Embed Size (px)
Citation preview

1
2
Safe Harbor
This presentation includes certain “forward-looking statements" within the meaning of the Private Securities Litigation Reform Act
of 1995, including statements concerning our cash flow and margin improvement expectations, our position to execute on our
growth strategy in the mid-market, and our ability to expand our leadership position and market opportunity for our inbound
platform. These forward-looking statements include, but are not limited to, plans, objectives, expectations and intentions and other
statements contained in this press release that are not historical facts and statements identified by words such as "expects,"
"anticipates," "intends," "plans," "believes," "seeks," "estimates" or words of similar meaning. These forward-looking statements
reflect our current views about our plans, intentions, expectations, strategies and prospects, which are based on the information
currently available to us and on assumptions we have made. Although we believe that our plans, intentions, expectations,
strategies and prospects as reflected in or suggested by those forward-looking statements are reasonable, we can give no
assurance that the plans, intentions, expectations or strategies will be attained or achieved. Furthermore, actual results may differ
materially from those described in the forward-looking statements and will be affected by a variety of risks and factors that are
beyond our control including, without limitation, our history of losses, our ability to retain existing customers and add new
customers, the continued growth of the market for an inbound platform; our ability to differentiate our platform from competing
products and technologies; our ability to manage our growth effectively to maintain our high level of service; our ability to maintain
and expand relationships with our marketing agency partners; our ability to successfully recruit and retain highly-qualified
personnel; the price volatility of our common stock, and other risks set forth under the caption "Risk Factors" in our Annual Report
on Form 10-K filed on February 16, 2017 and our other SEC filings. We assume no obligation to update any forward-looking
statements contained in this document as a result of new information, future events or otherwise.
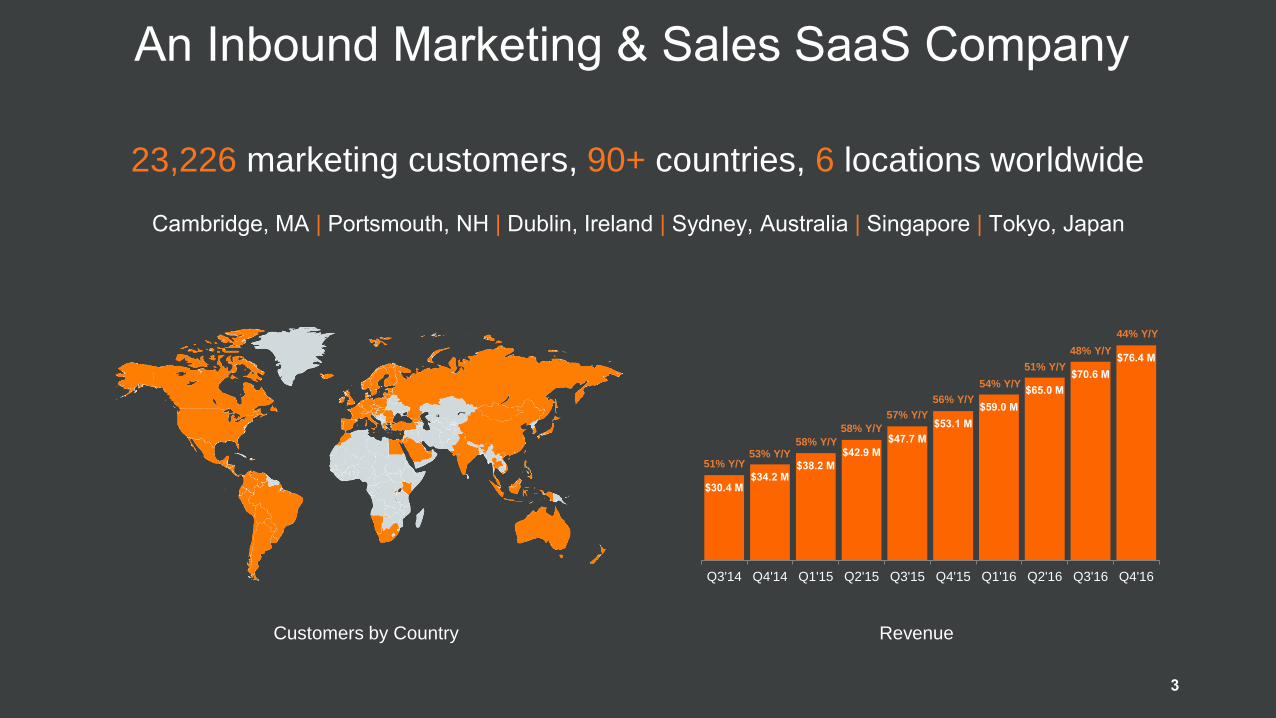
$30.4 M$34.2 M
$38.2 M
$42.9 M
$47.7 M
$53.1 M
$59.0 M
$65.0 M
$70.6 M
$76.4 M
Q3'14 Q4'14 Q1'15 Q2'15 Q3'15 Q4'15 Q1'16 Q2'16 Q3'16 Q4'16
RevenueCustomers by Country
An Inbound Marketing & Sales SaaS Company
23,226 marketing customers, 90+ countries, 6 locations worldwide
Cambridge, MA | Portsmouth, NH | Dublin, Ireland | Sydney, Australia | Singapore | Tokyo, Japan
51% Y/Y53% Y/Y
58% Y/Y
58% Y/Y
57% Y/Y
56% Y/Y
54% Y/Y
3
51% Y/Y
48% Y/Y
44% Y/Y
Why does exist?
4

Marketing has become an arms race for attention.
5
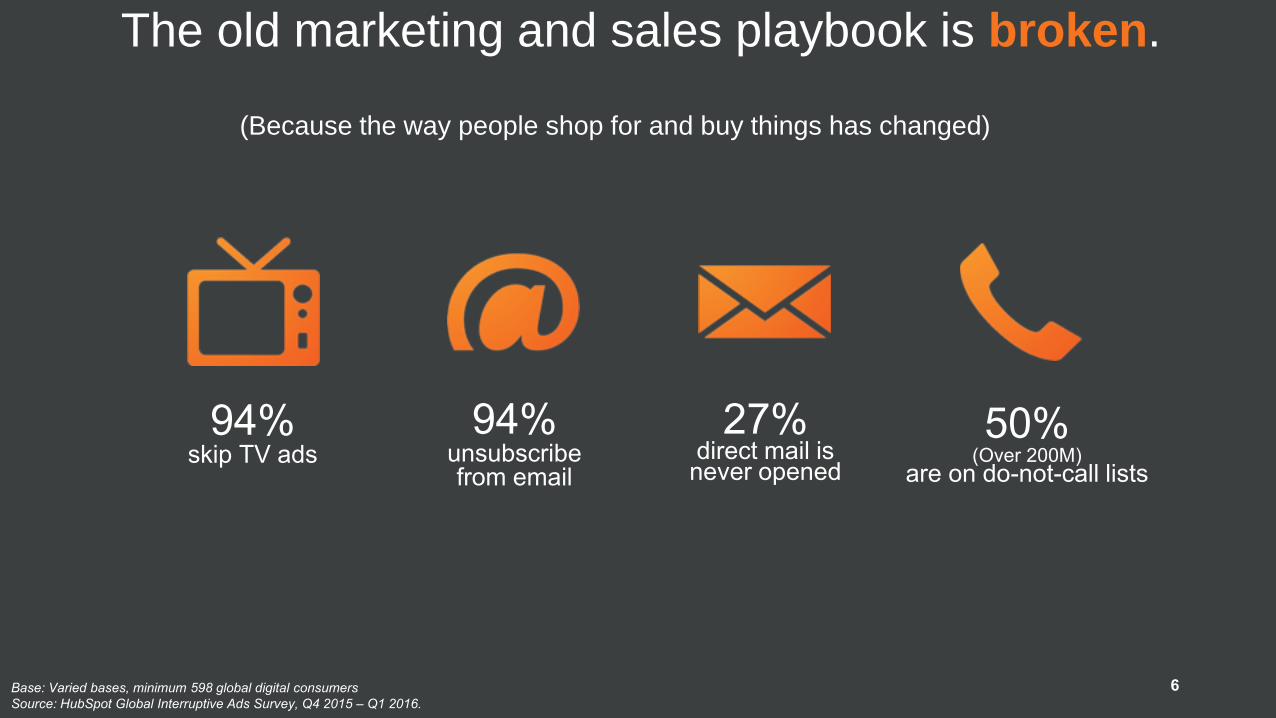
94% skip TV ads
94% unsubscribefrom email
27% direct mail is
never opened
50% (Over 200M)
are on do-not-call lists
Base: Varied bases, minimum 598 global digital consumers
Source: HubSpot Global Interruptive Ads Survey, Q4 2015 – Q1 2016.
The old marketing and sales playbook is broken.
(Because the way people shop for and buy things has changed)
6

But today’s consumers have
the tools to fight back.
7
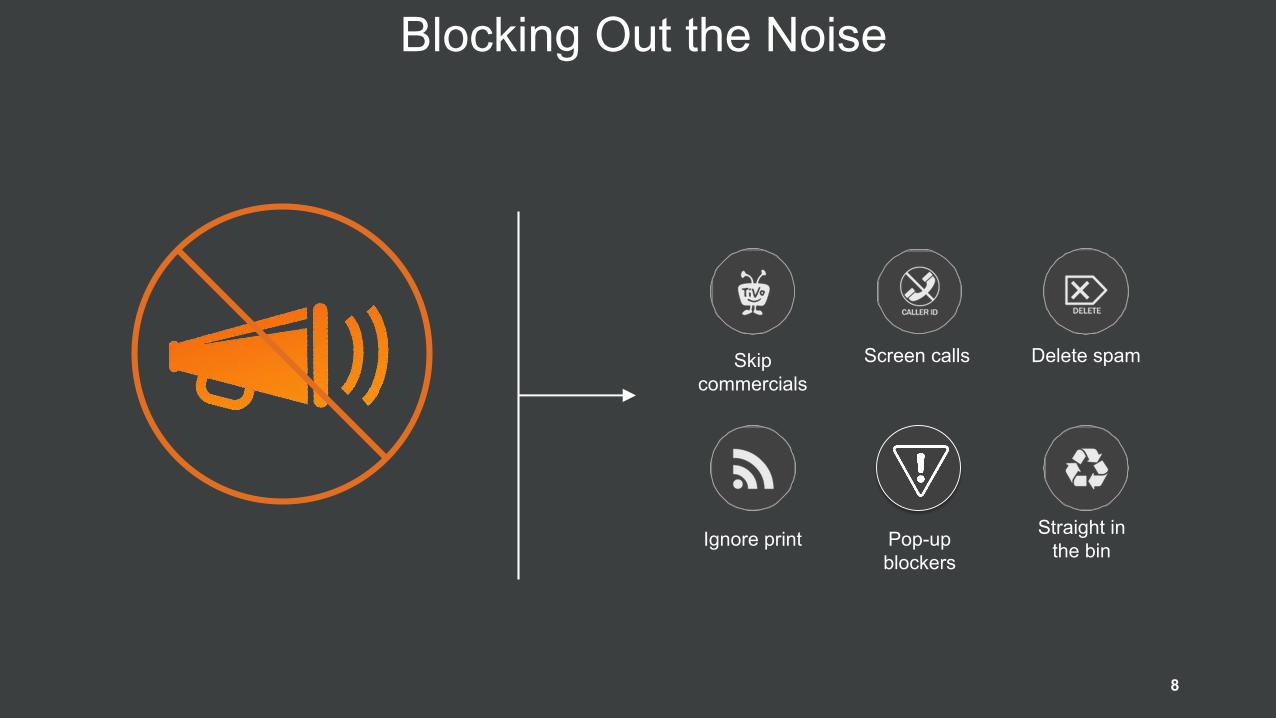
Skip
commercials
Screen calls Delete spam
Ignore printStraight in
the binPop-up
blockers
Blocking Out the Noise
It’s easier than ever
for customers to
block out the noise
8
So how do you reach a consumer
who doesn’t want to be bothered?
Be helpful.
9
Inbound Marketing & Sales
10
“Wait. What is inbound?”
11

Inbound is about the size of your brain,
not the width of your wallet
Helpful | Human | Personal | Transformational | Empowering | Educational
12
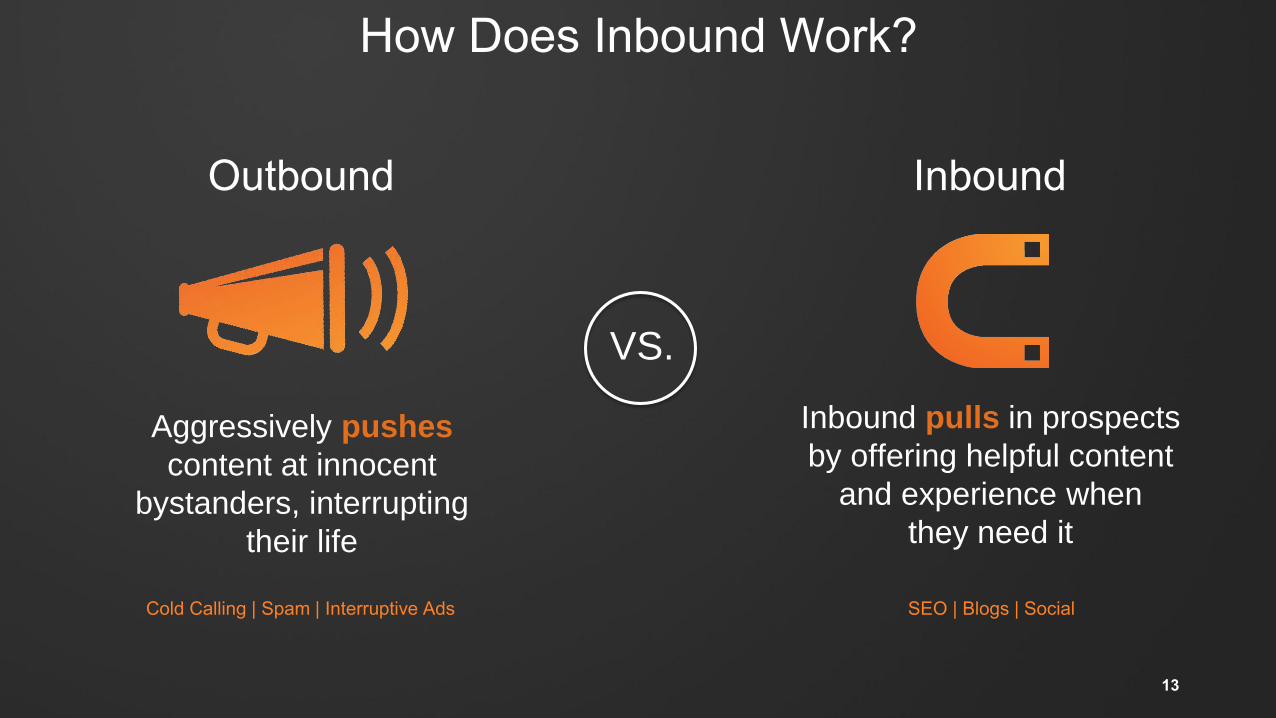
How Does Inbound Work?
Aggressively pushes
content at innocent
bystanders, interrupting
their life
Inbound pulls in prospects
by offering helpful content
and experience when
they need it
VS.
Outbound Inbound
SEO | Blogs | SocialCold Calling | Spam | Interruptive Ads
13
How does HubSpot do inbound?
14
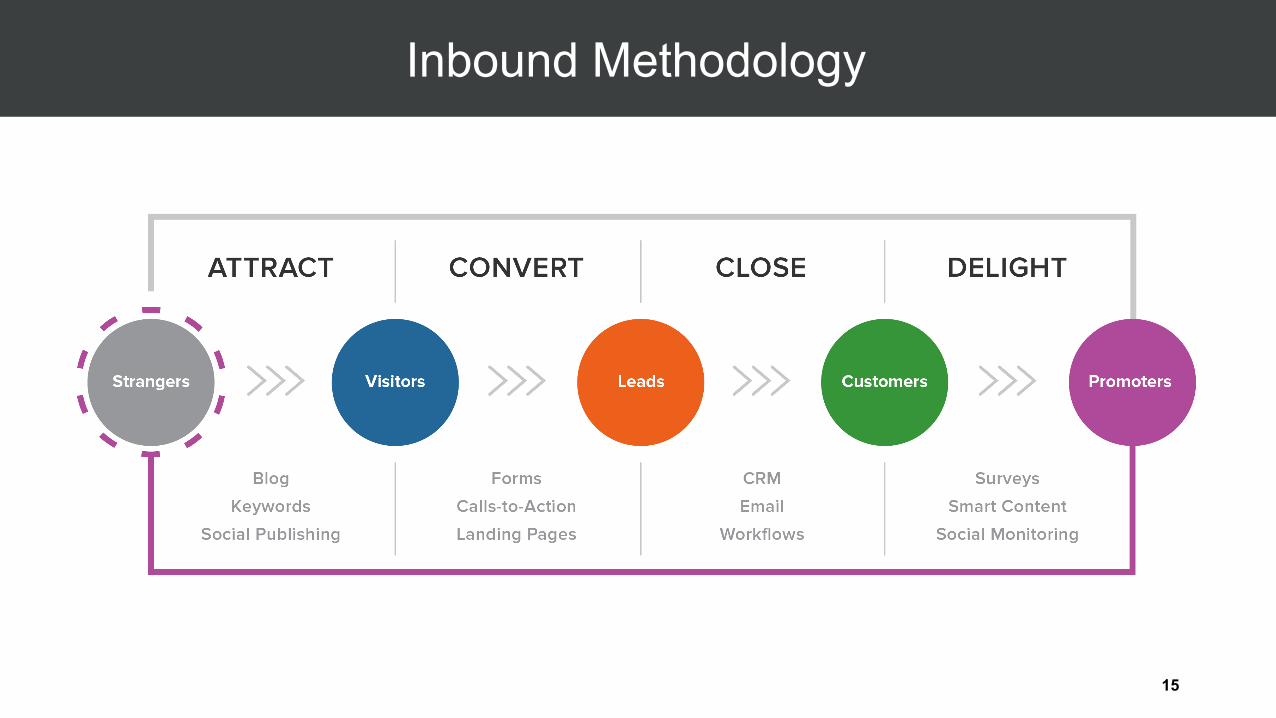
Inbound Methodology
15
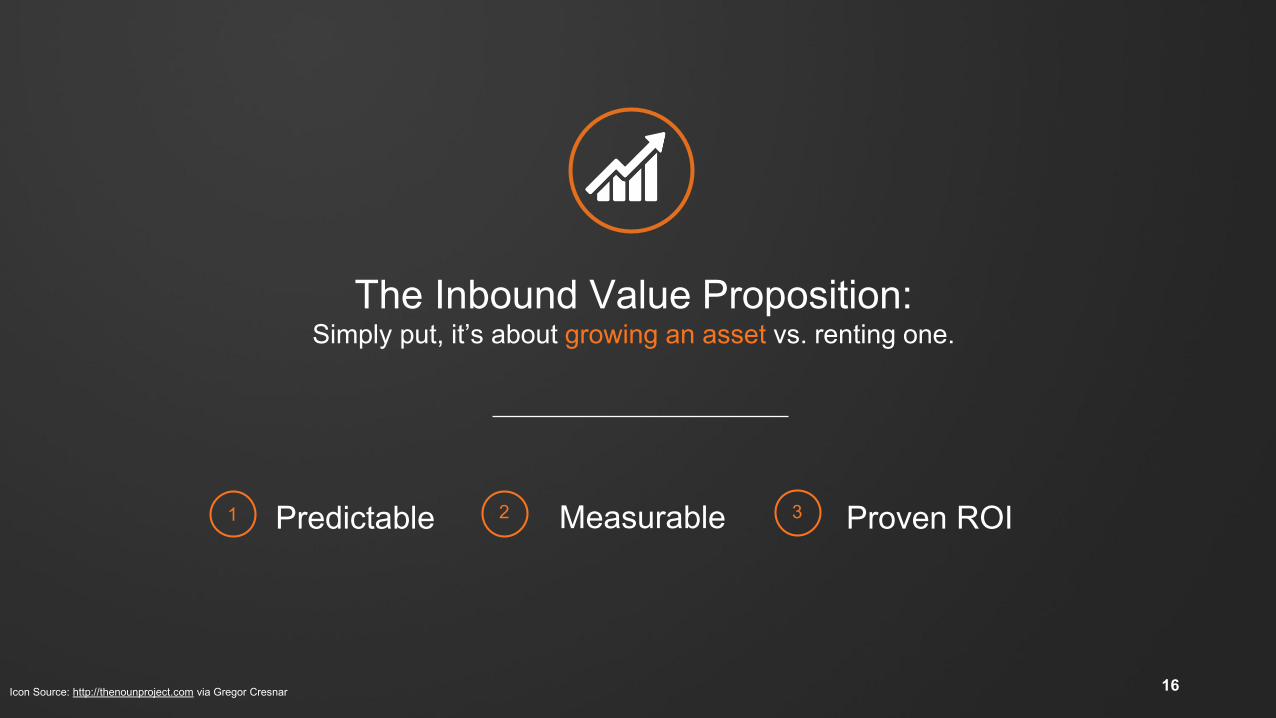
The Inbound Value Proposition: Simply put, it’s about growing an asset vs. renting one.
1 2 3Predictable Measurable Proven ROI
Icon Source: http://thenounproject.com via Gregor Cresnar 16
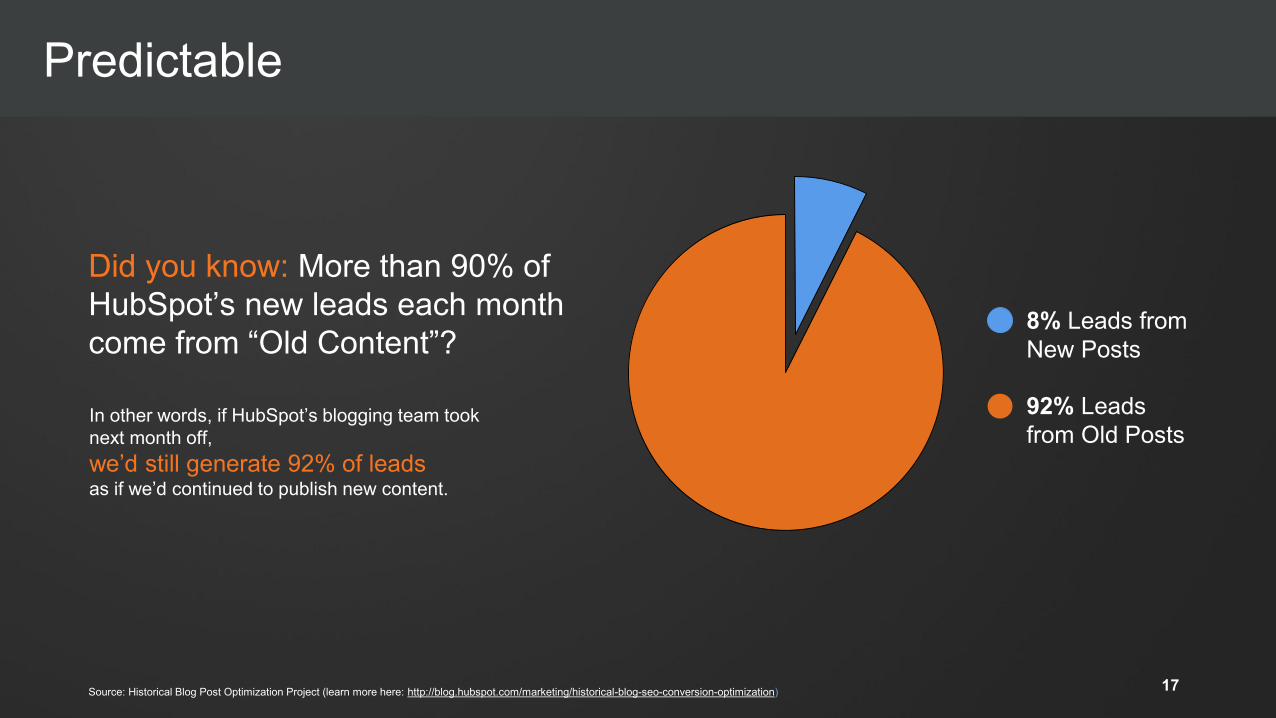
Did you know: More than 90% of
HubSpot’s new leads each month
come from “Old Content”?
92% Leads
from Old Posts
8% Leads from
New Posts
In other words, if HubSpot’s blogging team took
next month off,
we’d still generate 92% of leadsas if we’d continued to publish new content.
Source: Historical Blog Post Optimization Project (learn more here: http://blog.hubspot.com/marketing/historical-blog-seo-conversion-optimization)
Predictable
17
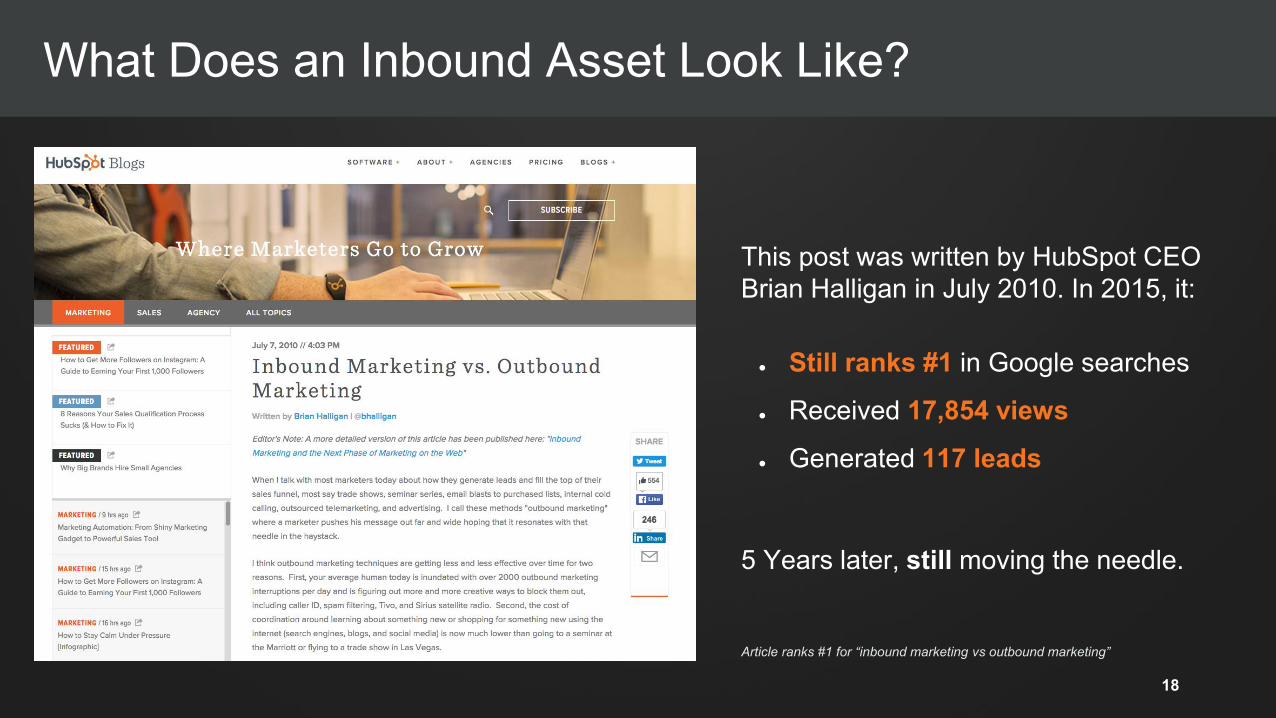
This post was written by HubSpot CEO
Brian Halligan in July 2010. In 2015, it:
● Still ranks #1 in Google searches
● Received 17,854 views
● Generated 117 leads
5 Years later, still moving the needle.
What Does an Inbound Asset Look Like?
Article ranks #1 for “inbound marketing vs outbound marketing”
18
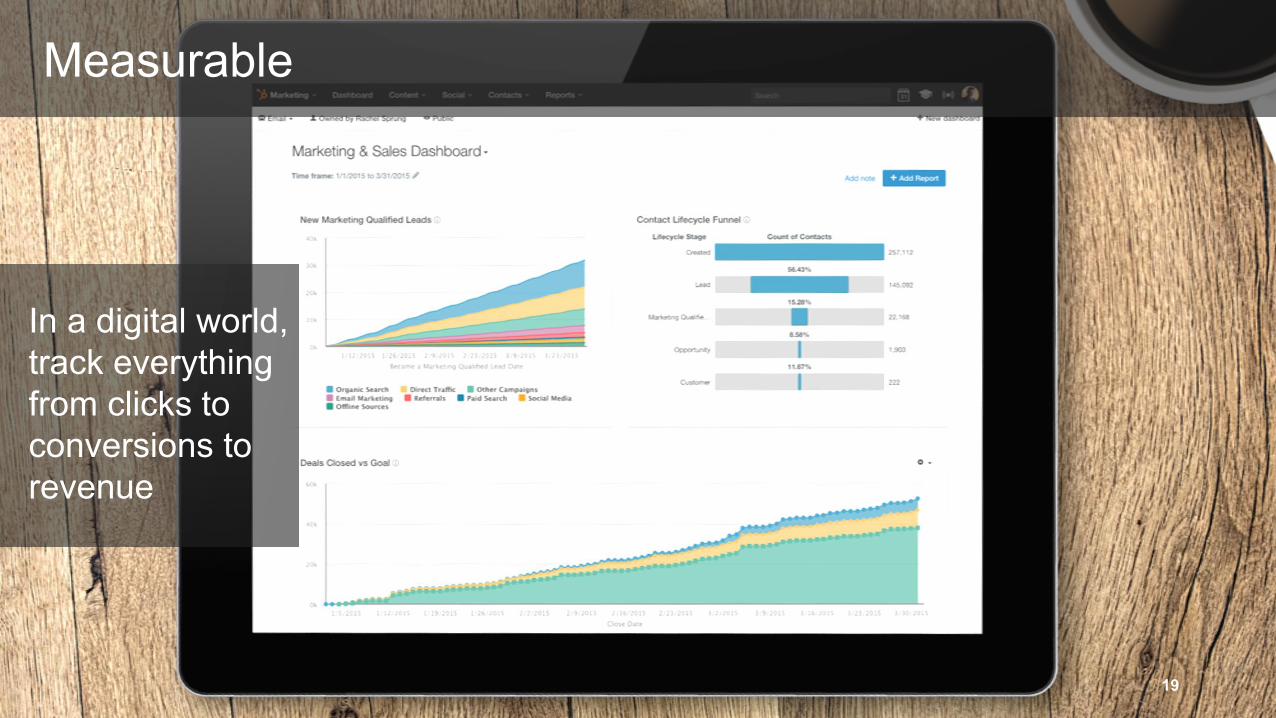
In a digital world,
track everything
from clicks to
conversions to
revenue
Measurable
19
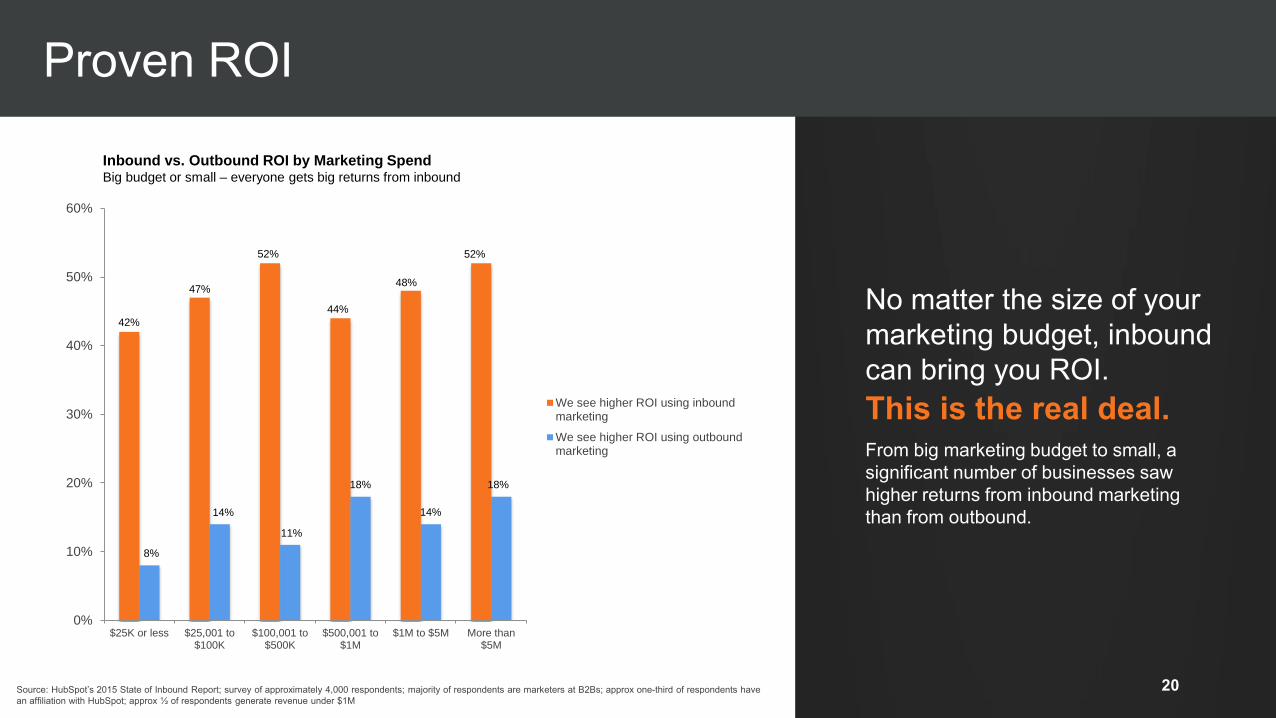
No matter the size of your
marketing budget, inbound
can bring you ROI.
This is the real deal.From big marketing budget to small, a
significant number of businesses saw
higher returns from inbound marketing
than from outbound.
0%
10%
20%
30%
40%
50%
60%
$25K or less $25,001 to$100K
$100,001 to$500K
$500,001 to$1M
$1M to $5M More than$5M
We see higher ROI using inboundmarketing
We see higher ROI using outboundmarketing
42%
Inbound vs. Outbound ROI by Marketing SpendBig budget or small – everyone gets big returns from inbound
8%
47%
52%
44%
48%
52%
14%
11%
18%
14%
18%
Proven ROI
Source: HubSpot’s 2015 State of Inbound Report; survey of approximately 4,000 respondents; majority of respondents are marketers at B2Bs; approx one-third of respondents have
an affiliation with HubSpot; approx ½ of respondents generate revenue under $1M
20
0% 10% 20% 30% 40% 50% 60% 70% 80%
0 to 25 employees
26 to 200 employees
201 or more employees
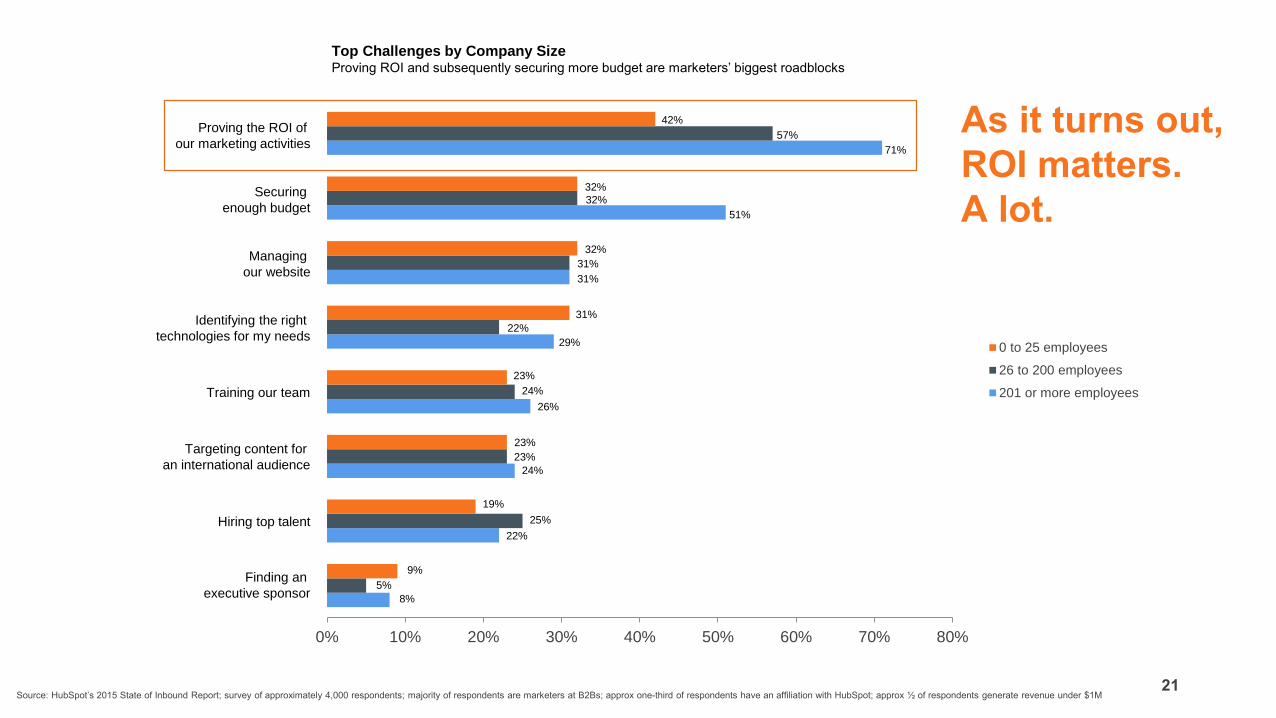
As it turns out,
ROI matters.
A lot.
Proving the ROI of
our marketing activities
Securing
enough budget
Managing
our website
Identifying the right
technologies for my needs
Training our team
Targeting content for
an international audience
Hiring top talent
Finding an
executive sponsor
42%
57%
71%
32%
32%
51%
32%
31%
31%
31%
22%
29%
23%
24%
26%
23%
23%
24%
19%
25%
22%
9%
5%
8%
Top Challenges by Company SizeProving ROI and subsequently securing more budget are marketers’ biggest roadblocks
Source: HubSpot’s 2015 State of Inbound Report; survey of approximately 4,000 respondents; majority of respondents are marketers at B2Bs; approx one-third of respondents have an affiliation with HubSpot; approx ½ of respondents generate revenue under $1M21

We are an inbound marketing & sales SaaS company.
Our mission is to transform how companies market and sell.
Our vision is a world where business is inbound.
22
23
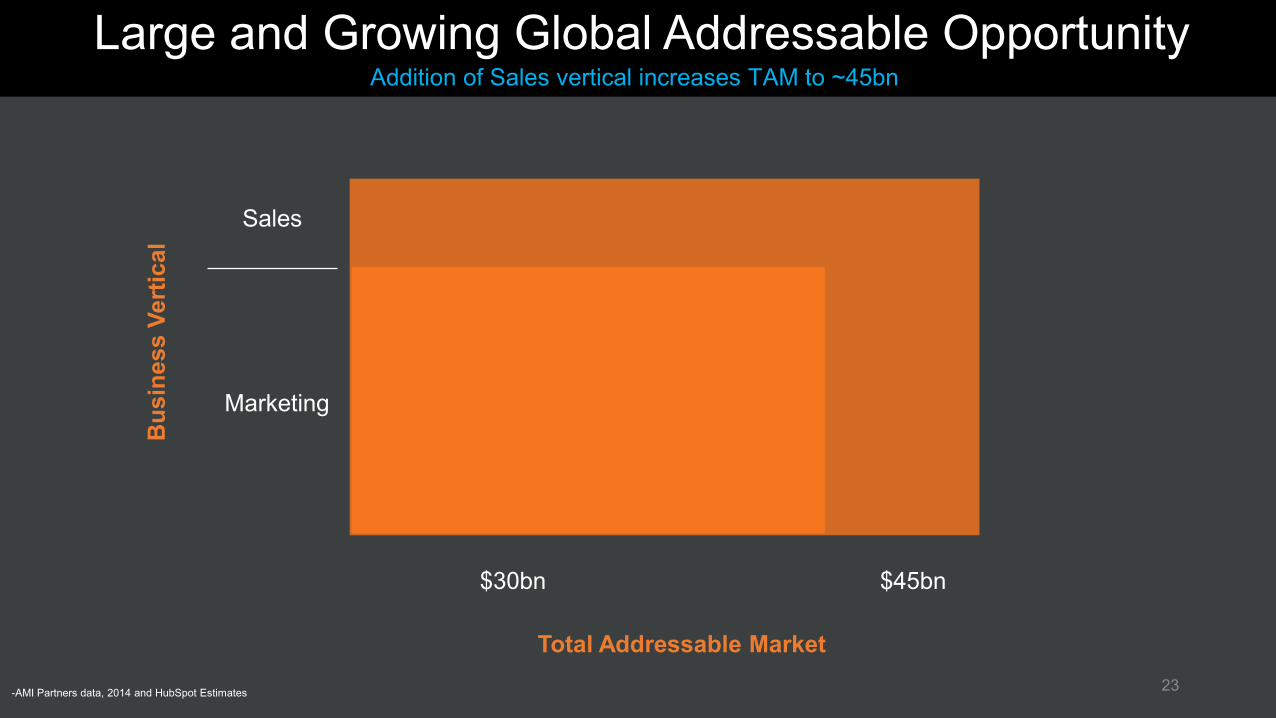
Bu
sin
ess V
ert
ical
Total Addressable Market
Sales
Marketing
$30bn $45bn
Large and Growing Global Addressable OpportunityAddition of Sales vertical increases TAM to ~45bn
-AMI Partners data, 2014 and HubSpot Estimates
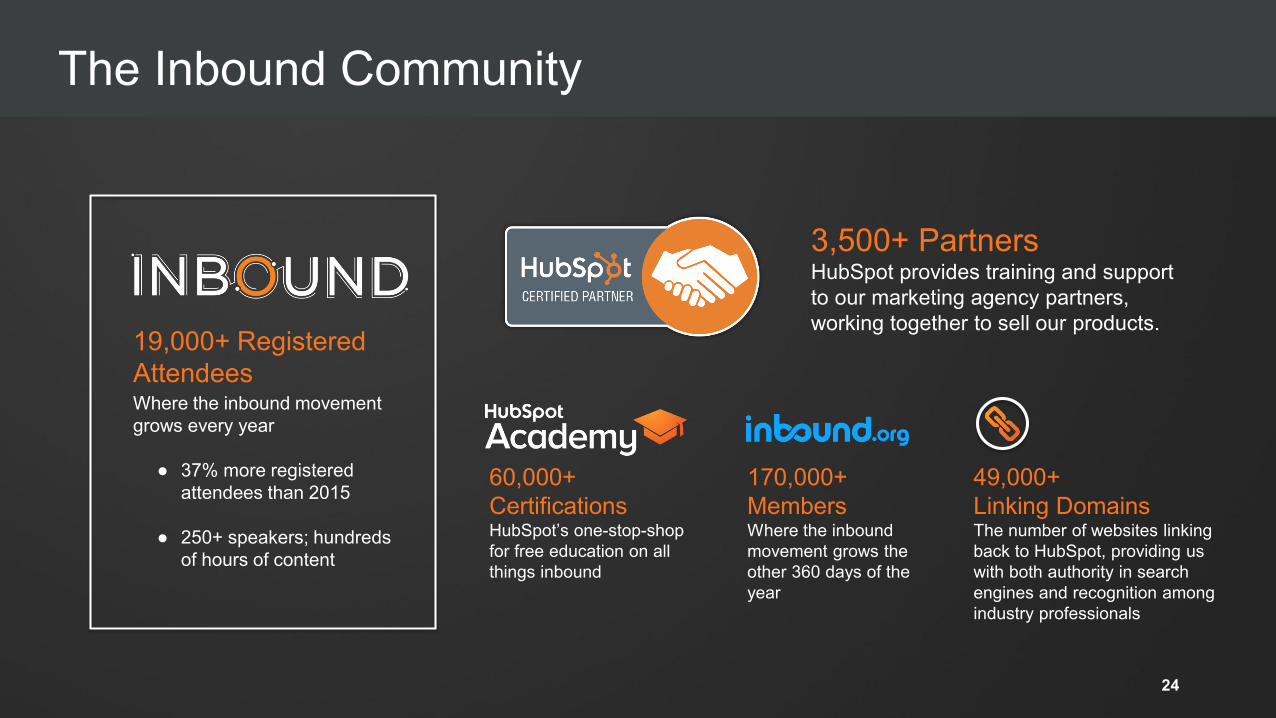
170,000+
MembersWhere the inbound
movement grows the
other 360 days of the
year
19,000+ Registered
AttendeesWhere the inbound movement
grows every year
● 37% more registered
attendees than 2015
● 250+ speakers; hundreds
of hours of content
3,500+ PartnersHubSpot provides training and support
to our marketing agency partners,
working together to sell our products.
60,000+
CertificationsHubSpot’s one-stop-shop
for free education on all
things inbound
49,000+
Linking DomainsThe number of websites linking
back to HubSpot, providing us
with both authority in search
engines and recognition among
industry professionals
The Inbound Community
24
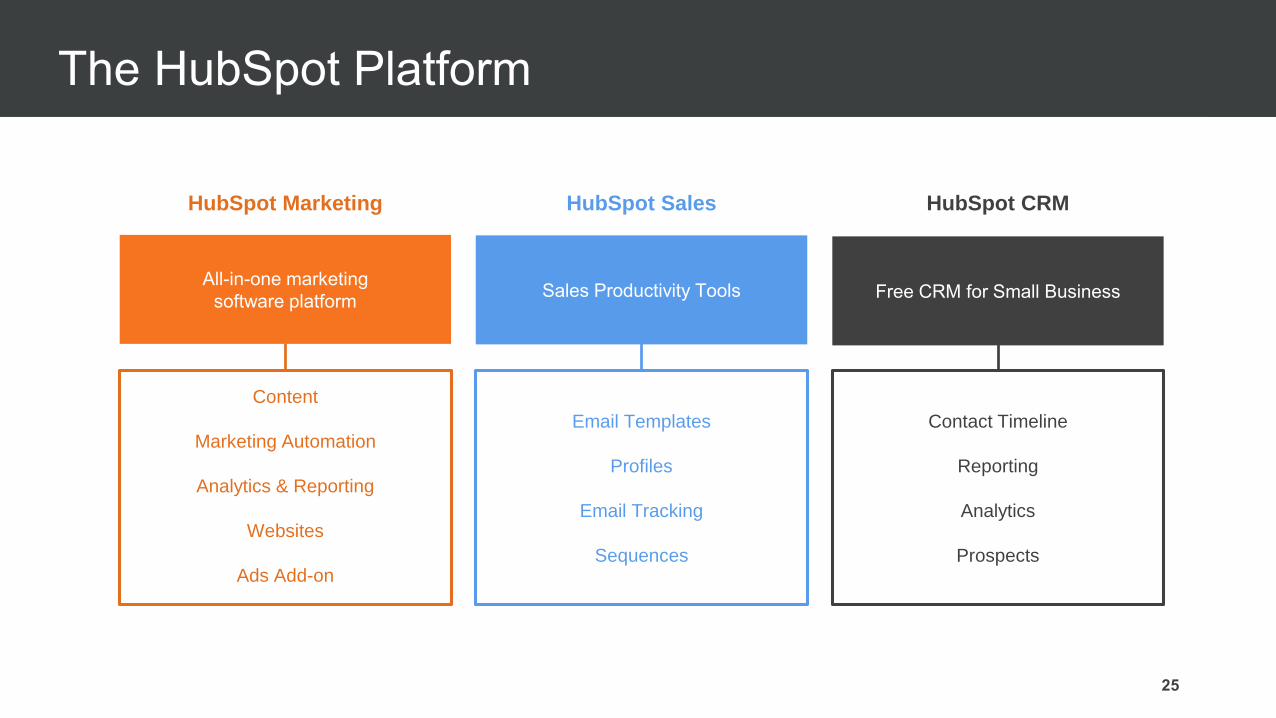
HubSpot Marketing
All-in-one marketing
software platformSales Productivity Tools Free CRM for Small Business
HubSpot CRM
Content
Marketing Automation
Analytics & Reporting
Websites
Ads Add-on
Email Templates
Profiles
Email Tracking
Sequences
Contact Timeline
Reporting
Analytics
Prospects
HubSpot Sales
The HubSpot Platform
25
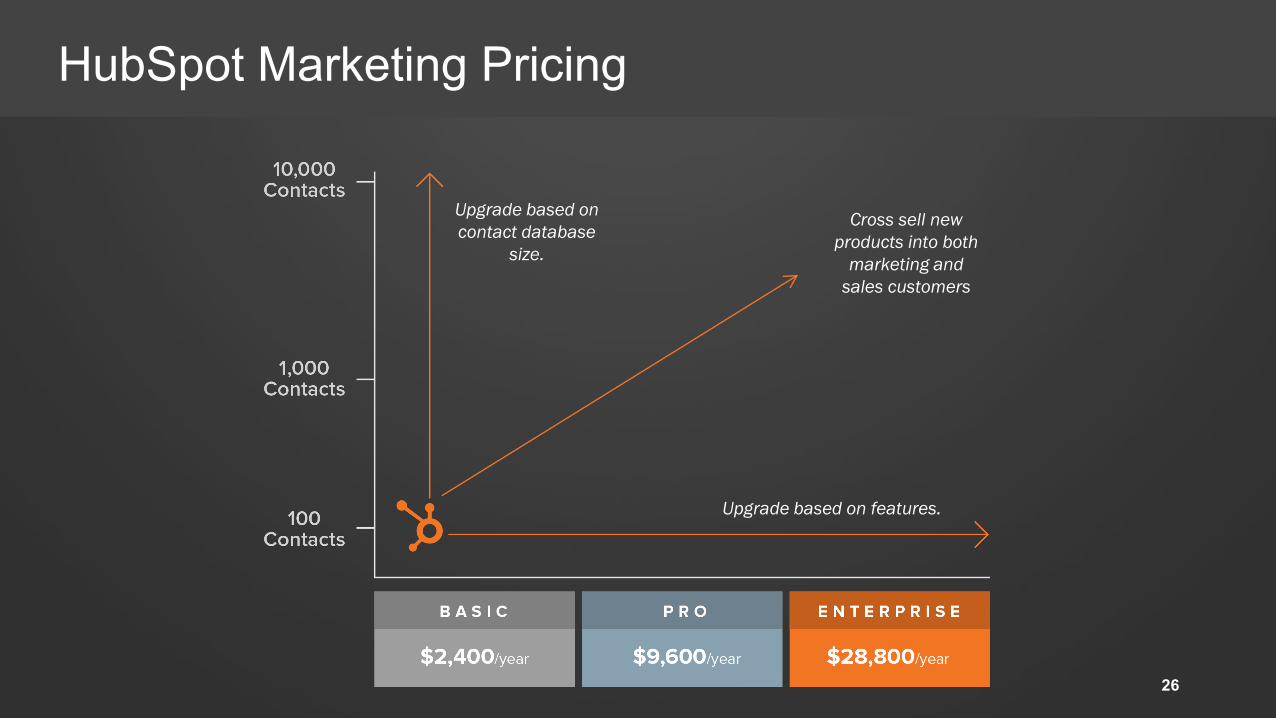
HubSpot Marketing Pricing
Upgrade based on
contact database
size.
Upgrade based on features.
Cross sell new
products into both
marketing and
sales customers
26
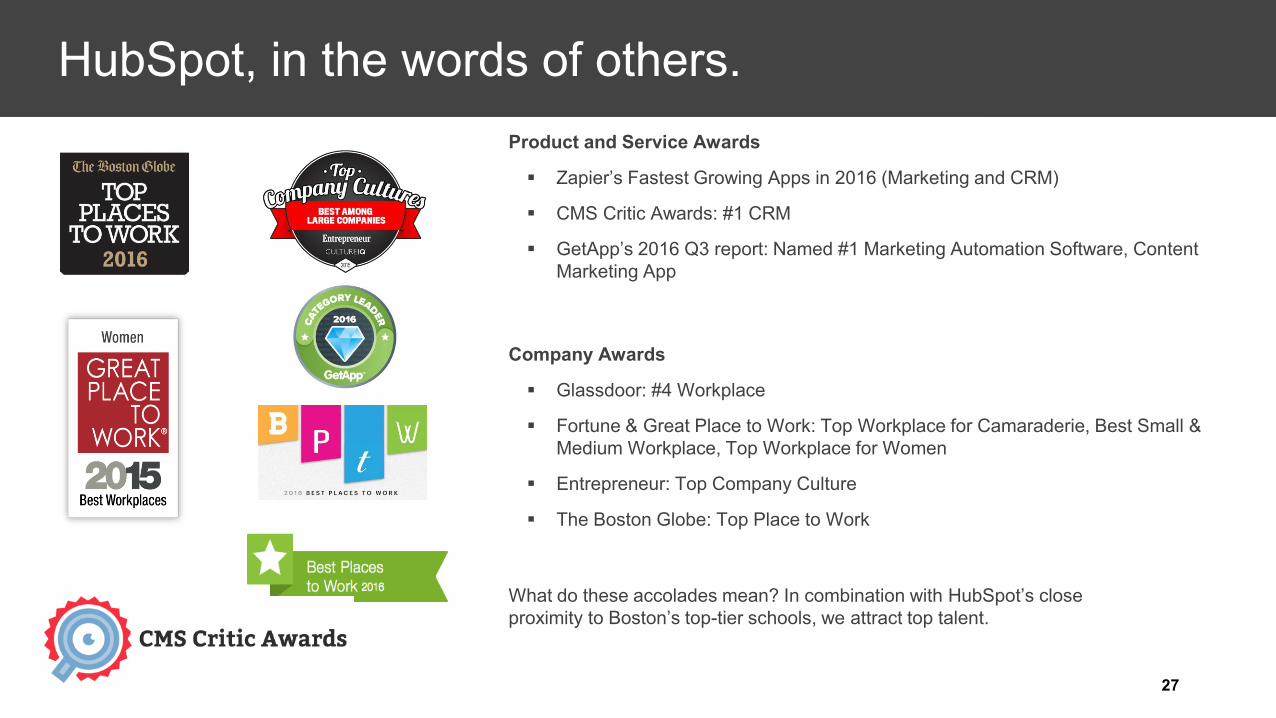
Company Awards
Glassdoor: #4 Workplace
Fortune & Great Place to Work: Top Workplace for Camaraderie, Best Small &
Medium Workplace, Top Workplace for Women
Entrepreneur: Top Company Culture
The Boston Globe: Top Place to Work
Product and Service Awards
Zapier’s Fastest Growing Apps in 2016 (Marketing and CRM)
CMS Critic Awards: #1 CRM
GetApp’s 2016 Q3 report: Named #1 Marketing Automation Software, Content
Marketing App
What do these accolades mean? In combination with HubSpot’s close
proximity to Boston’s top-tier schools, we attract top talent.
HubSpot, in the words of others.
27
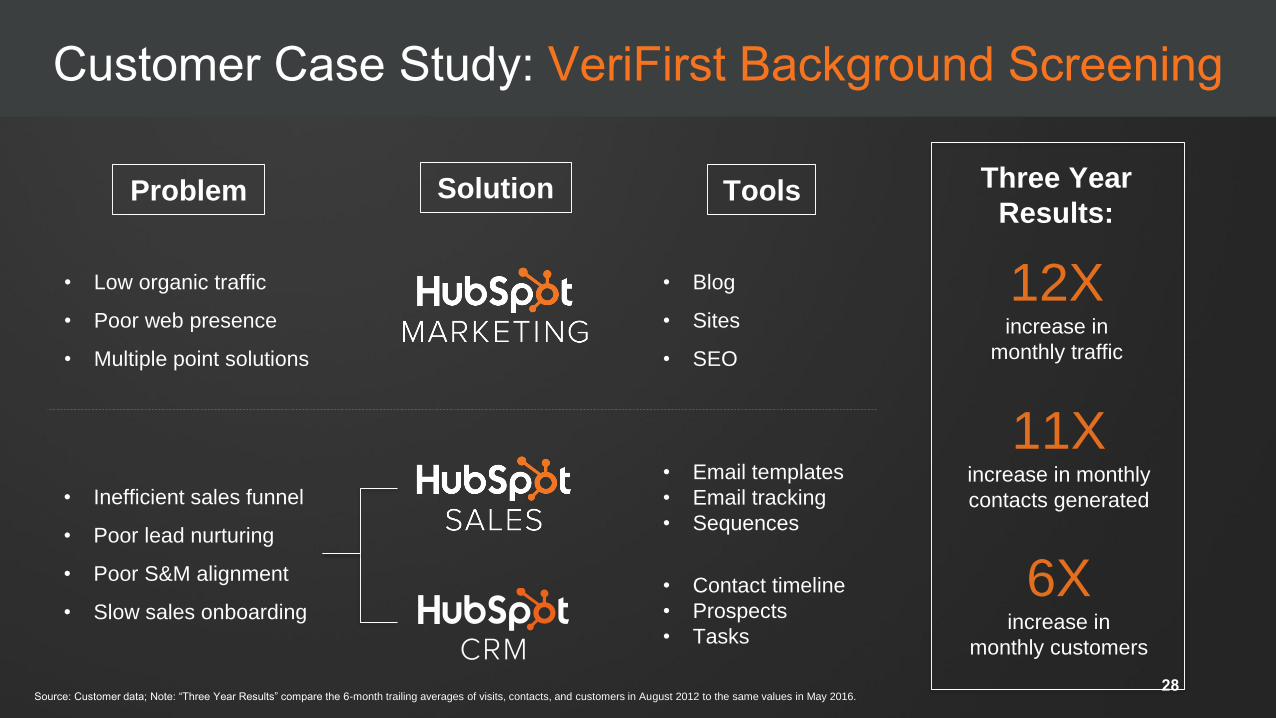
Customer Case Study: VeriFirst Background Screening
• Low organic traffic
• Poor web presence
• Multiple point solutions
• Inefficient sales funnel
• Poor lead nurturing
• Poor S&M alignment
• Slow sales onboarding
Problem Solution Tools
• Blog
• Sites
• SEO
• Email templates
• Email tracking
• Sequences
• Contact timeline
• Prospects
• Tasks
6Xincrease in
monthly customers
12Xincrease in
monthly traffic
11Xincrease in monthly
contacts generated
Three Year
Results:
Source: Customer data; Note: “Three Year Results” compare the 6-month trailing averages of visits, contacts, and customers in August 2012 to the same values in May 2016.28
HubSpot, in short…
Growth opportunity with multiple drivers
- Large, diversified and expanding global addressable market
- Drive new customer growth, cross sell existing products and grow internationally
Efficient and scalable customer acquisition model
- We expect to be free cash flow positive for CY17 and to reach non-GAAP operating profit
break-even in 4Q17.
29

Financial Review
30
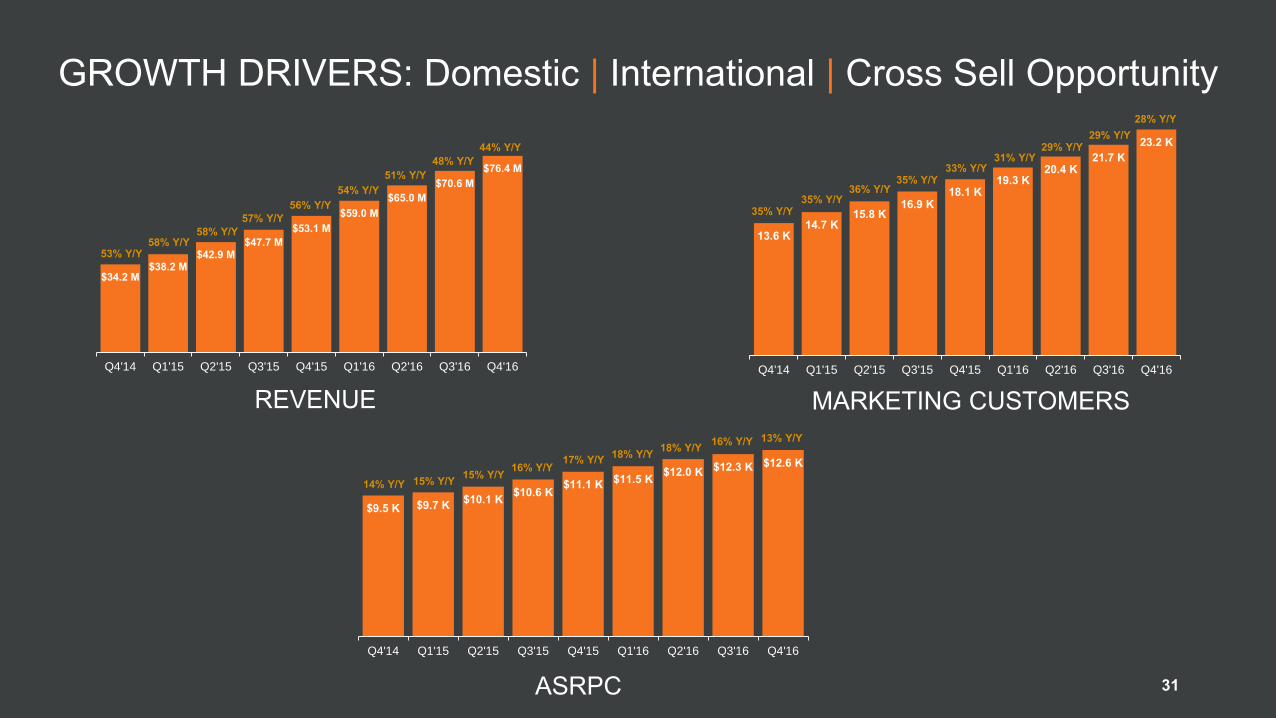
GROWTH DRIVERS: Domestic | International | Cross Sell Opportunity
REVENUE MARKETING CUSTOMERS
ASRPC 31
$34.2 M$38.2 M
$42.9 M$47.7 M
$53.1 M
$59.0 M
$65.0 M
$70.6 M
$76.4 M
Q4'14 Q1'15 Q2'15 Q3'15 Q4'15 Q1'16 Q2'16 Q3'16 Q4'16
53% Y/Y58% Y/Y
58% Y/Y
57% Y/Y
56% Y/Y
54% Y/Y
51% Y/Y
48% Y/Y
44% Y/Y
13.6 K14.7 K
15.8 K16.9 K
18.1 K19.3 K
20.4 K21.7 K
23.2 K
Q4'14 Q1'15 Q2'15 Q3'15 Q4'15 Q1'16 Q2'16 Q3'16 Q4'16
35% Y/Y35% Y/Y
36% Y/Y35% Y/Y
33% Y/Y31% Y/Y
29% Y/Y29% Y/Y
28% Y/Y
$9.5 K $9.7 K$10.1 K
$10.6 K$11.1 K $11.5 K
$12.0 K $12.3 K $12.6 K
Q4'14 Q1'15 Q2'15 Q3'15 Q4'15 Q1'16 Q2'16 Q3'16 Q4'16
14% Y/Y 15% Y/Y15% Y/Y
16% Y/Y17% Y/Y
18% Y/Y18% Y/Y
16% Y/Y 13% Y/Y
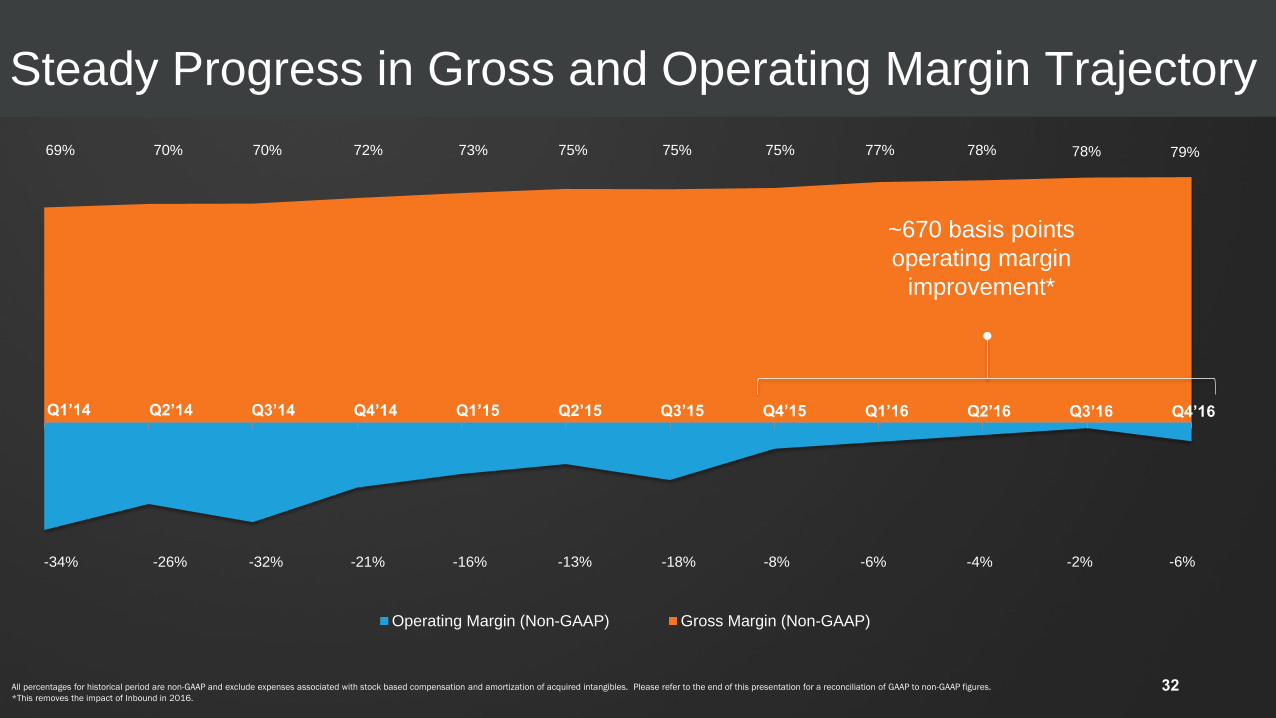
Steady Progress in Gross and Operating Margin Trajectory
32All percentages for historical period are non-GAAP and exclude expenses associated with stock based compensation and amortization of acquired intangibles. Please refer to the end of this presentation for a reconciliation of GAAP to non-GAAP figures.
*This removes the impact of Inbound in 2016.
Operating Margin (Non-GAAP) Gross Margin (Non-GAAP)
~670 basis points
operating margin
improvement*
-34% -26% -32% -21% -16% -13% -18% -8% -6% -4% -2% -6%
69% 70% 70% 72% 73% 75% 75% 75% 77% 78% 78% 79%
Q1’14 Q2’14 Q3’14 Q4’14 Q1’15 Q2’15 Q3’15 Q4’15 Q1’16 Q2’16 Q3’16 Q4’16
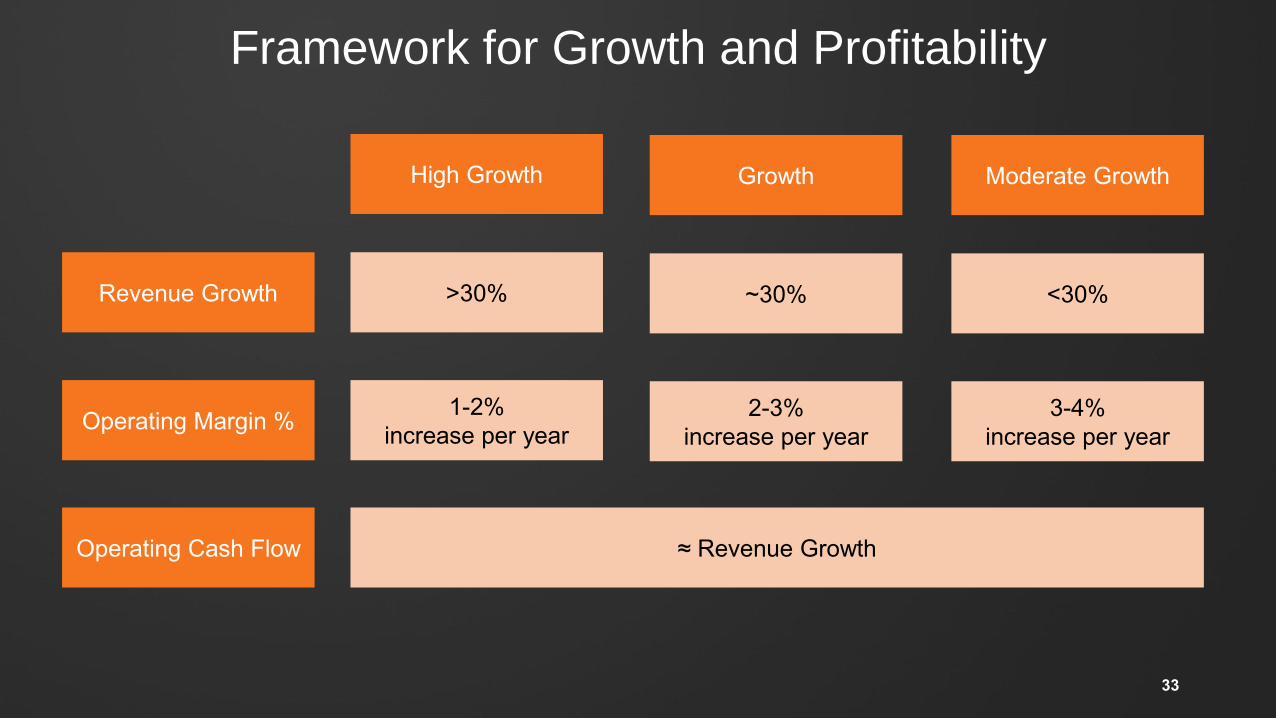
Framework for Growth and Profitability
33
Revenue Growth
Operating Margin %
Operating Cash Flow
<30%
3-4%
increase per year
Moderate Growth
>30%
1-2%
increase per year
≈ Revenue Growth
High Growth
~30%
2-3%
increase per year
Growth
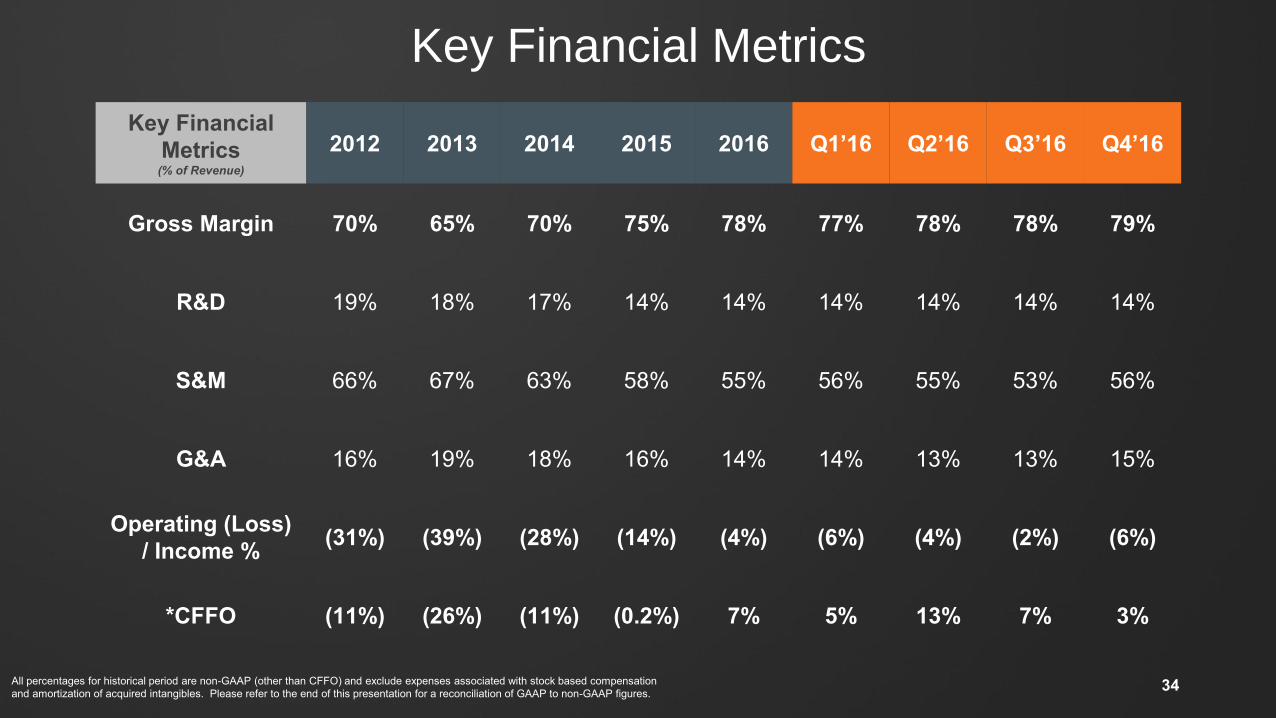
Key Financial Metrics
Key Financial
Metrics(% of Revenue)
2012 2013 2014 2015 2016 Q1’16 Q2’16 Q3’16 Q4’16
Gross Margin 70% 65% 70% 75% 78% 77% 78% 78% 79%
R&D 19% 18% 17% 14% 14% 14% 14% 14% 14%
S&M 66% 67% 63% 58% 55% 56% 55% 53% 56%
G&A 16% 19% 18% 16% 14% 14% 13% 13% 15%
Operating (Loss)
/ Income %(31%) (39%) (28%) (14%) (4%) (6%) (4%) (2%) (6%)
*CFFO (11%) (26%) (11%) (0.2%) 7% 5% 13% 7% 3%
All percentages for historical period are non-GAAP (other than CFFO) and exclude expenses associated with stock based compensation
and amortization of acquired intangibles. Please refer to the end of this presentation for a reconciliation of GAAP to non-GAAP figures.34

Thank you from HubSpot!
35
GAAP to Non-GAAP Reconciliation
36
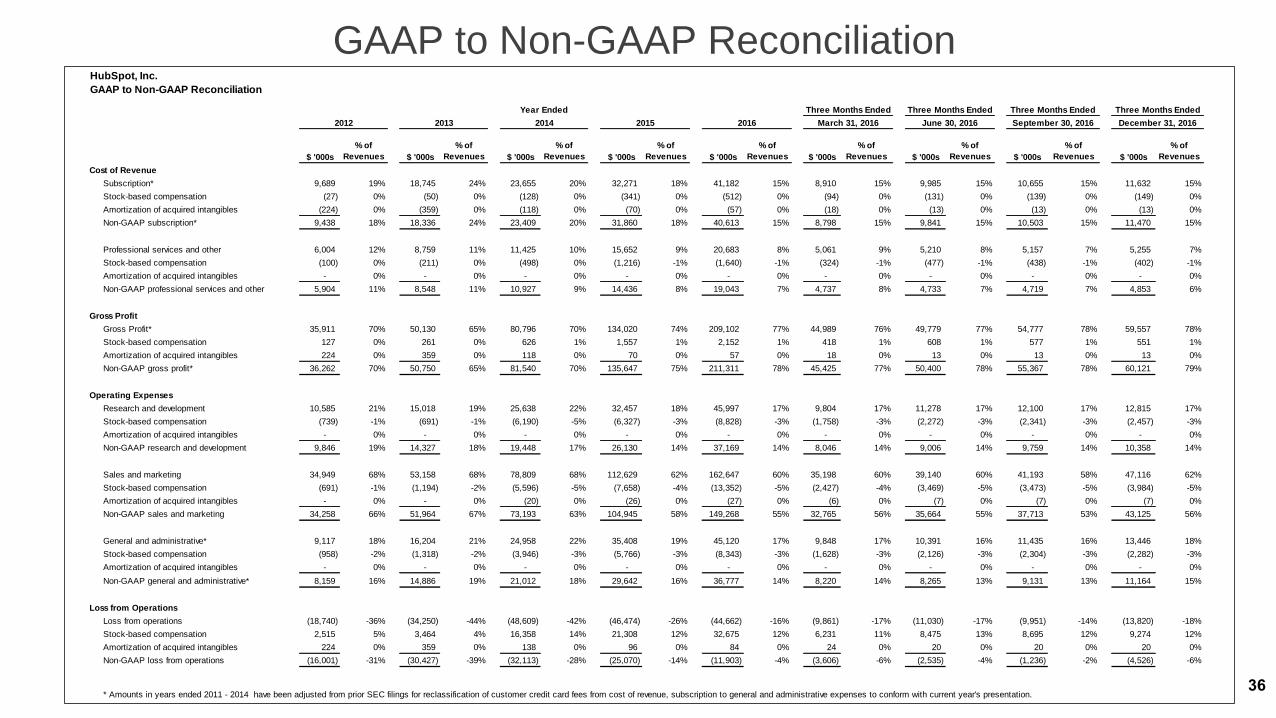
HubSpot, Inc.
GAAP to Non-GAAP Reconciliation
$ '000s
% of
Revenues $ '000s
% of
Revenues $ '000s
% of
Revenues $ '000s
% of
Revenues $ '000s
% of
Revenues $ '000s
% of
Revenues $ '000s
% of
Revenues $ '000s
% of
Revenues $ '000s
% of
Revenues
Cost of Revenue
Subscription* 9,689 19% 18,745 24% 23,655 20% 32,271 18% 41,182 15% 8,910 15% 9,985 15% 10,655 15% 11,632 15%
Stock-based compensation (27) 0% (50) 0% (128) 0% (341) 0% (512) 0% (94) 0% (131) 0% (139) 0% (149) 0%
Amortization of acquired intangibles (224) 0% (359) 0% (118) 0% (70) 0% (57) 0% (18) 0% (13) 0% (13) 0% (13) 0%
Non-GAAP subscription* 9,438 18% 18,336 24% 23,409 20% 31,860 18% 40,613 15% 8,798 15% 9,841 15% 10,503 15% 11,470 15%
Professional services and other 6,004 12% 8,759 11% 11,425 10% 15,652 9% 20,683 8% 5,061 9% 5,210 8% 5,157 7% 5,255 7%
Stock-based compensation (100) 0% (211) 0% (498) 0% (1,216) -1% (1,640) -1% (324) -1% (477) -1% (438) -1% (402) -1%
Amortization of acquired intangibles - 0% - 0% - 0% - 0% - 0% - 0% - 0% - 0% - 0%
Non-GAAP professional services and other 5,904 11% 8,548 11% 10,927 9% 14,436 8% 19,043 7% 4,737 8% 4,733 7% 4,719 7% 4,853 6%
Gross Profit
Gross Profit* 35,911 70% 50,130 65% 80,796 70% 134,020 74% 209,102 77% 44,989 76% 49,779 77% 54,777 78% 59,557 78%
Stock-based compensation 127 0% 261 0% 626 1% 1,557 1% 2,152 1% 418 1% 608 1% 577 1% 551 1%
Amortization of acquired intangibles 224 0% 359 0% 118 0% 70 0% 57 0% 18 0% 13 0% 13 0% 13 0%
Non-GAAP gross profit* 36,262 70% 50,750 65% 81,540 70% 135,647 75% 211,311 78% 45,425 77% 50,400 78% 55,367 78% 60,121 79%
Operating Expenses
Research and development 10,585 21% 15,018 19% 25,638 22% 32,457 18% 45,997 17% 9,804 17% 11,278 17% 12,100 17% 12,815 17%
Stock-based compensation (739) -1% (691) -1% (6,190) -5% (6,327) -3% (8,828) -3% (1,758) -3% (2,272) -3% (2,341) -3% (2,457) -3%
Amortization of acquired intangibles - 0% - 0% - 0% - 0% - 0% - 0% - 0% - 0% - 0%
Non-GAAP research and development 9,846 19% 14,327 18% 19,448 17% 26,130 14% 37,169 14% 8,046 14% 9,006 14% 9,759 14% 10,358 14%
Sales and marketing 34,949 68% 53,158 68% 78,809 68% 112,629 62% 162,647 60% 35,198 60% 39,140 60% 41,193 58% 47,116 62%
Stock-based compensation (691) -1% (1,194) -2% (5,596) -5% (7,658) -4% (13,352) -5% (2,427) -4% (3,469) -5% (3,473) -5% (3,984) -5%
Amortization of acquired intangibles - 0% - 0% (20) 0% (26) 0% (27) 0% (6) 0% (7) 0% (7) 0% (7) 0%
Non-GAAP sales and marketing 34,258 66% 51,964 67% 73,193 63% 104,945 58% 149,268 55% 32,765 56% 35,664 55% 37,713 53% 43,125 56%
General and administrative* 9,117 18% 16,204 21% 24,958 22% 35,408 19% 45,120 17% 9,848 17% 10,391 16% 11,435 16% 13,446 18%
Stock-based compensation (958) -2% (1,318) -2% (3,946) -3% (5,766) -3% (8,343) -3% (1,628) -3% (2,126) -3% (2,304) -3% (2,282) -3%
Amortization of acquired intangibles - 0% - 0% - 0% - 0% - 0% - 0% - 0% - 0% - 0%
Non-GAAP general and administrative* 8,159 16% 14,886 19% 21,012 18% 29,642 16% 36,777 14% 8,220 14% 8,265 13% 9,131 13% 11,164 15%
Loss from Operations
Loss from operations (18,740) -36% (34,250) -44% (48,609) -42% (46,474) -26% (44,662) -16% (9,861) -17% (11,030) -17% (9,951) -14% (13,820) -18%
Stock-based compensation 2,515 5% 3,464 4% 16,358 14% 21,308 12% 32,675 12% 6,231 11% 8,475 13% 8,695 12% 9,274 12%
Amortization of acquired intangibles 224 0% 359 0% 138 0% 96 0% 84 0% 24 0% 20 0% 20 0% 20 0%
Non-GAAP loss from operations (16,001) -31% (30,427) -39% (32,113) -28% (25,070) -14% (11,903) -4% (3,606) -6% (2,535) -4% (1,236) -2% (4,526) -6%
* Amounts in years ended 2011 - 2014 have been adjusted from prior SEC filings for reclassification of customer credit card fees from cost of revenue, subscription to general and administrative expenses to conform with current year's presentation.
2012 2013
Three Months Ended
March 31, 2016
Three Months Ended
December 31, 20162015
Three Months Ended
June 30, 20162016
Year Ended Three Months Ended
September 30, 20162014