Embed Size (px)
Citation preview
Safety Metrics: Measurements That Lead to Results
Christopher A. Janicak, Ph.D., CSP, ARM
Where are you today?• What are you doing today
to measure safety performance in the workplace?
• What metrics are you using?
• How well are they working?
Safety Metrics• The body of knowledge
used to quantify and measure safety performance.
• Measurement of key processes to permit process control.
• Provide an objective basis to determine process performance.
Continual Performance Improvement• An underlying premise for
safety metrics • Plan-Do-Check-Act should
be incorporated into all safety performance programs.
Performance Measurement• Involves:
– Determining what to measure
– Identifying data collection methods
– Collecting the data.
Evaluation• Assessing progress toward
achieving performance expectations
• Explain the causal relationships that exist between program activities and outcomes
Validity• Determine if the metric is
measuring what the safety manager thinks it is measuring
Reliability• Is there consistency in the
manner in measurements are taken?
• Reliability must be confirmed before validity can be confirmed.
Establishing a Safety Metric• Ability to accurately measure
safety performance depends upon the process that is followed to quantify that performance. – Standardized units of measure.– Instruments and methods capable
of measuring– Use of the instruments or methods
to quantify performance
Four types of Metrics• Direct measurement
systems • Indirect measurement
systems• Statistical samples• Interviews or surveys
Establishing a Safety Performance Program• A methodology for
establishing performance measures: – key objectives– outcome measures– activity measures
Key Objectives• Goals that articulate what
a company expects from the safety program.
• Key objectives can be the organization’s overall safety mission.
Outcome Measures• Reflect the company's key
safety objectives• Used to determine whether
the company has reached them
• Demonstrate the final results of the safety process.
Activity Measures• Monitor the performance
of activities that are instrumental in reaching the key objectives.
The Performance Measurement Process• Identify the process flow. • Identify the critical activity to be
measured.• Establish performance goal(s) or
standards.• Establish performance
measurement(s). • Identify responsible party(s). • Collect data. • Analyze/report actual performance. • Compare actual performance to
goal(s). • Make changes to bring back in line
with goal.
Trailing Indicators• Traditional metrics that
measure past safety efforts. • Data is collected after the
performance has been achieved.
• Accident records and loss reports.
Current Indicators• How well is the
management systems are working now?
• Provide a measure of potential losses over the short term.
• Examples include measures of safe and unsafe acts.
Leading Indicators• Measures that can be
effective in predicting future safety performance.
• “Before-The-Fact Measures.”
• Assess results of actions taken before accidents occur.
Benchmarking• Ongoing process of
measuring one company's safety performance against those recognized as industry leaders.
• Serves as a measuring stick for the organization by identifying those organizations that are viewed as the best.
Control Charts• A statistical device that
can be used for the study and control of safety performance in the workplace.
• Assumes the data distribution to approximate the normal bell-shaped curve.
Assumptions• Plotting measurements
over time, one would expect to obtain measurements over time that fall in the ranges depicted on the bell shaped curve.
Use of Control Charts• Methodology to detect
significant changes in safety performance measures.
• Charts include a baseline average line, and control limits.
• The control limits act as alarm values.
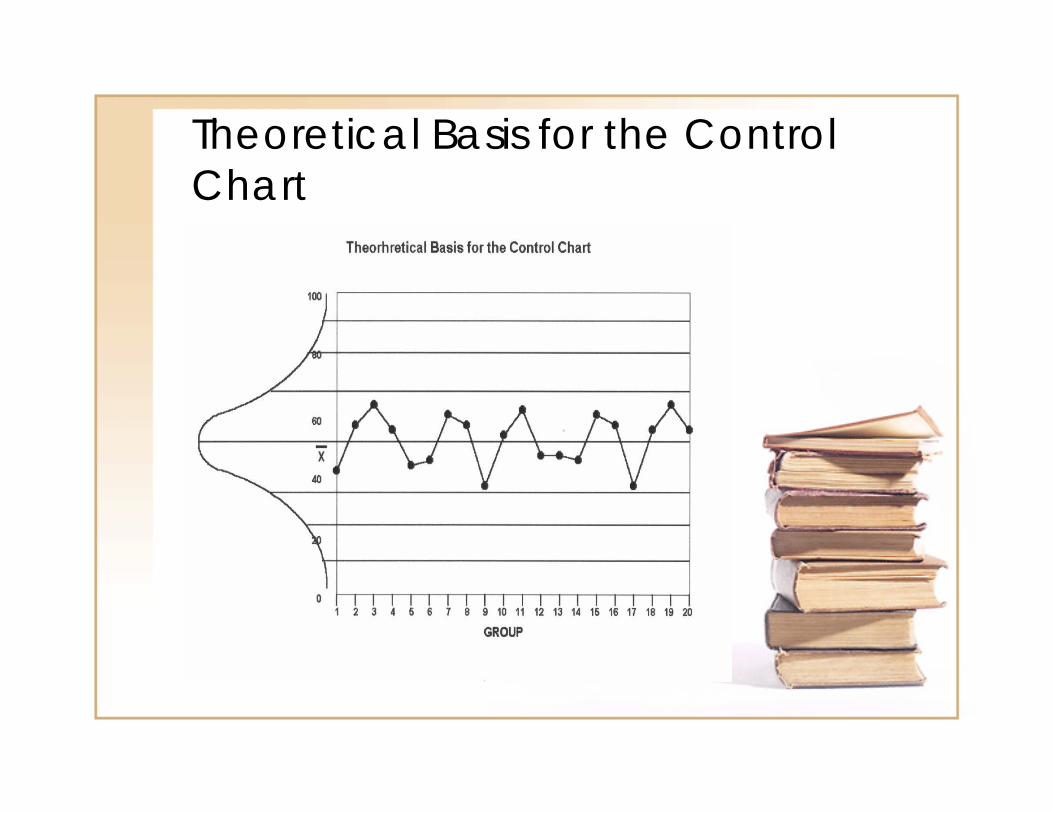
Theoretical Basis for the Control Chart
Control Charts• A control chart has a line
indicating the running average and two lines indicating the upper and lower control limits. – Common control limits are three
standard deviations above the mean and three standard deviations below the mean.
– The calculation of the control limits depends on the type of control chart.
Trends and Control• Purpose of a control chart
is to graphically identify trends.
• When using control charts, data may be considered a “trend” or “out of control.”
Out-of-Control Criteria• One or more points outside the limits
on a control chart.• One or more points in the vicinity of a
warning limit. • A run of 7 or more points. This might be
a run up or run down or simply a run above or below the central line on the control chart.
• Cycles or other nonrandom patterns in the data.
• Other criteria that are sometimes used are the following:– A run of 2 or 3 points outside of 2-sigma
limits.– A run of 4 or 5 points outside of 1-sigma
limits.
Interpreting Control Charts
• When data points are consistently above the upper control limit, the control chart indicates that the data is significantly different from what would be expected.
Interpreting Control Charts
• Points above the upper control limit could indicate problem if the data represents recordable injuries while they may indicate a good thing if the data represents the number of positive safety contacts made between supervisors and employees.

Questions?