Embed Size (px)
Citation preview

SAILING DIRECTIONS IN DIGITAL FORMAT: AN
OPPORTUNITY FOR ENRICHED MEDIA AND
INFORMATION CONTENT
ANDRES MILLAN
December 2007
TECHNICAL REPORT NO. 254

SAILING DIRECTIONS IN DIGITAL FORMAT: AN OPPORTUNITY FOR ENRICHED MEDIA
AND INFORMATION CONTENT
Andres Millan
Department of Geodesy and Geomatics Engineering University of New Brunswick
P.O. Box 4400 Fredericton, N.B.
Canada E3B 5A3
December 2007
© Andres Millan 2007

PREFACE
This technical report is a reproduction of a report submitted in partial fulfillment of
the requirements for the degree of Master of Engineering in the Department of Geodesy
and Geomatics Engineering, December 2007. The research was jointly supervised by Dr.
David Wells and Dr. John Hughes Clarke, and support was provided by the Royal
Spanish Navy Naval College.
As with any copyrighted material, permission to reprint or quote extensively from this
report must be received from the author. The citation to this work should appear as
follows:
Millan, Andres (2007). Sailing Directions in Digital Format: An Opportunity for
Enriched Media and Information Content. M.Eng. report, Department of Geodesy and Geomatics Engineering Technical Report No. 254, University of New Brunswick, Fredericton, New Brunswick, Canada, 81 pp.

ABSTRACT
Hydrographic offices have made an important effort to turn all their issued traditional
nautical publications into digital formats. Many nautical publications are now available in
digital formats. While useful, most of them are just digital versions of printed
publications. This report is concerned with one of the most important publications for the
navigator, Sailing Directions. A real improvement in the value to users of this publication
can be performed by means of adding digital multimedia features.
It is proposed that digital video film clips embedded in a GIS environment become a
supplemental means to provide additional information to the mariner about coastal
descriptions and harbour facilities. Used as an illustrated report, digital video can show
not only the information provided in printed Sailing Directions, but also some additional
aids (e.g., for manoeuvring or berthing). While still pictures can also provide visual
information, a 20-second video clip could easily be equivalent to a hundred pictures and
several paragraphs of text. In addition, a video clip with an audio track can provide on-
the-fly verbal narration and superimposed figures. This not only allows the navigator to
acquire the information more comfortably, it also depicts the real-world situation.
The major benefit of video film clips are to complement – not replace – the use of digital
nautical charts and published Sailing Directions. In addition, the incorporation of digital
Sailing Directions into GIS software can provide further decision-support capability for
navigators. GIS related digital Sailing Directions provides a good opportunity to produce
this publication in digital format according to IHO standards.
ii

From an informative point of view, the proposed digital development of Sailing
Directions is an effective enhancement of the traditional publication. So it is from the
regulatory point of view, because proposed digital Sailing Directions can accomplish
with present IHO challenges.
iii

DEDICATION
To my parents, Jose Millan and Isabel Gamboa, for they taught me to pray, and have been
the best reference in my life
iv

ACKNOWLEDGEMENTS
I wish to thank Dr. David Wells, professor emeritus at the University of New Brunswick
(UNB), for giving me all kind of advice and most useful guidelines to develop this
project. I would also like to express my gratitude to Dr. John Hughes Clarke, professor at
UNB, for the interest shown in the project and the fundamental support of linking me
with the Saint John (New Brunswick) Port Authority.
Dr. Lee Alexander, professor at the University of New Hampshire (UNH) and Chair of
the Harmonization Group on Marine information overlays, from IHO, has played an
essential role in this project, and has given me continuous support and good advice for its
development. Consequently he must also receive all my gratitude.
I like to express my gratitude to Dr. Glenn Jordan, professor from the Faculty of Forestry
at UNB. The efficient teaching and support given by him, while studying two online GIS
courses, have been keys to developing this project.
I wish to thank Dr. Peter Dare, professor at UNB and Chair of the Geodesy and
Geomatics department (GGE), his support for this project by means of efficient funding
management (along with Drs Wells and Hughes Clarke) for aerial filmings.
Thanks must be given to Steve McCavour and Jody Potter, from the Saint John (New
Brunswick) Port Authority, for their kindness and efficiency in making the ship “Harbour
Queen” available for my from-sea filming work. Pat Quinn, pilot from Saint John harbour
must also be warmly acknowledged for his useful comments and input.
v

Cameron McLeay and Kevin Wilson, from CARIS, have kindly showed me some
features from the products they work with. I appreciate their kind attention.
I wish to thank personnel from the Center of Coastal and Ocean Mapping (CCOM), at
UNH, especially Dr. Colin Ware, Dr. Kurt Schwehr, Dr. Matthew Plumlee, and Briana
Sullivan, for their kind attention and useful information exchange related to this project.
I also wish to thank Yves Leger, manager of the City of Saint John GIS Planning and
Development department, for his provision of aerial referenced photographs of the Saint
John area. I would like to express my gratitude to David Fraser, the UNB GGE mapping
technologist and GIS lab manager, for his continuous support in software acquisition and
management.
CDR Angel Chans, from the Royal Spanish Navy, has been a great help with IHO issues,
and their possible influence on the development of this project. I must thank him warmly.
I would like to thank the fellow students that have been a great help in the development
of this project: Steve Brucker and Ian Church, MScE students from the UNB Ocean
Mapping Group (OMG), for their data contribution; Blair Bridger, GGE 5th year student
at UNB, for his kind contribution providing the narration to some videoclips from this
project; and Pim Kuus, Miguel Vasquez, and Auke van der Werf, UNB GGE OMG
MscE students, for their support to the idea of this project, and their continuous
encouragement to carry on with it.
Finally, I wish to thank the Royal Spanish Navy for giving me the opportunity to study at
UNB and develop this project.
vi

TABLE OF CONTENTS Abstract ii Dedication iv Acknowledgements v Table of contents vii List of figures ix List of tables xii CHAPTER 1 Introduction 1 1.1 Concept of Sailing Directions 2 CHAPTER 2 Video filming as the most accurate tool to depict the
real world 6 2.1 Digital multimedia suitable for Sailing Directions 6 2.2 Looking for the most appropriate multimedia for
digital Sailing Directions 9 CHAPTER 3 GIS as an useful tool to complement digital video
Sailing Directions information 17 3.1 Nautical chart displayed in a GIS 18
3.2 Complementary GIS analysis tools 24 3.3 Summary of Advantages of using a GIS as the basic
environment for digital Sailing Directions 34 CHAPTER 4 Advantages and drawbacks of using this product
and other 3-d real world models, to accomplish Sailing Directions requirements 35
4.1 Works from CCOM at UNH 35 4.2 Google Earth 39
vii

CHAPTER 5 Further technical development recommendations 45
5.1 Display strategy 45 5.2 A strategy to link this product to an ECDIS 56
CHAPTER 6 Further standardization development recommendations: matching with IHO requirements 59
6.1 Background: the Standardization Nautical Publications Working Group (SNPGW) and the Committee on Hydrographic Requirements for Information Systems (CHRIS) 59
6.2 A first approach to match IHO requirements: digital Sailing
Directions as a Marine information overlay 63 6.3 Limitations of digital Sailing Directions as an MIO. S-100
standard as a proper space for digital Sailing Directions 68
CHAPTER 7 An approach to implementation and legal issues 73 CHAPTER 8 Conclusions 77 REFERENCES 79
EXTERNAL APPENDIX 1: Video File “Inner Approach to Saint John” EXTERNAL APPENDIX 2: Video File “The Channel into de Harbour”
CURRICULUM VITAE
viii

LIST OF FIGURES
1.1 Display of a nautical chart and the Sailing Directions to study a track 3
1.2 Detailed display of the tools available by the navigator to study
the entrance to the Saint John harbour (Nautical Chart and Sailing Directions) 3
1.3 Typical harbour approach view from a ship’s bridge 4
2.1 Still picture showing the most important features of a certain harbour
view (Saint John harbour from the fairway light and whistle buoy) 10
2.2 Video stills from a videoclip showing the Sailing Directions expressed in
figure 1b 12
2.3 Video stills from a videoclip showing guidelines and advice to enter
Saint John harbour through the main channel 13
2.4 3-D image of Saint John harbour seafloor, visualized in Fledermaus,
from IVS 14
2.5 3-D image of Saint John harbour seafloor, combined with its
corresponding real video image 15
3.1 ArcMap screen showing simultaneously several useful layers for
navigator’s use 19
3.2 ArcMap screen showing a Sailing Directions page, from the printed
version, hyperlinked to a feature in the map area 20
3.3 ArcMap screen showing a Sailing Directions page, from the printed
version, hyperlinked to a feature in the map area 22
3.4 ArcMap screen showing the Saint John webcam hyperlinked to the
Saint John nautical chart map area 23
ix

3.5 Example of scenes from a videoclip, showing leisure information
(restaurant in Saint John) 24
3.6 Wharf with ships berthed in it, showing a power outlet 25
3.7 Spatial join table obtained from a GIS spatial join between layers. 26
3.8. Buffering a line type layer 28
3.9. Result of intersecting a buffered street layer with the tourist places layer 29
3.10 Mapping a city according to the leisure degree in different areas 32
3.11 Mapping a port according to bollards, power outlets and water
outlets locations 33
4.1 View of software GEONAV, displaying real images and another
3D cartographic information (bathymetry, aerial pictures, symbols, etc) 36
4.2 View of software GEONAV, displaying real images and another
3D cartographic information (bathymetry, aerial pictures, symbols, etc) 37
4.3 Some 3D models visualized in Google Earth 40
4.4 3D model visualized in Google Earth, showing a pop-up window
with a picture of the building or feature, linked by a symbol 41
4.5 Image of the Saint John harbour offered from Google Earth 43
4.6 Night from-sea view of the Saint John harbour 44
5.1 Basic 3-frame-display for proposed Digital Sailing Directions 46
5.2 Links between the PDF window and the videoclip window 48
x

5.3 Links from the nautical chart, PDF and videoclips 49
5.4 Link to a Weather Forecast web page corresponding to the area covered
by the Sailing Directions booklet 50
5.5 Link to a PDF document apart from Sailing Directions 51
5.6 Display of SFProspector aided by an ArcIMS map document 52
5.7 Display of a PDF document of Sailing Directions and a videoclip, by means
of different hyperlinks 54
5.8 Example of a GIS 3-frame display for tourism purposes 55
5.9 Example of Sailing Directions coverage 56
5.10 Sketch of a link between an ECDIS and a spare screen for Sailing Directions 57
6.1 Different approaches for nautical publications to be integrated into ECDIS 62
6.2 Marine information overlay as layers that contain both chart-related
and operational features 66
6.3 Marine information overlay as a direct link between nautical
publication information and an ECDIS 67
6.4 Above: Florida Key National Marine Sanctuary. Below: Features of the
Sanctuary added to an ENC as an MIO 68
6.5 S-100 standard supporting a great variety of data sources, products and
services 71
7.1 Example of printed snapshots for real time guidance 74
7.2 Digital Sailing Directions responsibilities diagram 76
xi

LIST OF TABLES
3.1 Criterion to map a city according to different “leisure indexes” 30
xii

CHAPTER 1
INTRODUCTION
Since the early 1990’s, the International Hydrographic Organization (IHO) has developed
standards and encouraged member states to convert all the traditional paper nautical
publications into digital formats. Based on the idea of this process, this report is intended
to be a first step in a proposed implementation of a traditional nautical publication in
digital format: Sailing Directions. Four main concepts are to be considered as the basis of
this project:
- If a picture is worth a thousand words, a video is worth a million words.
- The publication “Sailing Directions” can be developed into a rich digital format,
improving its objectives by means of complementing its present text and image
format.
- Video movies plus Geographic Information Systems (GIS) are excellent tools to
perform this enhanced digitization. In addition, a GIS offers some analysis
possibilities for ships, port authorities, and marine companies.
- The goal must be to provide the navigator, when reaching a harbour or a coast, the
feeling of: “I have been here before, and I can identify at a glance all the marine
and land features I have in front of me”, that is to say, to improve safety at sea
by giving the navigator as much information as possible and in the most easily,
quickly and reliably understood way.
1

To show step by step what this project consists of, Chapter 1 of this report will first
explore the concept of Sailing Directions. Chapter 2 will demonstrate what video filming
can accomplish, to supplement Sailing Directions information. Chapter 3 describes how a
GIS software (based on ArcGIS, as an example) can support the information given by
Sailing Directions, and how to introduce videoclips in the GIS, and studies some analysis
tools that could improve the service given by the publication. Chapter 5 is a brief
comparison between this product and other 3D real world models. Chapter 6 include s
some recommendations to further developments of this product. Finally, Chapter 7
connects the proposed product to IHO standards.
1.1 CONCEPT OF SAILING DIRECTIONS Sailing Directions are publications that expand charted details and provide important
information of interest to navigation which may not necessarily be found on charts or in
other marine publications. It is intended to be read in conjunction with the charts quoted
in the text. This book contains a very detailed description of the coast, with many views
and information about harbours, winds, currents, lines, hazards, rescue stations, signals
and so on, and all of those data that make navigation easier and safer.
The main goal of Sailing Directions is to provide the navigator with a complementary
tool to improve the safety of his navigation.
Sailing Directions consist of a series of books. Each book covers a specific geographic
area and cross references all charts in that area.
To explain better the concept of Sailing Directions, and the further development reflected
in the rest of this report, an example is given: Suppose that a navigator wants to sail from
anywhere in the middle of the Bay of Fundy to Saint John (New Brunswick), and intends
2

to berth in the harbour of Saint John. The traditional process to study the track to follow
consists of displaying the nautical chart along with the Sailing Directions book (see figure
1.1). By identifying all the features, the navigator will obtain enough knowledge and self
confidence to perform a safe navigation.
Figure 1.1 Display of a nautical chart and the Sailing Directions to study a track.
Figure 1.2 Detailed display of the tools available by the navigator to study the entrance to the Saint John harbour (Nautical Chart and Sailing Directions)
Using the display explained above, the navigator visualizes the harbour. The navigator
uses written descriptions from the book, the black and white aerial images, and the
nautical chart information (see figure 1.2). However, figure 1.3 shows the image the
3

navigator is actually going to see through the windows of the bridge of the ship. That is to
say, the navigator normally will find some images that differ significantly from his
previous visualization.
Figure 1.3 Typical harbour approach view from a ship bridge (Saint John harbour from the fairway light and whistle buoy)
Even when Sailing Directions shows pictures of coastal views, these pictures, for reasons
of space constraints, are very scarce and do not reflect all the views the navigator will
find along his track.
When entering the harbour the navigator must perform a quick and accurate task. By
positioning the ship in the nautical chart, and remembering what he visualized from
Sailing Directions, he must identify all the marine objects and coastal features to make
sure that the ship sails along the right path. In addition, a good navigator always keeps in
mind that GPS signals can fail, and other traditional positioning methods must be ready to
use (radar, gyro bearing lines, visual references, etc). Therefore, even with a modern
4

Electronic Chart Display and Information System (ECDIS), the navigator has a pressing
need for a clear picture of the harbour.
Therefore, a tool that represents the real world as accurately as possible is needed. This
tool should show the navigator the real world along the whole path to the ship’s
destination berthing.
5

CHAPTER 2
VIDEO FILMING AS THE MOST ACCURATE TOOL TO DEPICT THE REAL WORLD Several multimedia can be used to illustrate Sailing Directions information. After a brief
analysis of these in section 2.1, section 2.2 will conclude which one is the most
appropriate.
2.1 DIGITAL MULTIMEDIA SUITABLE FOR SAILING DIRECTIONS Several digital multimedia features can be useful for Sailing Directions. Multimedia itself
means more than one concurrent presentation feature. To describe the real world as
accurately as possible, for Sailing Directions purposes, several digital media can be
considered. A brief description of some known options are described below:
- Digital printing:
o Word processing documents. Consist of plain-text formats. The most
popular is Microsoft Word. When Word processing documents contain
pictures, size increases considerably.
o Portable Document Format (PDF): Allows capturing and viewing all the
elements of a printed document as an electronic image that can be viewed,
navigated, searched, printed, or, due to its small size, forwarded to
someone else by e-mail.
o Extensive Markup Language (XML) and Hypertext Markup Language
(HTML). Both languages contain markup symbols to describe the contents
6

of a page or file (XML) or mainly text and images in a Web page, in terms
of how it is to be displayed and interacted with (HTML). XML is
“extensible” because, unlike HTML, the markup symbols are unlimited
and self-defining.
- Digital photographs:
o Referring to their spatial type:
Vertical photographs (the camera axis is vertical or nearly
vertical). They are taken from aircraft.
Oblique photographs (the camera axis is intentionally tilted). They
can be divided in Low Oblique (the horizon is not reflected in the
photograph), and High Oblique (the horizon is reflected in the
photograph). They can be taken from air, land or sea. Figures 1.2
and 1.3 show examples of oblique photographs.
Orthophotos. They are vertical photographs that have been
rectified in such a way that every feature in the photograph is
mapped according to its geographic position. They will be useful
as a complement to a GIS environment, as is explained in chapter
3.
o Referring to their digital formats:
Joint Photographic Experts Group (JPEG). This format can achieve
astounding compression ratios even while maintaining very high
image quality. It works by analyzing images and discarding of
information that the eye is least likely to notice.
7

Tagged Image File Format (TIFF). This format is used as a lossless
image storage format that uses no compression. Consequently, file
sizes are quite big.
Graphics Interchange Format (GIF). This format uses algorithms to
approximate the colors in the image with a limited palette of 256
colors. It produces very small pictures, but with a great loss of
image accuracy.
- Digital video:
o Digital video (DV) and Audio Video Interleave (AVI). They give the best
video quality. However, they demand significant storage space. Sixty
minutes of video can take up almost 12 GB of disk space.
o Moving Picture Experts Group (MPEG). This format is a high quality
compressed format, which is able to save up sixty minutes of video onto
2.3 GB of disk space.
o Streamable video formats: Windows Media Video (WMV), QuickTime
(MOV), RealVideo (RM), etc. They are sent in compressed form over the
internet and displayed by the viewer as they arrive. In a live broadcast, the
video signal is converted into a compressed digital signal and transmitted
from a special web server that is able to send the same file to multiple
users at the same time. They offer reasonable quality, small size files, and
allow users to send videos via e-mail, or place on the web for easy viewing
anywhere. However, these files, except MOV formats, cannot be restored
or edited .
8

o Flash Video (FLV). This format is the most used on the web. It has the
best size/quality ratio. Many web sites (for example, YouTube) offer
server-side encoding of video. Any format can be uploaded, and it is
automatically encoded to FLV.
2.2 LOOKING FOR THE MOST APPROPRIATE MULTIMEDIA FOR DIGITAL SAILING DIRECTIONS
Focusing on the information given by Sailing Directions (i.e., independently of nautical
chart displays), a brief analysis of suitable media is performed. Afterwards, possible
formats of these media will be analyzed.
A digital picture gives good resolution, and some text and figures can be superimposed to
explain the features reflected in them (see figure 2.1). In fact, some present Sailing
Directions are built using these kinds of figures. But due to book size constraints, those
figures have to be limited. Thus, only few of them, showing views from certain key
points, can be used, losing the continuity linking every image. The pictures themselves
must have only a few superimposed figures, otherwise the image would be saturated,
losing in such a way their informative purpose.
9

Figure 2.1 Still picture showing the most important features of a certain harbour view (Saint John harbour from the fairway light and whistle buoy)
Even considering exclusively the information reflected in the text of Sailing Directions,
the necessary number of pictures to describe the text faithfully, would be too high. Also if
we consider that much more information must be given to the navigator for him to have a
clear and complete picture of the harbour he is entering (approaches, buoy relative
positions, harbour facilities, etc), the number of pictures to be shown would have to be
huge, and publications would have important problems to cover all of them.
Filming can provide the navigator with all the required information, and not only in a
continuous and clear form, but also in a very comfortable and high “mind-impacting”
way. Watching a videoclip where Sailing Directions are shown by means of
superimposed text, figures and narration is a greatly effective way to give the navigator
that feeling of “I’ve been here before”, that is to say, to make the navigator feel familiar
with the corresponding coast or harbour. If we compare the information given by figure
10

1.2 with the one given by a videoclip, done for that part of Sailing Directions (see figure
2.2), we can see the great difference between them. In the videoclip, a verbal narration,
with text and superimposed figures, explains all features contained in Sailing Directions.
A little nautical chart superimposed on the image points out where all these features are,
helping the navigator their identification.
An additional and basic advantage of video filming is that a complete navigation through
a safe track (for instance, the navigation through the Saint John harbour main channel)
can be re-created. In addition, it has the additional security that this information is being
given from a real ship that is sailing safely according to the Sailing Directions. Guidance
on how to steer a ship to leave a harbour, or to go to a particular berthing place, can also
be efficiently provided by video. Figure 2.3 shows an example of a videoclip explaining
the navigation through the channel.
A complementary tool that can be added to a videoclip, in those video images where the
risk of shoals are present, is a superimposed 3-D image of the seafloor, Using a 3-D
visualization tool, like “Fledermaus” from Interactive Visualization Systems (IVS), a
rectified image of the seafloor, using control points, can be merged with the video image.
Figure 2.4 shows a typical 3-D seafloor display in Fledermaus. Figure 2.5 shows a video
still with a combined image.
11

12
12
Figure 2.2 Video stills from a video clip showing the Sailing Directions expressed in figure 1. 2 (See External Appendix 1)

13
Figure 2. 3 Video stills from a video clip showing guidelines and advice to enter Saint John harbour through the main channel (See Extemal Appendix 2)

Figure 2.4 3-D image of the Saint John harbour seafloor, visualized in Fledermaus, from IVS. Data used to build this image has been generously provided by the UNB Ocean Mapping Group
14

Figure 2.5 3-D image of the Saint John harbour seafloor, combined with its corresponding real video image. Due to a lack of bathymetric data in some areas of Saint John Harbour, the seafloor used in this figure is a touch up based on the data mentioned in figure 2.4
Detailed graphic information provided by a videoclip is great help for those navigators
coming from a different IALA (International Association of Marine Aids to Navigation
and Lighthouse Authorities) buoyage region. These images will assist a navigator coming
from Europe, for example, to keep in mind that when entering the Saint John harbour,
green buoys must be left on the port side.
Another big advantage of videoclips is for non-English speaking navigators. By watching
a videoclip they will understand on the fly all the features of the harbour, while reading
he/she has to have a good command in English to understand the text.
As stated in point 1, Sailing Directions is to be used mainly in advance of visiting a coast
or entering a harbour. It provides “to-be-previously-studied” information, so that when
15

entering the harbour, almost all the information is kept in mind by the navigator. In
addition, a real time useful feature could be obtained from videoclips. By means of
grabbing those key images of interest, the navigator can easily build a printable version of
the directions, just to be used while navigating. A sequence of images, like those ones
shown in figure 7.1, can be printed and ready to use in real time. Actually, the videoclips
can be visualized at the same time the ship is entering the harbour, but must be used by
personnel from the navigation support team (to provide assessment to the officer on
watch), not by the officer on watch.
Concerning formats for pictures, JPEG format seems to be the most reasonable. This
format gives good quality while not taking up much disk space. Concerning the type of
photographs, orthophotos are useful for GIS purposes (see section 3). Oblique
photographs, either aerial views or surface views, are useful for explanatory purposes as
detailed complements to videoclip moving images. For example, a detailed picture of a
ship that normally operates in a harbour (for example, M/V Princess of Acadia, in Saint
John harbour), can be merged in the explanations of a videoclip.
For video, FLV format is the best choice. While maintaining a good resolution, this
format cannot be edited by the user, and allows a possible broadcast of digital Sailing
Directions via the internet. Texts formats to be used in videoclips are provided by video
edition software itself. In section 6.4, when speaking about digital Sailing Directions
display strategy, and texts apart from the ones embedded in videoclips, PDF format is
very useful. However, text display showed in section 4 may be open to other text formats
like XML, or HTML.
16

CHAPTER 3 GIS AS AN USEFUL TOOL TO COMPLEMENT DIGITAL VIDEO SAILING
DIRECTIONS INFORMATION
As explained in point 1, Sailing Directions books are used along with nautical charts
simultaneously. While reading the book, navigators are checking the nautical chart. At
this point, it is evident that a videoclip is more explanatory than a piece of printed text.
However, the visualization of the nautical chart is a matter to take into account too. This
issue is analyzed in the following section.
Digital conversion of traditional products does not necessarily mean an improvement of
the product. Or at least it is matter to be discussed. A clear example is digital books. A
book in PDF format, read on a computer screen, has many advantages (a library of
thousands of books can be stored and read on a laptop, links to other features can be
added, search of words can be performed, etc). But, for leisure purposes, some can feel
that the quality of reading a hard copy book cannot be replaced by a digital one. Others,
on the other hand, may feel that reading a digital book in a large computer screen is
better than handling a printed copy.
Concerning Sailing Directions, a nautical chart must be used along with the publication
study. However, studying a paper nautical chart is more comfortable than studying the
equivalent ENC on a computer screen. By merely swinging the head, the eyes sweep the
nautical chart in fractions of seconds. By moving the head closer to the chart, details can
be seen, in fractions of seconds too. An ENC displayed in an ECDIS requires zoomings
and pannings to see all its features. In addition, a display from a paper nautical chart is
much cleaner than the one from an ENC displayed in an ECDIS.
17

Therefore, a question automatically comes to mind: Will a digital version of the nautical
chart contribute to improve Sailing Directions? The answer to this research question will
be given in following sections.
3.1 NAUTICAL CHART DISPLAYED IN A GIS
Using a GIS, a nautical chart and the information given by Sailing Directions can be
accessed and visualized simultaneously. Additionally, we can use the powerful GIS
analysis tools to improve the product. The layer system provided by a GIS can very easily
show many different kinds of information, simultaneously, on demand, depending on the
user needs. Figure 3.1 shows a GIS (ArcGIS in this case) screen displaying a nautical
chart over other GIS layers (aerial photographs, bollards, sailing lines, power outlets, etc)
ArcGIS offers a very effective and simple tool to add Sailing Directions information files
to GIS. By means of hyperlinks we can link the desired type of Sailing Directions format.
We can link, for instance, a Portable Document Format (PDF). Figure 3.2 shows a printed
version of Sailing Directions hyperlinked to a sailing line from the map area of ArcMap.
18

19

20
!!ftCIIC..,,_..~IM .... DIIP -· ~ D oHI . IS >< •
........ - &5 .,. .......
-Ill-. lilt-.-.
~ ra......., ..... - li!I £::C:I -- li!l C.h
• liS 4117.../totfl).aOCoOy., - lil -ol ...
-~~ hrlel.l • """: ..... .) -~!lord..)
Figure 3.2
--:!) ~ ,,,,."
~ 3 :!. ~<- • O ~? <:l€1
:.:;:.:ff,l ----------------=-~--==~-~~~-L-J
~
~- ~ -L-
l.tllr !JbatJ• • :J (.') • ~ :J ..,. ~ 0 .. .:. , i .... ·- -
:'C.C"!EO:::"''iL::~~
\ l
....,,,......~ .. ,.,......,.
Arc .\fap screen showing a Sailing Directions page, from the printed l'erstoll, h)periii!Ud to af(I(Jture in the map area
~

In the same way, video files can also be easily hyperlinked to ArcMap, resulting in a
clear and helpful way to identify the features shown in videoclips with those in the
nautical chart. In this example video files are attached to the corresponding sailing lines
created in the map. In figure 3.3 we can see how the video image identifies landmarks
with the control points defined as a layer in the GIS map screen.
One requirement for this product implementation, that we can guess by observing figure
3.3, is that a large computer screen is required to visualize in detail the GIS map area and
the videoclip. Even two screens would be suitable, one for the GIS map area, and the
other one for the videoclip. This matter will depend on the bridge room availability in
each particular case.
To complement this link between GIS and videoclips, the GPS position information of
the filming ship can be superimposed.
Another useful type of feature that can be hyperlinked to this product is a harbour
webcam, linked by its Uniform Resource Locator (URL). If an internet connection is
available, the most recent visibility conditions, for example, can be checked prior to enter
the harbour. Figure 3.4 shows a Saint John Harbour ArcMap view hyperlinked to the
webcam of Saint John.
21

22
~
.; ~ ()' .;. a--.; !!I ::::: i-~ ()
~ .. B' l
~ 4 ~ ::- ' ~
" ~ ~ 1il

23
o f f IP
"' ' j' ll 1 • . J
"' IJ . { f
1 r " i t ~ ... :... ~
'J .... .ij' .... Q Ill
\ "' ~ tJI ':! ~· s. " g> ~ ~ S" ~ .,. B li ,:;r ~ ::t ~ a <> s. .. g> e· ~ ~
$ "' tD [
9 R • " [ ~ ~ 1:1

Finally, and as an example of how video files can improve another kind of information, a
navigator could also be helped by a videoclip before planning a meal downtown. Figure
3.5 shows three scenes from a video file showing the path to a restaurant in Saint John,
departing from the downtown port gates, and the interior of that restaurant.
Figure 3.5 Example of scenes from a videoclip, showing leisure information (restaurant at Saint John)
3.2 COMPLEMENTARY GIS ANALYSIS TOOLS
Apart from Sailing Directions information, ArcGIS provides us with some powerful
analysis tools that can improve the product. Sailing Directions requirements and the
analysis tools can be merged in the same product. This section will demonstrate useful
analysis tasks that can be accomplished with ArcGIS, and provide examples of these
tasks.
The first example of an analysis tool is to check wether a berthing place is suitable for a
certain ship or not. Let us suppose that ship X is going to enter Saint John harbour, and
she is assigned a berthing place covering bollards 285, 286 and 287. This place could be a
24

good berthing or not depending, for example, on how far the closest operational power
outlet is. If the closest power outlet is farther than the length covered by the ship´s power
cable, then the ship will have to take her power from her own means, with the unpleasant
results (noise, waste of fuel, etc). Figure 3.6 illustrates this idea.
If we perform a spatial join between Power_Outlets and Bollards layers, we will have the
closest distances from the bollards to the power outlets. In such a way we will obtain a
table like figure 3.7 shows.
Figure 3.6 Wharf with ships at berthed, showing a power outlet. The power outlet in this wharf can be suitable for ships berthed at a distance “a” from it. But a ship berthed at a distance “b” from the power outlet must make sure that her power cable length is long enough to reach the power outlet
25

26
Ei< ~· !lew -· iiele<Oon !ools - !!01:> lie«•.,....,. • La,w: I~T<Y3tl 3 0 • / 8 I 3 ,. 1.----------...:.J: I@ IZiJ !Jlllfl § _. ... 1"3 . .. ,..
l St
• b 0 Joh_TO!.r_Con
• E. 0 COntl'oi..,JXW'Its
E 0 Acoo•••IO!iOno
B Cl P!o~ 278 • "6.505140
E Cl ~ --- 279 --- • 36.249683
• 280 • 60.1»<90S
P O Ar~ 231 • 102 831S10 --p Ei) lh::::~3··
282 • 81.096184
1·1H; --- 283 --- • 10 1.758975
• 2 .. • 42.023904
l-l E21 Jon bolllrclso\Va~ ou!Se --- 28S --- • 31.50'1568
• 28$( •I 9t.t2S$$0] b EZ1 Wateroutltts -- 287 tO 111.986244
• -- ,.., 101 47.0713861
b 0 "'''"" 2 .. tO >2.998083 . --- 290 - -- tO - 92.793163 6 621 Powt'tcu~ts , E 0 Sailo>Q.)nH
-B E!l Cctridors
Figure 3.7 Spatial join table obtained from a GIS spatial join between layers. Closest distances between bollards and power outlets are shown here

Here we can see that between bollards 285 and 287 the minimum distance to a power
outlet is around 31 metres (to power outlet # 9) and that the maximum distance is around
111 metres (to power outlet # 10). So if the power hose is 200 m long, there will not be
any problem. But if the power hose is 70 metres long we will have to check first how far
along the dock the ship´s power station is to be located, and depending on this fact, we
must check if the cable reaches the closest power outlet. In case it does not reach, prior to
entering the harbour, a more suitable berthing place can be requested, or make
arrangements in advance to get a longer cable. This information provided by ArcGIS will
avoid undesirable waste of time and money. A similar analysis could be performed with
water outlets, or port gates to the city.
The second example of an analysis tool is to plan a tourist visit to the town. When a ship
arrives in a port, she normally spends very few days there. If the Executive Officer (X.O.)
would want to organize a short but effective tourist visit, he could decide that the best
way to do it could be visiting those places that are close to the streets. Let us consider a
distance of 100 m as the maximum one to consider a place “near to the road”. If the crew
have only one morning for the visit, the X.O. can decide to rent a van, only for the
morning, and allow the crew to visit the highest number of places possible.
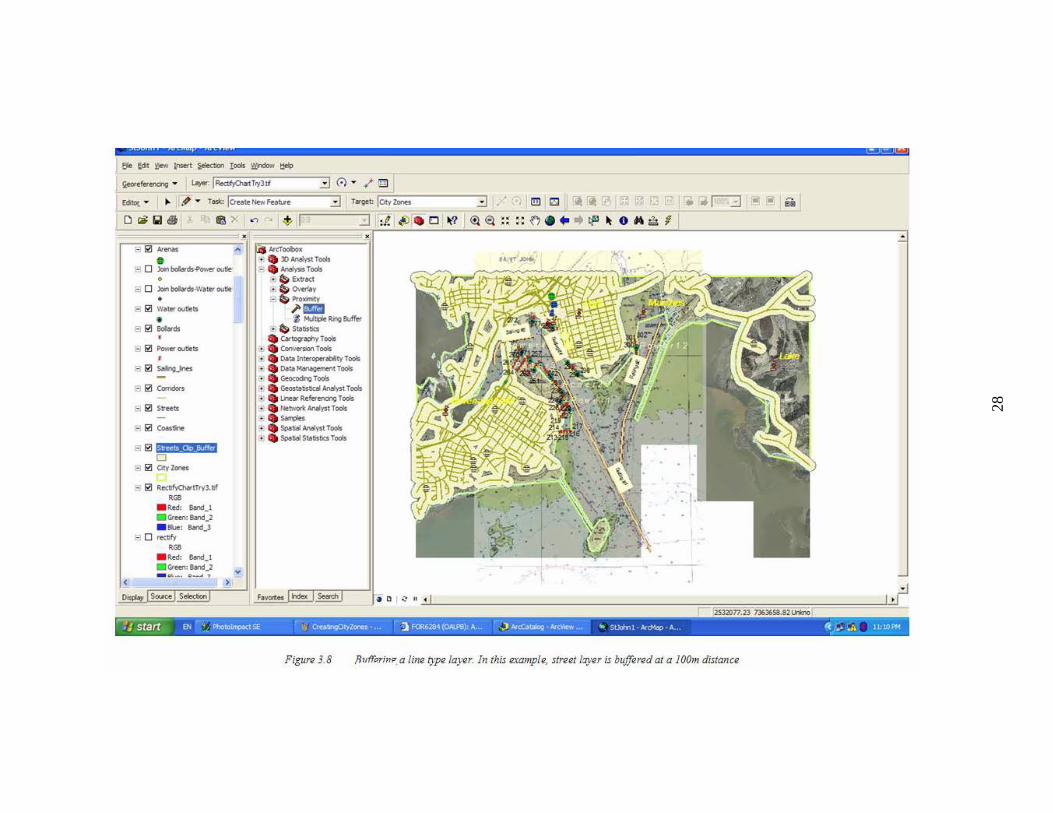
If we perform a buffer of 100 m around the streets, and then make an intersection with
the tourist places layer, we will obtain automatically all those tourist places within a
distance of 100 m from any street. Figure 3.8 shows the result of the buffering process,
and figure 3.9 the result of the intersection. In this case we can see that the only tourist
places near a street are “Reversing Falls”, “Old store”, “Old lighthouse” and “Park”.
“Marshes” and “Lake” are not included.
27
28
- • .. • 13'l'lall laJJ
fit t<ft !low l/1s«t ~ !ools ~ ~
!i<O<•I«"""''' • ~¥<" JRectl,(hortT.,.JJI ::::J 0 • / IE)
f6tot . ,.. IJ ,~ • Task: Jo............... ::::1 Twget '"'lo_tv_z.,..------::::1-.· • 1!!1 12>1 !f4 1t '" '" D ~ lll £9 e, x .-, . ~ ~ ..:]
= · · t= r1 --=s=--'611,....,..,-....,------A- f¥lcr.-x
C ~- . DMaiysi Tools " 0 ..... bola<ds.f>o\\<<C>U!Jo E' . Mal,... Tools
<> ~.· "' Extr~ 3 0 Jo<> bola<ds.W6oe< ou!Jo :--~ Ovttl6r
• 8 (i3 Water~ts
• ~ 611 -ds
d 611 Povmou!JoiS I
9 G!l _..._,.,..
d 611 Conidors
~ G!l s .....
d 611 Coaslft
R eJ fj•W .. I •jJ•!iGJ D
d 611 Olylon<s
3 G!l R«OftO>w<T•rJ.•f RG8
. Jl<d, Bind_! • c;,...,, Sand.Z • ill><' Sand_J
t=J 0 <mfy RG8
. Red, Bnl_l • Gre-en: 8Md_2
b ~ ...... ty
)' li:!mlJ '1; Mil.,.. R»g&lff<r
·; ~ S,.o;sliC$ • <artoo-ac>hy Tools '-. c......,_ Tools
! • O.talntcroperabityTods '• • 0.10-Hools
~- . GeocodngTools lt. • C.OSIOt>s«ai Mairsl Tools 1• • ..,..,. R•l«"""''' Tools ,. • ,.._,. MalystTool$
r. • S6o'r<les b . Soa""'ANivst Tools · • • Soa,.,SIOasl>csTools
<!l El ;~ :~ e"J . .. .. £iii ~ 0 ,. s f
Figure 3.8 !luffo.rinP.a line type layer. In this example, street layer is Uilffered at a lOOm distance
'"'

29
t. SUohn1 · ArcMap · ArcVi('W r;]@~
E<e tc>t ~jew """'' - !ocls - t!<l> !ie«<ft<....... • l.o;or I~T.,Jd 3 0 • ... El
EO"" • .. .~ • Toslc (e<••t<-F<aU< 3 T«g<t .. ,Oty;;;;;lonc<,..-------3-• ·i I!!J l!'i) ~ ~ ,.. ~~~ 1 ' ... r-:::1 oi • ~
[) ~ !;! &; ~ ... ~ .. • ~ • ~ I:,P. ~) • o ~? <!l ~ :~ ~~ ~ • .. • l.jil 11 o ,. a ~ f::1 e; Layers
= !a h@§ifif,(L@ • J) .Analyst Tools' , • • ..,.,.Tools •
- fia Jo/n_TrN_Cort . '=" &! ControiJIC*I-ts
- 611 A«oooodaoons
- G!IPio~ ~
.::. 621 T~IX_placM
l -. 611 .....
• =611 -•
<*J ~ Extrect OJ ~ ov.Ny
;- .. ,.,.... ;- ......
10- b Pro:ofttv /' Buff«
~ ,.; ......... """" •' b Statisbcs . cat"'9'aohYTocls
. · eon...-- . 061a • • Oat>
c.a. • Geoc.'!cldnO I TOtU'ISUt.J)faees 10 I TOUI"istieJ)faees Place 10 I TOtlffStiCJ)f~s llame I TOtl tfsticj)lat I [+. Geo$t4USb • I I j I R!V~Mgfak <thJ ..
- 0 ...., bolards- ..... • • Lhearltt .a~ g o~ s.1ore (N\111>
Cti • NtMOrlt A --- s 10 01::1 U;hthouse dl~
• 6 621 Water eu~ts
L+1 • $arrOie$ --- 8 ' ll Pal1: djl;ll>
:··. Soo"'"" --•.• Soo"' St> I
• - G!I S.Wds . = Ia ~eu~ts
- 6!1 SaOnoJn<s
2 611 c.mdo<$
- 63 Strtotets
Figure 3.9 Result of intersecting a lnl!fered street layer with the tourist places layer. Only those tourist places inside the lnlffer are given in the intersection table
J

The third example of an analysis task is to see at a glance which areas of the town are
more enjoyable in terms of leisure. If a ship has the opportunity of choosing a berthing
dock among several choices, a map of leisure levels will help the navigator to decide
where to berth, if a chance to choose exists.
By calculating a “leisure index” (based on a “leisure rating”, a product of several factors
related to the number, quality, visits, etc, of leisure elements in a city) the city can be
mapped according to this index. Figure 3.10 is the result of mapping the city according to
the “leisure index” expressed in table 3.1.
Leisure_rating Description Leisure Index (LI)
1-2 Boring areas 1
2-4 Areas with few leisure
opportunities
2
4-6 Areas with some leisure
opportunities
3
6-10 Areas with acceptable
leisure opportunities
4
10-12 Area worth visiting 5
12-20 Interesting areas 6
>= 20 Very interesting areas 7
Table 3.1 Criterion to map a city according to different “leisure indexes”
30

Those analyses explained above can be translated to a clear map layout to be shown to
the crew before calling at a port. These maps would permit the crew to see at a glance the
most enjoyable areas of the city, or which tourist places they are going to visit in the city.
A map layout would also be interesting for the ship´s Chief of Engineering to have a
visual idea about the location of power and water outlets according to the bollards.
Examples of these map layouts can be seen in figures 3.10 and 3.11.
Training courses of basic GIS analysis can be given to Navigation Team members in a
vessel. A three months training may be enough for a mariner to be able to manage GIS
analysis tools.
31

32
32
Legend
~AO< .. PI>CU
--- s..""
City Zones Ltisurt lndu by City Zonu
0 1- 41~
0 2 O H 0 39
Figure 3.10
~
0 6501,300 2,600 3,900 5,200 pill11111111111111 I I ' metres -~
JIJJPpj)Jg a city according to the leisure degree in different areas
33
Legend
~ 'NDC' 0. :t :a
-·· """"...-
--- """' COl.,..,.
0 650 1,300 2,600 3,900 5,200 ,..._.._- I I ' metres
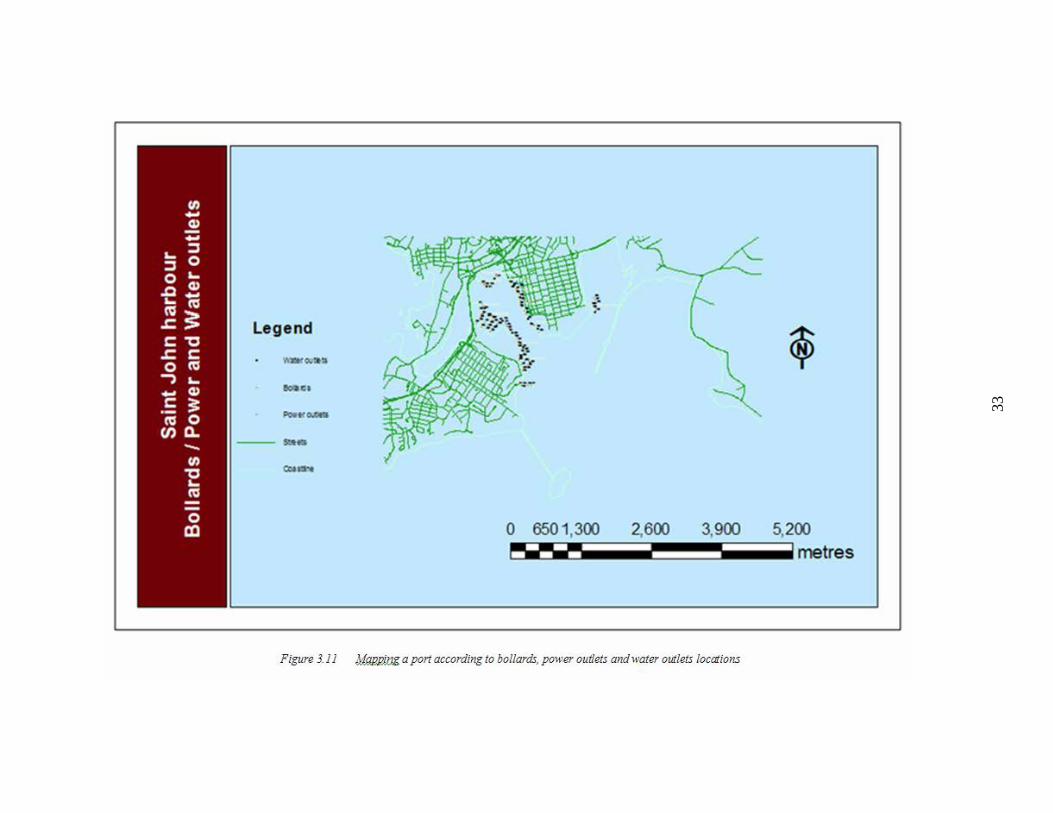
Figure 3.11 MIJBJ?JJJg a port according to bollards, power outkts and water ou&ts wcaiions

3.3 SUMMARY OF ADVANTAGES OF USING A GIS AS THE BASIC ENVIRONMENT FOR DIGITAL SAILING DIRECTIONS
Although a paper nautical chart is more comfortable to study, GIS features enhance
Sailing Directions to a great extent. The advantages of a GIS environment can be
summarized as follows:
- A GIS permits the navigator to check geographical positions by the simple
movement of the mouse. Bearings and distances can be obtained easily, without
any need for physical rulers, pencils, etc.
- GIS can show on the same screen the chart and Sailing Directions publication
information. Hence, large rooms for chart and book displays are not required. In
addition, Sailing Directions and nautical charts can be studied anywhere there is
room for a computer or laptop.
- GIS provides some analysis tools of interest for the navigator.
Another basic advantage of GIS use for Sailing Directions is that it could accomplish
IHO requirements, and be a tool for common legal use worldwide. This aspect is
discussed in more detail in section 7.
A disadvantage may be found in the required additional learning and training courses
required to use GIS effectively.
34

CHAPTER 4 ADVANTAGES AND DRAWBACKS OF USING THIS PRODUCT AND OTHER 3-D REAL WORLD MODELS TO ACCOMPLISH SAILING DIRECTIONS REQUIREMENTS Some sophisticated 3-D real world models are being developed. One could think of them
as useful tools to accomplish Sailing Directions requirements. Two of these products, that
are good examples of media rich 3-D real world modelling works, will be analyzed: The
work from the Center of Coastal and Ocean Mapping (CCOM) at the University of New
Hampshire (UNH) about panoramic images for situational awareness in a 3D chart-of the
future display, by means of GEONAV software; and the Google Earth world modelling
product.
4.1 WORKS FROM CCOM AT UNH
The first example (CCOM) is a tool that shows in real time the real world surrounding the
ship, according to her position. The images shown in this case are built by means of
mosaics of panoramic pictures (see figures 5.1 and 5.2) fitted to images of the seafloor
and aerial pictures.
35

36
Figure 4.1 View of software GEONAV, displaying real images and other 3D cartographic information (bathymetry, aerial pictures, symbol, etc. Image generously provided by the CCOM Chart of the Future Project at UNH

37
Figure 4.2 View of software GEONAV, displaying real images and other 3D cartographic information (bathymetry, aerial pictures, symbol, etc. Image generously provided by the CCOM Chart of the Future Project at UNH

Related with the project explained in this paper, it can be deduced that GEONAV
software has the following advantages with respect to the digital Sailing Directions
described here:
- The images surrounding the ship can be shown according with any direction. We
can choose any geographical position of the ship, and from it check how the coast
appears to the “ship’s eye”. The film based Sailing Directions only shows the
images focused by the video camera, not by anyone in any other direction.
- It can be useful for voyage planning and simulation. The video based Sailing
Directions cannot be used for simulation.
- GEONAV gives views of the coast, from any point of observation height. It can
recreate the view from a small ship, and also the view from the high bridge of a
large petrol oil tanker. In digital Sailing Directions, different filmings along the
same seaways, from different types of ships, should be performed.
And the following drawbacks:
- GEONAV does not show as accurate real world images as digital Sailing
Directions does. Perspectives, objects, and mass movements (smoke, waves, other
ships, etc), are much better represented in a video than in a mosaic of still images.
Video can make the navigator more familiar with the surrounding world.
- GEONAV can be used to explore a coast or a harbour, but it does not provide
orderly sequenced explanations about the features the navigator is watching. For
example, GEONAV does not explain where the most risky shoals are, how they
can be located visually with respect to land references, etc. Thus, the navigator
has to find this out by himself, and a 3D image of the seafloor is not always as
38

clear as it should be. A video with a superimposed 3D seafloor image can explain
in few seconds where a risky shoal is, and how to reference it with respect to land
known points. GEONAV cannot provide also detailed views and explanations of
features like a crane working, a power outlet cable coupling use, etc. Proposed
digital Sailing Directions takes the navigator by the hand, in such a way that, after
having gone through all the steps indicated by the index structure, a clear picture
of the coast or harbour, with a maximum of information, is kept in mind.
4.2 GOOGLE EARTH
3D models of areas of the world are being modeled by Google Earth. These models
combined with orthophotos and aerial photos, provide a 3D environment which provides
any view from any point, whether the point is in land or at sea. Travels through the model
can be performed, and video files showing these travels can be saved. Also, navigation
tracks can be imported and superimposed on the image. Figure 4.3 shows some models
from Boston and Calgary. Figure 4.4 reflects one of these models, with a pop-up window
showing a picture of a linked point.
39

Figure 4.3 Some 3D models visualized in Google Earth. The two upper ones correspond to Boston
(Massachusetts, USA), and the lower one to Calgary (Alberta, Canada)
40

Figure 4.4 3D model visualized in Google Earth, showing a pop-up window with a picture of the building or feature, linked by a symbol
Therefore, the advantages of a product like Google Earth can be:
- A virtual navigation through a complete 3D model can be performed. This
navigation can be saved in an explanatory video file. Aerial images and from-sea
images are pretty straightforward to obtain. There is no need to use an aircraft to
film aerial images, or a ship to film from-sea images.
41

And the drawbacks:
- It is difficult to model all the features of a geographic area, whether it is a large
area or a small one. A building is easy to model virtually, but modelling all the
features surrounding the building (trees, poles, terrain irregularities, etc) is a
difficult task. Coasts and harbours are not modelled in enough detail to be useful
as Sailing Directions. For instance, Saint John harbour is still offered in Google
Earth as an aerial picture map (see figure 4.5). Even having some links to pictures
(figure 4.4), the continuity and “on the fly” explanations from videoclips cannot
be performed.
- Like GEONAV, Google Earth does not provide orderly sequenced explanations
about the features the navigator is watching. A video file from Google Earth could
be saved and edited to show Sailing Directions, but the present visual information
given by Google Earth is not accurate enough to provide a detailed environment
for Sailing Directions.
- 3D virtual models of coasts and harbours, accurate enough to give confidence to
the mariner, is a medium-long term task.
- Updates would be harder to perform. Modelling a building that has been replaced,
for example, is much more complicated than updating a film.
42

Figure 4.5 Image of the Saint John harbour from Google Earth
A general advantage of digital Sailing Directions over any virtual model is that the
navigator has the confidence that video images are real images taken from a real ship,
performing a real navigation. For instance, a virtual model hardly will be able to
reproduce a night view of a harbour, while video will provide a real picture of that night
view (see figure 4.6).
43

Figure 4.6 Night from-sea view of the Saint John harbour
The comparative analysis performed in this point is not intended to be a comparison
between products’ quality (of course, GEONAV and Google Earth are infinitely more
developed products than a video). Instead the analysis aims to conclude which tool is
more suitable for Sailing Directions implementation.
CCOM and Google Earth both are much more ambitious goals. Merging their capabilities
with proposed digital Sailing Directions is a matter to be studied as another enriched
media opportunity.
44

CHAPTER 5
FURTHER TECHNICAL DEVELOPMENT RECOMMENDATIONS Until now, videoclips as a useful tool to enhance Sailing Directions information have
been studied. Now, a basic feature must be approached: how to display all the
information of Sailing Directions in an intuitive, indexed and attractive way for the user.
Section 6.1 will deal with a proposed display to accomplish this task. Section 6.2 will
define a strategy to organize the ENC-Sailing Directions linking.
5.1 DISPLAY STRATEGY As stated above, a basic factor must be studied more deeply: how to display all the
information of Sailing Directions, in an intuitive, indexed and attractive way for the user.
To make this display effective, this product should offer, at least, the ease of presentation
that the traditional Sailing Directions book gives. The traditional publication itself can
provide the basic script template for displaying the digital Sailing Directions.
Using the traditional publication as the basic script template to display the digital Sailing
Directions has important advantages. A display showing a PDF version of the
publication, along with the videoclips and the nautical chart, permits an “eventually-
linking-bridge” between the traditional publication and the proposed product.
Countries with a long coastline could initially consider it unfeasible to film all the
harbours and coasts within its responsibility (United States, Canada, Australia, etc), and
therefore, it woud be impossible to issue and implement this proposed Sailing Directions.
If the traditional nautical publication is kept, and the videoclips are added while being
45

filmed, digital Sailing Directions that match the concept of “complementing but not
replacing” can be created. To better explain this approach this section will work with
explanatory figures. Figure 5.1 shows a basic 3-frames-display that matches this idea.
Figure 5.1 Basic 3-frame-display for proposed Digital Sailing Directions
As figure 5.1 shows, a fixed 3-frame-display shows all the required information of
Sailing Directions.
46

The window on the left displays a PDF version of the traditional Sailing Directions
publication. As we have videoclips available from each section of this publication, they
will be linked to the PDF in two different ways (we can see already that the videoclip
concept is subordinated to the traditional publication implementation): (1) A link to a
videoclip that accurately reflects the information given in the corresponding paragraph,
and (2) A link to a videoclip that reflects information, that without being written in the
paragraph, is related to it , and gives additional useful information. Figures 6.2, 6.3, and
6.4 illustrate these ideas.
Figure 5.2 shows a detail of the upper left corner of the 3-frames-display. The first
example from figure 5.2 shows the section, from Canadian Sailing Directions, related to
berthing in the harbour of Saint John (paragraph 53 in Canadian Sailing Directions). A
link (coloured in red) opens the corresponding videoclip of this section. The second
example from figure 5.2 shows a hypothetic extension to paragraph 53. In this case, the
extension consists of an explanation of the type of power outlets and couplings in docks.
These kinds of explanatory extensions could cover many different features: from types
and shapes of outlets, to types and shapes of fenders, for example.
47

Figure 5.2 Links between the PDF window and the videoclip window
48
amt on try- rc ap- rc
Lools ~indow ljelp
.:1 0 • .;- [l)
o:J I ,,,got I Layer: fi)' RectifyMosaic.tif il () ":' ill • I ~~
t::::~G_A~_n_!~_,M_ru_n_•_•M __ ~_y_m __ Fu_M_Y ______________________________ _
Cil<m4117
,. Ouring~ummer.l~selsaocbor,afarcason- J ab~w,..,;ofmll-.:>llo~,.,)•~cbc1><0DCoj<
Speocerand Up< I'Juagi. • Be1:'Aten Cape Spenctf and McCoy Head. aboot8mil~ENE.thccoaslrecedesfonmngabiglt. :urhl'~dof\\-bichli~\-
-s c: ac 'ver. McCoy Head is a 100ndl!'t'l
~oad1ond •bout 200 '"' (61 m) ~ig~ and '"'"od •ilh nm. Vessels proceedmg Jl'& C"'" Speocor should. 'i.~lh a ""•!-going tlidal )trcrun, p:m Clther close 10 lhe cape orwell south of it toli\'Oi.d tide rips.
)I TheCa.tu uardmarinedcpol:is •l ThcemranretotheBhw:kRhttdrieiatloll. situ.t:ed oo die eaSl sideohhe main twb:Jur, 0.4 mile water. bul is accesMb!e a! cenam stages of the ride to E~Eof the bridge. The "'h:trf is 165m loog with 1 ~llUn ''e\'St'ls.lt is rqJQrted to be UI)S,Ifelllhigbl.llater deJ:th of 6.8 m ~· dunug S\\ gales. A ligbl f 1-17} is shcr.·n [rom a def.
TheJugarrefi!'ler) t~.turf. no longerm Str\· ttonCO"A-tron theSW s.ide<itremerentnocc Near ice. is .situated at the south end of lhe eas1 ~ide of lhc the e~t entrance point i5. a Pti:ll:ic wharf 16-t feet rnai.n ha.rboor. Thev.'h:ufil !34m long. 'i.'t!.b !Xpths ~50ml ~lllat e"~;tendstoadepthof25feet(7.6m) ofBto8Jma1ong$iik.Tha'eare('.I.'OTailmoonled a~higb'\1."33er
shore m.nes. 1be Sisters are a small group of rocks in
o:J[!0IDIIZl ~ ~ ;~ ~: 1') . .. .. i:fll ~ ~ 0 ..
A link opens a videoclip showing faithfully the information reflected in the corresponding PDF window paragraph
amt on try- r p- rc
W.indow t:!elp
3 0 • ~ L•Y"'' 1$ ReotifyMo, <.tif il () ":' ill • ~ J500 :±I .--------..:1 I T«g t I ::::1 I/ 01 D IIZl
~ ;~ ~: 1') . .. .. i:fll ~ ~ 0 ..
~~~~~~----~~~~- ------.--~ Gun of Maine and ~y m Fundy
Chan4ll7
DunngQJml1ler. \"«5tlsaocbor.afattasoaablcW~cfromlhcsbort,Wly"'herekt ..... cenCqe Spor«ralllf Up< I'Juagi. .. Bet'lten Cape SJX"OC"tr tOO McC•y Hetd, about M mi~ £.~E.lbetDa:>1 Tl'C'edd forming a bigbt. :11 tht head of \\b:!ch lies West Bay. 200 into which nows the Black Rivtr. McCoy Head is a rounded
, rue~~: ~
to anr~··here, except rhe B:mark Pouu Prusb 'itilh 1retS.. Vessels proceeding ~ Cape Spe'l'k.--er Tenninal. StOI'Q.andFfO\isions ofall kindsart auil- should. ll·tlh. a ~~~r-e~t ·goi.ng tidal ~l.l\'am, pas~ Clther able in Saint lolm. close to Lhecapc orwell !10\.ltb ofitiOa\'Oidtidtrlps.
The Ca...1adian COlSL Guard m3l'incdcpot is .1 Thcenrranretotre Block RhttdriCJat lou. situ.t:edoo lileeastsideoftbe mainbartxJ:~r.0.4mile v.-.uer. but is ac-ce~bleatcenain stagbofthe ride to E.'lEofthc bridge. The t.'harf is 165m loog wilh a snllDn .. ~ls.ltisreporttdtobewlSifelllhigbv.ater &¢i ol6.8 m alocysKie duriogS\1 g~e •. Ali!h11U/Joslowofroousld" Thesugarrefl!ll'1)'4tu.rf,nolooge-rmser\- ttontoll--rronlheSWsideo(W rhere.nlltoct.Near ice,i:~siluatcdatthesouthcndoflheeasnideofthe tlr eas1 entl111C'C point is a J\tllic v•h!tf !6-t fctt
mainharlloor Tiu!JJrtis 134m loog. •·idi depths il0m1\ongdiot"~"'""''ckp<hd!l feet(lhm) of5.3 [0 8J mabtzs.idc. Thar ml'A•orailmoon1ed a! high waier.
shore crane!~. The Sisters are 1 s..'ll3111JOOP of rocks in
j.
Another link opens a videoclip showing additional features, related to the PDF paragraph, but that are not included in the PDF

Figure 5.3 shows the relationship between the links explained in figure 5.2, and the
nautical chart.
Figure 5.3 Links from the nautical chart, PDF and videoclips.
49
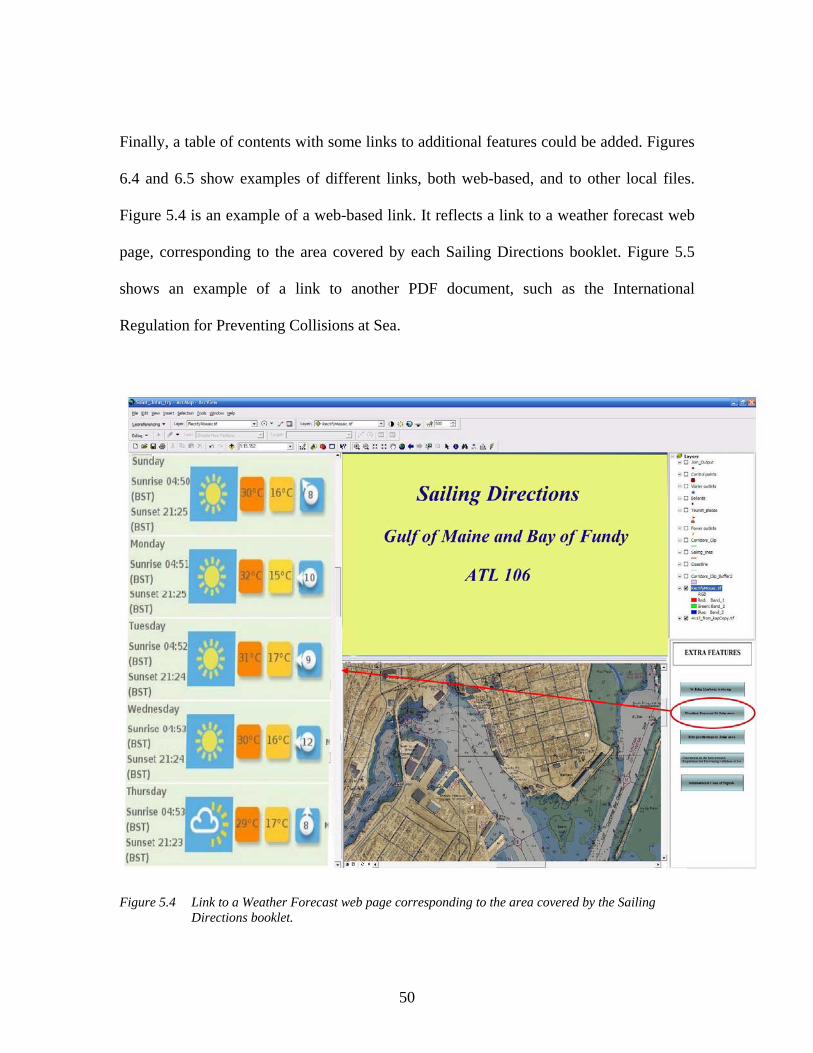
Finally, a table of contents with some links to additional features could be added. Figures
6.4 and 6.5 show examples of different links, both web-based, and to other local files.
Figure 5.4 is an example of a web-based link. It reflects a link to a weather forecast web
page, corresponding to the area covered by each Sailing Directions booklet. Figure 5.5
shows an example of a link to another PDF document, such as the International
Regulation for Preventing Collisions at Sea.
Figure 5.4 Link to a Weather Forecast web page corresponding to the area covered by the Sailing
Directions booklet.
50

Figure 5.5 Link to a PDF document apart from Sailing Directions. Everything stated in this section is a conceptual strategy. This 3-frames-display has not
been developed so far. But, having seen what ArcGIS is able to do, it is not difficult to
guess that this kind of display could be easily developed by GIS programmers without
any problem.
In fact, ESRI (Environmental Systems Research Institute), has developed ArcIMS, a
solution for delivering dynamic maps and GIS data and services via the web. ArcIMS has
been one of the tools used by SFProspector to broadcast its services. SFProspector is a
free on-line tool aimed at businesses looking to open or expand their operations in San
Francisco (USA) and members of the general public interested in obtaining demographic
51

and economic data. ArcIMS and SFProspector use a several-frames format to display
information. Figure 5.6 shows an example of this display. Viewing this example it is not
difficult to assume that a 3-frames-display for Sailing Directions would not be difficult
for a GIS company to develop.
Figure 5.6 Display of SFProspector aided by an ArcIMS map document This example of SFProspector working with ArcIMS, also gives us an idea of how digital
Sailing Directions could be implemented via the web. The advantage of keeping the
Sailing Directions information in a web server would be that the user could access
52

updated information much faster than receiving a periodic CD or any physical device.
This strategy calls to mind a single source database for multiple products. The idea of a
single data source was given by Germany in the SNPWG meeting held in Hamburg in
June 2003. Perhaps this 3-frames-display strategy could be useful for implementing this
idea. A PDF version of the list of lights in the left window, the nautical chart in the lower
window, and a videoclip showing different perspectives of the light, in the upper window
could be developed. The videoclip could show images of the light from the distance, in a
close view, real images of the light working at night, etc. But this single data source study
for other publications is beyond the scope of this report.
The closest approach to this display performed in this Sailing Directions project is a 3-
frames-display built by means of hyperlinks in ArcGIS. In such a way, we can now
display a window showing the PDF version of Sailing Directions, a videoclip, and the
nautical chart, by hyperlinking polygons to these applications. The result is shown in
figure 5.7.
53

54
~ " .., ., ~· " tl ~·
·~ ~ "' ;g '>l g.. " " ~ ~ ~
~ ~ ~ "" tl ~· 5--~ §
-.. -
'" u . . .. I· ~ u•
• • Cl .. •I 'i> ;b
~ "'-"' " 15:. ~
" ~ ~ ::; £il "' .... ~ *' :; "'- r
§ .. ~
i ~ !I
~ II. 1
~ §=' e;

Finally, and as a miscellaneous thought, this “linked-and-related-3-frames-display” could
be very useful for tourists planning trips and visits. It would be a complete, neat, and
intuitive way to get the best information. In this kind of display, a tourist could check, for
example, which accommodations of certain type lie in an area (hotels, bed and breakfasts,
camping grounds, etc), their appearance and the hours of operation (explanatory
videoclip), what the weather will be like for a period of time, etc. Figure 5.8 illustrates
this idea.
Figure 5.8 Example of a GIS 3-frame display for tourism purpose (text, picture and figure are extracted from Newfoundland tourist information in the web)
55

5.2 A STRATEGY TO LINK THIS PRODUCT TO AN ECDIS
A possible strategy to link Sailing Directions video files to an ECDIS is as following. The
natural link between the Nautical Chart and the Sailing Directions could be some
predetermined polygons covering geographical areas. These areas will be defined
according to the areas of information given by the present Sailing Directions publication.
Figure 5.9 shows an example of dividing areas according to Sailing Directions
publication. Note that the geographical division for Sailing Directions is not the same as
the Nautical Chart divisions. A Sailing Directions division may contain several nautical
charts, and one nautical chart may belong to different Sailing Directions divisions.
Figure 5.9 Example of Sailing Directions coverage
56

However, the present scheme for Sailing Directions could be modified to align with ENC
boundaries, if the two were to be tightly merged.
Each time there is a nautical chart displayed in the ECDIS, a link between that display,
and the geographic polygon it belongs to (that is to say, the Sailing Directions booklet it
belongs to), is shown. By clicking that link, a separate screen, exclusively employed for
Sailing Directions, called, for example, Sailing Directions Display (SDD) will show the
Sailing Directions information (See figure 5.10).
Figure 5.10 Sketch of a link between an ECDIS and a spare screen for Sailing Directions use
57

Because present ECDIS screens can be large, the possibility of displaying digital Sailing
Directions in the ECDIS screen itself could be considered. However, using the ECDIS
screen itself for Sailing Directions could introduce some drawbacks. For example:
- Seeing Sailing Directions while navigating would be disruptive for navigation
team personnel. Text and videoclip displays could distract attention to the nautical
chart.
- The ECDIS would be the only spot where Sailing Directions could be studied.
With a spare screen, Sailing Directions could be studied anywhere a laptop or a
personal computer can be plugged.
- A spare screen system would allow checking or presenting Sailing Directions on a
large screen in a conference room, while a one-screened one would not.
Another application could be the implementation and distribution of the product via the
internet (replacing physical shipment). The user could access updated video files as long
as an internet connection was available.
58

CHAPTER 6
FURTHER STANDARIZATION DEVELOPMENT RECOMENDATIONS: MATCHING WITH IHO REQUIREMENTS The complete digitization of Sailing Directions in a GIS environment has another
important advantage. As stated in previous section, IHO could support this type of
development. An ECDIS uses a GIS environment to display the nautical chart, very
similar in concept and features to the one used in this paper, ArcGIS. Therefore, a path to
merge this product with IHO requirements is worth studying.
6.1 BACKGROUND: THE STANDARIZATION NAUTICAL PUBLICATIONS
WORKING GROUP (SNPWG) AND THE COMMITTEE ON HYDROGRAPHIC REQUIREMENTS FOR INFORMATION SYSTEMS (CHRIS)
Special Publication S-57 from the International Hydrographic Office (IHO) provides
guidance to convert paper publications to digital formats. In such a way, a real world
codification process is being carried out in order to implement in computer systems all
those elements of interest for Hydrography and Navigation. The SNPWG (Standarization
Nautical Publications Working Group) from the IHO is working in this direction.
Concerning the nautical publications digitization process, the SNPWG has defined three
types of nautical publications:
- Type 1: Hard copy (NP1).
- Type 2: Digital version. A slight modification of type 1 (NP2).
- Type 3: Digital version for ECDIS. New product (NP3).
59

Concerning NP1, List of Lights publication is the one which has been more standarized,
because this publication is, basically, made of tables. The result of these works has been
the issuing of publication M 12. For Sailing Directions, and due to its literary content,
only some generic rules are given.
Concerning NP2, this type of digital publication is basically a Text Processor (MS Word,
for example), or a PDF version of hard copies.
Concerning NP3, these publications will be the ones intended to be used embedded with
an ECDIS. The IHO is focusing its efforts on this type of publication, and is trying to
build up a norm, from the very beginning. Since nobody has so far developed this type of
product, the IHO is trying to reach an agreement to develop a standard from which
publications can be developed to work in an ECDIS. Sailing Directions is the main
publication that is intended to be developed according to this normative. Initially,
information from publications should be codified to make possible a consult in a
geographic environment. This type of publication is intended to substitute, legally, the
hard copy version.
Sailing Directions can be digitized according to different methods. For example, a web
page format can be considered an interactive and appealing format.
If we compare briefly the process of nautical publications digitization, with the process
carried out with nautical charts, we could find a way to focus our efforts when developing
Sailing Directions digitally. When commencing to develop nautical charts digitally, most
hydrographic offices, and several companies, developed raster charts as a mere scan from
paper nautical charts. Eventually, electronic nautical charts (ENC and DNC) were built.
Finally, the IHO established official, only the ENC, rejecting the raster versions as illegal.
60

In a similar way, and concerning Sailing Directions, it would be logical to think that
hydrographic offices should devote their efforts to building a digital Sailing Directions of
type 3, i.e., Sailing Directions to be used along with the ENC in an ECDIS. They should
avoid “halfway” products that, although effective from the information point of view,
could pose a problem when used along with an ECDIS.
At the second meeting of the SNPWG, held in Hamburg, in 2003, two approaches were
defined about how NPs can be integrated into ECDIS. The first one consists of attaching
NP information to existing S-57 attributes (see upper figure 6.1). The second approach is
to expand the S-57 object model and object catalogue to allow NP information to be
integrated as S-57 object classes and attributes (See lower figure 6.1).
Another interesting approach discussed at the second SNPWG meeting was display
issues, i.e., how could NPs be displayed in the ECDIS system. One of the proposals was a
User Interface. It was suggested that the selection of NP information be contained within
a selection box. This approach is similar to the one explained in section 6.2.
61

Figure 6.1 Different approaches for nautical publications to be integrated into an ECDIS. Second meeting of the SNPWG
At the third meeting of the SNPWG, the group agreed to use Unified Modeling Language
(UML) to model data for NP3.
At the fifteenth meeting of the Committee on Hydrographic Requirements for
Information Systems (CHRIS), held in Monaco in June 2003, the S-57 format was agreed
to be used by NP3. At the eighteenth meeting of CHRIS it was stated that before SNPWG
can start with the work on the presentation of NPs in an ECDIS, the work on the
development of new object classes and attributes must have reached a state where first
test data sets can be produced. The University of New Hampshire (UNH) offered to start
62

a project on this topic, as expressed by Dr. Lee Alexander at the seventh meeting of
CHRIS in Rostock, Germany.
6.2 A FIRST APPROACH TO MATCH IHO REQUIREMENTS: DIGITAL
SAILING DIRECTIONS AS A MARINE INFORMATION OVERLAY (MIO)
Converting Sailing Directions to a format in accordance with S-57 specifications would
initially be the most effective way to implement this publication in an ECDIS. At the
third meeting of the SNPWG (Silver Spring, Maryland, USA, June 2004), Germany
reported having transformed its Sailing Directions into a simple structure with pictures,
tables, and short descriptions. At the fourth meeting of the SNPWG (Monaco, March
2005), Germany also claimed to be working to restructure the Sailing Directions so that it
is easier to produce them from a database. Also at this fourth meeting, a member of
NOAA, John Tucker, discussed the work that NOAA is doing with its Coast Pilot using
Extensive Markup language (XML). NOAA reported to be carrying on with this new
system, at the fifth meeting of the SNPWG (Copenhagen, Denmark, October 2005). This
new system by NOAA will be database driven and will auto generate Coast Pilot
corrections, display the Coast Pilot in a real-time format, and facilitate integration with
other US government products. At the seventh meeting of the SNPWG (Rostock,
Germany, February 2007), Denis van der Heul (Netherlands Hydrographic Office,
NLHO), gave a presentation on DigiPilot, an automated/interactive planning and
navigation system that displays information including Sailing Directions, routes, radar,
radio, harbour images, waypoints and more. At the last SNPWG meeting, France reported
63

to be working on an XML and Extensible Hyper Text Markup Language (XHTML) in
which a database prototype will produce all nautical publications shortly.
In section 2 it was explained how a videoclip is the best tool to depict the real world and
provide the navigator with a feeling of familiarity with the coast or harbour he is
approaching. Since a videoclip is a difficult feature to convert to S-57 format, we could
think that proposed Sailing Directions, based on videoclips, will not become easily a
NP3.
However, a different approach could be performed to propose a strategy to merge this
product with IHO specifications. This product could be added to an ECDIS, considering a
link to the video file environment as a Marine information overlay (MIO). The GIS
support for these video files could be the GIS software employed by the ECDIS to
display the nautical chart.
As defined in the International Maritime Organization (IMO) Performance Standards for
ECDIS, an “Electronic Navigational Chart (ENC) means the database, standardized as
to content, structure and format, issued for use with ECDIS on the authority of
government authorized hydrographic offices. The ENC contains all the chart information
necessary for safe navigation and may contain supplementary information in addition to
that contained in the paper chart (e.g. Sailing Directions) which may be considered
necessary for safe navigation.”.
Additionally, as stated in the document HGMIO (2007) “Relationship of Marine information Objects (MIOs) to Current/Future IHO Standards (Draft Version 1), 4 January 2007”:
“Marine information objects (MIOs) consist of supplementary information to be used
with an Electronic Chart Display and Information System (ECDIS) that are not
64

Electronic Navigational Chart (ENC) objects or specified navigational elements or
parameters. Supplementary means additional, non-mandatory information not already
covered by existing International Maritime Organization (IMO), International
Hydrographic Organization (IHO), and International Electrotechnical Commission
(IEC) standards or specifications. Current examples of MIOs include ice coverage,
tide/water level, current flow, meteorological, oceanographic, and marine habitats.
Depending on the navigation situation or task-at-hand, the provision and use of MIOs
(e.g., ice coverage, weather conditions, etc.) can be crucial in terms of improving both
the safety and efficiency of maritime navigation, as well as ensuring the protection of the
marine environment (e.g., coral reef habitats).”
An MIO can be considered as a navigational layer that may contain chart-related features
(lines, polygons, points, labels, colours, etc) as operational features (radar information,
Automatic Identification System, etc). Figure 6.2 illustrates this concept.
65

Figure 6.2 Marine information overlay as layers that contain both chart-related and operational features (Source: IEC Report to IMO NAV48)
At the fourth meeting of the IHO-IEC Harmonization Group on Marine information
overlays (HGMIO), held at the University of New Hampshire (USA), it was decided that
the acronym MIO should stand for “Marine Information Overlay”, instead of “Marine
Information Object”.
Thus, considering the proposed digital Sailing Directions publication as an MIO, a link
between the NP information and the ECDIS could be established. Recalling figure 6.1,
we could express this idea with figure 6.3:
66

Figure 6.3 Marine information overlay as a direct link between nautical publication information and an ECDIS.
This link could have the disadvantage of producing duplication of information in the
ECDIS. For example, the picture of a lighthouse shown by the ENC is also shown by the
videoclip of proposed Sailing Directions. However, this duplication of information
wouldn’t produce confusion, but complementary information. The information shown by
the videoclip complements the picture shown by the ENC.
67

6.3 LIMITATIONS OF DIGITAL SAILING DIRECTIONS AS AN MIO. S-100 STANDARD AS A PROPER SPACE FOR DIGITAL SAILING DIRECTIONS
As explained in the previous section, MIOs are basically additional layers that, once
added to the ENC display, show at a glance the required information. For example, figure
6.4 shows polygons that, added to a nautical chart as an additional layer, define the
geographical area of the Florida Keys National Marine Sanctuary. These polygons, when
added to an ENC, constitute an MIO.
Figure 6.4 Above: Florida Key National Marine Sanctuary (taken from “Coral Reef – Electronic chart
Initiative: Protecting Corals, Saving Ships” by Dr. Lee Alexander and Kathryn L. Ries). Below: features of the Sanctuary added to an ENC as an MIO.
68

Concerning Sailing Directions, a feature in the ENC, like a polygon, a point, or a line,
could be added as the “Sailing Directions layer”. But this layer would not show at a
glance any information regarding Sailing Directions. The layer should be hyperlinked to
Sailing Directions information. In section 3.1, it was explained how lines, polygons or
points can be linked to Sailing Directions information. A line, named a “sailing line”, is
linked to a videoclip explaining the entrance along the line’s path. A group of points,
named “bollards”, is linked to a videoclip explaining the berthing facilities. Even texts
can be linked to these features. Nowhere in IHO standards is it said that features from an
MIO cannot be hyperlinked to additional files.
However, a very basic subject slightly complicates this consideration of Sailing
Directions as an MIO. As explained in section 6.1, information from Sailing Directions
must be at least as organized as the traditional publication. That is to say, information
from Sailing Directions must be organized following an indexed and intuitive pattern.
Therefore, just clicking a polygon and popping out a videoclip or a piece of text is not
enough. If the navigator wants to study a harbour entrance as effectively as reading the
corresponding chapter in the traditional publication, where does he start to “click”? Who
tells him which features he must click to cover all the information? Who tells him when
he must change to another ENC to carry on the study (the description of a harbour may
cover several ENCs)? An answer to all these questions is a basis for the development of
proper digital Sailing Directions.
Assuming that the display explained in section 6.1 is the most suitable one (it answers
those basic questions stated above), it would be interesting to check if it fits into the MIO
concept. Suppose that each ENC has a layer named “Sailing Directions”, and that layer is
69

composed of several features (points, lines or polygons). By adding that layer to the table
of contents of the GIS map display, all the features are displayed in the ENC. For
example, a group of points would constitute the layer “bollards”, a group of polygons the
layer “docks”, etc. By clicking on just the main layer in the table of contents, the PDF
document and all the features in the ENC are displayed. The display will be something
like the one shown in figure 5.1.
Once again, nowhere is it said that this Sailing Directions layer, and all the hyperlinked
information, cannot constitute an MIO. However, one may feel that this kind of display is
out of the scope of the MIO concept.. Comparing figure 5.1 (Sailing Directions display)
with figure 6.4 (Marine Sanctuary layer), one might feel that they express different
concepts. It seems like a Sailing Directions display does not fit exactly in the concept of
“layer”. Nevertheless, since these hyperlinks are not prohibited, they can still be
considered.
However, an open door to match proposed digital Sailing Directions to IHO standards,
without “contaminating” the idea of MIOs as layers, is standard S-100 (IHO Geospatial
standard for Hydrographic Data).
Standard S-100 appears as the result of work from IHO for reviewing standard S-57. To
address S-57 limitations (inflexible maintenance regime, limited standard focused
exclusively for the production and exchange of ENC data, etc) the CHRIS authorised
work to begin a major revision of S-57.
The primary goal for S-100 is to be able to support a greater variety of hydrographic-
related digital data sources, products and customers. This includes new applications that
go beyond the scope of traditional hydrography. Figure 6.5 illustrates this idea. S-100
70

goals also include additional product specifications. They may be created to provide
separate registers for other user communities. In such a way, Nautical Publications
specifications may be created.
Figure 6.5 S-100 standard supporting a great variety of data sources, products and services (Figure taken from “Development of IHO S-100: The New IHO Geospatial Standard for Hydrographic Data”, by Lee Alexander, Michael Brown, Barrie Greenslade, Anthony Pharaoh)
Also, MIOs are intended to develop according to S-100 standard. In the near future MIOs
will continue to be S-57 based, since current ECDIS equipment is required to use ENC
data conforming to S-57. However, MIOs are intended to be, in the future, independent
from ENC product specification, even when used with S-57 based ENCs.
In summary, S-100 opens a wider field of specifications for digital charted-and-
navigational products. With S-100, considering digital Sailing Directions as an MIO does
not seem so beyond the scope of the concept “layer”. On the other hand, S-100 also opens
doors to digital nautical publications. Where to include digital Sailing Directions is a
matter that will be solved as long as S-100 specifications are developed. But, perhaps,
71

proposed digital Sailing Directions must not wait the implementation of S-100
specifications, but feedback, on the fly, S-100 implementation process by offering a
development proposal.
72

CHAPTER 7
AN APPROACH TO IMPLEMENTATION AND LEGAL ISSUES
As has been analyzed in previous sections, videoclips can be the best way to depict the
real world and make the navigator familiar with the coastal environment. However, the
information given in a videoclip must be carefully selected to produce an “informative”
or “descriptive” product, and not an “instructive” product. Too much advice in a
videoclip could complicate the legal implementation of digital Sailing Directions. A
navigator could understand the advice from a videoclip as compulsory directions to be
followed strictly. And, perhaps, we are constraining, in such a way, the scope of
navigators’ points of view to get their best references. Therefore, those videoclips that do
not match strictly with the original publication, i.e., the ones linked by the “blue” link in
figure 5.2, should be clearly defined as subjective-advising content.
Digital Sailing Directions must follow the same philosophy as the traditional publication,
i.e., a previous-study product. It is not intended to be used in real time by the officer on
watch. Perhaps, only a printable version of some key snapshots would be useful to be
employed in real time. Figure 7.1 shows a possible on-demand-printed guidance to be
used in real time.
73

Figure 7.1 Example of printed snapshots for real time guidance
74

When implementing this product, filming responsibilities should be defined. Who will
carry out the responsibility of filming a harbour, or a coast, for digital Sailing Directions?
In a country with a short coast, that responsibility could be assumed by the Hydrographic
Office. However, thinking of countries like Canada or the United States, we could
assume a kind of hierarchical responsibility between different organizations. For instance,
filming could be performed by port authorities, and then a process of validation could be
performed by the Hydrographic Office. Filming by port authorities would be a good
chance for periodical checks of docks’ state. It would also be a good opportunity to
periodically check the correspondence between Sailing Directions and the nautical chart.
Coast filming could be carried out by hydrographic vessels while working in
corresponding campaigns.
Carrying on with the implementation issue, we must not forget the role of private
companies. If digital Sailing Directions results in a useful and accepted product, some
GIS related companies should want to develop this product for their own benefit. As long
as they meet IHO or IMO requirements, they could develop and sell their own products.
But a validation from national hydrographic offices should be a condition. On the other
hand, proper software to display digital Sailing Directions information is more likely to
be developed by those software private companies than by hydrographic offices.
Therefore, private companies could perform an intermediate role in this production flow.
All these considerations can be summarized in figure 7.2.
75

Figure 7.2 Digital Sailing Directions responsibilities diagram
76

CHAPTER 8
CONCLUSIONS
Although the printed version of Sailing Directions must carry on being issued, it can be
improved by means of its conversion to digital format. Video files attached to GIS
software will give all the information reflected in that publication, and provide, in
addition, some analysis tools that can improve the initial product.
Video depicts the real world, for navigator’s concerns, in a more complete way than
virtual 3D real world modelling.
This product could be adapted to IHO requirements, considering a video file as a Marine
information overlay (MIO). An independent screen could be linked to an ECDIS to show
Sailing Directions information. S-100 standard could be the proper space to accomplish
IHO requirements.
An important further step must be considered: user acceptance. Sometimes it is supposed
that wonderful products must be accepted and used by clients, but sometimes, and
surprisingly, clients don’t use the issued product. Concerning Sailing Directions in digital
format, a testing period would need to be performed. A show port could be chosen to be
developed completely according to this technique, and then, an opinion poll and user
testing would confirm if it is a useful product or not.
77

Future tasks may include finding a company willing to build a prototype of proposed
digital Sailing Directions, defining different responsibilities in the process of
implementation, and regularize technical filming and GIS settings procedures.
78

REFERENCES
Alexander, Lee. K. L. Ries. [2004] Coral Reef – Electronic chart Initiative: Protecting
Corals, Saving Ships.
Alexander, Lee. M. Brown. B. Greenslade. A. Pharaoh. [2007] Development of IHO S-
100: The New IHO Geospatial Standard for Hydrographic Data.: International
Hydrographic Review, Vol. 7, No. 1, April 2007.
Alexander, Lee. M Huet [2007] IHO-IEC Harmonization Group on Marine Information
Overlays (HGMIO) Relationship of Marine Information Overlays (MIOs) to
Current/Future IHO Standards.Version 4. 14 August 2007
Chans, A., Royal Spanish Navy [2007] E-mail conversations about present IHO
intentions concerning digital nautical publications development
CHS [2001] Sailing Directions, Gulf of Maine and Bay of Fundy. ATL 106, Canadian
Hydrographic Service, Ottawa, Ontario
CHRIS. 15th Meeting [2003] IHB, Monaco, 10-13 June 2003.
CHRIS 18th Meeting [2006] Cairns, Australia, 25-29 September 2006.
Cyberlink rticles [2007] Quick guide to choosing the right video output format.
Available at:
http://www.cyberlink.com/english/dv-entertainment/articles/video_format.jsp
Cooperative Educational Service Agency (CESA) [2007] Digital Dictionary. Available at
http://www.cesa8.k12.wi/us/media/digital_dictionary.htm
79

ESRI ArcIMS product information [2007] Available at
http://www.esri.com/software/arcgis/arcims
Wijering, Jeroen [2007] FLV video compression. Available at
http://www.jeroenwijering.com/?item=FLV_Video_Compression
Google Earth [2007] Available at http://earth.google.com
HGMIO [2004] Marine information objects: Recommended Procedures for
Development, Edition 1, November 2004. [www.http://www.iho.shom.fr], HGMIO
Working Group Meeting #4.
HGMIO [2007] Relationship of Marine information objects (MIOs) to
Current/Future IHO Standards, Version 2.1, 7 February 2007.
[www.http://www.iho.shom.fr], HGMIO Working Group Meeting #4.
IEC Report to IMO NAV48.
Millan Gamboa, A. [2006] Una propuesta para la edicion del derrotero en formato digital
(“A proposal to develop Sailing Directions in digital format”). Revista General de
Marina. Madrid. Marzo 2006 (General Magazine of the Navy. Madrid. March 2006).
Plumlee, Matthew, C. Ware, R. Arsenault, R. Brennan [2005] Panoramic Images for
Situational Awareness in a 3D Chart-of-the-Future Display. Center for Coastal and Ocean
Mapping. University of New Hampshire. Durham, New Hampshire, USA.
Port of Saint John webcam [2006] Available at
http://www.cbc.ca/nb/webcam/webcam.html
80

SF Prospector [2007] SFGOV San Francisco. Available at
http://www.sfgov.org/site/sfprospector_index.asp
Standardization of Nautical Publications Working Group (SNPWG) 2nd Meeting [2003]
2 – 4 June - BSH Hamburg. Final Minutes.
Standardization of Nautical Publications Working Group (SNPWG) 3rd Meeting [2004]
7 – 9 June – NOAA, Silver Spring, Maryland. Final Minutes.
Standardization of Nautical Publications Working Group (SNPWG) 4th Meeting [2005]
1 – 3 March – IHB, Monaco. Final Minutes.
Standardization of Nautical Publications Working Group (SNPWG) 5th Meeting [2005]
25 – 27 October – KMS Copenhagen. Final Minutes.
Standardization of Nautical Publications Working Group (SNPWG) 6th Meeting [2006]
26 – 30 June – IHB, Monaco. Final Minutes
Standardization of Nautical Publications Working Group (SNPWG) 7th Meeting [2007]
12 – 16 february - BSH Rostock. Final Minutes.
Wolf, Paul R., Bon A. Dewitt. [2000] Elements of Photogrammetry (with Applications in
GIS), Boston, Mass McGraw-Hill
81

CURRICULUM VITAE
Candidate’s full name: Andres Millan Gamboa
Universities attended: Royal Spanish Navy Naval College. 1988-1993. Sub Lieutenant.
Publications: Una propuesta para la edicion del derrotero en formato digital (“A
proposal to develop Sailing Directions in digital format”). Revista General
de Marina. Madrid. Marzo 2006 (General Magazine of the Navy. Madrid.
March 2006)
Conference Presentations: US HYDRO 2007. Sailing Directions in Digital Formats: The
Real World in Video
82


![[45/15] UPDATES TO ADMIRALTY SAILING DIRECTIONS](https://img.pdfslide.net/doc/110x75/6204f032d1e77e7ed0289469/4515-updates-to-admiralty-sailing-directions.jpg)