Embed Size (px)
Citation preview

Salary Findings
April 25th, 2011Faculty Senate Budget Committee
Recommendations
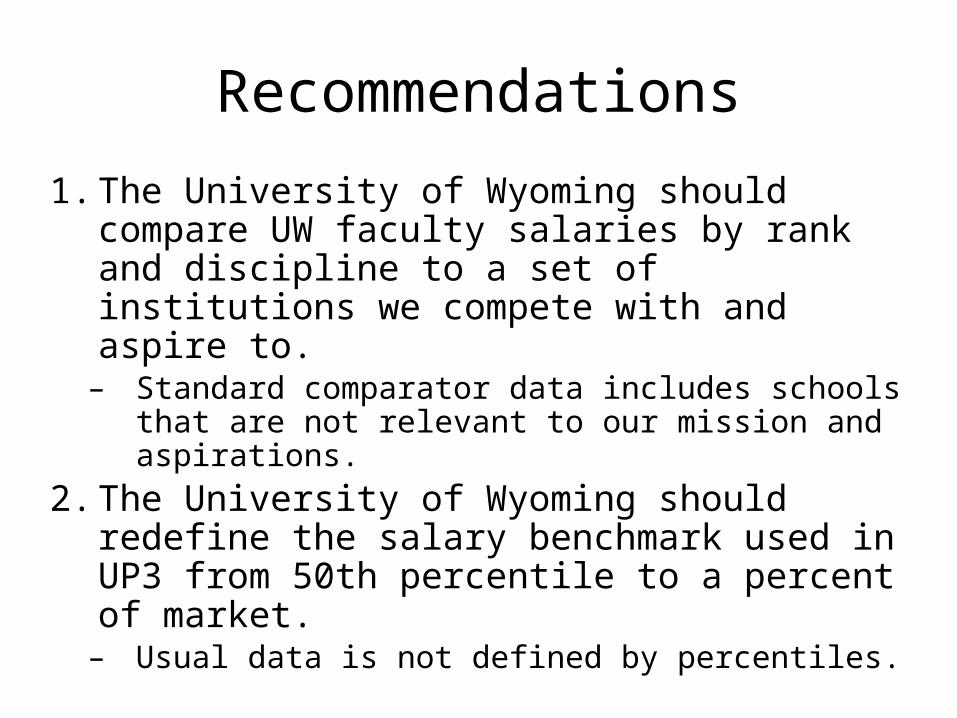
1. The University of Wyoming should compare UW faculty salaries by rank and discipline to a set of institutions we compete with and aspire to. – Standard comparator data includes schools that are
not relevant to our mission and aspirations.2. The University of Wyoming should redefine the
salary benchmark used in UP3 from 50th percentile to a percent of market. – Usual data is not defined by percentiles.
Background on comparisons
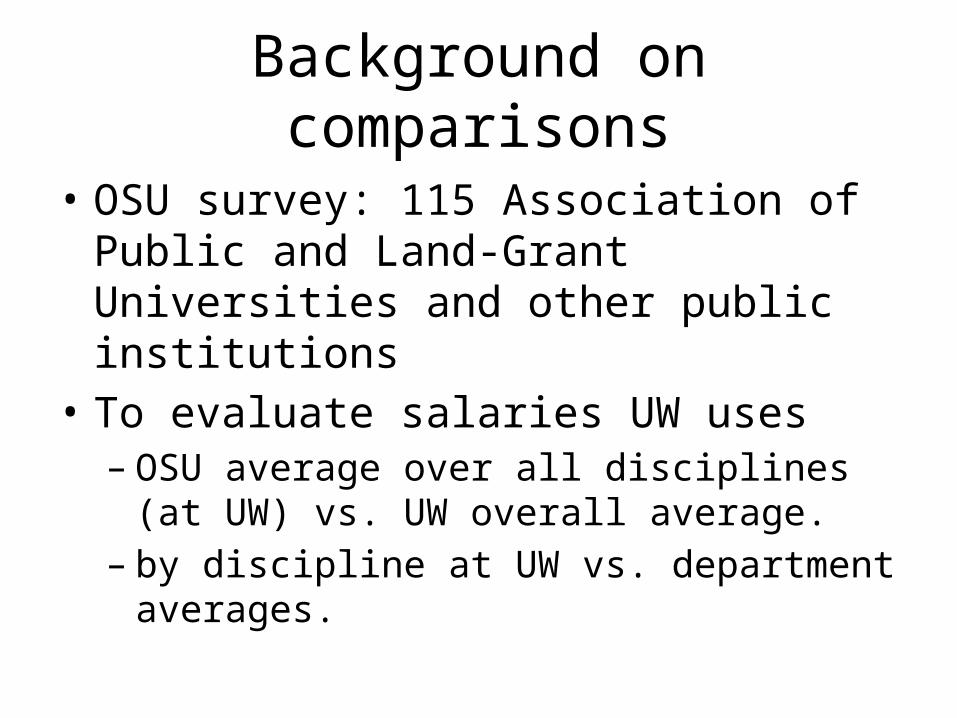
• OSU survey: 115 Association of Public and Land-Grant Universities and other public institutions
• To evaluate salaries UW uses – OSU average over all disciplines (at UW) vs. UW
overall average.– by discipline at UW vs. department averages.
Is OSU Data out of date?
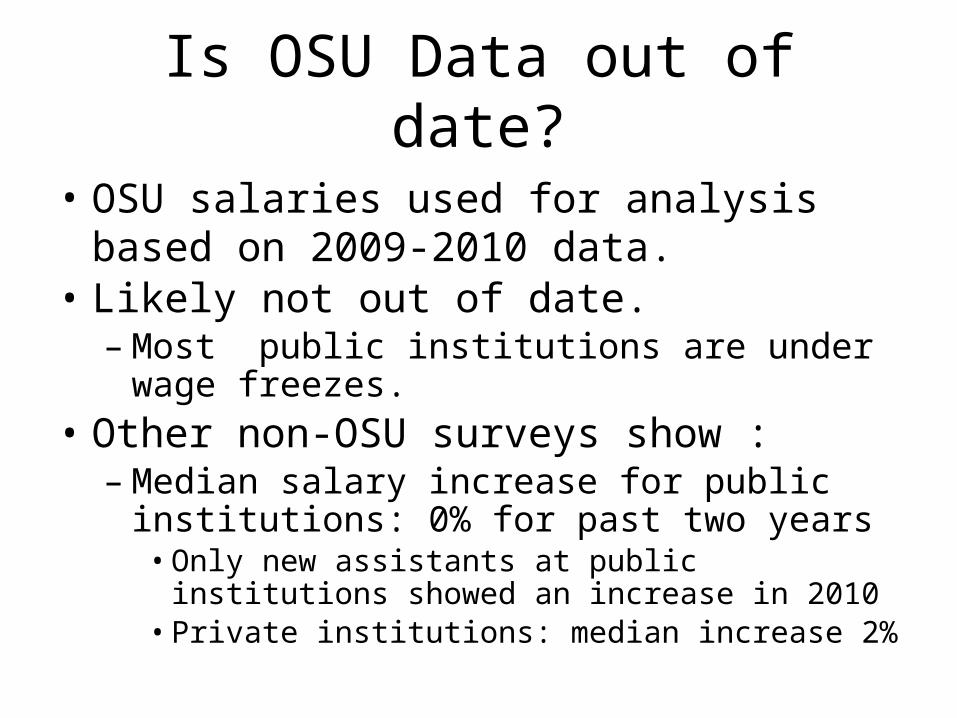
• OSU salaries used for analysis based on 2009-2010 data.
• Likely not out of date.– Most public institutions are under wage freezes.
• Other non-OSU surveys show : – Median salary increase for public institutions: 0%
for past two years• Only new assistants at public institutions showed an
increase in 2010• Private institutions: median increase 2%
Data - Where are we? Rank Number
of FacultyNumber of
DepartmentsAverage Salary
(Average of Department
Averages)
OSU Average Salary
across UW Disciplines
UW% of Market*
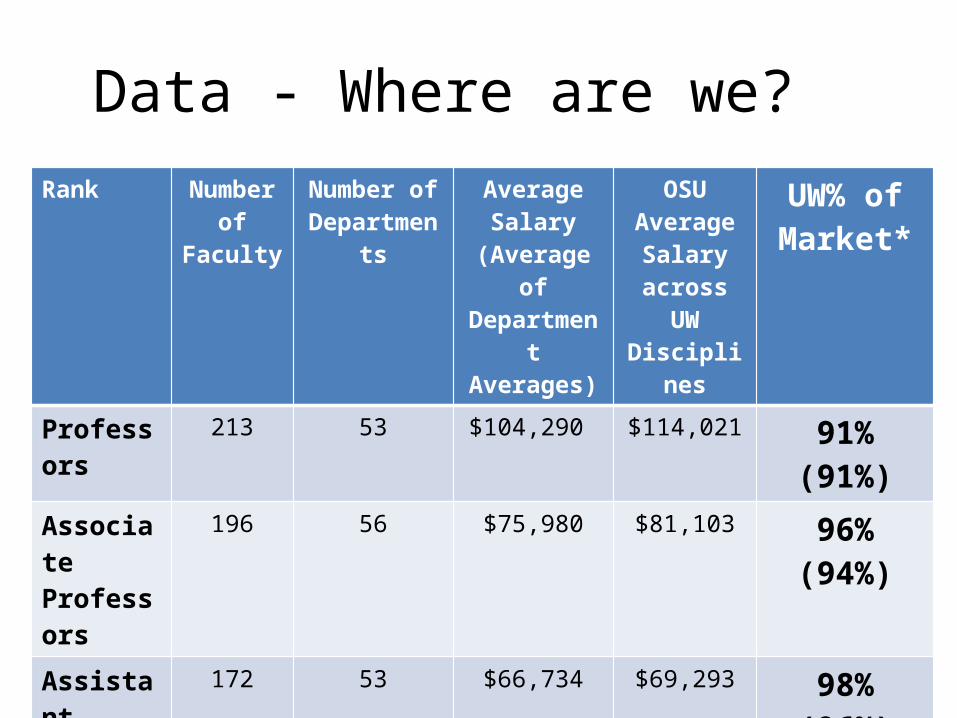
Professors 213 53 $104,290 $114,021 91% (91%)Associate Professors
196 56 $75,980 $81,103 96% (94%)
Assistant Professors
172 53 $66,734 $69,293 98% (96%)
Total Faculty
581
1999
-00
2000
-01
2001
-02
2002
-03
2003
-04
2004
-05
2005
-06
2006
-07
2007
-08
2008
-09
2009
-10
-30%
-25%
-20%
-15%
-10%
-5%
0%
5%
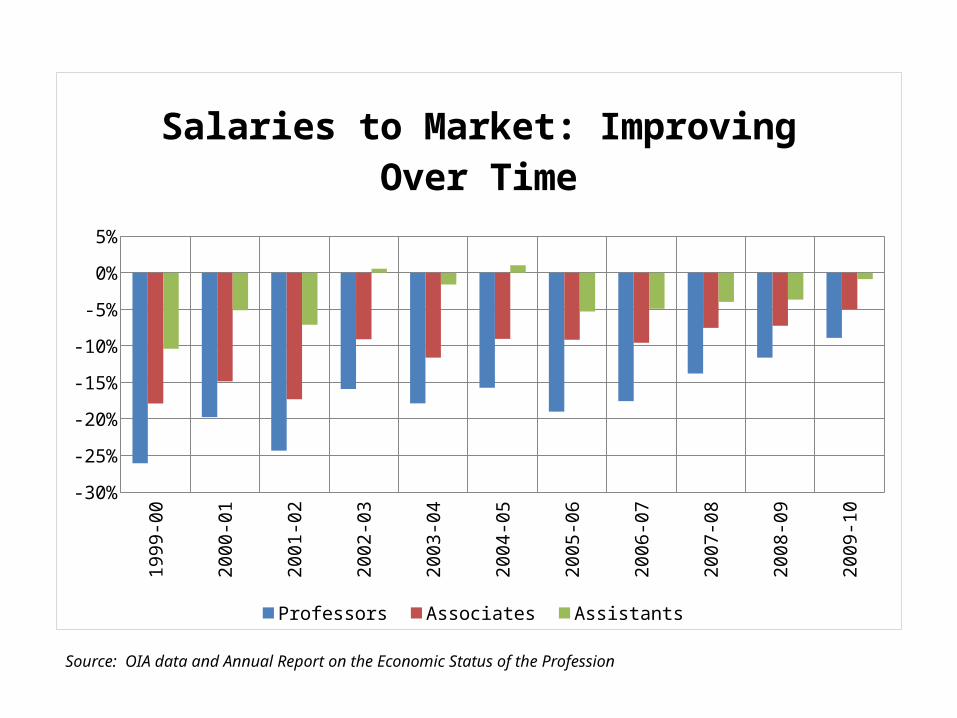
Salaries to Market: Improving Over Time
Professors Associates Assistants
Source: OIA data and Annual Report on the Economic Status of the Profession
Salary Results
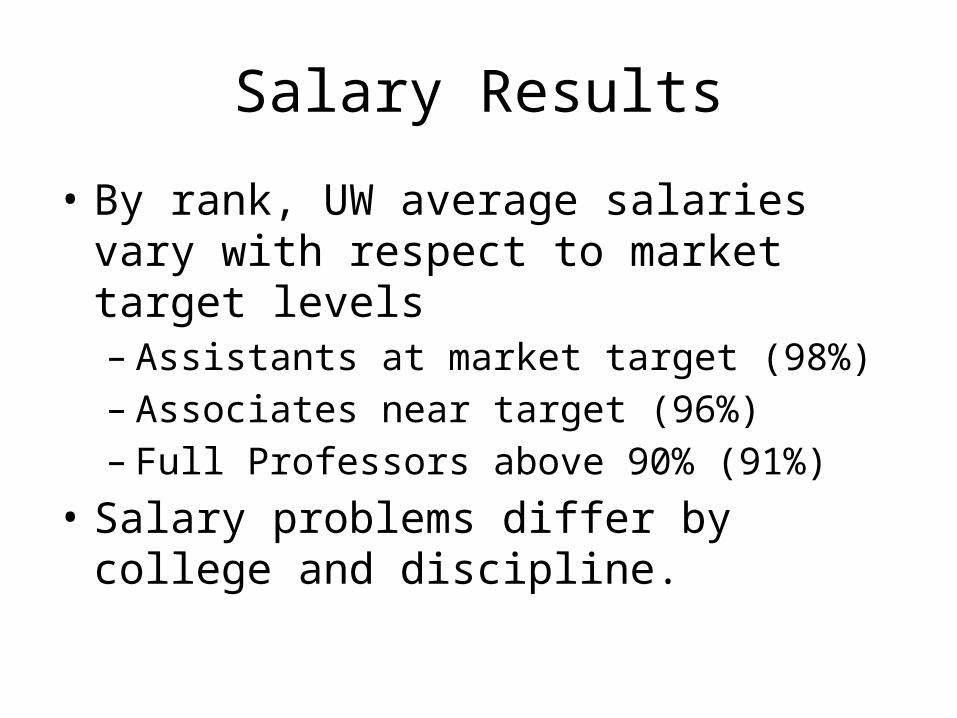
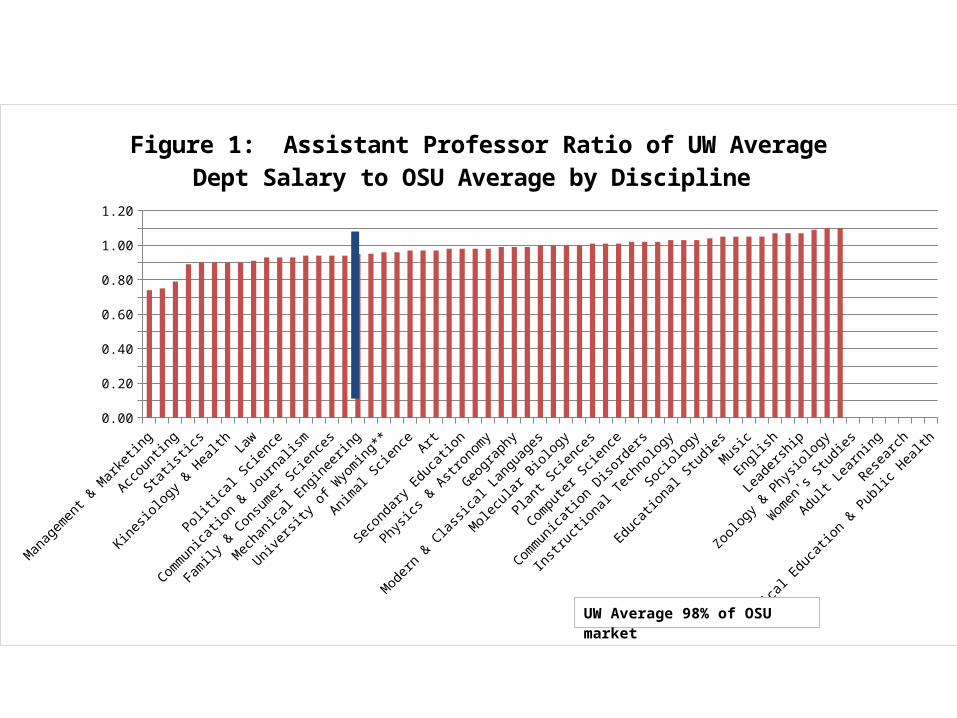
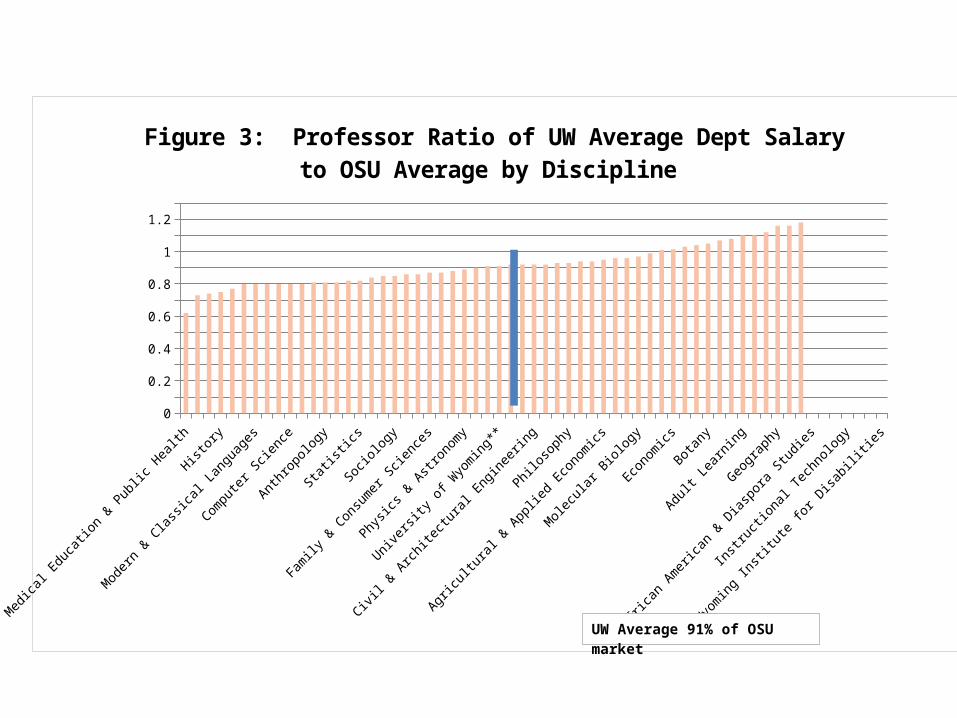
• By rank, UW average salaries vary with respect to market target levels– Assistants at market target (98%)– Associates near target (96%)– Full Professors above 90% (91%)
• Salary problems differ by college and discipline.
Manag
emen
t & M
arketi
ng
Accounting
Statisti
cs
Kinesiology
& Hea
lth Law
Political
Scien
ce
Communication &
Journ
alism
Family
& Consu
mer Sci
ences
Mechan
ical E
nginee
ring
Universi
ty of W
yoming*
*
Animal
Scien
ce Art
Seco
ndary Ed
ucation
Physics
& Astronomy
Geogra
phy
Modern &
Classic
al Lan
guag
es
Molecular
Biology
Plant S
ciences
Computer Sc
ience
Communication Diso
rders
Instructi
onal Te
chnology
Socio
logy
Educati
onal Stu
diesMusic
Engli
sh
Leaders
hip
Zoology
& Physi
ology
Women
's Studies
Adult Lea
rning
Researc
h
Medica
l Educati
on & Public
Health
0.00
0.10
0.20
0.30
0.40
0.50
0.60
0.70
0.80
0.90
1.00
1.10
1.20
Figure 1: Assistant Professor Ratio of UW Average Dept Salary to OSU Average by Discipline
UW Average 98% of OSU market
Plant S
ciences
Women
's Studies
Manag
emen
t & M
arketi
ng
Agricu
ltural
& Applie
d Economics
Statisti
cs
Civil &
Archite
ctural
Engin
eerin
g
Accounting
Atmosp
heric S
cience
Family
& Consu
mer Sci
ences
School o
f Nursi
ng
Geogra
phy
Profes
sional
Studies
School o
f Pharm
acy
American
Studies
Educati
onal Stu
dies
Modern &
Classic
al Lan
guag
es
Communication Diso
rders
Geology
& Geo
physics
Chemist
ry
Psychology
Elemen
tary &
Early
Childhood Ed
ucation
Thea
tre &
Dance
History
Mechan
ical E
nginee
ring
Physics
& Astronomy
Music
Socio
logy
Researc
h
Religio
us Studies
Finan
ce
Wyo
ming Insti
tute for D
isabiliti
es0.00
0.10
0.20
0.30
0.40
0.50
0.60
0.70
0.80
0.90
1.00
1.10
1.20
1.30
Figure 2: Associate Professor Ratio of UW Average Dept Salary to OSU Average by Discipline
UW Average 96% of OSU market
Medica
l Educati
on & Public
Health
Finan
ce
Psychology
Modern &
Classic
al Lan
guag
es
Accounting
Law
Anthropology
Political
Scien
ce
Profes
sional
Studies
Socio
logy
Electr
ical &
Computer En
ginee
ring
Music
Physics
& Astronomy
Kinesiology
& Hea
lth
Veterin
ary Sc
ience
Civil &
Archite
ctural
Engin
eerin
g
American
Studies
Speci
al Ed
ucation
Agricu
ltural
& Applie
d Economics
Geology
& Geo
physics
Mechan
ical E
nginee
ring
Economics
Seco
ndary Ed
ucation
Educati
onal Stu
dies
Adult Lea
rning
Chemist
ry
Mathem
atics
African
American
& Dias
pora Stu
dies
Religio
us Studies
Researc
h
Wyo
ming Insti
tute for D
isabiliti
es0
0.1
0.2
0.3
0.4
0.5
0.6
0.7
0.8
0.9
1
1.1
1.2
1.3
Figure 3: Professor Ratio of UW Average Dept Salary to OSU Average by Discipline
UW Average 91% of OSU market
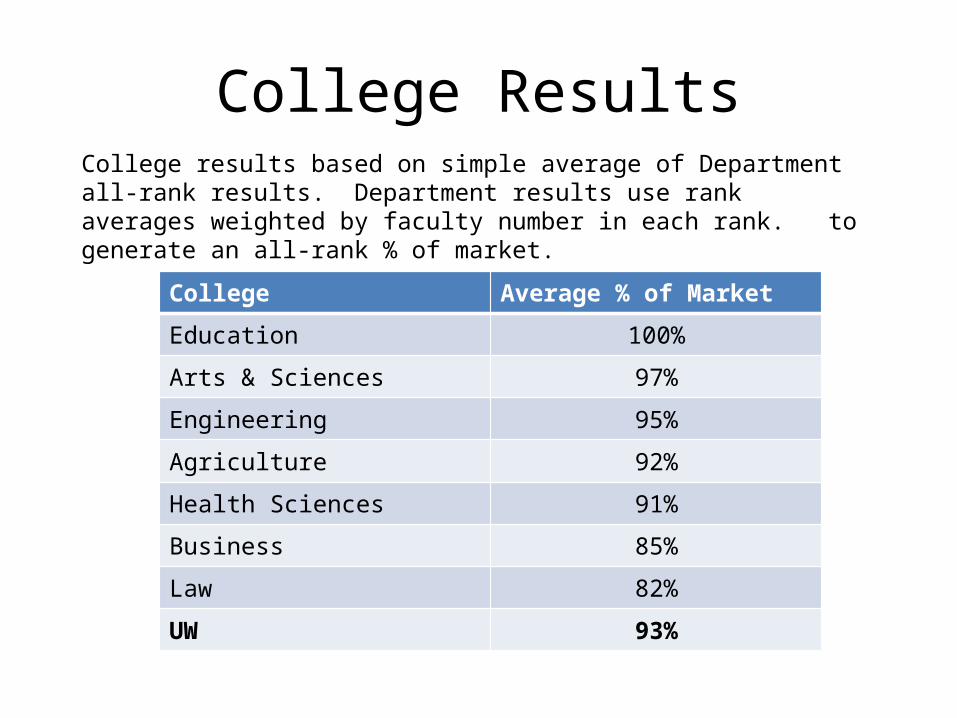
College Results
College Average % of Market
Education 100%
Arts & Sciences 97%
Engineering 95%
Agriculture 92%
Health Sciences 91%
Business 85%
Law 82%
UW 93%
College results based on simple average of Department all-rank results. Department results use rank averages weighted by faculty number in each rank. to generate an all-rank % of market.
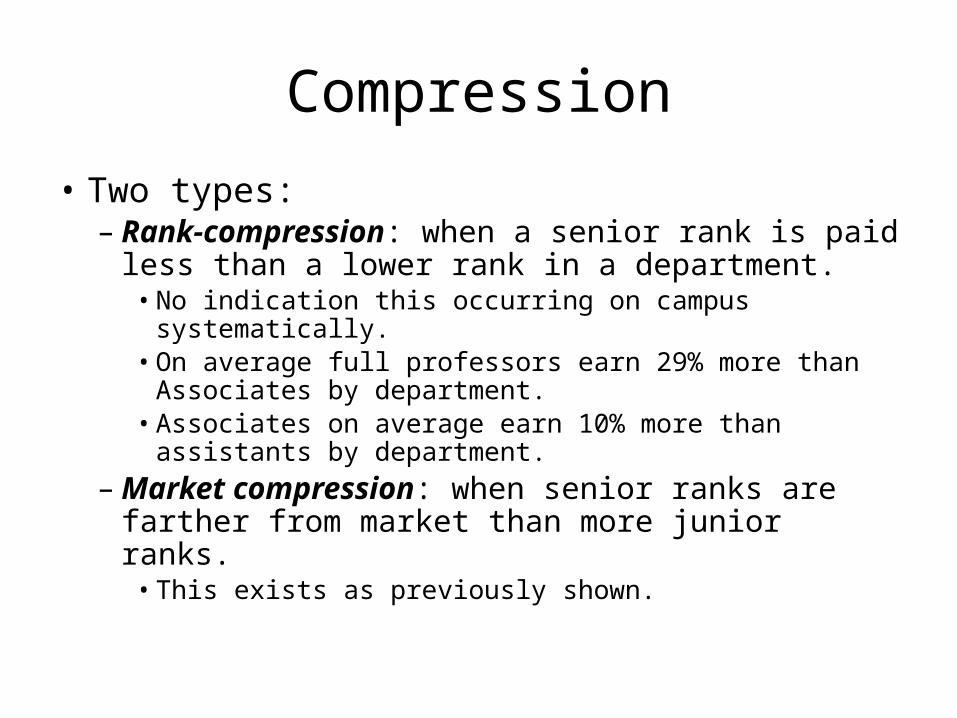
Compression
• Two types:– Rank-compression: when a senior rank is paid less
than a lower rank in a department.• No indication this occurring on campus systematically.• On average full professors earn 29% more than
Associates by department.• Associates on average earn 10% more than assistants
by department. – Market compression: when senior ranks are
farther from market than more junior ranks.• This exists as previously shown.
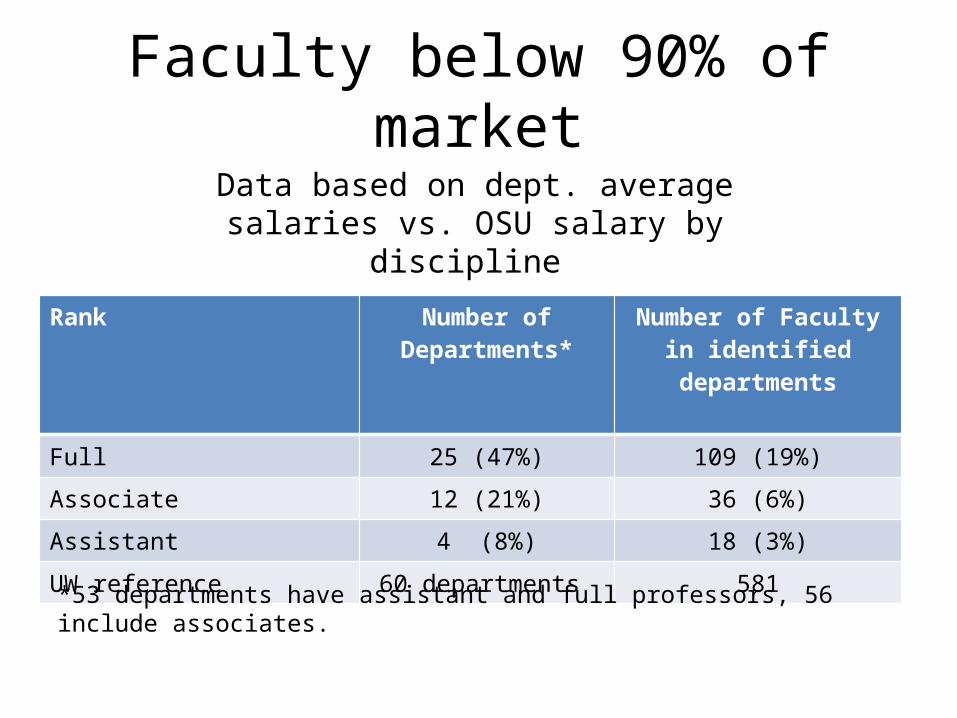
Faculty below 90% of market
Rank Number of Departments*
Number of Faculty in identified departments
Full 25 (47%) 109 (19%)
Associate 12 (21%) 36 (6%)
Assistant 4 (8%) 18 (3%)
UW reference 60 departments 581
Data based on dept. average salaries vs. OSU salary by discipline
*53 departments have assistant and full professors, 56 include associates.
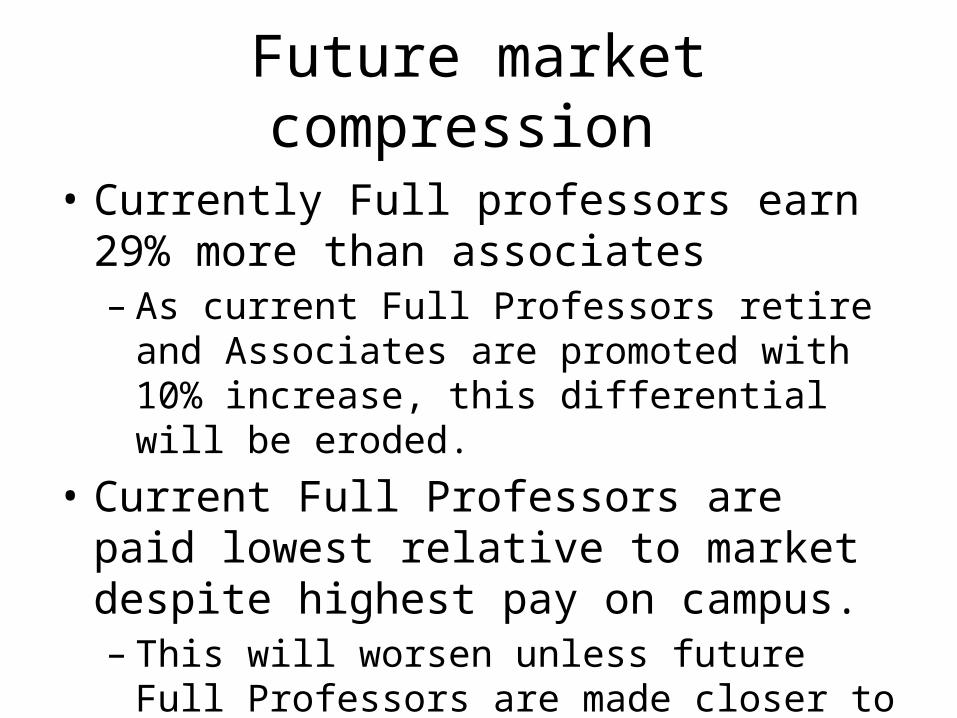
Future market compression
• Currently Full professors earn 29% more than associates– As current Full Professors retire and Associates are
promoted with 10% increase, this differential will be eroded.
• Current Full Professors are paid lowest relative to market despite highest pay on campus. – This will worsen unless future Full Professors are
made closer to market upon promotion.
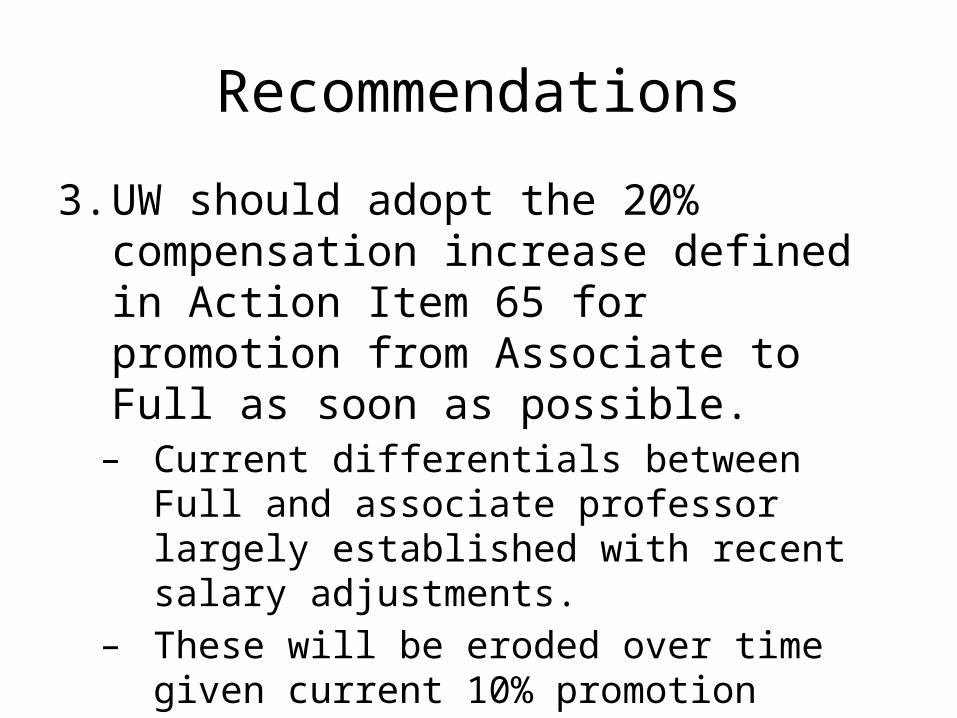
Recommendations
3. UW should adopt the 20% compensation increase defined in Action Item 65 for promotion from Associate to Full as soon as possible. – Current differentials between Full and associate
professor largely established with recent salary adjustments.
– These will be eroded over time given current 10% promotion policy.
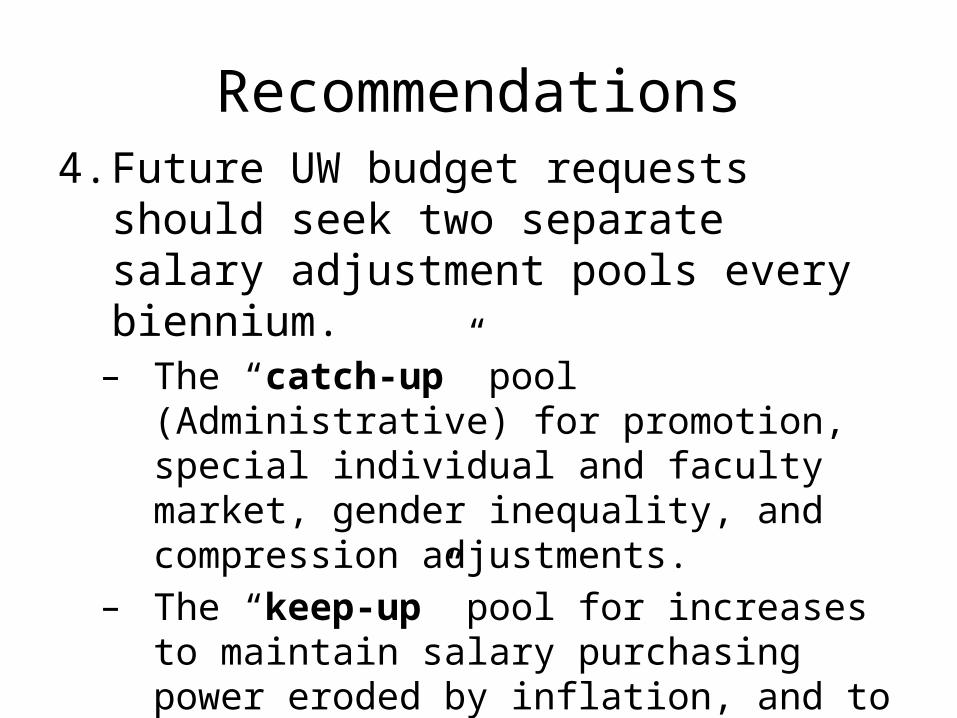
Recommendations4. Future UW budget requests should seek two
separate salary adjustment pools every biennium. – The “catch-up” pool (Administrative) for
promotion, special individual and faculty market, gender inequality, and compression adjustments.
– The “keep-up” pool for increases to maintain salary purchasing power eroded by inflation, and to remain competitive with the university benchmark salary levels.
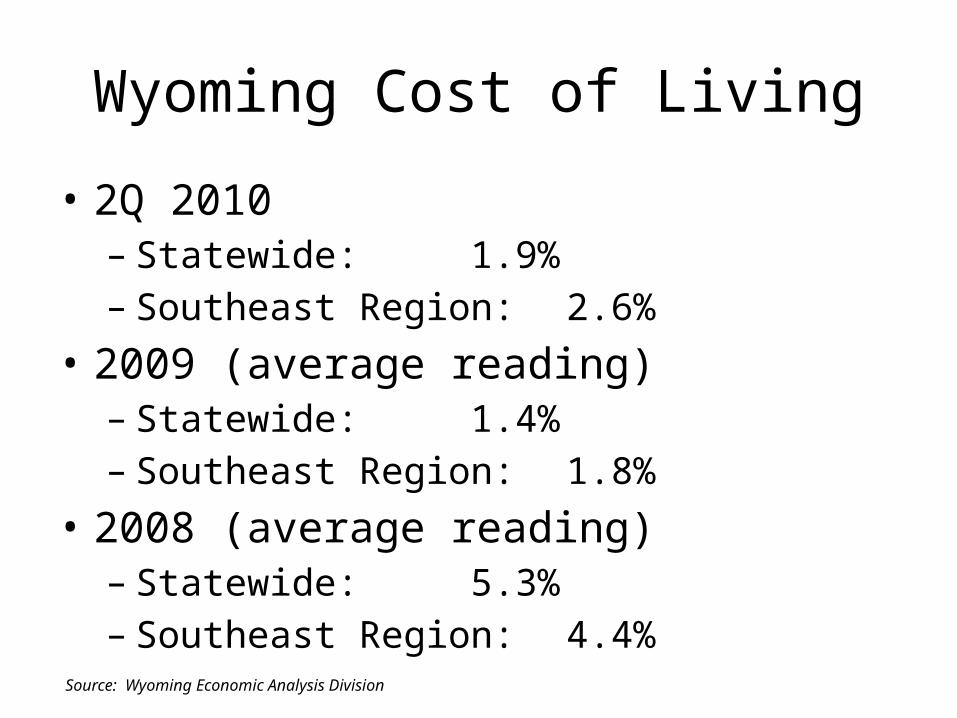
Wyoming Cost of Living
• 2Q 2010– Statewide: 1.9%– Southeast Region: 2.6%
• 2009 (average reading)– Statewide: 1.4%– Southeast Region: 1.8%
• 2008 (average reading)– Statewide: 5.3%– Southeast Region: 4.4%
Source: Wyoming Economic Analysis Division
Recommendations
5. The University of Wyoming should implement health insurance coverage to the domestic partners of UW faculty and staff beginning with the 2011-2012 academic year.– This maintains competitiveness with aspirational
comparators.

Benefits
• Our benefits are very competitive with the schools we defined as regional competitors and aspirational comparators.
• UW retirement plan equivalent to a 3% salary advantage because of low employee contribution rate required.
• Domestic partner benefit has been approved but not implemented at UW. – This benefit is commonplace among relevant public
institutions.
Diff to UW% Diff to UW
Tax Adj % Diff to UW
Tax+COL Adj % Diff to UW
Tax+COL+Ben Adj % Diff to UW
FICA % diff
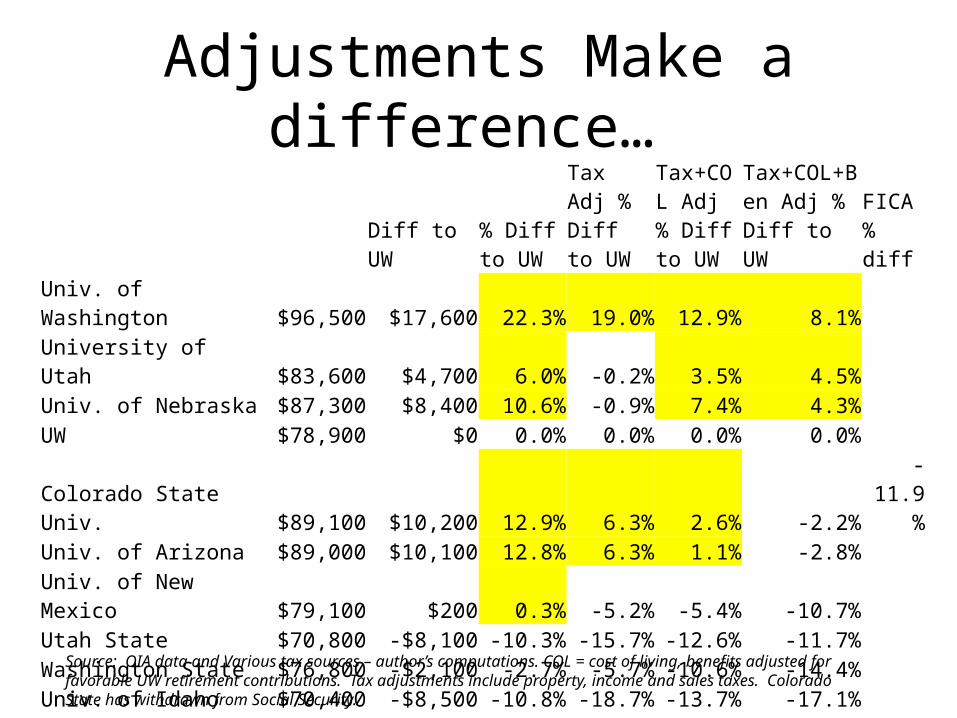
Univ. of Washington $96,500 $17,600 22.3% 19.0% 12.9% 8.1%University of Utah $83,600 $4,700 6.0% -0.2% 3.5% 4.5%Univ. of Nebraska $87,300 $8,400 10.6% -0.9% 7.4% 4.3%UW $78,900 $0 0.0% 0.0% 0.0% 0.0%Colorado State Univ. $89,100 $10,200 12.9% 6.3% 2.6% -2.2% -11.9%Univ. of Arizona $89,000 $10,100 12.8% 6.3% 1.1% -2.8%Univ. of New Mexico $79,100 $200 0.3% -5.2% -5.4% -10.7%Utah State $70,800 -$8,100 -10.3% -15.7% -12.6% -11.7%Washington State $76,800 -$2,100 -2.7% -5.7% -10.6% -14.4%Univ. of Idaho $70,400 -$8,500 -10.8% -18.7% -13.7% -17.1%Univ. of Oregon $76,000 -$2,900 -3.7% -6.1% -16.1% -18.8%Oregon State $72,700 -$6,200 -7.9% -10.3% -19.9% -22.4%New Mexico State $63,100 -$15,800 -20.0% -24.7% -24.8% -29.0%
Adjustments Make a difference…
Source: OIA data and Various tax sources – author’s computations. COL = cost of living, benefits adjusted for favorable UW retirement contributions. Tax adjustments include property, income and sales taxes. Colorado State has withdrawn from Social Security.

Other Tables
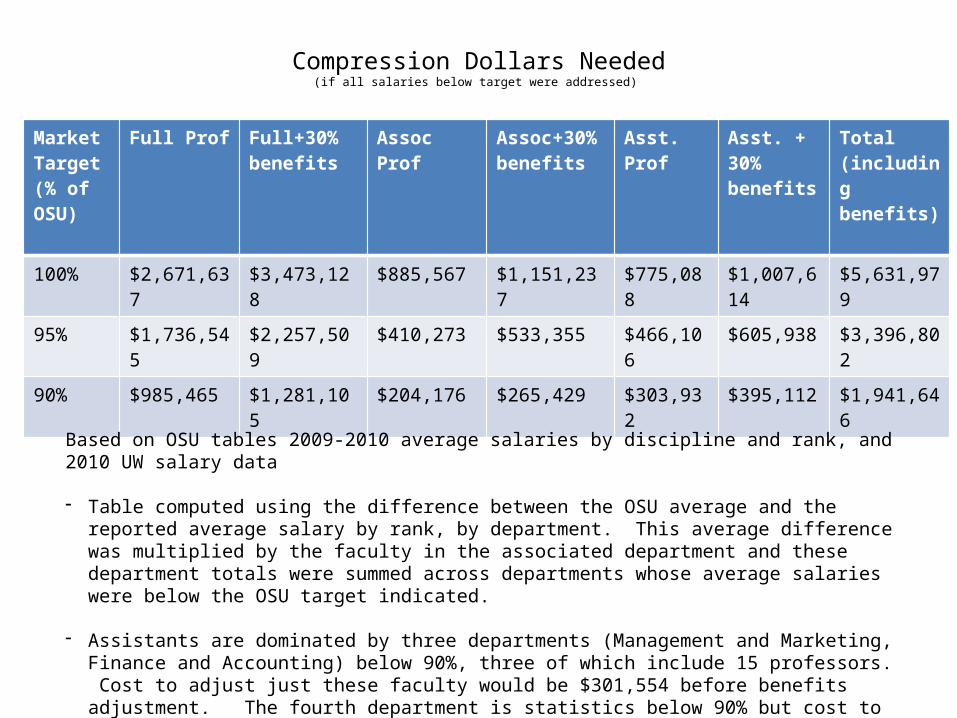
Compression Dollars Needed(if all salaries below target were addressed)
Market Target (% of OSU)
Full Prof Full+30% benefits
Assoc Prof Assoc+30% benefits
Asst. Prof Asst. + 30% benefits
Total (including benefits)
100% $2,671,637 $3,473,128 $885,567 $1,151,237 $775,088 $1,007,614 $5,631,979
95% $1,736,545 $2,257,509 $410,273 $533,355 $466,106 $605,938 $3,396,802
90% $985,465 $1,281,105 $204,176 $265,429 $303,932 $395,112 $1,941,646
Based on OSU tables 2009-2010 average salaries by discipline and rank, and 2010 UW salary data
- Table computed using the difference between the OSU average and the reported average salary by rank, by department. This average difference was multiplied by the faculty in the associated department and these department totals were summed across departments whose average salaries were below the OSU target indicated.
- Assistants are dominated by three departments (Management and Marketing, Finance and Accounting) below 90%, three of which include 15 professors. Cost to adjust just these faculty would be $301,554 before benefits adjustment. The fourth department is statistics below 90% but cost to adjust the three faculty in this department is $2,378 before benefits
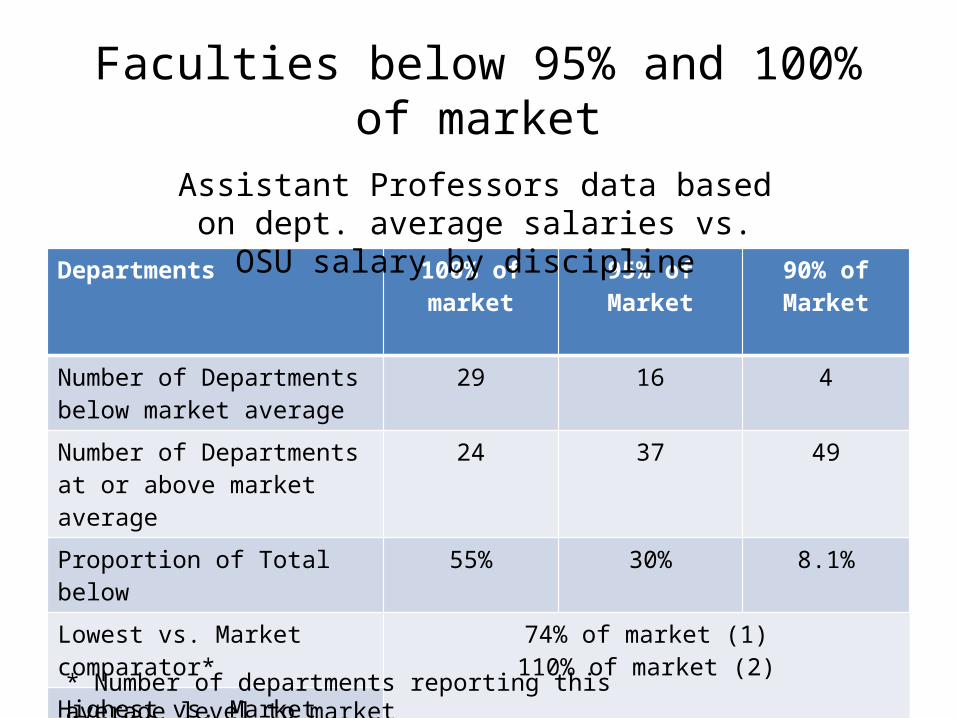
Faculties below 95% and 100% of market
Departments 100% of market 95% of Market 90% of Market
Number of Departments below market average
29 16 4
Number of Departments at or above market average
24 37 49
Proportion of Total below 55% 30% 8.1%
Lowest vs. Market comparator* 74% of market (1)110% of market (2)
Highest vs. Market comparator*
Number of Departments at market
4 at 100% 2 at 95% 4 at 90%
Assistant Professors data based on dept. average salaries vs. OSU salary by discipline
* Number of departments reporting this average level to market
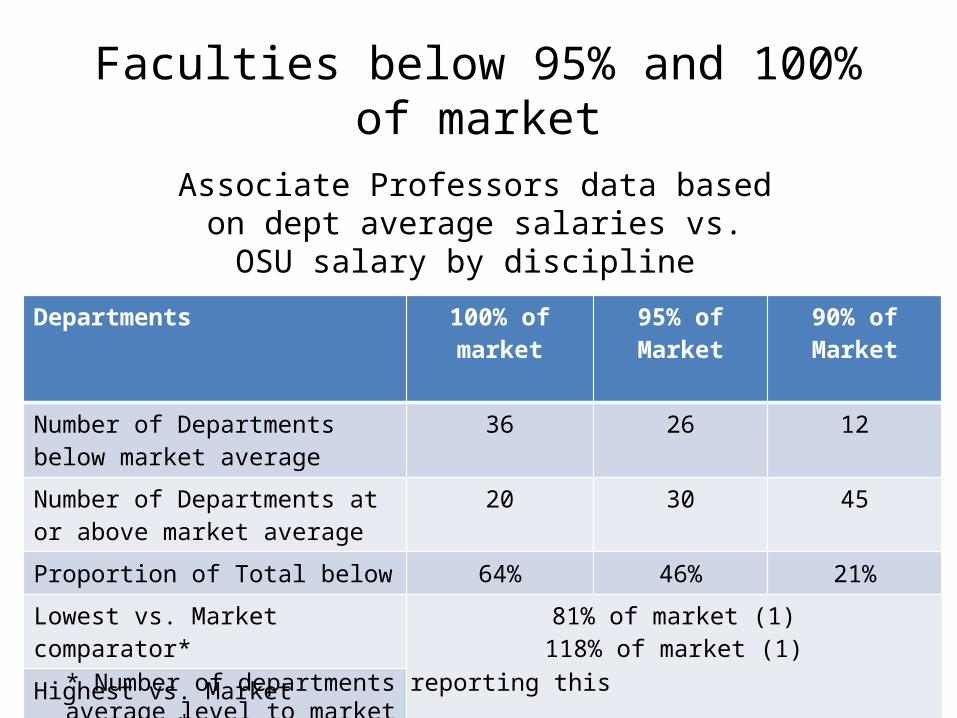
Faculties below 95% and 100% of market
Departments 100% of market 95% of Market 90% of Market
Number of Departments below market average
36 26 12
Number of Departments at or above market average
20 30 45
Proportion of Total below 64% 46% 21%
Lowest vs. Market comparator* 81% of market (1)118% of market (1)
Highest vs. Market comparator*
Number of Departments at market 4 at 100% 1 at 95% 4 at 90%
Associate Professors data based on dept average salaries vs. OSU salary by discipline
* Number of departments reporting this average level to market
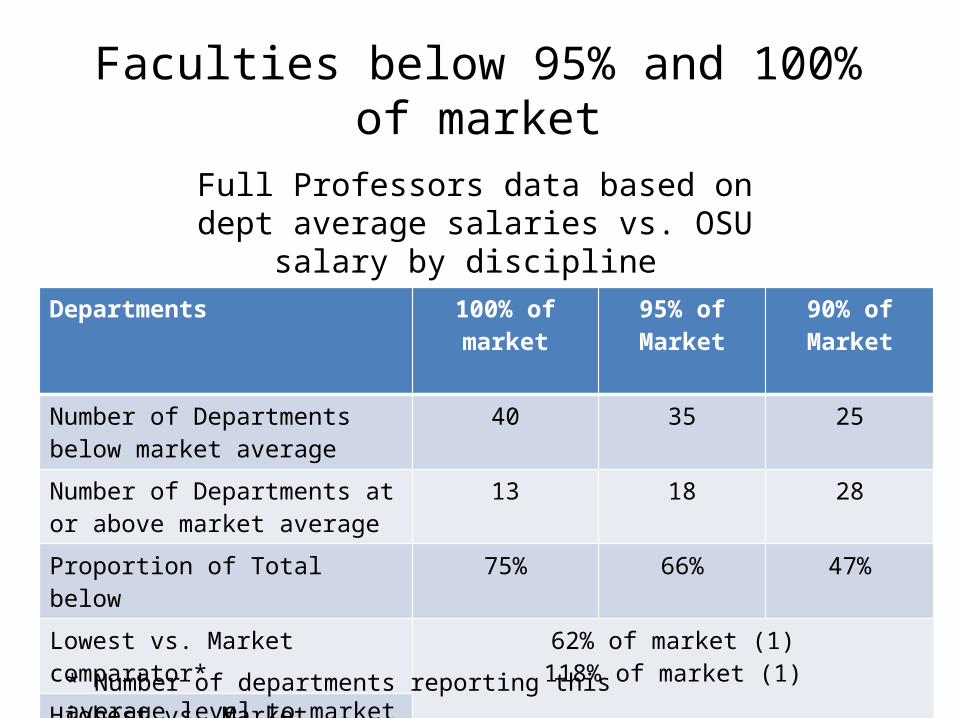
Faculties below 95% and 100% of market
Departments 100% of market 95% of Market 90% of Market
Number of Departments below market average
40 35 25
Number of Departments at or above market average
13 18 28
Proportion of Total below 75% 66% 47%
Lowest vs. Market comparator* 62% of market (1)118% of market (1)
Highest vs. Market comparator*
Number of Departments at market 2 at 101% 1 at 95% 1 at 90%
Full Professors data based on dept average salaries vs. OSU salary by discipline
* Number of departments reporting this average level to market
Quartile Analysis by Department
Departments Number of Faculty
Average % of market
Maximum % of market
(number of faculty)
Minimum % of market
(number of faculty)
Bottom quartile 47 77% 81% (5) 62% (1)
26%-50% 64 86% 91% (1) 81% (5)
51-75% 55 94% 99% (4) 92% (5)
Top: 76%-100% 50 108% 118% (3) 101% (10)
Full Professors data based on dept average salaries vs. OSU salary by discipline
Quartiles defined by Department % of Market
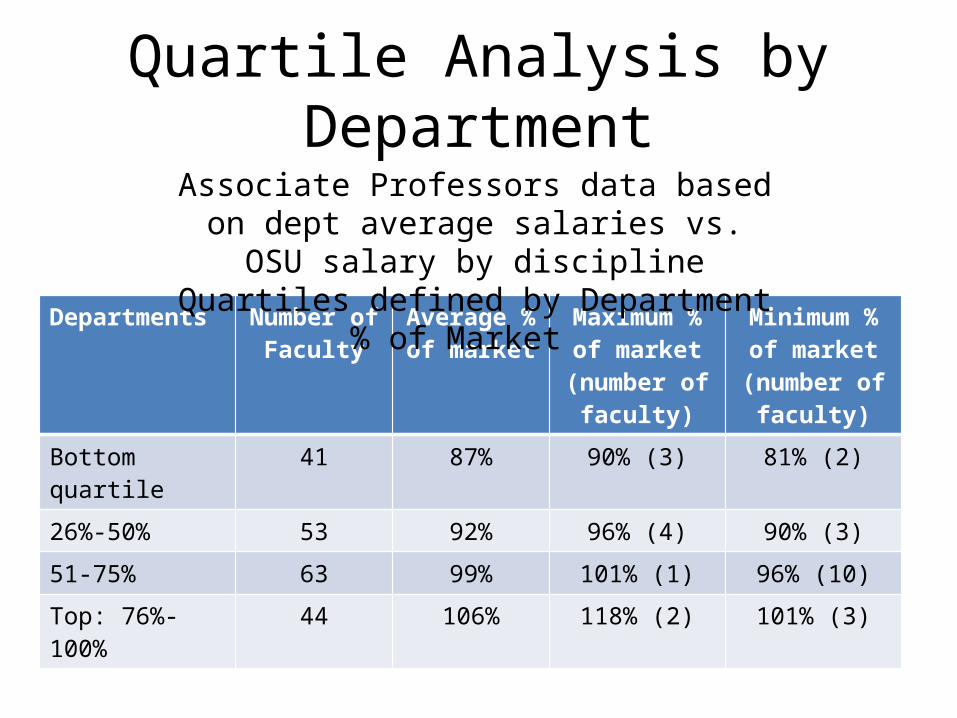
Quartile Analysis by Department
Departments Number of Faculty
Average % of market
Maximum % of market
(number of faculty)
Minimum % of market
(number of faculty)
Bottom quartile 41 87% 90% (3) 81% (2)
26%-50% 53 92% 96% (4) 90% (3)
51-75% 63 99% 101% (1) 96% (10)
Top: 76%-100% 44 106% 118% (2) 101% (3)
Associate Professors data based on dept average salaries vs. OSU salary by discipline
Quartiles defined by Department % of Market
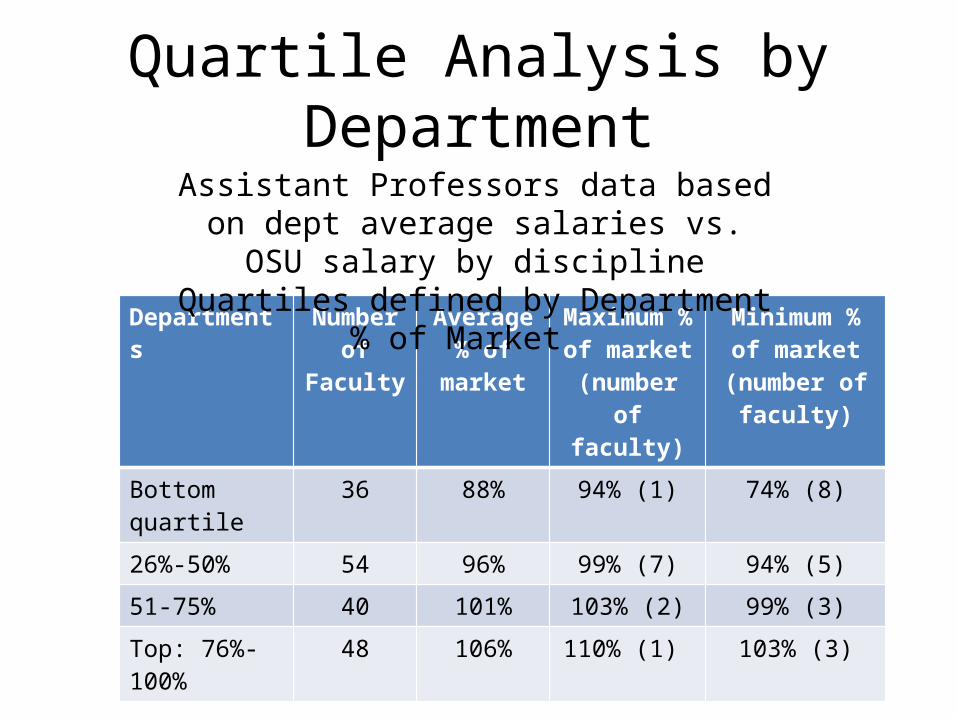
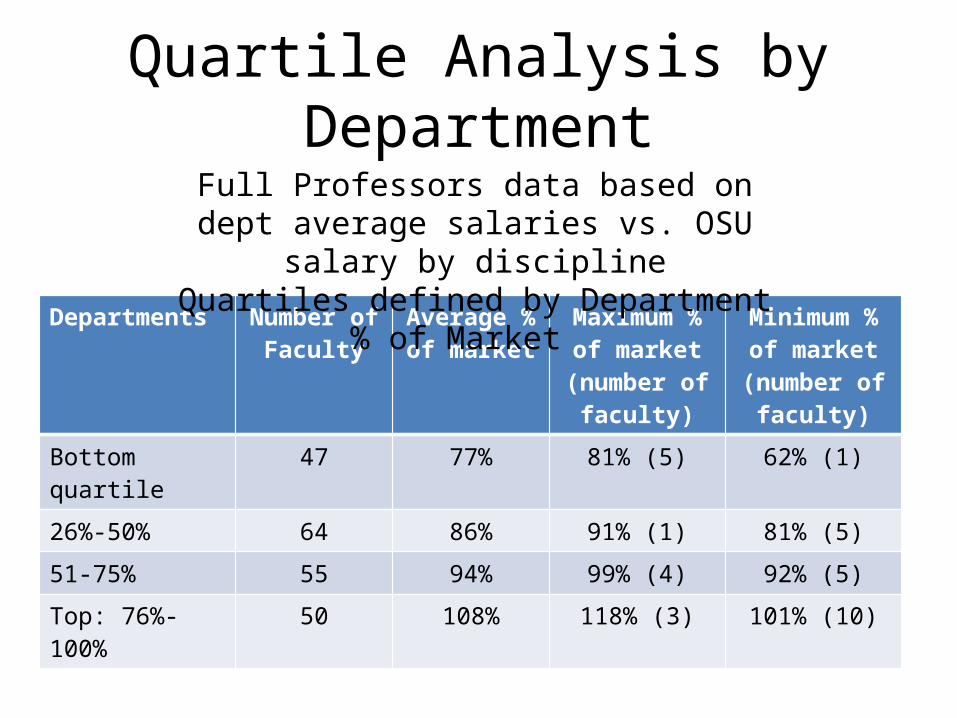
Quartile Analysis by Department
Departments Number of Faculty
Average % of market
Maximum % of market
(number of faculty)
Minimum % of market
(number of faculty)
Bottom quartile
36 88% 94% (1) 74% (8)
26%-50% 54 96% 99% (7) 94% (5)
51-75% 40 101% 103% (2) 99% (3)
Top: 76%-100% 48 106% 110% (1) 103% (3)
Assistant Professors data based on dept average salaries vs. OSU salary by discipline
Quartiles defined by Department % of Market