Embed Size (px)
Citation preview
© Copyright 2016 The Sales Management Association.
Sales Management Association Webcast
28 June 2016
Presented by
Getting Sales Compensation Right
About The Sales Management Association
Slide 2© 2016 The Sales Management Association. All rights reserved.
A global, cross-industry professional association for sales
operations and sales management.
Focused in providing research, case studies, training, peer
networking, and professional development to our membership.
Fostering a community of thought-leaders, service providers,
academics, and practitioners.
Learn More: www.salesmanagement.org
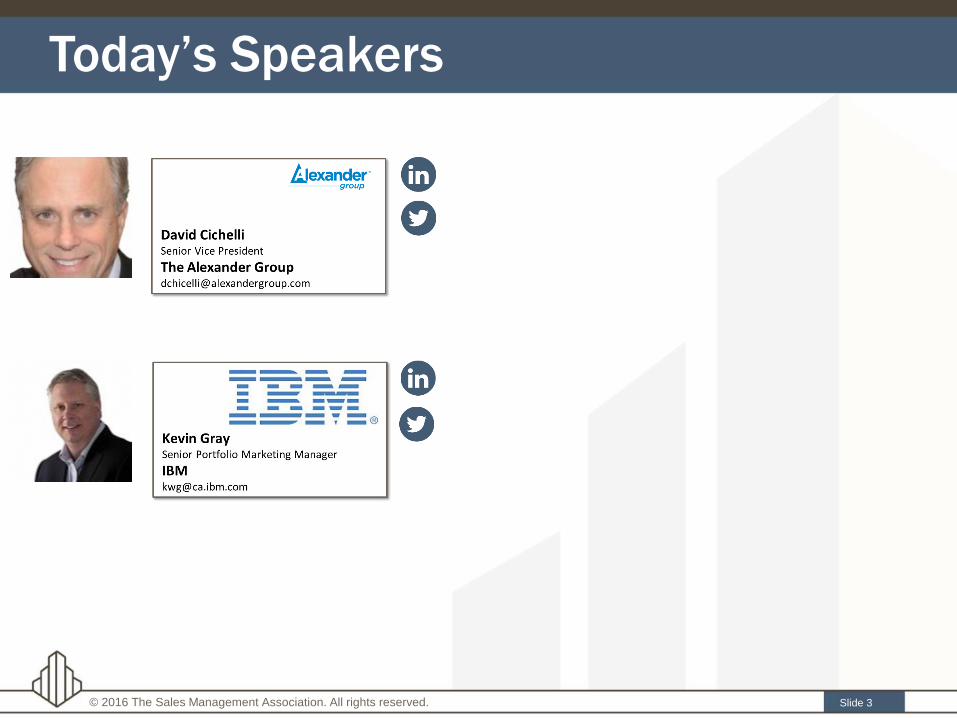
Today’s Speakers
Slide 3© 2016 The Sales Management Association. All rights reserved.

© Copyright 2016 The Sales Management Association.
Sales Management Association Webcast
28 June 2016
Getting Sales Compensation Right
Presented by

© 2016 IBM Corporation5
It’s not easy…
territory definitions, account assignments, setting quota, sales roles, plan measures, rates, crediting rules and more…
Getting Sales
Compensation Right
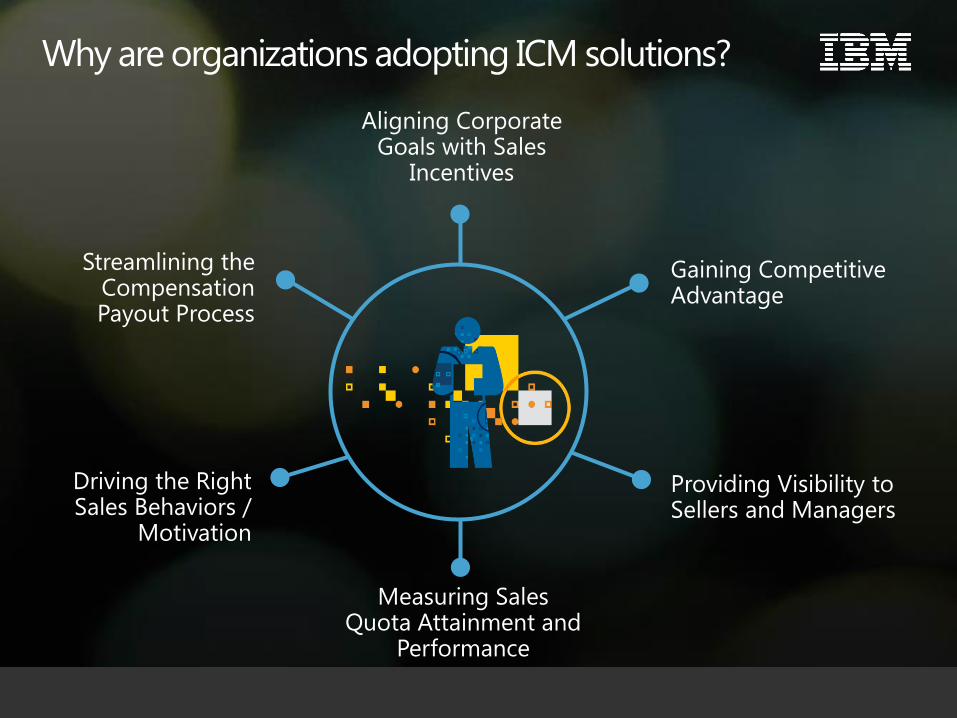
Why are organizations adopting ICM solutions?
Gaining Competitive Advantage
Streamlining the Compensation Payout Process
Driving the Right Sales Behaviors /
Motivation
Providing Visibility to Sellers and Managers
Aligning Corporate Goals with Sales
Incentives
Measuring Sales Quota Attainment and
Performance
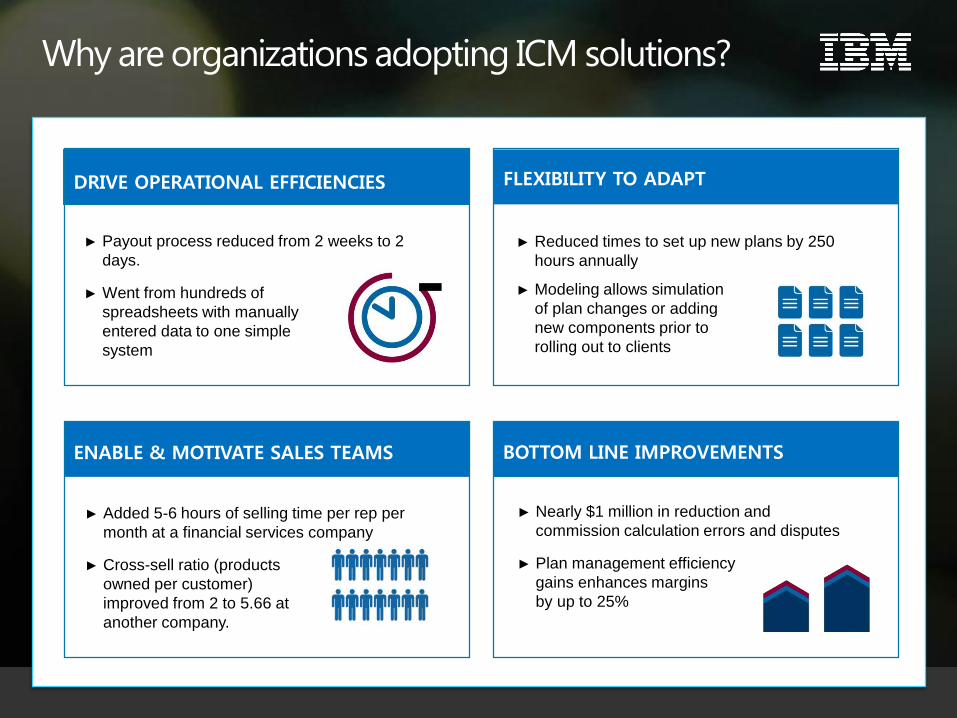
Why are organizations adopting ICM solutions?
► Reduced times to set up new plans by 250
hours annually
► Modeling allows simulation
of plan changes or adding
new components prior to
rolling out to clients
► Added 5-6 hours of selling time per rep per
month at a financial services company
► Cross-sell ratio (products
owned per customer)
improved from 2 to 5.66 at
another company.
► Nearly $1 million in reduction and
commission calculation errors and disputes
► Plan management efficiency
gains enhances margins
by up to 25%
ENABLE & MOTIVATE SALES TEAMS
FLEXIBILITY TO ADAPT
BOTTOM LINE IMPROVEMENTS
DRIVE OPERATIONAL EFFICIENCIES
► Payout process reduced from 2 weeks to 2
days.
► Went from hundreds of
spreadsheets with manually
entered data to one simple
system
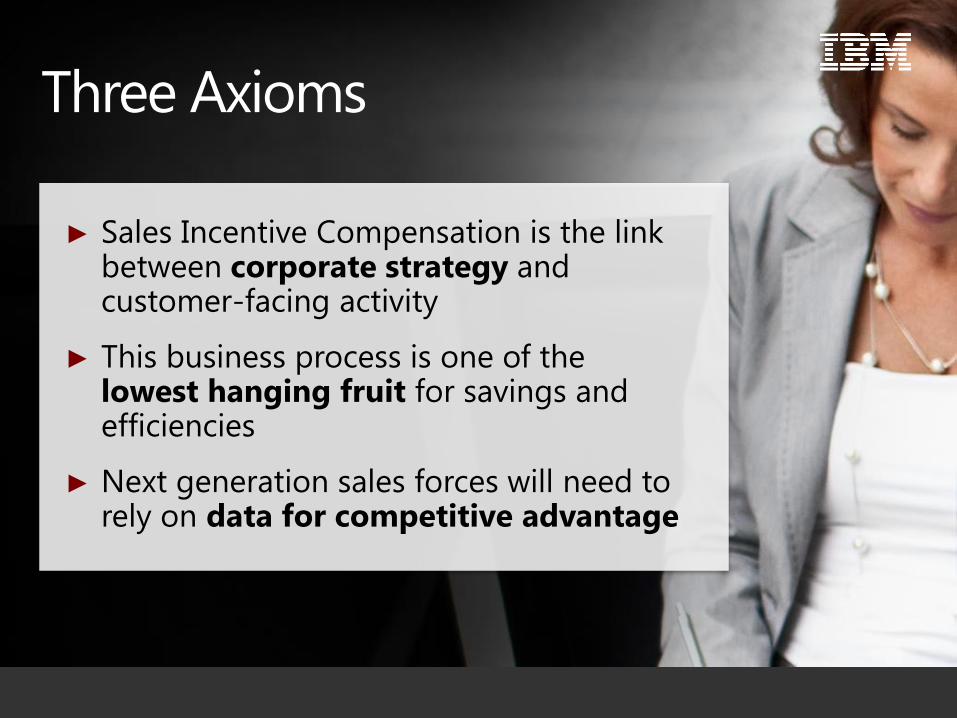
► Sales Incentive Compensation is the link between corporate strategy and customer-facing activity
► This business process is one of the lowest hanging fruit for savings and efficiencies
► Next generation sales forces will need to rely on data for competitive advantage
Three Axioms

Show me the sales incentive plan …“
and I’ll show you the company’s business priorities”
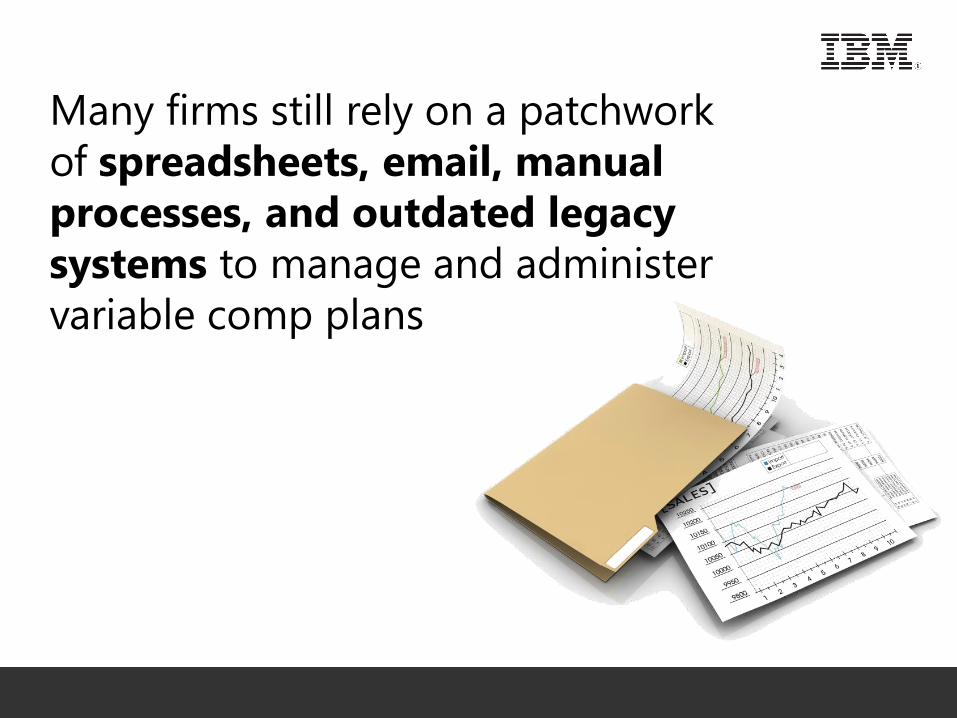
Many firms still rely on a patchwork
of spreadsheets, email, manual
processes, and outdated legacy
systems to manage and administer
variable comp plans
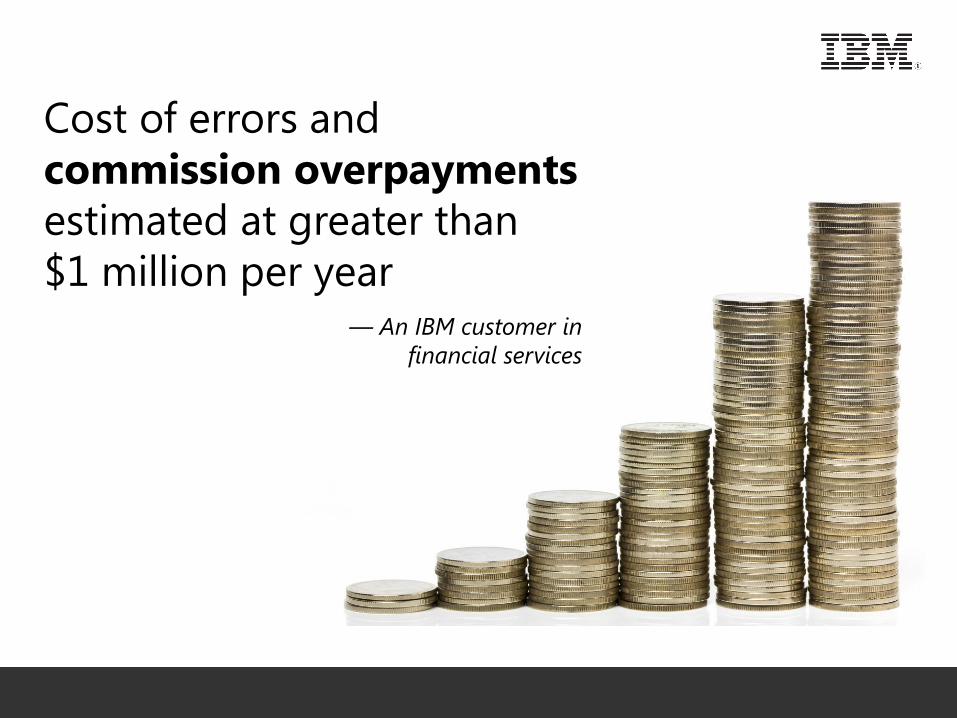
Cost of errors and
commission overpayments
estimated at greater than
$1 million per year— An IBM customer in
financial services
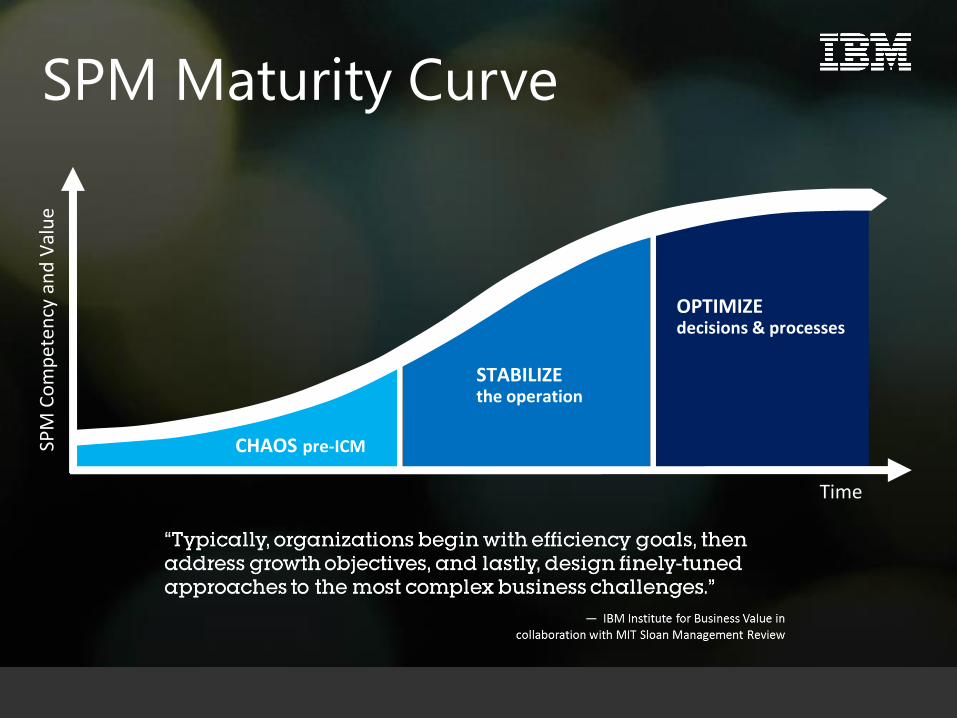
SPM Maturity Curve
Scaling a Market
Time
CHAOS pre-ICM
STABILIZE the operation
OPTIMIZE decisions & processes
SPM
Co
mp
eten
cy a
nd
Val
ue
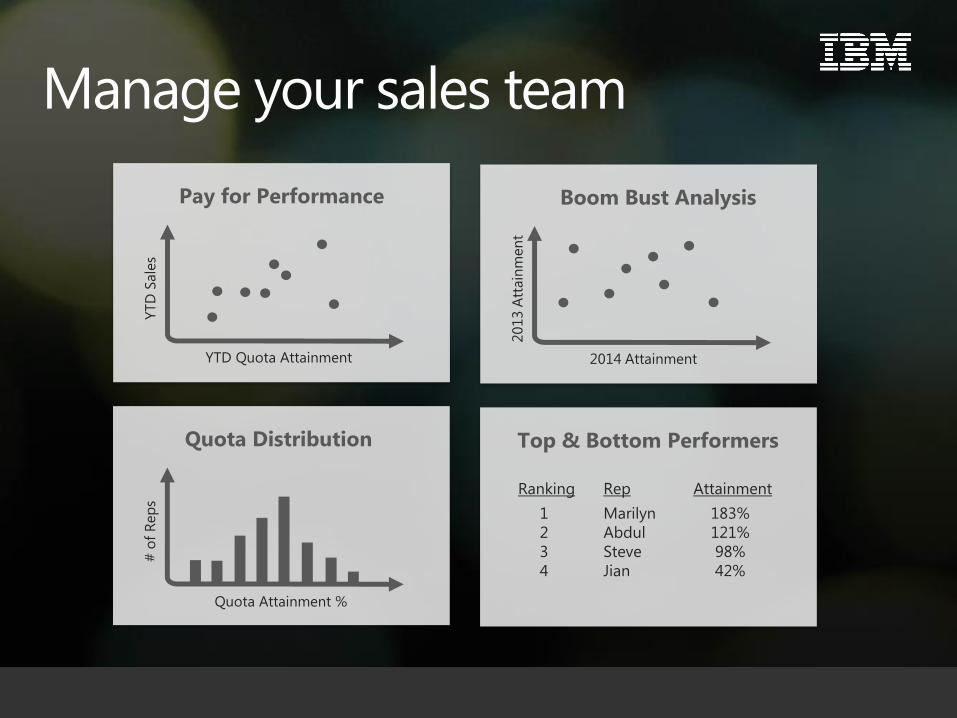
Pay for Performance
YTD
Sale
s
YTD Quota Attainment
Boom Bust Analysis
2013 A
ttain
men
t
2014 Attainment
Quota Distribution Top & Bottom Performers
Ranking
1
2
3
4
Rep
Marilyn
Abdul
Steve
Jian
Attainment
183%
121%
98%
42%
# o
f R
ep
s
Quota Attainment %
Manage your sales team
Atlanta | Chicago | San Francisco | Scottsdale | Stamford
Get Sales Compensation Right!
June 2016
David J. Cichelli
Senior Vice President
480.315.5828

© 2016 The Alexander Group, Inc.®
Objectives
Confirm that sales compensation plans are prone to
“classic” problems
Highlight key design principles
Show how growth changes the sales force
Present methods to investigate and manage sales
compensation plan health
Suggest a redesign process you can follow
23
© 2016 The Alexander Group, Inc.®
Something is not right…
24
…with the sales compensation plan…
© 2016 The Alexander Group, Inc.®
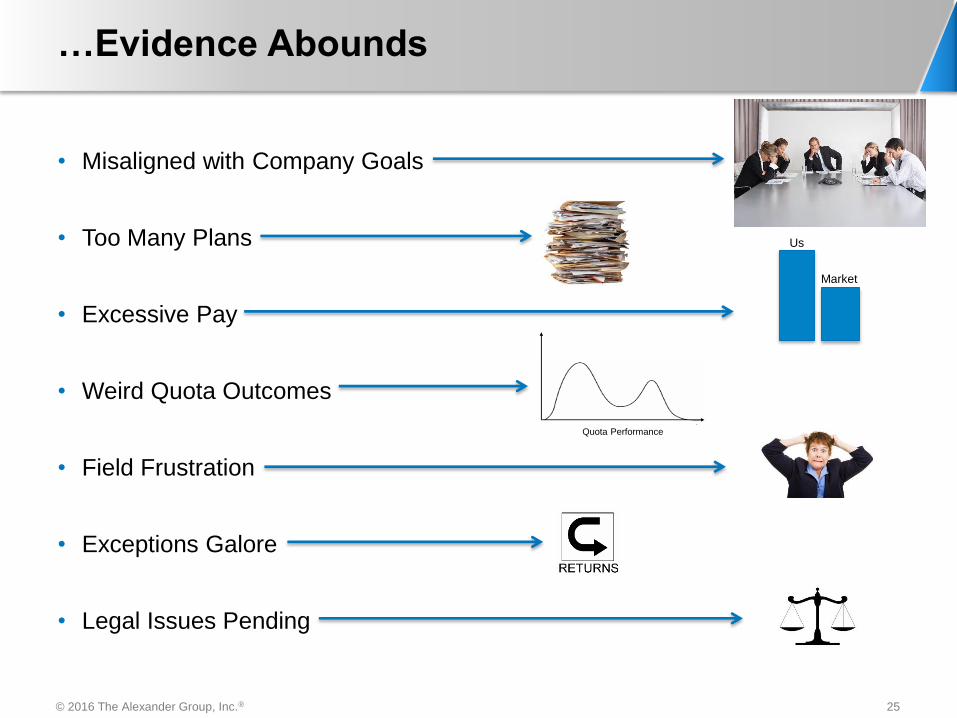
…Evidence Abounds
• Misaligned with Company Goals
• Too Many Plans
• Excessive Pay
• Weird Quota Outcomes
• Field Frustration
• Exceptions Galore
• Legal Issues Pending
Us
Market
Quota Performance
25
Sales Compensation—
Key Concepts
© 2016 The Alexander Group, Inc.®
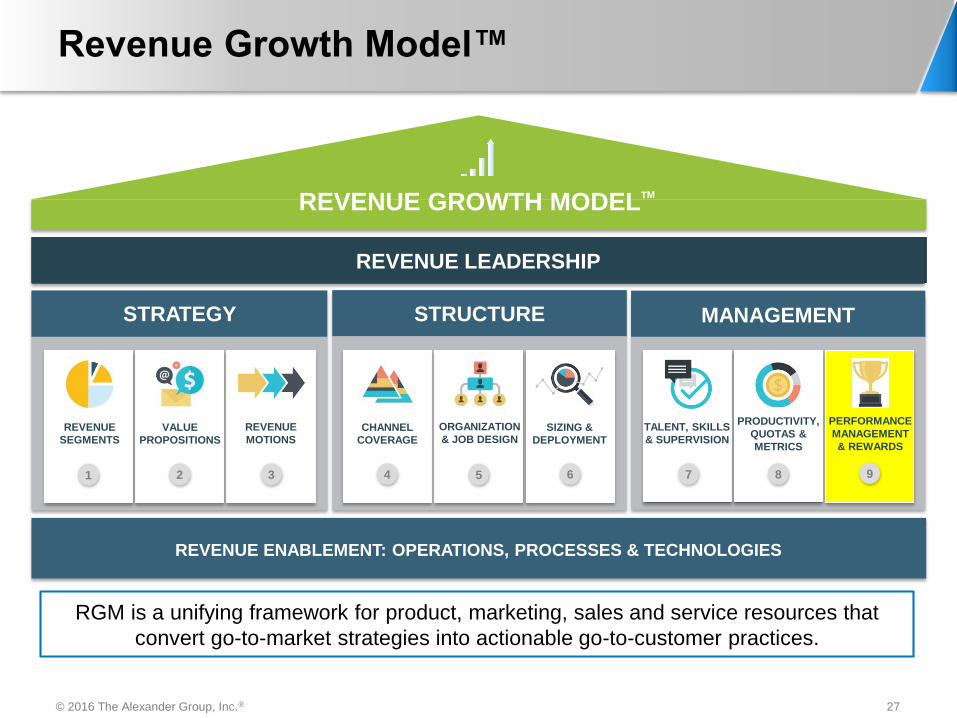
Revenue Growth Model™
RGM is a unifying framework for product, marketing, sales and service resources that
convert go-to-market strategies into actionable go-to-customer practices.
1 2 3 4 75 6 8 9
REVENUE
SEGMENTS
VALUE
PROPOSITIONS
REVENUE
MOTIONSCHANNEL
COVERAGE
TALENT, SKILLS
& SUPERVISION
ORGANIZATION
& JOB DESIGNSIZING &
DEPLOYMENT
PRODUCTIVITY,
QUOTAS &
METRICS
PERFORMANCE
MANAGEMENT
& REWARDS
REVENUE GROWTH MODELTM
REVENUE LEADERSHIP
STRATEGY STRUCTURE
REVENUE ENABLEMENT: OPERATIONS, PROCESSES & TECHNOLOGIES
MANAGEMENT
27
© 2016 The Alexander Group, Inc.®
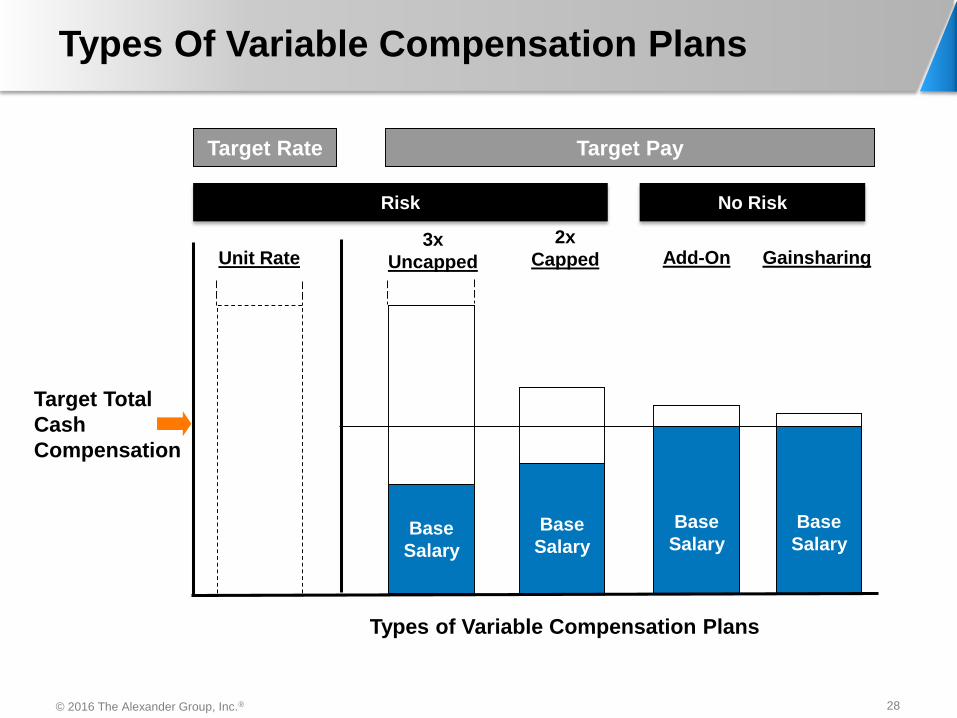
Base
SalaryBase
Salary
Target Total
Cash
Compensation
Base
Salary
GainsharingAdd-On3x
Uncapped
Types of Variable Compensation Plans
Base
Salary
2x
CappedUnit Rate
No RiskRisk
Target PayTarget Rate
Types Of Variable Compensation Plans
28
© 2016 The Alexander Group, Inc.®
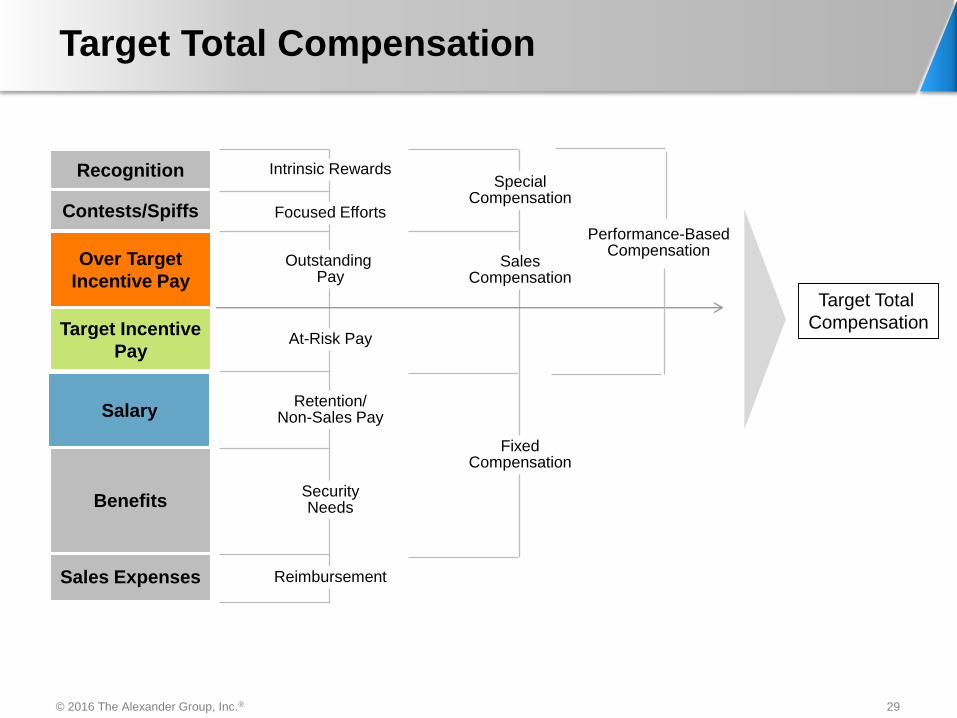
Target Total Compensation
Target Total
Compensation
Benefits
Sales Expenses
Recognition
Contests/Spiffs
Over Target
Incentive Pay
Target Incentive
Pay
Salary
Outstanding Pay
Retention/Non-Sales Pay
SecurityNeeds
Reimbursement
SpecialCompensation
FixedCompensation
Focused Efforts
Intrinsic Rewards
SalesCompensation
At-Risk Pay
Performance-BasedCompensation
29
© 2016 The Alexander Group, Inc.®
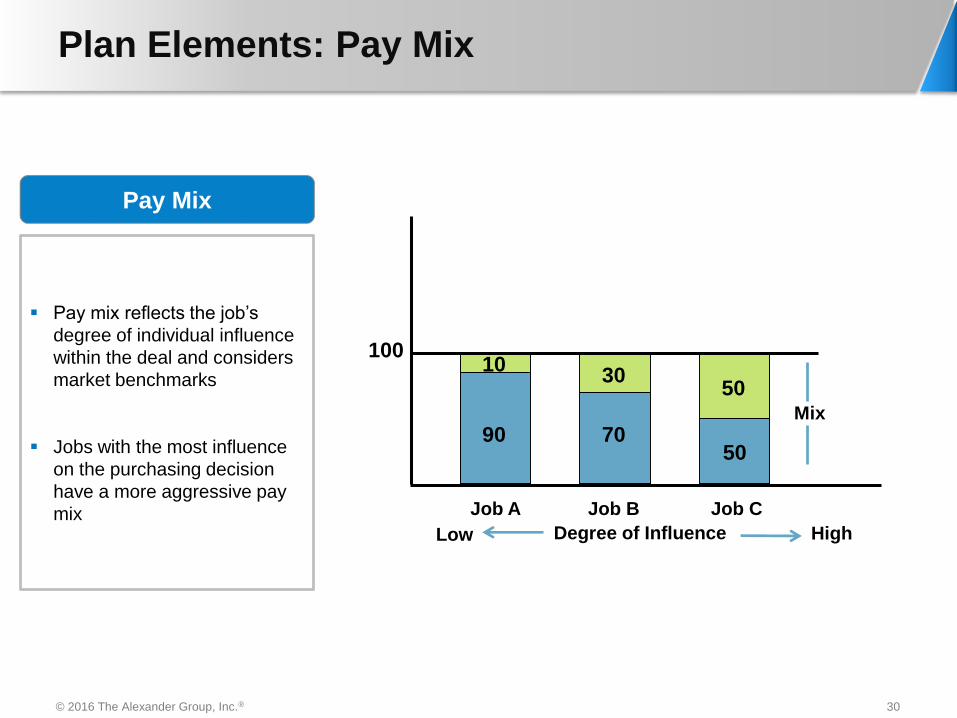
Pay Mix
Pay mix reflects the job’s
degree of individual influence
within the deal and considers
market benchmarks
Jobs with the most influence
on the purchasing decision
have a more aggressive pay
mix
100
Plan Elements: Pay Mix
Mix
90 7050
Degree of Influence
Job A Job B Job C
Low High
1030
50
30
© 2016 The Alexander Group, Inc.®
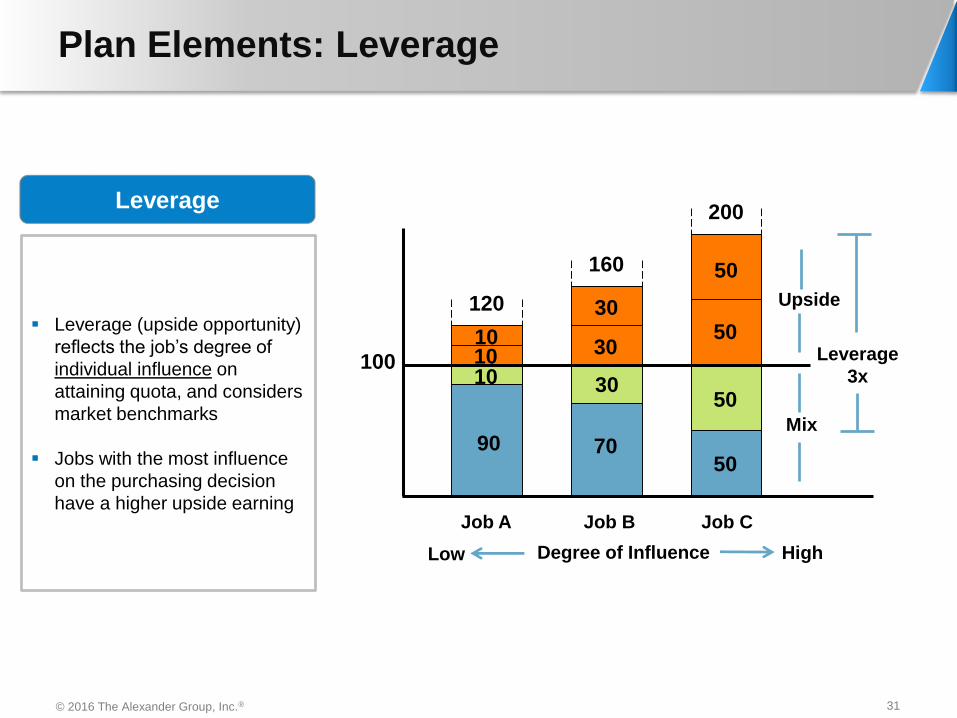
Plan Elements: Leverage
Leverage
Leverage (upside opportunity)
reflects the job’s degree of
individual influence on
attaining quota, and considers
market benchmarks
Jobs with the most influence
on the purchasing decision
have a higher upside earning
31
120
10
200
160
30
50
Mix
Upside
90 7050
Degree of Influence
Job A Job B Job C
Low High
1010 30
30
50
50
100 Leverage
3x
© 2016 The Alexander Group, Inc.®
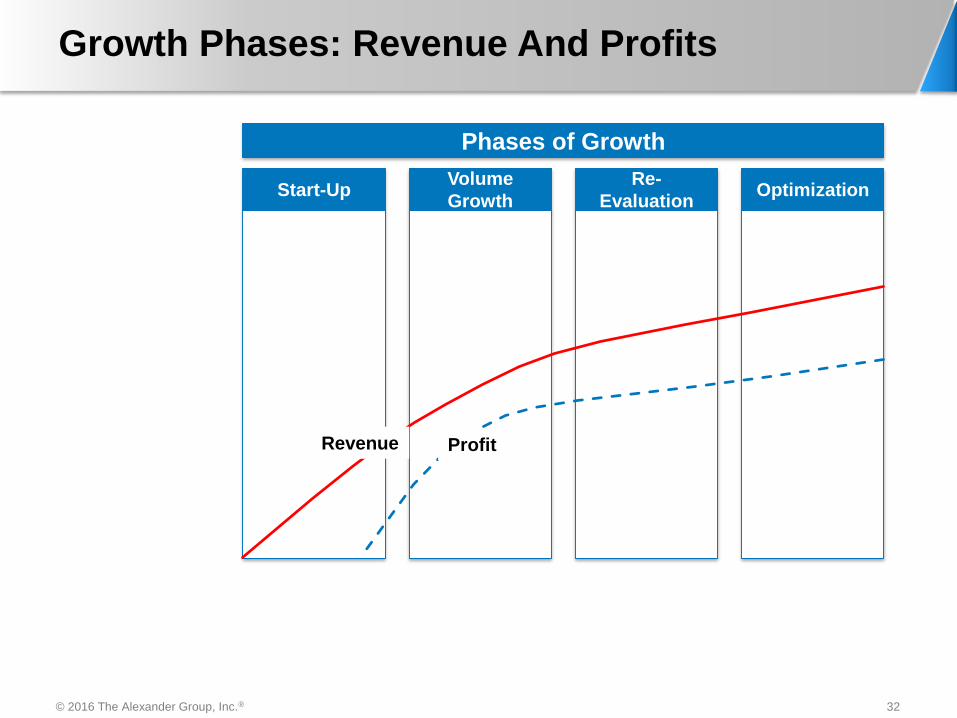
Growth Phases: Revenue And Profits
Start-UpVolume
Growth
Re-
EvaluationOptimization
Revenue Profit
Phases of Growth
32
© 2016 The Alexander Group, Inc.®
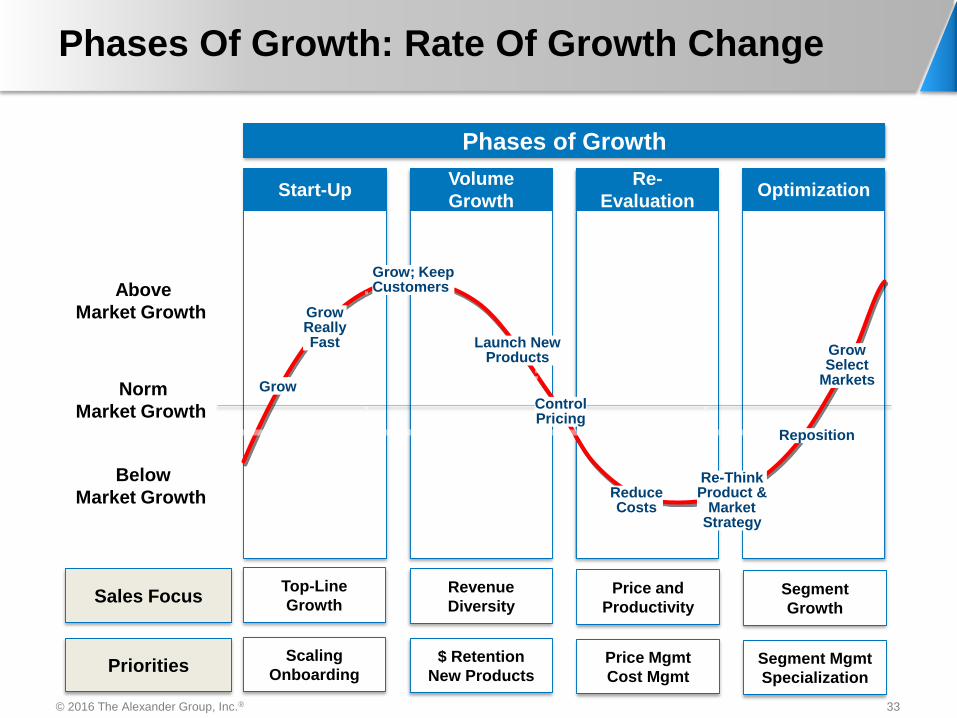
Phases Of Growth: Rate Of Growth Change
Start-UpVolume
Growth
Re-
EvaluationOptimization
Phases of Growth
Reposition
GrowSelect
Markets
Grow; KeepCustomers
Launch NewProducts
ControlPricing
ReduceCosts
Re-ThinkProduct &
MarketStrategy
Grow
GrowReallyFast
Norm
Market Growth
Below
Market Growth
Above
Market Growth
Top-Line
GrowthSales Focus
Scaling
OnboardingPriorities
Revenue
Diversity
$ Retention
New Products
Price and
Productivity
Price Mgmt
Cost Mgmt
Segment
Growth
Segment Mgmt
Specialization
33
© 2016 The Alexander Group, Inc.®
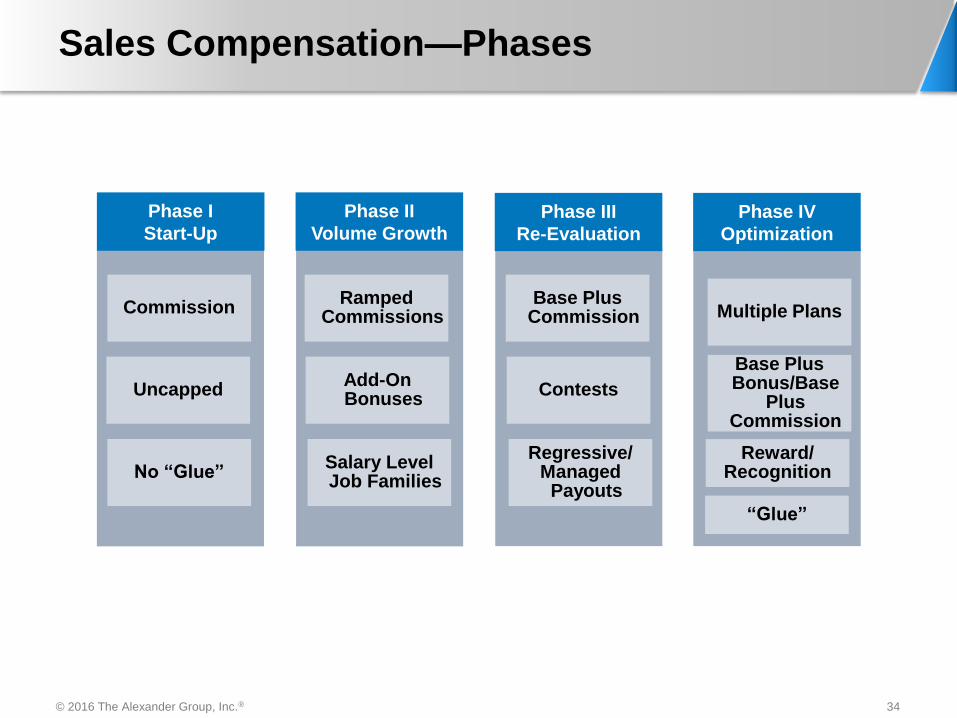
Base Plus Bonus/Base
Plus Commission
Multiple Plans
Reward/Recognition
Phase I
Start-Up
Phase II
Volume GrowthPhase III
Re-Evaluation
Phase IV
Optimization
Contests
Base Plus Commission
Regressive/Managed
Payouts
Add-On Bonuses
Ramped Commissions
Salary Level Job Families
Uncapped
Commission
No “Glue”
“Glue”
Sales Compensation—Phases
34
© 2016 The Alexander Group, Inc.®
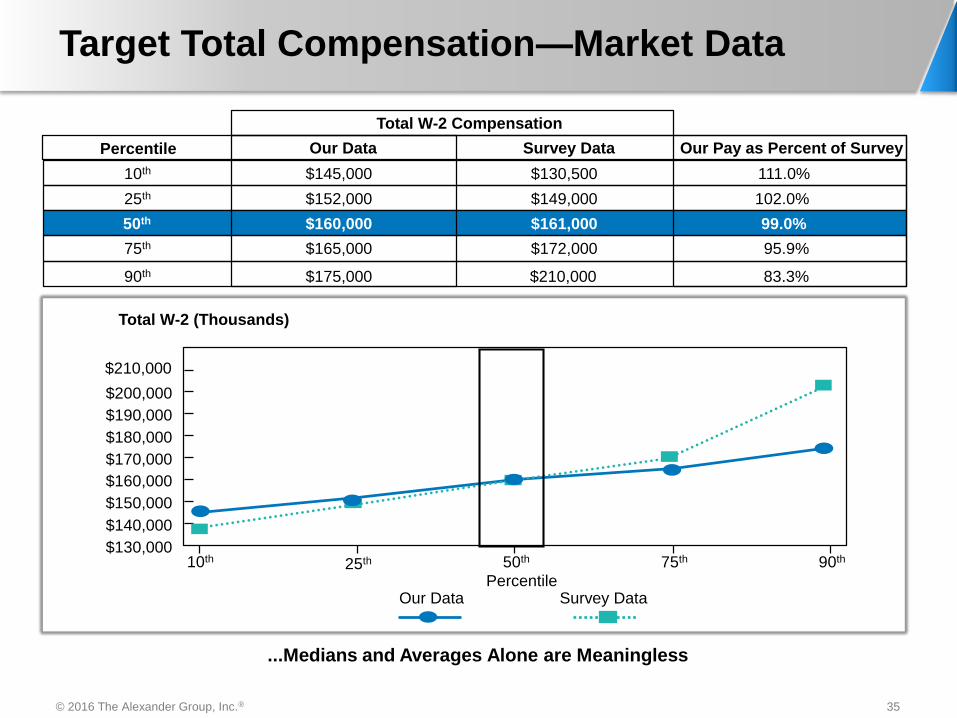
Target Total Compensation—Market Data
...Medians and Averages Alone are Meaningless
Total W-2 Compensation
Percentile Our Data Survey Data Our Pay as Percent of Survey
10th $145,000 $130,500 111.0%
25th $152,000 $149,000 102.0%
50th $160,000 $161,000 99.0%
75th $165,000 $172,000 95.9%
90th $175,000 $210,000 83.3%
10th 25th 50th 75th 90th$130,000
$140,000
$150,000
$160,000
$170,000
$180,000
$190,000
$200,000
Percentile
Total W-2 (Thousands)
Our Data Survey Data
$210,000
35
© 2016 The Alexander Group, Inc.®
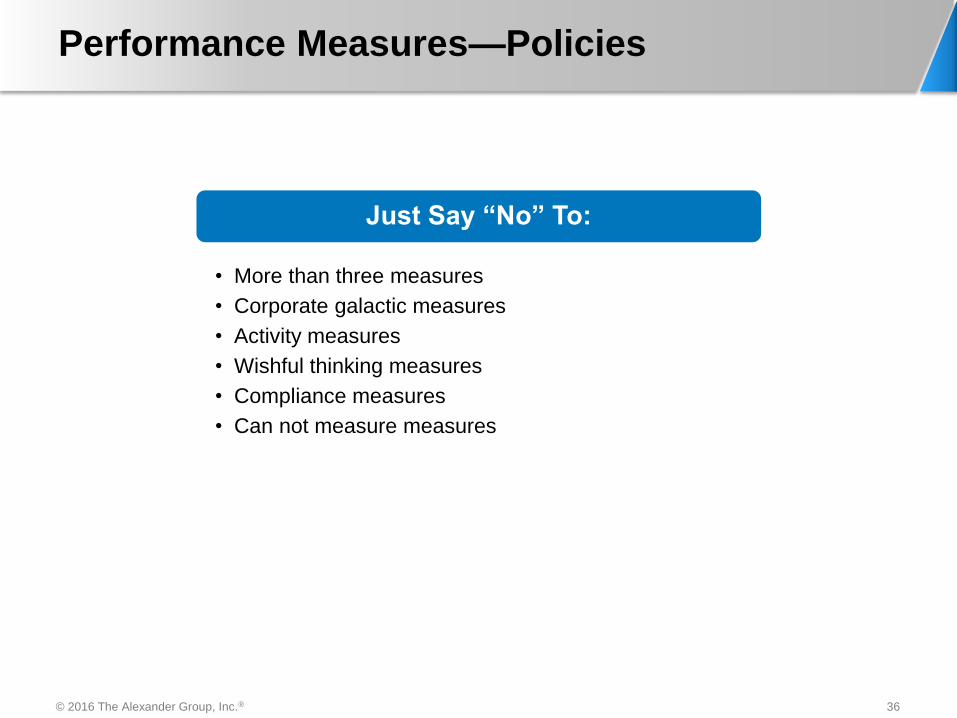
Performance Measures—Policies
Just Say “No” To:
• More than three measures
• Corporate galactic measures
• Activity measures
• Wishful thinking measures
• Compliance measures
• Can not measure measures
36
© 2016 The Alexander Group, Inc.®
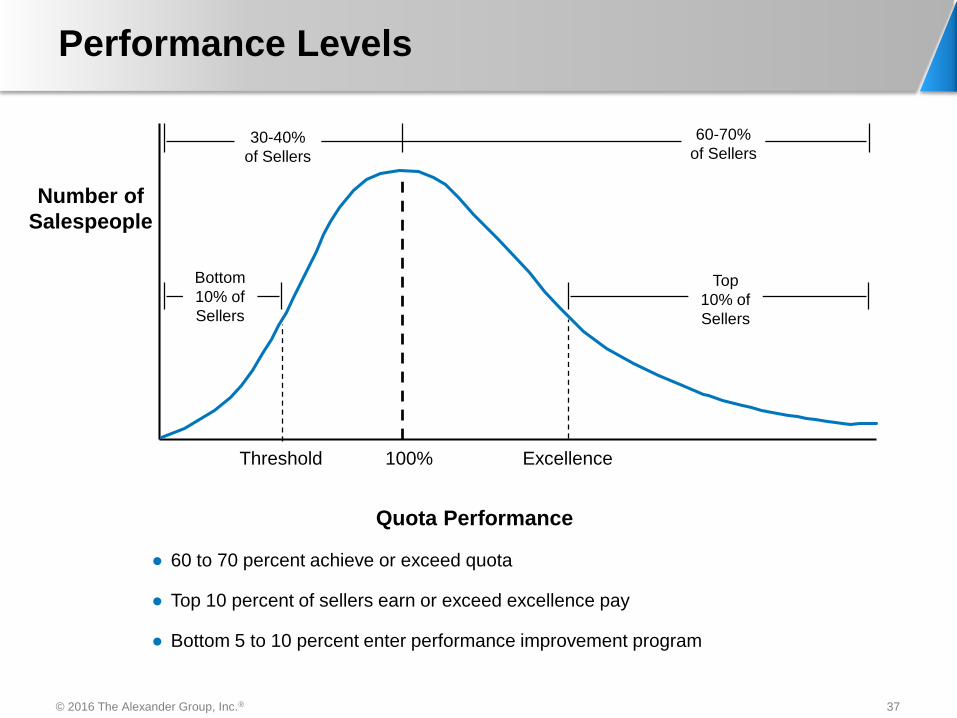
Performance Levels
Threshold 100%
Number of
Salespeople
30-40%
of Sellers
60-70%
of Sellers
Excellence
Top
10% of
Sellers
Quota Performance
● 60 to 70 percent achieve or exceed quota
● Top 10 percent of sellers earn or exceed excellence pay
● Bottom 5 to 10 percent enter performance improvement program
Bottom
10% of
Sellers
37

2017 Getting Started
© 2016 The Alexander Group, Inc.®
2017 Getting Started
Preparing for 2017? Get started with these steps:
Plan Inventory
Market Pay Analysis
Pay/Performance Analysis
Employee Survey
Job Title Rationalization
39
© 2016 The Alexander Group, Inc.®
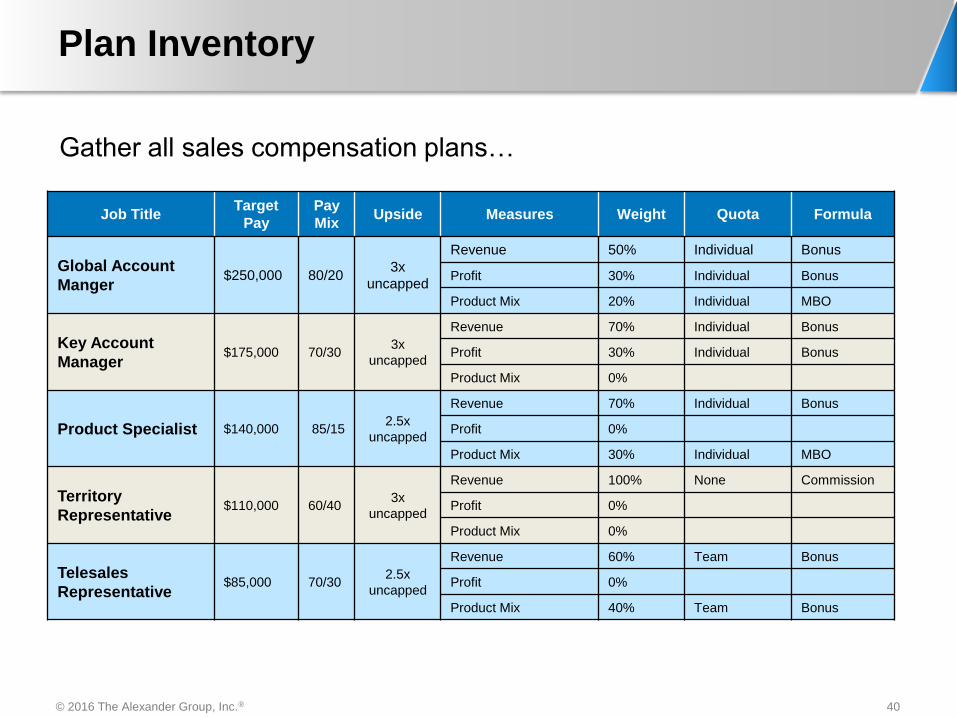
Plan Inventory
Gather all sales compensation plans…
40
Job TitleTarget
Pay
Pay
MixUpside Measures Weight Quota Formula
Global Account
Manger$250,000 80/20
3x
uncapped
Revenue 50% Individual Bonus
Profit 30% Individual Bonus
Product Mix 20% Individual MBO
Key Account
Manager$175,000 70/30
3x
uncapped
Revenue 70% Individual Bonus
Profit 30% Individual Bonus
Product Mix 0%
Product Specialist $140,000 85/152.5x
uncapped
Revenue 70% Individual Bonus
Profit 0%
Product Mix 30% Individual MBO
Territory
Representative$110,000 60/40
3x
uncapped
Revenue 100% None Commission
Profit 0%
Product Mix 0%
Telesales
Representative$85,000 70/30
2.5x
uncapped
Revenue 60% Team Bonus
Profit 0%
Product Mix 40% Team Bonus
© 2016 The Alexander Group, Inc.®
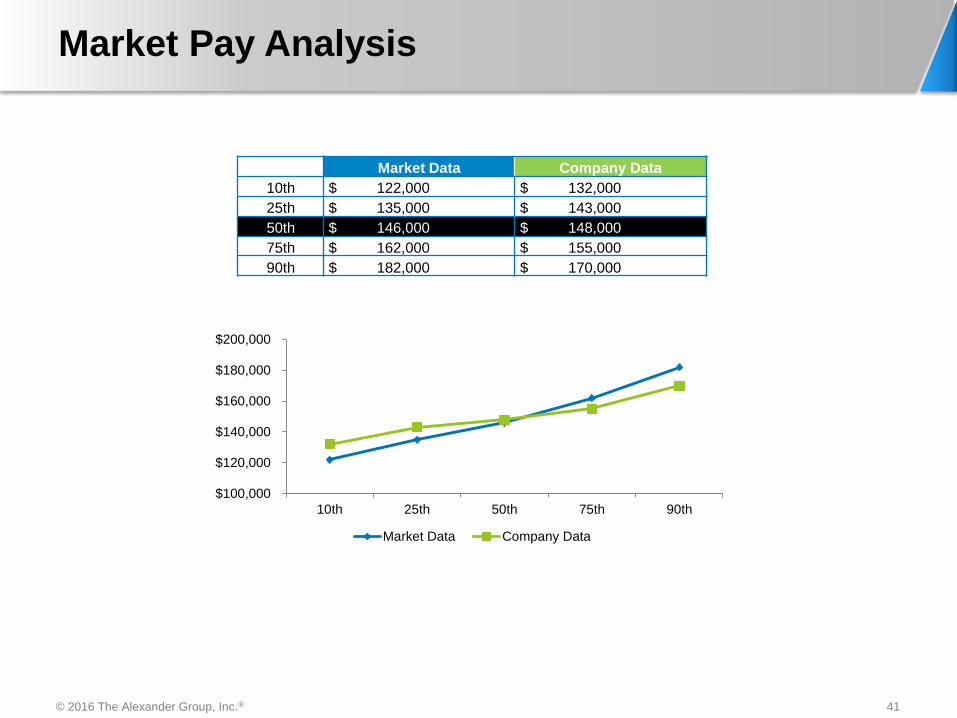
Market Pay Analysis
41
Market Data Company Data
10th $ 122,000 $ 132,000
25th $ 135,000 $ 143,000
50th $ 146,000 $ 148,000
75th $ 162,000 $ 155,000
90th $ 182,000 $ 170,000
$100,000
$120,000
$140,000
$160,000
$180,000
$200,000
10th 25th 50th 75th 90th
Market Data Company Data
© 2016 The Alexander Group, Inc.®
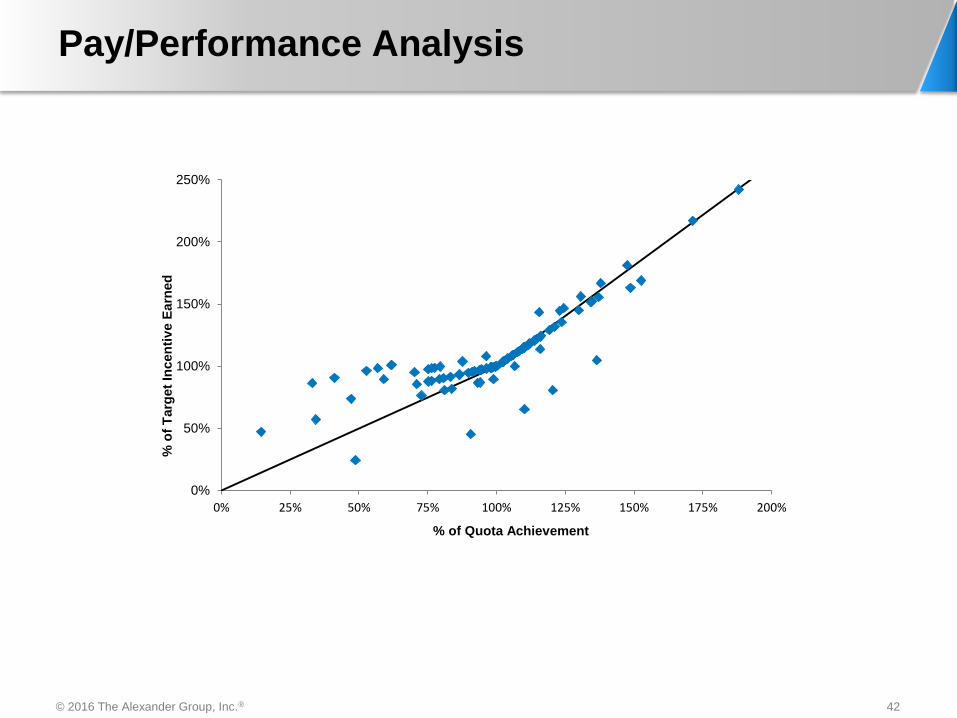
Pay/Performance Analysis
42
0%
50%
100%
150%
200%
250%
0% 25% 50% 75% 100% 125% 150% 175% 200%
% o
f T
arg
et
Incen
tiv
e E
arn
ed
% of Quota Achievement
© 2016 The Alexander Group, Inc.®
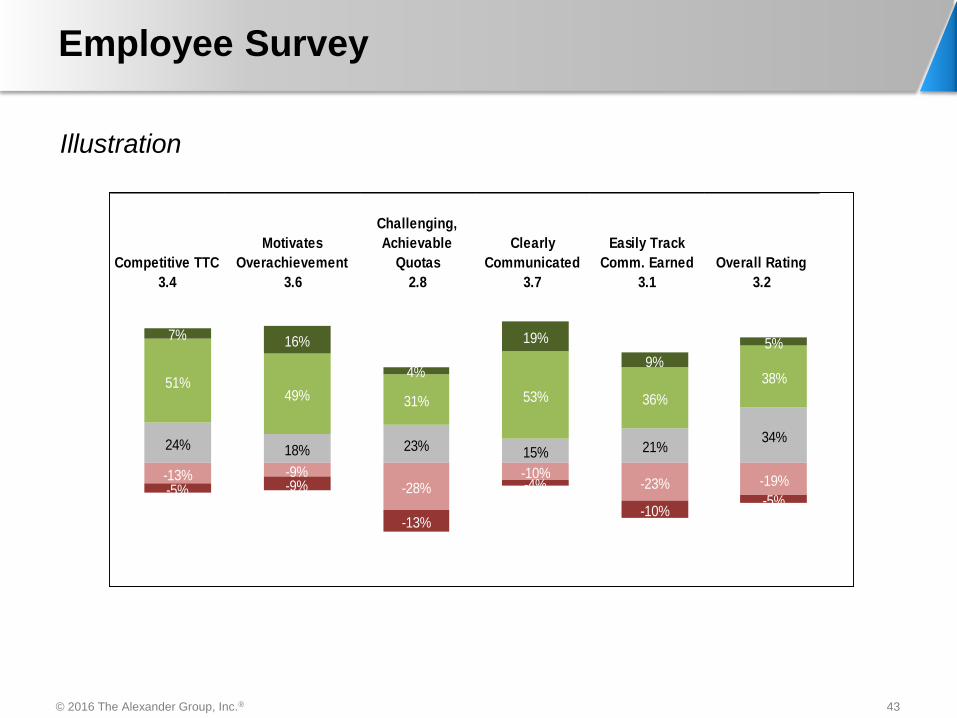
Employee Survey
43
Competitive TTC
Motivates
Overachievement
Challenging,
Achievable
Quotas
Clearly
Communicated
Easily Track
Comm. Earned Overall Rating
3.4 3.6 2.8 3.7 3.1 3.2
24% 18% 23% 15% 21%34%
-13% -9%-28%
-10%-23% -19%
-5% -9%
-13%
-4%
-10%-5%
51%49% 31% 53% 36%
38%
7% 16%
4%
19%
9%
5%
Illustration
© 2016 The Alexander Group, Inc.®
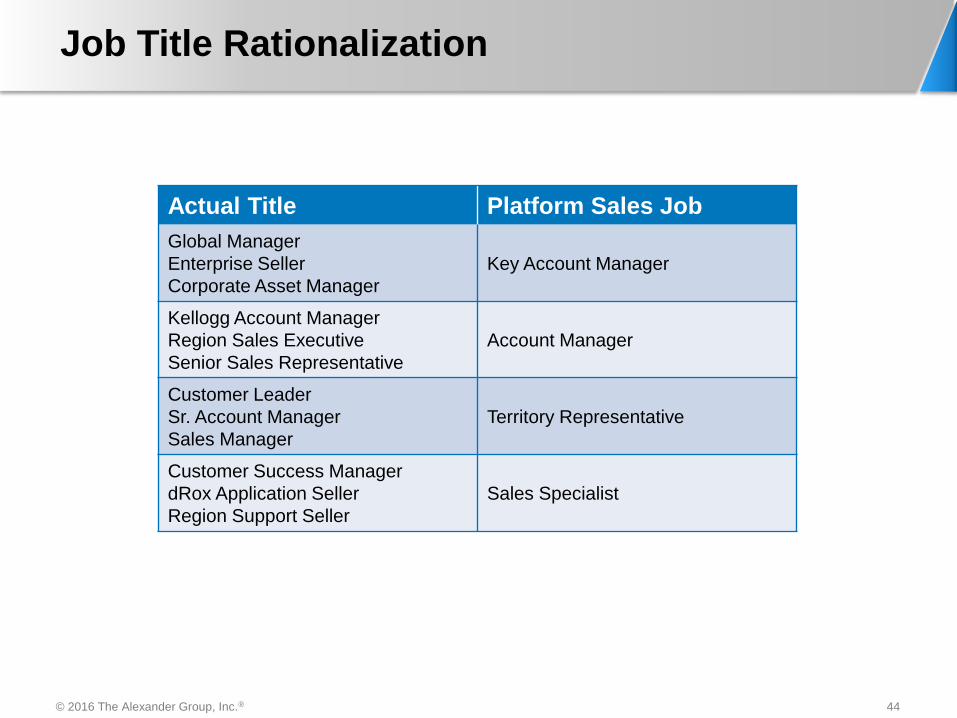
Job Title Rationalization
44
Actual Title Platform Sales Job
Global Manager
Enterprise Seller
Corporate Asset Manager
Key Account Manager
Kellogg Account Manager
Region Sales Executive
Senior Sales Representative
Account Manager
Customer Leader
Sr. Account Manager
Sales Manager
Territory Representative
Customer Success Manager
dRox Application Seller
Region Support Seller
Sales Specialist

You Need An Action Plan…
© 2016 The Alexander Group, Inc.®
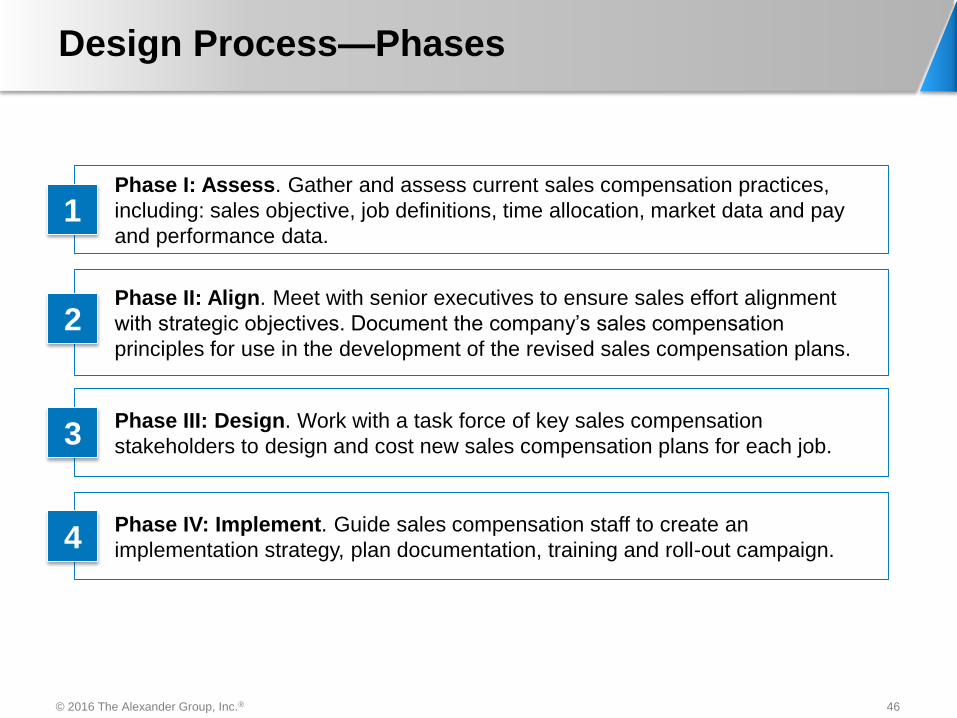
Design Process—Phases
Phase II: Align. Meet with senior executives to ensure sales effort alignment
with strategic objectives. Document the company’s sales compensation
principles for use in the development of the revised sales compensation plans.
2
Phase IV: Implement. Guide sales compensation staff to create an
implementation strategy, plan documentation, training and roll-out campaign. 4
46
Phase III: Design. Work with a task force of key sales compensation
stakeholders to design and cost new sales compensation plans for each job.
Phase I: Assess. Gather and assess current sales compensation practices,
including: sales objective, job definitions, time allocation, market data and pay
and performance data.
3
1
© 2016 The Alexander Group, Inc.®
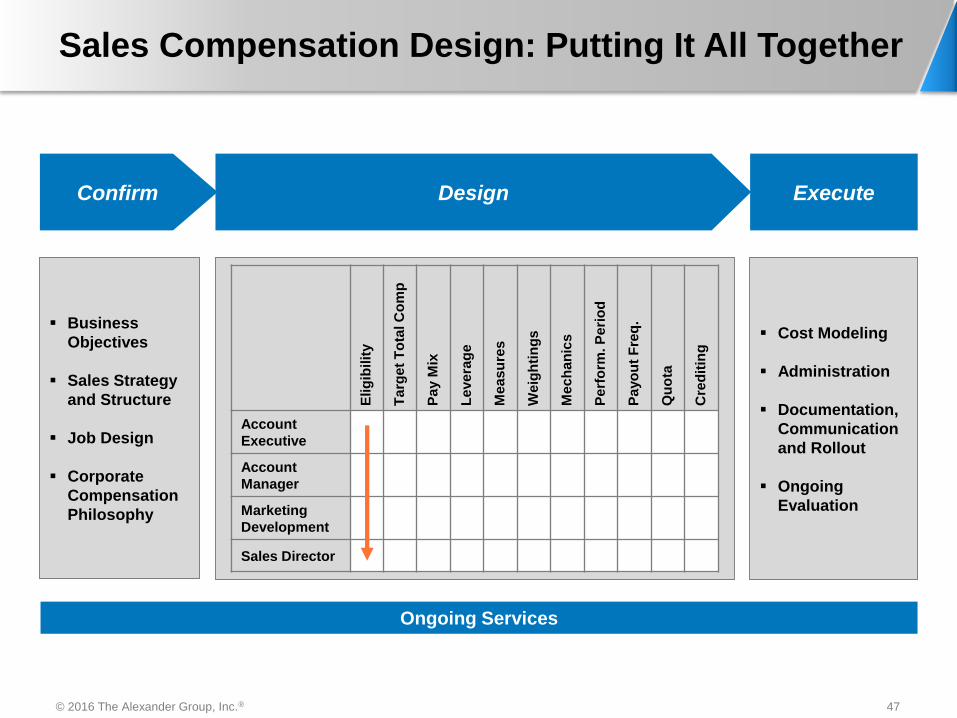
Sales Compensation Design: Putting It All Together
Business
Objectives
Sales Strategy
and Structure
Job Design
Corporate
Compensation
Philosophy
Cost Modeling
Administration
Documentation,
Communication
and Rollout
Ongoing
Evaluation
Confirm Design Execute
Elig
ibilit
y
Ta
rge
t T
ota
l C
om
p
Pa
y M
ix
Le
ve
rag
e
Me
as
ure
s
We
igh
tin
gs
Me
ch
an
ics
Pe
rfo
rm. P
eri
od
Payo
ut
Fre
q.
Qu
ota
Cre
dit
ing
Account
Executive
Account
Manager
Marketing
Development
Sales Director
Ongoing Services
47
© 2016 The Alexander Group, Inc.®
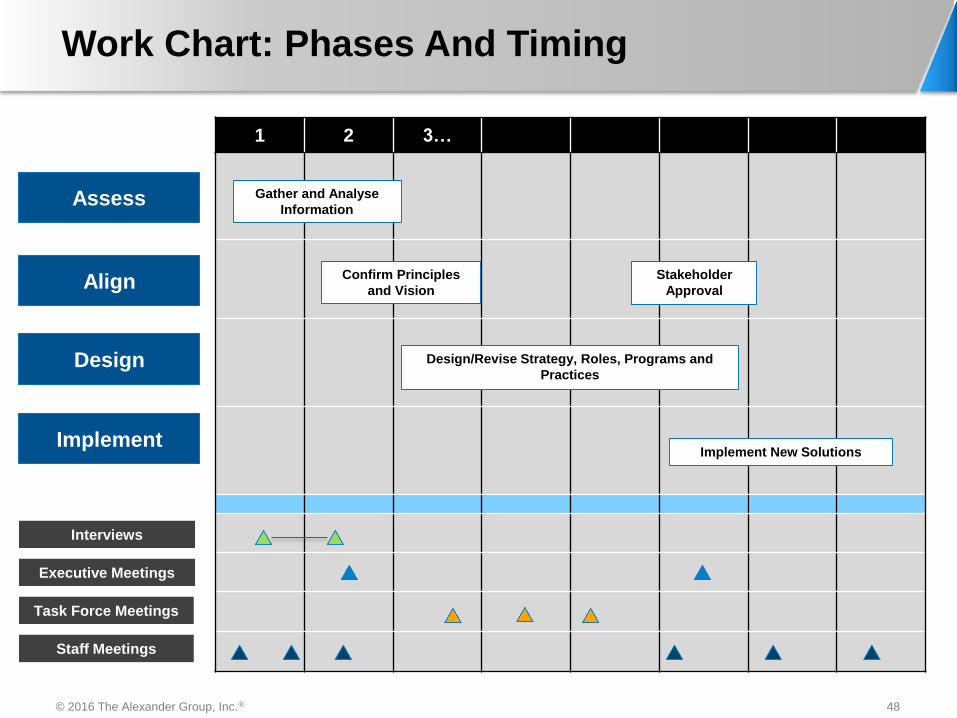
Work Chart: Phases And Timing
1 2 3…
Interviews
Executive Meetings
Task Force Meetings
Staff Meetings
Gather and Analyse
Information
Design/Revise Strategy, Roles, Programs and
Practices
Implement New Solutions
Assess
Align
Design
Implement
Confirm Principles
and Vision
Stakeholder
Approval
48
© 2016 The Alexander Group, Inc.®
Objectives
Confirm that sales compensation plans are prone to
“classic” problems
Highlight key design principles
Show how growth changes the sales force
Present methods to investigate and manage sales
compensation plan health
Suggest a redesign process you can follow
49
Define ICM and SPM
Slide 50© 2016 The Sales Management Association. All rights reserved.
Would you please define ICM and
SPM?
Sales Comp Design
Slide 51© 2016 The Sales Management Association. All rights reserved.
Should we examine what
competitors are doing when we
design our own sales compensation
plans?
Leveraging Data from ICM Systems
Slide 52© 2016 The Sales Management Association. All rights reserved.
Can you give more examples of
how organizations are making use
of data from their ICM systems?
Subscription-based Businesses
Slide 53© 2016 The Sales Management Association. All rights reserved.
Where would I find best practices in
compensation for subscription-based businesses,
where the goal is retention of current purchases
within current accounts, but no cold-calling,
prospecting, or new customer acquisition?
Questions and Discussion
Slide 54© 2016 The Sales Management Association. All rights reserved.
Enter your questions in the
“Questions” box on the right hand
side of the webinar application
window.
Did we run out of time before we got to your
question? Presenters can follow-up with you via
email. Feel free to submit more questions if
you’d like an offline response.
© Copyright 2016 The Sales Management Association
Thank You.