Embed Size (px)
Citation preview
Change the Header field via
>Insert >Header & Footer
1. Check in Footer
2. Fill in field
3. Click ‘Apply to All’
Headline maximum 2 lines
To view drawing guides:
1. Click “View” and select
’Gridlines’ and/or Guides’
Sales & Operations
Planning in ROCKWOOL Martin Middelboe Frederiksen
Supply Chain Development Manager
Group Supply Chain June 2013
Change the Header field via
>Insert >Header & Footer
1. Check in Footer
2. Fill in field
3. Click ‘Apply to All’
Headline maximum 2 lines
To view drawing guides:
1. Click “View” and select
’Gridlines’ and/or Guides’
Subheader - Arial regular size 14
Meeting/Event name – Month date, 2011, Type of event, Country – Arial regular size 8
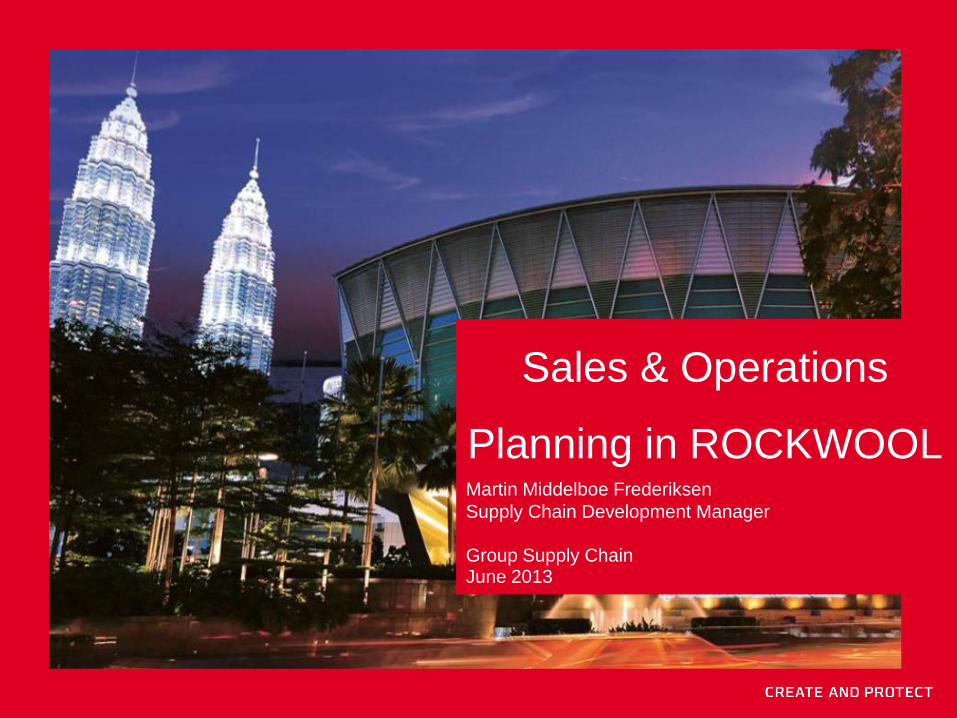
1937 we started
Now we are the world’s leading
producer of stone wool insulation
1,940 million EUR
9,700 employees
26(28) factories worldwide
63% sales in western Europe
Change the Header field via
>Insert >Header & Footer
1. Check in Footer
2. Fill in field
3. Click ‘Apply to All’
Headline maximum 5 lines
Subheader maximum 5 lines
To view drawing guides:
1. Click “View” and select
’Gridlines’ and/or Guides’
Insert picture
Size: H: 16.32 x W: 22.7 cm
Position: 1.35 x 1.37
1. Click on ‘picture icon’
2. Locate the picture and ‘Insert’
3. If you cannot see text in red box:
Right click on picture and
select ‘Send to Back’
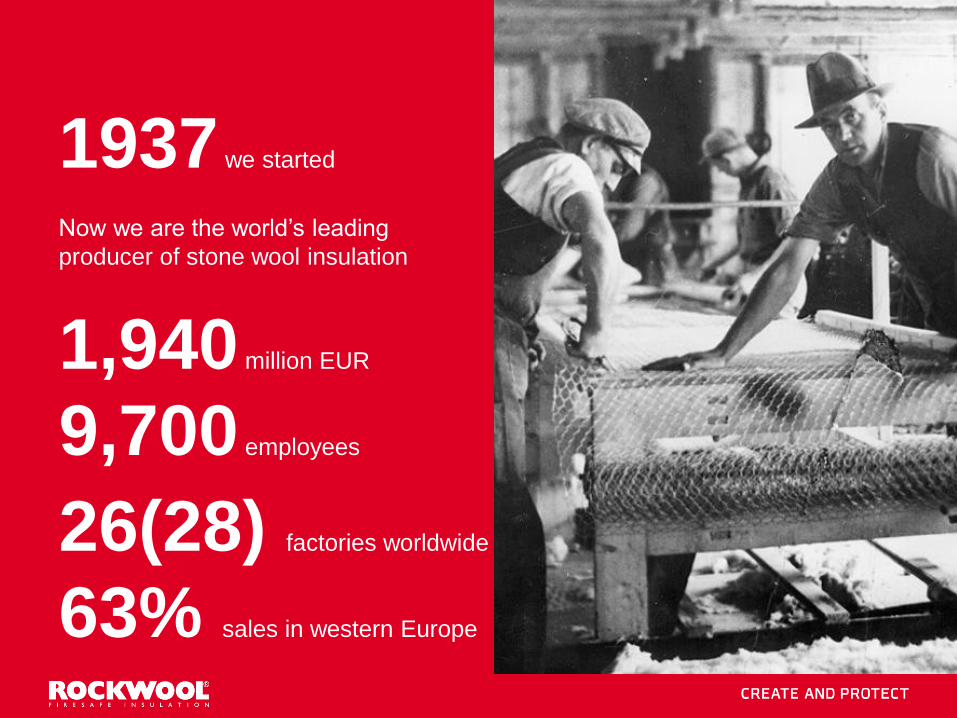
Unrivalled durability Unmatched fire resistance
Superior acoustics Sustainable materials
4 in 1: Our best kept secret
Change the Header field via
>Insert >Header & Footer
1. Check in Footer
2. Fill in field
3. Click ‘Apply to All’
Headline maximum 5 lines
Subheader maximum 5 lines
To view drawing guides:
1. Click “View” and select
’Gridlines’ and/or Guides’
Insert picture
Size: H: 16.32 x W: 22.7 cm
Position: 1.35 x 1.37
1. Click on ‘picture icon’
2. Locate the picture and ‘Insert’
3. If you cannot see text in red box:
Right click on picture and
select ‘Send to Back’
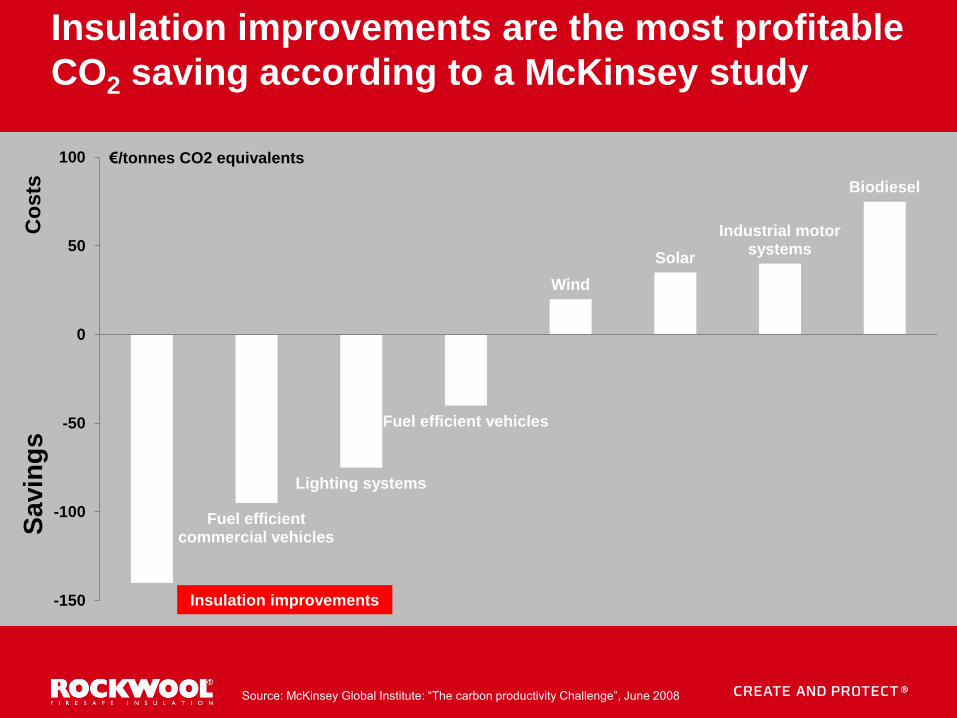
Source: McKinsey Global Institute: “The carbon productivity Challenge”, June 2008
Insulation improvements are the most profitable
CO2 saving according to a McKinsey study
Fuel efficient commercial vehicles
Lighting systems
Fuel efficient vehicles
Wind
Solar
Industrial motor systems
Biodiesel
-150
-100
-50
0
50
100
Insulation improvements
€/tonnes CO2 equivalents
Co
sts
S
avin
gs
Change the Header field via
>Insert >Header & Footer
1. Check in Footer
2. Fill in field
3. Click ‘Apply to All’
Headline maximum 2 lines
To view drawing guides:
1. Click “View” and select
’Gridlines’ and/or Guides’
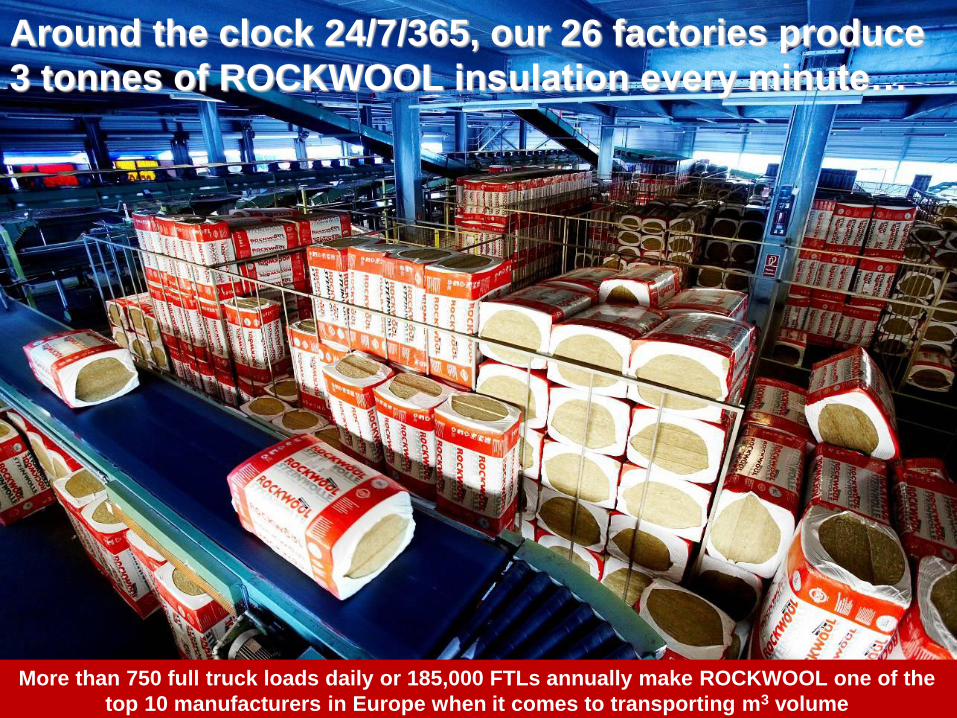
Around the clock 24/7/365, our 26 factories produce
3 tonnes of ROCKWOOL insulation every minute…
More than 750 full truck loads daily or 185,000 FTLs annually make ROCKWOOL one of the
top 10 manufacturers in Europe when it comes to transporting m3 volume
Change the Header field via
>Insert >Header & Footer
1. Check in Footer
2. Fill in field
3. Click ‘Apply to All’
Headline maximum 2 lines
To view drawing guides:
1. Click “View” and select
’Gridlines’ and/or Guides’
Subheader maximum 1 line
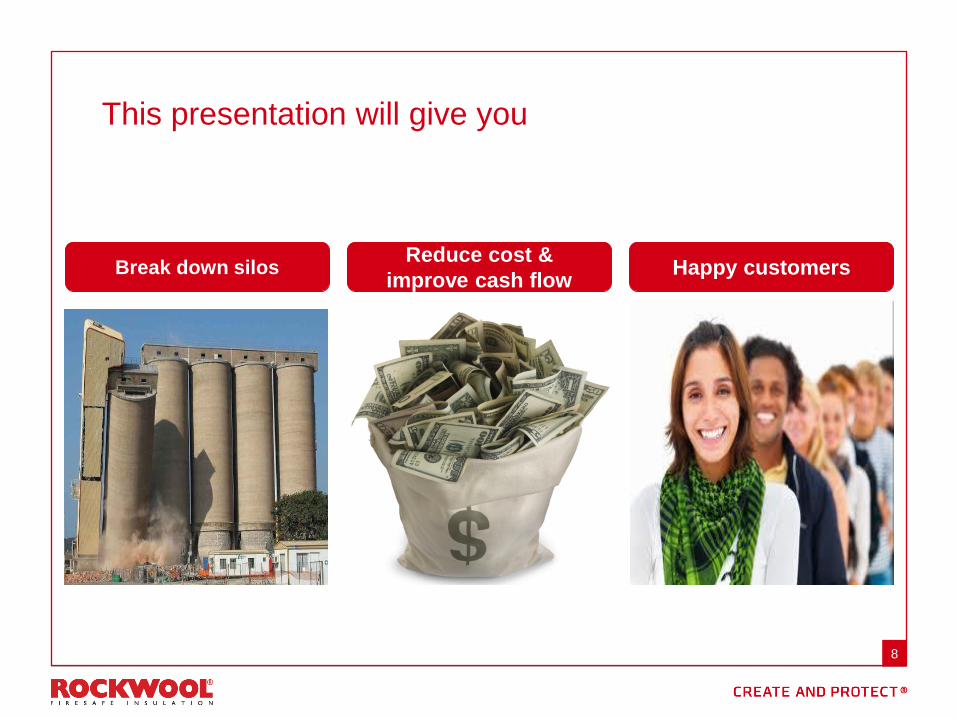
This presentation will give you
8
Break down silos Reduce cost &
improve cash flow Happy customers

Change the Header field via
>Insert >Header & Footer
1. Check in Footer
2. Fill in field
3. Click ‘Apply to All’
Headline maximum 2 lines
To view drawing guides:
1. Click “View” and select
’Gridlines’ and/or Guides’
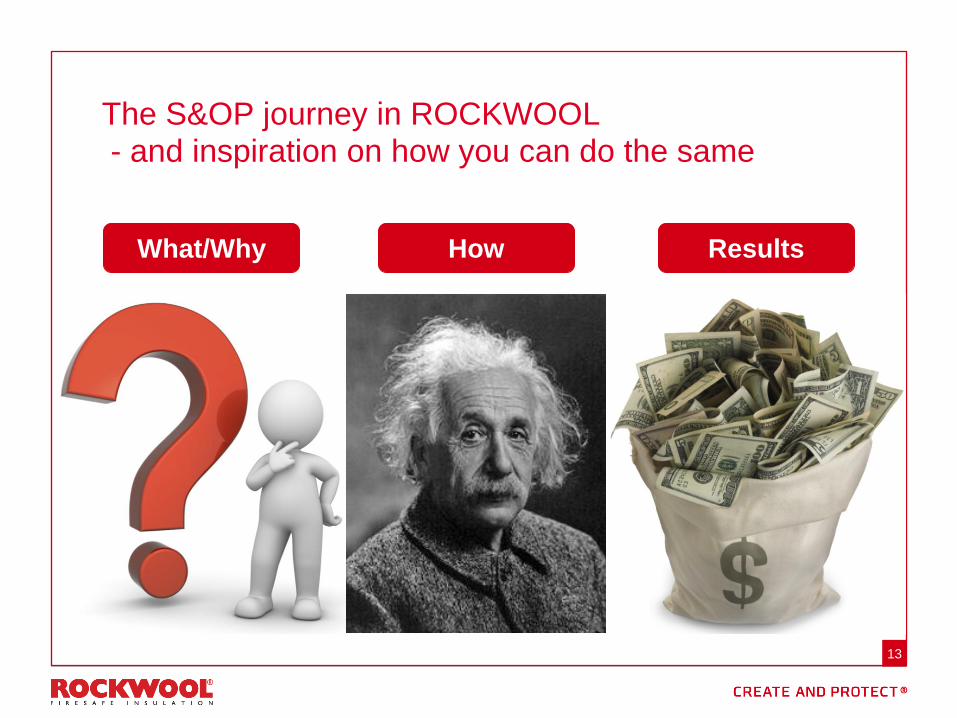
The S&OP journey in ROCKWOOL - and inspiration on how you can do the same
9
What/Why How Results
Change the Header field via
>Insert >Header & Footer
1. Check in Footer
2. Fill in field
3. Click ‘Apply to All’
Headline maximum 2 lines
To view drawing guides:
1. Click “View” and select
’Gridlines’ and/or Guides’
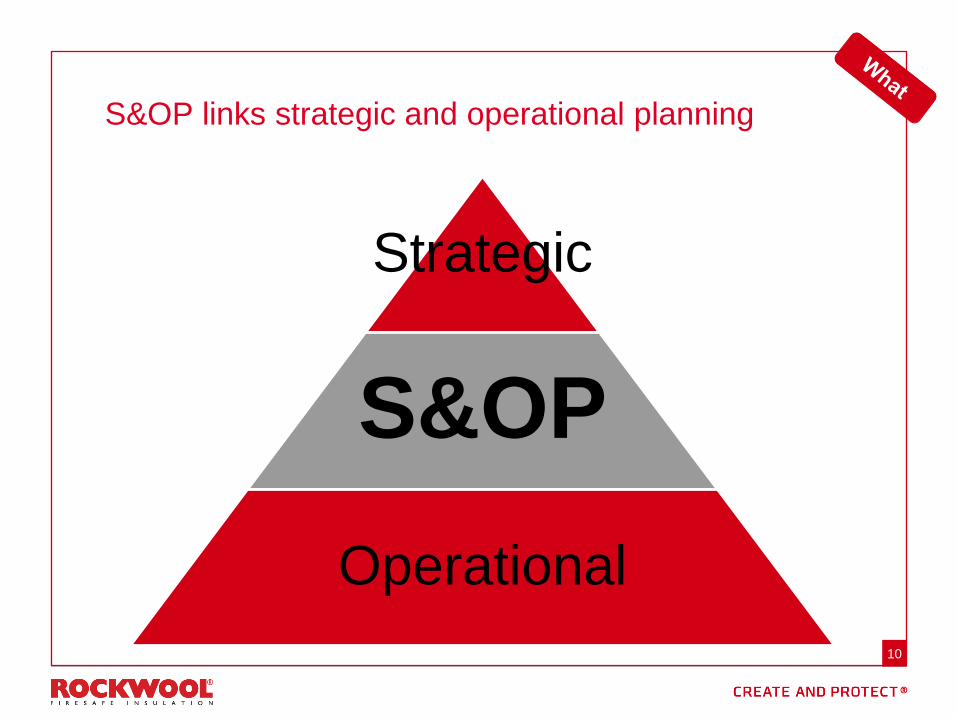
S&OP links strategic and operational planning
10
Strategic
S&OP
Operational
Change the Header field via
>Insert >Header & Footer
1. Check in Footer
2. Fill in field
3. Click ‘Apply to All’
Headline maximum 2 lines
To view drawing guides:
1. Click “View” and select
’Gridlines’ and/or Guides’
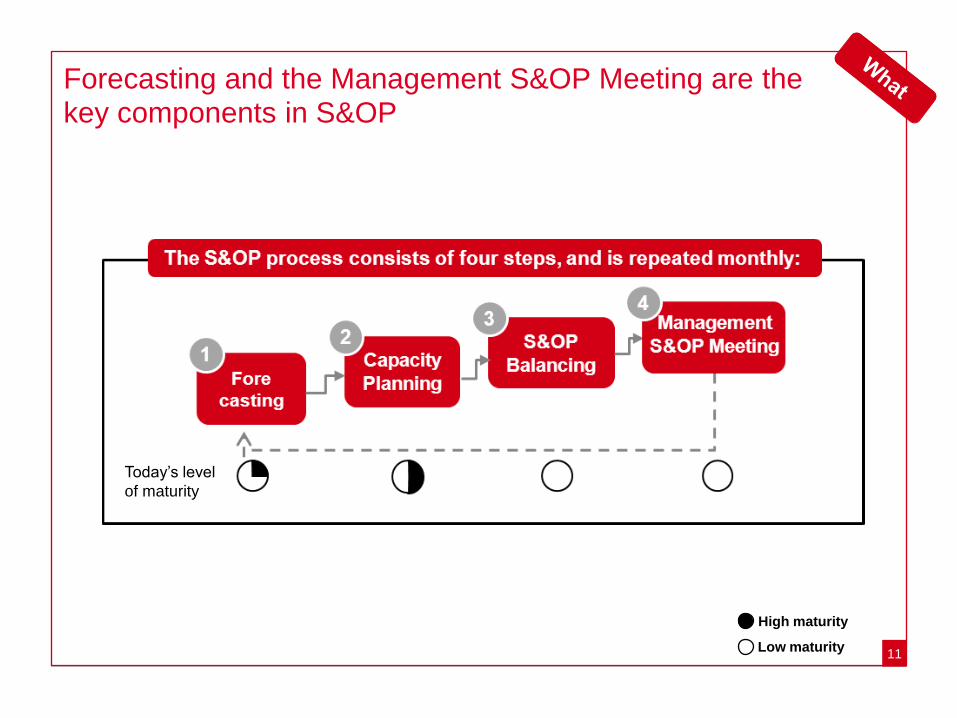
Forecasting and the Management S&OP Meeting are the key components in S&OP
11
Today’s level
of maturity
High maturity
Low maturity
Change the Header field via
>Insert >Header & Footer
1. Check in Footer
2. Fill in field
3. Click ‘Apply to All’
Headline maximum 2 lines
To view drawing guides:
1. Click “View” and select
’Gridlines’ and/or Guides’
12
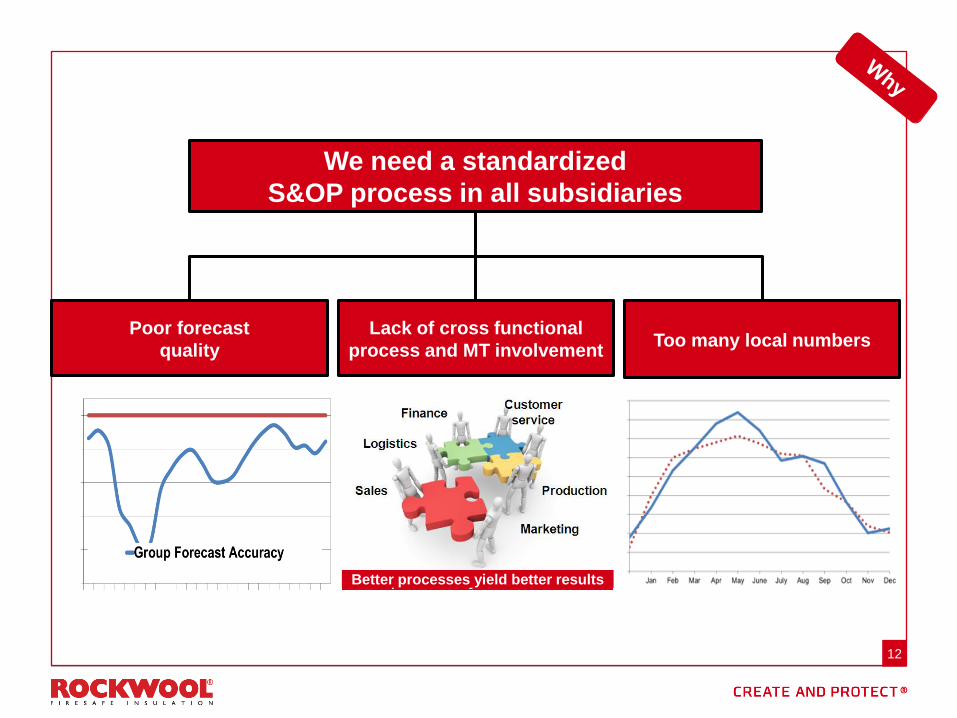
We need a standardized
S&OP process in all subsidiaries
Poor forecast
quality
Lack of cross functional
process and MT involvement Too many local numbers
Better processes yield better results
Change the Header field via
>Insert >Header & Footer
1. Check in Footer
2. Fill in field
3. Click ‘Apply to All’
Headline maximum 2 lines
To view drawing guides:
1. Click “View” and select
’Gridlines’ and/or Guides’
The S&OP journey in ROCKWOOL - and inspiration on how you can do the same
13
What/Why How Results
Change the Header field via
>Insert >Header & Footer
1. Check in Footer
2. Fill in field
3. Click ‘Apply to All’
Headline maximum 2 lines
To view drawing guides:
1. Click “View” and select
’Gridlines’ and/or Guides’
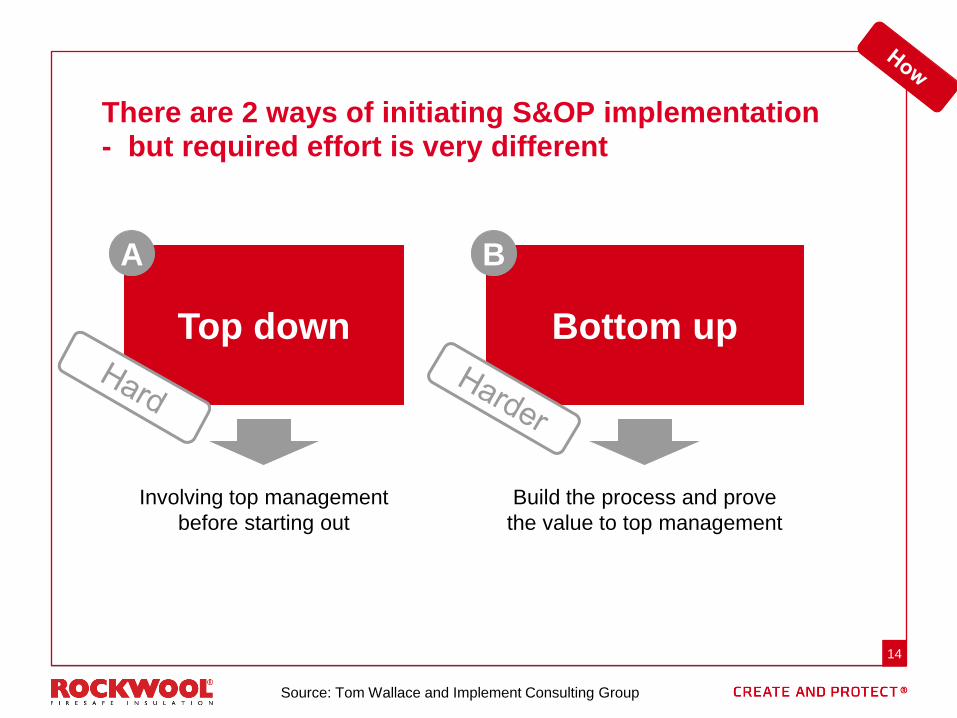
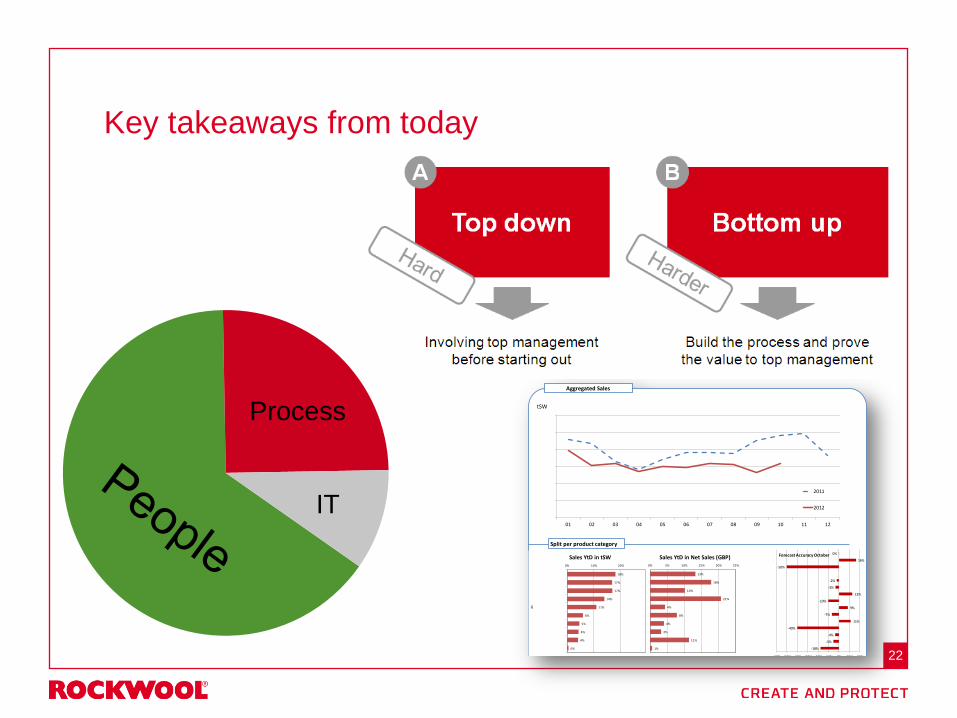
There are 2 ways of initiating S&OP implementation - but required effort is very different
14
Top down
A
Bottom up
B
Involving top management
before starting out
Build the process and prove
the value to top management
Source: Tom Wallace and Implement Consulting Group
Change the Header field via
>Insert >Header & Footer
1. Check in Footer
2. Fill in field
3. Click ‘Apply to All’
Headline maximum 2 lines
To view drawing guides:
1. Click “View” and select
’Gridlines’ and/or Guides’
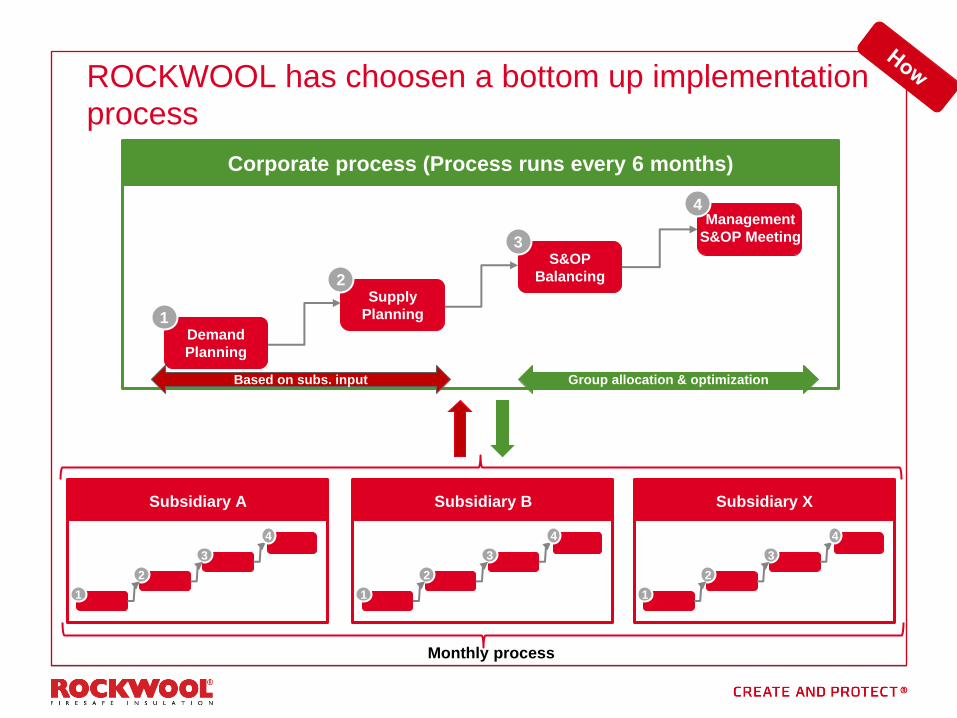
ROCKWOOL has choosen a bottom up implementation process
1
2
3
4
Subsidiary A
1
2
3
4
Subsidiary B
1
2
3
4
Subsidiary X
Corporate process (Process runs every 6 months)
Demand
Planning
1
Supply
Planning
2
S&OP
Balancing
3
4 Management
S&OP Meeting
Based on subs. input Group allocation & optimization
Monthly process
16
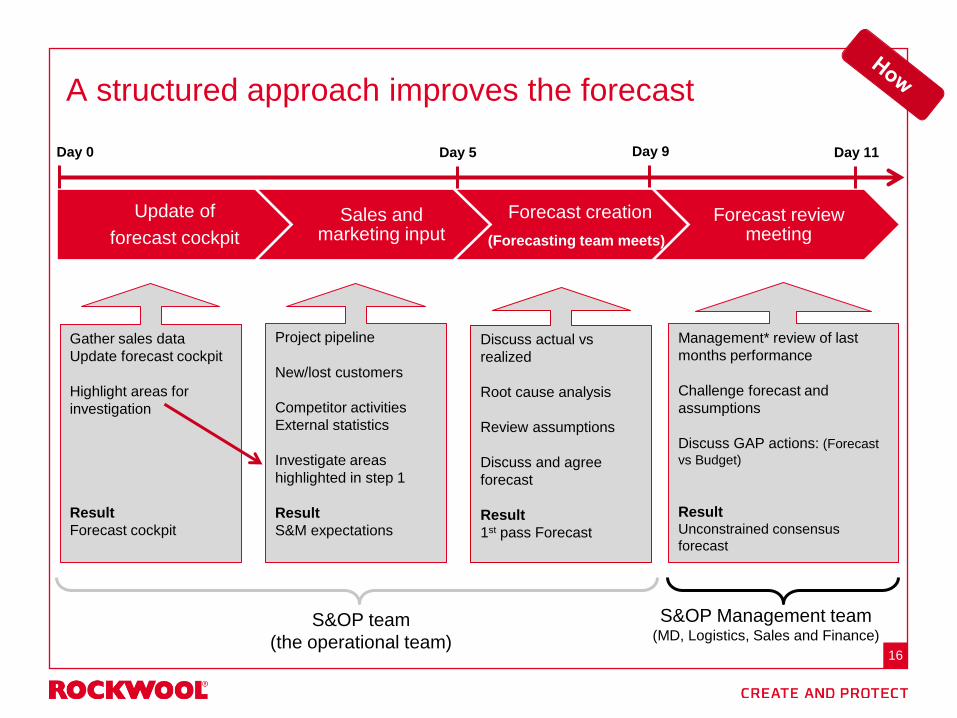
Update of
forecast cockpit
Sales and marketing input
Forecast creation
Forecast review meeting
A structured approach improves the forecast
Gather sales data
Update forecast cockpit
Highlight areas for
investigation
Result
Forecast cockpit
Project pipeline
New/lost customers
Competitor activities
External statistics
Investigate areas
highlighted in step 1
Result
S&M expectations
Management* review of last
months performance
Challenge forecast and
assumptions
Discuss GAP actions: (Forecast
vs Budget)
Result Unconstrained consensus
forecast
Day 0 Day 5
(Forecasting team meets)
Day 9 Day 11
S&OP Management team (MD, Logistics, Sales and Finance)
S&OP team
(the operational team)
Discuss actual vs
realized
Root cause analysis
Review assumptions
Discuss and agree
forecast
Result
1st pass Forecast
Change the Header field via
>Insert >Header & Footer
1. Check in Footer
2. Fill in field
3. Click ‘Apply to All’
Headline maximum 2 lines
To view drawing guides:
1. Click “View” and select
’Gridlines’ and/or Guides’
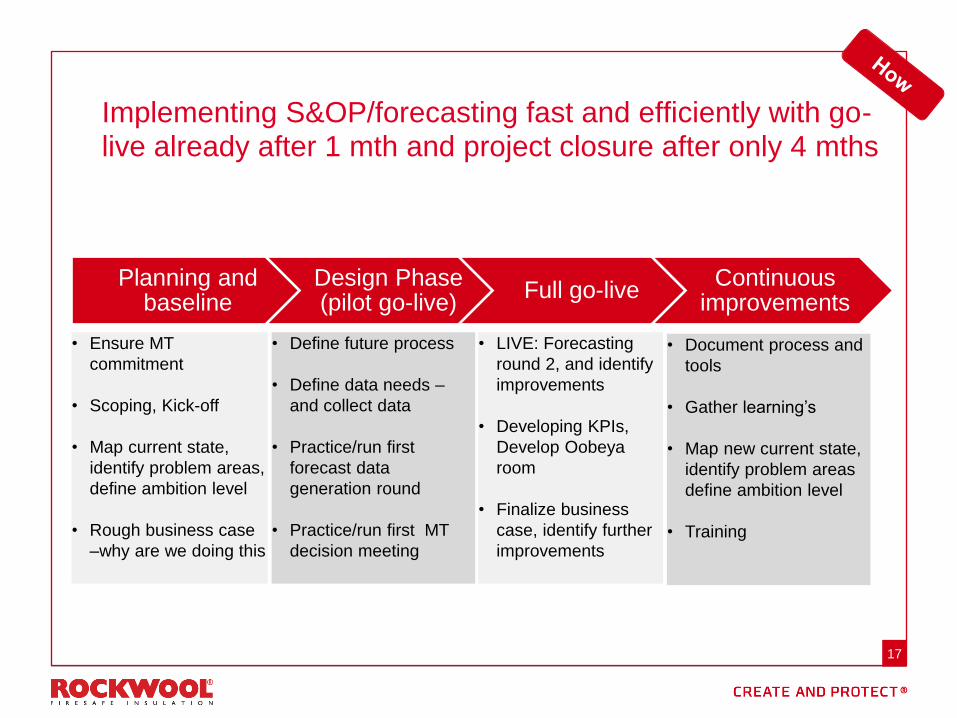
Implementing S&OP/forecasting fast and efficiently with go-live already after 1 mth and project closure after only 4 mths
17
Planning and baseline
Design Phase (pilot go-live)
Full go-live Continuous
improvements
• Ensure MT
commitment
• Scoping, Kick-off
• Map current state,
identify problem areas,
define ambition level
• Rough business case
–why are we doing this
• Define future process
• Define data needs –
and collect data
• Practice/run first
forecast data
generation round
• Practice/run first MT
decision meeting
• LIVE: Forecasting
round 2, and identify
improvements
• Developing KPIs,
Develop Oobeya
room
• Finalize business
case, identify further
improvements
• Document process and
tools
• Gather learning’s
• Map new current state,
identify problem areas
define ambition level
• Training

Change the Header field via
>Insert >Header & Footer
1. Check in Footer
2. Fill in field
3. Click ‘Apply to All’
Headline maximum 2 lines
To view drawing guides:
1. Click “View” and select
’Gridlines’ and/or Guides’
The S&OP journey in ROCKWOOL - and inspiration on how you can do the same
18
What/Why How Results
19
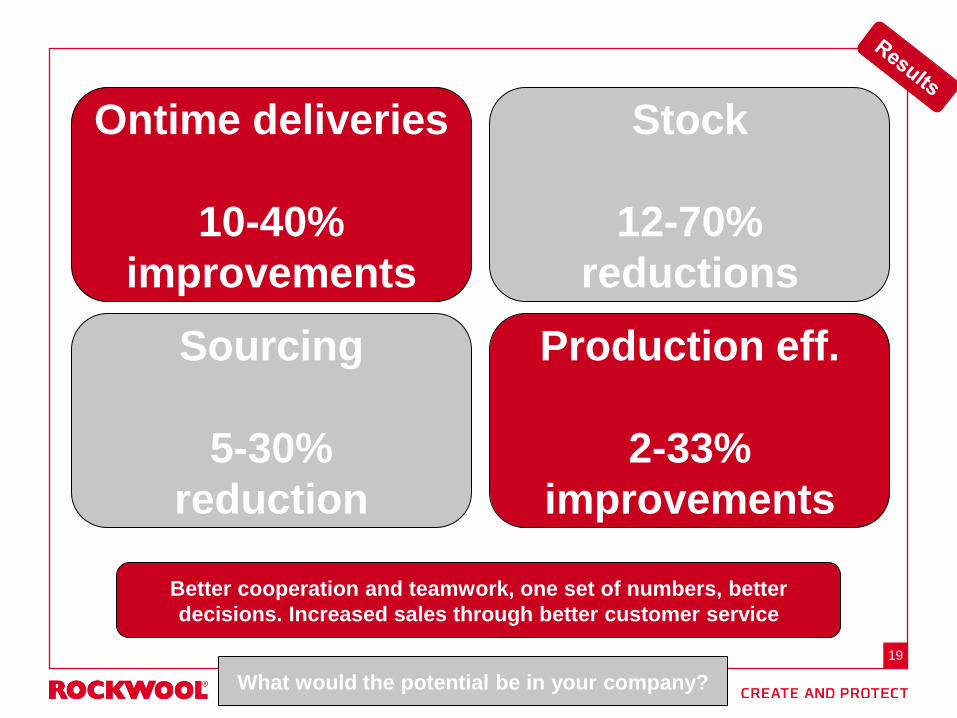
Ontime deliveries
10-40%
improvements
Sourcing
5-30%
reduction
Stock
12-70%
reductions
Production eff.
2-33%
improvements
What would the potential be in your company?
Better cooperation and teamwork, one set of numbers, better
decisions. Increased sales through better customer service
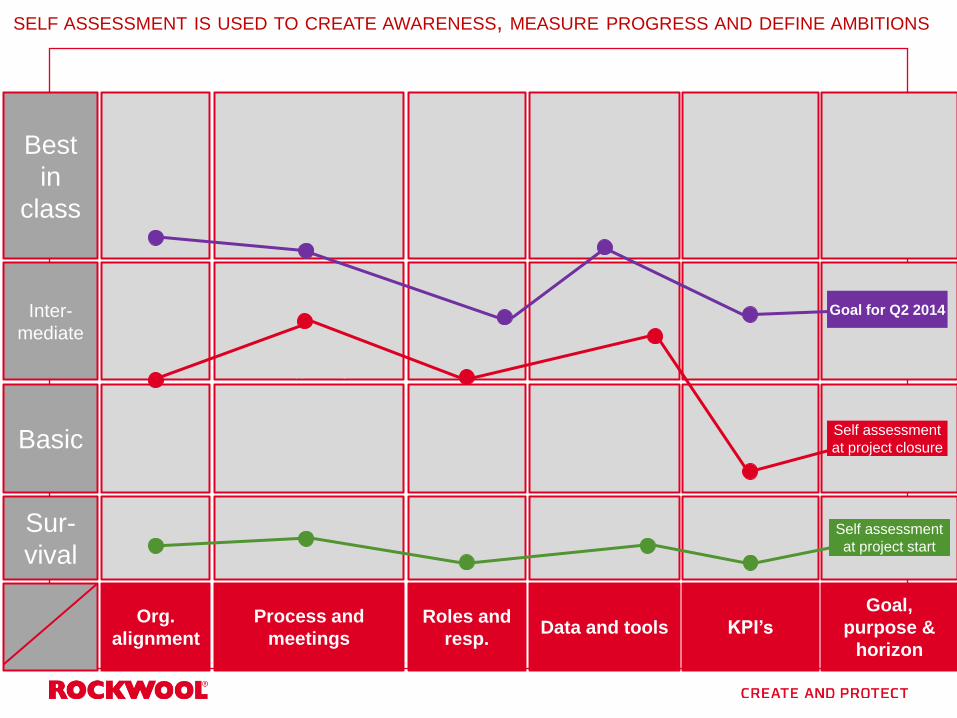
20
2
0
Data and tools Org.
alignment
Goal,
purpose &
horizon
Process and
meetings
Sur-
vival
Basic
Inter-
mediate
Best
in
class
Fire fighting
Horizon: Short
Below 3 months
No standardization, tools
are ”developed for each
issue”
Local tools for every
department
No defined process
Ad hoc meetings and participants
Agenda is ”developed for each
issue”
No coordination of
forecast across
the company
Several local
forecasts exists
Used for short term
decisions on production
capacity
Horizon: min 3mths
ahead (rolling)
Manual data extraction and
ad hoc analysis
Formal meetings to discuss and
challenge forecast exists
Defined process but “grey” areas
still exists
Some MT members are
participating in a sign off meeting
Internal alignment
on forecast figures
between sales
and operation
Forecast is used to
proactively manage
capacity utilization
(increase/dec. shift)
and
Plan seasonal inventory
Horizon: 12mths
ahead (rolling)
Automatic data extraction
OnePagers used for
analysis
Forecast scenario handling
possible
Fixed monthly formal meetings,
fixed agenda. Timing is aligned
with MT meetings and other
important deadlines
Key conclusions and actions are
documented
Forecast is approved by full MT
Collaboration
between finance,
sales and
operation
One set of
numbers
(confindence in
the forecast)
Optimize profit and
cash flow
Timing of investments
long term sourcing
Horizon: 18mths
ahead (rolling)
100% Integrated tools
(datawarehouse, planning
and finance)
Financial optimization and
scenario analysis possible
Fixed monthly formal meetings with
fixed agenda. Timing is aligned
with MT meetings and other
important deadlines
short weekly review.
Key conclusions and actions are
documented
Forecast is approved by full MT
and important external partners are
involved
Team is working
towards a
common goal
Cross
organisation
collaboration
including R&D,
HR etc
KPI’s
Sporadically:
Sales vs budget
Lagging KPI’s,
such as forecast
error/accuracy and
forecast bias
Mix of lagging and
behavioural KPI’s
KPIs are linked to
customer service and
financial impact
Mix of leading (e.g.
building permits) and
lagging KPI’s plus mix of
behavioural and result
KPI’s
KPIs are linked to Risk,
customer service and
financial impact
Roles and
resp.
No defined roles
and responsibilities
Roles and
responsibilities
formally defined
Roles and
responsibilities
formally defined
Sales own forecast
Clear owner of
entire process
Roles and
responsibilities
formally defined
Sales own forecast
Clear owner of
entire process
Self assessment
at project start
Self assessment
at project closure
Goal for Q2 2014
SELF ASSESSMENT IS USED TO CREATE AWARENESS, MEASURE PROGRESS AND DEFINE AMBITIONS
21
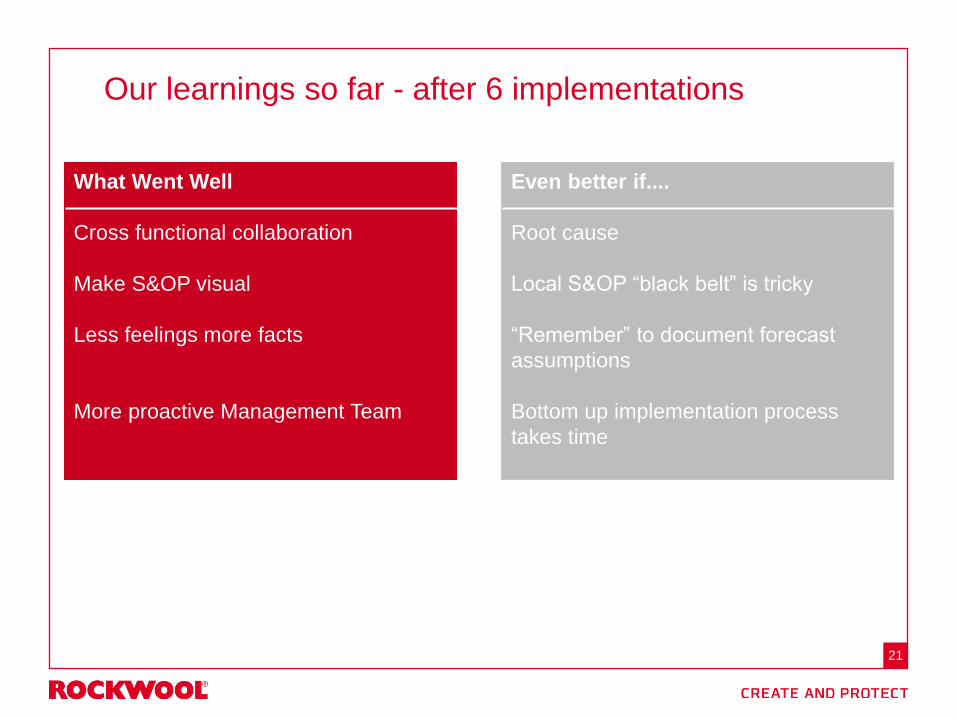
Our learnings so far - after 6 implementations
What Went Well
Cross functional collaboration
Make S&OP visual
Less feelings more facts
More proactive Management Team
Even better if....
Root cause
Local S&OP “black belt” is tricky
“Remember” to document forecast
assumptions
Bottom up implementation process
takes time
22
Key takeaways from today
Process
IT
Aggregated Sales
-
2.000
4.000
6.000
8.000
10.000
12.000
01 02 03 04 05 06 07 08 09 10 11 12
2011
2012
tSW
0%
4%
4%
5%
6%
11%
14%
17%
17%
18%
0% 10% 20%
Retail Products
HVAC
Roofing
Scheme Roll
Fire Protection
Granulate Products
External Wall
Panels
General Building
Slab Products
Sales YtD in tSW
1%
11%
3%
4%
8%
4%
21%
10%
18%
13%
0% 5% 10% 15% 20% 25%
Sales YtD in Net Sales (GBP)
Split per product category
Comments
-18%
-5%
-4%
-40%
11%
-7%
9%
-10%
13%
-3%
-2%
-50%
16%
0%
-60% -50% -40% -30% -20% -10% 0% 10% 20%
Retail Products
HVAC
Roofing
Scheme Roll
Fire Protection
Granulate Products
External Wall
Panels
General Building
Slab Products
Ireland
Ireland Panels
Ireland RTI
RTI Sales
Home Forecast Accuracy October
23
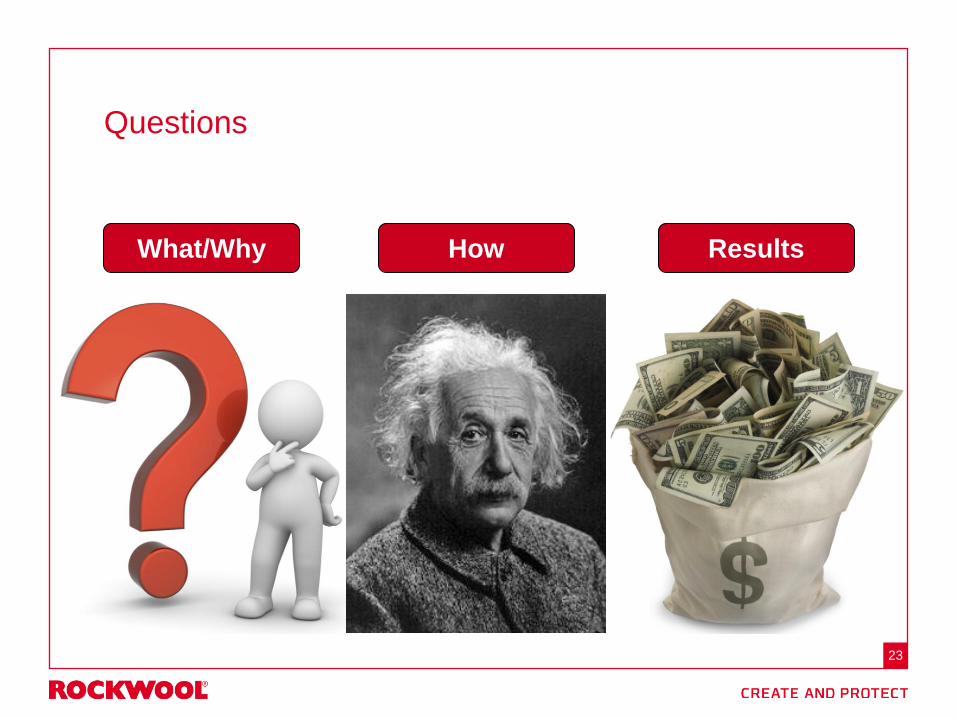
Questions
What/Why How Results