Embed Size (px)
Citation preview

Sally Beauty Holdings, Inc. Overview
December 2015 Fiscal year-end 2015
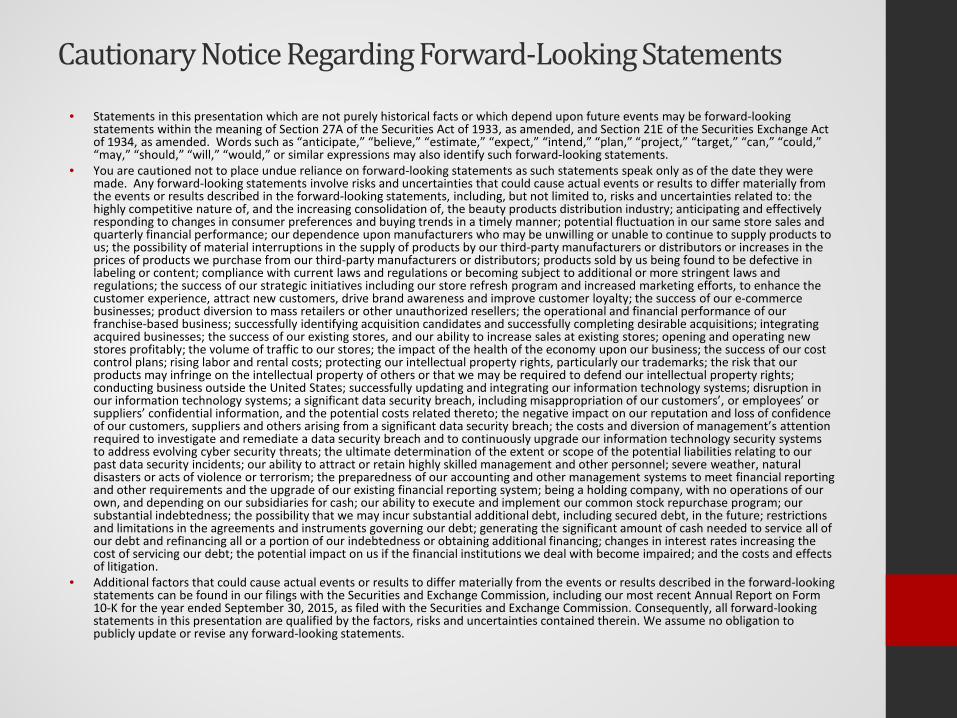
Cautionary Notice Regarding Forward-Looking Statements
• Statements in this presentation which are not purely historical facts or which depend upon future events may be forward-looking
statements within the meaning of Section 27A of the Securities Act of 1933, as amended, and Section 21E of the Securities Exchange Act of 1934, as amended. Words such as “anticipate,” “believe,” “estimate,” “expect,” “intend,” “plan,” “project,” “target,” “can,” “could,” “may,” “should,” “will,” “would,” or similar expressions may also identify such forward-looking statements.
• You are cautioned not to place undue reliance on forward-looking statements as such statements speak only as of the date they were made. Any forward-looking statements involve risks and uncertainties that could cause actual events or results to differ materially from the events or results described in the forward-looking statements, including, but not limited to, risks and uncertainties related to: the highly competitive nature of, and the increasing consolidation of, the beauty products distribution industry; anticipating and effectively responding to changes in consumer preferences and buying trends in a timely manner; potential fluctuation in our same store sales and quarterly financial performance; our dependence upon manufacturers who may be unwilling or unable to continue to supply products to us; the possibility of material interruptions in the supply of products by our third-party manufacturers or distributors or increases in the prices of products we purchase from our third-party manufacturers or distributors; products sold by us being found to be defective in labeling or content; compliance with current laws and regulations or becoming subject to additional or more stringent laws and regulations; the success of our strategic initiatives including our store refresh program and increased marketing efforts, to enhance the customer experience, attract new customers, drive brand awareness and improve customer loyalty; the success of our e-commerce businesses; product diversion to mass retailers or other unauthorized resellers; the operational and financial performance of our franchise-based business; successfully identifying acquisition candidates and successfully completing desirable acquisitions; integrating acquired businesses; the success of our existing stores, and our ability to increase sales at existing stores; opening and operating new stores profitably; the volume of traffic to our stores; the impact of the health of the economy upon our business; the success of our cost control plans; rising labor and rental costs; protecting our intellectual property rights, particularly our trademarks; the risk that our products may infringe on the intellectual property of others or that we may be required to defend our intellectual property rights; conducting business outside the United States; successfully updating and integrating our information technology systems; disruption in our information technology systems; a significant data security breach, including misappropriation of our customers’, or employees’ or suppliers’ confidential information, and the potential costs related thereto; the negative impact on our reputation and loss of confidence of our customers, suppliers and others arising from a significant data security breach; the costs and diversion of management’s attention required to investigate and remediate a data security breach and to continuously upgrade our information technology security systems to address evolving cyber security threats; the ultimate determination of the extent or scope of the potential liabilities relating to our past data security incidents; our ability to attract or retain highly skilled management and other personnel; severe weather, natural disasters or acts of violence or terrorism; the preparedness of our accounting and other management systems to meet financial reporting and other requirements and the upgrade of our existing financial reporting system; being a holding company, with no operations of our own, and depending on our subsidiaries for cash; our ability to execute and implement our common stock repurchase program; our substantial indebtedness; the possibility that we may incur substantial additional debt, including secured debt, in the future; restrictions and limitations in the agreements and instruments governing our debt; generating the significant amount of cash needed to service all of our debt and refinancing all or a portion of our indebtedness or obtaining additional financing; changes in interest rates increasing the cost of servicing our debt; the potential impact on us if the financial institutions we deal with become impaired; and the costs and effects of litigation.
• Additional factors that could cause actual events or results to differ materially from the events or results described in the forward-looking statements can be found in our filings with the Securities and Exchange Commission, including our most recent Annual Report on Form 10-K for the year ended September 30, 2015, as filed with the Securities and Exchange Commission. Consequently, all forward-looking statements in this presentation are qualified by the factors, risks and uncertainties contained therein. We assume no obligation to publicly update or revise any forward-looking statements.

Company Highlights
Sally Beauty Holdings is a leading international specialty retailer and distributor of professional beauty products
Annual consolidated sales of over $3.8 billion
Strong cash flow generation
Approximately 4,967 stores located in 13 countries (1)
Industry leading position with ~33% channel share
Proven resilience in recessionary cycles
Well-positioned for long-term growth
Two distinct business segments
(1) As of September 30, 2015, fiscal year end 2015 .
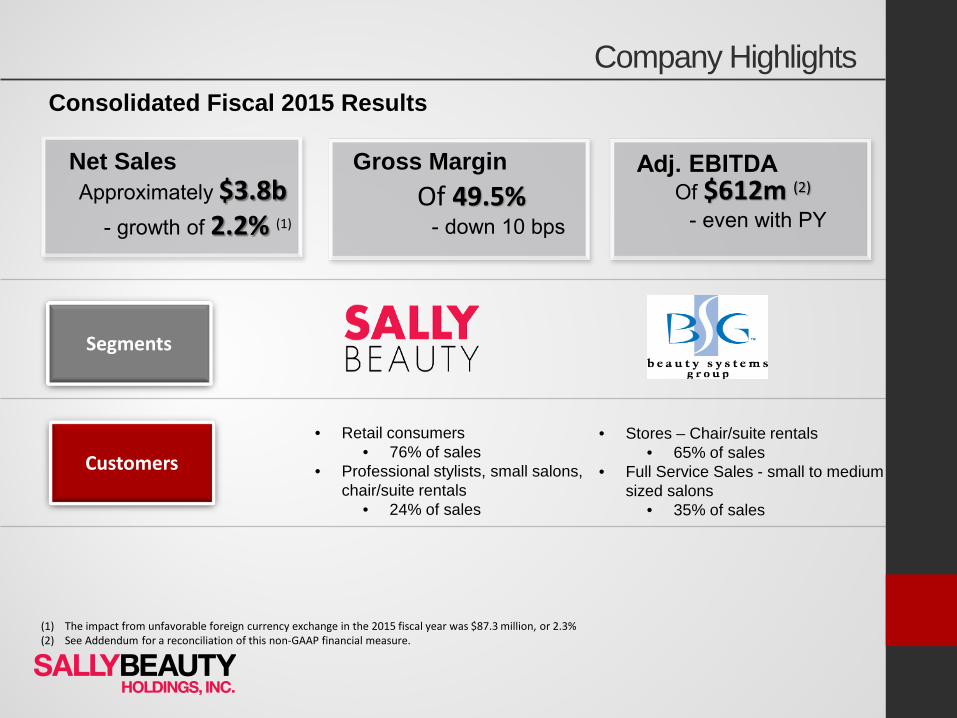
Consolidated Fiscal 2015 Results
Net Sales Gross Margin
Segments
Customers • Retail consumers
• 76% of sales • Professional stylists, small salons,
chair/suite rentals • 24% of sales
• Stores – Chair/suite rentals • 65% of sales
• Full Service Sales - small to medium sized salons
• 35% of sales
Company Highlights
(1) The impact from unfavorable foreign currency exchange in the 2015 fiscal year was $87.3 million, or 2.3% (2) See Addendum for a reconciliation of this non-GAAP financial measure.

3,673 stores worldwide (1)
Retail consumers (76% of sales)
Professional stylists (24% of sales)
Sales SSS growth EBIT EBIT margin
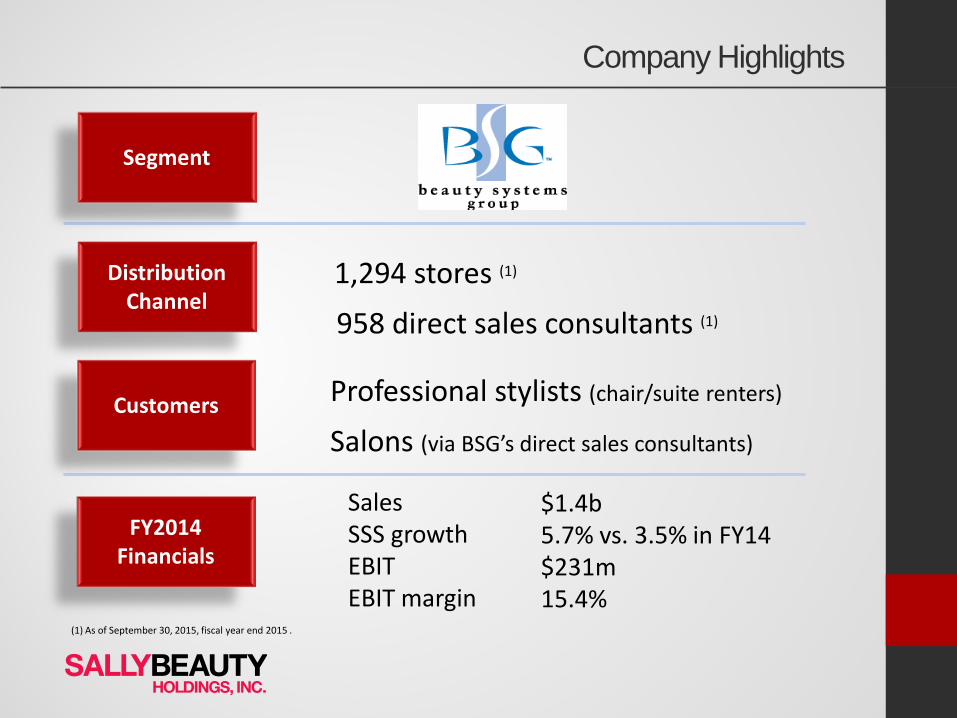
Segment
Distribution Channel
Customers
FY2014 Financials
$2.3b 1.7% vs. 1.3% in FY14 $412m 17.7%
Company Highlights
(1) As of September 30, 2015, fiscal year end 2015 .
Sales SSS growth EBIT EBIT margin
Segment
Distribution Channel
Customers
FY2014 Financials
1,294 stores (1)
958 direct sales consultants (1)
Professional stylists (chair/suite renters)
Salons (via BSG’s direct sales consultants)
$1.4b 5.7% vs. 3.5% in FY14 $231m 15.4%
Company Highlights
(1) As of September 30, 2015, fiscal year end 2015 .

Company Highlights
Open-Line Retail Exclusive / Full-Service
3,673 stores 1,294 stores 958 consultants
Professional stylists
` Retail Consumers $$$ High-end $ Value
Customers:
Distribution:
SBH plays an important role in the supply chain
Salons
(1) As of September 30, 2015, fiscal year end 2015 .
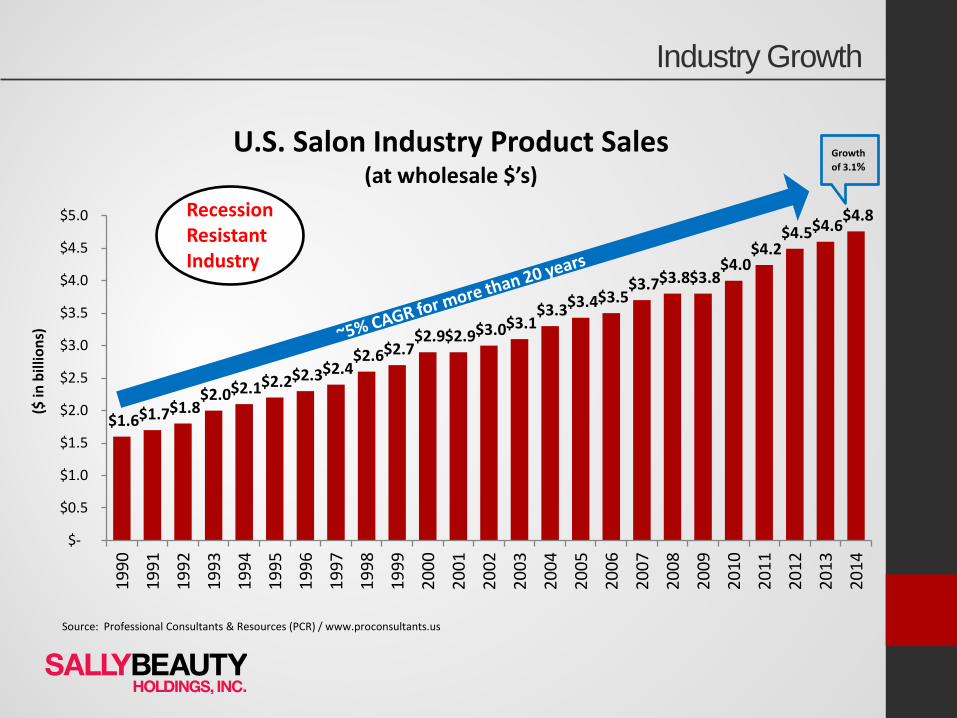
Industry Growth
$1.6 $1.7 $1.8 $2.0 $2.1 $2.2 $2.3 $2.4
$2.6 $2.7 $2.9 $2.9 $3.0 $3.1
$3.3 $3.4 $3.5 $3.7 $3.8 $3.8
$4.0 $4.2
$4.5 $4.6 $4.8
$-
$0.5
$1.0
$1.5
$2.0
$2.5
$3.0
$3.5
$4.0
$4.5
$5.0
1990
1991
1992
1993
1994
1995
1996
1997
1998
1999
2000
2001
2002
2003
2004
2005
2006
2007
2008
2009
2010
2011
2012
2013
2014
($ in
bill
ions
)
U.S. Salon Industry Product Sales (at wholesale $’s)
Growth of 3.1%
Recession Resistant Industry
Source: Professional Consultants & Resources (PCR) / www.proconsultants.us
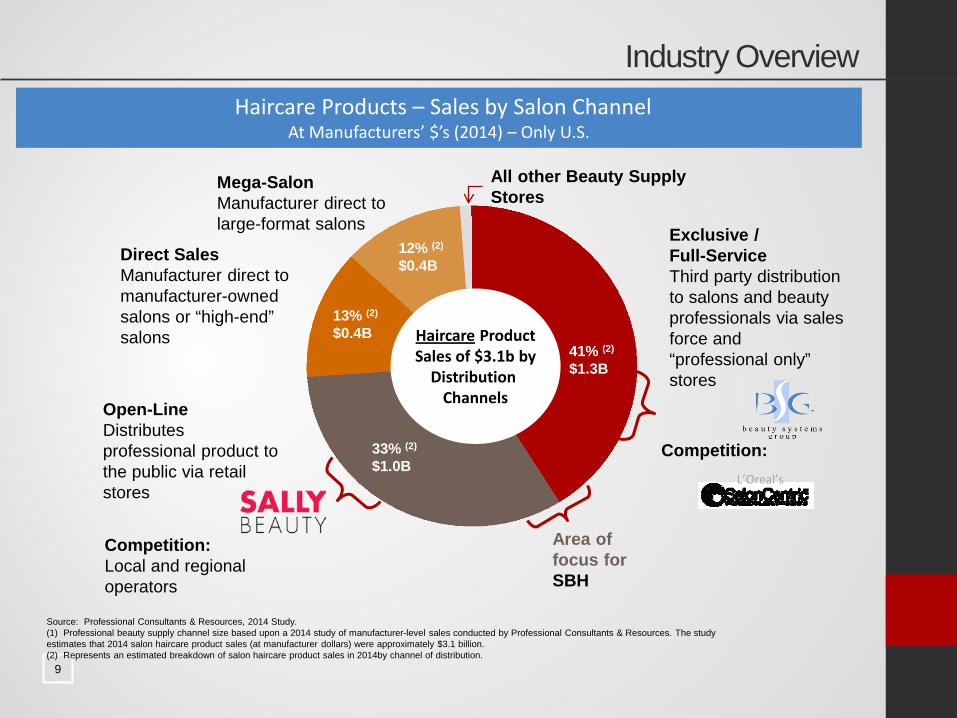
9
Haircare Product Sales of $3.1b by
Distribution Channels
Mega-Salon Manufacturer direct to large-format salons
12% (2)
$0.4B
41% (2)
$1.3B
33% (2)
$1.0B
13% (2)
$0.4B
Direct Sales Manufacturer direct to manufacturer-owned salons or “high-end” salons
Open-Line Distributes professional product to the public via retail stores
Competition: Local and regional operators
Exclusive / Full-Service Third party distribution to salons and beauty professionals via sales force and “professional only” stores
Competition: L’Oreal’s
Area of focus for SBH
Source: Professional Consultants & Resources, 2014 Study. (1) Professional beauty supply channel size based upon a 2014 study of manufacturer-level sales conducted by Professional Consultants & Resources. The study estimates that 2014 salon haircare product sales (at manufacturer dollars) were approximately $3.1 billion. (2) Represents an estimated breakdown of salon haircare product sales in 2014by channel of distribution.
Haircare Products – Sales by Salon Channel At Manufacturers’ $’s (2014) – Only U.S.
Industry Overview
All other Beauty Supply Stores

Business Segment Overview

Sally Beauty : Overview
Sally Beauty Supply global footprint
3,673(1) stores worldwide
2,868 stores in U.S. (including Puerto Rico)
805 stores in Canada, the UK, Ireland, Belgium, Netherlands, France, Germany, Spain, Chile, Colombia, Peru & Mexico
Average store size 1,700 sq. ft., 90% selling space
Professional open-line business - merchandise assortment not available through mass retailers
Destination for professional hair care and solutions
(1) As of September 30, 2015, fiscal year end 2015 .
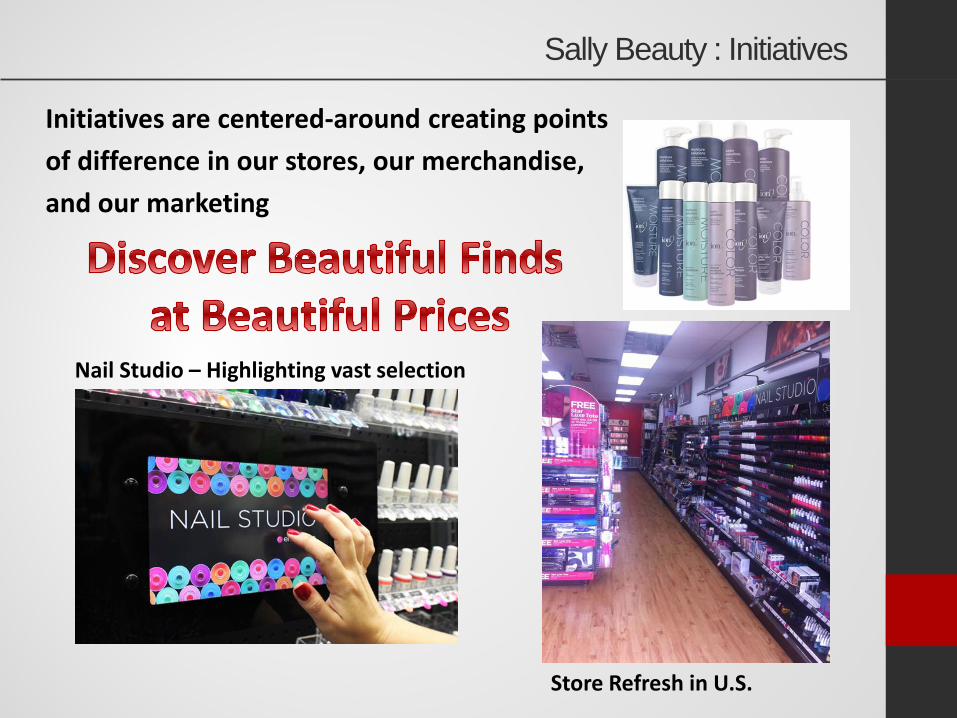
Initiatives are centered-around creating points of difference in our stores, our merchandise, and our marketing
Sally Beauty : Initiatives
Nail Studio – Highlighting vast selection
Store Refresh in U.S.
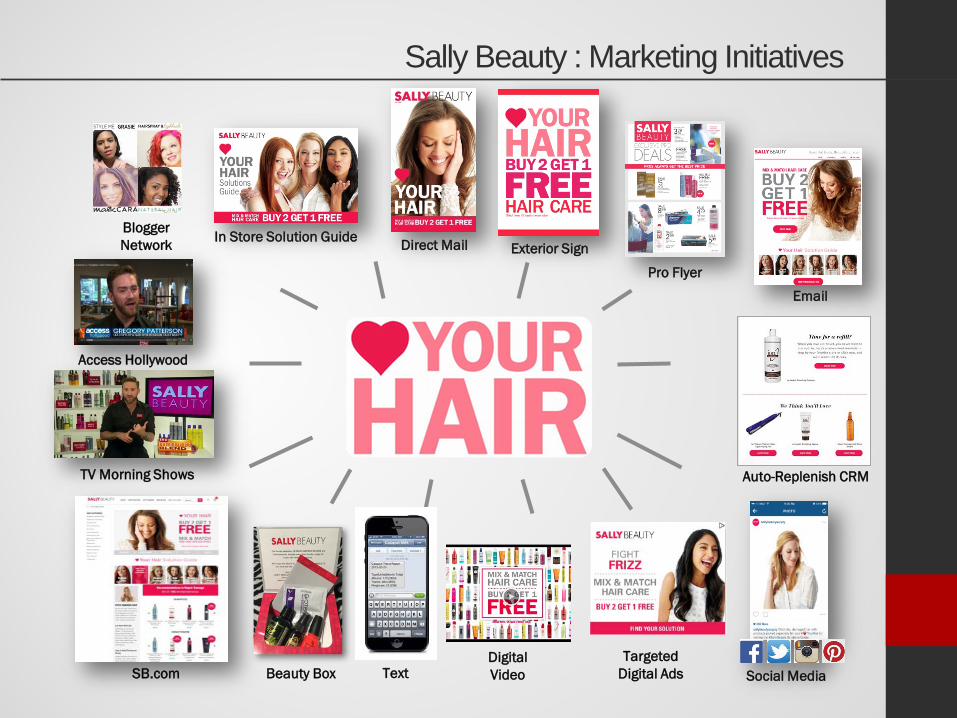
Sally Beauty : Marketing Initiatives
In Store Solution Guide Direct Mail Exterior Sign
Pro Flyer
Targeted Digital Ads
Social Media SB.com
Access Hollywood
TV Morning Shows
Blogger Network
Digital Video Beauty Box
Auto-Replenish CRM
Text
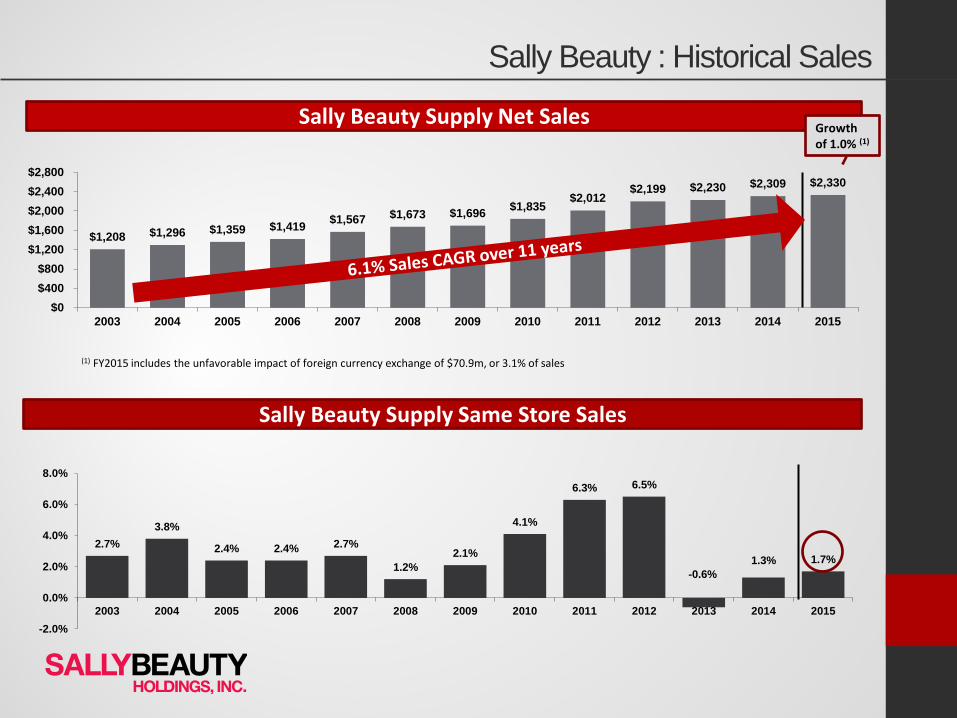
Sally Beauty : Historical Sales
2.7% 3.8%
2.4% 2.4% 2.7%
1.2% 2.1%
4.1%
6.3% 6.5%
-0.6% 1.3% 1.7%
-2.0%
0.0%
2.0%
4.0%
6.0%
8.0%
2003 2004 2005 2006 2007 2008 2009 2010 2011 2012 2013 2014 2015
$1,208 $1,296 $1,359 $1,419 $1,567 $1,673 $1,696 $1,835 $2,012
$2,199 $2,230 $2,309 $2,330
$0$400$800
$1,200$1,600$2,000$2,400$2,800
2003 2004 2005 2006 2007 2008 2009 2010 2011 2012 2013 2014 2015
Sally Beauty Supply Net Sales
Sally Beauty Supply Same Store Sales
Growth of 1.0% (1)
(1) FY2015 includes the unfavorable impact of foreign currency exchange of $70.9m, or 3.1% of sales

7%
8%
14%
9%
16%
25%
22%
Sally Beauty : Merchandise Offering
Hair Care
Hair Color
Skin and Nail Care
Electrical Appliances
Brushes, Cutlery and Accessories
Other Beauty Items
We offer a diversified mix of beauty products
Ethnic Products
47% of Sales from Hair Care & Color
*Fiscal year 2015
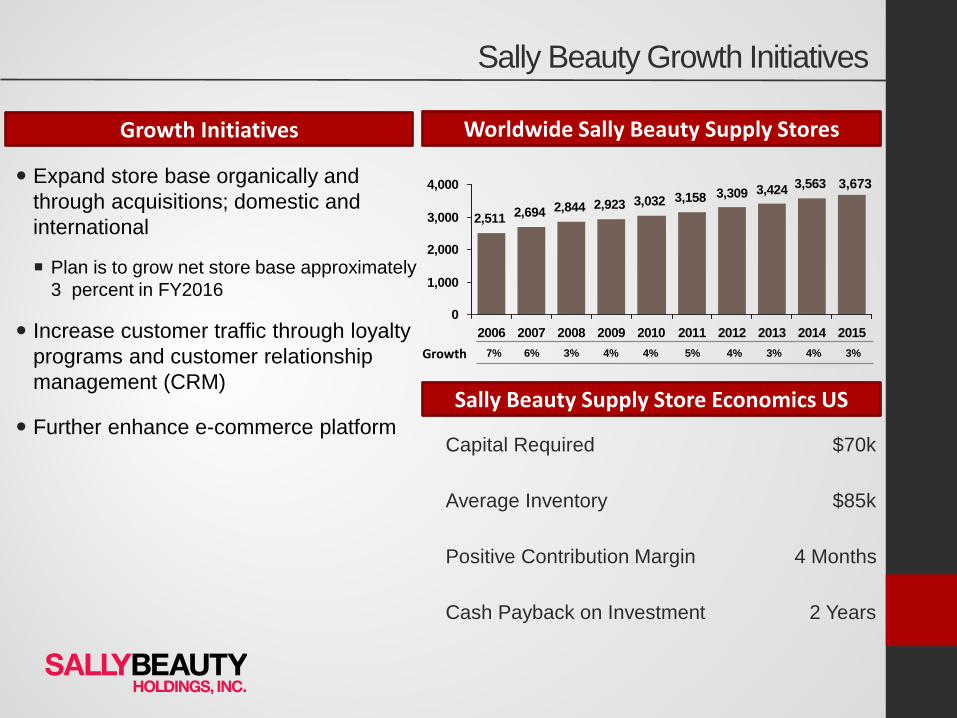
Expand store base organically and through acquisitions; domestic and international
Plan is to grow net store base approximately 3 percent in FY2016
Increase customer traffic through loyalty programs and customer relationship management (CRM)
Further enhance e-commerce platform
Growth Initiatives
2,511 2,694 2,844 2,923 3,032 3,158 3,424 3,5633,309
0
1,000
2,000
3,000
4,000
2006 2007 2008 2009 2010 2011 2012 2013 2014 2015
Worldwide Sally Beauty Supply Stores
Sally Beauty Supply Store Economics US
Capital Required $70k
Average Inventory $85k
Positive Contribution Margin 4 Months
Cash Payback on Investment 2 Years
Growth
Sally Beauty Growth Initiatives
3,673
7% 6% 3% 4% 4% 5% 4% 3% 4% 3%

Sally Beauty Supply: International Opportunity
805 Sally Beauty stores located in 13 countries
Stores located in Canada, the UK, Republic of Ireland, Belgium, France, the Netherlands, Germany, Spain, Chile, Colombia, Peru & Mexico
24% of Sally Beauty sales from international
Sales mix differs from U.S./Canada
UK/Europe
~80-85% professional ~15-20% retail
Mexico and South America almost 100% retail
Existing International Platform Long-Term Store Growth Potential (1)
(Canada) ~250
(Mexico) 196 ~250
(UK / Ireland) 260 ~300
(Belgium, France, Germany, Spain, Netherlands)
187 600-800
(Chile) 40 ~45
Potential Current
112
(Colombia)
2
Total 805 ~1,500+
(Peru) ~40
(1) As of September 2015, fiscal 2015 year end
8
~50
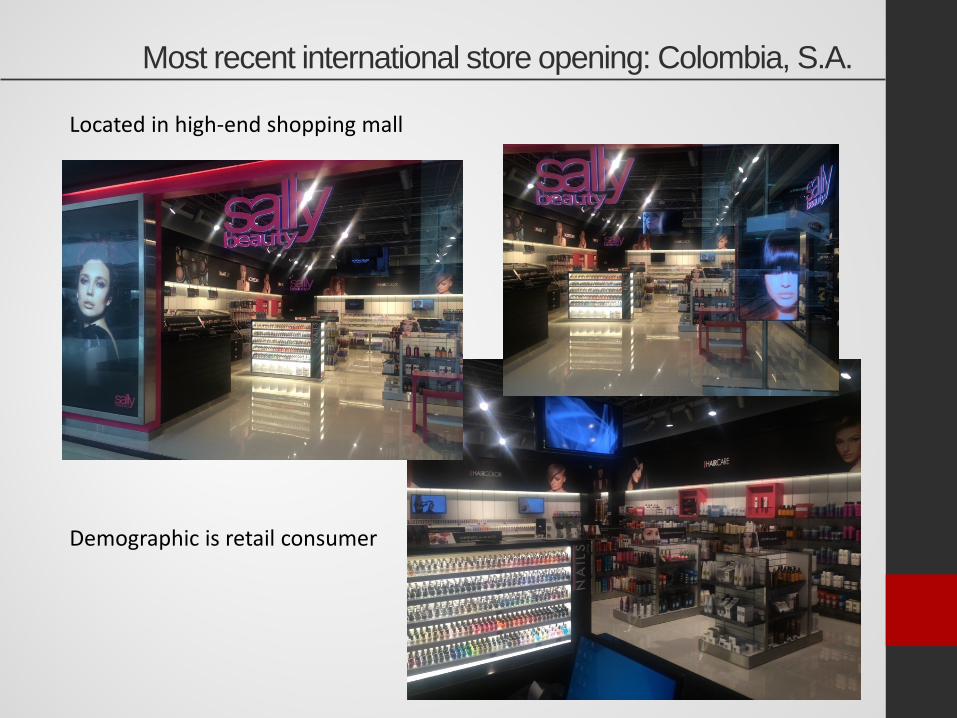
Most recent international store opening: Colombia, S.A.
Located in high-end shopping mall
Demographic is retail consumer
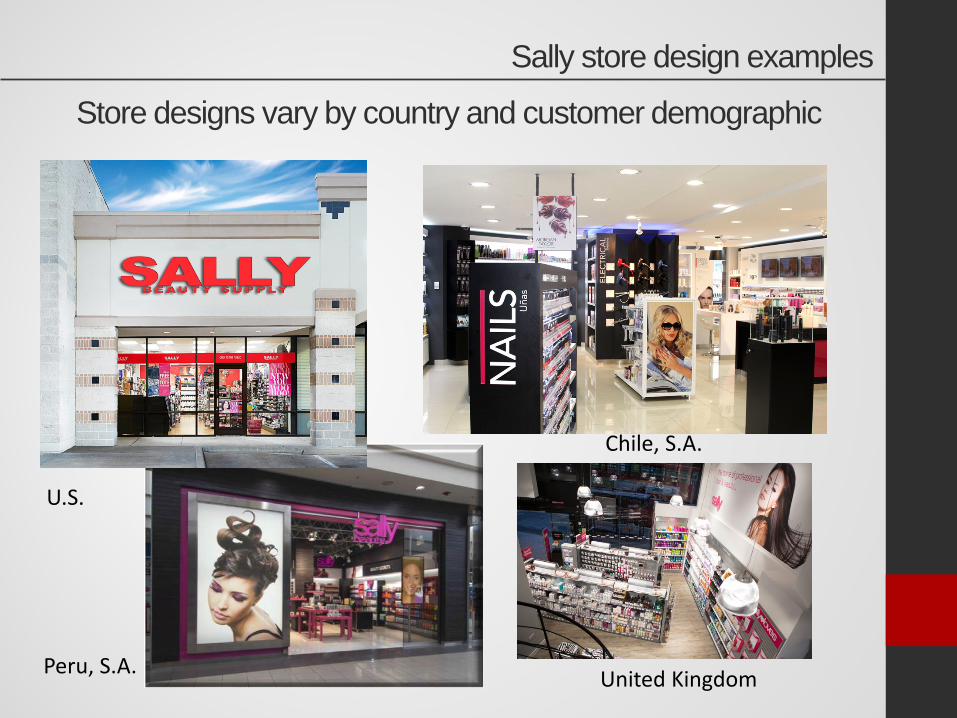
U.S.
Chile, S.A.
United Kingdom Peru, S.A.
Store designs vary by country and customer demographic
Sally store design examples
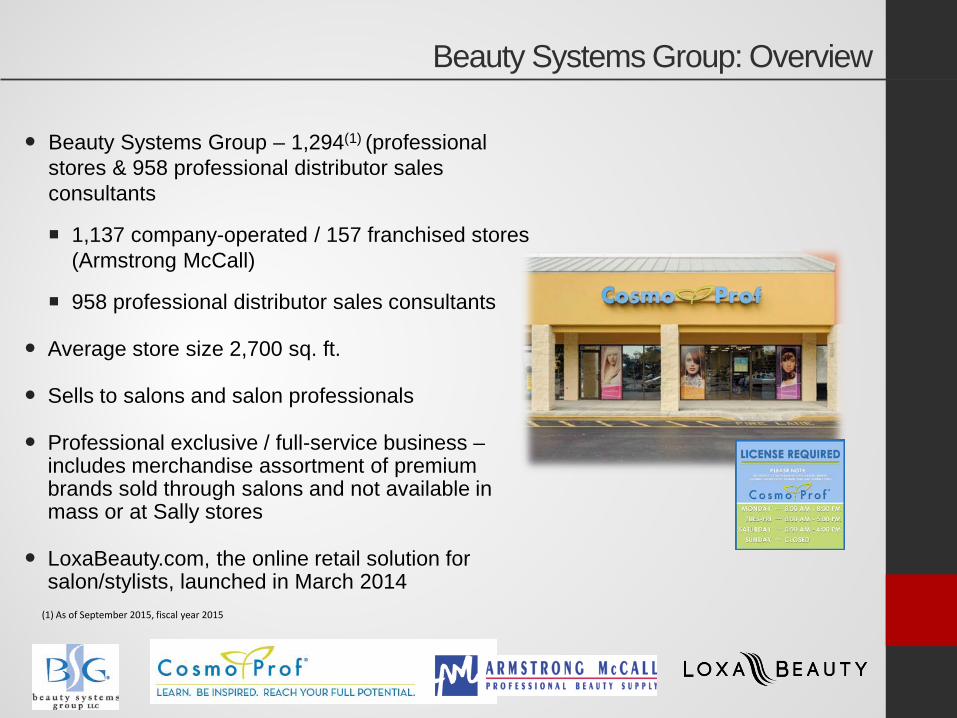
Beauty Systems Group: Overview
Beauty Systems Group – 1,294(1) (professional stores & 958 professional distributor sales consultants
1,137 company-operated / 157 franchised stores (Armstrong McCall)
958 professional distributor sales consultants
Average store size 2,700 sq. ft.
Sells to salons and salon professionals
Professional exclusive / full-service business – includes merchandise assortment of premium brands sold through salons and not available in mass or at Sally stores
LoxaBeauty.com, the online retail solution for salon/stylists, launched in March 2014
(1) As of September 2015, fiscal year 2015
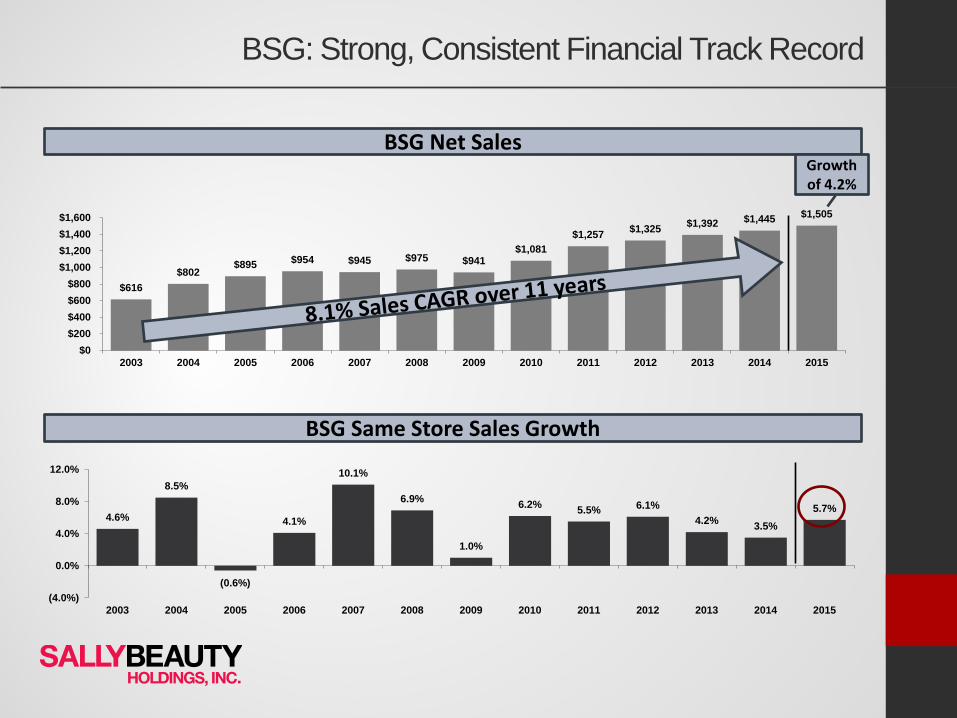
BSG: Strong, Consistent Financial Track Record
$616 $802
$895 $954 $945 $975 $941 $1,081
$1,257 $1,325 $1,392 $1,445 $1,505
$0$200$400$600$800
$1,000$1,200$1,400$1,600
2003 2004 2005 2006 2007 2008 2009 2010 2011 2012 2013 2014 2015
BSG Net Sales
4.6%
8.5%
(0.6%)
4.1%
10.1%
6.9%
1.0%
6.2% 5.5% 6.1% 4.2% 3.5%
5.7%
(4.0%)
0.0%
4.0%
8.0%
12.0%
2003 2004 2005 2006 2007 2008 2009 2010 2011 2012 2013 2014 2015
BSG Same Store Sales Growth
Growth of 4.2%
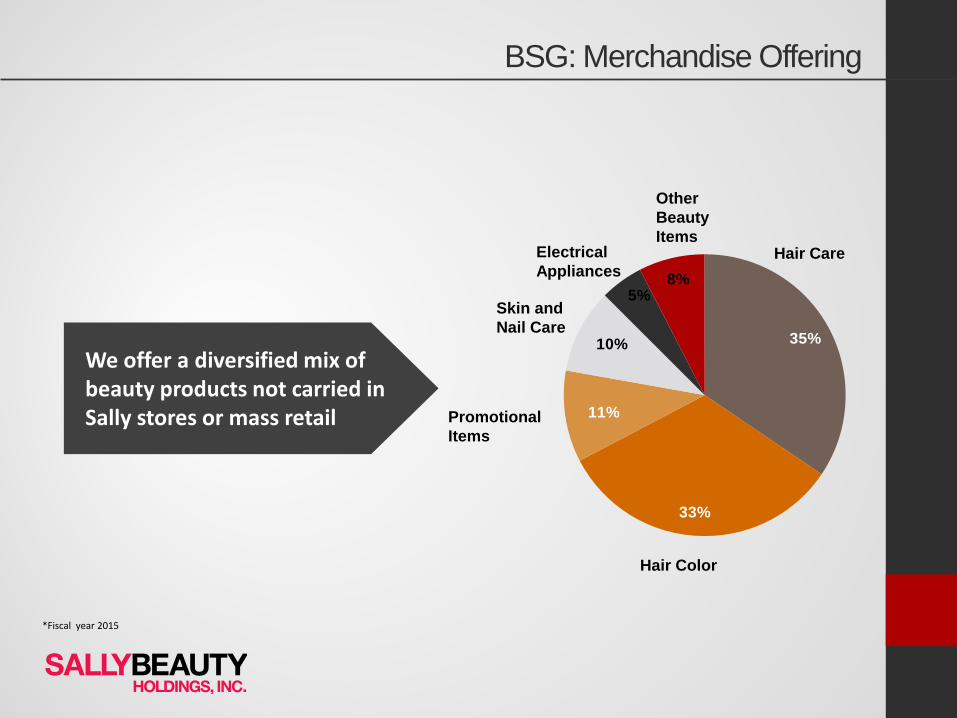
BSG: Merchandise Offering
We offer a diversified mix of beauty products not carried in Sally stores or mass retail
8%5%
10%
11%
33%
35%
Hair Care
Skin and Nail Care
Electrical Appliances
Promotional Items
Other Beauty Items
Hair Color
*Fiscal year 2015
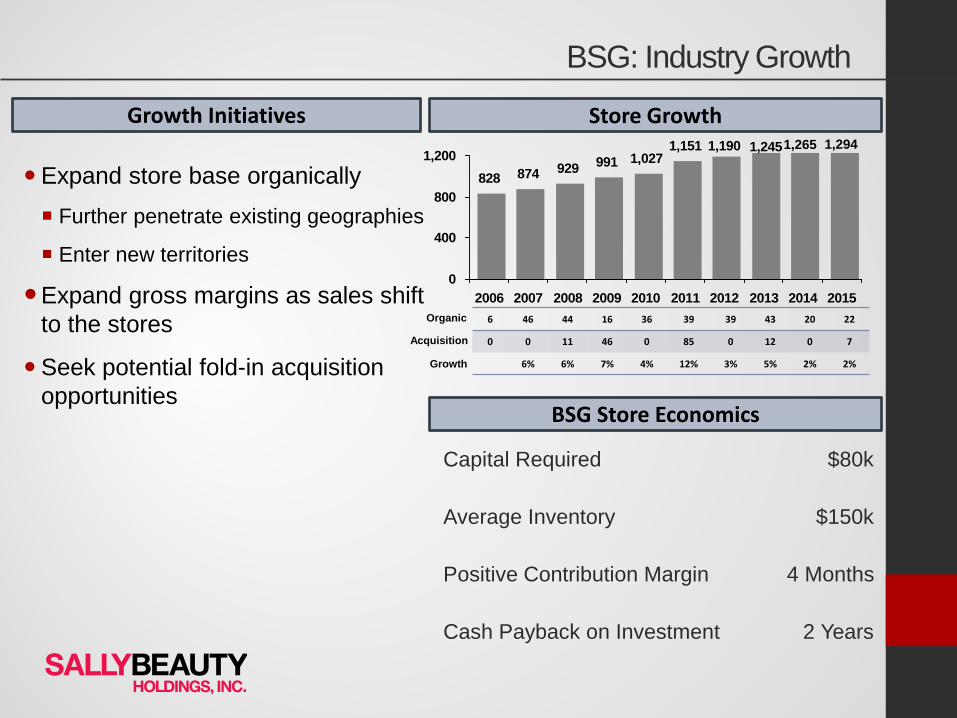
BSG: Industry Growth
828 874 929 991 1,0271,151 1,190 1,245
0
400
800
1,200
2006 2007 2008 2009 2010 2011 2012 2013 2014 2015
Expand store base organically Further penetrate existing geographies
Enter new territories
Expand gross margins as sales shift to the stores
Seek potential fold-in acquisition opportunities
Capital Required $80k
Average Inventory $150k
Positive Contribution Margin 4 Months
Cash Payback on Investment 2 Years
Growth Initiatives
BSG Store Economics
Growth
1,265
Organic
Acquisition
Store Growth Store Growth 1,294
6 46 44 16 36 39 39 43 20 22
0 0 11 46 0 85 0 12 0 7
6% 6% 7% 4% 12% 3% 5% 2% 2%

Consolidated Results

Summary of Recent Sr. Notes Transaction
($ in millions)Sources of Funds $ %New Senior Notes due 2025 $750.0 94.8%Cash from Balance Sheet 40.8 5.2%Total Sources $790.8 100.0%
Uses of Funds $ %Repay Existing Sr. Notes due 2019 $750.0 94.8%Call Premium(1) 25.8 3.3%Estimated Fees & Expenses 15.1 1.9%Total Uses $790.8 100.0%
($ in millions) Pro FormaPro Forma Capitalization Maturity Pricing 9/30/15Cash & Cash Equivalents $99.2
ABL Revolving Credit Facility ($500)(2) 7/1/2018 L + 150 -Capital Leases - - 2.9Total Secured Debt $2.9Senior Notes due 2019 11/15/2019 6.875% -Senior Notes due 2022 6/1/2022 5.750% 850.0Senior Notes due 2023 11/1/2023 5.500% 200.0New Senior Notes due 2025 2025 - 750.0Total Debt $1,802.9
LTM Adj. EBITDA(3) $612.4FY2015 Rent Expense 223.2LTM Adj. EBITDAR 835.6LTM Capital Expenditures 106.5
Credit StatisticsTotal Debt / LTM Adj. EBITDA 2.9xNet Debt / LTM Adj. EBITDA 2.8xAdj. Debt (5x) / LTM Adj. EBITDAR 3.5xAdj. Debt (8x) / LTM Adj. EBITDAR 4.3x____________________
(1) Call premium of 103.438 on Senior Notes due 2019. (2) 9/30/15 borrowing base of $500 million; $477 million of availability after accounting for $23 million of Letters of Credit outstanding. (3) See Addendum for a reconciliation of this non-GAAP financial measure.
2
5.625%
• On 11/18/15, entered into an underwriting agreement related to the public offering of $750,000,000 senior notes at 5.625% due 2025
• Expect the offering to close on or about December 3, 2015 • Intend to use the net proceeds from the offering to redeem all $750,000,000, 6.875% senior notes due 2019 at
a redemption premium equal to 103.438% (callable as of 11/15/15) • Anticipate the redemption to be completed on December 18, 2015
Overview

$0.33
$0.44$0.52
$0.77
$1.07
$1.42$1.48
$1.53 $1.53
$0.00
$0.20
$0.40
$0.60
$0.80
$1.00
$1.20
$1.40
$1.60
2007 2008 2009 2010 2011 2012 2013 2014 2015
Flat YoY
Sales and EPS Growth for total Company
$2,514 $2,648 $2,637
$2,916
$3,269
$0
$500
$1,000
$1,500
$2,000
$2,500
$3,000
$3,500
FY07 FY08 FY09 FY10 FY11 FY12 FY13 FY14 FY15
$3,524 $3,622
Sales EPS (adjusted)
2.2% YoY
$3,754 (1) $3,834
(1) FY15 includes $87.3 million, or 230 points of growth, of unfavorable F(X) exchange rates (2) See Addendum for a reconciliation of this non-GAAP financial measure.
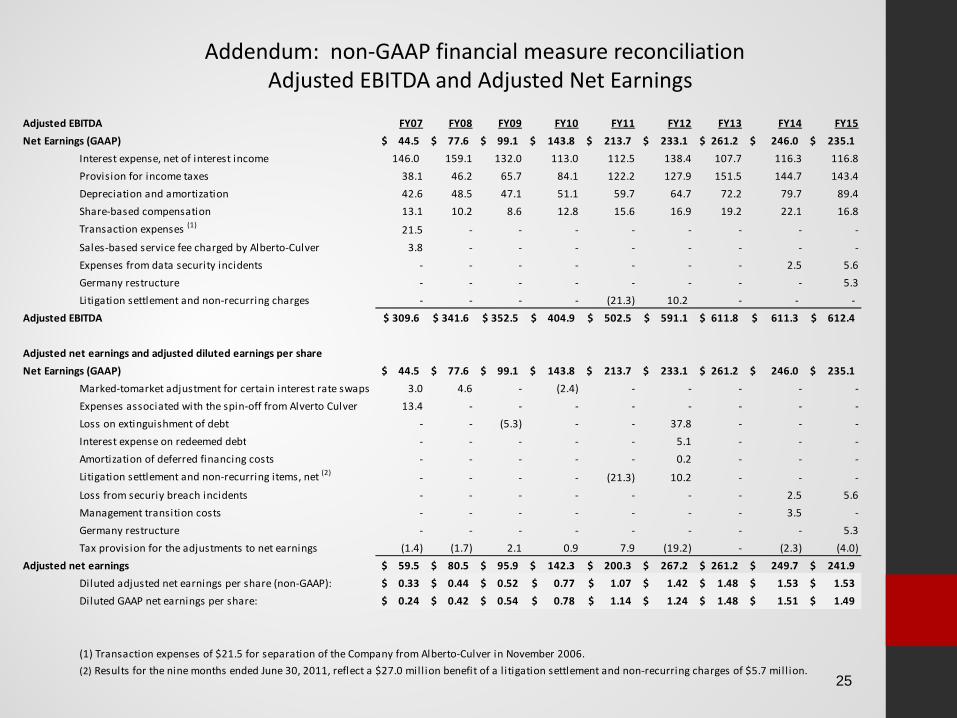
Addendum: non-GAAP financial measure reconciliation Adjusted EBITDA and Adjusted Net Earnings
Adjusted EBITDA FY07 FY08 FY09 FY10 FY11 FY12 FY13 FY14 FY15Net Earnings (GAAP) 44.5$ 77.6$ 99.1$ 143.8$ 213.7$ 233.1$ 261.2$ 246.0$ 235.1$
Interest expense, net of interest income 146.0 159.1 132.0 113.0 112.5 138.4 107.7 116.3 116.8Provision for income taxes 38.1 46.2 65.7 84.1 122.2 127.9 151.5 144.7 143.4Depreciation and amortization 42.6 48.5 47.1 51.1 59.7 64.7 72.2 79.7 89.4Share-based compensation 13.1 10.2 8.6 12.8 15.6 16.9 19.2 22.1 16.8Transaction expenses (1) 21.5 - - - - - - - -Sales-based service fee charged by Alberto-Culver 3.8 - - - - - - - -Expenses from data security incidents - - - - - - - 2.5 5.6Germany restructure - - - - - - - - 5.3Litigation settlement and non-recurring charges - - - - (21.3) 10.2 - - -
Adjusted EBITDA 309.6$ 341.6$ 352.5$ 404.9$ 502.5$ 591.1$ 611.8$ 611.3$ 612.4$
Adjusted net earnings and adjusted diluted earnings per shareNet Earnings (GAAP) 44.5$ 77.6$ 99.1$ 143.8$ 213.7$ 233.1$ 261.2$ 246.0$ 235.1$
Marked-tomarket adjustment for certain interest rate swaps 3.0 4.6 - (2.4) - - - - -Expenses associated with the spin-off from Alverto Culver 13.4 - - - - - - - -Loss on extinguishment of debt - - (5.3) - - 37.8 - - -Interest expense on redeemed debt - - - - - 5.1 - - -Amortization of deferred financing costs - - - - - 0.2 - - -Litigation settlement and non-recurring items, net (2) - - - - (21.3) 10.2 - - -Loss from securiy breach incidents - - - - - - - 2.5 5.6Management transition costs - - - - - - - 3.5 -Germany restructure - - - - - - - - 5.3Tax provision for the adjustments to net earnings (1.4) (1.7) 2.1 0.9 7.9 (19.2) - (2.3) (4.0)
Adjusted net earnings 59.5$ 80.5$ 95.9$ 142.3$ 200.3$ 267.2$ 261.2$ 249.7$ 241.9$ Diluted adjusted net earnings per share (non-GAAP): 0.33$ 0.44$ 0.52$ 0.77$ 1.07$ 1.42$ 1.48$ 1.53$ 1.53$ Diluted GAAP net earnings per share: 0.24$ 0.42$ 0.54$ 0.78$ 1.14$ 1.24$ 1.48$ 1.51$ 1.49$
(1) Transaction expenses of $21.5 for separation of the Company from Alberto-Culver in November 2006.(2) Results for the nine months ended June 30, 2011, reflect a $27.0 mill ion benefit of a l itigation settlement and non-recurring charges of $5.7 mill ion.
25
Cautionary Notice Regarding Forward-Looking Statements Statements in this presentation which are not purely historical facts or which depend upon future events may be forward-looking statements within the meaning of Section 27A of the Securities Act of 1933, as amended, and Section 21E of the Securities Exchange Act of 1934, as amended. Words such as “anticipate,” “believe,” “estimate,” “expect,” “intend,” “plan,” “project,” “target,” “can,” “could,” “may,” “should,” “will,” “would,” or similar expressions may also identify such forward-looking statements. You are cautioned not to place undue reliance on forward-looking statements as such statements speak only as of the date they were made. Any forward-looking statements involve risks and uncertainties that could cause actual events or results to differ materially from the events or results described in the forward-looking statements, including, but not limited to, risks and uncertainties related to: the highly competitive nature of, and the increasing consolidation of, the beauty products distribution industry; anticipating and effectively responding to changes in consumer preferences and buying trends in a timely manner; potential fluctuation in our same store sales and quarterly financial performance; our dependence upon manufacturers who may be unwilling or unable to continue to supply products to us; the possibility of material interruptions in the supply of products by our third-party manufacturers or distributors or increases in the prices of products we purchase from our third-party manufacturers or distributors; products sold by us being found to be defective in labeling or content; compliance with current laws and regulations or becoming subject to additional or more stringent laws and regulations; the success of our strategic initiatives including our store refresh program and increased marketing efforts, to enhance the customer experience, attract new customers, drive brand awareness and improve customer loyalty; the success of our e-commerce businesses; product diversion to mass retailers or other unauthorized resellers; the operational and financial performance of our franchise-based business; successfully identifying acquisition candidates and successfully completing desirable acquisitions; integrating acquired businesses; the success of our existing stores, and our ability to increase sales at existing stores; opening and operating new stores profitably; the volume of traffic to our stores; the impact of the health of the economy upon our business; the success of our cost control plans; rising labor and rental costs; protecting our intellectual property rights, particularly our trademarks; the risk that our products may infringe on the intellectual property of others or that we may be required to defend our intellectual property rights; conducting business outside the United States; successfully updating and integrating our information technology systems; disruption in our information technology systems; a significant data security breach, including misappropriation of our customers’, or employees’ or suppliers’ confidential information, and the potential costs related thereto; the negative impact on our reputation and loss of confidence of our customers, suppliers and others arising from a significant data security breach; the costs and diversion of management’s attention required to investigate and remediate a data security breach and to continuously upgrade our information technology security systems to address evolving cyber security threats; the ultimate determination of the extent or scope of the potential liabilities relating to our past data security incidents; our ability to attract or retain highly skilled management and other personnel; severe weather, natural disasters or acts of violence or terrorism; the preparedness of our accounting and other management systems to meet financial reporting and other requirements and the upgrade of our existing financial reporting system; being a holding company, with no operations of our own, and depending on our subsidiaries for cash; our ability to execute and implement our common stock repurchase program; our substantial indebtedness; the possibility that we may incur substantial additional debt, including secured debt, in the future; restrictions and limitations in the agreements and instruments governing our debt; generating the significant amount of cash needed to service all of our debt and refinancing all or a portion of our indebtedness or obtaining additional financing; changes in interest rates increasing the cost of servicing our debt; the potential impact on us if the financial institutions we deal with become impaired; and the costs and effects of litigation. Additional factors that could cause actual events or results to differ materially from the events or results described in the forward-looking statements can be found in our filings with the Securities and Exchange Commission, including our most recent Annual Report on Form 10-K for the year ended September 30, 2015, as filed with the Securities and Exchange Commission. Consequently, all forward-looking statements in this presentation are qualified by the factors, risks and uncertainties contained therein. We assume no obligation to publicly update or revise any forward-looking statements.