Embed Size (px)
Citation preview
The Plant Cell, Vol. 1, 715-725, July 1989 O 1989 American Society of Plant Physiologists
Salt Stress Leads to Differential Expression of Two lsogenes of Phosphoenolpyruvate Carboxylase during Crassulacean Acid Metabolism lnduction in the Common Ice Plant
John C. Cushman,” Gabriele Meyer,aYb Christine 6. Michalowski,” Jürgen M. Schmitt,b and Hans J. Bohnert”,’ a Department of Biochemistry, University of Arizona, Tucson, Arizona 85721
Botanisches Institut, Universitat Würzburg, D8700 Würzburg, Federal Republic of Germany
The common ice plant is a facultative halophyte in which Crassulacean acid metabolism, a metabolic adaptation to arid environments, can be induced by irrigating plants with high levels of NaCl or by drought. This stress-induced metabolic transition is accompanied by up to a 50-fold increase in the activity of phosphoenolpyruvate carboxylase (PEPCase). To analyze the molecular basis of this plant response to water stress, we have isolated and characterized two members of the PEPCase gene family from the common ice plant. The PEPCase isogenes, designated Ppcí and Ppc2, have consenred intron-exon organizations, are 76.4% identical at the nucleotide sequence level within exons, and encode predicted polypeptides with 83% amino acid identity. Steady-state levels of mRNAs from the two genes differ dramatically when plants are salt-stressed. Transcripts of Ppcí increase about 30-fold in leaves within 5 days of salt stress. In contrast, steady-state levels of Ppc2 transcripts decrease slightly in leaf tissue over the same stress period. Steady-state levels of transcripts of both genes decrease in roots over 5 days of salt stress. We have used in vitro transcription assays with nuclei isolated from leaves to demonstrate that the increased expression of Ppcí caused by water stress occurs in part at the transcriptional level.
INTRODUCTION
Crassulacean acid metabolism (CAM) is a well-character- ized physiological adaptation to water stress found in plants of tropical origin that typically grow in warm, dry climates (Kluge and Ting, 1978). CAM is defined by diurnal fluctuation of organic acids (mainly malate) and reciproca1 diurnal fluctuation of storage carbohydrates. CAM plants open their stomata primarily at night, when the majority of CO, uptake occurs, and close them during the day to avoid excess evaporative water loss (Osmond and Holtum, 1981; Ting, 1985). CAM is also characterized by high activities of phosphoenolpyruvate carboxylase (PEPCase, EC 4.1.1.31), the enzyme responsible for the primary fixation of COn into oxaloacetate, which is subsequently converted to malate (O’Leary, 1982). During the day, accumulated C4 acids (mainly malate) are decarboxylated to provide COs for later fixation by ribulose-bisphosphate carboxylase (Ting, 1985).
PEPCase is present in bacteria, algae, and higher plants. In addition to its role in photosynthesis, severa1 other
’ To whom correspondence should be addressed
diverse anapleurotic functions have been postulated for the enzyme, such as replenishment of tricarboxylic acid cycle intermediates, NADPH regeneration, and recapture of respired CO, (Andreo, Gonzalez, and Iglesias, 1987). Numerous plant species switch from a C3 mode of pho- tosynthetic carbon metabolism to CAM in response to various environmental stimuli (Ting and Rayder, 1982). In some plants, this switch can be induced by salt or water stress (Winter and von Willert, 1972; von Willert et al., 1976a, 1976b; Ting and Hanscom, 1977), by changes in photoperiod (Brulfert et al., 1982), or as a part of their normal developmental program (Jones, 1975; Brulfert, Guerrier, and Queiroz, 1982; Sipes and Ting, 1985). In the common ice plant, this metabolic transition is accompanied by substantial increases in the activity of a set of carbon metabolism enzymes of the glycolytic pathway (Holtum and Winter, 1982). Among those enzymes whose activities are known to increase, PEPCase has been most inten- sively studied (Foster, Edwards, and Winter, 1982). The increase of PEPCase enzyme activity in the common ice plant is the result of de novo protein synthesis (Hofner et al., 1987). The increase in PEPCase protein is paralleled
Dow
nloaded from https://academ
ic.oup.com/plcell/article/1/7/715/5970352 by guest on 09 February 2022
716 The Plant Cell
by an increase in PEPCase mRNA as assayed by immu- noprecipitation of PEPCase from the products of in vitro translation of RNA isolated from stressed plants (Ostrem et al., 1987; Michalowski et al., 1989). PEPCase mRNA levels drop rapidly upon removal of salt (Vernon et al., 1988).
Multiple forms of PEPCase are known to exist in higher plants (Ting and Osmond, 1973). Different classes of the enzyme have apparently evolved to perform the same enzymatic step associated with different metabolic path- ways. At least four different molecular species of the enzyme have been identified on the basis of kinetic and chromatographic properties in different species, including a C3 photosynthetic form, a nonautotrophic or “root” form, a C4 photosynthetic form, and a CAM photosynthetic form (Ting and Osmond, 1973). Recently, there has been prog- ress in the analysis of the genetic basis for different forms of PEPCase in the C4 plant maize. PEPCase cDNA clones have been used to identify different PEPCase mRNAs that encode isozymic forms present in roots and leaves (Harps- ter and Taylor, 1986). cDNA clones, including a full-length cDNA clone for the C4 PEPCase (Yanagisawa et al., 1988) and two different genomic PEPCase clones, have been isolated from maize (Hudspeth et al., 1986). The maize PEPCase gene family consists of five distinct genes (Grula and Hudspeth, 1987) with only the C4 photosynthetic version of the genomic PEPCase clone having been char- acterized thus far (Hudspeth and Grula, 1989). PEPCase is expressed in a developmental, light- and tissue-specific manner in maize leaves (Nelson and Langdale, 1989, and references therein).
In contrast, very little is known at the molecular level about different forms of PEPCase present in CAM plants and the metabolic roles that each of these forms plays. While there have been many studies that have revealed the existence of different PEPCase isoforms (von Willert et al., 1976b; Brulfert and Queiroz, 1982; Brulfert, Guerrier, and Queiroz, 1982; Brulfert et al., 1982; Müller and Kluge, 1983; Hofner et al., 1989), little is known about the genes encoding these different forms. We have recently charac- terized a full-length PEPCase cDNA clone (Rickers et al., 1989) isolated from a cDNA library made from mRNA isolated from salt-stressed common ice plants (Schmitt, Michalowski, and Bohnert, 1988). We have now charac- terized two distinct genomic PEPCase genes that differ markedly in their expression during CAM induction. One of the genes, Ppcl, encodes a form of the enzyme whose expression is induced by salt stress. This gene corre- sponds to the CAM-specific cDNA described by Rickers et al. (1 989). The second gene encodes an alternate form of the enzyme whose expression is not enhanced by stress. We show by in vitro transcription run-on experi- ments using isolated nuclei from the ice plant that the differences in accumulation of steady-state transcripts are controlled in part at the level of transcription.
R E SU LTS
lsolation and Characterization of Genomic Clones
A portion (90,000 plaques) of a primary genomic library constructed in X FIX (Stratagene, Inc.) was screened using a CAM-specific PEPCase cDNA isolated from a cDNA library made from poly(A+) RNA isolated from salt- stressed plants (Rickers et al., 1989). During purification of plaques by hybridization, two different classes of plaques became evident. One class hybridized very strongly with the CAM-specific PEPCase cDNA probe even after high-stringency (60°C) washes of filters. Eight inde- pendent genomic clones for this class of gene were iso- lated. The second class of plaques hybridized only weakly with the cDNA probe and not at all under conditions of high-stringency washing. Six independent clones of this type were isolated.
To further characterize and distinguish these two classes of genomic PEPCase clones, restriction maps of the two groups of clones were constructed. All of the clones from each class were found to possess identical restriction maps. DNA blots were used to determine the position of restriction fragments with respect to the coding regions of the genes, and similar differences in hybridiza- tion characteristics between the types of clones were observed as described above (data not shown).
Characterization of PEPCase lsogenes
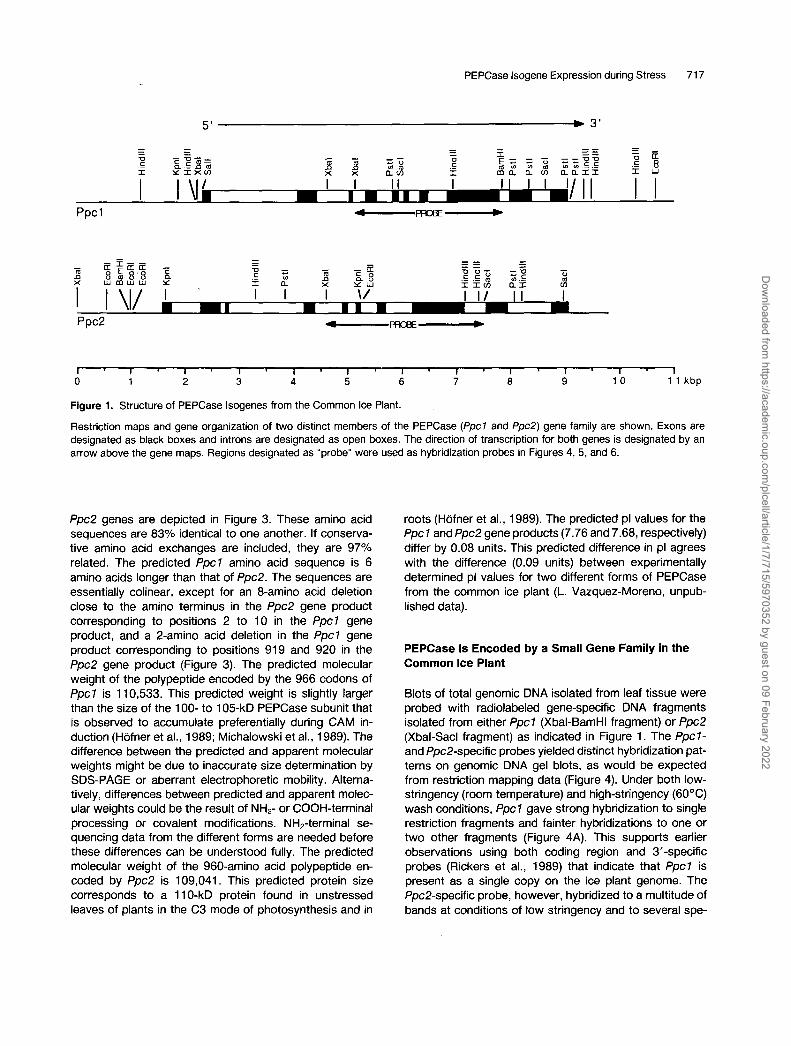
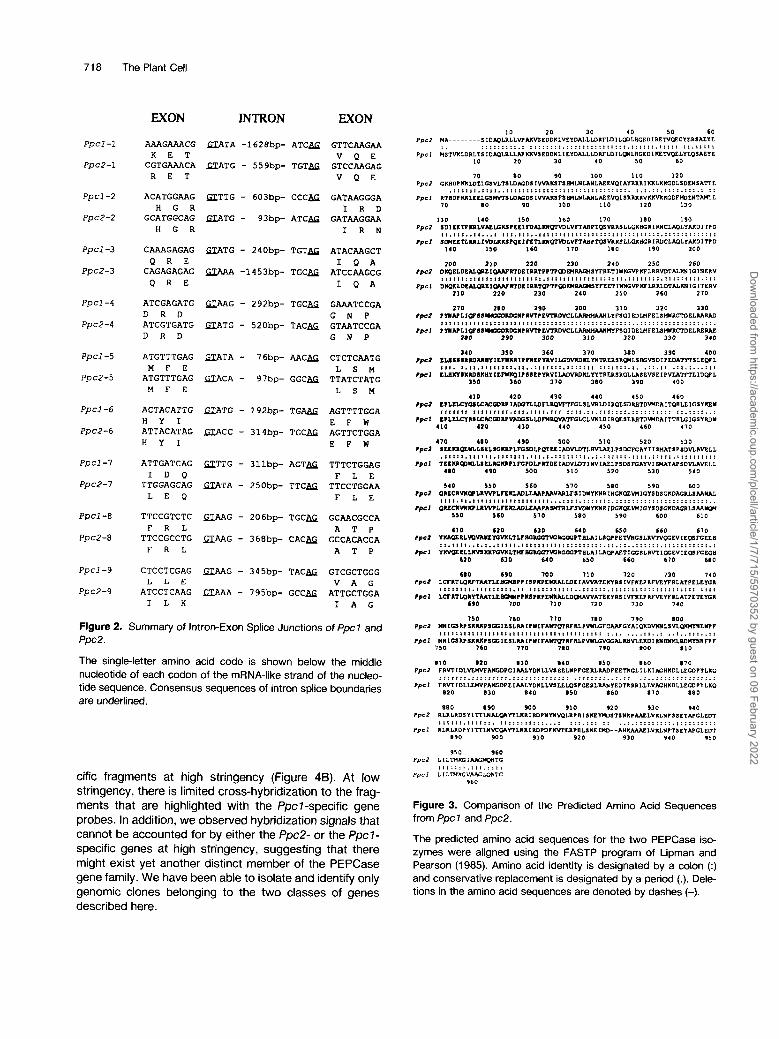
Restriction fragments containing regions that hybridized to. the cDNA probe were subcloned into pTZ18u or 19u, and deletion subclones for sequence analysis were gen- erated (Dale, McClure, and Houchins, 1985). The restric- tion maps and structure of the two different PEPCase isogenes are illustrated in Figure 1. The Ppcl gene spans a region of 6920 bp and is interrupted by nine introns. The Ppc2 gene is also interrupted by nine introns and extends for 7416 bp. Since both genes have coding regions of similar size (966 codons for Ppcl versus 960 codons for Ppc2), most of the difference in gene size is accounted for by differences in intron size. The placement of introns within the coding regions of the two genes is completely conserved (Figure 2). All of the introns exhibit the con- served dinucleotides GT and AG at their 5’ ends and 3’ ends, respectively, common to eukaryotic intron-exon splice junctions (Mount, 1982). lntrons in Ppcl range in size from 86 to 1638 bp and from 103 to 1463 bp for Ppc2. The complete nucleotide sequences for Ppcl and Ppc2 will appear in the EMBL/GenBank/DDBJ nucleotide sequence databases under accession numbers X14587 and X14588, respectively.
The predicted amino acid sequences of the Ppcl and
Dow
nloaded from https://academ
ic.oup.com/plcell/article/1/7/715/5970352 by guest on 09 February 2022
PEPCase lsogene Expression during Stress 71 7
5' * 3'
Ppcl
l ' l ~ l ~ l ' l ' l ~ l ' l ~ l ' l ' l ' l O 1 2 3 4 5 6 7 0 9 1 0 1 1 kbp
Figure 1. Structure of PEPCase lsogenes from the Common Ice Plant.
Restriction maps and gene organization of two distinct members of the PEPCase ( 4 x 7 and Ppc2) gene family are shown. Exons are designated as black boxes and introns are designated as open boxes. The direction of transcription for both genes is designated by an arrow above the gene maps. Regions designated as "probe" were used as hybridization probes in Figures 4, 5, and 6.
Ppc2 genes are depicted in Figure 3. These amino acid sequences are 83% identical to one another. If conserva- tive amino acid exchanges are included, they are 97% related. The predicted Ppcl amino acid sequence is 6 amino acids longer than that of Ppc2. The sequences are essentially colinear, except for an 8-amino acid deletion close to the amino terminus in the Ppc2 gene product corresponding to positions 2 to 10 in the Ppcl gene product, and a 2-amino acid deletion in the Ppcl gene product corresponding to positions 919 and 920 in the Ppc2 gene product (Figure 3). The predicted molecular weight of the polypeptide encoded by the 966 codons of Ppcl is 110,533. This predicted weight is slightly larger than the size of the 100- to 105-kD PEPCase subunit that is observed to accumulate preferentially during CAM in- duction (Hofner et al., 1989; Michalowski et al., 1989). The difference between the predicted and apparent molecular weights might be due to inaccurate size determination by SDS-PAGE or aberrant electrophoretic mobility. Alterna- tively, differences between predicted and apparent molec- ular weights could be the result of NH2- or COOH-terminal processing or covalent modifications. NH,-terminal se- quencing data from the different forms are needed before these differences can be understood fully. The predicted molecular weight of the 960-amino acid polypeptide en- coded by Ppc2 is 109,041. This predicted protein size corresponds to a 110-kD protein found in unstressed leaves of plants in the C3 mode of photosynthesis and in
roots (Hofner et al., 1989). The predicted pl values for the Ppcl andPpc2 gene products (7.76 and 7.68, respectively) differ by 0.08 units. This predicted difference in pl agrees with the difference (0.09 units) between experimentally determined pl values for two different forms of PEPCase from the common ice plant (L. Vazquez-Moreno, unpub- lished data).
PEPCase Is Encoded by a Small Gene Family in the Common Ice Plant
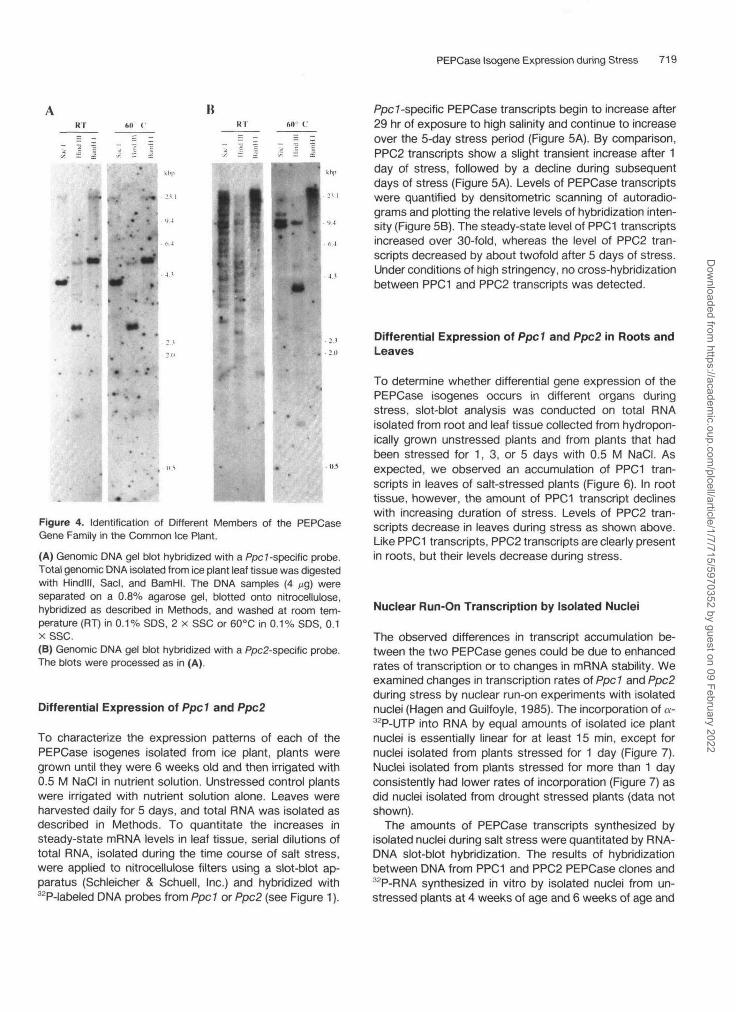
Blots of total genomic DNA isolated from leaf tissue were probed with radiolabeled gene-specific DNA fragments isolated from either Ppcl (Xbal-BamHI fragment) or Ppc2 (Xbal-Sacl fragment) as indicated in Figure 1. The Ppcl- and Ppc2-specific probes yielded distinct hybridization pat- terns on genomic DNA gel blots, as would be expected from restriction mapping data (Figure 4). Under both low- stringency (room temperature) and high-stringency (6OOC) wash conditions, Ppcl gave strong hybridization to single restriction fragments and fainter hybridizations to one or two other fragments (Figure 4A). This supports earlier observations using both coding region and 3'-specific probes (Rickers et al., 1989) that indicate that Ppcl is present as a single copy on the ice plant genome. The Ppc2-specific probe, however, hybridized to a multitude of bands at conditions of low stringency and to severa1 spe-
Dow
nloaded from https://academ
ic.oup.com/plcell/article/1/7/715/5970352 by guest on 09 February 2022
71 8 The Plant Cell
EXON INTRON EXON
PPCl-1
ppcz-1
P p c l - 2
FpCZ-2
P p c l - 3
p p c 2 - 3
P P C l - 4
p p c 2 - 4
P p c l - 5
p p c z - 5
F p c l - 6
F p C 2 - 6
PpCl -7
FpCP-7
p p c 1 - e
F p C 2 - 0
F p c l - 9
p p c 2 - 9
AAAGAAACG GTATA - 1 6 2 B b p - ATCBG GTTCAAGAA K E T V Q E
CGTGAAACA GTATG - 5 5 9 b p - TGTBG GTCCAAGAG R E T V Q E
ACATGGAAG GXTTG - 603bp- CCCBG GATAAGGGA H G R I R D
GCATGGCAG D T G - 93bp- ATCBG GATAAGGAA H G R I R N
CAAAGAGAG D T G - 2 4 0 b p - T G T X ATACAAGCT O R E I Q A
CAGAGAGAG N - 1 4 5 3 b p - T G C X ATCCAAGCG Q R E I Q A
ATCGAGATG a A A G - 2 9 2 b p - TGCBJ; GAAATCCGA D R D G N P ATCGTGATG U A T G - 5 2 0 b p - TACBJ; GTAATCCGA D R D G N P
ATGTTTGAG D T A - 7 6 b p - AACBG CTCTCAATG L S M M F E
ATGTTTGAG m C A - 9 7 b p - GGCBG TTATCTATG M F E L S M
ACTACATTG D T G - 192bp- TGA& AGTTTTGGA H Y I E F W ATTACATAG D C C - 3 1 4 b p - TGCBG AGTTCTGGA
E F W H Y I
ATTGATCAG U T T G - 311bp- AGTgG TTTCTGGAG I D Q F L E
TTGGAGCAG a T A - 2 5 0 b p - TTCgG TTCCTGGAA L E Q F L E
TTCCGTCTC U A A G - 206bp- TGCBJ; GCAACGCCA F R L A T P
TTCCGCCTG a A A G - 368bp- CACBJ; GCCACACCA F R L A T P
CTCCTCGAG GTAAG - 3 4 5 b p - T A C X GTCGCTGGG
ATCCTCAAG GTAAA - 7 9 5 b p - G C C X ATTGCTGGA V A G
I A G
L L E
I L K
Figure 2. Summary of Intron-Exon Splice Junctions of Ppcl and PpcP.
The single-letter amino acid code is shown below the middle nucleotide of each codon of the mRNA-like strand of the nucleo- tide sequence. Consensus sequences of intron splice boundaries are underlined.
cific fragments at high stringency (Figure 46). At low stringency, there is limited cross-hybridization to the frag- ments that are highlighted with the fpcl-specific gene probes. In addition, we observed hybridization signals that cannot be accounted for by either the Ppc2- or the Ppcl- specific genes at high stringency, suggesting that there might exist yet another distinct member of the PEPCase gene family. We have been able to isolate and identify only genomic clones belonging to the two classes of genes described here.
p p c 2
P p s l
P p s l
P p s l
p p c z
PPCI
P p c l
PPCl
P p c z
P p c l
?PC2
P p s l
p p c z
PVCl
?PCl
?PCI
?pcz
PpcJ
r p c l
P p c l
r p d
P p c l
10 20 30 4 0 5 0 60 W I - - - - - - - - S I D M L R L L W ~ E D D K L V Y D ~ L L D R F L D ~ L ~ L M G E D ~ ~ ~ ~ E C Y E R S ~ K E
:::::::::.: . . . . . . . . . . . . . . . . . . . . . . . . . . . . . . . . . . . . . ::.i::::
HSTVI(LDRLTSIDMLRLLUPSWDKLIEYD~LLDRFLDILOILRGEDII(PTVOELYWSAEKE 10 20 10 4 0 50 60
10 10 90 100 110 120 CI(RD?I(XLDUCSVLTSLDICDSIWIKSFfLIII (WILUIL~EVQIAYYRIIRI~LKff iDLSDENSA~E ............................................. :.:.::.::::.:::.: :: R T ~ D P I ( X L E U C S ~ S L f f i D S I ~ M F S L I I I W I U I H L ~ E V Q l S R l l l ( R V l O ( V I f f i D F W E N T ~ ~ 1 0 8 0 90 100 110 120 130
........................................
110 140 1so 160 110 180 190 S D I ~ E ~ l ( l l L V ~ L C I W ? E ~ I F D ~ L I M ~ L ~ M ? T O S M R S L L P l l s C l l I I W C L M L Y M D l T P D : : . I : : . . I , . . . I .....................................................
S [ I I U R U L I W L K M I O ~ I F C ~ L I M ~ W L ~ M P T O S M R ~ L L ~ E G R I R D C L M L Y I I ( D I T P D 140 1so 160 1JO 180 190 200
200 210 2 2 0 2 3 0 2 1 0 250 260 D M L L D C I I L ~ L I ~ R T D E 1 R R T P P ~ ~ M M M S Y F M E T I U f f i W I ( F L R R V D T ~ I M I G I N E R V ~~
, , * : : : : * : , I , , * , , , : : : : : : I : . : : : : : : : : : : : : : : : : : : : . : : : : : : : : . : : : : : : : : : . : : : DKQELDLIILltOllCl~RTDCIRRTOPRWMMMSKFRETI*NGVPI(FLRIILDT1LIMICITERV
210 220 230 240 250 260 270
2JO 2 8 0 290 300 310 320 130 P ~ U L I W S I ~ D R ~ ? R ~ P E ~ W ~ ~ L K F S Q I E D ~ F E L S ~ R C ? D E L ~ ............................................................... P ~ U L I W 8 S ~ D R f f i I P R ~ I Y R E \ P R I D V n U R I D I M l l m ~
280 290 300 310 3 2 0 330 3 4 0
.....................................
340 350 360 1 1 0 380 390 400 ~ L l l l I 8 l l O ~ l l l I ~ n m B I P P U E ? ~ V I ~ ~ l a ~ ~ E R S R ~ L S ~ V 1 D ~ ? E D A ~ S L E W L ................................................................ C L ~ I F I 8 ~ I D I I ( ~ K 1 L m O I ? I S ~ ? ~ V I L l o ~ l a ~ T R E R S R Q L ~ S E ~ E I P V U T F ~ l D W L
150 360 310 380 390 400
410 420 430 4 4 0 450 4 60 C ? L C L C I ~ U K C D l V I ~ ~ L D F L I I O Y F T F C L S L V R L D I R Q E S D R B T D I R I D A I T O B L E I G S K I ( P U ........................................................... C I L U C I R I U ~ C O D ~ V I 9 C S L L D ~ ~ ~ T F G L C L V I ( L D I R a E S E ~ T D I M D A I T T B I l : I G S Y R D Y
.................................... 410 420 410 4 4 0 450 460 470
470 480 490 500 510 520 530 I L L I I ~ ~ L 8 E L 8 D U P L P C S D L P ~ ~ ~ I M ~ T L B V U E L L L .............................................................. TLCIOIW~LSU.IEI(L?LFCIDtPRTDEIMLDnDTINVIAELPSDSFCAlVISIUT~S~VLIVLL
...................................... 480 4 9 0 soo s 1 0 s 2 0 S30 540
1
540 550 560 510 5 0 0 590 60 O O I I L C R V ) ( O L I V V s L ~ l [ W ~ U ) M V ~ L F S I D Y I I O I R l N C K a E I R I I C Y S D S C K D f f i R L S M * U . .................................................................... Q ~ C ) ( V I ( R L I V M L F C l [ W L E M P A I ~ R L F S ~ ~ R ~ f f i N ~ ~ l G ~ ~ D S G K D f f i R L S M ~
550 560 SlO se0 590 60 o 610
680 690 1 0 0 1 1 0 J20 1 3 0 1 4 0 L C P R T W R F T M T L E ~ ? Q ISPKPl~ALWEIAWITGKYRS IVFKEPRFFMWRLATPELEYGR I t t I ~ I i I . ! I t I I I * I l . I I I , : , : I t , : : : . . : : : : : I . : : : : : : : : : : : : : : : : : : : : : : : S I L ~ R T U I R Y T M T L E ~ ? ? K S P K ? C ~ ~ W ~ ~ T E E K R S I W K E P R F Y E ~ R L A T P E T E I C P .
690 700 JIO 1 2 0 730 740
7so 760 1 1 0 780 7 9 0 800 ~ l ~ S l V S N M ? S f f i I ~ l L M 1 Q U I F A ~ ~ R F R L P V * L C F C M T C K A I Q K D V I M L S ~ Q l D r m E ~ F ........................................ :. i . . . . ......... . . , . . : : : . . : i
M N l C S I V S ~ M ? l f f i l E S L M l P ~ l F A ~ ~ R F ~ L P ~ ~ f f i ~ ~ ~ E N D l ~ ~ ~ W ~ N N F P F ' 5 0 J60 170 1 1 0 190 800 810
810 1 2 0 830 840 810 1160 870 PpC3 F R V I l D L ~ ~ A f f i D ? C I ~ K D I ( L L V 1 E E L U ? F C E I I L R I D F E E R I C L I L K I f f i C R K D L L E G D P K L R Q
:::::::.::i:*::::.**:::::::::::: + : : I : : : : . . : . : : .:..:::::::::::::.: P p c l TRVIIDLLEWVFAffiDPEIMLKDKLLVSEEWSFCERLIUWKEDTIIRRLLF.Vffi~DLLEWPILNQ
820 810 840 850 860 1 1 0 8 8 0
8 8 0 890 90 O O10 920 930 940 PpC2 R L R L R D S Y f T I L N ~ O I ~ L K R I R D ? N ' R I ~ L R ? R I S I ( E ~ D S T S N l P M E L V K L N P S S E Y ~ C L E D T
:::i::.::::::. :::::i:::::...: :::.::: :: ........................ P p S l R L R L R D P K ' I T T L N I ) C M ' I 1 L K I I W P D F l M E R ? ~ L S K E l M D - - A ~ ~ L V K L l l ? T S E Y U C L E D T
890 90 O 910 920 930 940 9S O
950 960 P p c 2 LIL?WffiIA?GUQNTG
Ppcl L lL?WXCVAWLONTG . . . . . . . . . . . . . . ................
960
Figure 3. Comparison of the Predicted Amino Acid Sequences from Ppc7 and fpc2.
The predicted amino acid sequences for the two PEPCase iso- zymes were aligned using the FASTP program of Lipman and Pearson (1985). Amino acid identity is designated by a colon (:) and conservative replacement is designated by a period (.). Dele- tions in the amino acid sequences are denoted by dashes (-).
Dow
nloaded from https://academ
ic.oup.com/plcell/article/1/7/715/5970352 by guest on 09 February 2022
PEPCase Isogene Expression during Stress 719
BKT All ( KT 60 C
kh|,
.t:-VS:. .:J
Figure 4. Identification of Different Members of the PEPCaseGene Family in the Common Ice Plant.
(A) Genomic DMA gel blot hybridized with a Ppc 1 -specific probe.Total genomic DMA isolated from ice plant leaf tissue was digestedwith Hindlll, Sacl, and BamHI. The DMA samples (4 ^g) wereseparated on a 0.8% agarose gel, blotted onto nitrocellulose,hybridized as described in Methods, and washed at room tem-perature (RT) in 0.1% SDS, 2 x SSC or 60°C in 0.1% SDS, 0.1XSSC.(B) Genomic DMA gel blot hybridized with a Ppc2-specific probe.The blots were processed as in (A).
Differential Expression of Ppc 7 and Ppc2
To characterize the expression patterns of each of thePEPCase isogenes isolated from ice plant, plants weregrown until they were 6 weeks old and then irrigated with0.5 M NaCI in nutrient solution. Unstressed control plantswere irrigated with nutrient solution alone. Leaves wereharvested daily for 5 days, and total RNA was isolated asdescribed in Methods. To quantitate the increases insteady-state mRNA levels in leaf tissue, serial dilutions oftotal RNA, isolated during the time course of salt stress,were applied to nitrocellulose filters using a slot-blot ap-paratus (Schleicher & Schuell, Inc.) and hybridized with32P-labeled DMA probes from Ppc 7 or Ppc2 (see Figure 1).
Ppc 7-specific PEPCase transcripts begin to increase after29 hr of exposure to high salinity and continue to increaseover the 5-day stress period (Figure 5A). By comparison,PPC2 transcripts show a slight transient increase after 1day of stress, followed by a decline during subsequentdays of stress (Figure 5A). Levels of PEPCase transcriptswere quantified by densitometric scanning of autoradio-grams and plotting the relative levels of hybridization inten-sity (Figure 5B). The steady-state level of PPC1 transcriptsincreased over 30-fold, whereas the level of PPC2 tran-scripts decreased by about twofold after 5 days of stress.Under conditions of high stringency, no cross-hybridizationbetween PPC1 and PPC2 transcripts was detected.
Differential Expression of Ppc 7 and Ppc2 in Roots andLeaves
To determine whether differential gene expression of thePEPCase isogenes occurs in different organs duringstress, slot-blot analysis was conducted on total RNAisolated from root and leaf tissue collected from hydropon-ically grown unstressed plants and from plants that hadbeen stressed for 1, 3, or 5 days with 0.5 M NaCI. Asexpected, we observed an accumulation of PPC1 tran-scripts in leaves of salt-stressed plants (Figure 6). In roottissue, however, the amount of PPC1 transcript declineswith increasing duration of stress. Levels of PPC2 tran-scripts decrease in leaves during stress as shown above.Like PPC1 transcripts, PPC2 transcripts are clearly presentin roots, but their levels decrease during stress.
Nuclear Run-On Transcription by Isolated Nuclei
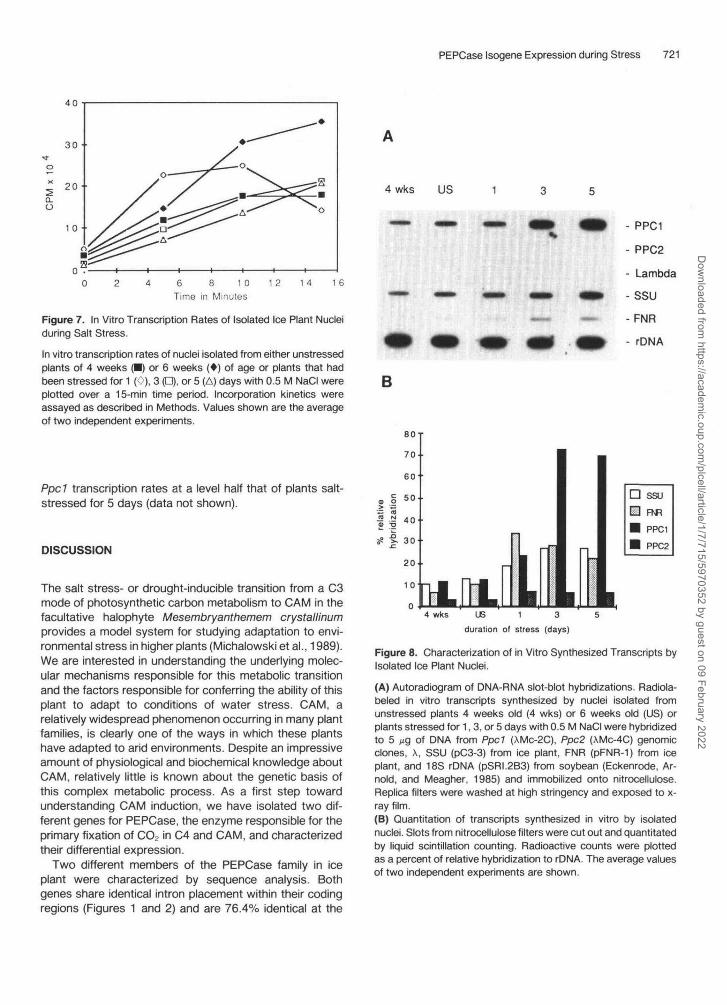
The observed differences in transcript accumulation be-tween the two PEPCase genes could be due to enhancedrates of transcription or to changes in mRNA stability. Weexamined changes in transcription rates of Ppc 7 and Ppc2during stress by nuclear run-on experiments with isolatednuclei (Hagen and Guilfoyle, 1985). The incorporation of a-32P-UTP into RNA by equal amounts of isolated ice plantnuclei is essentially linear for at least 15 min, except fornuclei isolated from plants stressed for 1 day (Figure 7).Nuclei isolated from plants stressed for more than 1 dayconsistently had lower rates of incorporation (Figure 7) asdid nuclei isolated from drought stressed plants (data notshown).
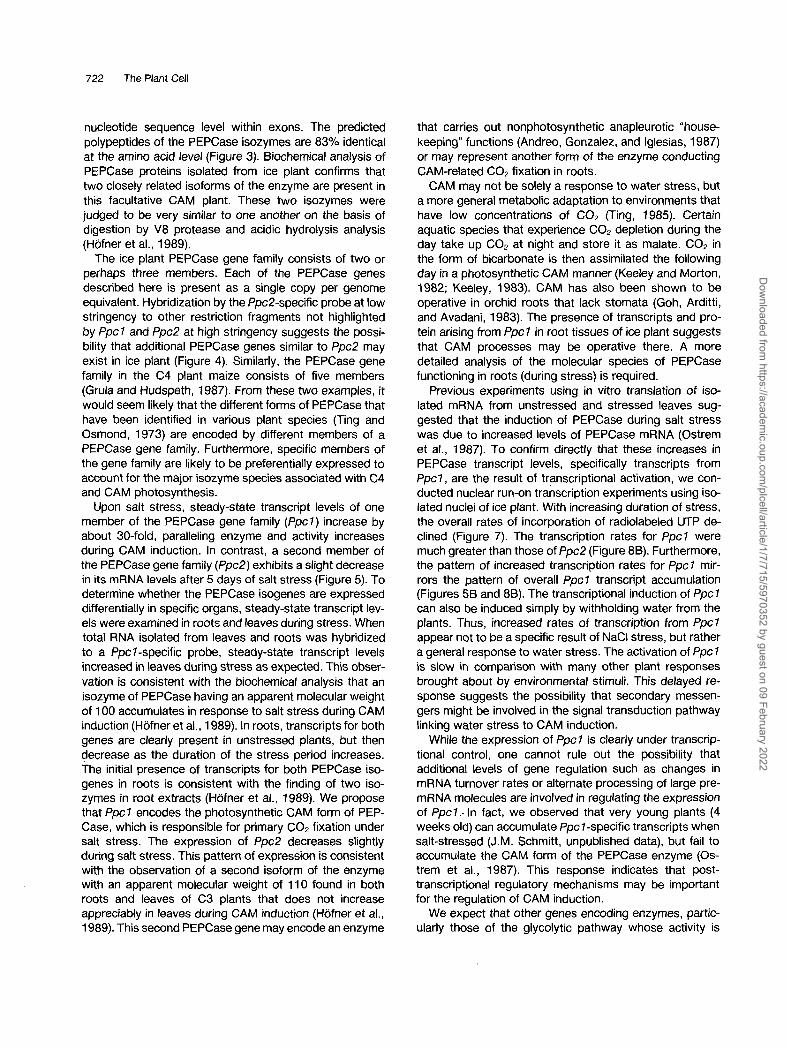
The amounts of PEPCase transcripts synthesized byisolated nuclei during salt stress were quantitated by RNA-DNA slot-blot hybridization. The results of hybridizationbetween DNA from PPC1 and PPC2 PEPCase clones and32P-RNA synthesized in vitro by isolated nuclei from un-stressed plants at 4 weeks of age and 6 weeks of age and
Dow
nloaded from https://academ
ic.oup.com/plcell/article/1/7/715/5970352 by guest on 09 February 2022

720 The Plant Cell
PPCl
ISill.
PPC2
l i S 1 2 3 4
6-week-old plants salt-stressed for 1, 3, or 5 days areshown in Figure 8A. The amounts of hybridizing mRNAswere compared with control DMAs, including ferredoxinNADP-reductase (FNR) from the common ice plant, whosesteady-state levels of transcripts are known to remainconstant during the stress procedure (Michalowski,Schmitt, and Bohnert, 1989); small subunit of ribulosebisphosphate carboxylase (SSU) from the common iceplant, whose steady- state mRNA levels decrease slightlyduring salt stress (J. DeRocher, unpublished data); and18S rDNA from soybean (Eckenrode, Arnold, andMeagher, 1985). The hybridizing bands were cut out andquantitated by liquid scintillation counting and plotted as arelative percent of rRNA hybridization (Figure 8B). X DNAused as a negative control for nonspecific hybridizationgave no detectable hybridization signal. The rates of tran-scription of the SSU and FNR controls showed a smallincrease during stress. Ppc2 transcription remained rela-tively unchanged and accounted for less than 7% of de-tectable transcripts. In contrast, transcription rates forPpd increased greater than sixfold during salt stress.Nuclei isolated from plants that had been drought-stressed(not watered) for 9 days also exhibited an induction in
B
1009080706050403020'10j ,0;
0 10 20 30 40 50 60 70 80 90 100
HounofNiClSmi
Figure 5. Differential PPC Transcript Accumulation during SaltStress.(A) Slot-blot hybridization of differential PPC1 and PPC2 transcriptaccumulation during salt stress. Equal amounts of total RNA fromice plants stressed with 0.5 M NaCI for various lengths of time(US, unstressed; 1, 5 hr; 2, 29 hr; 3, 53 hr; 4, 77 hr; 5, 100 hr)were slot-blotted onto nitrocellulose filters as twofold serial dilu-tions (5.0 tig to 0.18 jig). Duplicate filters were hybridized withequal counts of radiolabeled Ppc 1 - or Ppc2-specific probes (Figure1), washed under high-stringency (60°C) conditions, and exposedto x-ray film.(B) Quantitation of the differential accumulation of steady-statelevels of PEPCase transcripts during salt stress. Autoradiogramswere scanned with a laser densitometer and the values from threedilutions in the linear range were averaged. The relative percenthybridization signal was plotted.
ROOTSUS 1 3 5
LEAVESUS 1 3 5
PPC1
ROOTSUS 1 3 5
LEAVESUS 1 3 5
PPC2
Figure 6. Differential Expression of Ppc Genes in Roots andLeaves.Serial dilutions (5.0 //g to 0.31 Mg) of total RNA were analyzed byslot-blot hybridization as described in Figure 5. RNA was isolatedfrom hydroponically grown plants that were unstressed (US) orstressed for 1, 3, or 5 days with 0.5 M NaCI.
Dow
nloaded from https://academ
ic.oup.com/plcell/article/1/7/715/5970352 by guest on 09 February 2022
PEPCase Isogene Expression during Stress 721
a.O
6 8 10Time in Minutes
Figure 7. In Vitro Transcription Rates of Isolated Ice Plant Nucleiduring Salt Stress.
In vitro transcription rates of nuclei isolated from either unstressedplants of 4 weeks P) or 6 weeks (*) of age or plants that hadbeen stressed for 1 (0), 3 (D), or 5 (A) days with 0.5 M NaCI wereplotted over a 15-min time period. Incorporation kinetics wereassayed as described in Methods. Values shown are the averageof two independent experiments.
Ppd transcription rates at a level half that of plants salt-stressed for 5 days (data not shown).
DISCUSSION
The salt stress- or drought-inducible transition from a C3mode of photosynthetic carbon metabolism to CAM in thefacultative halophyte Mesembryanthemem crystallinumprovides a model system for studying adaptation to envi-ronmental stress in higher plants (Michalowski et al., 1989).We are interested in understanding the underlying molec-ular mechanisms responsible for this metabolic transitionand the factors responsible for conferring the ability of thisplant to adapt to conditions of water stress. CAM, arelatively widespread phenomenon occurring in many plantfamilies, is clearly one of the ways in which these plantshave adapted to arid environments. Despite an impressiveamount of physiological and biochemical knowledge aboutCAM, relatively little is known about the genetic basis ofthis complex metabolic process. As a first step towardunderstanding CAM induction, we have isolated two dif-ferent genes for PEPCase, the enzyme responsible for theprimary fixation of CO? in C4 and CAM, and characterizedtheir differential expression.
Two different members of the PEPCase family in iceplant were characterized by sequence analysis. Bothgenes share identical intron placement within their codingregions (Figures 1 and 2) and are 76.4% identical at the
4 wks US
- PPC1
- PPC2
- Lambda
-SSU
-FNR
- rDNA
B
4 wks US 1 3 5duration of stress (days)
Figure 8. Characterization of in Vitro Synthesized Transcripts byIsolated Ice Plant Nuclei.
(A) Autoradiogram of DNA-RNA slot-blot hybridizations. Radiola-beled in vitro transcripts synthesized by nuclei isolated fromunstressed plants 4 weeks old (4 wks) or 6 weeks old (US) orplants stressed for 1, 3, or 5 days with 0.5 M NaCI were hybridizedto 5 Mg of DNA from Ppd (AMC-2C), Ppc2 (XMc-4C) genomicclones, X, SSU (pC3-3) from ice plant, FNR (pFNR-1) from iceplant, and 18S rDNA (pSRI.2B3) from soybean (Eckenrode, Ar-nold, and Meagher, 1985) and immobilized onto nitrocellulose.Replica filters were washed at high stringency and exposed to x-ray film.(B) Quantitation of transcripts synthesized in vitro by isolatednuclei. Slots from nitrocellulose filters were cut out and quantitatedby liquid scintillation counting. Radioactive counts were plottedas a percent of relative hybridization to rDNA. The average valuesof two independent experiments are shown.
Dow
nloaded from https://academ
ic.oup.com/plcell/article/1/7/715/5970352 by guest on 09 February 2022
722 The Plant Cell
nucleotide sequence level within exons. The predicted polypeptides of the PEPCase isozymes are 83% identical at the amino acid level (Figure 3). Biochemical analysis of PEPCase proteins isolated from ice plant confirms that two closely related isoforms of the enzyme are present in this facultative CAM plant. These two isozymes were judged to be very similar to one another on the basis of digestion by V8 protease and acidic hydrolysis analysis (Hijfner et al., 1989).
The ice plant PEPCase gene family consists of two or perhaps three members. Each of the PEPCase genes described here is present as a single copy per genome equivalent. Hybridization by the Ppc2-specific probe at low stringency to other restriction fragments not highlighted by Ppcl and PpcP at high stringency suggests the possi- bility that additional PEPCase genes similar to Ppc2 may exist in ice plant (Figure 4). Similarly, the PEPCase gene family in the C4 plant. maize consists of five members (Gruta and Hudspeth, 1987). From these two examples, it would seem likely that the different forms of PEPCase that have been identified in various plant species (Ting and Osmond, 1973) are encoded by different members of a PEPCase gene family. Furthermore, specific members of the gene family are likely to be preferentially expressed to account for the major isozyme species associated with C4 and CAM photosynthesis.
Upon salt stress, steady-state transcript levels of one member of the PEPCase gene family (Ppcl) increase by about 30-fold, paralleling enzyme and activity increases during CAM induction. In contrast, a second member of the PEPCase gene family (Ppc2) exhibits a slight decrease in its mRNA levels after 5 days of salt stress (Figure 5). To determine whether the PEPCase isogenes are expressed differentially in specific organs, steady-state transcript lev- els were examined in roots and leaves during stress. When total RNA isolated from leaves and roots was hybridized to a Ppcl-specific probe, steady-state transcript levels increased in leaves during stress as expected. This obser- vation is consistent with the biochemical analysis that an isozyme of PEPCase having an apparent molecular weight of 1 O0 accumulates in response to salt stress during CAM induction (Hofner et al., 1989). In roots, transcripts for both genes are clearly present in unstressed plants, but then decrease as the duration of the stress period increases. The initial presence of transcripts for both PEPCase iso- genes in roots is consistent with the finding of two iso- zymes in root extracts (Hofner et al., 1989). We propose that Ppcl encodes the photosynthetic CAM form of PEP- Case, which is responsible for primary CO, fixation under salt stress. The expression of fpc2 decreases slightly during salt stress. This pattern of expression is consistent with the observation of a second isoform of the enzyme with an apparent molecular weight of 11 O found in both roots and leaves of C3 plants that does not increase appreciably in leaves during CAM induction (Hofner et al., 1989). This second PEPCase gene may encode an enzyme
that carries out nonphotosynthetic anapleurotic “house- keeping” functions (Andreo, Gonzalez, and Iglesias, 1987) or may represent another form of the enzyme conducting CAM-related CO, fixation in roots.
CAM may not be solely a response to water stress, but a more general metabolic adaptation to environments that have low concentrations of CO, (Ting, 1985). Certain aquatic species that experience CO, depletion during the day take up CO, at night and store it as malate. CO, in the form of bicarbonate is then assimilated the following day in a photosynthetic CAM manner (Keeley and Morton, 1982; Keeley, 1983). CAM has also been shown to be operative in orchid roots that lack stomata (Goh, Arditti, and Avadani, 1983). The presence of transcripts and pro- tein arising from Ppcl in root tissues of ice plant suggests that CAM processes may be operative there. A more detailed analysis of the molecular species of PEPCase functioning in roots (during stress) is required.
Previous experiments using in vitro translation of iso- lated mRNA from unstressed and stressed leaves sug- gested that the induction of PEPCase during salt stress was due to increased levels of PEPCase mRNA (Ostrem et al., 1987). To confirm directly that these increases in PEPCase transcript levels, specifically transcripts from Ppcl , are the result of transcriptional activation, we con- ducted nuclear run-on transcription experiments using iso- lated nuclei of ice plant. With increasing duration of stress, the overall rates of incorporation of radiolabeled UTP de- clined (Figure 7). The transcription rates for Ppcl were much greater than those of PpcP (Figure 8B). Furthermore, the pattern of increased transcription rates for Ppcl mir- rors the pattern of overall Ppcl transcript accumulation (Figures 5B and 8B). The transcriptional induction of Ppcl can also be induced simply by withholding water from the plants. Thus, increased rates of transcription from Ppcl appear not to be a specific result of NaCl stress, but rather a general response to water stress. The activation of Ppcl is slow in comparison with many other plant responses brought about by environmental stimuli. This delayed re- sponse suggests the possibility that secondary messen- gers might be involved in the signal transduction pathway linking water stress to CAM induction.
While the expression of Ppcl is clearly under transcrip- tional control, one cannot rule out the possibility that additional levels of gene regulation such as changes in mRNA turnover rates or alternate processing of large pre- mRNA molecules are involved in regulating the expression of Ppcl.. In fact, we observed that very young plants (4 weeks old) can accumulate Ppcl -specific transcripts when salt-stressed (J.M. Schmitt, unpublished data), but fail to accumulate the CAM form of the PEPCase enzyme (Os- trem et al., 1987). This response indicates that post- transcriptional regulatory mechanisms may be important for the regulation of CAM induction.
We expect that other genes encoding enzymes, partic- ularly those of the glycolytic pathway whose activity is
Dow
nloaded from https://academ
ic.oup.com/plcell/article/1/7/715/5970352 by guest on 09 February 2022
PEPCase lsogene Expression during Stress 723
induced during CAM induction (Holtum and Winter, 1982), will exhibit similar kinetic patterns of transcriptional acti- vation. We have isolated via differential screening of mRNA from unstressed and stressed plants a number of cDNA clones that exhibit patterns of transcript accumulation during salt stress that are similar to that of f pc l . One of these clones encodes a cytosolic form of glyceraldehyde- 3-phosphate dehydrogenase, an enzyme that plays a ma- jor role in the glycolytic pathway (J.A. Ostrem, D.M. Ver- non, and H.J. Bohnert, submitted). These genes may share common 5' sequence elements that are involved in their coordinate regulation. Characterization of the upstream sequences of genes whose expression is induced by en- vironmental stresses will allow the dissection of the mech- anisms that regulate gene expression of this important plant metabolic pathway. In addition to the specific acti- vation of Ppcl by water stress demonstrated here, the promoter for this gene is likely to be very complex, as PEPCase expression is also modulated by a diurnal rhyth- micity (Vernon et al., 1988) that is one of the central characteristics of CAM (Ting, 1985). We are currently studying this diurnal regulation at the mRNA and transcrip- tional level. Further study of cis-acting regulatory elements and putative transcription factors will enable us eventually to understand the signal transduction pathway involved in the perception of water stress and the metabolic adjust- ments implemented by the ice plant to cope with such stress.
ME T H O D S
Growth and Hanresting of Plant Material
Common ice plants (Mesembryanthemum crystallinum) were grown from seedlings as previously described (Ostrem et al., 1987). Plants were stressed when 6 weeks to 7 weeks old by irrigation each day with a nutrient solution containing 0.5 M NaCI. Plant material was collected at various times after stress (as indicated in figure legends), frozen in liquid nitrogen, and stored at -7OOC. Hydroponically grown plants for organ-specific anal- yses were grown in 0.5 X Hoagland solution with aeration and stressed by adding NaCl solution to a final concentration of 0.5 M to the nutrient solution.
Construction and Screening of Genomic Library
Common ice plants were grown in the greenhouse for 6 weeks. Eighty grams of plant material (leaves and stems) were harvested, and the DNA was isolated according to the method of Bedbrook (1981). When analyzed by electophoresis in a 0.5% agarose gel, the isolated DNA migrated slightly slower than intact bacterio- phage T4 DNA (-1 65 kb).
Aliquots of 12 pg of total genomic DNA were partially digested for various times with 6 units of Mbol and separated on a 0.5% agarose gel. The fragments between 23 kb and 9 kb (A Hindlll markers) were electroeluted from gels using a Biotrap apparatus
(Schleicher & Schuell, Inc.). The eluted DNA was subjected to a partia1 fill-in reaction and ligated into the Xhol site of X FIX (Stratagene, Inc.) according to manufacturer's instructions. 0.1 pg to 0.3 pg of ligated DNA was packaged in vitro using packaging extracts prepared according to method B (Maniatis, Fritsch, and Sambrook, 1982). 0.5 to 0.8 x 10⁵ recombinant phage were obtained per packaging reaction. The primary library was screened for PEPCase clones using a nick-translated (Maniatis, Fritsch, and Sambrook, 1982) 2.5-kb Xhol fragment of a PEPCase cDNA clone designated pl211, which contains most of the coding region of the gene from the common ice plant (Rickers et al., 1989). Individual hybridizing plaques were purified by three rounds of plaque hybridization (Benton and Davis, 1977).
lsolation and Characteriration of X DNA from Clones
Large-scale isolation of X DNA was conducted according to the method of Carlock (1987) except that the CsCl gradient purifica- tion step was omitted. Restriction analysis of isolated DNA was conducted according to manufacturer's recommendations.
DNA Sequencing and Sequence Data Analysis
DNA fragments from X clones that hybridized to p1211 and thus were likely to contain PEPCase coding regions were subcloned into plasmid vectors pTZ18u or pTZ19u (Mead and Kemper, 1986). Single-stranded plasmid DNA was made according to Vieira and Messing (1 987). Deletion subclones for sequence analy- sis were generated using the technique of Date, McClure, and Hutchins (1985) and sequenced using the dideoxy chain termi- nation method with a modified form of T7 DNA polymerase (Sequenase) (Tabor and Richardson, 1987).
DNA sequence data were compiled using the DNA lnspector Ile sequence analysis program (Textco, Inc., Keene, NH) and analyzed using the programs of the University of Wisconsin Ge- netics Computer Group (Devereux, Haeberli, and Smithies, 1985) on a Digital Equipment Corporation microVAX2. Amino acid se- quence alignments were conducted using the FASTP search algorithm described by Lipman and Pearson (1985).
Genomic DNA Blots
Total genomic DNA was isolated according to the method of Steinmüller and Apel (1 986). DNA fragments were transferred from 0.8% agarose gels onto nitrocellulose and hybridized to nick- translated probes as described below.
RNA Blots and Slot-Blots
Total RNA was isolated and slot-blotted onto nitrocellulose as previously described (Michalowski et al., 1989). Nitrocellulose filters were prehybridized briefly and then hybridized at 42°C in 6 X SSC (SSC = 0.15 M NaCI, 0.01 M Naa citrate) containing 50% (v/v) formamide and 0.25% (w/v) nonfat dry milk (Johnson et al., 1984) with the appropriate radioactive probe labeled by nick translation (Maniatis, Fritsch, and Sambrook, 1982). Filters were washed in 2 x SSC/O.lo/o SDS at room temperature or at 6OoC
Dow
nloaded from https://academ
ic.oup.com/plcell/article/1/7/715/5970352 by guest on 09 February 2022
724 l h e Plant Cell
in 0.1 x SSC/O.l% SDS. l h e filters were exposed to x-ray film (X-omat AR-5, Kodak) at -7OOC with intensifying screens. Slot- blots were quantitated with a GS 300 scanning densitometer (Hoefer Scientific Instruments) coupled to a Shimadzu Chroma- tapac CR-1 integrator.
In Vitro Transcription Assays
Nuclei were isolated at the beginning of the dark period (6 PM) according to the method of Hagen and Guilfoyle (1985) with some modifications. Briefly, after ether treatment, 20 g of fresh leaf tissue was ground with mortar and pestle in 40 mL of nucleus isolation buffer. The homogenate was filtered through two layers of Miracloth and a 90-fim nylon filter. Triton X-100 was added dropwise with stirring to the filtrate to a final concentration of 0.25%. The filtrate was then applied directly to Percoll gradients. The average yield of nuclei was about 1 .i3 x 105/g fresh weight of tissue. In vitro transcription assays containing 5 x 1 O5 nuclei were conducted as described (Hagen and Guilfoyle, 1985). Incor- poration of 32P-UTP (>3000 Ci/mM) was assayed by spotting duplicate 2-bL samples removed during various periods of incu- bation at 3OoC onto Whatman DE81 filters. Filters were washed five times in 5% NaHPO,, two times in dionized H20, and two times in 95% ethanol, dried, and counted in 5-mL of nonaqueous scintillation mixture.
DNA Slot-Blot Hybridization
Plasmid or h DNA (5 fig) was denatured by heating for 1 hr at 65OC in 0.3 M NaOH, neutralized with 0.5 M NH40Ac (pH 4.7), and diluted with 5 volumes of 10 X SSC (pH 7.0). DNA was then applied to nitrocellulose using a slot-blot device, and membranes were baked for 2 hr at 80°C. Filters were then hybridized to 32P- RNA synthesized by isolated nuclei (1 X 10' cpm/2 mL) as described for RNA slot-blot analysis.
ACKNOWLEDGMENTS
This work is supported by USDA-CRGP 87-1-2474 to H.J.B. and USDA-CRSR 86-2-2748. J.C.C. is the recipient of a National Science Foundation Postdoctoral Fellowship in Plant Biology (DMB-8710662). G.M. and J.M.S. acknowledge support from the Deutsche Forschungsgemeinschaft (Schm 490) and Leibnitz grant to Prof. U. Heber. We thank R.B. Meagher for the gift of the 18s rRNA clone from soybean. The authors thank D.M. Vernon and Drs. J.A. Ostrem and C.C. Wasmann for critical reading of the manuscript.
Received Aprill4, 1989; revised May 15, 1989.
REFERENCES
Andreo C.S., Gonzalez, D.H., and Iglesias, A.A. (1987). Higher plant phosphoenolpyruvate carboxylase. FEBS Lett. 213, 1-8.
Bedbrook, J. (1 981). A plant nuclear DNA preparation procedure. Plant MOI. Biol. Newslett. 2, 24.
Benton, W.D., and Davis, R.W. (1977). Screening Lambda gt recombinant clones by hybridization to single plaques in situ. Science 196, 180-1 82.
Brulfert, J., and Queiroz, O. (1 982). Photoperiodism and Cras- sulacean acid metabolism. 111. Different characteristics of the photoperiod-sensitive and non-sensitive isoforms of phos- phoenolpyruvate carboxylase and Crassulacean acid metabo- lism operation. Planta 154, 339-343.
Brulfert, J., Guerrier, D., and Queiroz, O. (1 982). Photoperiodism and Crassulacean acid metabolism. II. Relations between leaf aging and photoperiod in Crassulacean acid metabolism induc- tion. Planta 154, 332-338.
Brulfert, J., Miiller, D., Kluge, M., and Queiroz, O. (1982). Photoperiodism and Crassulacean acid metabolism. 1. Immu- nological and kinetic evidences for different patterns of phos- phoenolpyruvate carboxylase isoforms in photoperiodically in- ducible and noninducible Crassulacean acid metabolism plants. Planta 154, 326-331.
Carlock, L.R. (1987). Analyzing lambda libraries. Focus 8, 6-8. Dale, R.M.K., McClure, B.A., and Houchins, J.P. (1 985). A rapid
single-stranded cloning strategy for producing a sequential series of overlapping clones for use in DNA sequencing: Appli- cation to sequencing the corn mitochondrial 18s rDNA. Plasmid
Devereux, J., Haeberli, P., and Smithies, O. (1 985). A compre- hensive set of sequence analysis programs for tbne VAX. Nucl. Acids Res. 12, 387-393.
Eckenrode, V.K., Arnolcl, J., and Meagher, R.B. (1985). Com- parison of the nucleotide sequence of soybean 18s rRNA with the sequences of other small-subunit rRNAs. J. MOI. Evol. 21,
Foster, J.G., Edwards, G.E., and Winter, K. (1982). Changes in levels of phosphoenolpyruvate carboxylase with induction of Crassulacean acid metabolism in Mesembryanthemum crystal- linum L. Plant Cell Physiol. 23, 585-594.
Goh, C.J., Arditti, J., and Avadani, P.N. (1983). Carbon fixation in orchid aerial roots. New Phytol. 95,367-374.
Grula, J.W., and Hudspeth, R.L. (1987). The phosphoenolpyru- vate carboxylase gene family of maize. In Plant Gene Systems and Their Biology, I.L. Key and L. Mclntosh, eds (New York: Alan R. Liss), pp. 207-21 6.
Hagen, G., and Guilfoyle, T.J. (1985) . Rapid induction of selec- tive transcription by auxins. MOI. Cell. Biol. 5, 1197-1203.
Harpster, M.H., and Taylor, W.C. (1 986). Maize phosphoenolpy- ruvate carboxylase: Cloning and characterization of mRNAs encoding isozymic forms. J. Biol. Chem. 261, 61 32-6136.
Hofner, R., Vazquez-Moreno, L., Winter, K., Bohnert, H.J., and Schmitt, J.M. (1 987). lnduction of Crassulacean acid metabo- lism in Mesembryanthemum crystallinum by high salinity: Mass increase and de novo synthesis of PEP-carboxylase. Plant Physiol. 83, 91 5-919.
Hofner, R., Vazquez-Moreno, L., Abou-Mandour, A.A., Bohnert, H.J., and Schmitt, J.M. (1989). Two isoforms of phosphoenol- pyruvate carboxylase in the facultative CAM plant Mesembryan- themum crystallinum. Plant Physiol. Biochem., in press.
Holtum, J.A.M., and Winter, K. (1982). Activity of enzymes of
13,31-40.
259-269.
'
Dow
nloaded from https://academ
ic.oup.com/plcell/article/1/7/715/5970352 by guest on 09 February 2022
PEPCase lsogene Expression during Stress 725
carbon metabolism during the induction of Crassulacean acid metabolism in Mesembryanthemum crystallinum L. Planta 155,
Hudspeth, R.L., and Grula, J.W. (1 989). Structure and expression of the maize gene encoding the phosphoenolpyruvate carbox- ylase isozyme involved in C4 photosynthesis. Plant MOI. Biol., in press.
Hudspeth, R.L., Glackin, C.A., Bonner, J., and Grula, J.W. (1 986). Genomic and cDNA clones for maize phosphoenolpy- ruvate carboxylase and pyruvate, orthophosphate dikinase: Expression of different gene-family members in leaves and roots. Proc. Natl. Acad. Sci. USA 83, 2884-2888.
Johnson, D.A., Gautsch, J.W., Sportsman, J.R., and Elder, J.H. (1 984). lmproved technique utilizing nonfat dry milk for analysis of proteins and nucleic acids transferred to nitrocellulose filters. Gene Anal. Tech. 1, 3-8.
Jones, M.B. (1975). The effect of leaf age on leaf resistance and CO, exchange of the CAM plant Bryophyllum fedtschenkoi. Planta 123, 91-96.
Keeley, J.E. (1 983). Crassulacean acid metabolism in the season- ally submerged aquatic lsoetes howellii. Oecologia 58, 57-62.
Keeley, J.E., and Morton, B.A. (1982). Distribution of diurna1 acid metabolism in submerged aquatic plants outside the genus lsoetes. Photosynthetica 16, 546-553.
Kluge, M., and Ting, I.P. (1978). Crassulacean Acid Metabolism. Analysis of an Ecological Adaptation. Ecological Studies, Vol. 30, W.D. Billings and O.L. Lange, eds (Heidelberg: Springer- Verlag), p. 209.
Lipman, D.J., and Pearson, W.R. (1985). Rapid and sensitive protein similarity searches. Science 227, 1435-1 441.
Maniatis, T., Fritsch, E.F., and Sambrook, J. (1 982). Molecular Cloning: A Laboratory Manual. (Cold Spring Harbor, NY: Cold Spring Harbor Laboratory).
Mead, D.A., and Kemper, 8. (1 986). Chimeric single-stranded DNA phage plasmid cloning vectors. In A Survey of Molecular Cloning Vectors and Their Uses, R. Rodriguez and D.T. Den- hardt, eds (Boston: Butterworth), pp. 85-1 02.
Michalowski, C.B., Schmitt, J.M., and Bohnert, H.J. (1 989). Expression during salt stress and nucleotide sequence of cDNA for ferredoxin-NADP+ reductase from Mesembryanthemum crystallinum. Plant Physiol. 89, 81 7-822.
Michalowski, C.B., Olson, S.W., Piepenbrock, M., Schmitt, J.M., and Bohnert, H.J. (1989). Time course of mRNA induction elicited by salt stress in the common ice plant (Mesembryanthe- mum crystallinum). Plant Physiol. 89, 81 1-816.
Mount, S.M. (1982). A catalogue of splice junction sequences. Nucl. Acids Res. 10, 459-472.
Müller, D., and Kluge, M. (1983). lmmunological evidence for a crassulacean acid metabolism specific phosphoenolpyruvate carboxylase in Sedum and Kalanchoe species. Physiol. Veg.
Nelson, T., and Langdale, J.A. (1 989). Patterns of leaf develop- ment in C4 plants. Plant Cell 1, 3-1 3.
O’Leary, M.H. (1 982). Phosphoenolpyruvate carboxylase: An en- zymologist’s view. Annu. Rev. Plant Physiol. 33, 297-31 5.
Osmond, C.B., and Holtum, J.A.M. (1 981). Crassulacean acid metabolism. In Crassulacean Acid Metabolism, The Biochem-
8-16.
21,919-926.
istry of Plants, Vol. 8, M.D. Hatch and N.K. Boardman, eds (New York: Academic Press), pp. 283-328.
Ostrem, J.A., Olson, S.W., Schmitt, J.M., and Bohnert, H.J. (1987). Salt stress increases the leve1 of translatable mRNA for phosphoenolpyruvate carboxylase in Mesembryanthemum crystallinum. Plant Physiol. 84, 1270-1 275.
Rickers, J., Cushman, J.C., Michalowski, C.B., Schmitt, J.M., and Bohnert, H.J. (1989). Expression of the CAM-form of phosphoenolpyruvate carboxylase and nucleotide sequence of a full length cDNA from Mesembryanthemum crystallinum. MOI. Gen. Genet. 215,447-454.
Schmitt, J.M.,Michalowski, C.B., and Bohnert, H.J. (1988). Gene expression during CAM induction under salt stress in Mesem- bryanthemum: cDNA library and increased levels of mRNA for phosphoenolpyruvate carboxylase and pyruvate orthophos- phate dikinase. Photosynth. Res. 17, 159-171.
Sipes, D.L., and Ting, I.P. (1985). Crassulacean metabolism and crassulacean acid metabolism modifications in Peperomia camptotricha. Plant Physiol. 77, 59-63.
Steinmüller, K., and Apel, K. (1986). A simple and efficient procedure for isolating plant chromatin which is suitable for studies of DNase I-sensitive domains and hypersensitive sites. Plant MOI. Biol. 7, 87-94.
Tabor, S., and Richardson, C.C. (1987). DNA sequence analysis with a modified bacteriophage T7 DNA polymerase. Proc. Natl. Acad. Sci. USA 84,4767-4771.
Ting, I.P. (1 985). Crassulacean acid metabolism. Annu. Rev. Plant Physiol. 36, 595-622.
Ting, I.P., and Hanscom, 2. (1 977). lnduction of acid metabolism in Portulacaria afra. Plant Physiol. 59, 51 1-514.
Ting, I.P., and Osmond, C.B. (1973). Multiple forms of plant phosphoenolpyruvate carboxylase associated with different metabolic pathways. Plant Physiol. 51, 448-453.
Ting, I.P., and Rayder, L. (1982). Regulation of C3 to CAM shifts. In Crassulacean Acid Metabolism, I.P. Ting and M. Gibbs, eds (Baltimore: Waverly Press), pp. 193-207.
Vernon, D.M., Ostrem, J.A., Schmitt, J.M., and Bohnert, H.J. (1 988). PEPCase transcript levels in Mesembryanthemum crys- tallinum decline rapidly upon relief from salt stress. Plant Phys- iol. 86, 1002-1 004.
Vieira, J., and Messing, J. (1 987). Production of single-stranded plasmid DNA. Methods Enzymol. 153, 3-12.
von Willert, D.J., Kirst, G.O., Treichel, S., and von Willert, K. (1976a). The effect of leaf age and salt stress on malate accumulation and phosphoenolpyruvate carboxylase in Mesem- bryanthemum crystallinum. Plant Sci. Lett. 7, 341 -346.
von Willert, D.J., Treichel, S., Kirst, G.O., and Curdts, E. (1976b). Environmentally controlled changes of phosphoenolpyruvate carboxylases in Mesembryanthemum. Phytochemistry 15,
Winter, K., and von Willert, D.J. (1972). NaCl induzierter Cras- sulaceen-Saurestoffwechsel bei Mesembryanthemum crystal- linum Z. Pflanzenphysiol. 67, 166-170.
Yanagisawa, S., Izui, K., Yamaguchi, Y., Shigesada, K., and Katsuki, H. (1988). Further analysis of cDNA clones for maize phosphoenolpyruvate carboxylase involved in C4 photosyn- thesis. FEBS Lett. 229, 107-1 1 O.
1435-1 436.
Dow
nloaded from https://academ
ic.oup.com/plcell/article/1/7/715/5970352 by guest on 09 February 2022