Embed Size (px)
Citation preview

MIT ICATMIT ICAT
Operating Costs and Productivity Measures
Dr. Peter P. Belobaba
16.75J/1.234J
Airline Management
February 15, 2006

MIT ICATMIT ICAT DOT Form 41
• Form 41 contains traffic, financial, and operating cost data reported to the DOT by US Major airlines– Data is reported and published quarterly for most tables
– Detail of reporting differs for different expense categories• Aircraft operating expenses by aircraft type and region of operation
• Other expenses more difficult to allocate by aircraft type
• DOT Form 41 includes the following schedules:– P12 : Profit and Loss statement
– P52 : Aircraft Operating Expenses
– P6 : Operating Expenses by Objective Groupings
– P7 : Operating Expenses by Functional Groupings
– P10 : Employment Statistics
– B1 : Balance Sheet

MIT ICATMIT ICAT Objective Cost Category Breakdown (3Q2005)
Source: ATA data
U N IT C O S T B Y C A T E G O R YC ents per A S M
0.00
0 .50
1 .00
1 .50
2 .00
2 .50
3 .00
3 .50
Labo
r
Fuel
Ow
ners
hip
Prof
essi
onal
Serv
ices
Land
ing
Fees
Food
&
Beve
rage
Mai
nten
ance
Mat
eria
l
Pass
enge
r
Com
mis
sion
s
Insu
ranc
e
Com
mun
icat
ion
Ad &
Prom
otio
n
Utils
& O
ffice
Supp
lies
Oth
er

MIT ICATMIT ICAT Form 41 Functional Cost Categories
• Aircraft operating costs– Expenses associated with flying aircraft, also referred to as “Direct
Operating Costs” (DOC)
• Aircraft servicing costs– Handling aircraft on the ground, includes landing fees
• Traffic service costs– Processing passengers, baggage and cargo at airports
• Passenger service costs– Meals, flight attendants, in-flight services
• Reservation and Sales costs– Airline reservations and ticket offices, travel agency commissions
• Other costs, including:– Advertising and publicity expense– General and administrative expense

MIT ICATMIT ICAT Activity Drivers by Functional Category
• Aircraft Operating Costs– Per Block Hour (for example, $3415 for 185-seat B757-200 in 2003)
• Aircraft Servicing Costs– Per Aircraft Departure (average $1135 in 2003)
• Traffic Servicing Costs– Per Enplaned Passenger (average $18)
• Passenger Servicing Costs– Per RPM (average $0.015)
• Reservations and Sales Costs– % of Total Revenue (average 10%)
• Other Indirect and System Overhead Costs– % of Total Operating Expense (average 12%)

MIT ICATMIT ICAT 2004 Functional Cost Breakdown

MIT ICATMIT ICAT Airline Operating Cost Breakdown
• Adapted from Form 41, used by Boeing, MIT (and Aviation Daily) for more detailed comparisons
FLIGHT (DIRECT) OPERATING COSTS (DOC) = 50%• All costs related to aircraft flying operations
• Include pilots, fuel, maintenance, and aircraft ownership
GROUND OPERATING COSTS = 30%• Servicing of passengers and aircraft at airport stations
• Includes aircraft landing fees and reservations/sales charges
SYSTEM OPERATING COSTS = 20%• Marketing, administrative and general overhead items
• Includes in-flight services and ground equipment ownership
• Percentages shown reflect historical “rules of thumb”.

MIT ICATMIT ICAT Flight Operating Costs
• Flight operating costs (FOC) by aircraft type:– Reflect an average allocation of system-wide costs per block hour,
as reported by airlines for each aircraft type
– Can be affected by specific airline network or operational patterns
– Collected by US DOT as Form 41 operating data from airlines
• Typical breakdown of FOC for US carrier:CREW: Pilot wages and benefits
FUEL: Easiest to allocate and most clearly variable cost
MAINTENANCE: Direct airframe and engine maintenance cost, plus “burden” or overhead (hangars and spare parts inventory)
OWNERSHIP: Depreciation, leasing costs and insurance

MIT ICATMIT ICAT Example: B757-200 FOC (2003 US data)
• Costs per block-hour of operations (avg. 181 seats):
CREW $ 869
FUEL $ 904
MAINTENANCE $ 875
OWNERSHIP $ 767
TOTAL FOC $3415 per block-hr
• Based on 1267 mile average stage length and 9.7 block-hr daily utilization (weighted averages):
– Different stage lengths and utilization by different airlines result in substantial variations in block-hour costs for same aircraft type
– Also, differences in crew costs (union contracts, seniority), maintenance costs (wage rates), and ownership costs (age of a/c)

MIT ICATMIT ICAT Boeing 757-200 Flight Operating Costs 2003
Table 9 - Hourly flight and Seats Costs for the B757-200
Number of Sv HFC HSC Utilization SLAirline Aircraft (seats) ($/hr) ($/seat-hr) (hrs/day) (Miles)American 142 175 3370.1 19.26 10.2 1430.8Delta 106 185 3382.8 18.29 11.0 1084.8United 96 182 3516.8 19.32 9.1 1361.5Northwest 54 182 2923.7 16.06 9.2 1157.7Continental 41 178 3445.7 19.36 10.7 1506.1US Airways 30 182 4308.0 23.67 9.9 1015.2ATA 16 214 4284.3 20.02 8.9 1390.4America West 13 190 3808.4 20.04 8.3 1073.5average 498 186 3630.0 19.50 9.7 1252.5
Source: DOT Form41 Schedule P-5.2

MIT ICATMIT ICAT Unit Cost by Airline Group
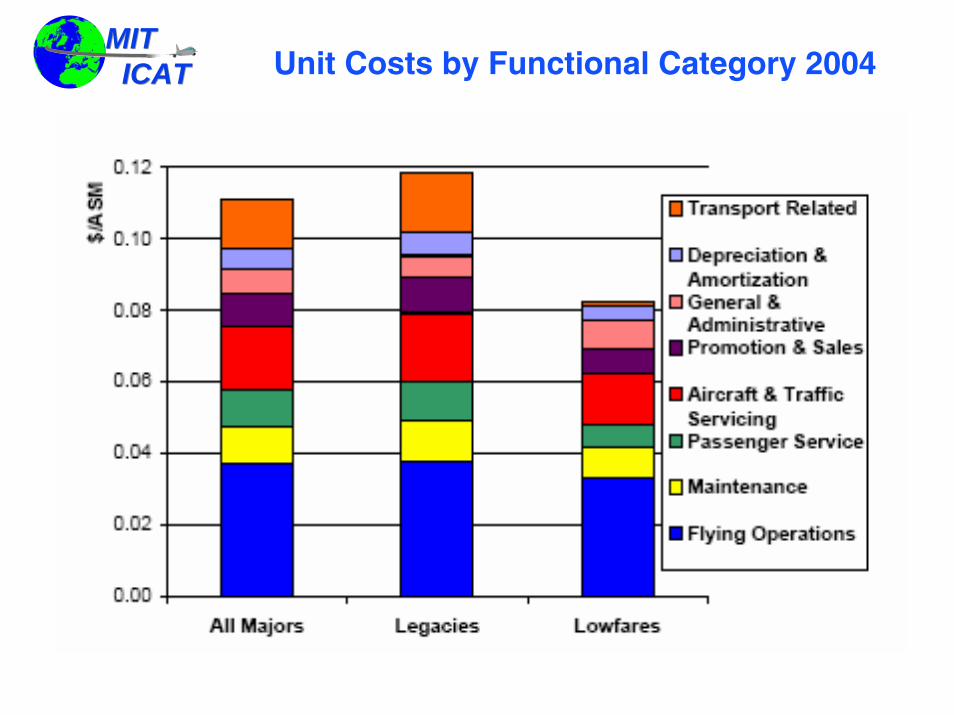
MIT ICATMIT ICAT Unit Costs by Functional Category 2004

MIT ICATMIT ICAT
Lowfare carriers have lowest CASM across all average stage lengths
C A S M v s . S ta g e L e n g th 2 0 0 3
A A
C O
D L
N WU A
U S
A S
H P
T Z
W N
B 6
F L
$ 0 .0 5
$ 0 .0 6
$ 0 .0 7
$ 0 .0 8
$ 0 .0 9
$ 0 .1 0
$ 0 .1 1
$ 0 .1 2
$ 0 .1 3
$ 0 .1 4
$ 0 .1 5
0 5 0 0 1 0 0 0 1 5 0 0
S t a g e L e n g t h ( m i l e s )
CA
SM
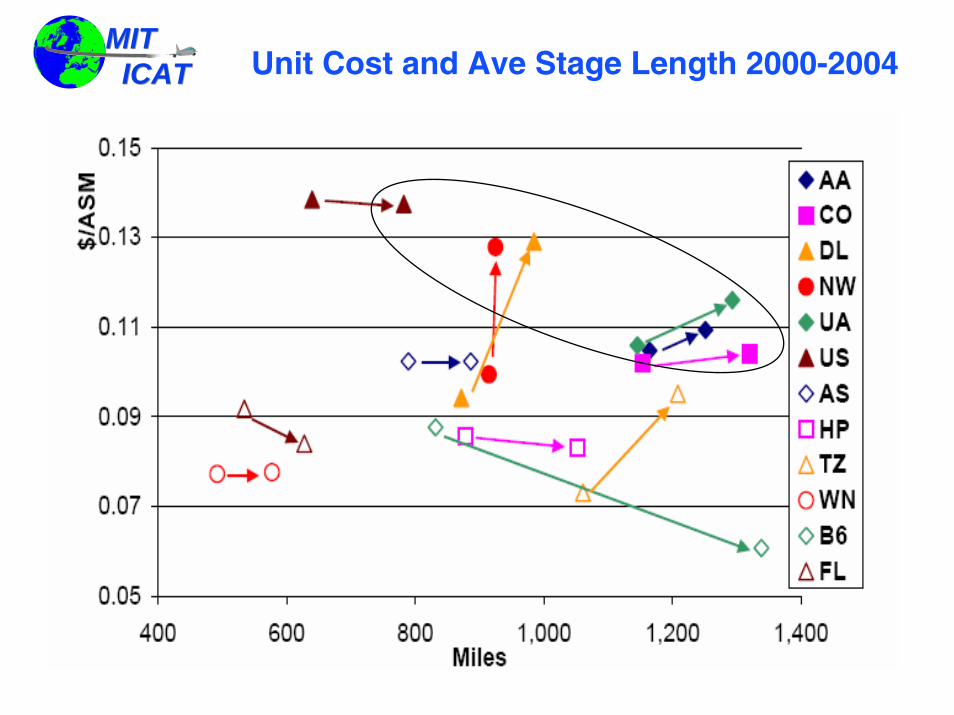
MIT ICATMIT ICAT Unit Cost and Ave Stage Length 2000-2004

MIT ICATMIT ICAT Ex-transport related CASM 2000-2004

MIT ICATMIT ICAT Yield and Stage Length 2000-2004

MIT ICATMIT ICAT Aircraft Productivity
• Measured in ASMs generated per aircraft per day:
= # departures X average stage length X # seats
• Aircraft “utilization” measured in block-hours/day:– Block hours begin at door close (blocks away from wheels) to door
open (blocks under wheels)
– Gate-to-gate time, including ground taxi times
• Increased aircraft productivity achieved with:– More flight departures per day, either through shorter turnaround
(ground) times or off-peak departure times
– Longer stage lengths (average stage length is positively correlated with increased aircraft utilization = block hours per day)
– More seats in same aircraft type (no first class seating and/or tighter “seat pitch”)
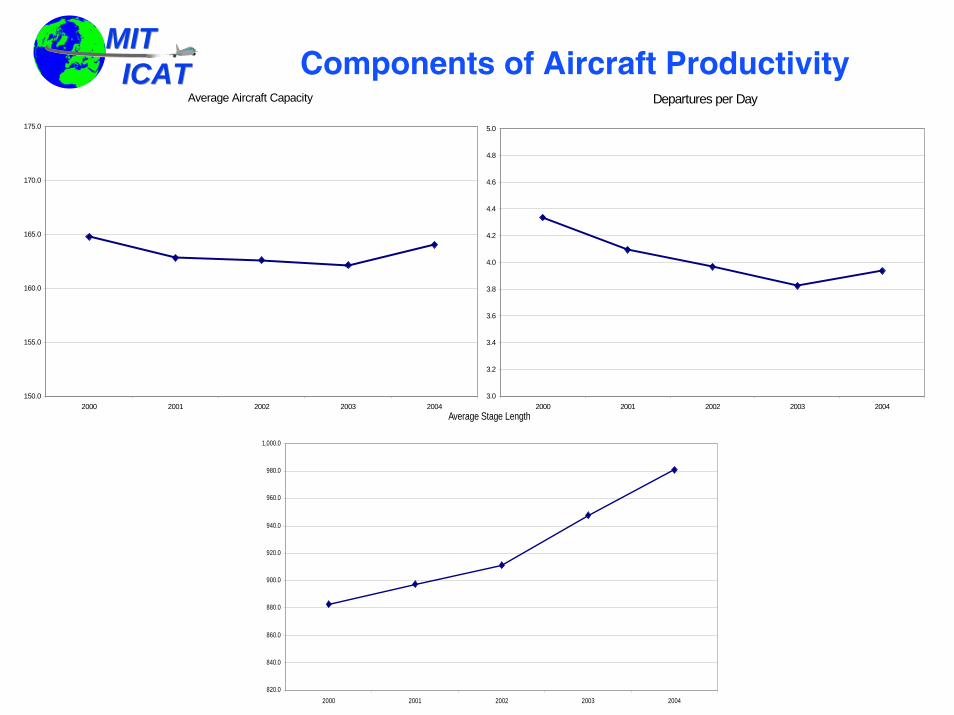
MIT ICATMIT ICAT Components of Aircraft Productivity
Average Stage Length
820.0
840.0
860.0
880.0
900.0
920.0
940.0
960.0
980.0
1,000.0
2000 2001 2002 2003 2004
Average Aircraft Capacity
150.0
155.0
160.0
165.0
170.0
175.0
2000 2001 2002 2003 2004
Departures per Day
3.0
3.2
3.4
3.6
3.8
4.0
4.2
4.4
4.6
4.8
5.0
2000 2001 2002 2003 2004

MIT ICATMIT ICAT US Major Airlines Aircraft Productivity
Aircraft Productivity (ASMs per day)
500,000
520,000
540,000
560,000
580,000
600,000
620,000
640,000
660,000
680,000
700,000
2000 2001 2002 2003 2004

MIT ICATMIT ICAT AIRCRAFT UTILIZATION 1999-2003
8.00
8.50
9.00
9.50
10.00
10.50
11.00
11.50
12.00
19991
19992
19993
19994
20001
20002
20003
20004
20011
20012
20013
20014
20021
20022
20023
20024
20031
20032
20033
20034
Blo
ck H
ours
per
Day
TOP 6 NETWNON-NETW

MIT ICATMIT ICAT Example: Boeing 737-500 Productivity
Airline Flights per Day
Block Hours
Stage Length
Seats ASMs
Continental 3.9 8.3 719 104 291,246
United 4.3 7.5 564 109 264,284
Southwest 8.2 10.2 400 122 399,746
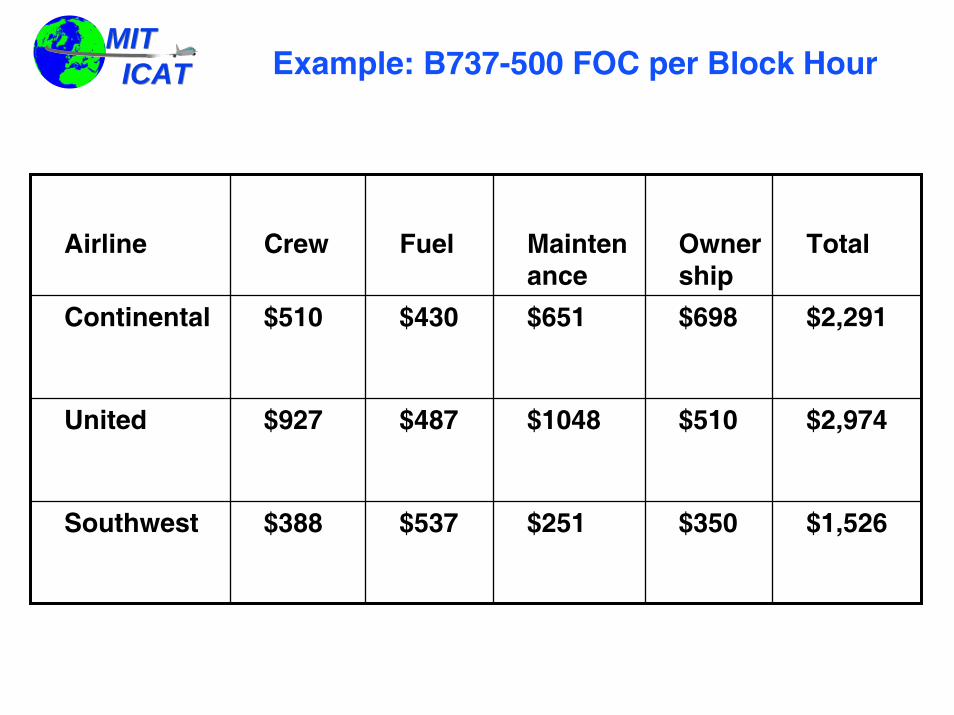
MIT ICATMIT ICAT Example: B737-500 FOC per Block Hour
Airline Crew Fuel Maintenance
Ownership
Total
Continental $510 $430 $651 $698 $2,291
United $927 $487 $1048 $510 $2,974
Southwest $388 $537 $251 $350 $1,526
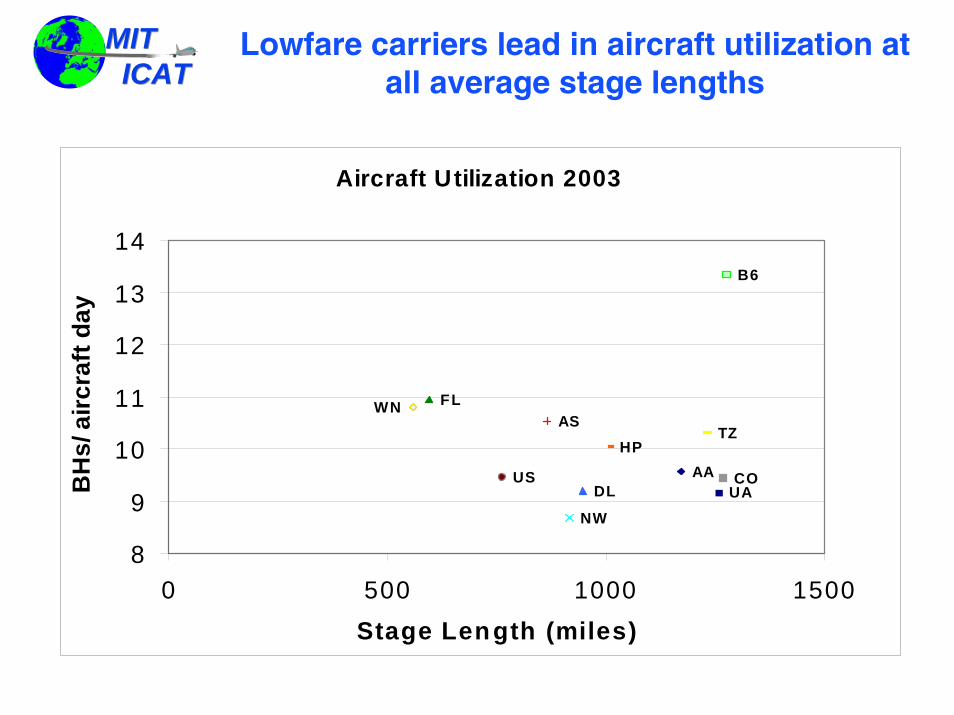
MIT ICATMIT ICAT
Lowfare carriers lead in aircraft utilization at all average stage lengths
Aircraft Utilization 2003
AA CODL
NWUA
US
ASHP
TZWN
B6
FL
8
9
10
11
12
13
14
0 500 1000 1500Stage Length (miles)
BH
s/ a
ircra
ft d
ay
MIT ICATMIT ICAT Employee Productivity
• Measured in ASMs per employee per period
• As with aircraft, employee productivity should be higher with:
– Longer stage lengths (amount of aircraft and traffic servicing for each flight departure not proportional to stage length)
– Larger aircraft sizes (economies of scale in labor required per seat for each flight departure)
– Increased aircraft productivity due to shorter turnaround times (more ASMs generated by aircraft contribute to positive employee productivity measures)
• Yet, network airlines with long stage lengths and large aircraft have lower employee productivity rates

MIT ICATMIT ICAT
Legacy carrier employment down by 25% since 2000, a loss of over 100,000 jobs

MIT ICATMIT ICAT US Major Airline Labor Cost per Employee
Average Salary+Benefits per Employee
$60,000
$65,000
$70,000
$75,000
$80,000
$85,000
$90,000
2000 2001 2002 2003 2004

MIT ICATMIT ICAT
Lowfare carrier salaries/benefits per employee 25% lower than legacy carriers
Salaries and Benefits per Em ployee
$0
$10,000
$20,000
$30,000
$40,000
$50,000
$60,000
$70,000
$80,000
$90,000
1997 1998 1999 2000 2001 2002 2003
CPI
Adj
uste
d to
200
0
LegacyLowfare

MIT ICATMIT ICAT ASMs/employee vs. Average Stage Length
300
350
400
450
500
550
0 200 400 600 800 1000 1200 1400
Average Stage Length
AS
Ms/
Em
plo
yee
(000
)

MIT ICATMIT ICAT ASMs/employee and Average A/C Size
300
350
400
450
500
550
100 120 140 160 180 200
Average Seats per Departure
AS
Ms/
Em
plo
yee
(000
)

MIT ICATMIT ICAT Employee Productivity Up 30% From 2002
EMPLOYEE PR OD U C TIV ITYA S M s per FTE , 4 Qtr M oving S um
1,600
1,700
1,800
1,900
2,000
2,100
2,200
2,300
2,400
1Q90
1Q91
1Q92
1Q93
1Q94
1Q95
1Q96
1Q97
1Q98
1Q99
1Q00
1Q01
1Q02
1Q03
1Q04
1Q05
Source: ATA data

MIT ICATMIT ICAT ASM per Employee 2000-2004
Annual ASM per Employee
1,000,000
1,200,000
1,400,000
1,600,000
1,800,000
2,000,000
2,200,000
2,400,000
2,600,000
2,800,000
3,000,000
2000 2001 2002 2003 2004

MIT ICATMIT ICAT Revenue per Employee
Annual Operating Revenue per Employee
100,000
120,000
140,000
160,000
180,000
200,000
220,000
240,000
260,000
280,000
300,000
2000 2001 2002 2003 2004

MIT ICATMIT ICAT ASM per Dollar of Salaries+Benefits
Annual ASM per Dollar Salaries & Benefits
20.0
21.0
22.0
23.0
24.0
25.0
26.0
27.0
28.0
29.0
30.0
2000 2001 2002 2003 2004

MIT ICATMIT ICAT Revenue per Dollar of Labor Expense
Operating Revenue per Salary/Benefit Dollar
1.000
1.500
2.000
2.500
3.000
3.500
2000 2001 2002 2003 2004

MIT ICATMIT ICAT Summary: Airline Productivity Measures
• Aircraft Productivity– Aircraft Utilization (block-hours per day)
– ASMs per Aircraft per Day• Average Stage Length
• Number of Departures per Day
• Aircraft Capacity (seats per aircraft)
• Employee Productivity– ASMs per Employee
– ASMs per Labor Dollar
– Revenue per Employee,
– Revenue per Labor Dollar