Embed Size (px)
Citation preview

Sample size in cluster randomised trials
Sandra Eldridge
Professor of Biostatistics
Director of Pragmatic Clinical Trials Unit

Outline
• Introduction
• Background to trials in health services research/ primary health care
• Accounting for variation in cluster size
• Intra-cluster correlation coefficients
Sample size calculations in cluster randomised trials
- usual method
2
21
22
2
)(
)(2
zzN
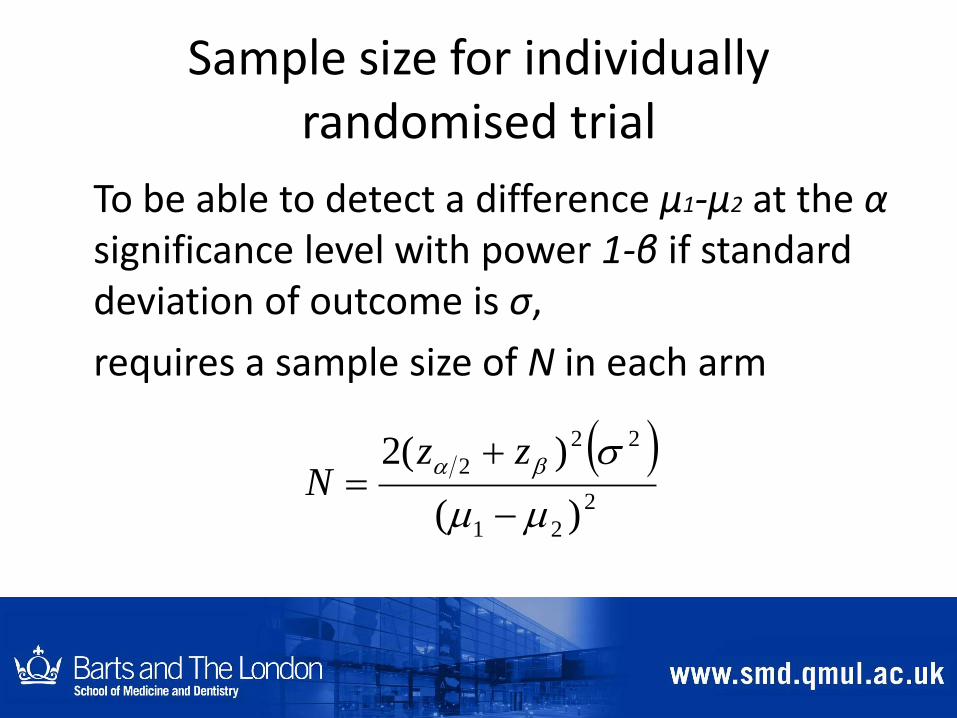
Sample size for individually randomised trial
To be able to detect a difference μ1-μ2 at the αsignificance level with power 1-β if standard deviation of outcome is σ,
requires a sample size of N in each arm
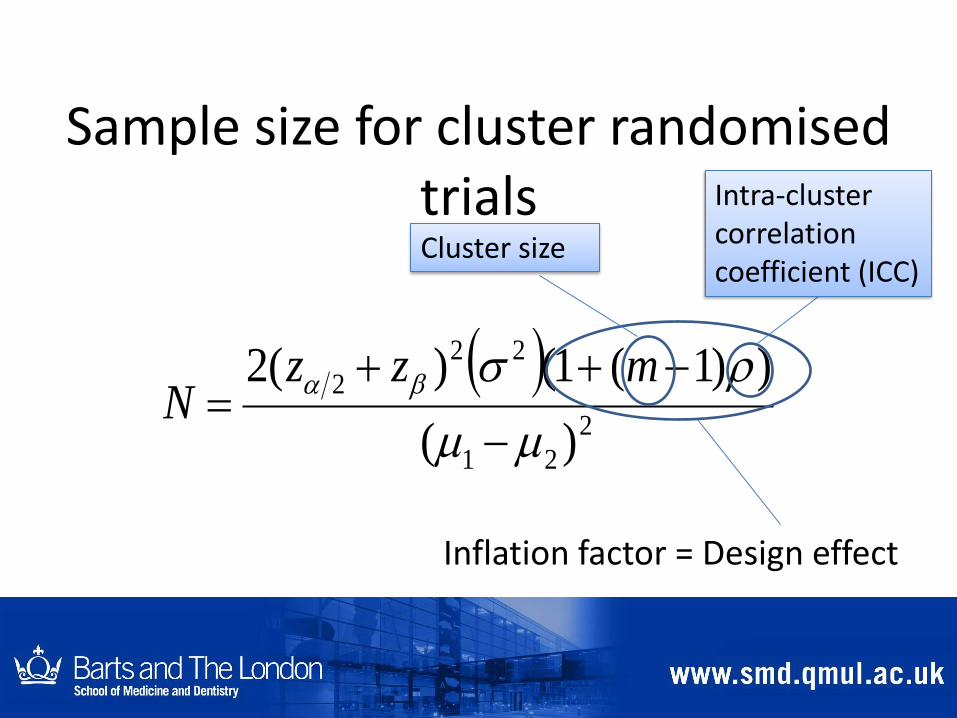
Sample size for cluster randomised trials
2
21
22
2
)(
))1(1()(2
mzzN
Inflation factor = Design effect
Intra-cluster correlation coefficient (ICC)
Cluster size

Derivation
ρ = σb2/ (σb
2 + σw2)
m = cluster size (assuming clusters are all the same size)
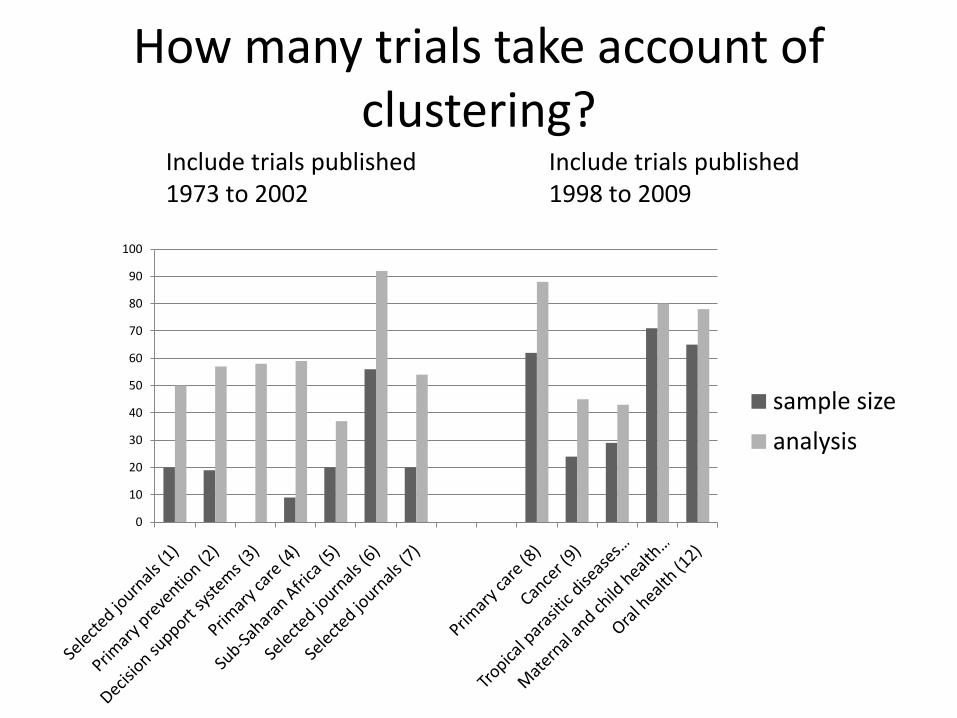
How many trials take account of clustering?
0
10
20
30
40
50
60
70
80
90
100
sample size
analysis
Include trials published Include trials published1973 to 2002 1998 to 2009
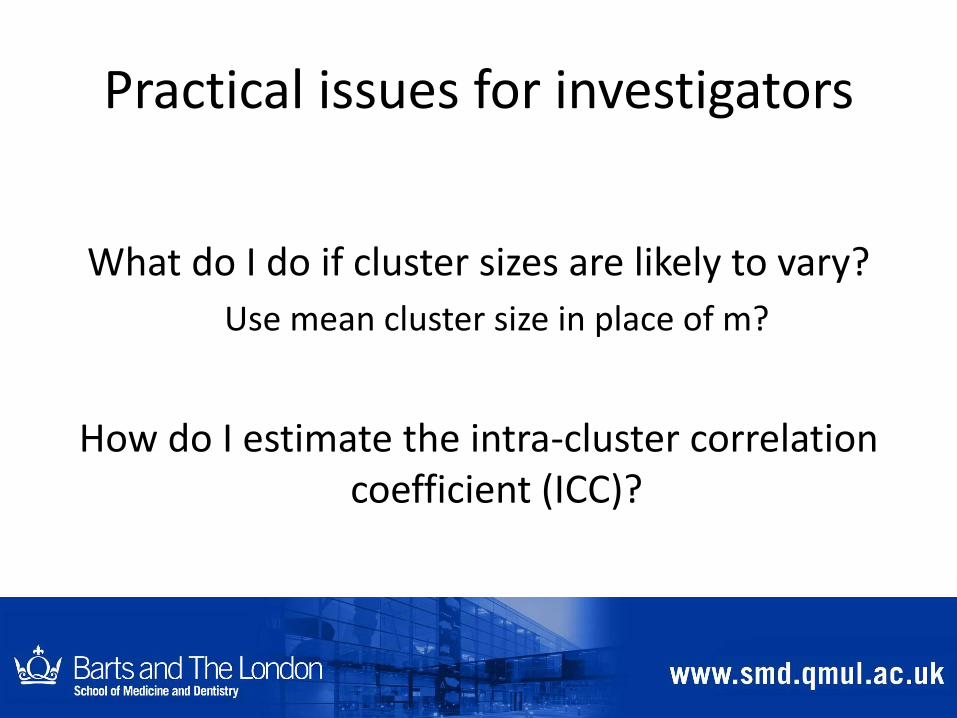
Practical issues for investigators
What do I do if cluster sizes are likely to vary?
Use mean cluster size in place of m?
How do I estimate the intra-cluster correlation coefficient (ICC)?

Trials in health services research Particularly in primary care

Frequently cluster randomised
Answer questions about the effect of
– Education to health professionals
– Changing organisational structure
– Addition of new staff
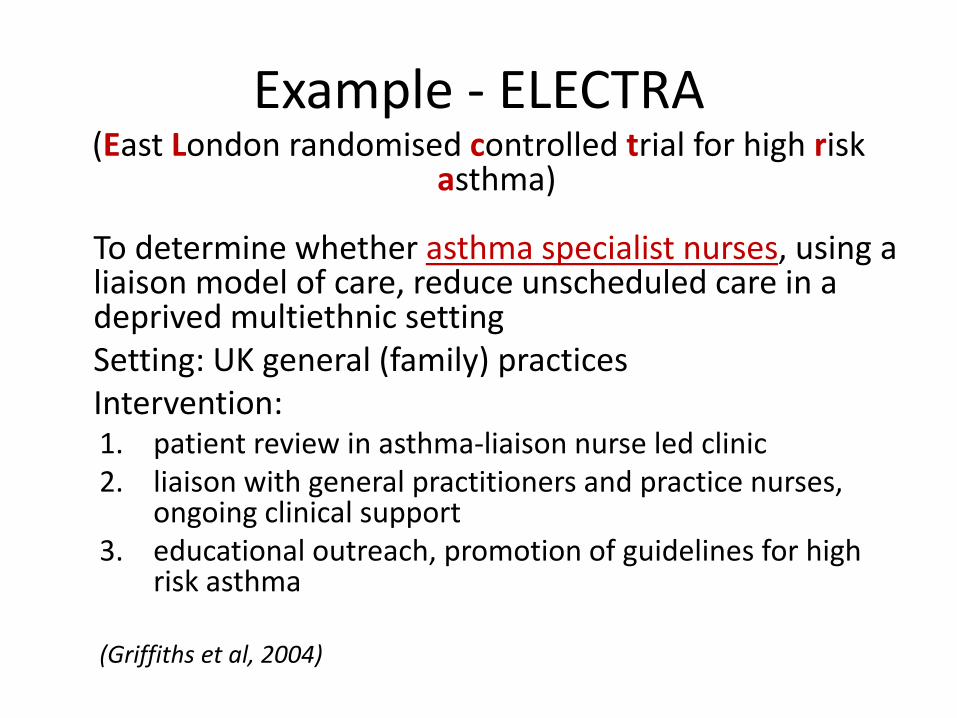
Example - ELECTRA (East London randomised controlled trial for high risk
asthma)
To determine whether asthma specialist nurses, using a liaison model of care, reduce unscheduled care in a deprived multiethnic settingSetting: UK general (family) practicesIntervention:1. patient review in asthma-liaison nurse led clinic 2. liaison with general practitioners and practice nurses,
ongoing clinical support3. educational outreach, promotion of guidelines for high
risk asthma
(Griffiths et al, 2004)
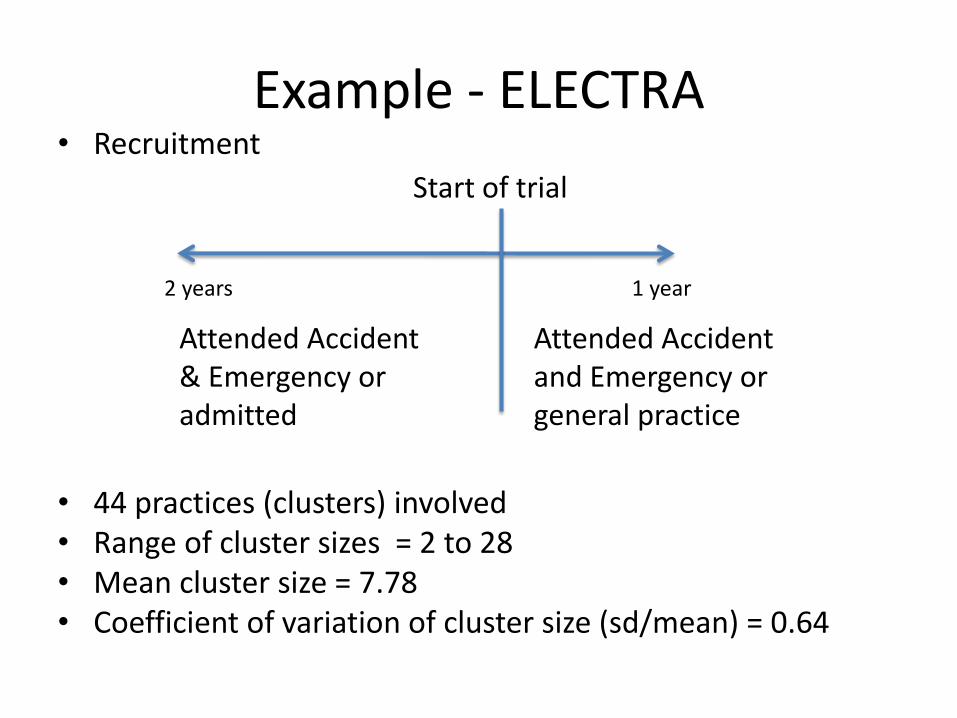
Example - ELECTRA• Recruitment
• 44 practices (clusters) involved• Range of cluster sizes = 2 to 28• Mean cluster size = 7.78• Coefficient of variation of cluster size (sd/mean) = 0.64
Start of trial
Attended Accident & Emergency or admitted
Attended Accident and Emergency or general practice
1 year2 years
Example - ELECTRA
• Primary outcome = attendance for unscheduled care in trial period
• ICC used in sample size calculation = 0.05
• Actual ICC = -0.0056
• Negative ICC set to zero for analysis (ieassume no clustering)
Four reviews, one methods paper
• Trials in primary care (Eldridge et al, 2004)
• Trials in oral health (Froud et al, in press)
• Trials in residential facilities for older people (Diaz-Ordaz, in preparation)
• Sample size estimation methods - review (Clare Rutterford, current PhD student)
• Sample size estimation when cluster sizes vary (Eldridge et al, 2006)
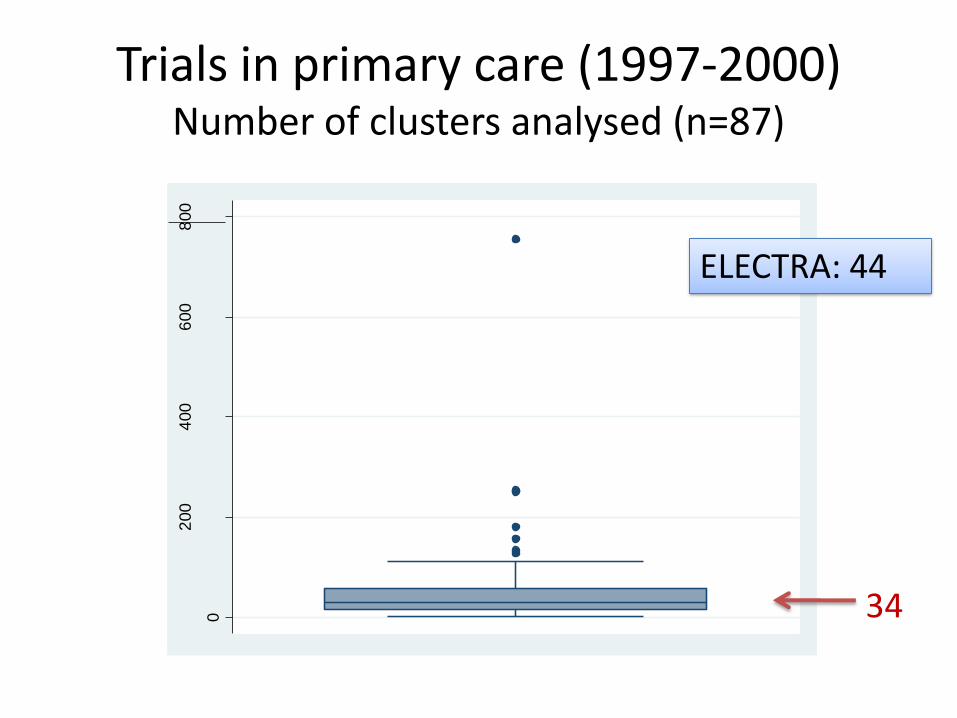
Trials in primary care (1997-2000) Number of clusters analysed (n=87)
0
200
400
600
800
num
ber
of clu
ste
rs a
naly
sed
34
ELECTRA: 44
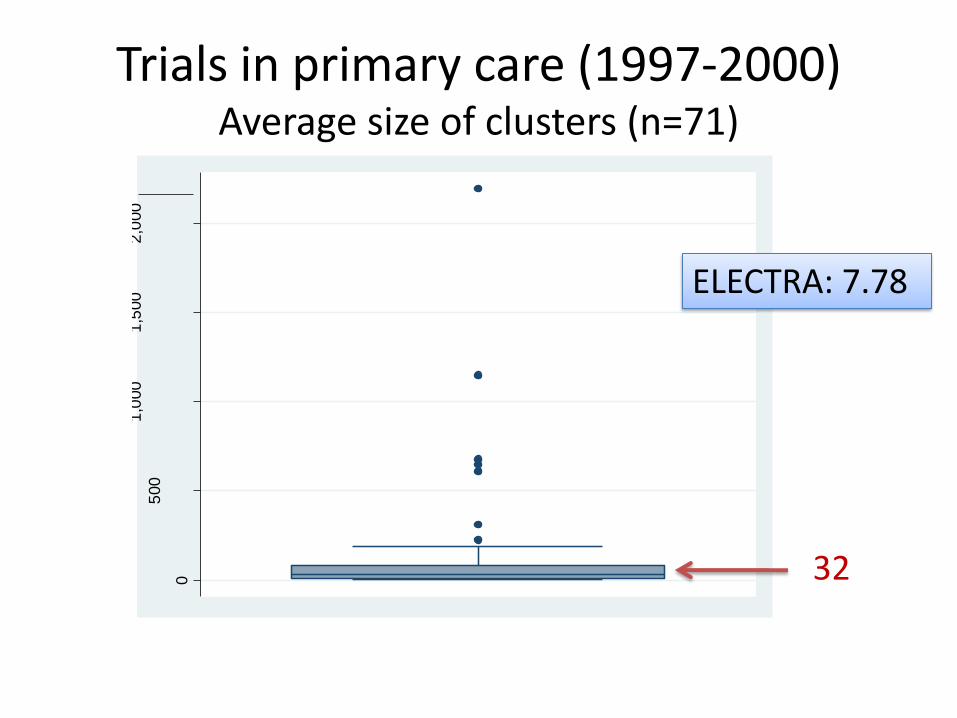
Trials in primary care (1997-2000) Average size of clusters (n=71)
0
500
1,0
00
1,5
00
2,0
00
avclu
siz
32
ELECTRA: 7.78
Trials in primary care (1997-2000) Unequal sized clusters (n=139)
• 27 (19%) attempted to have equal cluster sizes
• Usually recruiting
– from registers
– using incident cases
• Cluster size approx. proportional to total size of cluster
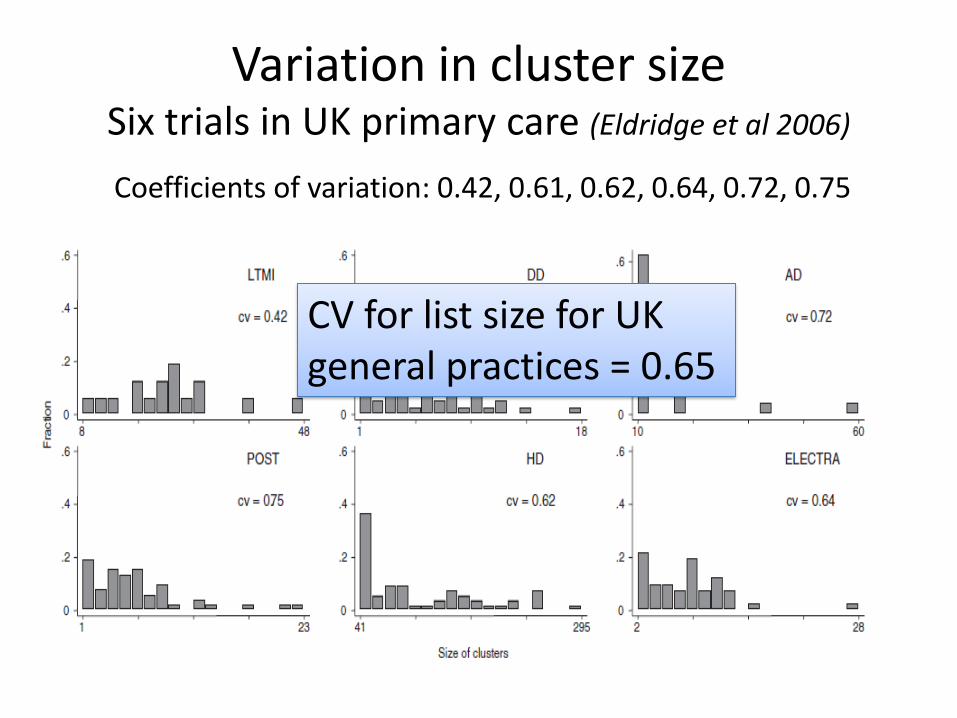
Variation in cluster sizeSix trials in UK primary care (Eldridge et al 2006)
Coefficients of variation: 0.42, 0.61, 0.62, 0.64, 0.72, 0.75
CV for list size for UK general practices = 0.65
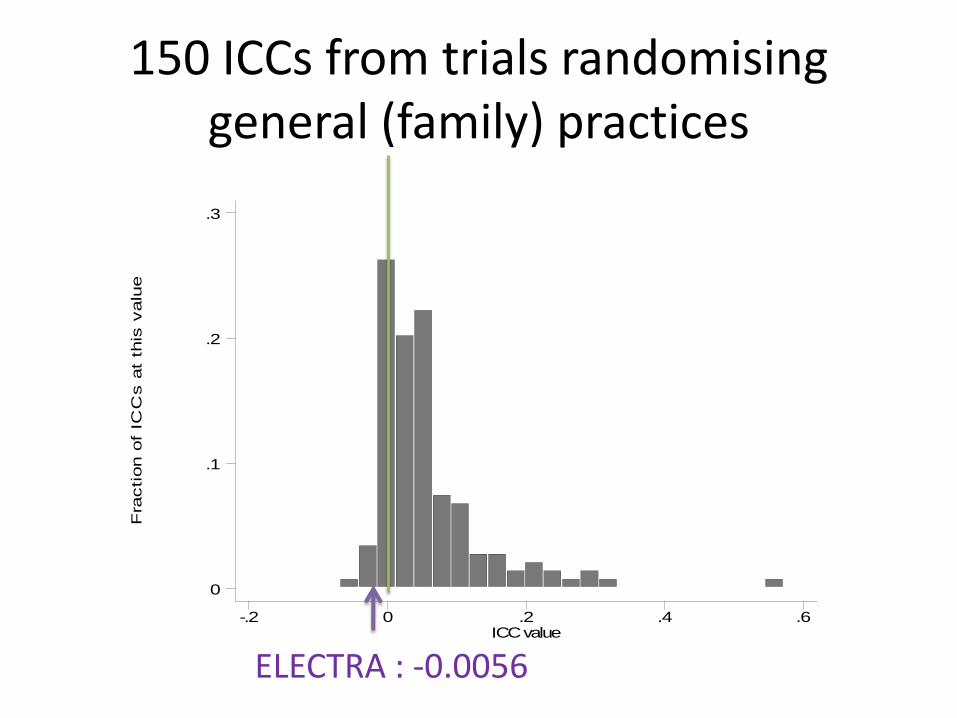
150 ICCs from trials randomising general (family) practices
Fra
ction o
f IC
Cs a
t th
is v
alu
e
ICC value-.2 0 .2 .4 .6
0
.1
.2
.3
ELECTRA : -0.0056
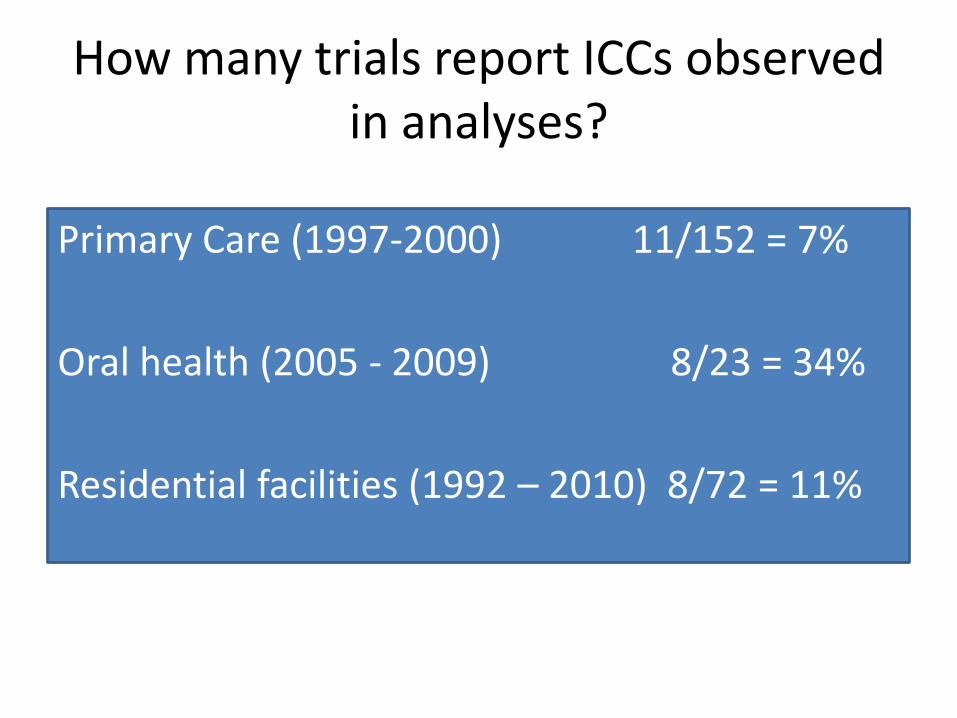
How many trials report ICCs observed in analyses?
Primary Care (1997-2000) 11/152 = 7%
Oral health (2005 - 2009) 8/23 = 34%
Residential facilities (1992 – 2010) 8/72 = 11%
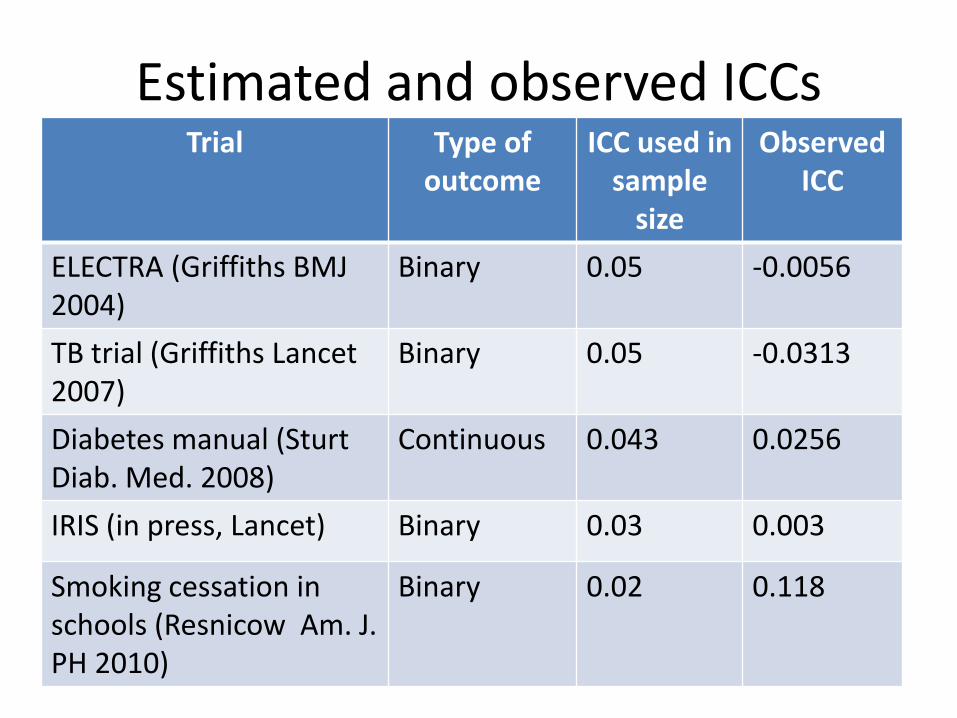
Estimated and observed ICCsTrial Type of
outcomeICC used in
sample size
Observed ICC
ELECTRA (Griffiths BMJ 2004)
Binary 0.05 -0.0056
TB trial (Griffiths Lancet 2007)
Binary 0.05 -0.0313
Diabetes manual (SturtDiab. Med. 2008)
Continuous 0.043 0.0256
IRIS (in press, Lancet) Binary 0.03 0.003
Smoking cessation in schools (Resnicow Am. J. PH 2010)
Binary 0.02 0.118
Summary
• ELECTRA not untypical in terms of
– Number of clusters
– Cluster size
– Unequal cluster sizes
– Observed ICC not very close to ICC used in sample size calculation
Issues
• Adjusting sample size estimation to account for variable cluster size
• Need information about variability in cluster size
• Need information about ICC
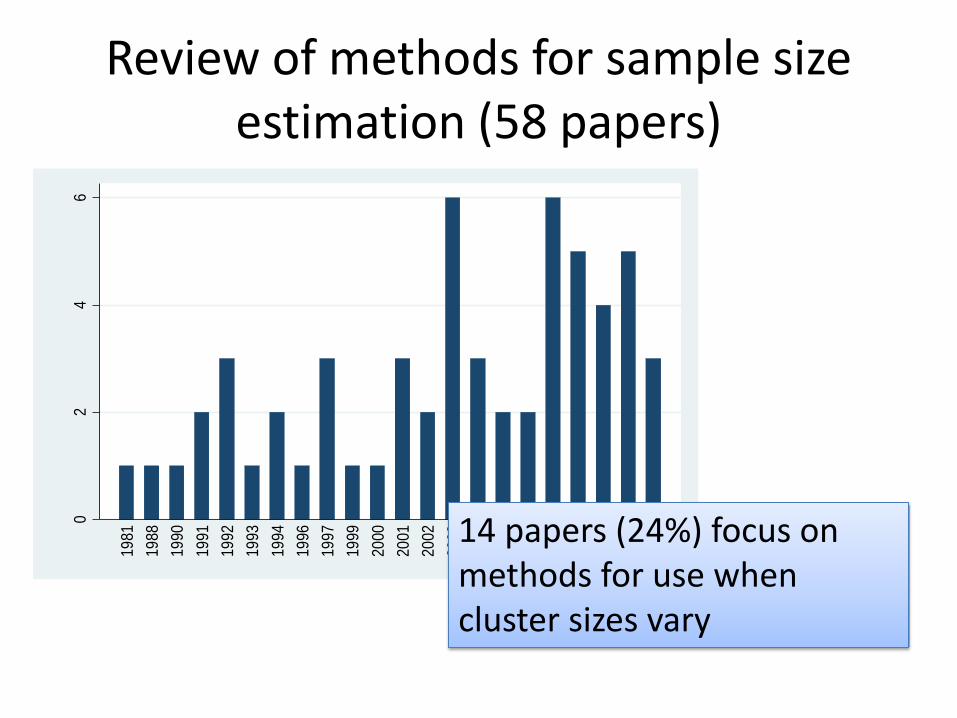
Review of methods for sample size estimation (58 papers)
02
46
Fre
que
ncy
1981
1988
1990
1991
1992
1993
1994
1996
1997
1999
2000
2001
2002
2003
2004
2005
2006
2007
2008
2009
2010
201114 papers (24%) focus on
methods for use when cluster sizes vary
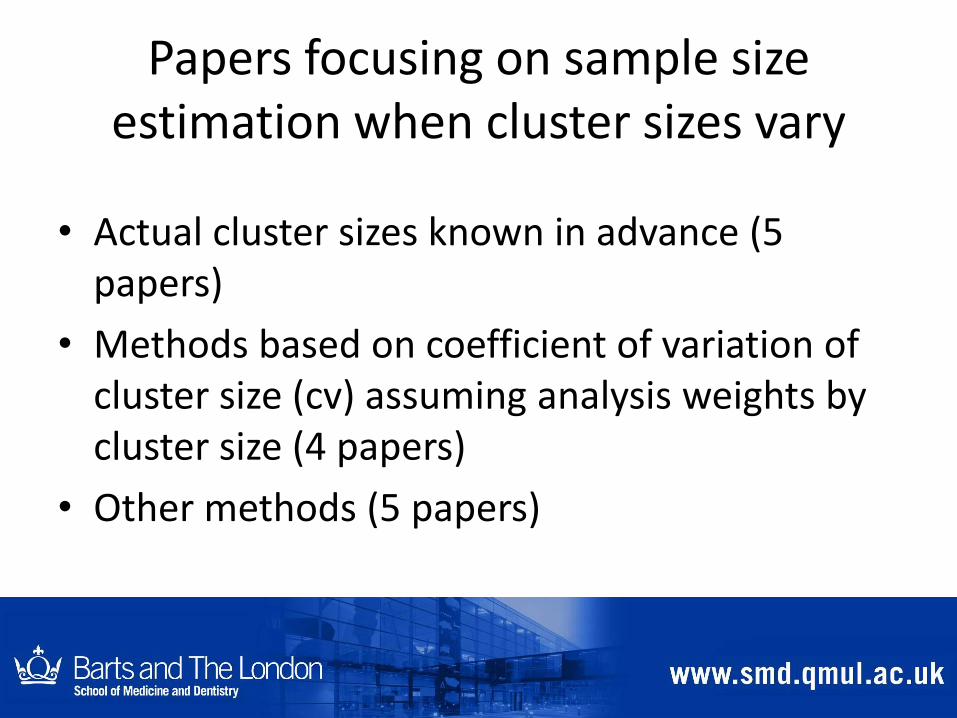
Papers focusing on sample size estimation when cluster sizes vary
• Actual cluster sizes known in advance (5 papers)
• Methods based on coefficient of variation of cluster size (cv) assuming analysis weights by cluster size (4 papers)
• Other methods (5 papers)
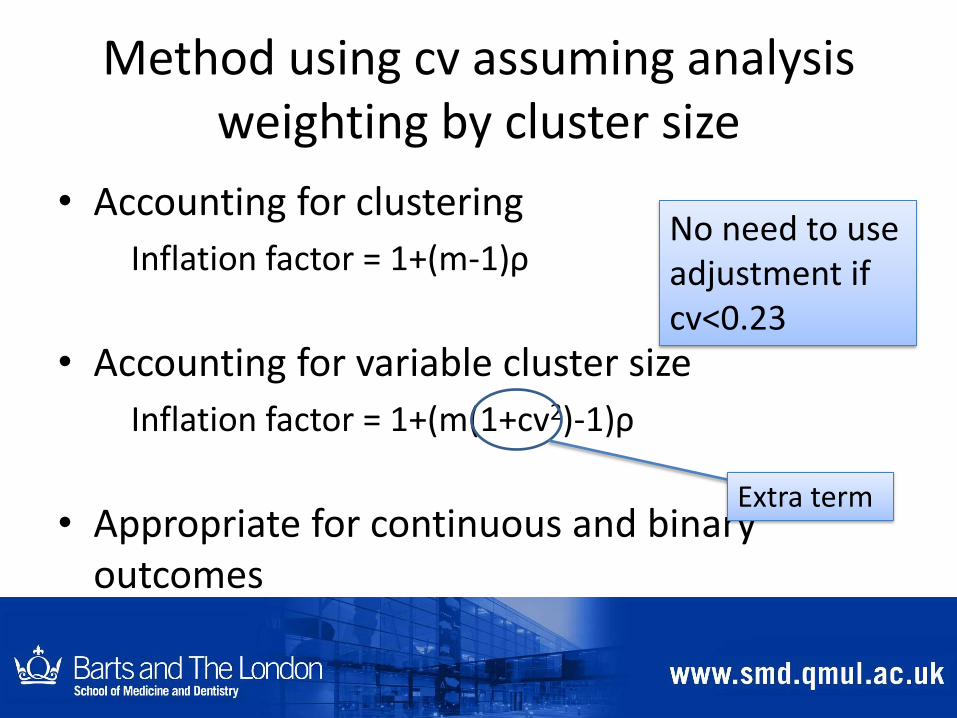
Method using cv assuming analysis weighting by cluster size
• Accounting for clustering
Inflation factor = 1+(m-1)ρ
• Accounting for variable cluster size
Inflation factor = 1+(m(1+cv2)-1)ρ
• Appropriate for continuous and binary outcomes
Extra term
No need to use adjustment if cv<0.23
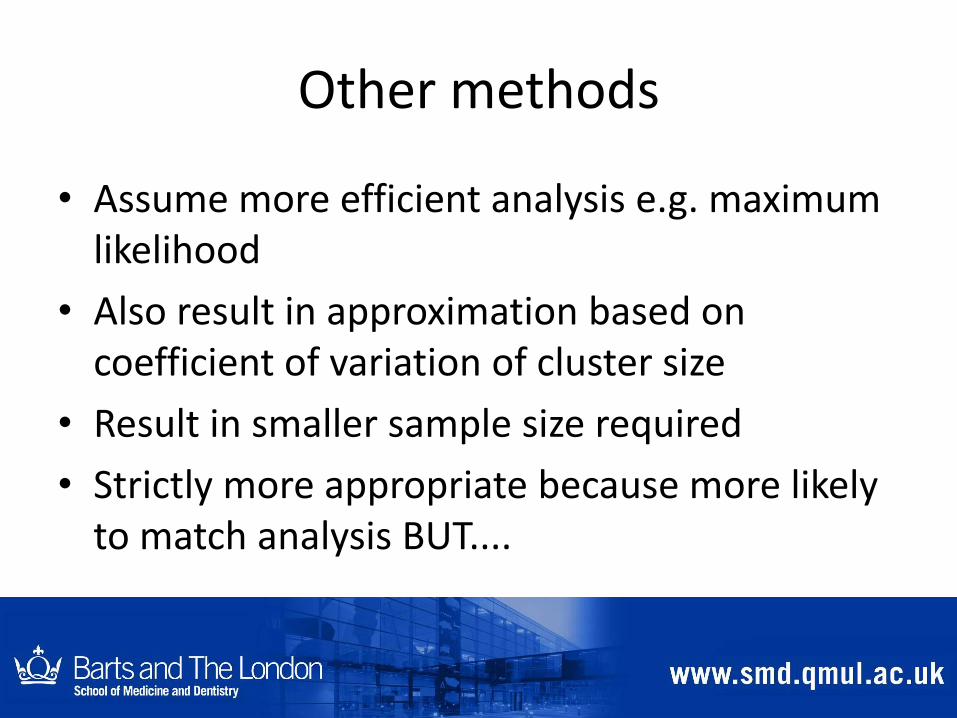
Other methods
• Assume more efficient analysis e.g. maximum likelihood
• Also result in approximation based on coefficient of variation of cluster size
• Result in smaller sample size required
• Strictly more appropriate because more likely to match analysis BUT....
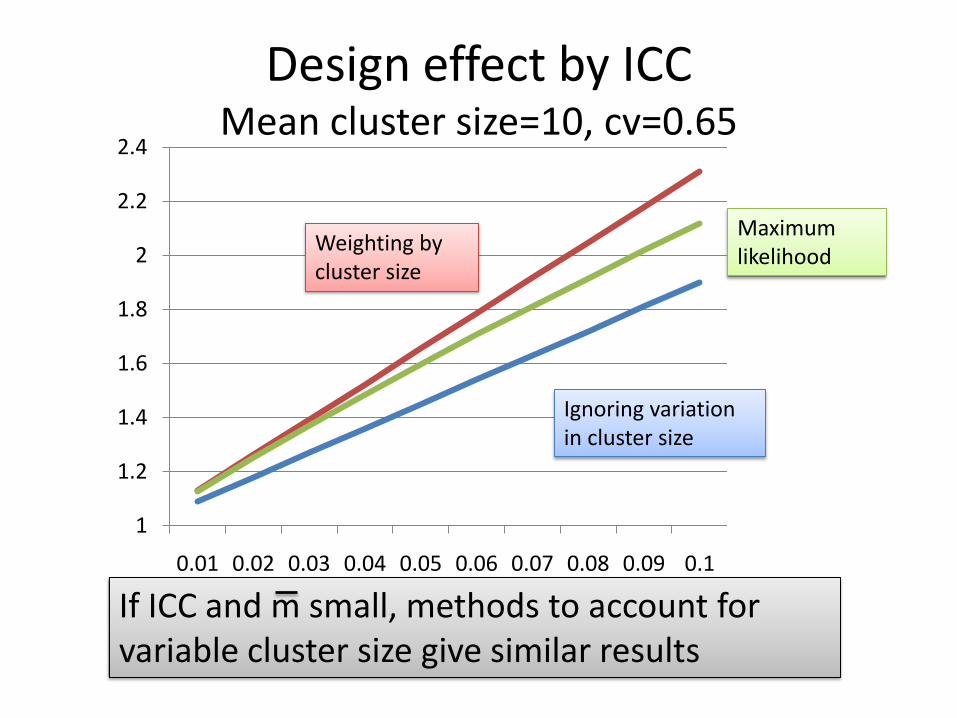
Design effect by ICCMean cluster size=10, cv=0.65
Maximum likelihood
1
1.2
1.4
1.6
1.8
2
2.2
2.4
0.01 0.02 0.03 0.04 0.05 0.06 0.07 0.08 0.09 0.1
If ICC and m small, methods to account for variable cluster size give similar results
Ignoring variation in cluster size
Weighting by cluster size
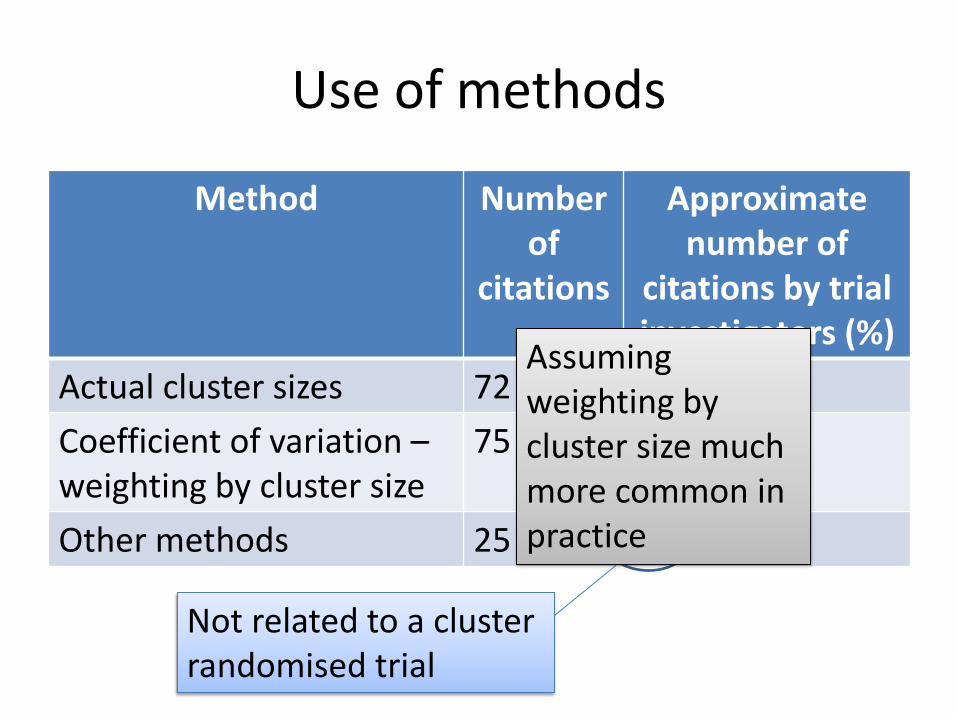
Use of methods
Method Number of
citations
Approximate number of
citations by trial investigators (%)
Actual cluster sizes 72 12 (16%)
Coefficient of variation –weighting by cluster size
75 16 (21%)
Other methods 25 1 (4%)
Not related to a cluster randomised trial
Assuming weighting by cluster size much more common in practice
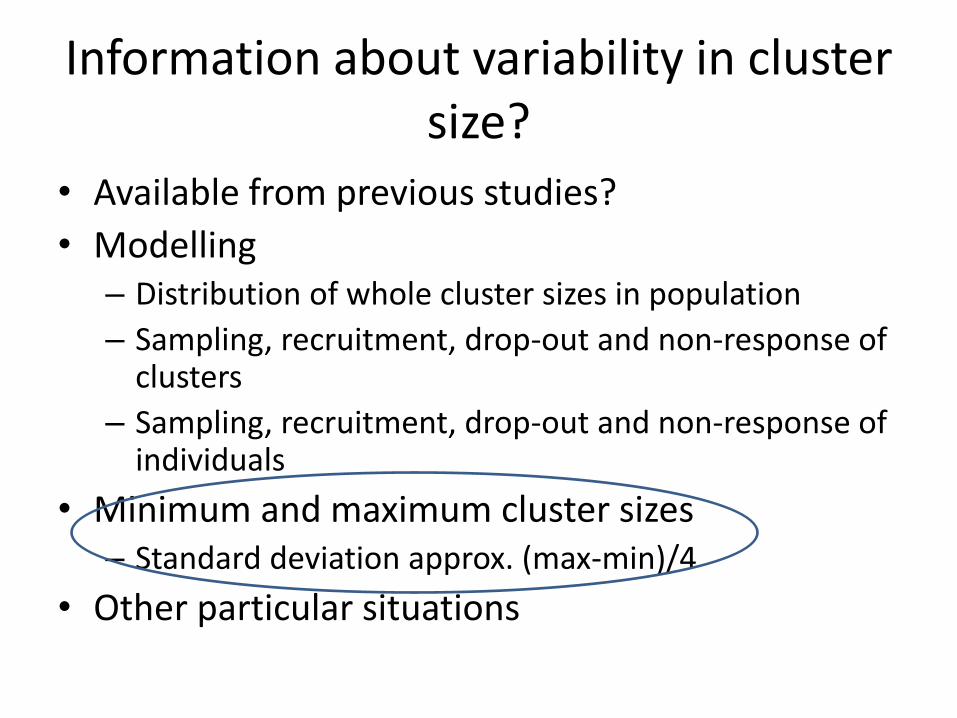
Information about variability in cluster size?
• Available from previous studies?
• Modelling – Distribution of whole cluster sizes in population
– Sampling, recruitment, drop-out and non-response of clusters
– Sampling, recruitment, drop-out and non-response of individuals
• Minimum and maximum cluster sizes – Standard deviation approx. (max-min)/4
• Other particular situations
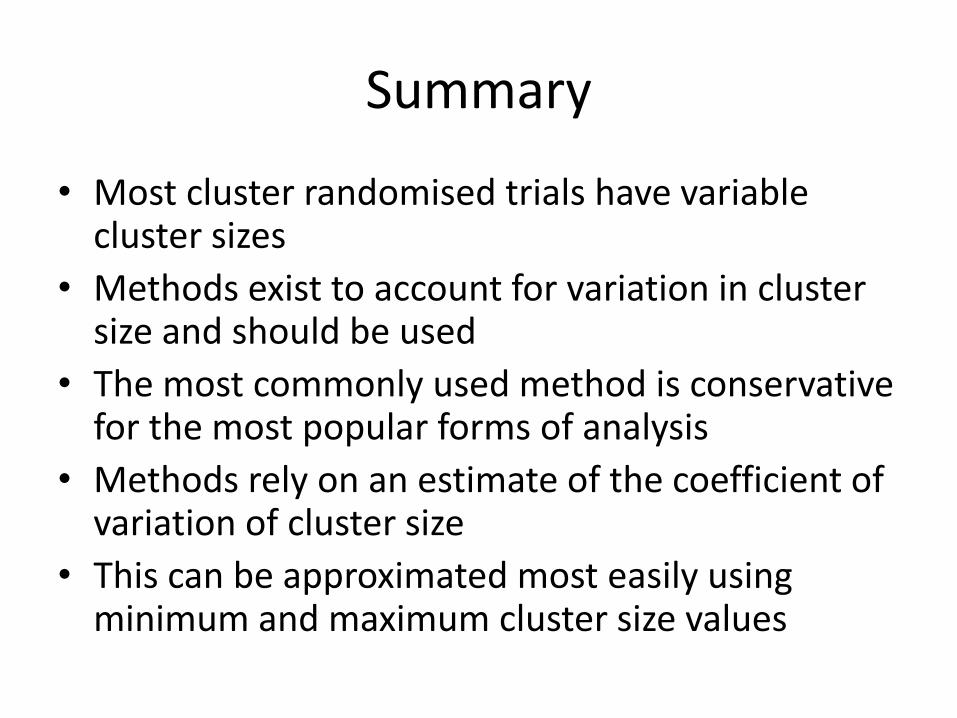
Summary
• Most cluster randomised trials have variable cluster sizes
• Methods exist to account for variation in cluster size and should be used
• The most commonly used method is conservative for the most popular forms of analysis
• Methods rely on an estimate of the coefficient of variation of cluster size
• This can be approximated most easily using minimum and maximum cluster size values

Need to have estimate of ICC
Obtaining estimates of ICCs
• Guess
• Single estimate from previous study or pilot
– popular method but......
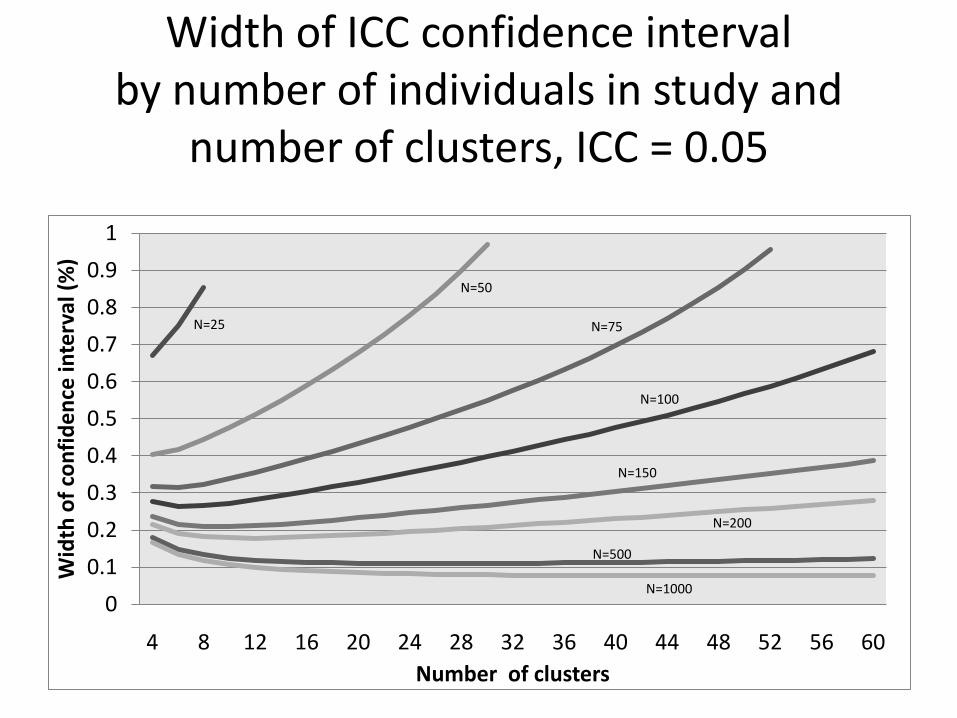
Width of ICC confidence interval by number of individuals in study and
number of clusters, ICC = 0.05
0
0.1
0.2
0.3
0.4
0.5
0.6
0.7
0.8
0.9
1
4 8 12 16 20 24 28 32 36 40 44 48 52 56 60
Wid
th o
f co
nfi
de
nce
inte
rval
(%
)
Number of clusters
N=25
N=50
N=75
N=100
N=150
N=200
N=500
N=1000
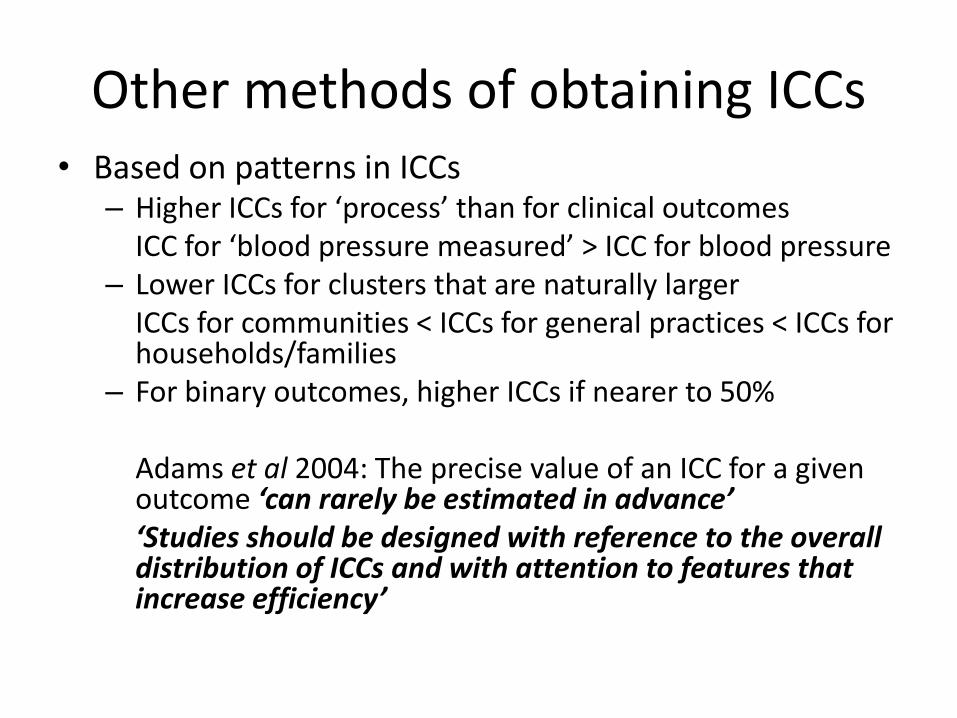
Other methods of obtaining ICCs• Based on patterns in ICCs
– Higher ICCs for ‘process’ than for clinical outcomesICC for ‘blood pressure measured’ > ICC for blood pressure
– Lower ICCs for clusters that are naturally larger ICCs for communities < ICCs for general practices < ICCs for households/families
– For binary outcomes, higher ICCs if nearer to 50%
Adams et al 2004: The precise value of an ICC for a given outcome ‘can rarely be estimated in advance’ ‘Studies should be designed with reference to the overall distribution of ICCs and with attention to features that increase efficiency’
Other methods of obtaining ICCs
• Based on simple combination of several estimates
• Modelling several estimates to produce distribution of ICC values (Turner et al 2005)
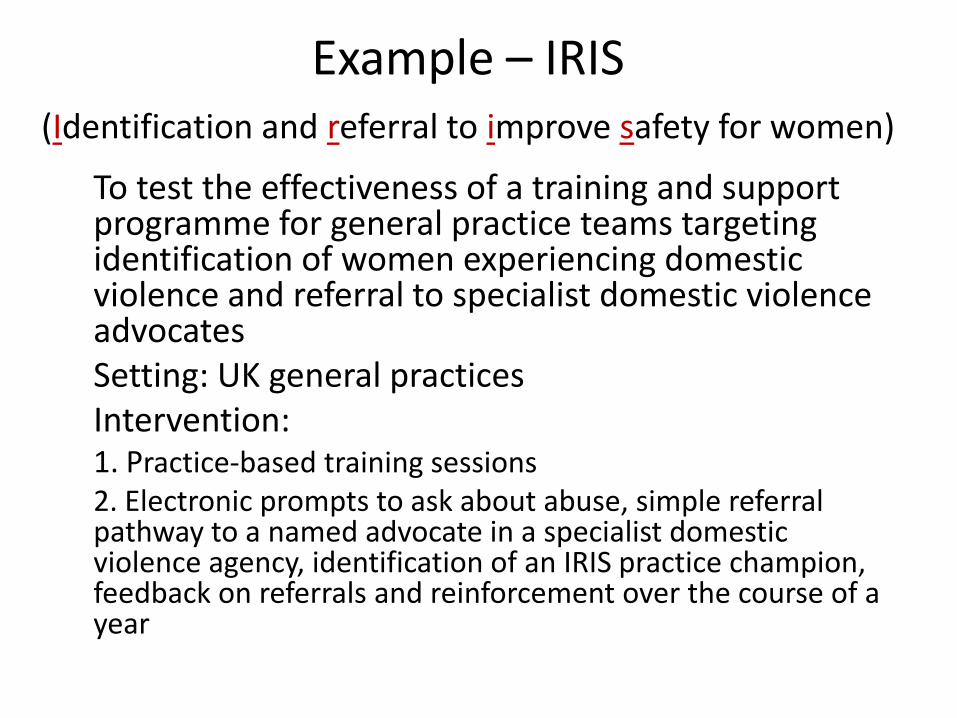
Example – IRIS(Identification and referral to improve safety for women)
To test the effectiveness of a training and support programme for general practice teams targeting identification of women experiencing domestic violence and referral to specialist domestic violence advocatesSetting: UK general practicesIntervention: 1. Practice-based training sessions 2. Electronic prompts to ask about abuse, simple referral pathway to a named advocate in a specialist domestic violence agency, identification of an IRIS practice champion, feedback on referrals and reinforcement over the course of a year
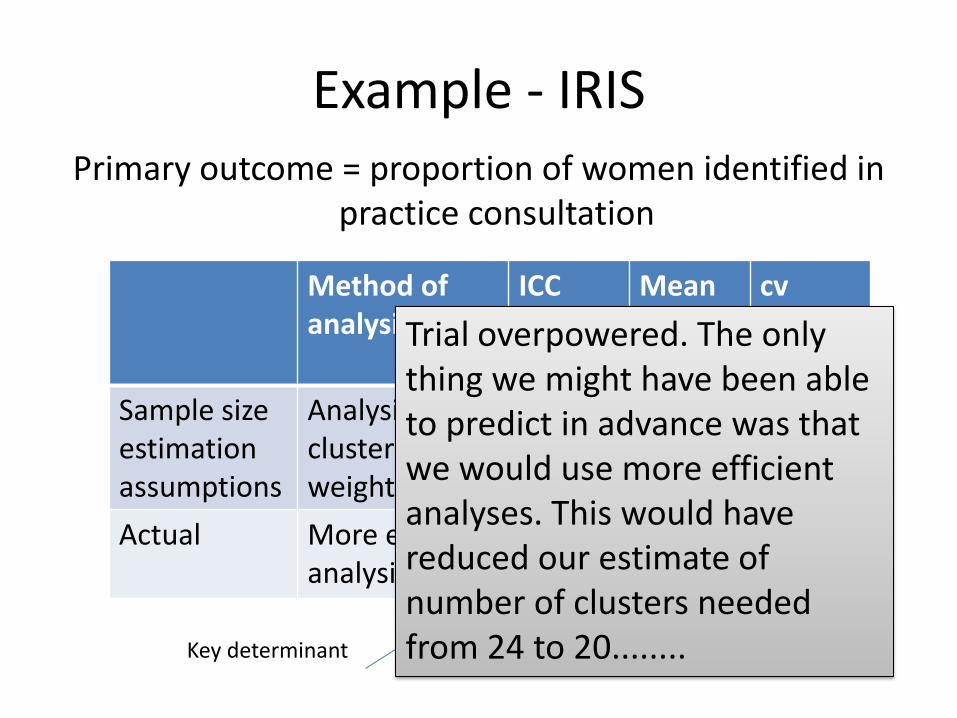
Example - IRISPrimary outcome = proportion of women identified in
practice consultation
Method of analysis
ICC Mean cluster size
cv
Sample size estimationassumptions
Analysis using cluster size weights
0.03 1600 0.5
Actual More efficient analysis
0.003 3013 0.2(approx)
Key determinant
Trial overpowered. The only thing we might have been able to predict in advance was that we would use more efficient analyses. This would have reduced our estimate of number of clusters needed from 24 to 20........
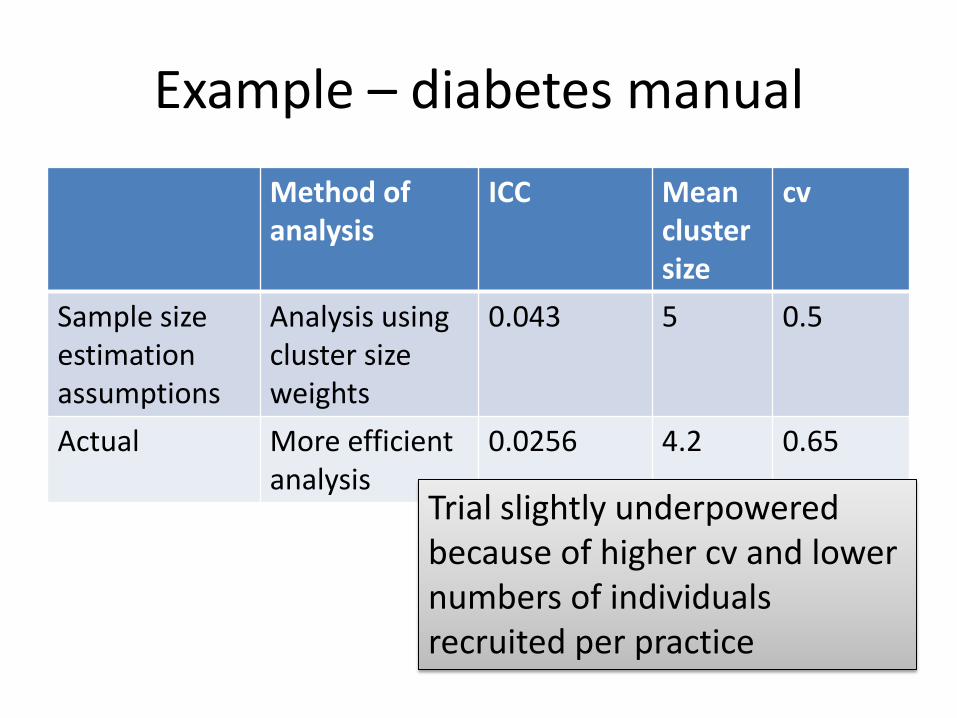
Example – diabetes manual
Method of analysis
ICC Mean cluster size
cv
Sample size estimation assumptions
Analysis using cluster size weights
0.043 5 0.5
Actual More efficient analysis
0.0256 4.2 0.65
Trial slightly underpowered because of higher cv and lower numbers of individuals recruited per practice
Conclusions• Sample size estimation challenging for these
trials
• Simple methods now exist to account for variable cluster size; these should be used
• Useful to acquire as much knowledge as possible in particular area
• Information on patterns in ICCs is useful
• Need more information about cvs of cluster size