Embed Size (px)
Citation preview
THIS CIRCULAR IS IMPORTANT AND REQUIRES YOUR IMMEDIATE ATTENTION
If you are in any doubt as to any aspect of this circular or as to the action to be taken, you shouldconsult a stockbroker or other registered dealer in securities, a bank manager, solicitor, professionalaccountant or other professional advisor.
If you have sold or transferred all your shares in Samsonite International S.A., you should at oncehand this circular, together with the enclosed form of proxy, to the purchaser or transferee or to thebank, stockbroker or other agent through whom the sale or transfer was effected for transmission to thepurchaser or transferee.
Hong Kong Exchanges and Clearing Limited and The Stock Exchange of Hong Kong Limited take noresponsibility for the contents of this circular, make no representation as to its accuracy orcompleteness and expressly disclaim any liability whatsoever for any loss howsoever arising from or inreliance upon the whole or any part of the contents of this circular.
SAMSONITE INTERNATIONAL S.A.
13–15 Avenue de la Liberté, L-1931 LuxembourgR.C.S. LUXEMBOURG: B 159.469
(Incorporated in Luxembourg with limited liability)(Stock code: 1910)
MAJOR TRANSACTIONIN RELATION TO
THE ACQUISITION OF TUMI HOLDINGS, INC.
AND
NOTICE OF GENERAL MEETING
Financial Advisor to the Company
A notice convening the General Meeting of Samsonite International S.A. to be held at 13–15 Avenue de laLiberté, L-1931 Luxembourg and by video conference at 5/F, Hutchison House, 10 Harcourt Road, Central,Hong Kong on Tuesday, July 26, 2016 at 11:00 a.m. (CET)/5:00 p.m. (Hong Kong time) is set out on pages N-1and N-2 of this circular. A form of proxy for use at the General Meeting is also enclosed. Such form of proxy isalso published on the websites of Hong Kong Exchanges and Clearing Limited (http://www.hkexnews.hk) andthe Company (http://www.samsonite.com).
Whether or not you are able to attend the General Meeting, please complete and sign the enclosed form of proxyin accordance with the instructions printed thereon and return it to the Company’s branch share registrar inHong Kong, Computershare Hong Kong Investor Services Limited, at 17M Floor, Hopewell Centre, 183 Queen’sRoad East, Wanchai, Hong Kong or to the Company’s registered office at 13–15 Avenue de la Liberté, L-1931Luxembourg as soon as possible but in any event not less than 48 hours before the time appointed for the holdingof the General Meeting or any adjournment thereof. Completion and return of the form of proxy will not precludeshareholders from attending and voting in person at the General Meeting if they so wish.
June 28, 2016
CONTENTS
Page
Definitions . . . . . . . . . . . . . . . . . . . . . . . . . . . . . . . . . . . . . . . . . . . . . . . . . . . . . . . . . . . . . . . . . . . . . . . . . . . . 1
Letter from the Board . . . . . . . . . . . . . . . . . . . . . . . . . . . . . . . . . . . . . . . . . . . . . . . . . . . . . . . . . . . . . . . . . . 3
A. Introduction . . . . . . . . . . . . . . . . . . . . . . . . . . . . . . . . . . . . . . . . . . . . . . . . . . . . . . . . . . . . . . . . . . 3
B. Strategic and Financial Rationale for the Merger . . . . . . . . . . . . . . . . . . . . . . . . . . . . . . . . . . . . . 4
C. The Merger Agreement . . . . . . . . . . . . . . . . . . . . . . . . . . . . . . . . . . . . . . . . . . . . . . . . . . . . . . . . . 5
D. Debt Financing . . . . . . . . . . . . . . . . . . . . . . . . . . . . . . . . . . . . . . . . . . . . . . . . . . . . . . . . . . . . . . . . 18
E. Information on the Group . . . . . . . . . . . . . . . . . . . . . . . . . . . . . . . . . . . . . . . . . . . . . . . . . . . . . . . . 20
F. Information on Tumi . . . . . . . . . . . . . . . . . . . . . . . . . . . . . . . . . . . . . . . . . . . . . . . . . . . . . . . . . . . 20
G. Financial Effects of the Merger on the Group . . . . . . . . . . . . . . . . . . . . . . . . . . . . . . . . . . . . . . . . 21
H. Implications of the Merger under the Listing Rules . . . . . . . . . . . . . . . . . . . . . . . . . . . . . . . . . . . . 21
I. Waiver from Strict Compliance with the Listing Rules . . . . . . . . . . . . . . . . . . . . . . . . . . . . . . . . . 22
J. Recommendation of the Board . . . . . . . . . . . . . . . . . . . . . . . . . . . . . . . . . . . . . . . . . . . . . . . . . . . . 23
K. General Meeting . . . . . . . . . . . . . . . . . . . . . . . . . . . . . . . . . . . . . . . . . . . . . . . . . . . . . . . . . . . . . . . 23
L. Additional Information . . . . . . . . . . . . . . . . . . . . . . . . . . . . . . . . . . . . . . . . . . . . . . . . . . . . . . . . . . 24
APPENDIX I — Financial Information of the Group . . . . . . . . . . . . . . . . . . . . . . . . . . . . . . . . . . . I-1
APPENDIX II — Financial Information of the Tumi Group . . . . . . . . . . . . . . . . . . . . . . . . . . . . . . II-1
APPENDIX III — Unaudited Pro Forma Financial Information of the Enlarged Group . . . . . . . . III-1
APPENDIX IV — General Information . . . . . . . . . . . . . . . . . . . . . . . . . . . . . . . . . . . . . . . . . . . . . . . . IV-1
Notice of General Meeting . . . . . . . . . . . . . . . . . . . . . . . . . . . . . . . . . . . . . . . . . . . . . . . . . . . . . . . . . . . . . . N-1
- i -
DEFINITIONS
In this circular, unless the context otherwise requires, the following expressions shall have thefollowing meanings:
“adjusted EBITDA” earnings before interest, tax, depreciation and amortization, adjustedfor other income and expenses and non-cash stock-basedcompensation expense
“Announcement” the announcement of the Company dated March 4, 2016 in relation tothe Merger
“Articles of Incorporation” the articles of incorporation of the Company currently in force
“Board” the board of Directors of the Company
“Closing” closing of the Merger
“Company” Samsonite International S.A. , a société anonymeincorporated and existing under the laws of the Grand-Duchy ofLuxembourg having its registered office at 13-15 Avenue de laLiberté, L-1931 Luxembourg, registered with the Luxembourg tradeand companies register with number B159.469 with limited liability,with the Shares being listed on the Main Board of the Stock Exchange
“Delaware General Corporation Law” the General Corporation Law of the State of Delaware (as amended)
“Directors” the directors of the Company
“Dissenting Tumi Shares” the Tumi Shares that are eligible for and whose holders properlyexercise and perfect the appraisal rights for such Tumi Shares inaccordance with the Delaware General Corporation Law
“Enlarged Group” the Group as enlarged by the Merger
“Exchange Act” the U.S. Securities Exchange Act of 1934, as amended, and the rulespromulgated thereunder
“General Meeting” the general meeting of the Shareholders of Company to be held at13–15 Avenue de la Liberté, L-1931 Luxembourg and by videoconference at 5/F, Hutchison House, 10 Harcourt Road, Central,Hong Kong on Tuesday, July 26, 2016 at 11:00 a.m. (CET)/5:00 p.m.(Hong Kong time) for Shareholders to consider and, if thought fit,approve the Merger Agreement, the transactions contemplated by theMerger Agreement, including the Merger, the debt financing as wellas the guarantees and security to be granted in that respect
“Group” the Company and its subsidiaries
“Hong Kong” the Hong Kong Special Administrative Region of the People’sRepublic of China
“IFRS” International Financial Reporting Standards
“Latest Practicable Date” June 21, 2016, being the latest practicable date prior to the printing ofthis circular for ascertaining certain information in this circular
“Listing Rules” the Rules Governing the Listing of Securities on the Stock Exchange
- 1 -
DEFINITIONS
“Merger” the proposed merger of PTL Acquisition with and into Tumi, withTumi surviving the merger as an indirect wholly-owned subsidiary ofthe Company on the terms and conditions set out in the MergerAgreement
“Merger Agreement” the agreement and plan of merger dated as of March 3, 2016 enteredinto between the Company, PTL Acquisition and Tumi in relation tothe Merger
“PTL Acquisition” PTL Acquisition Inc., a company incorporated and existing under thelaws of the State of Delaware, United States, and an indirect wholly-owned subsidiary of the Company formed solely for the purpose ofengaging in transactions contemplated by the Merger Agreement
“SFO” the Securities and Futures Ordinance, Chapter 571 of the Laws ofHong Kong (as amended, supplemented or otherwise modified fromtime to time)
“Shares” ordinary shares of US$0.01 each in the capital of the Company
“Shareholders” holders of Shares
“Stock Exchange” The Stock Exchange of Hong Kong Limited
“Tumi” Tumi Holdings, Inc., a company incorporated and existing under thelaws of the State of Delaware, United States, with the Tumi Sharesbeing traded on the New York Stock Exchange under the symbol“TUMI”
“Tumi Board” the board of directors of Tumi
“Tumi Common Stock” common stock of US$0.01 each in the capital of Tumi
“Tumi Group” Tumi and its subsidiaries
“Tumi Material Adverse Effect” any state of facts, circumstance, condition, event, change,development, occurrence, result or effect (each, an “Effect”) that,individually or in combination with any other Effect, (i) (subject tocertain exceptions as set out in the Merger Agreement) is or wouldreasonably be expected to be materially adverse to the business,financial condition, assets, liabilities or results of operations of Tumiand its subsidiaries, taken as a whole, or (ii) would prevent, materiallyimpair or materially delay the timely performance by Tumi of, or hasor would have a material adverse effect on the ability of Tumi to,timely perform, its obligations under the Merger Agreement
“Tumi Shares” shares of Tumi Common Stock
“Tumi Stockholders” holders of Tumi Shares
“US$” United States dollars, the lawful currency of the United States
“U.S.” or “United States” the United States of America
“U.S. GAAP” U.S. Generally Accepted Accounting Principles
- 2 -
LETTER FROM THE BOARD
SAMSONITE INTERNATIONAL S.A.
13–15 Avenue de la Liberté, L-1931 LuxembourgR.C.S. LUXEMBOURG: B 159.469
(Incorporated in Luxembourg with limited liability)(Stock code: 1910)
Executive Directors: Registered Office:Ramesh Dungarmal Tainwala (Chief Executive Officer) 13–15 Avenue de la LibertéKyle Francis Gendreau L-1931
LuxembourgNon-executive Directors:Timothy Charles Parker (Chairman) Principal Place of Business in Hong Kong:Tom Korbas 25/F, Tower 2, The Gateway
Harbour City, 25 Canton RoadIndependent Non-executive Directors: Tsimshatsui, KowloonPaul Kenneth Etchells Hong KongKeith HamillMiguel Kai Kwun KoBruce Hardy McLain (Hardy)Ying Yeh
June 28, 2016To the Shareholders
Dear Sir/Madam,
MAJOR TRANSACTION IN RELATION TOTHE ACQUISITION OF TUMI HOLDINGS, INC.
AND
NOTICE OF GENERAL MEETING
A. INTRODUCTION
On March 4, 2016, the Company announced that the Company and PTL Acquisition (anindirect wholly-owned subsidiary of the Company) had entered into the Merger Agreement with Tumipursuant to which the Company agreed to acquire Tumi, subject to the terms and conditions set out inthe Merger Agreement. The acquisition is proposed to be effected by way of a merger of PTLAcquisition with and into Tumi, with Tumi surviving the merger as an indirect wholly-ownedsubsidiary of the Company.
Tumi is a leading global premium lifestyle brand offering a comprehensive line of businessbags, travel luggage and accessories. The brand is consistently recognized as “best in class” for the
- 3 -
LETTER FROM THE BOARD
high quality, durability, functionality and innovative design of its products, which range from its iconicblack ballistic business cases and travel luggage synonymous with the modern business professional, totravel accessories, women’s bags and outdoor apparel. As of December 31, 2015, the Tumi brand wassold in approximately 2,000 points of distribution from New York to Paris to London and Tokyo, aswell as in the world’s top department, specialty and travel retail stores in over 75 countries.
As one or more of the applicable percentage ratios (as set out and calculated under Rule 14.07of the Listing Rules) in respect of the Merger is more than 25% but all are less than 100%, the Mergerconstitutes a major transaction of the Company and is subject to the reporting, announcement, circularand shareholders’ approval requirements under Chapter 14 of the Listing Rules.
The purpose of this circular is to provide you with, among other things, (i) further informationin respect of the Merger, (ii) the financial information relating to the Group and the Tumi Group,(iii) unaudited pro forma financial information of the Enlarged Group, (iv) other information asrequired by the Listing Rules and (v) notice of the General Meeting.
B. STRATEGIC AND FINANCIAL RATIONALE FOR THE MERGER
The Board considers that the Merger is fair and reasonable and in the interests of the Companyand the Shareholders as a whole for the following reasons.
Compelling Strategic and Financial Rationale for the Merger
(a) Creates a leading global travel lifestyle company. The Merger brings together Tumi, aniconic North American purveyor of premium business bags, travel luggage and accessories,with the Group, the world’s best known and largest lifestyle bags and travel luggage company,to create a leading global travel lifestyle company.
(b) Ideal and complementary fit with the Group. With approximately 2,000 points ofdistribution across over 75 countries, Tumi’s leading market position in the premium businessand luggage segment is a perfect complement to the Group’s strong and diverse portfolio ofbrands and products, with limited overlap in market positioning, price point and distribution.The addition of Tumi builds on the Group’s proven track record of successful acquisitionsacross multiple product categories and price points to broaden its portfolio.
(c) Enables the Group to strategically expand into the highly attractive premium segment ofthe global business bags, travel luggage and accessories market with a business and travelbrand that is recognized worldwide as being “best in class” in the premium segment.
(d) Presents tremendous opportunities to leverage the Group’s extensive global retail andwholesale network and its strengths in distribution, sourcing, technical innovation andlocalisation of products to consumer preferences to introduce the Tumi brand to millions ofnew customers in additional markets worldwide. This includes expansion in Asia and Europe,while strengthening Tumi’s platform in North America, as well as leveraging the Group’s clearstrength in hardside innovation to expand Tumi’s hardside luggage offering.
(e) Reinforces the Group’s strong platform for long-term growth and profitability. Tumi is aprofitable business and the combined company is expected to generate significant free cashflow to meet interest payments while continuing to make cash distributions to Shareholders.
- 4 -
LETTER FROM THE BOARD
(f) Creates potential for significant operational and top-line synergies. This includes costsavings in such key areas as sourcing, logistics, sales and marketing, distribution, retail andgeneral and administrative costs, as well as potential top-line synergies resulting from theGroup’s enhanced and complementary product development and global reach.
The Group’s Strategy for Tumi
(a) Leverage the Group’s global multi-channel distribution model and expertise in directoperations by:
Š utilizing the Group’s strong global distribution network to penetrate wholesale doors inAsia and Europe;
Š utilizing the Group’s on-the-ground resources to improve Tumi’s international productmerchandising and mix, with products tailored to local market preferences;
Š accelerating Tumi’s retail footprint in Asia with stores in each major market;
Š cross-selling Tumi products in the Group’s “multi-brand” stores; and
Š implementing best practices in retail operations.
(b) Enhance product development and innovation by:
Š utilizing shared best practices and complementary development efforts to improveinnovation; and
Š expanding and enhancing Tumi’s hardside strategy, particularly in the premium Asianand European markets by leveraging the Group’s clear strength in hardside innovation.
Following completion of the Merger, the Company will continue to be listed on the Main Boardof the Stock Exchange.
C. THE MERGER AGREEMENT
The principal terms and conditions of the Merger Agreement are set out below.
1. Date
March 3, 2016 (New York time)
2. Parties
(a) The Company;
(b) PTL Acquisition; and
(c) Tumi.
The Directors confirm that, to the best of their knowledge, information and belief, having madeall reasonable enquiries, Tumi and its ultimate beneficial owners are third parties independent of theCompany and connected persons of the Company (as defined in the Listing Rules).
- 5 -

LETTER FROM THE BOARD
3. Merger
The Company has agreed to acquire Tumi by way of a merger to be consummated inaccordance with the Delaware General Corporation Law, in accordance with the terms and subject tothe conditions of the Merger Agreement. The acquisition is proposed to be effected by way of theMerger whereby PTL Acquisition will be merged with and into Tumi, with Tumi surviving the mergeras an indirect wholly-owned subsidiary of the Company.
4. Consideration
In accordance with the terms and subject to the conditions of the Merger Agreement, each TumiShare issued and outstanding immediately prior to the Closing, other than Dissenting Tumi Shares andTumi Shares owned by the Company, PTL Acquisition, Tumi or any of their respective wholly-ownedsubsidiaries (including treasury shares), will be cancelled and converted into the right to receive cashin an amount equal to US$26.75 per Tumi Share, without interest (the “Merger Consideration”).
Stock options (whether vested or unvested), service restricted stock unit awards (whethervested or unvested) and performance restricted stock unit awards (whether vested or unvested) grantedby Tumi, in each case which are outstanding immediately prior to the Closing, will be cancelled.Holders of Tumi stock options will be entitled to receive a cash amount equal to the product of (a) thenumber of Tumi Shares subject to the Tumi stock options multiplied by (b) the excess, if any, of theMerger Consideration over the exercise price of each stock option, less applicable taxes required to bewithheld with respect to such payment. Holders of Tumi service restricted stock unit awards will beentitled to receive a cash amount equal to the product of (a) the number of Tumi Shares subject to theTumi service restricted stock unit awards multiplied by (b) the Merger Consideration, less applicabletaxes required to be withheld with respect to such payment. Holders of Tumi performance restrictedstock unit awards will be entitled to receive a cash amount equal to the product of (a) the number ofTumi Shares subject to the Tumi performance restricted stock unit awards (assuming target-levelperformance) multiplied by (b) the Merger Consideration, less applicable taxes required to be withheldwith respect to such payment.
Pursuant to the Merger Agreement, subject to certain limited exceptions as set out in theMerger Agreement, Tumi may not grant any new Tumi stock options or restricted stock unit awardsor issue any new Tumi Shares (except pursuant to the exercise of existing Tumi stock options or thesettlement of existing Tumi restricted stock unit awards) prior to Closing. As of May 31, 2016, therewere (i) 67,661,362 Tumi Shares issued and outstanding (excluding treasury shares), (ii) 765,959Tumi Shares held in treasury, (iii) 280,161 Tumi Shares which were subject to outstanding Tumiperformance restricted stock unit awards (assuming target-level performance), (iv) 238,684 TumiShares which were subject to outstanding Tumi service restricted stock unit awards and(v) 1,031,827 Tumi Shares which were issuable upon the exercise of outstanding Tumi stockoptions.
The aggregate cash consideration payable by the Company under the terms of the MergerAgreement is expected to be approximately US$1,829,029,898 (the “Total Consideration”),calculated on a fully diluted basis as of May 31, 2016, with the dilutive effect of outstanding stockoptions and restricted stock unit awards granted by Tumi incorporated based on the assumption thatproceeds received from each such stock option or restricted stock unit award, if exercised, would be
- 6 -
LETTER FROM THE BOARD
used to repurchase Tumi Shares at the price equal to the Merger Consideration. The TotalConsideration will be funded by a new committed debt financing that will comprise US$500 millionin a Revolving Facility (as defined below) and US$1,925 million in Term Loan Facilities (asdefined below), as well as by the Group’s own cash resources. In determining the source offunding for the Total Consideration, the Company took into account the amount of theGroup’s available cash resources, the availability of debt financing on favourable terms comparedto equity financing and the fact that debt financing would be less dilutive to the earnings per Shareof the Company and therefore better aligns with the interests of the Shareholders as a whole.Please see “Debt Financing” below for further details of the debt financing arrangements for theMerger.
The Merger values Tumi at an equity valuation of approximately US$1,829,029,898. Thisrepresents a 13.6 times multiple of enterprise value to Tumi’s adjusted EBITDA for the last twelvemonths ended December 31, 2015.
The Merger Consideration of US$26.75 per Tumi Share represents a premium of approximately38% of the volume weighted average price of US$19.34 per Tumi Share on the New York StockExchange for the five trading days up to and including March 2, 2016.
The Merger Consideration was based on arm’s length negotiations with Tumi and wasdetermined by reference to, among other things, the past financial performance of Tumi, growthprospects of the relevant market/segment, strategic fit with the Group’s business, potential synergies aswell as the Group’s assessment of how it can leverage on its strengths to maximise Tumi’s futuregrowth potential. In view of the variety of factors considered by the Company and the complexity ofthese factors, the Company did not find it practicable to, and did not, quantify or otherwise assignrelative weights to the foregoing factors in reaching its determination and recommendations, nor wasthere any formula that was used by the Company to determine the Merger Consideration.
In accordance with the Delaware General Corporation Law, holders of Tumi Shares may beeligible to exercise appraisal rights for such Tumi Shares. The Dissenting Tumi Shares will not beconverted into a right to receive the Merger Consideration but instead will be entitled to rights grantedby the Delaware General Corporation Law to holders of Dissenting Tumi Shares, subject to certainconditions. Tumi has agreed to provide the Company with prompt written notice of any demands forappraisals of Dissenting Tumi Shares and the Company will have the opportunity to participate innegotiations and proceedings with respect to such demands.
5. Conditions
Closing of the Merger is conditional on the satisfaction (or, to the extent not prohibited byapplicable law, waiver) of certain conditions as set out below (the “Conditions”).
Conditions to the Obligations of Each Party
The obligations of each party are subject to the satisfaction (or, to the extent not prohibited byapplicable law, waiver) of the following conditions:
(a) the Tumi Stockholders shall have adopted the Merger Agreement in accordance with theDelaware General Corporation Law;
- 7 -
LETTER FROM THE BOARD
(b) approval of the Merger Agreement and the transactions contemplated by the MergerAgreement, including the Merger, by the Shareholders of the Company shall have beenobtained in accordance with the applicable law of Luxembourg, the Articles ofIncorporation and the Listing Rules;
(c) any applicable waiting period under the U.S. Hart-Scott-Rodino Antitrust ImprovementsAct of 1976 (as amended) relating to the consummation of the Merger shall haveexpired or been terminated and any approvals or consents required under any otherantitrust laws shall have been obtained;
(d) no court of competent jurisdiction or any governmental entity having jurisdiction overany party shall have issued any order, nor shall there be in effect any applicable law orother legal restraint, injunction or prohibition that makes consummation of the Mergerillegal or otherwise prohibited; and
(e) no governmental entity in the U.S. or a jurisdiction where more than 5% of Tumi’s andTumi’s subsidiaries’ combined sales occur and with actual jurisdiction over the partiesshall have commenced a proceeding challenging or seeking to restrain, enjoin orotherwise prohibit the consummation of the Merger or any of the other transactionscontemplated by the Merger Agreement, or seeking to prohibit or limit the Company’sor PTL Acquisition’s ability to own, control, direct, operate or retain all or a portion ofthe business operated by Tumi and its subsidiaries, in each case, that would, consideringthe merits of the claims, available defences (procedural and substantive) and likelihoodthat such governmental entity ultimately will prevail, (i) create a significant risk of arestraint or injunction being imposed that prohibits consummation of the Merger or(ii) have a Tumi Material Adverse Effect or a material adverse effect on the Company’sability to acquire, own, operate and enjoy the benefit of owning and operating Tumifollowing the Closing.
Conditions to the Obligations of the Company and PTL Acquisition
The obligations of the Company and PTL Acquisition to consummate the Merger are furthersubject to the satisfaction (or, to the extent not prohibited by applicable law, waiver) of the followingconditions:
(a) the representations and warranties given by Tumi contained in the Merger Agreementshall be true and correct as of the date of the Merger Agreement and as of the date ofClosing (or as of another date specified in the Merger Agreement), subject to certainmateriality or material adverse effect qualifications described in the Merger Agreement;
(b) Tumi shall have performed and complied in all material respects with the agreementsand covenants made by it in the Merger Agreement that are required to be performed orcomplied with by it at or prior to Closing;
(c) since the date of the Merger Agreement, there have not been any Effects that have hador would reasonably be expected to have, individually or in the aggregate, a TumiMaterial Adverse Effect;
(d) the Company shall have received a payoff letter regarding the repayment of allindebtedness of Tumi as of the date of Closing under the Existing Target CreditAgreement (as defined in “Debt Financing” below) and the release of any guarantees
- 8 -
LETTER FROM THE BOARD
and other security given by Tumi in respect of such indebtedness subject to the deliveryof funds as arranged by the Company to effect such repayment; and
(e) the Company shall have received an officer’s certificate from an executive officer of Tumiregarding satisfaction of the conditions in the preceding paragraphs (a), (b) and (c).
Conditions to the Obligations of Tumi
The obligations of Tumi to consummate the Merger are further subject to the satisfaction (or, tothe extent not prohibited by applicable law, waiver) of the following conditions:
(a) the representations and warranties given by the Company and PTL Acquisitioncontained in the Merger Agreement shall be true as of the date of Closing (or as ofanother date specified in the Merger Agreement), except as would not, individually or inthe aggregate, prevent or have a material adverse effect on the ability of the Company orPTL Acquisition to consummate the Merger;
(b) the Company and PTL Acquisition shall have performed and complied in all materialrespects with the agreements and covenants made by them in the Merger Agreementthat are required to be performed or complied with by them at or prior to Closing; and
(c) Tumi shall have received an officer’s certificate from an executive officer of theCompany regarding satisfaction of the conditions in the preceding paragraphs.
Status of the Conditions
On April 13, 2016, the Federal Cartel Office of Germany provided unconditional clearance forthe Merger. On April 22, 2016, the applicable waiting period under the U.S. Hart-Scott-RodinoAntitrust Improvements Act of 1976 (as amended) relating to the consummation of the Merger expired.
The Tumi Stockholders’ meeting is convened to be held on July 12, 2016 for the purposes ofconsidering and, if thought fit, adopting the Merger Agreement.
As of the Latest Practicable Date, save for Condition (c) under “Conditions to the Obligationsof Each Party” above, which has been satisfied, none of the Conditions (including the Conditions thatby their nature are to be satisfied by actions taken at Closing) has been satisfied (or, to the extent notprohibited by applicable law, waived).
6. Conduct of Business Pending the Merger
The Merger Agreement provides that, during the period commencing on the signing of theMerger Agreement and ending on the earlier of the termination of the Merger Agreement inaccordance with its terms and the effective time of the Merger, except for matters (i) required byapplicable law, (ii) undertaken with the prior written consent of the Company, which shall not beunreasonably withheld, conditioned or delayed or (iii) expressly required by the Merger Agreement,Tumi must, and must cause each of its subsidiaries to, conduct in all material respects its business inthe ordinary course of business, consistent with past practice, and use its commercially reasonableefforts to, among other things:
(a) maintain and preserve intact its business organization, assets, technology, present linesof business, rights and franchises;
- 9 -
LETTER FROM THE BOARD
(b) keep available the services of any current or former employee, consultant, independentcontractor, officer or director of Tumi or any of its subsidiaries;
(c) maintain in effect all of its material permits, licenses, consents, franchises, approval,privileges, immunities, authorizations, exemptions, registrations, certificates, variancesand similar rights obtained from a governmental entity;
(d) maintain and preserve satisfactory relationships with customers, lenders, suppliers,licensors, licensees, distributors and others having material business relationships withTumi or any of its subsidiaries; and
(e) take no action that is intended to or would reasonably be expected to adversely affect ormaterially delay the ability of Tumi to perform its covenants and agreements under theMerger Agreement or to consummate the transactions contemplated thereby.
7. Non-Solicitation Undertakings and Acquisition Proposals
Under the terms of the Merger Agreement, except as expressly permitted by the MergerAgreement, Tumi may not, and must cause its affiliates and its and their directors, officers andemployees, and must direct and use its reasonable best efforts to cause its and their respectiverepresentatives not to, directly or indirectly:
(a) initiate, solicit, authorize or encourage, or facilitate the submission or making of, anyacquisition proposal (as defined below), or any inquiry, expression of interest, proposal,offer or request for information that could reasonably be expected to lead to or result inan acquisition proposal;
(b) participate or engage in negotiations or discussions (other than for a period of fourbusiness days after the receipt of an acquisition proposal solely to the extent necessaryto obtain sufficient information, ascertain facts or clarify certain terms with respect tosuch acquisition proposal) or furnish any information concerning Tumi or any of itssubsidiaries to any third party relating to an acquisition proposal or any inquiry,expression of interest, proposal, offer or request for information that could reasonablybe expected to lead to or result in an acquisition proposal;
(c) enter into any contract or other agreement or understanding (written or oral, binding ornon-binding, preliminary or definitive) relating to an acquisition proposal; or
(d) resolve or agree to do any of the foregoing.
Under the Merger Agreement, an “acquisition proposal” means any offer or proposal (otherthan an offer or proposal made or submitted by or on behalf of the Company) regarding any transaction(including any single- or multi-step transaction) or series of transactions with a person or “group” (asdefined in Exchange Act) relating to (i) the acquisition of at least 15% of the assets of, equity interestsin, or business of Tumi, pursuant to a merger, reorganization, recapitalization, consolidation, jointventure or other business combination, sale combination, sale of shares of capital stock, sale of assets,tender offer, exchange offer or otherwise, or (ii) any combination of the foregoing types of transactionsif the sum of the percentage of consolidated assets, consolidated revenues or earnings of Tumiinvolved is 15% or more (such transaction, an “acquisition transaction”).
- 10 -
LETTER FROM THE BOARD
Existing Discussions or Negotiations
Under the terms of the Merger Agreement, Tumi has agreed to:
(a) immediately cease and cause to be terminated all discussions or negotiations with anyperson existing on March 3, 2016 with respect to any acquisition proposal, or anyinquiry, expression of interest, proposal, offer or request for information that couldreasonably be expected to lead to or result in an acquisition proposal;
(b) terminate access by any third party to any physical or electronic data room or otheraccess to data or information of Tumi, in each case relating to or in connection with, anyacquisition proposal or any potential acquisition transaction;
(c) request the prompt return or destruction of all information provided to any third party inthe year immediately preceding the date of the Merger Agreement in connection withany inquiry, expression of interest, proposal, offer or request for information that couldreasonably be expected to lead to or result in an acquisition proposal or a proposedacquisition transaction; and
(d) enforce, and not waive or modify, the provisions of any existing confidentiality or non-disclosure agreement entered into with respect to any acquisition proposal or anypotential acquisition transaction, including any standstill provisions contained therein.
Tumi has also agreed to release the Company from its obligation to comply with the standstillprovisions contained in the confidentiality agreement entered into between the Company and Tumifrom and after March 3, 2016.
Receipt of Acquisition Proposals
If, at any time prior to the receipt of the Tumi Stockholder approval, Tumi receives anunsolicited, written bona fide acquisition proposal (which acquisition proposal was made afterMarch 3, 2016 and did not result from a breach (other than in any immaterial respect) of the provisionsof the Merger Agreement relating to Tumi’s non-solicitation undertakings), Tumi, the Tumi Board andits representatives, may, subject to compliance with the applicable provision in the Merger Agreement,engage in negotiations or discussions with, or furnish any information and reasonable access to, anythird party making such acquisition proposal if, and only if, the Tumi Board determines in good faith,after consultation with Tumi’s outside legal counsel and outside independent financial advisors, thatsuch acquisition proposal constitutes, or could reasonably be expected to result in, a “superiorproposal” (as defined below); provided, that:
(a) prior to providing access to or furnishing any such information, Tumi (A) receives fromsuch third party an executed acceptable confidentiality agreement or (B) if such thirdparty is already party with Tumi to a valid and existing confidentiality agreement as ofMarch 3, 2016, amends such existing agreement so that it is an acceptableconfidentiality agreement;
(b) any such information so furnished has been previously provided to the Company or isprovided to the Company substantially concurrently with it being so furnished to suchthird party; and
(c) Tumi gives the Company written notice of such determination promptly after theTumi Board makes such determination (and in no event later than twenty-four hours
- 11 -
LETTER FROM THE BOARD
after such determination) and in any event prior to furnishing any such information orengaging in such negotiations or discussions.
Under the Merger Agreement, a “superior proposal” means a bona fide written acquisitionproposal (provided, that for purposes of this definition, the references to “15%” in the definition ofacquisition proposal shall be deemed to be references to “75%”) made by a third party that the TumiBoard determines in good faith, after consultation with Tumi’s outside independent financial advisorsand outside legal counsel, and considering all the terms of the acquisition proposal (including, withoutlimitation, the legal, financial and regulatory aspects of such proposal, the identity of the third partymaking such proposal and the conditions for completion of such proposal), (i) is on terms that are morefavorable from a financial point of view to the holders of Tumi Shares than the Merger (after givingeffect to all proposed changed terms), (ii) is reasonably expected to be consummated on a timely basisand does not contain any conditionality of the third party’s obligation to consummate the superiorproposal that is related to the third party’s completion of due diligence (for the avoidance of doubt, aright of the third party to have access to or notification of information or documents will not be deemeda due diligence closing condition) or the third party having obtained financing for the superior proposaland (iii) the financing of which is fully committed or reasonably determined in good faith by the TumiBoard to be available.
Fiduciary Exception and Adverse Recommendation Change
Except as expressly permitted by the provisions of the Merger Agreement described in the firsttwo paragraphs immediately below, the Tumi Board may not:
(a) withdraw (or qualify or modify in any manner adverse to the Company), or publiclypropose to withdraw (or so qualify or modify), its recommendation to the TumiStockholders that they adopt the Merger Agreement;
(b) fail to include its recommendation to the Tumi Stockholders that they adopt the MergerAgreement in Tumi’s proxy statement;
(c) take any action to exempt any person (other than the Company and its affiliates) fromthe provisions of Section 203 of the Delaware General Corporation Law or any other“moratorium,” “control share acquisition,” “business combination,” “fair price” or otherform of anti-takeover law or regulation;
(d) fail to recommend against any acquisition proposal subject to Regulation 14D under theExchange Act within ten business days after the commencement of such acquisitionproposal or any material amendment of such acquisition proposal;
(e) approve, adopt or recommend any acquisition proposal, or propose publicly to approve,adopt or recommend, any acquisition proposal; or
(f) approve, adopt or recommend, or propose publicly to approve, adopt or recommend, orallow Tumi or any of its subsidiaries to execute or enter into any contract or otheragreement or understanding, other than an acceptable confidentiality agreement withany third party constituting or relating to, or that is intended to or could reasonably beexpected to lead to or result in, any acquisition proposal or acquisition transaction, orrequiring, or reasonably expected to cause, Tumi to abandon, terminate, delay or fail toconsummate, or that would otherwise impede, interfere with or be inconsistent with the
- 12 -
LETTER FROM THE BOARD
Merger Agreement, the merger or any of the other transactions contemplated thereby, orrequiring, or reasonably expected to cause, Tumi to fail to comply with the MergerAgreement.
At any time prior to the receipt of the Tumi Stockholder approval, in the event a materialdevelopment or material change in circumstances (other than relating to or in connection with anacquisition proposal, acquisition transaction or superior proposal) occurs or arises after March 3, 2016that was not known and not reasonably foreseeable by the Tumi Board as of March 3, 2016, the TumiBoard may make a change to its recommendation to the Tumi Stockholders if and only if theTumi Board determines in good faith, after consultation with Tumi’s outside legal counsel and outsideindependent financial advisors, that the failure to take such action would be inconsistent with the TumiBoard’s fiduciary duties to the Tumi Stockholders under applicable law; provided, that Tumi shall haveprovided the Company four business days’ prior written notice advising the Company that it intends totake such action and specifying, in reasonable detail, the reasons for such action and:
(a) during such four business day period, if requested by the Company, Tumi must engagein good faith negotiations with the Company (and Tumi must cause its affiliates and itsand their directors, officers and employees and directed and otherwise used itsreasonable best efforts to cause its and their other representatives, including withoutlimitation, its outside legal counsel and outside independent financial advisors, to haveengaged in good faith negotiations with the Company and its representatives) regardingchanges to the terms of the Merger Agreement; and
(b) Tumi must consider any adjustments to the Merger Agreement and any otheragreements that may be proposed in writing by the Company no later than 11:59 p.m.(New York time) on the fourth business day of such four business day period and mustdetermine in good faith (after consultation with its outside legal counsel and outsideindependent financial advisors) that the failure to make a change in recommendationwould be inconsistent with the Tumi Board’s fiduciary duties to the Tumi Stockholdersunder applicable law.
At any time prior to receipt of the Tumi Stockholder approval, if, in response to an unsolicited,written bona fide acquisition proposal first made after March 3, 2016 that did not result from a breach(other than in any immaterial respect) of the provisions of the Merger Agreement relating to Tumi’snon-solicitation undertakings, the Tumi Board determines in good faith (after consultation with itsoutside legal counsel and outside independent financial advisors) that (i) such acquisition proposalconstitutes a superior proposal and (ii) the failure to approve or recommend such superior proposalwould be inconsistent with the Tumi Board’s fiduciary duties to the Tumi Stockholders underapplicable law, Tumi may terminate the Merger Agreement in accordance with the provisions of theMerger Agreement; provided, however, that Tumi may not terminate the Merger Agreement inaccordance with paragraph (d)(i) under “Termination Events” below and this paragraph unless Tumi(x) has complied with and not breached (other than in any immaterial respect) its obligations under theprovisions of the Merger Agreement relating to Tumi’s non-solicitation undertakings, (y) pays, orcauses to be paid, to the Company the termination fee payable pursuant to the Merger Agreement priorto or concurrently with such termination and (z) concurrently with such termination, enters into adefinitive written alternative acquisition agreement that documents all the terms and conditions of suchsuperior proposal.
- 13 -
LETTER FROM THE BOARD
Notwithstanding anything to the contrary contained in the Merger Agreement, Tumi will not beentitled to terminate the Merger Agreement pursuant to the preceding paragraph and paragraph (d)(i)under “Termination Events” below, unless (x) Tumi provides to the Company four business days’prior written notice advising the Company that Tumi intends to take such action (and specifying, inreasonable detail, the reasons for such action and the terms and conditions of any such superiorproposal, including the identity of the third party that has made such superior proposal) and providesthe Company a copy of the relevant proposed transaction agreement or the latest draft thereof or, if nosuch agreement or draft exists, a written summary of the material terms and conditions of such superiorproposal, and any other related available documentation and correspondence relating to such superiorproposal, and (y):
(a) during such four business day period, if requested by the Company, Tumi must engagein good faith negotiations with the Company (and Tumi must cause its affiliates and itsand their directors, officers and employees and directed and otherwise used itsreasonable best efforts to cause its and their other representatives, including withoutlimitation, its outside legal counsel and outside independent financial advisors, to haveengaged in good faith negotiations with the Company and its representatives) regardingchanges to the terms of the Merger Agreement intended to cause such acquisitionproposal to no longer constitute a superior proposal; and
(b) Tumi must consider any proposed changed terms proposed by the Company no laterthan 11:59 p.m. (New York time) on the fourth business day of such four business dayperiod and must determine in good faith that the superior proposal would continue toconstitute a superior proposal if such proposed changed terms were to be given effect.
Tumi and the Company have agreed that, (A) if the Company, within four business daysfollowing its receipt of a superior proposal notice, makes a proposal that, as determined in good faithby the Tumi Board (after consultation with its outside legal counsel and outside independent financialadvisors), results in the applicable acquisition proposal no longer being a superior proposal, then Tumiwill have no right to terminate the Merger Agreement as a result of such acquisition proposal, and(B) any (1) revisions to the financials terms or any other material terms of a superior proposal or(2) revisions to the financial terms or any other material terms to an acquisition proposal that the TumiBoard had determined no longer constitutes a superior proposal, will constitute a new acquisitionproposal and will in each case require Tumi to deliver to the Company a new superior proposal noticeand a new four business day period will commence thereafter; provided, however, that such new fourbusiness day notice period will be shortened to the longer of three business days and the timeremaining on the prior notice period if the only change to the material terms of such superior proposalis an increase in (without any change to the form of) the per share merger consideration. Tumi has noright to terminate the Merger Agreement pursuant to the provisions of the Merger Agreement describedin paragraph (d)(i) under “Termination Events” below unless it has complied with the procedures setforth in the foregoing.
Nothing contained in the Merger Agreement prohibits Tumi or the Tumi Board, directly orindirectly through their respective representatives, from (i) taking and disclosing any position or disclosingany information reasonably required under Rule 14d-9, Rule 14e-2(a) or Item 1012(a) of Regulation M-Apromulgated under the Exchange Act or (ii) making any “stop, look and listen” communication to the TumiStockholders pursuant to Rule 14d-9(f) promulgated under the Exchange Act.
- 14 -
LETTER FROM THE BOARD
Notice of Acquisition Proposal
Under the terms of the Merger Agreement, Tumi has agreed to promptly advise the Company inwriting in the event that it or any of its affiliates, any of its or its affiliates’ officers, directors oremployees or, to Tumi’s knowledge, any of its or its affiliates’ representatives receives any acquisitionproposal, and in connection with such notice, provide to the Company the material terms andconditions of any such acquisition proposal. Tumi has agreed to keep the Company promptly informedin writing on a reasonably current basis of the status of, and any material changes to, the terms of anysuch acquisition proposal (including providing the Company a notification in writing within twenty-four hours following any determination by the Tumi Board or any material changes to the terms of anysuch acquisition proposal) and any discussions and negotiations concerning the material terms andconditions thereof and provide to the Company as soon as practicable after receipt thereof of anywritten indication of interest (or amendment thereto) or any written material received in connectiontherewith (or amendment thereto), including copies of any proposed alternative acquisition agreement(including any drafts thereof) and any proposed financing commitments and fee letters related thereto(including drafts thereof).
8. Termination
Termination Events
The Merger Agreement may be terminated and the Merger will not proceed (with anytermination by the Company also being an effective termination by PTL Acquisition):
(a) by mutual written agreement of Tumi and the Company;
(b) by either Tumi or the Company, if:
(i) Closing has not occurred at or before 5:00 p.m. (New York time) onDecember 31, 2016, provided that if certain conditions as set out in the MergerAgreement have been satisfied, either Tumi or the Company may extend thedate of Closing to no later than 5:00 p.m. (New York time) on March 3, 2017;
(ii) the required Tumi Stockholder adoption of the Merger Agreement is notobtained at the Tumi Stockholder meeting or at any adjournment orpostponement thereof, in each case, at which a vote on such adoption was taken;
(iii) the required Shareholder approval of the Company for the Merger Agreement andthe transactions contemplated by the Merger Agreement, including the Merger, isnot obtained at the General Meeting or at any adjournment or postponementthereof, in each case, at which a vote on such approval was taken; or
(iv) any court of competent jurisdiction or any governmental entity shall have issueda final, non-appealable order or taken any other action, in each case permanentlyrestraining, enjoining or otherwise prohibiting the Merger, or any applicable lawshall be in effect that makes consummation of the Merger illegal or otherwiseprohibited; or
(c) by the Company, if:
(i) prior to the receipt of the required Tumi Stockholder approval, (A) the TumiBoard (or any committee thereof) shall have failed to include itsrecommendation in its proxy statement or shall have otherwise effected a change
- 15 -
LETTER FROM THE BOARD
in its recommendation to the Tumi Stockholders under the Merger Agreement,(B) Tumi enters into an alternative acquisition agreement for a superiorproposal, (C) Tumi shall have violated or breached (or be deemed pursuant tothe terms thereof, to have violated or breached) in any material respect anyprovision in the Merger Agreement in respect of covenants relating to alternativeproposals for the acquisition of Tumi and the obtaining of the Tumi Stockholderapproval or (D) Tumi shall have violated or breached the covenant in the MergerAgreement in relation to the obtaining of Tumi Stockholders approval in amanner that has a material adverse impact on the timing of, or the ability toobtain, the requisite Tumi Stockholder approval; or
(ii) Tumi shall have breached or failed to perform in any material respect any of itscovenants or other agreements contained in the Merger Agreement or anyrepresentation or warranty of Tumi contained in the Merger Agreement shall notbe true and correct, subject to materiality provisions and cure periods, providedhowever, that the Company may not terminate the Merger Agreement pursuantto this paragraph if, at the time of such termination, the Company or PTLAcquisition is in material breach of the Merger Agreement; or
(d) by Tumi, if:
(i) prior to the receipt of the required Tumi Stockholder approval, in order toconcurrently enter into a definitive alternative acquisition agreement concerninga transaction that constitutes a superior proposal in accordance with the MergerAgreement; provided, that Tumi (A) pays the Termination Fee (as definedbelow) to the Company and (B) concurrently with such termination, enters intosuch definitive alternative acquisition agreement;
(ii) the Company shall have breached or failed to perform in any material respectany of its covenants or other agreements contained in the Merger Agreement orany representation or warranty of the Company contained in the MergerAgreement shall not be true and correct, subject to materiality provisions andcure periods, provided however, that Tumi may not terminate the MergerAgreement pursuant to this paragraph if, at the time of such termination, Tumi isin material breach of the Merger Agreement; or
(iii) prior to the receipt of the required Company Shareholder approval, (A) theBoard (or any committee thereof) shall have failed to include itsrecommendation in this circular or shall have otherwise effected a change inrecommendation due to its fiduciary duties under applicable law or (B) theCompany shall have violated or breached the covenant in the Merger Agreementrelating to the obtaining of the Company Shareholder approval in a manner thathas a material adverse impact on the timing of, or the ability to obtain, therequisite Company Shareholder approval.
Termination Fee Payable by Tumi
If the Merger Agreement is terminated by:
(1) the Company pursuant to paragraph (c)(ii) above or the Company or Tumi pursuant toparagraph (b)(i) or (b)(ii) above, and in any case (x) prior to the date of such termination
- 16 -
LETTER FROM THE BOARD
(or the date of the Tumi Stockholder meeting in the case of termination pursuant toparagraph (b)(ii) above), an acquisition proposal or an intention to make an acquisitionproposal shall have been communicated to the management of Tumi or the Tumi Boardor shall have been publicly disclosed and (y) within 15 months after such termination,(I) Tumi enters into a definitive agreement with respect to any acquisition proposal witha third party that is thereafter consummated or (II) Tumi consummates the transactionscontemplated by any acquisition proposal with a third party, which, in the case of (I) or(II), need not be the same acquisition proposal described in sub-paragraph (x) above;
(2) Tumi pursuant to paragraph (d)(i) above;
(3) the Company pursuant to paragraph (c)(i) above (but only in circumstances where theCompany does not have a right to terminate pursuant to paragraph (b)(ii) above); or
(4) either Tumi or the Company pursuant to paragraph (b)(ii) above,
then Tumi must pay to the Company an amount equal to, in the case of paragraph (1), (2) or (3) above,US$54,700,000, or in the case of paragraph (4) above, US$13,700,000 (each such applicable amount,the “Termination Fee”); provided, however, that any payment of the Termination Fee payable inaccordance with paragraph (4) above will not affect the Company’s right to receive any TerminationFee otherwise due under paragraph (1) above, but will reduce, on a dollar for dollar basis, anyTermination Fee that subsequently becomes due and payable under paragraph (1) above.
Termination Fee Payable by the Company
If the Merger Agreement is terminated by Tumi pursuant to paragraph (d)(iii) above (but onlyin circumstances where Tumi does not have a right to terminate pursuant to paragraph (b)(iii) above),the Company must pay to Tumi an amount equal to US$18,200,000. If the Merger Agreement isterminated by Tumi or the Company pursuant to paragraph (b)(iii) above, the Company must pay toTumi an amount equal to US$13,700,000.
The amount of the termination fees payable by either party was determined through arm’s lengthnegotiations between the parties after considering a variety of factors, including each party’s views onmarket practice for termination fees payable in similar contexts and the amounts that would be reasonableunder the circumstances. After consultations with their respective advisors, the parties considered that, inacquisitions of publicly traded companies organized under Delaware law, such as Tumi, market practicefor the amount of termination fees payable by a party upon a failure of its shareholders’ meeting toapprove a business combination transaction were generally not in excess of 1.0% of the fully dilutedequity value of the proposed transaction and that termination fees payable upon a termination by thetarget company to accept a superior proposal were generally in the range of 3% to 4% of the fully dilutedequity value of the proposed transaction. In addition, in the case of the termination fee payable by eitherparty upon a failure of its shareholders to approve the Merger, the parties considered the objective ofhaving a fee that would not be coercive of these shareholder votes and, in the case of the Termination Feepayable by Tumi in connection with its termination of the Merger Agreement to accept a superiorproposal, the parties considered the objective of having a fee that would not preclude such a superiorproposal. The parties further considered, after consultations with their respective advisors, that thetermination fees for the Merger were not in excess of the aforementioned ranges based on market practiceand that the amount of these fees, when taken in the context of the value of the Merger, was notsignificant enough to be inconsistent with these objectives.
- 17 -
LETTER FROM THE BOARD
9. Delisting of Tumi Shares from the New York Stock Exchange
Prior to Closing, Tumi will cooperate with the Company and use reasonable best efforts to take suchactions which are reasonably necessary to enable the delisting by Tumi of the Tumi Shares from the NewYork Stock Exchange and the deregistration of the Tumi Shares under the Exchange Act as promptly aspracticable after the Closing (if such delisting and deregistration have not occurred at or prior to Closing).
10. Closing
Subject to the satisfaction or waiver of the Conditions, Closing is expected to take place on thefourth business day after the satisfaction or waiver of all Conditions or, if later, the fourth business dayafter the marketing period during which the debt financing arrangements described below will bemarketed concludes. It is currently expected that Closing will occur in the second half of 2016.
D. DEBT FINANCING
As contemplated under the Merger Agreement, part of the Total Consideration is expected to befunded by way of committed debt financing which will be made available to the Company and/or certainof its subsidiaries pursuant to a commitment letter entered into by the Company with certain lenders andfinancial institutions, which has been replaced by a credit agreement entered into by PTL Acquisition andcertain lenders and financial institutions dated May 13, 2016 (the “Credit Agreement”). Such debtfinancing has been arranged by Morgan Stanley Senior Funding, Inc., HSBC Securities (USA) Inc.,SunTrust Robinson Humphrey, Inc., The Bank of Tokyo-Mitsubishi UFJ, Ltd., Barclays Bank PLC,Citizens Bank, N.A., ING Belgium SA/NV, Fifth Third Bank and Bank of China Limited (the “LeadArrangers”). The Credit Agreement provides an aggregate principal amount of US$2,425 million, whichconsists of US$500 million in commitments for revolving loans (the “Revolving Facility”) andUS$1,925 million in new term loan credit facilities, consisting of US$675 million of a Term Loan Btranche (the “Term Loan B Facility”) and US$1,250 million of a Term Loan A tranche (the “TermLoan A Facility” and together with the Term Loan B Facility, the “Term Loan Facilities”; the TermLoan Facilities, together with the Revolving Facility, the “Senior Credit Facilities”). The proceeds ofthe borrowings under the Term Loan B Facility have been funded and deposited into an escrow accounton May 13, 2016 (New York Time) and are being held in escrow prior to Closing.
Concurrently with Closing, the Company plans (a) to terminate and pay in full amountsoutstanding under (i) the second amended and restated credit agreement, dated as of June 17, 2014, byand among the Company, HSBC Bank USA, National Association, as administrative agent, and thelenders and other parties thereto (the “Existing Credit Agreement”) and (ii) the amended and restatedcredit and guaranty agreement, dated as of April 4, 2012, by and among Tumi, certain subsidiaries ofTumi and Wells Fargo Bank, National Association, as collateral agent, and the lenders and otherparties thereto (the “Existing Target Credit Agreement” and, together with the Existing CreditAgreement, the “Existing Senior Credit Facilities”) and (b) for the Company and certain of itssubsidiaries to join the Credit Agreement as borrowers and guarantors, for the Term Loan B Facility tobe released from escrow and for the Term Loan A Facility to be funded.
- 18 -
LETTER FROM THE BOARD
Certain details of the proposed Senior Credit Facilities are set out below:
Maturity: Not more than five years with regard to the Revolving Facility andthe Term Loan A Facility and not more than seven years withregard to the Term Loan B Facility.
Interest rate: In respect of the Term Loan B Facility, interest on the aggregateprincipal amount of the Term Loan B Facility is expected to havebegun to accrue from the date that the Term Loan B Facility wasfunded into escrow and shall be payable quarterly in arrears. TheTerm Loan B Facility shall accrue interest at a rate equal to anadjusted rate based on the London Interbank Offered Rate(“LIBOR”) plus 3.25% per annum (or a base rate plus 2.25% perannum).
In respect of the Term Loan A Facility and Revolving Facility,interest shall begin to accrue on Closing. The interest rates for theRevolving Facility and the Term Loan A Facility will initially bean adjusted rate based on LIBOR plus 2.75% per annum (or a baserate plus 1.75% per annum) and thereafter shall be based on thetotal net leverage ratio of the Company and its restrictedsubsidiaries.
Use of proceeds: The proceeds of the Senior Credit Facilities will be used to pay theTotal Consideration, to repay the Existing Senior Credit Facilitiesand to pay fees, costs and expenses related to the foregoingtransactions and for general corporate purposes.
Guarantee: Upon Closing, the Senior Credit Facilities are expected to beguaranteed by each borrower and certain subsidiaries of theCompany.
Financial covenants: Following Closing, the Senior Credit Facilities will require theCompany and its restricted subsidiaries to, among other things,meet certain quarterly financial covenants. Commencing with thefiscal quarter ending December 31, 2016, the Company and itsrestricted subsidiaries will be required to maintain (i) a pro formatotal net leverage ratio of not greater than 4.75:1.00, whichthreshold will decrease to 4.50:1.00 for test periods in 2018,4.25:1.00 for test periods in 2019 and 4.00:1.00 for test periods in2020, and (ii) a pro forma interest coverage ratio of not less than3.25:1.00.
In order to partially mitigate the risk of interest rate fluctuations under the Senior CreditFacilities, a wholly-owned subsidiary of the Company has entered into interest rate swaps with MorganStanley Capital Services LLC and Bank of America, N.A., which will, contingent upon Closing, takeeffect on December 31, 2016. The effect of such swaps is that, for a period of five years beginningDecember 31, 2016, LIBOR will be fixed at approximately 1.30% with respect to the interest thataccrues on approximately 65% of the outstanding principal amount under the Term Loan Facilities. Inthe event that Closing does not occur, the swaps will terminate and the Company’s subsidiary partythereto will not have any obligations thereunder.
- 19 -
LETTER FROM THE BOARD
E. INFORMATION ON THE GROUP
The Group is the world’s best known and largest lifestyle bag and travel luggage company,with a heritage dating back more than 100 years. The Group is principally engaged in the design,manufacture, sourcing and distribution of luggage, business and computer bags, outdoor and casualbags, travel accessories and slim protective cases for personal electronic devices throughout the world,primarily under the Samsonite®, American Tourister®, Hartmann®, High Sierra®, Gregory®, Speck®
and Lipault® brand names as well as other owned and licensed brand names. The Group’s core brand,Samsonite, is one of the most well-known travel luggage brands in the world.
The Group sells its products through a variety of wholesale distribution channels, through itscompany-operated retail stores and through e-commerce. Its principal wholesale distribution customersare department and specialty retail stores, mass merchants, catalog showrooms and warehouse clubs.The Group sells its products in Asia, North America, Europe and Latin America. As of December 31,2015, the Group’s products were sold in over 100 countries.
F. INFORMATION ON TUMI
Founded in 1975, Tumi is a leading global premium lifestyle brand offering a comprehensiveline of business bags, travel luggage and accessories. The brand is consistently recognized as “best inclass” for the high quality, durability, functionality and innovative design of its products, which rangefrom its iconic black ballistic business cases and travel luggage synonymous with the modern businessprofessional, to travel accessories, women’s bags and outdoor apparel.
As of December 31, 2015, the Tumi brand was sold in approximately 2,000 points ofdistribution from New York to Paris to London and Tokyo, as well as in the world’s top department,specialty and travel retail stores in over 75 countries. The Tumi Shares are traded on the New YorkStock Exchange under the symbol “TUMI”.
Set out below is selected consolidated financial information of Tumi derived from Tumi’spublished audited historical consolidated financial statements, which have been prepared in accordancewith U.S. GAAP:
For the year ended December 31,
(in US$ thousands) 2013 2014 2015
Net sales . . . . . . . . . . . . . . . . . . . . . . . . . . . . . . . . . . . . . . . . . . . . . . . . . . . . . . . . . . 467,438 527,194 547,655Income before income taxes . . . . . . . . . . . . . . . . . . . . . . . . . . . . . . . . . . . . . . . . . . . 86,108 93,839 97,453Net income . . . . . . . . . . . . . . . . . . . . . . . . . . . . . . . . . . . . . . . . . . . . . . . . . . . . . . . . 54,559 58,009 63,013
As of December 31,
(in US$ thousands) 2013 2014 2015
Net asset value . . . . . . . . . . . . . . . . . . . . . . . . . . . . . . . . . . . . . . . . . . . . . . . . . . . . . 367,998 426,883 480,846
For the year ended December 31, 2015, Tumi’s net sales were approximately US$547.7million, representing a year on year increase of 4%. North America accounted for 68% of Tumi’s 2015net sales, with Asia Pacific accounting for 17%, Europe, Middle East and Africa accounting for 14%and Latin America accounting for the remaining 1% of net sales. Tumi has historically achieved stronggrowth in net sales with a compound annual growth rate of 17% from 2010 to 2015 and highlyattractive EBITDA margins at and over 20% during the same period.
- 20 -

LETTER FROM THE BOARD
G. FINANCIAL EFFECTS OF THE MERGER ON THE GROUP
Upon Closing, Tumi will become an indirect wholly-owned subsidiary of the Company and itsresults will be consolidated with that of the Group.
As set out in Tumi’s audited financial statements for the financial year ended December 31,2015, the net sales and net income of Tumi were approximately US$547.7 million andUS$63.0 million, respectively. On this basis, the Directors expect that the Merger would have apositive impact on the Group’s net sales and earnings following Closing.
Appendix III to this circular sets out certain unaudited pro forma financial information of theEnlarged Group, which illustrates the financial effects of the Merger (including the debt financing forthe Merger) on the assets and liabilities of the Group assuming Closing had taken place onDecember 31, 2015.
As set out in Appendix III to this circular, as a result of the Merger (including the debtfinancing for the Merger):
(a) the total assets of the Group would increase from approximately US$2,215.8 million toapproximately US$4,128.7 million for the Enlarged Group;
(b) the total liabilities of the Group would increase from approximately US$816.5 millionto approximately US$2,765.3 million for the Enlarged Group; and
(c) the gearing ratio of the Group, calculated as total loans and borrowings (excludingdeferred financing costs) divided by total equity, would increase from approximately4.6% to 142.3%.
The Directors are of the view that the Merger (including the debt financing for the Merger) isnot expected to have any material adverse impact on the financial position of the Group. The Directorsare also of the view that, taking into account the scheduled payment obligations under the SeniorCredit Facilities and the expected cash flows of the Enlarged Group, the Enlarged Group will be able tomeet its scheduled payment obligations under the Senior Credit Facilities. In addition, as set out in“Working Capital” in Appendix I to this circular, the Directors are of the opinion that the EnlargedGroup will have sufficient working capital for its present requirements for at least the next 12 monthsfrom the date of this circular.
Shareholders should note that the earnings contribution from Tumi after Closing will depend onthe future performance of Tumi, and the actual effect of the Merger (including the debt financing forthe Merger) on the assets and liabilities of the Group will depend on the financial position of Tumi asof the date of Closing, which cannot be quantified as of the Latest Practicable Date. The unaudited proforma financial information of the Enlarged Group set out in Appendix III to this circular has beenprepared for illustrative purposes only and because of its hypothetical nature, it may not give a truepicture of the financial position of the Group and the Enlarged Group at any future date.
H. IMPLICATIONS OF THE MERGER UNDER THE LISTING RULES
As one or more of the applicable percentage ratios (as set out and calculated under Rule 14.07of the Listing Rules) in respect of the Merger is more than 25% but all are less than 100%, the Mergerconstitutes a major transaction of the Company and is subject to the reporting, announcement, circularand shareholders’ approval requirements under Chapter 14 of the Listing Rules.
- 21 -
LETTER FROM THE BOARD
I. WAIVER FROM STRICT COMPLIANCE WITH THE LISTING RULES
Pursuant to Rule 14.67(6)(a)(i) of the Listing Rules, the Company is required to include in thiscircular an accountants’ report on Tumi prepared in accordance with Chapter 4 of the Listing Rules.The accountants’ report must include the financial information of Tumi for each of the three financialyears ended December 31, 2015 prepared using accounting policies which should be materiallyconsistent with those adopted by the Company.
Tumi is listed on the New York Stock Exchange. In accordance with the rules and regulationsof the U.S. Securities and Exchange Commission (the “SEC”), Tumi’s published audited annualfinancial statements and its published unaudited quarterly financial information have been prepared inaccordance with U.S. GAAP. Tumi’s financial statements for the financial year ended December 31,2015 have been audited by Tumi’s auditors, Deloitte & Touche LLP, in accordance with the standardsof the Public Company Accounting Oversight Board (United States) (“PCAOB”). Tumi’s financialstatements for each of the financial years ended December 31, 2013 and 2014 were audited by GrantThornton LLP in accordance with the standards of PCAOB. Tumi’s quarterly financial information isalso reviewed prior to its publication as required by SEC regulations.
Each of Grant Thornton LLP and Deloitte & Touche LLP is a firm with international name andreputation and is registered with the PCAOB.
The Company’s financial statements are prepared in accordance with IFRS. Complying withthe strict requirements of Rule 14.67(6)(a)(i) of the Listing Rules in having to produce an accountants’report on Tumi in this circular would be unduly burdensome and would create practical difficulties asthis would require Tumi and its auditors to undertake a considerable amount of work to convert Tumi’sfinancial information for each of the three financial years ended December 31, 2015 from U.S. GAAPto IFRS. This would have significant timing, resource and cost implications for both Tumi and theCompany.
In replacement of an accountants’ report on Tumi, the following disclosure has been includedin this circular:
(a) the audited financial information on Tumi for the financial years ended December 31,2013, 2014 and 2015 prepared in accordance with U.S. GAAP, including themanagement discussion and analysis, extracted from the annual reports of Tumi foreach of such years, as set out in “Published Financial Information of the Tumi Group ofEach of the Three Years Ended December 31, 2013, 2014 and 2015 and the ThreeMonths Ended March 27, 2016” and “Management Discussion and Analysis of Tumi” inAppendix II to this circular;
(b) a summary of the material differences between the accounting policies adopted by Tumi(under U.S. GAAP) and the accounting policies adopted by the Company (under IFRS),including a line-by-line reconciliation of the consolidated income statements,consolidated statements of comprehensive income and consolidated balance sheets,addressing the material differences, other than presentational differences, which wouldhave a significant effect on Tumi’s financial information referred to in paragraph(a) above had it been prepared in accordance with the accounting policies adopted bythe Company under IFRS (the “Reconciliation”). The Reconciliation is reported on byDeloitte Touche Tohmatsu in Hong Kong in accordance with Hong Kong Standard of
- 22 -
LETTER FROM THE BOARD
Assurance Engagements 3000, as set out in “Differences between the AccountingPolicies Adopted by the Company (IFRS) and Tumi (U.S. GAAP)” in Appendix II to thiscircular; and
(c) supplemental financial information of Tumi for the financial years ended December 31,2013, 2014 and 2015 (the “Supplemental Financial Information”) which is requiredfor an accountants’ report under the Listing Rules but not disclosed in the publishedfinancial information of Tumi, excluding the information required under Listing Rule4.08(3) (which requires the accountants’ report to state that it has been prepared inaccordance with the Auditing Guideline – Prospectuses and the reporting accountant(Statement 3.340) issued by the Hong Kong Institute of Certified Public Accountants),as set out in “Supplemental Financial Information of the Tumi Group” in Appendix II tothis circular.
The Directors consider that the published financial information in relation to Tumi reproducedin this circular, when taken together with the related management discussion and analysis, theReconciliation and the Supplemental Financial Information, will afford Shareholders with all materialinformation necessary to assess the financial performance of Tumi throughout the periods presented,such information being broadly commensurate in all material respects to the disclosure that wouldotherwise have been provided if an accountants’ report on Tumi had been produced underRule 14.67(6)(a)(i) of the Listing Rules.
Accordingly, the Company has applied to the Stock Exchange for, and the Stock Exchange hasgranted, a waiver from strict compliance with Rule 14.67(6)(a)(i) of the Listing Rules such that theCompany is not required to include an accountants’ report on Tumi in this circular.
J. RECOMMENDATION OF THE BOARD
Having taken into account the reasons for, and benefits of, the Merger as set out above, theDirectors have unanimously approved, among other things, the Merger and recommend theShareholders to vote in favour of the resolution to be proposed at the General Meeting to approve theMerger Agreement, the transactions contemplated by the Merger Agreement, including the Merger, thedebt financing as well as the guarantees and security to be granted in that respect.
K. GENERAL MEETING
The General Meeting will be convened and held for the purpose of considering and, if thoughtfit, approving the Merger Agreement, the transactions contemplated by the Merger Agreement,including the Merger, the debt financing as well as the guarantees and security to be granted in thatrespect. The notice of the General Meeting is set out on pages N-1 and N-2 of this circular.
Under the Hong Kong Listing Rules, all Shareholders who have a material interest (which isdifferent from that of all other Shareholders) in the Merger Agreement, any of the transactionscontemplated by the Merger Agreement, including the Merger, the debt financing as well as theguarantees and security to be granted in that respect and their associates (as defined in the ListingRules) will be required to abstain from voting on the resolution to approve the Merger Agreement, thetransactions contemplated by the Merger Agreement, including the Merger, the debt financing as wellas the guarantees and security to be granted in that respect at the General Meeting.
- 23 -
LETTER FROM THE BOARD
To the best of the Directors’ knowledge, information and belief, having made all reasonableenquiries, no Shareholder is required to abstain from voting on the resolution to approve the MergerAgreement, the transactions contemplated by the Merger Agreement, including the Merger, the debtfinancing as well as the guarantees and security to be granted in that respect at the General Meeting.
Pursuant to the Listing Rules and Article 13.5 of the Articles of Incorporation, any vote ofShareholders at a general meeting must be taken by poll. An announcement on the poll vote results willbe published by the Company after the General Meeting in the manner prescribed under Rule 13.39(5)of the Listing Rules.
A form of proxy for use at the General Meeting is enclosed with this circular and such form ofproxy is also published on the websites of Hong Kong Exchanges and Clearing Limited(http://www.hkexnews.hk) and the Company (http://www.samsonite.com). To be valid, the form ofproxy must be completed and signed in accordance with the instructions printed thereon and depositedat the Company’s branch share registrar in Hong Kong, Computershare Hong Kong Investor ServicesLimited, at 17M Floor, Hopewell Centre, 183 Queen’s Road East, Wanchai, Hong Kong or to theCompany’s registered office at 13–15 Avenue de la Liberté, L-1931 Luxembourg as soon as possiblebut in any event not less than 48 hours before the time appointed for the holding of the GeneralMeeting or any adjournment thereof.
Completion and return of the form of proxy will not preclude Shareholders from attending andvoting in person at the General Meeting if they so wish.
L. ADDITIONAL INFORMATION
Morgan Stanley Asia Limited acted as financial advisor to the Company on the Merger.
Your attention is drawn to the additional information set out in Appendices I to IV to thiscircular.
Shareholders and potential investors in the Company should note that the consummationof the Merger is subject to the fulfilment of certain conditions, including, among other things, theapproval of the Shareholders of the Company and the approval of the Tumi Stockholders, andthat the Merger Agreement may be terminated in certain circumstances. Accordingly, there is noassurance that the Merger will be completed. Shareholders and potential investors in theCompany should exercise caution when dealing in the Shares.
Yours faithfully,For and on behalf of the Board
Timothy Charles ParkerChairman
- 24 -
A. FINANCIAL INFORMATION OF THE GROUP FOR EACH OF THE THREE YEARSENDED 31 DECEMBER 2013, 2014 AND 2015
Financial information of the Group for each of the three years ended December 31, 2013, 2014and 2015 is disclosed in the following documents which have been published on the websites of theStock Exchange (http://www.hkexnews.hk) and the Company (http://www.samsonite.com) and can beaccessed at the website addresses below:
Š Annual report of the Company for the year ended December 31, 2013 published onApril 24, 2014 (pages 94 to 175)
http://www4.samsonite.com/_investordocs/20140424051856_E_Samsonite%20International%20SA%202013%20Annual%20Report%2020140424.pdf
Š Annual report of the Company for the year ended December 31, 2014 published onApril 24, 2015 (pages 102 to 187)
http://www4.samsonite.com/_investordocs/20150424134154_E_2014%20Annual%20Report%20-%20FINAL%20(2015-04-24).pdf
Š Annual report of the Company for the year ended December 31, 2015 published onApril 22, 2016 (pages 123 to 215).
http://www4.samsonite.com/_investordocs/20160422001507_E_Samsonite%202015%20Annual%20Report%20(FINAL%202016-04-22).pdf
B. INDEBTEDNESS STATEMENT
Borrowings
As of the close of business on April 30, 2016, being the latest practicable date for the purposeof this statement of indebtedness, the Enlarged Group had outstanding loans and borrowings ofapproximately US$64.9 million, which comprised (i) bank loans of approximately US$59.0 million, ofwhich approximately US$43.4 million were secured, approximately US$15.5 million were unsecuredand approximately US$41.7 million were guaranteed by certain subsidiaries of the Enlarged Group and(ii) other loans and borrowings of approximately US$5.9 million, of which approximatelyUS$0.1 million were secured, approximately US$5.8 million were unsecured and none was guaranteed.
Pledge of assets
As of the close of business on April 30, 2016, the Enlarged Group had pledged assets withaggregate carrying values of approximately US$2,036.1 million, of which approximatelyUS$2,036.0 million and US$0.1 million were pledged as collateral for bank loans and other loans andborrowings, respectively.
Contingent liabilities and guarantees
As of the close of business on April 30, 2016, the Enlarged Group did not have any materialcontingent liabilities, the results of which would have a material adverse impact on its financial results.
Save as disclosed above and apart from intra-group liabilities and guarantees, as of the close ofbusiness on April 30, 2016, the Enlarged Group did not have any outstanding loan capital, bankoverdrafts, loans, mortgages, charges or other similar indebtedness, hire purchase or finance leasecommitments, liabilities under acceptances or acceptance credits, guarantees or other materialcontingent liabilities.
- I-1 -
APPENDIX I FINANCIAL INFORMATION OF THE GROUP
C. WORKING CAPITAL
The Directors are of the opinion that, following Closing and in the absence of unforeseeablecircumstances, after taking into account the Enlarged Group’s business prospects, internal resourcesand available credit facilities, the Enlarged Group will have sufficient working capital for its presentrequirements for at least the next 12 months from the date of this circular.
D. NO MATERIAL ADVERSE CHANGE
As of the Latest Practicable Date, the Directors are not aware of any material adverse change inthe financial or trading position of the Group since December 31, 2015, the date to which the latestpublished audited consolidated financial statements of the Group were made up.
E. FINANCIAL AND TRADING PROSPECTS OF THE ENLARGED GROUP
The Merger will create a leading global travel lifestyle company by bringing together Tumi, aniconic North American purveyor of premium business bags, travel luggage and accessories, with theGroup, the world’s best known and largest lifestyle bag and travel luggage company. The Group’sbroad global retail and wholesale distribution network and its strengths in sourcing, technicalinnovation and localisation of products will allow it to introduce the Tumi brand to millions of newcustomers in additional existing markets worldwide. This includes expansion of Tumi in Asia, Europeand Latin America, strengthening its platform in North America and leveraging the Group’s clearstrength in hardside innovation to expand Tumi’s hardside luggage offering.
In turn, Tumi will reinforce the Group’s strong platform for long-term growth and profitability.Tumi is a highly profitable business and the Enlarged Group is expected to generate significant freecash flow to fund operations and service debt while continuing to make cash distributions toShareholders.
The Merger creates potential for significant operational and volume-growth synergies. Thisincludes cost savings in key areas such as sourcing, logistics, sales and marketing, distribution, retailand general and administrative costs, as well as potential volume-growth synergies resulting from theEnlarged Group’s enhanced and complementary product development and global reach.
The Enlarged Group’s growth strategy will continue as planned, with a focus on the following:
(a) continue to develop the Enlarged Group into a well-diversified multi-brand, multi-category and multi-channel luggage, bag and accessories business;
(b) tactfully deploy multiple brands to operate at wider price points and broader consumerdemographics in each category;
(c) increase the proportion of sales from the retail channel by growing e-commerce salesand through targeted expansion of its retail presence;
(d) continue to invest in the Enlarged Group’s brands with sustained research anddevelopment spending to produce exciting and innovative new products as well as newmaterials, supported by effective marketing spend to drive awareness amongconsumers; and
(e) focus on integrating Tumi into the Group’s existing business and to begin to realizeanticipated synergies.
- I-2 -
APPENDIX I FINANCIAL INFORMATION OF THE GROUP
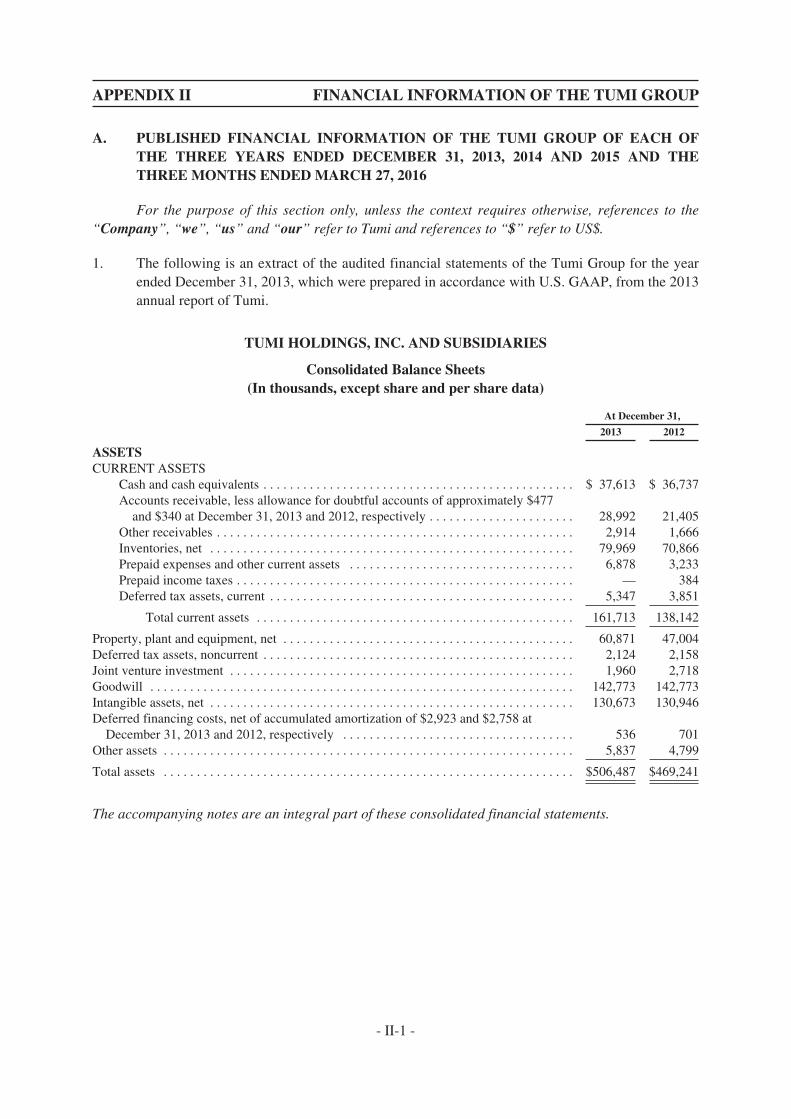
APPENDIX II FINANCIAL INFORMATION OF THE TUMI GROUP
A. PUBLISHED FINANCIAL INFORMATION OF THE TUMI GROUP OF EACH OFTHE THREE YEARS ENDED DECEMBER 31, 2013, 2014 AND 2015 AND THETHREE MONTHS ENDED MARCH 27, 2016
For the purpose of this section only, unless the context requires otherwise, references to the“Company”, “we”, “us” and “our” refer to Tumi and references to “$” refer to US$.
1. The following is an extract of the audited financial statements of the Tumi Group for the yearended December 31, 2013, which were prepared in accordance with U.S. GAAP, from the 2013annual report of Tumi.
TUMI HOLDINGS, INC. AND SUBSIDIARIES
Consolidated Balance Sheets(In thousands, except share and per share data)
At December 31,
2013 2012
ASSETSCURRENT ASSETS
Cash and cash equivalents . . . . . . . . . . . . . . . . . . . . . . . . . . . . . . . . . . . . . . . . . . . . . . . $ 37,613 $ 36,737Accounts receivable, less allowance for doubtful accounts of approximately $477
and $340 at December 31, 2013 and 2012, respectively . . . . . . . . . . . . . . . . . . . . . . 28,992 21,405Other receivables . . . . . . . . . . . . . . . . . . . . . . . . . . . . . . . . . . . . . . . . . . . . . . . . . . . . . . 2,914 1,666Inventories, net . . . . . . . . . . . . . . . . . . . . . . . . . . . . . . . . . . . . . . . . . . . . . . . . . . . . . . . 79,969 70,866Prepaid expenses and other current assets . . . . . . . . . . . . . . . . . . . . . . . . . . . . . . . . . . 6,878 3,233Prepaid income taxes . . . . . . . . . . . . . . . . . . . . . . . . . . . . . . . . . . . . . . . . . . . . . . . . . . . — 384Deferred tax assets, current . . . . . . . . . . . . . . . . . . . . . . . . . . . . . . . . . . . . . . . . . . . . . . 5,347 3,851
Total current assets . . . . . . . . . . . . . . . . . . . . . . . . . . . . . . . . . . . . . . . . . . . . . . . . 161,713 138,142
Property, plant and equipment, net . . . . . . . . . . . . . . . . . . . . . . . . . . . . . . . . . . . . . . . . . . . . 60,871 47,004Deferred tax assets, noncurrent . . . . . . . . . . . . . . . . . . . . . . . . . . . . . . . . . . . . . . . . . . . . . . . 2,124 2,158Joint venture investment . . . . . . . . . . . . . . . . . . . . . . . . . . . . . . . . . . . . . . . . . . . . . . . . . . . . 1,960 2,718Goodwill . . . . . . . . . . . . . . . . . . . . . . . . . . . . . . . . . . . . . . . . . . . . . . . . . . . . . . . . . . . . . . . . 142,773 142,773Intangible assets, net . . . . . . . . . . . . . . . . . . . . . . . . . . . . . . . . . . . . . . . . . . . . . . . . . . . . . . . 130,673 130,946Deferred financing costs, net of accumulated amortization of $2,923 and $2,758 at
December 31, 2013 and 2012, respectively . . . . . . . . . . . . . . . . . . . . . . . . . . . . . . . . . . . 536 701Other assets . . . . . . . . . . . . . . . . . . . . . . . . . . . . . . . . . . . . . . . . . . . . . . . . . . . . . . . . . . . . . . 5,837 4,799
Total assets . . . . . . . . . . . . . . . . . . . . . . . . . . . . . . . . . . . . . . . . . . . . . . . . . . . . . . . . . . . . . . $506,487 $469,241
The accompanying notes are an integral part of these consolidated financial statements.
- II-1 -

APPENDIX II FINANCIAL INFORMATION OF THE TUMI GROUP
TUMI HOLDINGS, INC. AND SUBSIDIARIES
Consolidated Balance Sheets (continued)(In thousands, except share and per share data)
At December 31,
2013 2012
LIABILITIES AND STOCKHOLDERS’ EQUITYCURRENT LIABILITIES
Accounts payable . . . . . . . . . . . . . . . . . . . . . . . . . . . . . . . . . . . . . . . . . . . . . . . . . . . . . $ 33,938 $ 27,366Accrued expenses . . . . . . . . . . . . . . . . . . . . . . . . . . . . . . . . . . . . . . . . . . . . . . . . . . . . . 32,120 29,503Income taxes payable . . . . . . . . . . . . . . . . . . . . . . . . . . . . . . . . . . . . . . . . . . . . . . . . . . 4,680 —
Total current liabilities . . . . . . . . . . . . . . . . . . . . . . . . . . . . . . . . . . . . . . . . . . . . . 70,738 56,869
Revolving credit facility . . . . . . . . . . . . . . . . . . . . . . . . . . . . . . . . . . . . . . . . . . . . . . . . . . . . 8,000 45,000Other long-term liabilities . . . . . . . . . . . . . . . . . . . . . . . . . . . . . . . . . . . . . . . . . . . . . . . . . . . 8,556 7,271Deferred tax liabilities . . . . . . . . . . . . . . . . . . . . . . . . . . . . . . . . . . . . . . . . . . . . . . . . . . . . . . 51,195 49,016
Total liabilities . . . . . . . . . . . . . . . . . . . . . . . . . . . . . . . . . . . . . . . . . . . . . . . . . . . 138,489 158,156
Commitments and contingencies
STOCKHOLDERS’ EQUITYCommon stock—$0.01 par value; 350,000,000 shares authorized, 68,144,473 shares
issued and 67,866,667 shares outstanding as of December 31, 2013 and 2012 . . . . 681 681Preferred stock—$0.01 par value; 75,000,000 shares authorized and no shares issued
or outstanding as of December 31, 2013 and 2012 . . . . . . . . . . . . . . . . . . . . . . . . . . — —Additional paid-in capital . . . . . . . . . . . . . . . . . . . . . . . . . . . . . . . . . . . . . . . . . . . . . . . 310,554 308,545Treasury stock, at cost . . . . . . . . . . . . . . . . . . . . . . . . . . . . . . . . . . . . . . . . . . . . . . . . . . (4,874) (4,874)Retained earnings . . . . . . . . . . . . . . . . . . . . . . . . . . . . . . . . . . . . . . . . . . . . . . . . . . . . . 61,725 7,166Accumulated other comprehensive loss . . . . . . . . . . . . . . . . . . . . . . . . . . . . . . . . . . . . (88) (433)
Total stockholders’ equity . . . . . . . . . . . . . . . . . . . . . . . . . . . . . . . . . . . . . . . . . . . 367,998 311,085
Total liabilities and stockholders’ equity . . . . . . . . . . . . . . . . . . . . . . . . . . . . . . . . . . . . . . . $506,487 $469,241
The accompanying notes are an integral part of these consolidated financial statements.
- II-2 -
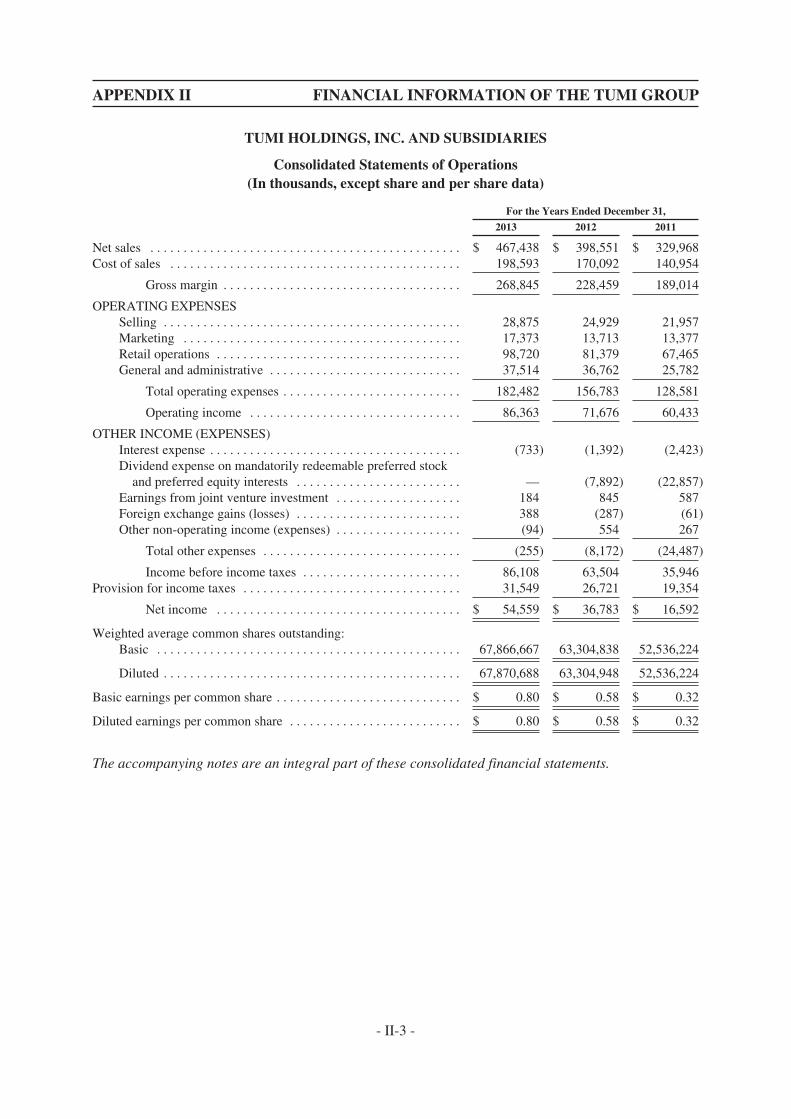
APPENDIX II FINANCIAL INFORMATION OF THE TUMI GROUP
TUMI HOLDINGS, INC. AND SUBSIDIARIES
Consolidated Statements of Operations(In thousands, except share and per share data)
For the Years Ended December 31,
2013 2012 2011
Net sales . . . . . . . . . . . . . . . . . . . . . . . . . . . . . . . . . . . . . . . . . . . . . . . $ 467,438 $ 398,551 $ 329,968Cost of sales . . . . . . . . . . . . . . . . . . . . . . . . . . . . . . . . . . . . . . . . . . . . 198,593 170,092 140,954
Gross margin . . . . . . . . . . . . . . . . . . . . . . . . . . . . . . . . . . . . 268,845 228,459 189,014
OPERATING EXPENSESSelling . . . . . . . . . . . . . . . . . . . . . . . . . . . . . . . . . . . . . . . . . . . . . 28,875 24,929 21,957Marketing . . . . . . . . . . . . . . . . . . . . . . . . . . . . . . . . . . . . . . . . . . 17,373 13,713 13,377Retail operations . . . . . . . . . . . . . . . . . . . . . . . . . . . . . . . . . . . . . 98,720 81,379 67,465General and administrative . . . . . . . . . . . . . . . . . . . . . . . . . . . . . 37,514 36,762 25,782
Total operating expenses . . . . . . . . . . . . . . . . . . . . . . . . . . . 182,482 156,783 128,581
Operating income . . . . . . . . . . . . . . . . . . . . . . . . . . . . . . . . 86,363 71,676 60,433
OTHER INCOME (EXPENSES)Interest expense . . . . . . . . . . . . . . . . . . . . . . . . . . . . . . . . . . . . . . (733) (1,392) (2,423)Dividend expense on mandatorily redeemable preferred stock
and preferred equity interests . . . . . . . . . . . . . . . . . . . . . . . . . — (7,892) (22,857)Earnings from joint venture investment . . . . . . . . . . . . . . . . . . . 184 845 587Foreign exchange gains (losses) . . . . . . . . . . . . . . . . . . . . . . . . . 388 (287) (61)Other non-operating income (expenses) . . . . . . . . . . . . . . . . . . . (94) 554 267
Total other expenses . . . . . . . . . . . . . . . . . . . . . . . . . . . . . . (255) (8,172) (24,487)
Income before income taxes . . . . . . . . . . . . . . . . . . . . . . . . 86,108 63,504 35,946Provision for income taxes . . . . . . . . . . . . . . . . . . . . . . . . . . . . . . . . . 31,549 26,721 19,354
Net income . . . . . . . . . . . . . . . . . . . . . . . . . . . . . . . . . . . . . $ 54,559 $ 36,783 $ 16,592
Weighted average common shares outstanding:Basic . . . . . . . . . . . . . . . . . . . . . . . . . . . . . . . . . . . . . . . . . . . . . . 67,866,667 63,304,838 52,536,224
Diluted . . . . . . . . . . . . . . . . . . . . . . . . . . . . . . . . . . . . . . . . . . . . . 67,870,688 63,304,948 52,536,224
Basic earnings per common share . . . . . . . . . . . . . . . . . . . . . . . . . . . . $ 0.80 $ 0.58 $ 0.32
Diluted earnings per common share . . . . . . . . . . . . . . . . . . . . . . . . . . $ 0.80 $ 0.58 $ 0.32
The accompanying notes are an integral part of these consolidated financial statements.
- II-3 -
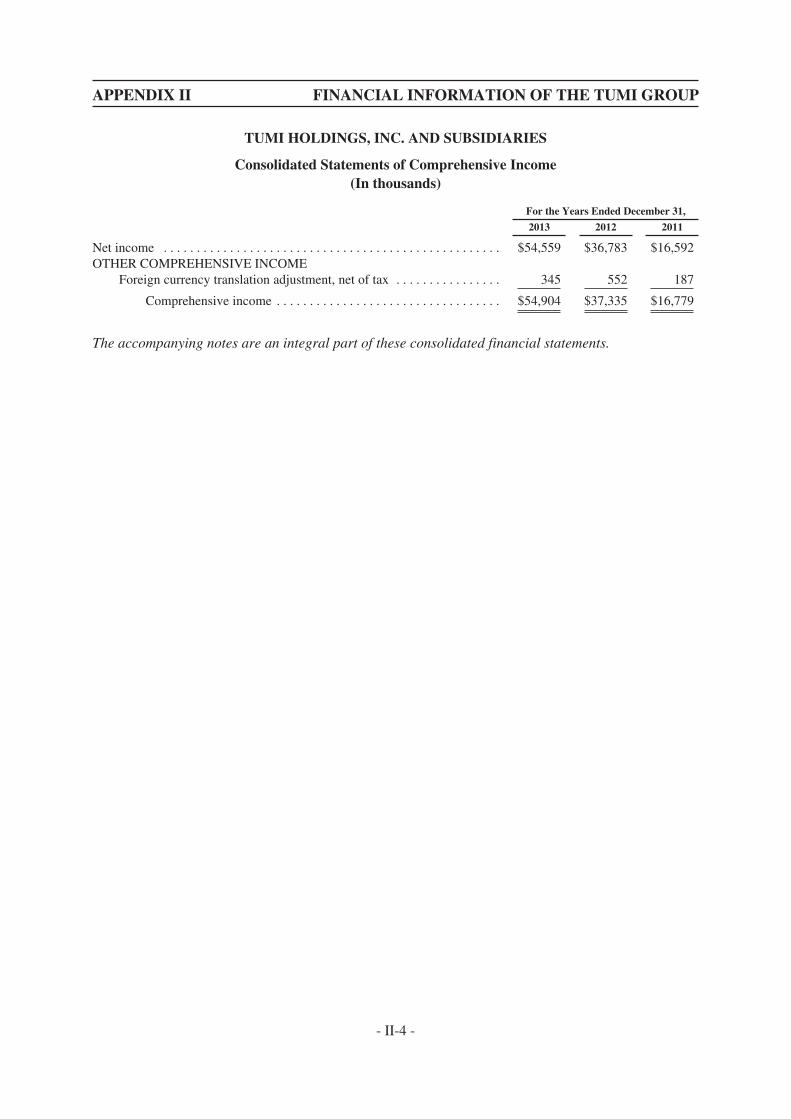
APPENDIX II FINANCIAL INFORMATION OF THE TUMI GROUP
TUMI HOLDINGS, INC. AND SUBSIDIARIES
Consolidated Statements of Comprehensive Income(In thousands)
For the Years Ended December 31,
2013 2012 2011
Net income . . . . . . . . . . . . . . . . . . . . . . . . . . . . . . . . . . . . . . . . . . . . . . . . . . . $54,559 $36,783 $16,592OTHER COMPREHENSIVE INCOME
Foreign currency translation adjustment, net of tax . . . . . . . . . . . . . . . . 345 552 187
Comprehensive income . . . . . . . . . . . . . . . . . . . . . . . . . . . . . . . . . . $54,904 $37,335 $16,779
The accompanying notes are an integral part of these consolidated financial statements.
- II-4 -
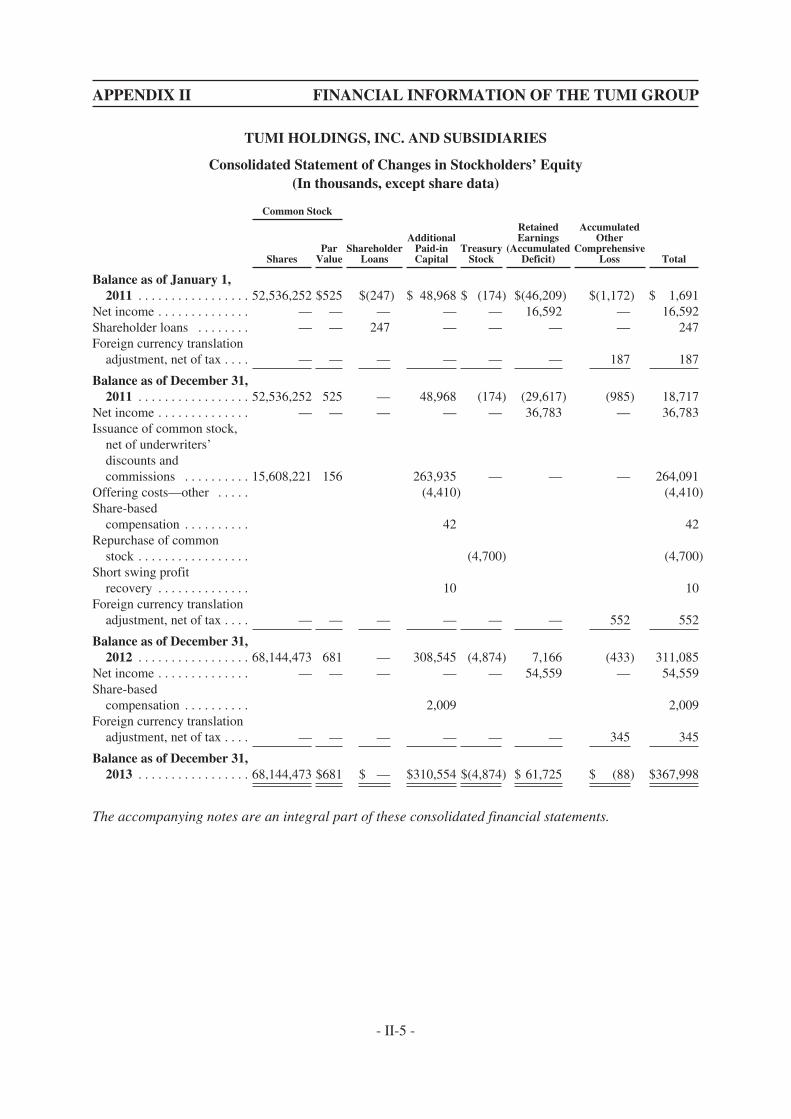
APPENDIX II FINANCIAL INFORMATION OF THE TUMI GROUP
TUMI HOLDINGS, INC. AND SUBSIDIARIES
Consolidated Statement of Changes in Stockholders’ Equity(In thousands, except share data)
Common Stock
SharesPar
ValueShareholder
Loans
AdditionalPaid-inCapital
TreasuryStock
RetainedEarnings
(AccumulatedDeficit)
AccumulatedOther
ComprehensiveLoss Total
Balance as of January 1,2011 . . . . . . . . . . . . . . . . . 52,536,252 $525 $(247) $ 48,968 $ (174) $(46,209) $(1,172) $ 1,691
Net income . . . . . . . . . . . . . . — — — — — 16,592 — 16,592Shareholder loans . . . . . . . . — — 247 — — — — 247Foreign currency translation
adjustment, net of tax . . . . — — — — — — 187 187
Balance as of December 31,2011 . . . . . . . . . . . . . . . . . 52,536,252 525 — 48,968 (174) (29,617) (985) 18,717
Net income . . . . . . . . . . . . . . — — — — — 36,783 — 36,783Issuance of common stock,
net of underwriters’discounts andcommissions . . . . . . . . . . 15,608,221 156 263,935 — — — 264,091
Offering costs—other . . . . . (4,410) (4,410)Share-based
compensation . . . . . . . . . . 42 42Repurchase of common
stock . . . . . . . . . . . . . . . . . (4,700) (4,700)Short swing profit
recovery . . . . . . . . . . . . . . 10 10Foreign currency translation
adjustment, net of tax . . . . — — — — — — 552 552
Balance as of December 31,2012 . . . . . . . . . . . . . . . . . 68,144,473 681 — 308,545 (4,874) 7,166 (433) 311,085
Net income . . . . . . . . . . . . . . — — — — — 54,559 — 54,559Share-based
compensation . . . . . . . . . . 2,009 2,009Foreign currency translation
adjustment, net of tax . . . . — — — — — — 345 345
Balance as of December 31,2013 . . . . . . . . . . . . . . . . . 68,144,473 $681 $ — $310,554 $(4,874) $ 61,725 $ (88) $367,998
The accompanying notes are an integral part of these consolidated financial statements.
- II-5 -
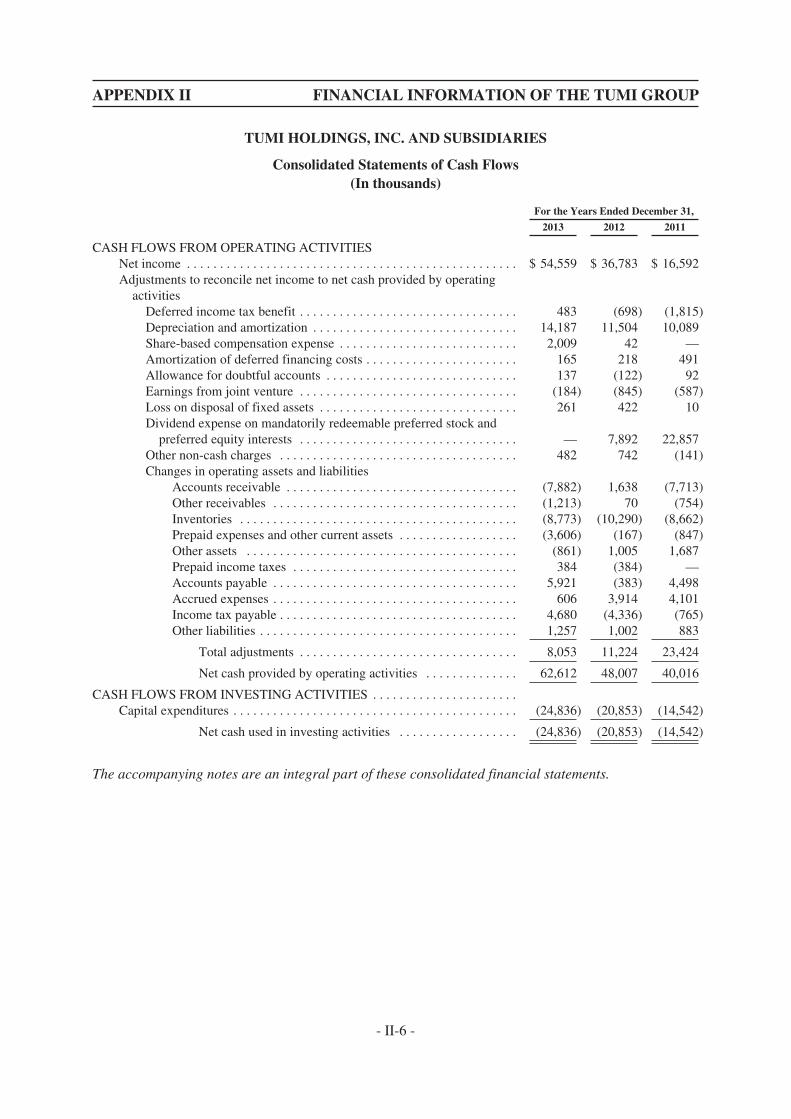
APPENDIX II FINANCIAL INFORMATION OF THE TUMI GROUP
TUMI HOLDINGS, INC. AND SUBSIDIARIES
Consolidated Statements of Cash Flows(In thousands)
For the Years Ended December 31,
2013 2012 2011
CASH FLOWS FROM OPERATING ACTIVITIESNet income . . . . . . . . . . . . . . . . . . . . . . . . . . . . . . . . . . . . . . . . . . . . . . . . . . $ 54,559 $ 36,783 $ 16,592Adjustments to reconcile net income to net cash provided by operating
activitiesDeferred income tax benefit . . . . . . . . . . . . . . . . . . . . . . . . . . . . . . . . . 483 (698) (1,815)Depreciation and amortization . . . . . . . . . . . . . . . . . . . . . . . . . . . . . . . 14,187 11,504 10,089Share-based compensation expense . . . . . . . . . . . . . . . . . . . . . . . . . . . 2,009 42 —Amortization of deferred financing costs . . . . . . . . . . . . . . . . . . . . . . . 165 218 491Allowance for doubtful accounts . . . . . . . . . . . . . . . . . . . . . . . . . . . . . 137 (122) 92Earnings from joint venture . . . . . . . . . . . . . . . . . . . . . . . . . . . . . . . . . (184) (845) (587)Loss on disposal of fixed assets . . . . . . . . . . . . . . . . . . . . . . . . . . . . . . 261 422 10Dividend expense on mandatorily redeemable preferred stock and
preferred equity interests . . . . . . . . . . . . . . . . . . . . . . . . . . . . . . . . . — 7,892 22,857Other non-cash charges . . . . . . . . . . . . . . . . . . . . . . . . . . . . . . . . . . . . 482 742 (141)Changes in operating assets and liabilities
Accounts receivable . . . . . . . . . . . . . . . . . . . . . . . . . . . . . . . . . . . (7,882) 1,638 (7,713)Other receivables . . . . . . . . . . . . . . . . . . . . . . . . . . . . . . . . . . . . . (1,213) 70 (754)Inventories . . . . . . . . . . . . . . . . . . . . . . . . . . . . . . . . . . . . . . . . . . (8,773) (10,290) (8,662)Prepaid expenses and other current assets . . . . . . . . . . . . . . . . . . (3,606) (167) (847)Other assets . . . . . . . . . . . . . . . . . . . . . . . . . . . . . . . . . . . . . . . . . (861) 1,005 1,687Prepaid income taxes . . . . . . . . . . . . . . . . . . . . . . . . . . . . . . . . . . 384 (384) —Accounts payable . . . . . . . . . . . . . . . . . . . . . . . . . . . . . . . . . . . . . 5,921 (383) 4,498Accrued expenses . . . . . . . . . . . . . . . . . . . . . . . . . . . . . . . . . . . . . 606 3,914 4,101Income tax payable . . . . . . . . . . . . . . . . . . . . . . . . . . . . . . . . . . . . 4,680 (4,336) (765)Other liabilities . . . . . . . . . . . . . . . . . . . . . . . . . . . . . . . . . . . . . . . 1,257 1,002 883
Total adjustments . . . . . . . . . . . . . . . . . . . . . . . . . . . . . . . . . 8,053 11,224 23,424
Net cash provided by operating activities . . . . . . . . . . . . . . 62,612 48,007 40,016
CASH FLOWS FROM INVESTING ACTIVITIES . . . . . . . . . . . . . . . . . . . . . .Capital expenditures . . . . . . . . . . . . . . . . . . . . . . . . . . . . . . . . . . . . . . . . . . . (24,836) (20,853) (14,542)
Net cash used in investing activities . . . . . . . . . . . . . . . . . . (24,836) (20,853) (14,542)
The accompanying notes are an integral part of these consolidated financial statements.
- II-6 -
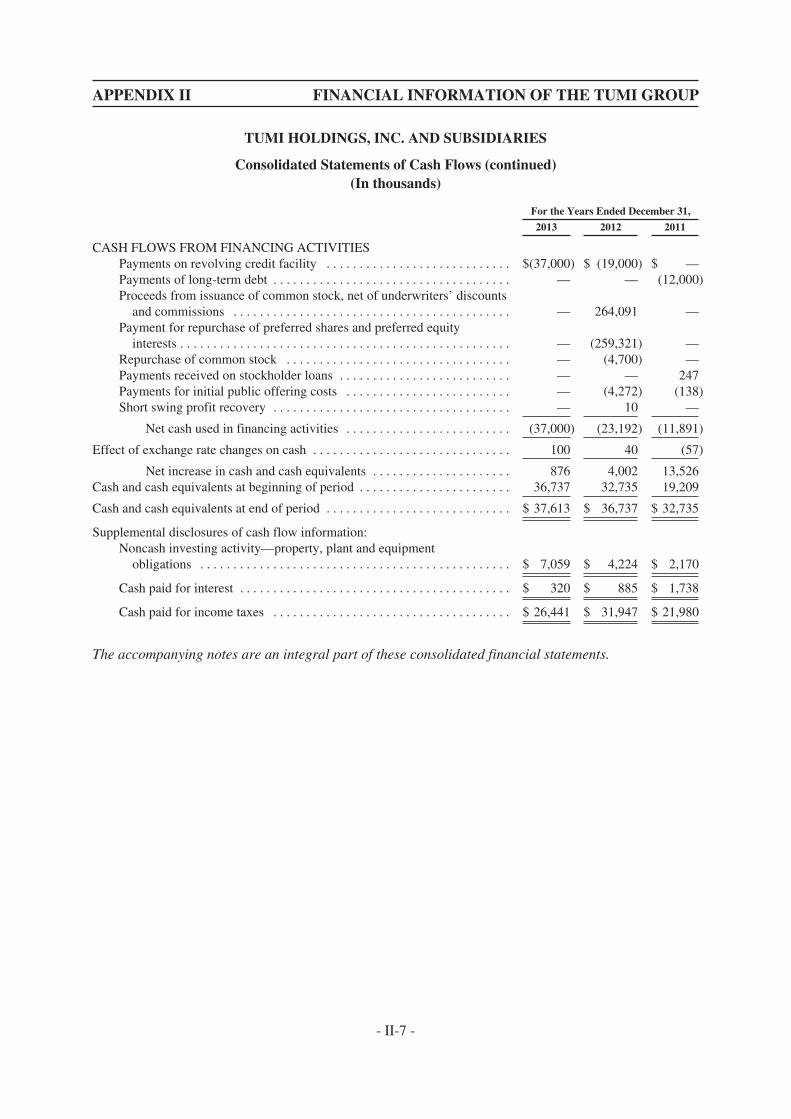
APPENDIX II FINANCIAL INFORMATION OF THE TUMI GROUP
TUMI HOLDINGS, INC. AND SUBSIDIARIES
Consolidated Statements of Cash Flows (continued)(In thousands)
For the Years Ended December 31,
2013 2012 2011
CASH FLOWS FROM FINANCING ACTIVITIESPayments on revolving credit facility . . . . . . . . . . . . . . . . . . . . . . . . . . . . $(37,000) $ (19,000) $ —Payments of long-term debt . . . . . . . . . . . . . . . . . . . . . . . . . . . . . . . . . . . . — — (12,000)Proceeds from issuance of common stock, net of underwriters’ discounts
and commissions . . . . . . . . . . . . . . . . . . . . . . . . . . . . . . . . . . . . . . . . . . — 264,091 —Payment for repurchase of preferred shares and preferred equity
interests . . . . . . . . . . . . . . . . . . . . . . . . . . . . . . . . . . . . . . . . . . . . . . . . . . — (259,321) —Repurchase of common stock . . . . . . . . . . . . . . . . . . . . . . . . . . . . . . . . . . — (4,700) —Payments received on stockholder loans . . . . . . . . . . . . . . . . . . . . . . . . . . — — 247Payments for initial public offering costs . . . . . . . . . . . . . . . . . . . . . . . . . — (4,272) (138)Short swing profit recovery . . . . . . . . . . . . . . . . . . . . . . . . . . . . . . . . . . . . — 10 —
Net cash used in financing activities . . . . . . . . . . . . . . . . . . . . . . . . . (37,000) (23,192) (11,891)
Effect of exchange rate changes on cash . . . . . . . . . . . . . . . . . . . . . . . . . . . . . . 100 40 (57)
Net increase in cash and cash equivalents . . . . . . . . . . . . . . . . . . . . . 876 4,002 13,526Cash and cash equivalents at beginning of period . . . . . . . . . . . . . . . . . . . . . . . 36,737 32,735 19,209
Cash and cash equivalents at end of period . . . . . . . . . . . . . . . . . . . . . . . . . . . . $ 37,613 $ 36,737 $ 32,735
Supplemental disclosures of cash flow information:Noncash investing activity—property, plant and equipment
obligations . . . . . . . . . . . . . . . . . . . . . . . . . . . . . . . . . . . . . . . . . . . . . . . $ 7,059 $ 4,224 $ 2,170
Cash paid for interest . . . . . . . . . . . . . . . . . . . . . . . . . . . . . . . . . . . . . . . . . $ 320 $ 885 $ 1,738
Cash paid for income taxes . . . . . . . . . . . . . . . . . . . . . . . . . . . . . . . . . . . . $ 26,441 $ 31,947 $ 21,980
The accompanying notes are an integral part of these consolidated financial statements.
- II-7 -
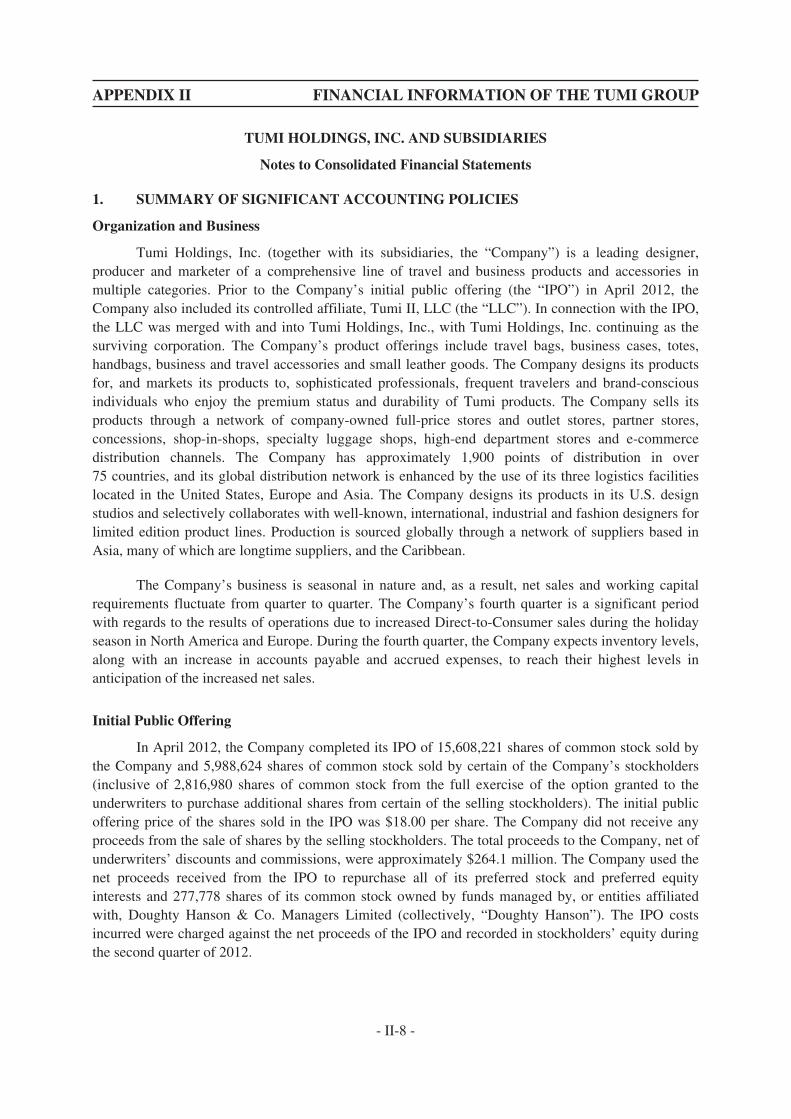
APPENDIX II FINANCIAL INFORMATION OF THE TUMI GROUP
TUMI HOLDINGS, INC. AND SUBSIDIARIES
Notes to Consolidated Financial Statements
1. SUMMARY OF SIGNIFICANT ACCOUNTING POLICIES
Organization and Business
Tumi Holdings, Inc. (together with its subsidiaries, the “Company”) is a leading designer,producer and marketer of a comprehensive line of travel and business products and accessories inmultiple categories. Prior to the Company’s initial public offering (the “IPO”) in April 2012, theCompany also included its controlled affiliate, Tumi II, LLC (the “LLC”). In connection with the IPO,the LLC was merged with and into Tumi Holdings, Inc., with Tumi Holdings, Inc. continuing as thesurviving corporation. The Company’s product offerings include travel bags, business cases, totes,handbags, business and travel accessories and small leather goods. The Company designs its productsfor, and markets its products to, sophisticated professionals, frequent travelers and brand-consciousindividuals who enjoy the premium status and durability of Tumi products. The Company sells itsproducts through a network of company-owned full-price stores and outlet stores, partner stores,concessions, shop-in-shops, specialty luggage shops, high-end department stores and e-commercedistribution channels. The Company has approximately 1,900 points of distribution in over75 countries, and its global distribution network is enhanced by the use of its three logistics facilitieslocated in the United States, Europe and Asia. The Company designs its products in its U.S. designstudios and selectively collaborates with well-known, international, industrial and fashion designers forlimited edition product lines. Production is sourced globally through a network of suppliers based inAsia, many of which are longtime suppliers, and the Caribbean.
The Company’s business is seasonal in nature and, as a result, net sales and working capitalrequirements fluctuate from quarter to quarter. The Company’s fourth quarter is a significant periodwith regards to the results of operations due to increased Direct-to-Consumer sales during the holidayseason in North America and Europe. During the fourth quarter, the Company expects inventory levels,along with an increase in accounts payable and accrued expenses, to reach their highest levels inanticipation of the increased net sales.
Initial Public Offering
In April 2012, the Company completed its IPO of 15,608,221 shares of common stock sold bythe Company and 5,988,624 shares of common stock sold by certain of the Company’s stockholders(inclusive of 2,816,980 shares of common stock from the full exercise of the option granted to theunderwriters to purchase additional shares from certain of the selling stockholders). The initial publicoffering price of the shares sold in the IPO was $18.00 per share. The Company did not receive anyproceeds from the sale of shares by the selling stockholders. The total proceeds to the Company, net ofunderwriters’ discounts and commissions, were approximately $264.1 million. The Company used thenet proceeds received from the IPO to repurchase all of its preferred stock and preferred equityinterests and 277,778 shares of its common stock owned by funds managed by, or entities affiliatedwith, Doughty Hanson & Co. Managers Limited (collectively, “Doughty Hanson”). The IPO costsincurred were charged against the net proceeds of the IPO and recorded in stockholders’ equity duringthe second quarter of 2012.
- II-8 -
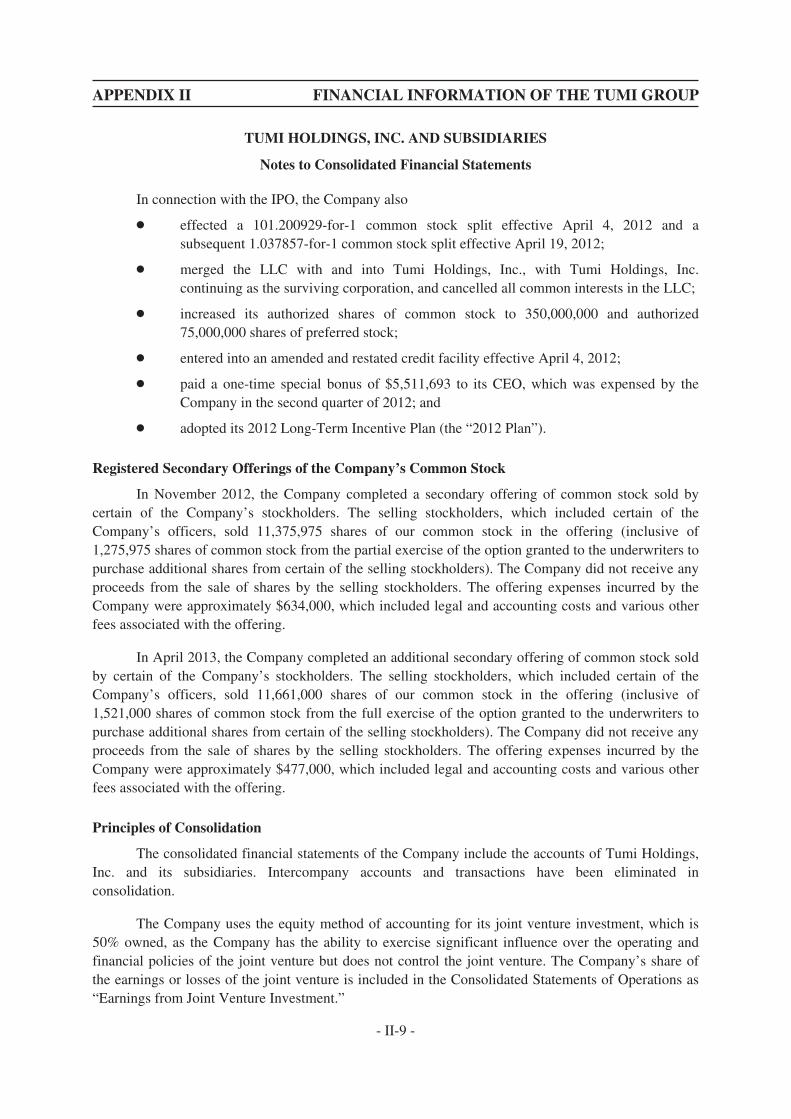
APPENDIX II FINANCIAL INFORMATION OF THE TUMI GROUP
TUMI HOLDINGS, INC. AND SUBSIDIARIES
Notes to Consolidated Financial Statements
In connection with the IPO, the Company also
Š effected a 101.200929-for-1 common stock split effective April 4, 2012 and asubsequent 1.037857-for-1 common stock split effective April 19, 2012;
Š merged the LLC with and into Tumi Holdings, Inc., with Tumi Holdings, Inc.continuing as the surviving corporation, and cancelled all common interests in the LLC;
Š increased its authorized shares of common stock to 350,000,000 and authorized75,000,000 shares of preferred stock;
Š entered into an amended and restated credit facility effective April 4, 2012;
Š paid a one-time special bonus of $5,511,693 to its CEO, which was expensed by theCompany in the second quarter of 2012; and
Š adopted its 2012 Long-Term Incentive Plan (the “2012 Plan”).
Registered Secondary Offerings of the Company’s Common Stock
In November 2012, the Company completed a secondary offering of common stock sold bycertain of the Company’s stockholders. The selling stockholders, which included certain of theCompany’s officers, sold 11,375,975 shares of our common stock in the offering (inclusive of1,275,975 shares of common stock from the partial exercise of the option granted to the underwriters topurchase additional shares from certain of the selling stockholders). The Company did not receive anyproceeds from the sale of shares by the selling stockholders. The offering expenses incurred by theCompany were approximately $634,000, which included legal and accounting costs and various otherfees associated with the offering.
In April 2013, the Company completed an additional secondary offering of common stock soldby certain of the Company’s stockholders. The selling stockholders, which included certain of theCompany’s officers, sold 11,661,000 shares of our common stock in the offering (inclusive of1,521,000 shares of common stock from the full exercise of the option granted to the underwriters topurchase additional shares from certain of the selling stockholders). The Company did not receive anyproceeds from the sale of shares by the selling stockholders. The offering expenses incurred by theCompany were approximately $477,000, which included legal and accounting costs and various otherfees associated with the offering.
Principles of Consolidation
The consolidated financial statements of the Company include the accounts of Tumi Holdings,Inc. and its subsidiaries. Intercompany accounts and transactions have been eliminated inconsolidation.
The Company uses the equity method of accounting for its joint venture investment, which is50% owned, as the Company has the ability to exercise significant influence over the operating andfinancial policies of the joint venture but does not control the joint venture. The Company’s share ofthe earnings or losses of the joint venture is included in the Consolidated Statements of Operations as“Earnings from Joint Venture Investment.”
- II-9 -

APPENDIX II FINANCIAL INFORMATION OF THE TUMI GROUP
TUMI HOLDINGS, INC. AND SUBSIDIARIES
Notes to Consolidated Financial Statements
Segment Reporting
The Company became subject to and adopted the provisions of the Financial AccountingStandards Board’s (the “FASB”) guidance for segment reporting in 2011. Segment information hasbeen provided on the basis of the Company’s four reportable segments for all periods presented (seeNote 15—Segment Information), which are: (i) Direct-to-Consumer North America; (ii) Indirect-to-Consumer North America; (iii) Direct-to-Consumer International; and (iv) Indirect-to-ConsumerInternational.
Estimates
The preparation of financial statements in conformity with accounting principles generallyaccepted in the United States of America requires management to make estimates and assumptions thataffect the reported amounts of assets and liabilities and disclosure of contingent assets and liabilities atthe date of the financial statements and the reported amounts of revenues and expenses during thereporting period. Significant estimates include valuation of goodwill and intangibles, allowance fordoubtful accounts, adjustments for slow-moving and obsolete inventory, accrued warranties,realization of deferred tax assets, income tax uncertainties, the valuation of share-based compensationand related forfeiture rates, and useful lives of assets. Actual results could differ materially from thoseestimates.
Revenue Recognition
Revenue is generated from the sale of the Company’s products and is classified as “Net Sales”in the Company’s Consolidated Statements of Operations. The Company recognizes revenue in itsDirect-to-Consumer segment when inventory is received by the customer and the related title passes. Inthe Company’s Indirect-to-Consumer segment, revenue is recognized when inventory is in possessionof the wholesale customers or their appointed carriers, at which point the related title passes.Provisions for discounts, rebates to customers and returns are recorded as a reduction of revenue in thesame period as the related sales. Revenue associated with gift cards is recognized upon redemption.Revenue from gift cards and the amount of revenue recognized for gift cards not redeemed(“breakage”) is immaterial to these consolidated financial statements. Amounts billed to customers fordelivery costs are classified as a component of net sales and the related delivery costs are classified asa component of cost of sales. Sales and value added tax collected from customers and remitted togovernmental authorities are accounted for on a net basis and are excluded from net sales in theConsolidated Statements of Operations.
Cash and Cash Equivalents
The Company’s cash and cash equivalents are defined as cash and short-term highly liquidinvestments with an original maturity of three months or less from the date of purchase. TheCompany’s cash and cash equivalents consist of cash in banks as of December 31, 2013 and 2012.
Effective December 31, 2010 and through December 31, 2012, all funds in a “noninterest-bearing transaction account” were insured in full at all institutions covered by the Federal Deposit
- II-10 -
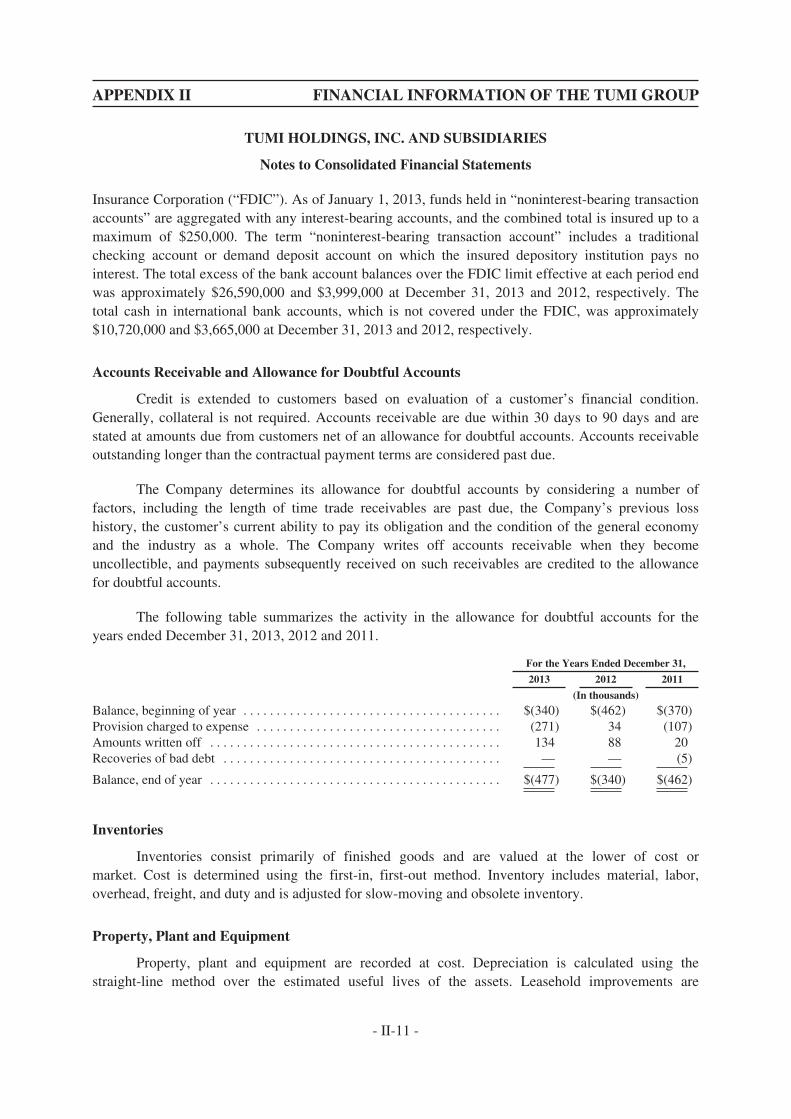
APPENDIX II FINANCIAL INFORMATION OF THE TUMI GROUP
TUMI HOLDINGS, INC. AND SUBSIDIARIES
Notes to Consolidated Financial Statements
Insurance Corporation (“FDIC”). As of January 1, 2013, funds held in “noninterest-bearing transactionaccounts” are aggregated with any interest-bearing accounts, and the combined total is insured up to amaximum of $250,000. The term “noninterest-bearing transaction account” includes a traditionalchecking account or demand deposit account on which the insured depository institution pays nointerest. The total excess of the bank account balances over the FDIC limit effective at each period endwas approximately $26,590,000 and $3,999,000 at December 31, 2013 and 2012, respectively. Thetotal cash in international bank accounts, which is not covered under the FDIC, was approximately$10,720,000 and $3,665,000 at December 31, 2013 and 2012, respectively.
Accounts Receivable and Allowance for Doubtful Accounts
Credit is extended to customers based on evaluation of a customer’s financial condition.Generally, collateral is not required. Accounts receivable are due within 30 days to 90 days and arestated at amounts due from customers net of an allowance for doubtful accounts. Accounts receivableoutstanding longer than the contractual payment terms are considered past due.
The Company determines its allowance for doubtful accounts by considering a number offactors, including the length of time trade receivables are past due, the Company’s previous losshistory, the customer’s current ability to pay its obligation and the condition of the general economyand the industry as a whole. The Company writes off accounts receivable when they becomeuncollectible, and payments subsequently received on such receivables are credited to the allowancefor doubtful accounts.
The following table summarizes the activity in the allowance for doubtful accounts for theyears ended December 31, 2013, 2012 and 2011.
For the Years Ended December 31,
2013 2012 2011
(In thousands)
Balance, beginning of year . . . . . . . . . . . . . . . . . . . . . . . . . . . . . . . . . . . . . . . $(340) $(462) $(370)Provision charged to expense . . . . . . . . . . . . . . . . . . . . . . . . . . . . . . . . . . . . . (271) 34 (107)Amounts written off . . . . . . . . . . . . . . . . . . . . . . . . . . . . . . . . . . . . . . . . . . . . 134 88 20Recoveries of bad debt . . . . . . . . . . . . . . . . . . . . . . . . . . . . . . . . . . . . . . . . . . — — (5)
Balance, end of year . . . . . . . . . . . . . . . . . . . . . . . . . . . . . . . . . . . . . . . . . . . . $(477) $(340) $(462)
Inventories
Inventories consist primarily of finished goods and are valued at the lower of cost ormarket. Cost is determined using the first-in, first-out method. Inventory includes material, labor,overhead, freight, and duty and is adjusted for slow-moving and obsolete inventory.
Property, Plant and Equipment
Property, plant and equipment are recorded at cost. Depreciation is calculated using thestraight-line method over the estimated useful lives of the assets. Leasehold improvements are
- II-11 -

APPENDIX II FINANCIAL INFORMATION OF THE TUMI GROUP
TUMI HOLDINGS, INC. AND SUBSIDIARIES
Notes to Consolidated Financial Statements
amortized over the lesser of their estimated useful lives or the terms of the respective leases. Repairsand maintenance costs are expensed as incurred; major renewals or betterments are capitalized.
Long-Lived Assets
The Company reviews long-lived assets, such as property, plant and equipment and certainidentifiable intangibles with finite lives, for possible impairment whenever events or changes incircumstances indicate that the carrying amount of an asset may not be recoverable. Some factors theCompany considers important which could trigger an impairment review include: (i) significantunderperformance compared to expected historical or projected future operating results; (ii) significantchanges in the Company’s use of the acquired assets or the strategy for its overall business; and(iii) significant negative industry or economic trends. No impairment was recognized during the yearsended December 31, 2013, 2012 and 2011.
Deferred Financing Costs
The net balance of the costs incurred for obtaining debt financing was $536,000 and $701,000as of December 31, 2013 and 2012, respectively. The Company amortizes deferred financing costs tointerest expense over the lives of the related financing agreements. During the years endedDecember 31, 2013, 2012 and 2011, respectively, $165,000, $218,000 and $491,000 was amortized tointerest expense.
Offering Costs
In 2011, the Company commenced the process for its initial public offering of the shares of itscommon stock. The specific incremental costs directly attributable to the offering were initiallydeferred and recorded as “Deferred Offering Costs” in the consolidated balance sheet as ofDecember 31, 2011. The offering was completed in April 2012 and the deferred offering costs werecharged against the net proceeds of the IPO and recorded in stockholders’ equity during the secondquarter of 2012.
In November 2012 and April 2013, the Company completed secondary offerings of commonstock sold by certain of the Company’s stockholders. The Company did not receive any proceeds fromthe sale of shares and the offering expenses incurred were expensed directly to operating expenses.
Goodwill and Intangible Assets
Goodwill represents the excess of the purchase price over the fair value of net assets acquired,including intangible assets. Indefinite-lived intangible assets consist of brand/trade name. Goodwilland brand/trade name are not being amortized in accordance with the provisions of the FASB’sguidance, which requires these assets to be tested for impairment annually and whenever events orchanges in circumstances indicate that the carrying value may not be recoverable. The Company’sannual impairment testing date is the first day of its fourth quarter. No impairment was recognized inthe years ended December 31, 2013, 2012 and 2011.
- II-12 -
APPENDIX II FINANCIAL INFORMATION OF THE TUMI GROUP
TUMI HOLDINGS, INC. AND SUBSIDIARIES
Notes to Consolidated Financial Statements
The quantitative goodwill impairment test, if necessary, is a two-step process. Under the first oftwo steps, the Company compares the fair value of a reporting unit to its carrying amount, includinggoodwill, to identify a potential impairment. If the fair value of the reporting unit is less than itscarrying value, an indication of goodwill impairment exists for such reporting unit and the enterprisemust perform step two of the impairment test to measure the impairment, if any. Under step two, animpairment loss is recognized for any excess of the carrying amount of the reporting unit’s goodwillover the implied fair value of that goodwill. The implied fair value of goodwill is determined byallocating the fair value of the reporting unit in a manner similar to a purchase price allocation: the fairvalue of the reporting unit is allocated to all of the assets and liabilities of that unit (including anyunrecognized intangible assets) and the residual fair value after this allocation is the implied fair valueof the reporting unit goodwill.
The Company uses techniques including discounted expected future cash flows (Level 3 input),or DCF, to test goodwill. Indefinite-lived intangible assets are tested for impairment through an incomeapproach known as the relief from royalty method. A discounted cash flow analysis calculates the fairvalue by estimating the after-tax cash flows attributable to a reporting unit or asset and thendiscounting the after-tax cash flows to a present value using a risk-adjusted discount rate. Assumptionsused in DCF and the relief from royalty method require the exercise of significant judgment includingjudgment about appropriate royalty rates, discount rates and terminal values, growth rates and theamount and timing of expected future cash flows. Although the Company believes the historicalassumptions and estimates made are reasonable and appropriate, different assumptions and estimatescould materially impact its reported financial results.
The Company’s reporting units for the purpose of goodwill impairment testing are thereportable business segments: (i) Direct-to-Consumer North America, (ii) Indirect-to-Consumer NorthAmerica, (iii) Direct-to-Consumer International and (iv) Indirect-to-Consumer International. Thereporting units were determined in accordance with the guidance on reportable segments in FASBASC 280-10-50-1. There is no discrete financial information available to the Company for itsoperations below its reportable business segments.
Share-Based Compensation
Share-based compensation represents the cost related to stock options granted to employeesunder the 2012 Plan. The Company measures share-based compensation cost at the grant date based onthe estimated fair value of the award and recognizes the cost on a straight-line basis (net of estimatedforfeitures) over the vesting period. The Company estimates the fair value of stock options using theBlack-Scholes valuation model. All share-based compensation costs are recorded in cost of sales or thevarious operating expense lines in the consolidated statements of operations based on the employee’srespective function (see Note 17—Share-Based Compensation Plans and Awards).
Fair Value Measurements
The Company applies the FASB’s guidance for “Fair Value Measurements.” Under this standard,fair value is defined as the price that would be received to sell an asset or paid to transfer a liability (i.e.,the “exit price”) in an orderly transaction between market participants at the measurement date.
- II-13 -
APPENDIX II FINANCIAL INFORMATION OF THE TUMI GROUP
TUMI HOLDINGS, INC. AND SUBSIDIARIES
Notes to Consolidated Financial Statements
In determining fair value, the Company uses various valuation approaches. The hierarchy ofthose valuation approaches is broken down into three levels based on the reliability of inputs asfollows:
Level 1— Inputs that are quoted prices in active markets for identical assets or liabilities that theCompany has the ability to access at the measurement date. An active market for the assetor liability is a market in which transactions for the asset or liability occur with sufficientfrequency and volume to provide pricing information on an ongoing basis. The valuationunder this approach does not entail a significant degree of judgment.
Level 2— Inputs, other than quoted prices included within Level 1, that are observable for the assetor liability, either directly or indirectly. Level 2 inputs include: quoted prices for similarassets or liabilities in active markets, inputs other than quoted prices that are observablefor the asset or liability (e.g., interest rates and yield curves observable at commonlyquoted intervals or current market) and contractual prices for the underlying financialinstrument, as well as other relevant economic measures.
Level 3— Inputs that are unobservable for the asset or liability. Unobservable inputs are used tomeasure fair value to the extent that observable inputs are not available, thereby allowingfor situations in which there is little, if any, market activity for the asset or liability at themeasurement date.
The Company’s non-financial assets which are subject to nonrecurring fair value measurementsinclude goodwill, intangible assets and property, plant and equipment. These assets are recorded atcarrying value. However, whenever events or changes in circumstances indicate that their carryingvalue may not be fully recoverable (or at least annually for goodwill and indefinite-lived intangibleassets), such assets are assessed for impairment and, if applicable, written down to and recorded at fairvalue. To measure fair value for such assets, the Company uses techniques including DCF.
The carrying amounts of cash and cash equivalents, accounts receivable, accounts payable, andthe Company’s variable interest rate credit facility (See Note 8—Credit Facilities) were reasonableestimates of their fair value as of December 31, 2013 and 2012. If measured at fair value in thefinancial statements, the Company’s variable interest rate credit facility would be classified as Level 2in the fair value hierarchy.
Income Taxes
The Company utilizes the asset and liability method of accounting for income taxes, underwhich deferred income taxes are recognized for the tax consequences of temporary differences byapplying enacted statutory tax rates applicable to future years to differences between the financialstatement carrying amounts and the tax basis of existing assets and liabilities. The effect on deferredtaxes of a change in tax rates is recognized in income in the period that includes the enactment date. Avaluation allowance is provided when it is more likely than not that some portion or all of the deferredtax assets will not be realized.
The Company applies the FASB’s provisions for uncertain tax positions. The Company utilizesthe two step process to determine the amount of recognized tax benefit. For tax positions meeting the
- II-14 -
APPENDIX II FINANCIAL INFORMATION OF THE TUMI GROUP
TUMI HOLDINGS, INC. AND SUBSIDIARIES
Notes to Consolidated Financial Statements
more-likely-than-not threshold, the amount recognized in the consolidated financial statements is thelargest benefit that has a greater than 50% likelihood of being realized upon ultimate settlement withthe relevant tax authority. The Company recognizes interest and penalties associated with uncertain taxpositions as a component of income tax expense.
Foreign Currency Translation
The financial statements of the Company’s branch offices and subsidiaries in Europe aremeasured using a currency other than the U.S. dollar.
Assets and liabilities recorded in functional currencies other than U.S. dollars are translated intoU.S. dollars at the year-end rate of exchange. Revenues and expenses are translated at the averageexchange rates for the year. The resulting translation adjustments are charged or credited to othercomprehensive income.
Realized foreign currency transaction gains and losses on transactions denominated incurrencies other than the functional currency, such as those resulting from the settlement of receivablesand payables denominated in foreign currency, are included in the earnings of the current period in“Foreign Exchange Gains (Losses).”
Unrealized gains and losses on intercompany foreign currency transactions that are of a long-term investment nature (that is settlement is not planned or anticipated in the foreseeable future) arerecorded in other comprehensive income. Unrealized gains and losses on intercompany foreigncurrency transactions for which settlement is anticipated are included in the determination of netincome.
Advertising Costs
The Company expenses advertising costs as incurred. Total advertising expenses, excludingcooperative advertising costs, included in operating expenses in the accompanying ConsolidatedStatements of Operations were approximately $8,502,000, $6,443,000 and $6,127,000 for the yearsended December 31, 2013, 2012 and 2011, respectively.
Cooperative Advertising Costs
The Company accounts for certain advertising costs in accordance with the FASB’s guidancefor “Customer Payments and Incentives.” This standard provides guidance with respect to thestatement of operations classification of and the accounting for recognition and measurement ofconsideration given by a vendor to a customer, which includes sales incentive offers labeled asdiscounts, coupons, rebates and free products or services as well as arrangements labeled as slottingfees, cooperative advertising and buy downs. As per the FASB’s guidance, the Company isrecognizing cooperative advertising costs in marketing expenses and sales incentives related to “freeproduct” as an expense in cost of sales. The Company recognized cooperative advertising expense ofapproximately $3,234,000, $2,619,000 and $2,078,000 as a marketing expense in the accompanyingConsolidated Statements of Operations for the years ended December 31, 2013, 2012 and 2011,respectively.
- II-15 -
APPENDIX II FINANCIAL INFORMATION OF THE TUMI GROUP
TUMI HOLDINGS, INC. AND SUBSIDIARIES
Notes to Consolidated Financial Statements
Store Preopening Expenses
Costs incurred prior to the opening of a new store are expensed as incurred.
Warranties
The Company provides its customers with a product warranty subsequent to the sale of itsproducts. The Company’s warranty policy provides for one year of worry-free service as well as anadditional warranty against manufacturers’ defects or flaws in construction for between two and fiveyears, depending on the product line. The Company recognizes estimated costs associated with thelimited warranty at the time of sale of its products. The warranty reserve is based on historicalexperience.
Treasury Stock
The Company periodically repurchases treasury stock. These treasury stock transactions arerecorded using the cost method.
Dividend Expense on Mandatorily Redeemable Preferred Stock and Preferred Equity Interests
Dividends accrued on the Company’s mandatorily redeemable preferred stock and preferredequity interests (see Note 12—Mandatorily Redeemable Preferred Stock and Preferred EquityInterests) are presented in other income (expenses) in the consolidated statements of operations for theyears ended December 31, 2012 and 2011. All of the Company’s preferred stock and preferred equityinterests were repurchased at carrying value (inclusive of all accrued dividends) in connection with theour IPO in April 2012.
Earnings per Common Share
Basic earnings per common share is computed by dividing income available to commonstockholders by the weighted-average common shares outstanding for the period. Diluted earnings percommon share is computed on the basis of the weighted-average number of common sharesoutstanding plus the effect of dilutive potential common shares outstanding during the period using thetreasury stock method.
2. RECENTLY ISSUED ACCOUNTING PRONOUNCEMENTS
In February 2013, the FASB issued ASU No. 2013-02, “Comprehensive Income (Topic 220):Reporting of Amounts Reclassified Out of Accumulated Comprehensive Income.” The new guidancerequires an entity to report the effect of significant reclassifications out of accumulated othercomprehensive income on the respective line items in net income if the amounts are required to bereclassified in their entirety to net income. For other amounts that are not required to be reclassified intheir entirety to net income in the same reporting period, an entity is required to cross-reference toother disclosures that provide additional detail about those amounts. The new guidance was effectiveprospectively for fiscal years and interim periods beginning after December 15, 2012, with earlyadoption permitted. The Company adopted the amended guidance effective January 1, 2013 and it didnot have a material effect on its consolidated financial statements.
- II-16 -
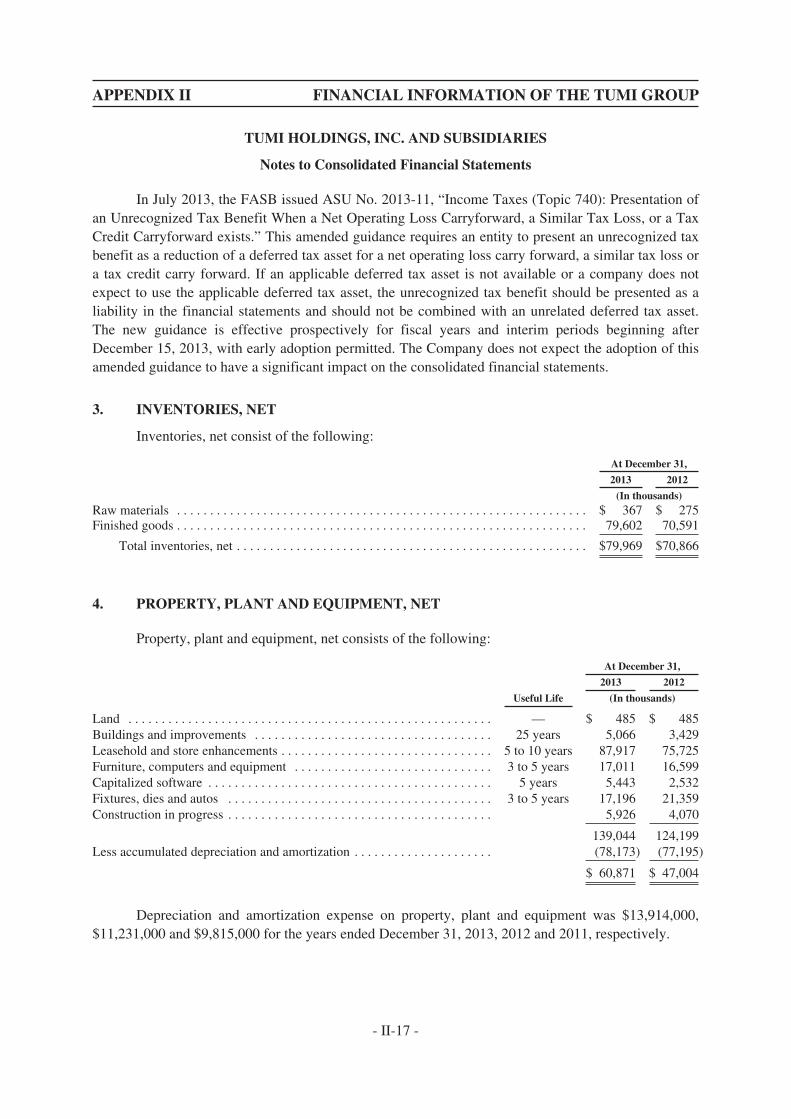
APPENDIX II FINANCIAL INFORMATION OF THE TUMI GROUP
TUMI HOLDINGS, INC. AND SUBSIDIARIES
Notes to Consolidated Financial Statements
In July 2013, the FASB issued ASU No. 2013-11, “Income Taxes (Topic 740): Presentation ofan Unrecognized Tax Benefit When a Net Operating Loss Carryforward, a Similar Tax Loss, or a TaxCredit Carryforward exists.” This amended guidance requires an entity to present an unrecognized taxbenefit as a reduction of a deferred tax asset for a net operating loss carry forward, a similar tax loss ora tax credit carry forward. If an applicable deferred tax asset is not available or a company does notexpect to use the applicable deferred tax asset, the unrecognized tax benefit should be presented as aliability in the financial statements and should not be combined with an unrelated deferred tax asset.The new guidance is effective prospectively for fiscal years and interim periods beginning afterDecember 15, 2013, with early adoption permitted. The Company does not expect the adoption of thisamended guidance to have a significant impact on the consolidated financial statements.
3. INVENTORIES, NET
Inventories, net consist of the following:
At December 31,
2013 2012
(In thousands)Raw materials . . . . . . . . . . . . . . . . . . . . . . . . . . . . . . . . . . . . . . . . . . . . . . . . . . . . . . . . . . . . . . $ 367 $ 275Finished goods . . . . . . . . . . . . . . . . . . . . . . . . . . . . . . . . . . . . . . . . . . . . . . . . . . . . . . . . . . . . . . 79,602 70,591
Total inventories, net . . . . . . . . . . . . . . . . . . . . . . . . . . . . . . . . . . . . . . . . . . . . . . . . . . . . . $79,969 $70,866
4. PROPERTY, PLANT AND EQUIPMENT, NET
Property, plant and equipment, net consists of the following:
At December 31,
2013 2012
Useful Life (In thousands)
Land . . . . . . . . . . . . . . . . . . . . . . . . . . . . . . . . . . . . . . . . . . . . . . . . . . . . . . . — $ 485 $ 485Buildings and improvements . . . . . . . . . . . . . . . . . . . . . . . . . . . . . . . . . . . . 25 years 5,066 3,429Leasehold and store enhancements . . . . . . . . . . . . . . . . . . . . . . . . . . . . . . . . 5 to 10 years 87,917 75,725Furniture, computers and equipment . . . . . . . . . . . . . . . . . . . . . . . . . . . . . . 3 to 5 years 17,011 16,599Capitalized software . . . . . . . . . . . . . . . . . . . . . . . . . . . . . . . . . . . . . . . . . . . 5 years 5,443 2,532Fixtures, dies and autos . . . . . . . . . . . . . . . . . . . . . . . . . . . . . . . . . . . . . . . . 3 to 5 years 17,196 21,359Construction in progress . . . . . . . . . . . . . . . . . . . . . . . . . . . . . . . . . . . . . . . . 5,926 4,070
139,044 124,199Less accumulated depreciation and amortization . . . . . . . . . . . . . . . . . . . . . (78,173) (77,195)
$ 60,871 $ 47,004
Depreciation and amortization expense on property, plant and equipment was $13,914,000,$11,231,000 and $9,815,000 for the years ended December 31, 2013, 2012 and 2011, respectively.
- II-17 -
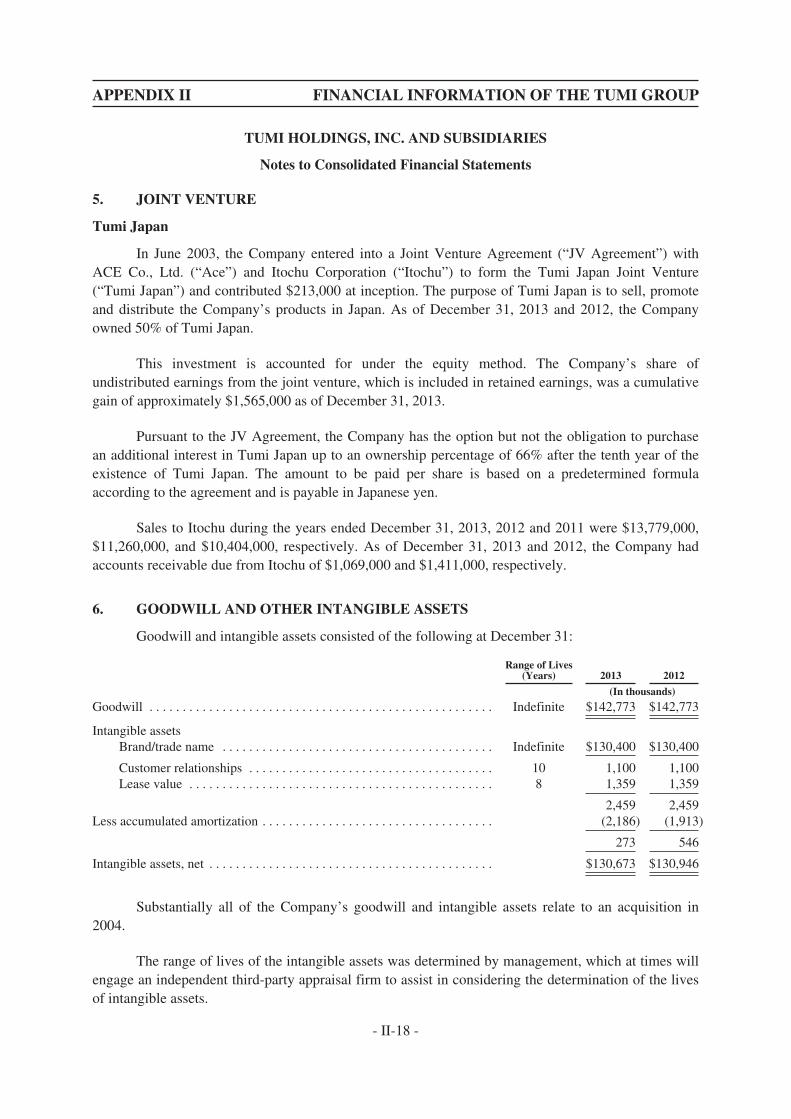
APPENDIX II FINANCIAL INFORMATION OF THE TUMI GROUP
TUMI HOLDINGS, INC. AND SUBSIDIARIES
Notes to Consolidated Financial Statements
5. JOINT VENTURE
Tumi Japan
In June 2003, the Company entered into a Joint Venture Agreement (“JV Agreement”) withACE Co., Ltd. (“Ace”) and Itochu Corporation (“Itochu”) to form the Tumi Japan Joint Venture(“Tumi Japan”) and contributed $213,000 at inception. The purpose of Tumi Japan is to sell, promoteand distribute the Company’s products in Japan. As of December 31, 2013 and 2012, the Companyowned 50% of Tumi Japan.
This investment is accounted for under the equity method. The Company’s share ofundistributed earnings from the joint venture, which is included in retained earnings, was a cumulativegain of approximately $1,565,000 as of December 31, 2013.
Pursuant to the JV Agreement, the Company has the option but not the obligation to purchasean additional interest in Tumi Japan up to an ownership percentage of 66% after the tenth year of theexistence of Tumi Japan. The amount to be paid per share is based on a predetermined formulaaccording to the agreement and is payable in Japanese yen.
Sales to Itochu during the years ended December 31, 2013, 2012 and 2011 were $13,779,000,$11,260,000, and $10,404,000, respectively. As of December 31, 2013 and 2012, the Company hadaccounts receivable due from Itochu of $1,069,000 and $1,411,000, respectively.
6. GOODWILL AND OTHER INTANGIBLE ASSETS
Goodwill and intangible assets consisted of the following at December 31:
Range of Lives(Years) 2013 2012
(In thousands)
Goodwill . . . . . . . . . . . . . . . . . . . . . . . . . . . . . . . . . . . . . . . . . . . . . . . . . . . . Indefinite $142,773 $142,773
Intangible assetsBrand/trade name . . . . . . . . . . . . . . . . . . . . . . . . . . . . . . . . . . . . . . . . . Indefinite $130,400 $130,400
Customer relationships . . . . . . . . . . . . . . . . . . . . . . . . . . . . . . . . . . . . . 10 1,100 1,100Lease value . . . . . . . . . . . . . . . . . . . . . . . . . . . . . . . . . . . . . . . . . . . . . . 8 1,359 1,359
2,459 2,459Less accumulated amortization . . . . . . . . . . . . . . . . . . . . . . . . . . . . . . . . . . . (2,186) (1,913)
273 546
Intangible assets, net . . . . . . . . . . . . . . . . . . . . . . . . . . . . . . . . . . . . . . . . . . . $130,673 $130,946
Substantially all of the Company’s goodwill and intangible assets relate to an acquisition in2004.
The range of lives of the intangible assets was determined by management, which at times willengage an independent third-party appraisal firm to assist in considering the determination of the livesof intangible assets.
- II-18 -
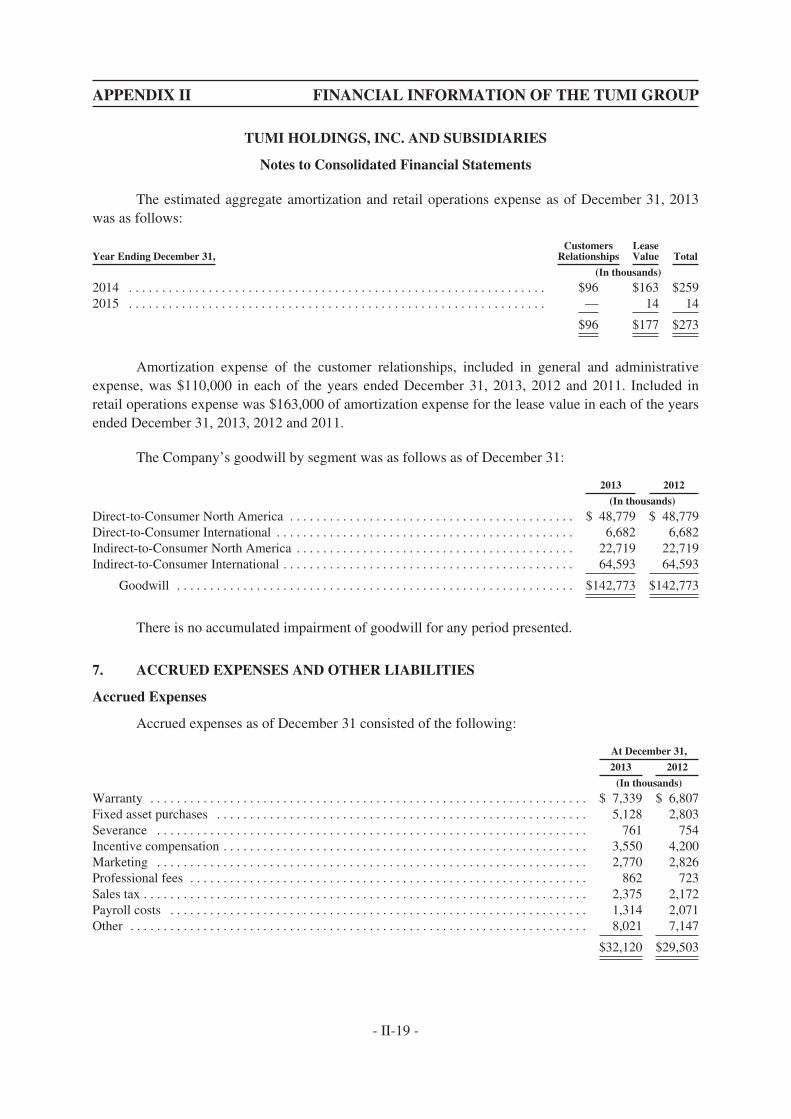
APPENDIX II FINANCIAL INFORMATION OF THE TUMI GROUP
TUMI HOLDINGS, INC. AND SUBSIDIARIES
Notes to Consolidated Financial Statements
The estimated aggregate amortization and retail operations expense as of December 31, 2013was as follows:
Year Ending December 31,Customers
RelationshipsLeaseValue Total
(In thousands)
2014 . . . . . . . . . . . . . . . . . . . . . . . . . . . . . . . . . . . . . . . . . . . . . . . . . . . . . . . . . . . . . . . $96 $163 $2592015 . . . . . . . . . . . . . . . . . . . . . . . . . . . . . . . . . . . . . . . . . . . . . . . . . . . . . . . . . . . . . . . — 14 14
$96 $177 $273
Amortization expense of the customer relationships, included in general and administrativeexpense, was $110,000 in each of the years ended December 31, 2013, 2012 and 2011. Included inretail operations expense was $163,000 of amortization expense for the lease value in each of the yearsended December 31, 2013, 2012 and 2011.
The Company’s goodwill by segment was as follows as of December 31:
2013 2012
(In thousands)
Direct-to-Consumer North America . . . . . . . . . . . . . . . . . . . . . . . . . . . . . . . . . . . . . . . . . . . $ 48,779 $ 48,779Direct-to-Consumer International . . . . . . . . . . . . . . . . . . . . . . . . . . . . . . . . . . . . . . . . . . . . . 6,682 6,682Indirect-to-Consumer North America . . . . . . . . . . . . . . . . . . . . . . . . . . . . . . . . . . . . . . . . . . 22,719 22,719Indirect-to-Consumer International . . . . . . . . . . . . . . . . . . . . . . . . . . . . . . . . . . . . . . . . . . . . 64,593 64,593
Goodwill . . . . . . . . . . . . . . . . . . . . . . . . . . . . . . . . . . . . . . . . . . . . . . . . . . . . . . . . . . . . $142,773 $142,773
There is no accumulated impairment of goodwill for any period presented.
7. ACCRUED EXPENSES AND OTHER LIABILITIES
Accrued Expenses
Accrued expenses as of December 31 consisted of the following:
At December 31,
2013 2012
(In thousands)
Warranty . . . . . . . . . . . . . . . . . . . . . . . . . . . . . . . . . . . . . . . . . . . . . . . . . . . . . . . . . . . . . . . . . . $ 7,339 $ 6,807Fixed asset purchases . . . . . . . . . . . . . . . . . . . . . . . . . . . . . . . . . . . . . . . . . . . . . . . . . . . . . . . . 5,128 2,803Severance . . . . . . . . . . . . . . . . . . . . . . . . . . . . . . . . . . . . . . . . . . . . . . . . . . . . . . . . . . . . . . . . . 761 754Incentive compensation . . . . . . . . . . . . . . . . . . . . . . . . . . . . . . . . . . . . . . . . . . . . . . . . . . . . . . . 3,550 4,200Marketing . . . . . . . . . . . . . . . . . . . . . . . . . . . . . . . . . . . . . . . . . . . . . . . . . . . . . . . . . . . . . . . . . 2,770 2,826Professional fees . . . . . . . . . . . . . . . . . . . . . . . . . . . . . . . . . . . . . . . . . . . . . . . . . . . . . . . . . . . . 862 723Sales tax . . . . . . . . . . . . . . . . . . . . . . . . . . . . . . . . . . . . . . . . . . . . . . . . . . . . . . . . . . . . . . . . . . . 2,375 2,172Payroll costs . . . . . . . . . . . . . . . . . . . . . . . . . . . . . . . . . . . . . . . . . . . . . . . . . . . . . . . . . . . . . . . 1,314 2,071Other . . . . . . . . . . . . . . . . . . . . . . . . . . . . . . . . . . . . . . . . . . . . . . . . . . . . . . . . . . . . . . . . . . . . . 8,021 7,147
$32,120 $29,503
- II-19 -
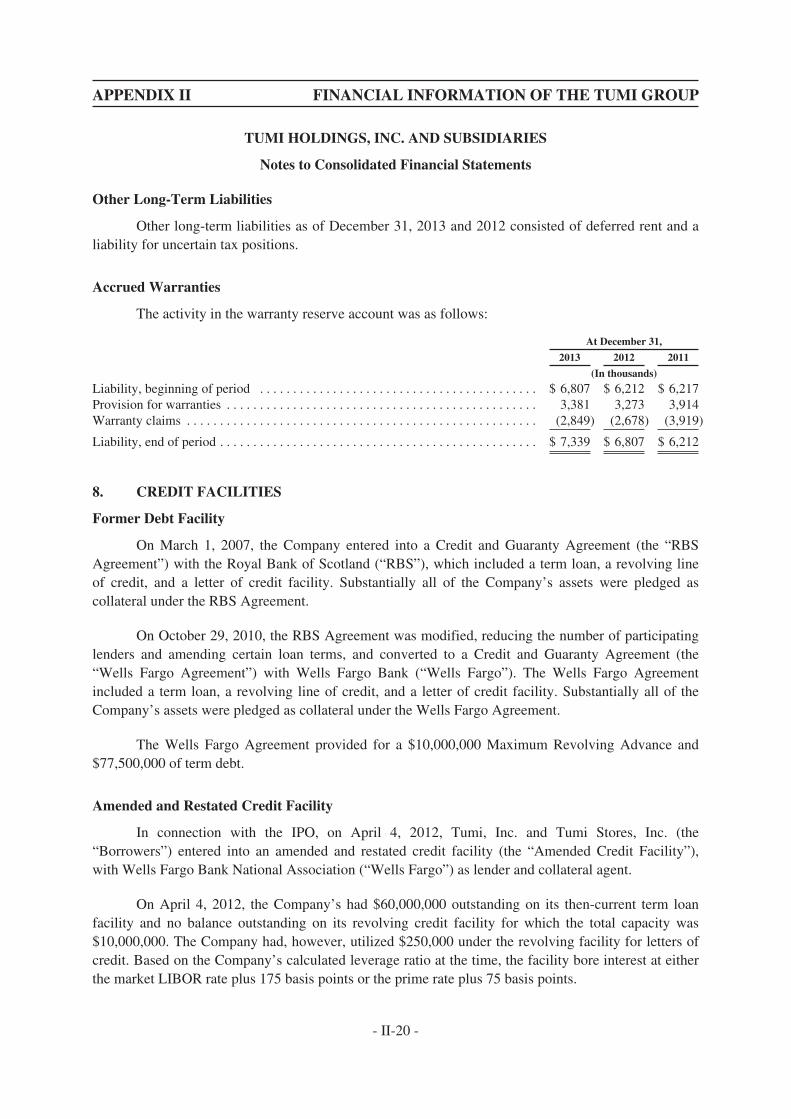
APPENDIX II FINANCIAL INFORMATION OF THE TUMI GROUP
TUMI HOLDINGS, INC. AND SUBSIDIARIES
Notes to Consolidated Financial Statements
Other Long-Term Liabilities
Other long-term liabilities as of December 31, 2013 and 2012 consisted of deferred rent and aliability for uncertain tax positions.
Accrued Warranties
The activity in the warranty reserve account was as follows:
At December 31,
2013 2012 2011
(In thousands)
Liability, beginning of period . . . . . . . . . . . . . . . . . . . . . . . . . . . . . . . . . . . . . . . . . . $ 6,807 $ 6,212 $ 6,217Provision for warranties . . . . . . . . . . . . . . . . . . . . . . . . . . . . . . . . . . . . . . . . . . . . . . . 3,381 3,273 3,914Warranty claims . . . . . . . . . . . . . . . . . . . . . . . . . . . . . . . . . . . . . . . . . . . . . . . . . . . . . (2,849) (2,678) (3,919)
Liability, end of period . . . . . . . . . . . . . . . . . . . . . . . . . . . . . . . . . . . . . . . . . . . . . . . . $ 7,339 $ 6,807 $ 6,212
8. CREDIT FACILITIES
Former Debt Facility
On March 1, 2007, the Company entered into a Credit and Guaranty Agreement (the “RBSAgreement”) with the Royal Bank of Scotland (“RBS”), which included a term loan, a revolving lineof credit, and a letter of credit facility. Substantially all of the Company’s assets were pledged ascollateral under the RBS Agreement.
On October 29, 2010, the RBS Agreement was modified, reducing the number of participatinglenders and amending certain loan terms, and converted to a Credit and Guaranty Agreement (the“Wells Fargo Agreement”) with Wells Fargo Bank (“Wells Fargo”). The Wells Fargo Agreementincluded a term loan, a revolving line of credit, and a letter of credit facility. Substantially all of theCompany’s assets were pledged as collateral under the Wells Fargo Agreement.
The Wells Fargo Agreement provided for a $10,000,000 Maximum Revolving Advance and$77,500,000 of term debt.
Amended and Restated Credit Facility
In connection with the IPO, on April 4, 2012, Tumi, Inc. and Tumi Stores, Inc. (the“Borrowers”) entered into an amended and restated credit facility (the “Amended Credit Facility”),with Wells Fargo Bank National Association (“Wells Fargo”) as lender and collateral agent.
On April 4, 2012, the Company’s had $60,000,000 outstanding on its then-current term loanfacility and no balance outstanding on its revolving credit facility for which the total capacity was$10,000,000. The Company had, however, utilized $250,000 under the revolving facility for letters ofcredit. Based on the Company’s calculated leverage ratio at the time, the facility bore interest at eitherthe market LIBOR rate plus 175 basis points or the prime rate plus 75 basis points.
- II-20 -
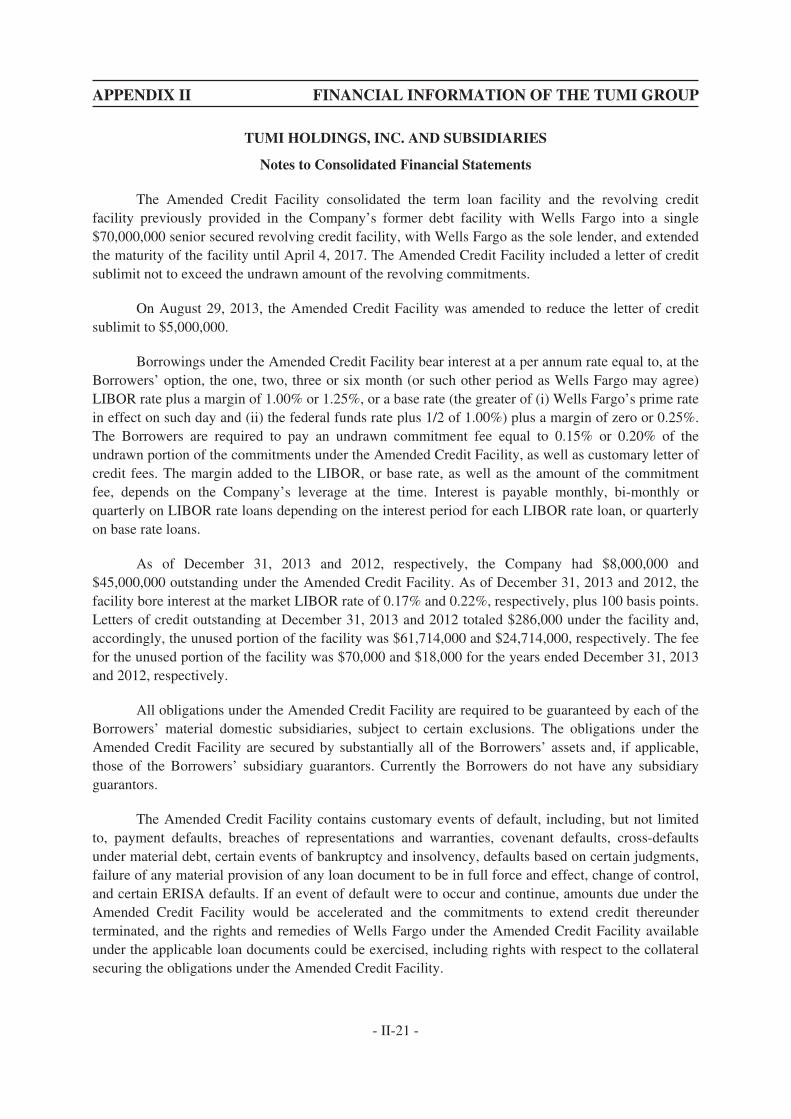
APPENDIX II FINANCIAL INFORMATION OF THE TUMI GROUP
TUMI HOLDINGS, INC. AND SUBSIDIARIES
Notes to Consolidated Financial Statements
The Amended Credit Facility consolidated the term loan facility and the revolving creditfacility previously provided in the Company’s former debt facility with Wells Fargo into a single$70,000,000 senior secured revolving credit facility, with Wells Fargo as the sole lender, and extendedthe maturity of the facility until April 4, 2017. The Amended Credit Facility included a letter of creditsublimit not to exceed the undrawn amount of the revolving commitments.
On August 29, 2013, the Amended Credit Facility was amended to reduce the letter of creditsublimit to $5,000,000.
Borrowings under the Amended Credit Facility bear interest at a per annum rate equal to, at theBorrowers’ option, the one, two, three or six month (or such other period as Wells Fargo may agree)LIBOR rate plus a margin of 1.00% or 1.25%, or a base rate (the greater of (i) Wells Fargo’s prime ratein effect on such day and (ii) the federal funds rate plus 1/2 of 1.00%) plus a margin of zero or 0.25%.The Borrowers are required to pay an undrawn commitment fee equal to 0.15% or 0.20% of theundrawn portion of the commitments under the Amended Credit Facility, as well as customary letter ofcredit fees. The margin added to the LIBOR, or base rate, as well as the amount of the commitmentfee, depends on the Company’s leverage at the time. Interest is payable monthly, bi-monthly orquarterly on LIBOR rate loans depending on the interest period for each LIBOR rate loan, or quarterlyon base rate loans.
As of December 31, 2013 and 2012, respectively, the Company had $8,000,000 and$45,000,000 outstanding under the Amended Credit Facility. As of December 31, 2013 and 2012, thefacility bore interest at the market LIBOR rate of 0.17% and 0.22%, respectively, plus 100 basis points.Letters of credit outstanding at December 31, 2013 and 2012 totaled $286,000 under the facility and,accordingly, the unused portion of the facility was $61,714,000 and $24,714,000, respectively. The feefor the unused portion of the facility was $70,000 and $18,000 for the years ended December 31, 2013and 2012, respectively.
All obligations under the Amended Credit Facility are required to be guaranteed by each of theBorrowers’ material domestic subsidiaries, subject to certain exclusions. The obligations under theAmended Credit Facility are secured by substantially all of the Borrowers’ assets and, if applicable,those of the Borrowers’ subsidiary guarantors. Currently the Borrowers do not have any subsidiaryguarantors.
The Amended Credit Facility contains customary events of default, including, but not limitedto, payment defaults, breaches of representations and warranties, covenant defaults, cross-defaultsunder material debt, certain events of bankruptcy and insolvency, defaults based on certain judgments,failure of any material provision of any loan document to be in full force and effect, change of control,and certain ERISA defaults. If an event of default were to occur and continue, amounts due under theAmended Credit Facility would be accelerated and the commitments to extend credit thereunderterminated, and the rights and remedies of Wells Fargo under the Amended Credit Facility availableunder the applicable loan documents could be exercised, including rights with respect to the collateralsecuring the obligations under the Amended Credit Facility.
- II-21 -
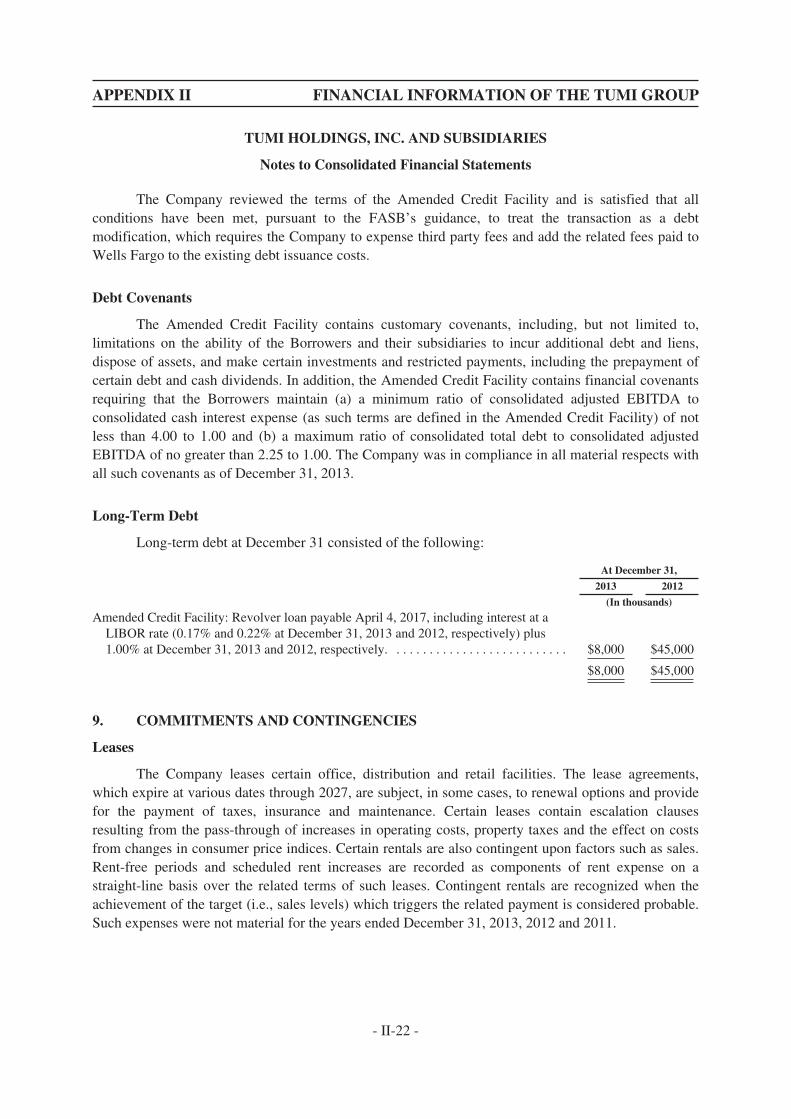
APPENDIX II FINANCIAL INFORMATION OF THE TUMI GROUP
TUMI HOLDINGS, INC. AND SUBSIDIARIES
Notes to Consolidated Financial Statements
The Company reviewed the terms of the Amended Credit Facility and is satisfied that allconditions have been met, pursuant to the FASB’s guidance, to treat the transaction as a debtmodification, which requires the Company to expense third party fees and add the related fees paid toWells Fargo to the existing debt issuance costs.
Debt Covenants
The Amended Credit Facility contains customary covenants, including, but not limited to,limitations on the ability of the Borrowers and their subsidiaries to incur additional debt and liens,dispose of assets, and make certain investments and restricted payments, including the prepayment ofcertain debt and cash dividends. In addition, the Amended Credit Facility contains financial covenantsrequiring that the Borrowers maintain (a) a minimum ratio of consolidated adjusted EBITDA toconsolidated cash interest expense (as such terms are defined in the Amended Credit Facility) of notless than 4.00 to 1.00 and (b) a maximum ratio of consolidated total debt to consolidated adjustedEBITDA of no greater than 2.25 to 1.00. The Company was in compliance in all material respects withall such covenants as of December 31, 2013.
Long-Term Debt
Long-term debt at December 31 consisted of the following:
At December 31,
2013 2012
(In thousands)
Amended Credit Facility: Revolver loan payable April 4, 2017, including interest at aLIBOR rate (0.17% and 0.22% at December 31, 2013 and 2012, respectively) plus1.00% at December 31, 2013 and 2012, respectively. . . . . . . . . . . . . . . . . . . . . . . . . . . $8,000 $45,000
$8,000 $45,000
9. COMMITMENTS AND CONTINGENCIES
Leases
The Company leases certain office, distribution and retail facilities. The lease agreements,which expire at various dates through 2027, are subject, in some cases, to renewal options and providefor the payment of taxes, insurance and maintenance. Certain leases contain escalation clausesresulting from the pass-through of increases in operating costs, property taxes and the effect on costsfrom changes in consumer price indices. Certain rentals are also contingent upon factors such as sales.Rent-free periods and scheduled rent increases are recorded as components of rent expense on astraight-line basis over the related terms of such leases. Contingent rentals are recognized when theachievement of the target (i.e., sales levels) which triggers the related payment is considered probable.Such expenses were not material for the years ended December 31, 2013, 2012 and 2011.
- II-22 -
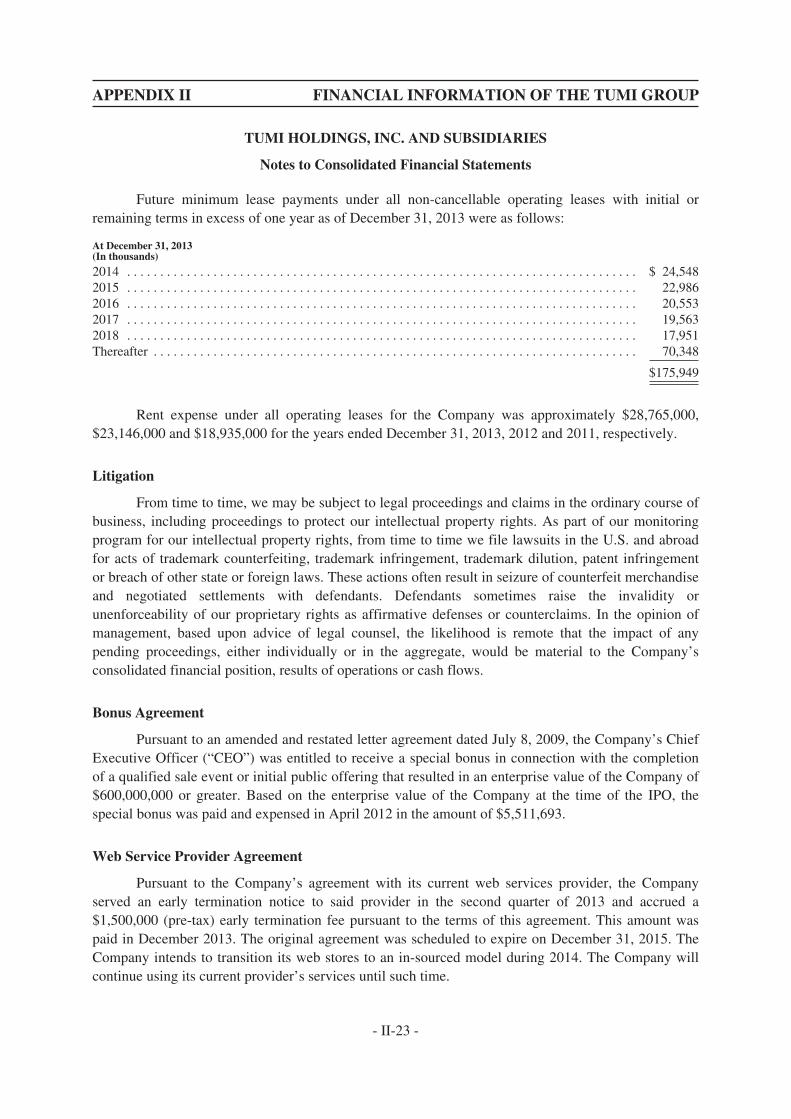
APPENDIX II FINANCIAL INFORMATION OF THE TUMI GROUP
TUMI HOLDINGS, INC. AND SUBSIDIARIES
Notes to Consolidated Financial Statements
Future minimum lease payments under all non-cancellable operating leases with initial orremaining terms in excess of one year as of December 31, 2013 were as follows:
At December 31, 2013(In thousands)
2014 . . . . . . . . . . . . . . . . . . . . . . . . . . . . . . . . . . . . . . . . . . . . . . . . . . . . . . . . . . . . . . . . . . . . . . . . . . . . . $ 24,5482015 . . . . . . . . . . . . . . . . . . . . . . . . . . . . . . . . . . . . . . . . . . . . . . . . . . . . . . . . . . . . . . . . . . . . . . . . . . . . . 22,9862016 . . . . . . . . . . . . . . . . . . . . . . . . . . . . . . . . . . . . . . . . . . . . . . . . . . . . . . . . . . . . . . . . . . . . . . . . . . . . . 20,5532017 . . . . . . . . . . . . . . . . . . . . . . . . . . . . . . . . . . . . . . . . . . . . . . . . . . . . . . . . . . . . . . . . . . . . . . . . . . . . . 19,5632018 . . . . . . . . . . . . . . . . . . . . . . . . . . . . . . . . . . . . . . . . . . . . . . . . . . . . . . . . . . . . . . . . . . . . . . . . . . . . . 17,951Thereafter . . . . . . . . . . . . . . . . . . . . . . . . . . . . . . . . . . . . . . . . . . . . . . . . . . . . . . . . . . . . . . . . . . . . . . . . . 70,348
$175,949
Rent expense under all operating leases for the Company was approximately $28,765,000,$23,146,000 and $18,935,000 for the years ended December 31, 2013, 2012 and 2011, respectively.
Litigation
From time to time, we may be subject to legal proceedings and claims in the ordinary course ofbusiness, including proceedings to protect our intellectual property rights. As part of our monitoringprogram for our intellectual property rights, from time to time we file lawsuits in the U.S. and abroadfor acts of trademark counterfeiting, trademark infringement, trademark dilution, patent infringementor breach of other state or foreign laws. These actions often result in seizure of counterfeit merchandiseand negotiated settlements with defendants. Defendants sometimes raise the invalidity orunenforceability of our proprietary rights as affirmative defenses or counterclaims. In the opinion ofmanagement, based upon advice of legal counsel, the likelihood is remote that the impact of anypending proceedings, either individually or in the aggregate, would be material to the Company’sconsolidated financial position, results of operations or cash flows.
Bonus Agreement
Pursuant to an amended and restated letter agreement dated July 8, 2009, the Company’s ChiefExecutive Officer (“CEO”) was entitled to receive a special bonus in connection with the completionof a qualified sale event or initial public offering that resulted in an enterprise value of the Company of$600,000,000 or greater. Based on the enterprise value of the Company at the time of the IPO, thespecial bonus was paid and expensed in April 2012 in the amount of $5,511,693.
Web Service Provider Agreement
Pursuant to the Company’s agreement with its current web services provider, the Companyserved an early termination notice to said provider in the second quarter of 2013 and accrued a$1,500,000 (pre-tax) early termination fee pursuant to the terms of this agreement. This amount waspaid in December 2013. The original agreement was scheduled to expire on December 31, 2015. TheCompany intends to transition its web stores to an in-sourced model during 2014. The Company willcontinue using its current provider’s services until such time.
- II-23 -

APPENDIX II FINANCIAL INFORMATION OF THE TUMI GROUP
TUMI HOLDINGS, INC. AND SUBSIDIARIES
Notes to Consolidated Financial Statements
10. INCOME TAXES
The components of United States and foreign income from operations before income taxeswere as follows:
For the Years Ended December 31,
2013 2012 2011
(In thousands)
United States . . . . . . . . . . . . . . . . . . . . . . . . . . . . . . . . . . . . . . . . . . . . . . . . . . . . . . $81,554 $63,001 $37,710Foreign . . . . . . . . . . . . . . . . . . . . . . . . . . . . . . . . . . . . . . . . . . . . . . . . . . . . . . . . . . . 4,554 503 (1,764)
Total income before income taxes . . . . . . . . . . . . . . . . . . . . . . . . . . . . . . . . . . $86,108 $63,504 $35,946
The provision for income taxes is as follows:
For the Years Ended December 31,
2013 2012 2011
(In thousands)
Current provisionFederal . . . . . . . . . . . . . . . . . . . . . . . . . . . . . . . . . . . . . . . . . . . . . . . . . . . . . . . $27,515 $22,745 $17,620State . . . . . . . . . . . . . . . . . . . . . . . . . . . . . . . . . . . . . . . . . . . . . . . . . . . . . . . . . 3,340 3,392 2,820Foreign . . . . . . . . . . . . . . . . . . . . . . . . . . . . . . . . . . . . . . . . . . . . . . . . . . . . . . . 211 1,282 729
Total current provision . . . . . . . . . . . . . . . . . . . . . . . . . . . . . . . . . . . . . . . 31,066 27,419 21,169
DeferredFederal . . . . . . . . . . . . . . . . . . . . . . . . . . . . . . . . . . . . . . . . . . . . . . . . . . . . . . . 1,124 (335) 2,754State . . . . . . . . . . . . . . . . . . . . . . . . . . . . . . . . . . . . . . . . . . . . . . . . . . . . . . . . . (565) (317) (4,433)Foreign . . . . . . . . . . . . . . . . . . . . . . . . . . . . . . . . . . . . . . . . . . . . . . . . . . . . . . . (76) (46) (136)
Total deferred provision . . . . . . . . . . . . . . . . . . . . . . . . . . . . . . . . . . . . . . 483 (698) (1,815)
Total provision for income taxes . . . . . . . . . . . . . . . . . . . . . . . . . . . . . . . $31,549 $26,721 $19,354
The differences between income taxes based on the statutory U.S. federal income tax rate of35% and the Company’s effective income tax rate are provided in the following reconciliation:
For the Years Ended December 31,
2013 2012 2011
(In thousands)
Statutory federal income tax . . . . . . . . . . . . . . . . . . . . . . . . . . . . . . . . . . . . . . . . . . $30,138 $22,226 $12,580Dividend expense on mandatorily redeemable preferred stock and preferred
equity interests . . . . . . . . . . . . . . . . . . . . . . . . . . . . . . . . . . . . . . . . . . . . . . . . . . . — 2,762 8,000State and local net of federal benefit . . . . . . . . . . . . . . . . . . . . . . . . . . . . . . . . . . . . 1,694 1,789 (1,049)Other . . . . . . . . . . . . . . . . . . . . . . . . . . . . . . . . . . . . . . . . . . . . . . . . . . . . . . . . . . . . (283) (56) (177)
Total provision for income taxes . . . . . . . . . . . . . . . . . . . . . . . . . . . . . . . . . . . $31,549 $26,721 $19,354
- II-24 -

APPENDIX II FINANCIAL INFORMATION OF THE TUMI GROUP
TUMI HOLDINGS, INC. AND SUBSIDIARIES
Notes to Consolidated Financial Statements
The major components of deferred income taxes were as follows:
At December 31,
2013 2012
(In thousands)
Deferred tax assetsNet operating loss—foreign . . . . . . . . . . . . . . . . . . . . . . . . . . . . . . . . . . . . . . . . . . . . . . $ 2,067 $ 2,814Warranty reserves . . . . . . . . . . . . . . . . . . . . . . . . . . . . . . . . . . . . . . . . . . . . . . . . . . . . . . 2,725 2,548Rent expense . . . . . . . . . . . . . . . . . . . . . . . . . . . . . . . . . . . . . . . . . . . . . . . . . . . . . . . . . . 1,968 2,036Other comprehensive income . . . . . . . . . . . . . . . . . . . . . . . . . . . . . . . . . . . . . . . . . . . . . 51 283Inventory reserves . . . . . . . . . . . . . . . . . . . . . . . . . . . . . . . . . . . . . . . . . . . . . . . . . . . . . . 819 664Other . . . . . . . . . . . . . . . . . . . . . . . . . . . . . . . . . . . . . . . . . . . . . . . . . . . . . . . . . . . . . . . . 586 354Depreciation . . . . . . . . . . . . . . . . . . . . . . . . . . . . . . . . . . . . . . . . . . . . . . . . . . . . . . . . . . 114 118Accrued expense . . . . . . . . . . . . . . . . . . . . . . . . . . . . . . . . . . . . . . . . . . . . . . . . . . . . . . . 473 449Allowance for doubtful accounts . . . . . . . . . . . . . . . . . . . . . . . . . . . . . . . . . . . . . . . . . . 177 379Share-based compensation . . . . . . . . . . . . . . . . . . . . . . . . . . . . . . . . . . . . . . . . . . . . . . . 746 —Valuation allowance . . . . . . . . . . . . . . . . . . . . . . . . . . . . . . . . . . . . . . . . . . . . . . . . . . . . (2,255) (3,002)
Total deferred tax assets, net . . . . . . . . . . . . . . . . . . . . . . . . . . . . . . . . . . . . . . . . . 7,471 6,643
Deferred tax liabilitiesIntangibles . . . . . . . . . . . . . . . . . . . . . . . . . . . . . . . . . . . . . . . . . . . . . . . . . . . . . . . . . . . (48,536) (49,016)Depreciation . . . . . . . . . . . . . . . . . . . . . . . . . . . . . . . . . . . . . . . . . . . . . . . . . . . . . . . . . . (2,659) (634)
Total deferred tax liabilities, net . . . . . . . . . . . . . . . . . . . . . . . . . . . . . . . . . . . . . . . (51,195) (49,650)
Total deferred tax balance . . . . . . . . . . . . . . . . . . . . . . . . . . . . . . . . . . . . . . . $(43,724) $(43,007)
Amounts included in the consolidated balance sheet:Deferred tax assets, current . . . . . . . . . . . . . . . . . . . . . . . . . . . . . . . . . . . . . . . . . . . . . . . . . . $ 5,347 $ 3,851Deferred tax asset, noncurrent . . . . . . . . . . . . . . . . . . . . . . . . . . . . . . . . . . . . . . . . . . . . . . . . 2,124 2,158Deferred tax liabilities . . . . . . . . . . . . . . . . . . . . . . . . . . . . . . . . . . . . . . . . . . . . . . . . . . . . . . (51,195) (49,016)
Total . . . . . . . . . . . . . . . . . . . . . . . . . . . . . . . . . . . . . . . . . . . . . . . . . . . . . . . . . . . . $(43,724) $(43,007)
Approximately $48,467,000 and $48,889,000 of deferred tax liabilities were recognized as ofDecember 31, 2013 and 2012, respectively, to reflect the potential future tax liability relating to the$131,500,000 of identifiable intangible assets arising out of the purchase price valuation adjustment in2004. Approximately $51,000 of deferred tax assets as of December 31, 2013 related to unrealizedgains recorded in other comprehensive income.
In assessing the realizability of deferred tax assets, management considers whether it is morelikely than not that some portion of the deferred tax assets will not be realized. The ultimate realization ofdeferred tax assets relating to a particular jurisdiction is dependent upon the generation of future taxableincome during the periods in which those temporary differences become deductible in that jurisdiction.
Management considers the scheduled reversal of deferred tax liabilities and projected futuretaxable income in making this assessment. Based upon the level of historical taxable income andprojections for future taxable income over the periods in which the deferred tax assets are deductible,management believes it is more likely than not that the Company will realize the benefits of thesedeductible differences, with the exception of certain foreign net operating losses and deferred tax assets.
- II-25 -
APPENDIX II FINANCIAL INFORMATION OF THE TUMI GROUP
TUMI HOLDINGS, INC. AND SUBSIDIARIES
Notes to Consolidated Financial Statements
At December 31, 2013 and 2012, there were approximately $6,958,000 and $9,648,000 of grossforeign net operating loss carryforwards, respectively. The majority of these net operating losscarryforwards have an unlimited carryforward period. A valuation allowance of $2,067,000 and $2,814,000was recorded at December 31, 2013 and 2012, respectively, related to the foreign net operating losses. It isanticipated that these will not be utilized due to continuing losses in these jurisdictions.
The Company has elected to treat all of its foreign subsidiaries as disregarded entities forU.S. income tax purposes. Accordingly, the taxable income of the Company’s foreign subsidiaries istaxed currently in the U.S. and no deferred tax liability exists in regards to the unrepatriated earnings ofthe subsidiaries.
The Company applies the FASB’s provisions for uncertain tax positions. The Company utilizesthe two step process to determine the amount of recognized tax benefit. For tax positions meeting themore-likely-than-not threshold, the amount recognized in the consolidated financial statements is thelargest benefit that has a greater than 50% likelihood of being realized upon ultimate settlement withthe relevant tax authority. The Company recognizes interest and penalties associated with certain taxpositions as a component of income tax expense.
The Federal tax returns were audited for the years 2008 and 2009 which resulted in minimaladjustments. For years prior to 2009 the federal statute of limitations is closed. The New Jersey taxreturns were audited for the years 2003–2006 with no income tax adjustments. The Minnesota taxreturns were audited for the years 2006–2008 which resulted in minimal adjustments. The New Yorktax returns were audited for 2009 and 2010 which resulted in minimal adjustments. Most of theremaining states remain open to examination for a period of 3 to 4 years from date of filing. TheCompany files tax returns in all of the foreign jurisdictions that it has a permanent establishment andthe tax filings remain subject to examination for 4 to 5 years.
The Company recognizes interest and penalties associated with uncertain tax positions as acomponent of income tax expense. The Company had approximately $173,000 and $253,000 for thepayment of interest and penalties accrued at December 31, 2013 and 2012, respectively. The Companyrecorded estimated tax related penalty and interest expense in the statement of operations ofapproximately $17,000, $79,000 and $41,000 during the years ended December 31, 2013, 2012 and2011, respectively. The total liability for unrecognized tax benefit, inclusive of interest and penalties, atDecember 31, 2013 and 2012 amounted to approximately $517,000 and $1,001,000, respectively. Theamount of unrecognized tax benefit that, if recognized, would affect the effective tax rate atDecember 31, 2013 and 2012 was $344,000 and $694,000, respectively.
The Company does not expect that there will be a material impact on the amount ofunrecognized tax benefit in the next 12 months.
- II-26 -
APPENDIX II FINANCIAL INFORMATION OF THE TUMI GROUP
TUMI HOLDINGS, INC. AND SUBSIDIARIES
Notes to Consolidated Financial Statements
The following table indicates the changes to the Company’s uncertain tax positions for theperiod and years ended December 31, 2013, 2012 and 2011.
For the Years Ended December 31,
2013 2012 2011
(In thousands)
Balance, beginning of year . . . . . . . . . . . . . . . . . . . . . . . . . . . . . . . . . . . . . . . . . . . $ 747 $658 $214Additions based on tax positions related to the current year . . . . . . . . . . . . . . . . . — 95 187Additions based on tax positions related to prior years . . . . . . . . . . . . . . . . . . . . . — — 291Reductions based on tax positions related to prior years . . . . . . . . . . . . . . . . . . . . (403) — —Expiration of statute of limitations . . . . . . . . . . . . . . . . . . . . . . . . . . . . . . . . . . . . . — (6) —Settlements . . . . . . . . . . . . . . . . . . . . . . . . . . . . . . . . . . . . . . . . . . . . . . . . . . . . . . . — — (34)
Balance, end of year . . . . . . . . . . . . . . . . . . . . . . . . . . . . . . . . . . . . . . . . . . . . . . . . $ 344 $747 $658
As of December 31, 2013, $344,000 of the above amount was included in other long-termliabilities in the consolidated balance sheet. As of December 31, 2012, $53,000 and $694,000 of theabove amount was included in income taxes payable and other long-term liabilities, respectively, in theconsolidated balance sheet.
11. EMPLOYEE BENEFIT PLAN
The Company has a 401(k) profit-sharing and savings plan (the “Plan”). Under the Plan,eligible employees could contribute up to 60% of their compensation not to exceed $17,500 (subject tofuture adjustment) during calendar year 2013, $17,000 during calendar year 2012 and $16,500 duringcalendar year 2011. In December 2003, the Company elected to adopt a safe harbor contribution planamendment, effective January 1, 2004, whereby safe harbor contributions may be made to eligibleparticipants in the 401(k) profit sharing and savings plan. By making a safe harbor matchingcontribution, the Company’s Plan was no longer subject to certain regulatory testing, thereby enablingall participants to make tax-deferred contributions up to the maximum allowable amount.
The Company has a voluntary safe harbor contribution match up to 100% of the employee’scontribution on the first 3% of their compensation and 50% of the employee’s contribution on the next2% of eligible compensation. Employer contributions expensed for the Plan amounted toapproximately $885,000, $788,000 and $661,000 for the years ended December 31, 2013, 2012 and2011, respectively. Participants are at all times fully vested in their contributions; the Company’s safeharbor contribution is fully vested immediately.
Profit-sharing contributions vest over a 5 year period in accordance with the Plan’s vestingschedules. No contributions were made during 2013, 2012 or 2011.
12. MANDATORILY REDEEMABLE PREFERRED STOCK AND PREFERRED EQUITYINTERESTS
In connection with the IPO in April 2012, the Company repurchased all of its mandatorilyredeemable Series A preferred stock, par value $0.01, and all of its preferred equity interest units. Thisincluded 77,500 shares of Series A preferred stock, with a subscription price of $77,500,000, and
- II-27 -
APPENDIX II FINANCIAL INFORMATION OF THE TUMI GROUP
TUMI HOLDINGS, INC. AND SUBSIDIARIES
Notes to Consolidated Financial Statements
50,000 preferred equity interest units, with a subscription price of $50,000,000. All of the mandatorilyredeemable preferred stock and preferred equity interests were issued during 2004 in connection withan acquisition. The mandatorily redeemable preferred stock and preferred equity interests had identicalrights and preferences and accrued dividends at the rate of 10% compounded annually and werecumulative.
The mandatorily redeemable preferred stock and preferred equity interests repurchased in 2012totaled $259,321,000, comprised of $157,627,000 of Series A preferred stock, inclusive of $80,127,000of accrued dividends, and $101,694,000 of preferred equity interests, inclusive of $51,694,000 ofaccrued dividends.
13. STOCKHOLDERS’ EQUITY
As of December 31, 2013 and 2012, there were 350,000,000 shares of common stockauthorized, with a par value of $0.01, of which 67,866,667 shares, net of treasury stock, wereoutstanding. Common stock represents 100% of the ownership and voting control of Tumi Holdings,Inc. and does not accrue dividends.
In connection with the IPO, 75,000,000 shares of preferred stock were authorized, with a parvalue of $0.01, of which no shares were issued or outstanding as of December 31, 2013 and 2012.
As of December 31, 2013 and 2012, the Company held 277,806 shares of common stock intreasury.
Stock Splits
In connection with the IPO, the Company’s Board of Directors approved a 101.200929-for-1common stock split and a subsequent 1.037857-for-1 common stock split, which were effectiveApril 4, 2012 and April 19, 2012, respectively.
All common share and per share amounts in the consolidated financial statements have beenadjusted retrospectively for all periods presented to reflect the 101.200929-for-1 and 1.037857-for-1common stock splits.
Accumulated Other Comprehensive Loss
The balance in accumulated other comprehensive loss consists only of foreign currencytranslation adjustments, net of tax.
Shareholder Loans
Shareholder loans arose from the sale of stock to employees in May 2009, all of which wererepaid in full by December 31, 2011. In accordance with the FASB’s guidance, shareholder loans areclassified in Stockholders’ Equity.
- II-28 -
APPENDIX II FINANCIAL INFORMATION OF THE TUMI GROUP
TUMI HOLDINGS, INC. AND SUBSIDIARIES
Notes to Consolidated Financial Statements
14. EARNINGS PER SHARE
The following table summarizes the calculation of basic and diluted earnings per common share(adjusted for the stock splits described in Note 13—Stockholders’ Equity) for the years endedDecember 31, 2013, 2012 and 2011.
For the Years Ended December 31,
2013 2012 2011
(In thousands, except share and per share data)Basic earnings per common shareNumerator:
Net income . . . . . . . . . . . . . . . . . . . . . . . . . . . . . . . . . . . . . . . . . $ 54,559 $ 36,783 $ 16,592Denominator:
Basic weighted average common shares outstanding . . . . . 67,866,667 63,304,838 52,536,224
Basic earnings per common share . . . . . . . . . . . . . . . . . . . . . . . . . . . . $ 0.80 $ 0.58 $ 0.32
Diluted earnings per common share:Numerator:
Net income . . . . . . . . . . . . . . . . . . . . . . . . . . . . . . . . . . . . . . . . . $ 54,559 $ 36,783 $ 16,592Denominator:
Number of shares used in basic calculation . . . . . . . . . . . . 67,866,667 63,304,838 52,536,224Weighted average dilutive effect of employee stock
options . . . . . . . . . . . . . . . . . . . . . . . . . . . . . . . . . . . . . . . 4,021 110 —
Diluted weighted average common sharesoutstanding . . . . . . . . . . . . . . . . . . . . . . . . . . . . . . . 67,870,688 63,304,948 52,536,224
Diluted earnings per common share . . . . . . . . . . $ 0.80 $ 0.58 $ 0.32
The Company excluded 8,328 weighted average stock options for the year ended December 31,2013 and none for the year ended December 31, 2012 from the calculation of diluted earnings percommon share because the exercise prices of these stock options were greater than or equal to theaverage market price of the common shares. These options could be included in the calculation in thefuture if the average market value of the common shares increases and is greater than the exercise priceof these options. The Company included all outstanding weighted average stock options with exerciseprices less than the average market price of the common shares in the calculation of the weightedaverage dilutive effect of employee stock options, but a weighted average of 446,090 of these stockoptions for the year ended December 31, 2013 (none for the year ended December 31, 2012) did nothave any impact on the dilutive effect of employee stock options in the preceding table, as they weredetermined to be antidilutive when the treasury stock method was applied.
15. SEGMENT INFORMATION
The Company sells its products globally to consumers through both direct and indirect channelsand manages its business through four operating segments: Direct-to-Consumer North America,Direct-to-Consumer International, Indirect-to-Consumer North America and Indirect-to-ConsumerInternational. The Company’s Chief Executive Officer and Chief Financial Officer are its chiefoperating decision makers (the “CODM’s”) as defined in the FASB’s guidance relating to segmentreporting. The CODM’s evaluate net sales and operating income of the Company’s segments toallocate resources and evaluate performance. Operating income of the Company’s segments ismeasured on net sales, less cost of goods sold and direct expenses of each segment and certain
- II-29 -
APPENDIX II FINANCIAL INFORMATION OF THE TUMI GROUP
TUMI HOLDINGS, INC. AND SUBSIDIARIES
Notes to Consolidated Financial Statements
operating expenses allocated to each segment. Expenses not specifically allocated to the individualsegments include costs such as product design and development, certain general and administrative,shipping, warehouse and other expenses. The CODM’s do not receive information related to totalassets by segment. Although the Company’s products fall into three major categories: travel, businessand accessories, the Company’s classification of individual product codes into these categories is fluidand dynamic; while the Company collects gross sales data, the Company does not collect financialinformation to derive net sales (including discounts and allowances) and markdowns by productcategory in sufficient detail to report such data in its financial statements in the aggregate or bysegment.
Following is a description of our segments:
Direct-to-Consumer North America
The Company’s Direct-to-Consumer North America segment sells the Company’s productsdirectly to consumers through a network of company-owned retail stores consisting of full-price storesand outlet stores strategically positioned in high-end retail malls or street venues. In addition, sales ofthe Company’s products to consumers through our e-commerce website are included in this segment.
Indirect-to-Consumer North America
The Company sells to wholesale customers, including specialty luggage retailers, prestigedepartment stores and business to business channels. Many of the Company’s wholesale customers alsooperate their own e-commerce websites through which they sell the Company’s products. The Companyalso sells its products in partner stores, which are operated by local distributors or retailers, that carryonly Tumi products and are governed by strict operating guidelines that the Company dictates.
Direct-to-Consumer International
The Company sells directly to consumers through a network of company-owned full-price andoutlet stores in high-end street venues and select malls in international locations. The Company alsosells its products directly to consumers through our e-commerce website.
Indirect-to-Consumer International
The Company sells its products through wholesale distribution channels in Europe, the MiddleEast and Africa, the Asia-Pacific region and Central and South America. The Company also sells itsproducts in partner stores, operated by local distributors or retailers, that carry only Tumi products andare governed by strict operating guidelines that the Company dictates. In addition, the Companyoperates concessions in department stores throughout Europe and the Middle East. Many of theCompany’s wholesale customers also operate their own e-commerce websites through which they sellthe Company’s products.
- II-30 -
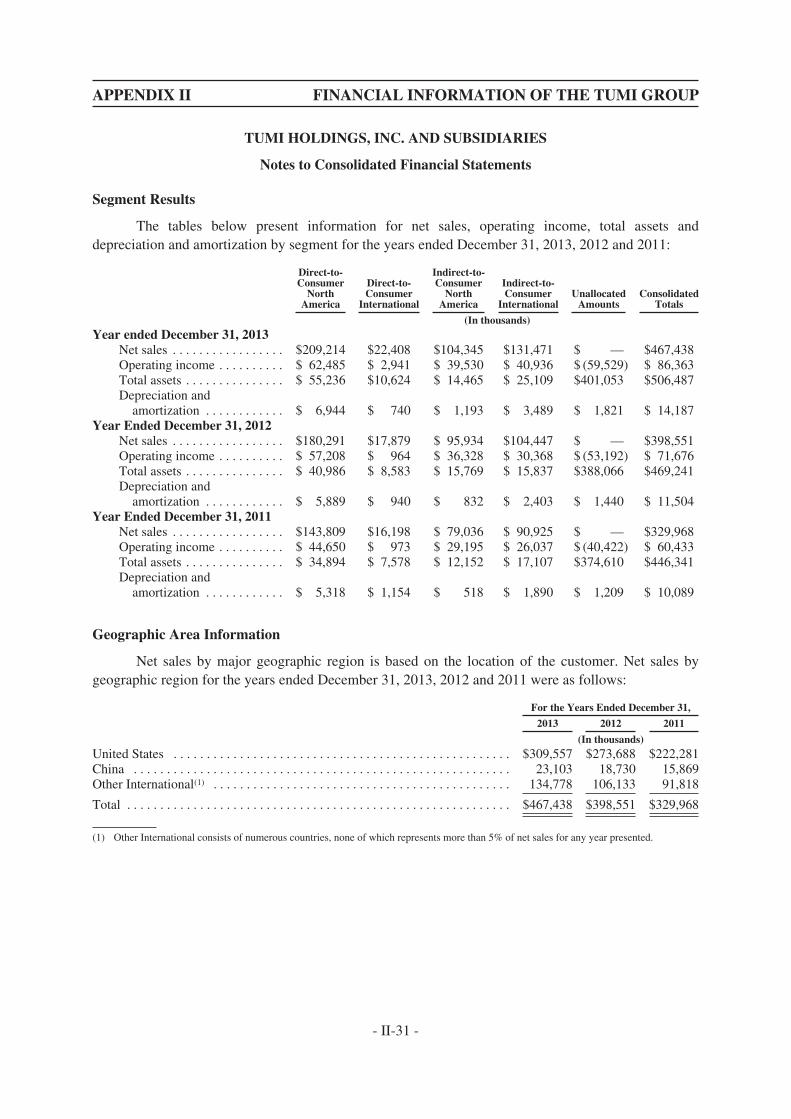
APPENDIX II FINANCIAL INFORMATION OF THE TUMI GROUP
TUMI HOLDINGS, INC. AND SUBSIDIARIES
Notes to Consolidated Financial Statements
Segment Results
The tables below present information for net sales, operating income, total assets anddepreciation and amortization by segment for the years ended December 31, 2013, 2012 and 2011:
Direct-to-Consumer
NorthAmerica
Direct-to-Consumer
International
Indirect-to-Consumer
NorthAmerica
Indirect-to-Consumer
InternationalUnallocated
AmountsConsolidated
Totals
(In thousands)Year ended December 31, 2013
Net sales . . . . . . . . . . . . . . . . . $209,214 $22,408 $104,345 $131,471 $ — $467,438Operating income . . . . . . . . . . $ 62,485 $ 2,941 $ 39,530 $ 40,936 $ (59,529) $ 86,363Total assets . . . . . . . . . . . . . . . $ 55,236 $10,624 $ 14,465 $ 25,109 $401,053 $506,487Depreciation and
amortization . . . . . . . . . . . . $ 6,944 $ 740 $ 1,193 $ 3,489 $ 1,821 $ 14,187Year Ended December 31, 2012
Net sales . . . . . . . . . . . . . . . . . $180,291 $17,879 $ 95,934 $104,447 $ — $398,551Operating income . . . . . . . . . . $ 57,208 $ 964 $ 36,328 $ 30,368 $ (53,192) $ 71,676Total assets . . . . . . . . . . . . . . . $ 40,986 $ 8,583 $ 15,769 $ 15,837 $388,066 $469,241Depreciation and
amortization . . . . . . . . . . . . $ 5,889 $ 940 $ 832 $ 2,403 $ 1,440 $ 11,504Year Ended December 31, 2011
Net sales . . . . . . . . . . . . . . . . . $143,809 $16,198 $ 79,036 $ 90,925 $ — $329,968Operating income . . . . . . . . . . $ 44,650 $ 973 $ 29,195 $ 26,037 $ (40,422) $ 60,433Total assets . . . . . . . . . . . . . . . $ 34,894 $ 7,578 $ 12,152 $ 17,107 $374,610 $446,341Depreciation and
amortization . . . . . . . . . . . . $ 5,318 $ 1,154 $ 518 $ 1,890 $ 1,209 $ 10,089
Geographic Area Information
Net sales by major geographic region is based on the location of the customer. Net sales bygeographic region for the years ended December 31, 2013, 2012 and 2011 were as follows:
For the Years Ended December 31,
2013 2012 2011
(In thousands)United States . . . . . . . . . . . . . . . . . . . . . . . . . . . . . . . . . . . . . . . . . . . . . . . . . . . $309,557 $273,688 $222,281China . . . . . . . . . . . . . . . . . . . . . . . . . . . . . . . . . . . . . . . . . . . . . . . . . . . . . . . . . 23,103 18,730 15,869Other International(1) . . . . . . . . . . . . . . . . . . . . . . . . . . . . . . . . . . . . . . . . . . . . . 134,778 106,133 91,818
Total . . . . . . . . . . . . . . . . . . . . . . . . . . . . . . . . . . . . . . . . . . . . . . . . . . . . . . . . . . $467,438 $398,551 $329,968
(1) Other International consists of numerous countries, none of which represents more than 5% of net sales for any year presented.
- II-31 -
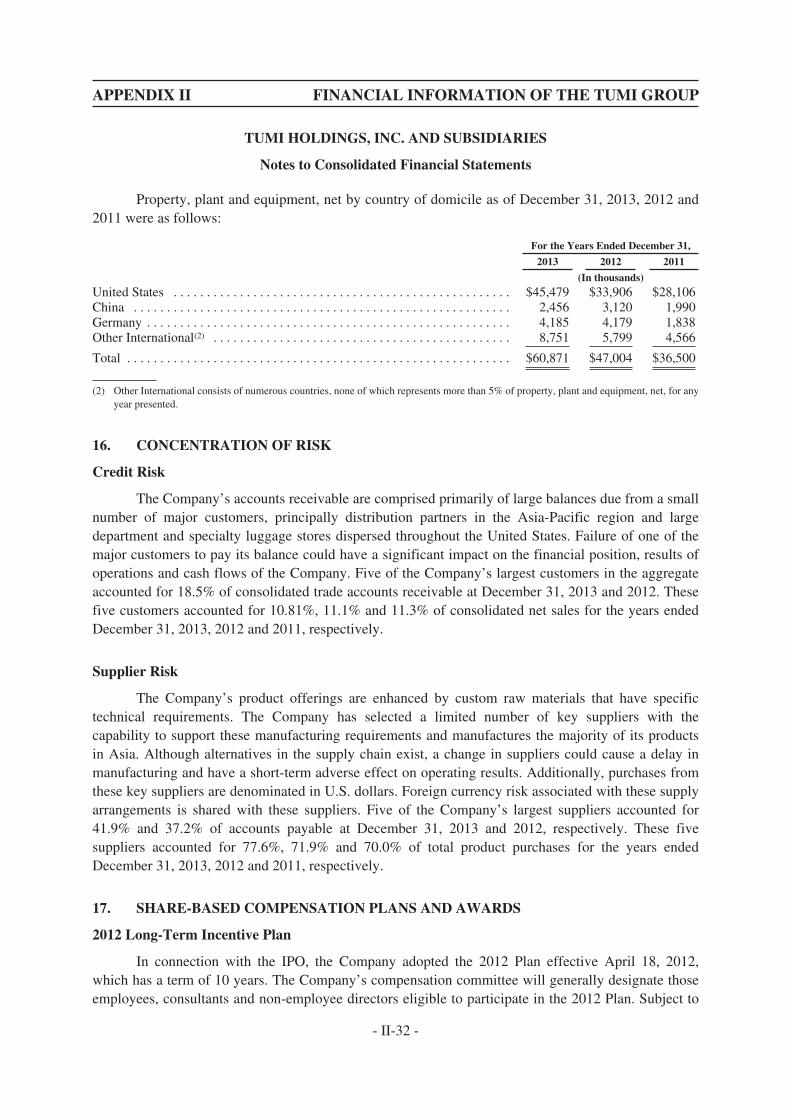
APPENDIX II FINANCIAL INFORMATION OF THE TUMI GROUP
TUMI HOLDINGS, INC. AND SUBSIDIARIES
Notes to Consolidated Financial Statements
Property, plant and equipment, net by country of domicile as of December 31, 2013, 2012 and2011 were as follows:
For the Years Ended December 31,
2013 2012 2011
(In thousands)United States . . . . . . . . . . . . . . . . . . . . . . . . . . . . . . . . . . . . . . . . . . . . . . . . . . . $45,479 $33,906 $28,106China . . . . . . . . . . . . . . . . . . . . . . . . . . . . . . . . . . . . . . . . . . . . . . . . . . . . . . . . . 2,456 3,120 1,990Germany . . . . . . . . . . . . . . . . . . . . . . . . . . . . . . . . . . . . . . . . . . . . . . . . . . . . . . . 4,185 4,179 1,838Other International(2) . . . . . . . . . . . . . . . . . . . . . . . . . . . . . . . . . . . . . . . . . . . . . 8,751 5,799 4,566
Total . . . . . . . . . . . . . . . . . . . . . . . . . . . . . . . . . . . . . . . . . . . . . . . . . . . . . . . . . . $60,871 $47,004 $36,500
(2) Other International consists of numerous countries, none of which represents more than 5% of property, plant and equipment, net, for anyyear presented.
16. CONCENTRATION OF RISK
Credit Risk
The Company’s accounts receivable are comprised primarily of large balances due from a smallnumber of major customers, principally distribution partners in the Asia-Pacific region and largedepartment and specialty luggage stores dispersed throughout the United States. Failure of one of themajor customers to pay its balance could have a significant impact on the financial position, results ofoperations and cash flows of the Company. Five of the Company’s largest customers in the aggregateaccounted for 18.5% of consolidated trade accounts receivable at December 31, 2013 and 2012. Thesefive customers accounted for 10.81%, 11.1% and 11.3% of consolidated net sales for the years endedDecember 31, 2013, 2012 and 2011, respectively.
Supplier Risk
The Company’s product offerings are enhanced by custom raw materials that have specifictechnical requirements. The Company has selected a limited number of key suppliers with thecapability to support these manufacturing requirements and manufactures the majority of its productsin Asia. Although alternatives in the supply chain exist, a change in suppliers could cause a delay inmanufacturing and have a short-term adverse effect on operating results. Additionally, purchases fromthese key suppliers are denominated in U.S. dollars. Foreign currency risk associated with these supplyarrangements is shared with these suppliers. Five of the Company’s largest suppliers accounted for41.9% and 37.2% of accounts payable at December 31, 2013 and 2012, respectively. These fivesuppliers accounted for 77.6%, 71.9% and 70.0% of total product purchases for the years endedDecember 31, 2013, 2012 and 2011, respectively.
17. SHARE-BASED COMPENSATION PLANS AND AWARDS
2012 Long-Term Incentive Plan
In connection with the IPO, the Company adopted the 2012 Plan effective April 18, 2012,which has a term of 10 years. The Company’s compensation committee will generally designate thoseemployees, consultants and non-employee directors eligible to participate in the 2012 Plan. Subject to
- II-32 -
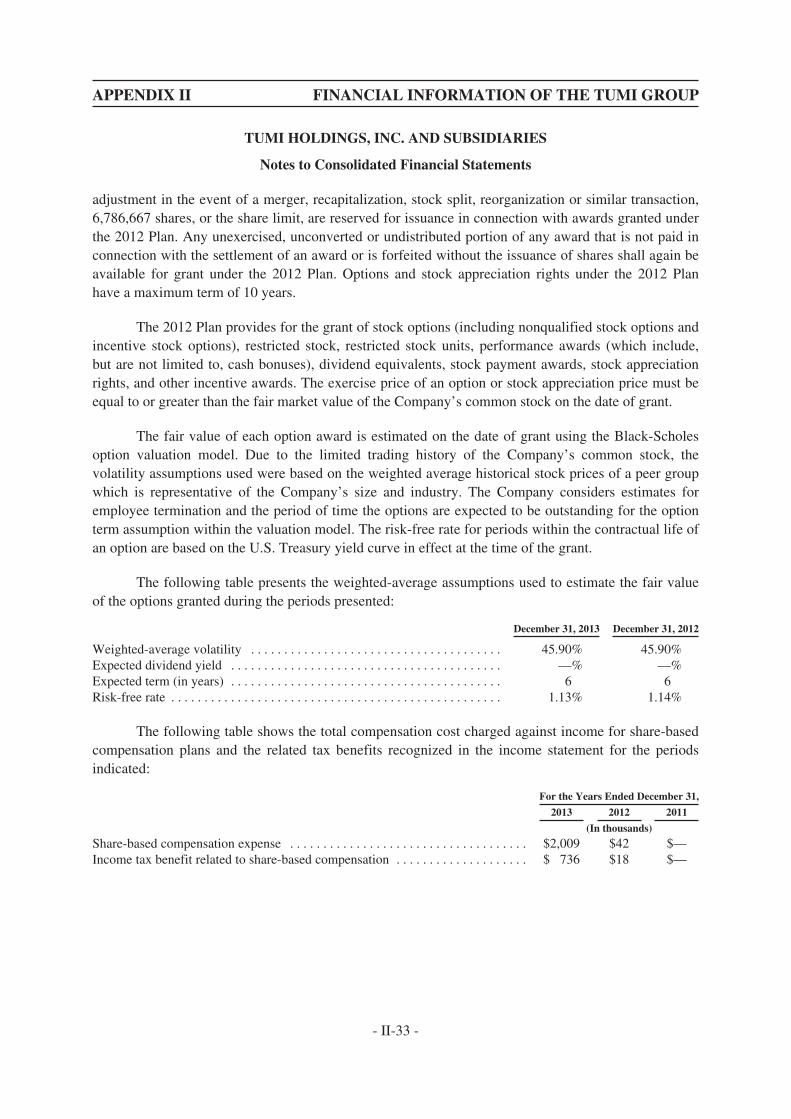
APPENDIX II FINANCIAL INFORMATION OF THE TUMI GROUP
TUMI HOLDINGS, INC. AND SUBSIDIARIES
Notes to Consolidated Financial Statements
adjustment in the event of a merger, recapitalization, stock split, reorganization or similar transaction,6,786,667 shares, or the share limit, are reserved for issuance in connection with awards granted underthe 2012 Plan. Any unexercised, unconverted or undistributed portion of any award that is not paid inconnection with the settlement of an award or is forfeited without the issuance of shares shall again beavailable for grant under the 2012 Plan. Options and stock appreciation rights under the 2012 Planhave a maximum term of 10 years.
The 2012 Plan provides for the grant of stock options (including nonqualified stock options andincentive stock options), restricted stock, restricted stock units, performance awards (which include,but are not limited to, cash bonuses), dividend equivalents, stock payment awards, stock appreciationrights, and other incentive awards. The exercise price of an option or stock appreciation price must beequal to or greater than the fair market value of the Company’s common stock on the date of grant.
The fair value of each option award is estimated on the date of grant using the Black-Scholesoption valuation model. Due to the limited trading history of the Company’s common stock, thevolatility assumptions used were based on the weighted average historical stock prices of a peer groupwhich is representative of the Company’s size and industry. The Company considers estimates foremployee termination and the period of time the options are expected to be outstanding for the optionterm assumption within the valuation model. The risk-free rate for periods within the contractual life ofan option are based on the U.S. Treasury yield curve in effect at the time of the grant.
The following table presents the weighted-average assumptions used to estimate the fair valueof the options granted during the periods presented:
December 31, 2013 December 31, 2012
Weighted-average volatility . . . . . . . . . . . . . . . . . . . . . . . . . . . . . . . . . . . . . . 45.90% 45.90%Expected dividend yield . . . . . . . . . . . . . . . . . . . . . . . . . . . . . . . . . . . . . . . . . —% —%Expected term (in years) . . . . . . . . . . . . . . . . . . . . . . . . . . . . . . . . . . . . . . . . . 6 6Risk-free rate . . . . . . . . . . . . . . . . . . . . . . . . . . . . . . . . . . . . . . . . . . . . . . . . . . 1.13% 1.14%
The following table shows the total compensation cost charged against income for share-basedcompensation plans and the related tax benefits recognized in the income statement for the periodsindicated:
For the Years Ended December 31,
2013 2012 2011
(In thousands)
Share-based compensation expense . . . . . . . . . . . . . . . . . . . . . . . . . . . . . . . . . . . . $2,009 $42 $—Income tax benefit related to share-based compensation . . . . . . . . . . . . . . . . . . . . $ 736 $18 $—
- II-33 -
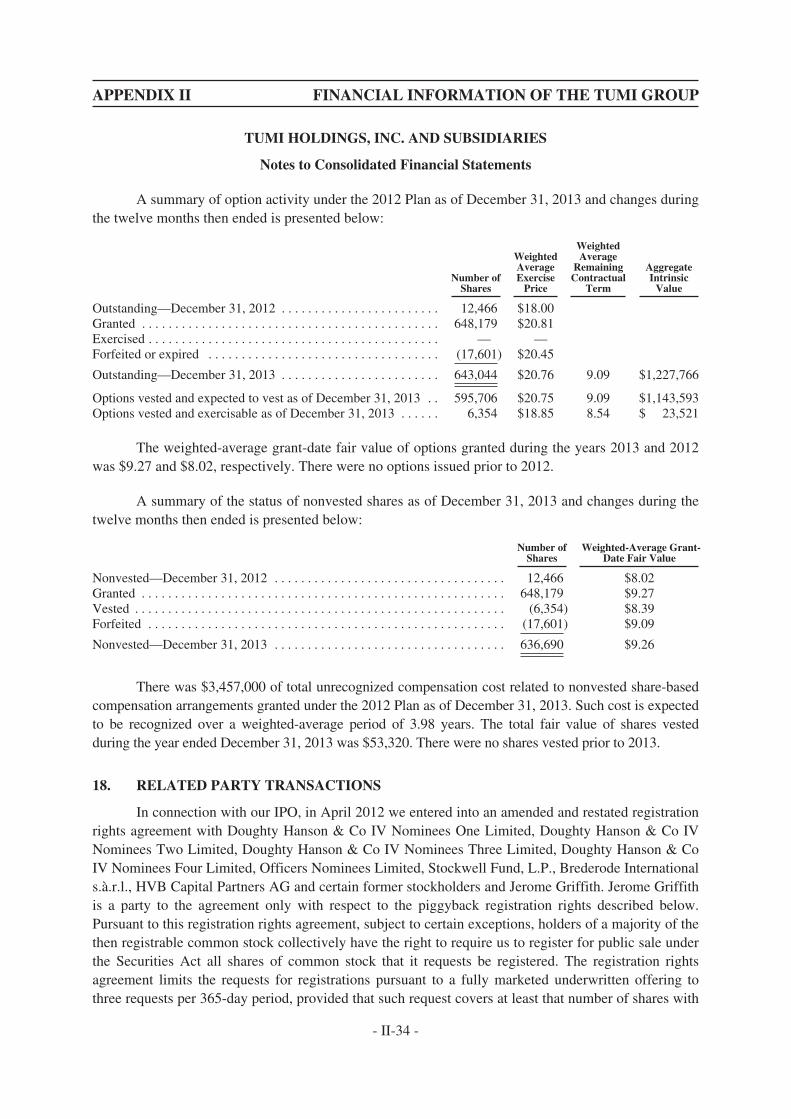
APPENDIX II FINANCIAL INFORMATION OF THE TUMI GROUP
TUMI HOLDINGS, INC. AND SUBSIDIARIES
Notes to Consolidated Financial Statements
A summary of option activity under the 2012 Plan as of December 31, 2013 and changes duringthe twelve months then ended is presented below:
Number ofShares
WeightedAverageExercise
Price
WeightedAverage
RemainingContractual
Term
AggregateIntrinsic
Value
Outstanding—December 31, 2012 . . . . . . . . . . . . . . . . . . . . . . . . 12,466 $18.00Granted . . . . . . . . . . . . . . . . . . . . . . . . . . . . . . . . . . . . . . . . . . . . . 648,179 $20.81Exercised . . . . . . . . . . . . . . . . . . . . . . . . . . . . . . . . . . . . . . . . . . . . — —Forfeited or expired . . . . . . . . . . . . . . . . . . . . . . . . . . . . . . . . . . . (17,601) $20.45
Outstanding—December 31, 2013 . . . . . . . . . . . . . . . . . . . . . . . . 643,044 $20.76 9.09 $1,227,766
Options vested and expected to vest as of December 31, 2013 . . 595,706 $20.75 9.09 $1,143,593Options vested and exercisable as of December 31, 2013 . . . . . . 6,354 $18.85 8.54 $ 23,521
The weighted-average grant-date fair value of options granted during the years 2013 and 2012was $9.27 and $8.02, respectively. There were no options issued prior to 2012.
A summary of the status of nonvested shares as of December 31, 2013 and changes during thetwelve months then ended is presented below:
Number ofShares
Weighted-Average Grant-Date Fair Value
Nonvested—December 31, 2012 . . . . . . . . . . . . . . . . . . . . . . . . . . . . . . . . . . . 12,466 $8.02Granted . . . . . . . . . . . . . . . . . . . . . . . . . . . . . . . . . . . . . . . . . . . . . . . . . . . . . . . 648,179 $9.27Vested . . . . . . . . . . . . . . . . . . . . . . . . . . . . . . . . . . . . . . . . . . . . . . . . . . . . . . . . (6,354) $8.39Forfeited . . . . . . . . . . . . . . . . . . . . . . . . . . . . . . . . . . . . . . . . . . . . . . . . . . . . . . (17,601) $9.09
Nonvested—December 31, 2013 . . . . . . . . . . . . . . . . . . . . . . . . . . . . . . . . . . . 636,690 $9.26
There was $3,457,000 of total unrecognized compensation cost related to nonvested share-basedcompensation arrangements granted under the 2012 Plan as of December 31, 2013. Such cost is expectedto be recognized over a weighted-average period of 3.98 years. The total fair value of shares vestedduring the year ended December 31, 2013 was $53,320. There were no shares vested prior to 2013.
18. RELATED PARTY TRANSACTIONS
In connection with our IPO, in April 2012 we entered into an amended and restated registrationrights agreement with Doughty Hanson & Co IV Nominees One Limited, Doughty Hanson & Co IVNominees Two Limited, Doughty Hanson & Co IV Nominees Three Limited, Doughty Hanson & CoIV Nominees Four Limited, Officers Nominees Limited, Stockwell Fund, L.P., Brederode Internationals.à.r.l., HVB Capital Partners AG and certain former stockholders and Jerome Griffith. Jerome Griffithis a party to the agreement only with respect to the piggyback registration rights described below.Pursuant to this registration rights agreement, subject to certain exceptions, holders of a majority of thethen registrable common stock collectively have the right to require us to register for public sale underthe Securities Act all shares of common stock that it requests be registered. The registration rightsagreement limits the requests for registrations pursuant to a fully marketed underwritten offering tothree requests per 365-day period, provided that such request covers at least that number of shares with
- II-34 -
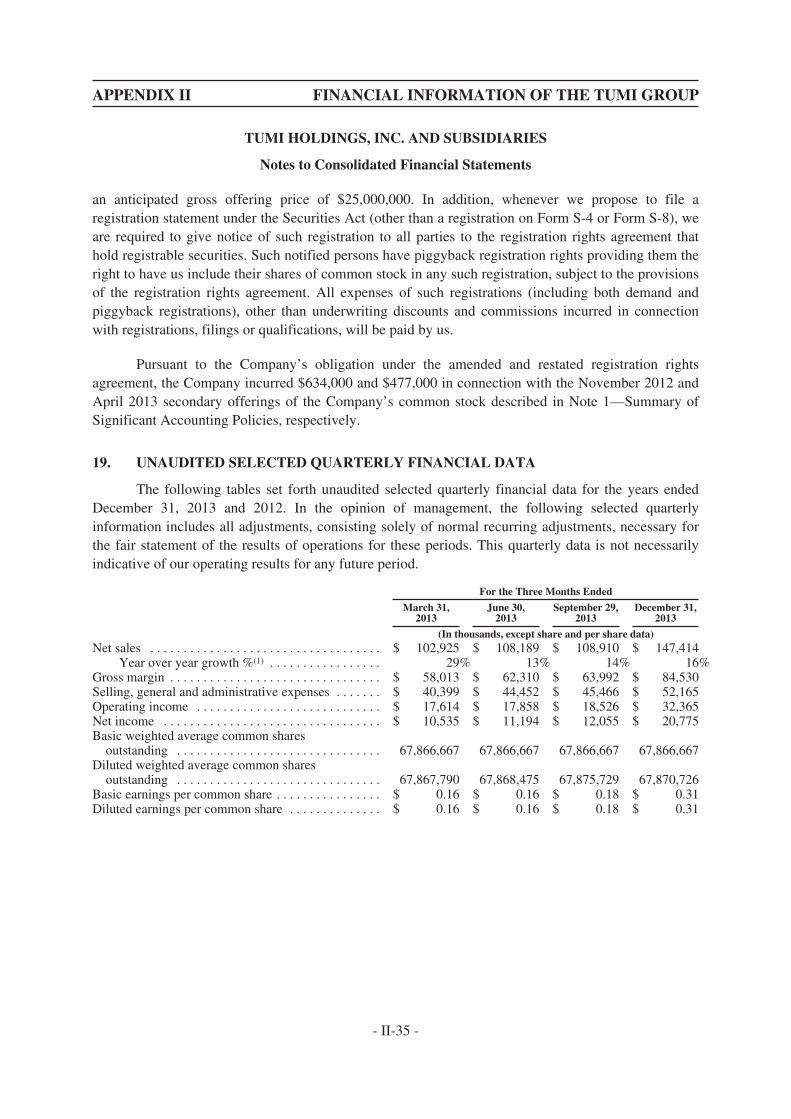
APPENDIX II FINANCIAL INFORMATION OF THE TUMI GROUP
TUMI HOLDINGS, INC. AND SUBSIDIARIES
Notes to Consolidated Financial Statements
an anticipated gross offering price of $25,000,000. In addition, whenever we propose to file aregistration statement under the Securities Act (other than a registration on Form S-4 or Form S-8), weare required to give notice of such registration to all parties to the registration rights agreement thathold registrable securities. Such notified persons have piggyback registration rights providing them theright to have us include their shares of common stock in any such registration, subject to the provisionsof the registration rights agreement. All expenses of such registrations (including both demand andpiggyback registrations), other than underwriting discounts and commissions incurred in connectionwith registrations, filings or qualifications, will be paid by us.
Pursuant to the Company’s obligation under the amended and restated registration rightsagreement, the Company incurred $634,000 and $477,000 in connection with the November 2012 andApril 2013 secondary offerings of the Company’s common stock described in Note 1—Summary ofSignificant Accounting Policies, respectively.
19. UNAUDITED SELECTED QUARTERLY FINANCIAL DATA
The following tables set forth unaudited selected quarterly financial data for the years endedDecember 31, 2013 and 2012. In the opinion of management, the following selected quarterlyinformation includes all adjustments, consisting solely of normal recurring adjustments, necessary forthe fair statement of the results of operations for these periods. This quarterly data is not necessarilyindicative of our operating results for any future period.
For the Three Months Ended
March 31,2013
June 30,2013
September 29,2013
December 31,2013
(In thousands, except share and per share data)Net sales . . . . . . . . . . . . . . . . . . . . . . . . . . . . . . . . . . . $ 102,925 $ 108,189 $ 108,910 $ 147,414
Year over year growth %(1) . . . . . . . . . . . . . . . . . 29% 13% 14% 16%Gross margin . . . . . . . . . . . . . . . . . . . . . . . . . . . . . . . . $ 58,013 $ 62,310 $ 63,992 $ 84,530Selling, general and administrative expenses . . . . . . . $ 40,399 $ 44,452 $ 45,466 $ 52,165Operating income . . . . . . . . . . . . . . . . . . . . . . . . . . . . $ 17,614 $ 17,858 $ 18,526 $ 32,365Net income . . . . . . . . . . . . . . . . . . . . . . . . . . . . . . . . . $ 10,535 $ 11,194 $ 12,055 $ 20,775Basic weighted average common shares
outstanding . . . . . . . . . . . . . . . . . . . . . . . . . . . . . . . 67,866,667 67,866,667 67,866,667 67,866,667Diluted weighted average common shares
outstanding . . . . . . . . . . . . . . . . . . . . . . . . . . . . . . . 67,867,790 67,868,475 67,875,729 67,870,726Basic earnings per common share . . . . . . . . . . . . . . . . $ 0.16 $ 0.16 $ 0.18 $ 0.31Diluted earnings per common share . . . . . . . . . . . . . . $ 0.16 $ 0.16 $ 0.18 $ 0.31
- II-35 -

APPENDIX II FINANCIAL INFORMATION OF THE TUMI GROUP
TUMI HOLDINGS, INC. AND SUBSIDIARIES
Notes to Consolidated Financial Statements
For the Three Months Ended
March 25,2012
June 24,2012
September 23,2012
December 31,2012
(In thousands, except per share data)Net sales . . . . . . . . . . . . . . . . . . . . . . . . . . . . . . . . . . . $ 80,021 $ 95,823 $ 95,860 $ 126,847
Year over year growth %(1) . . . . . . . . . . . . . . . . . 21% 22% 22% 19%Gross margin . . . . . . . . . . . . . . . . . . . . . . . . . . . . . . . . $ 45,405 $ 54,693 $ 55,175 $ 73,186Selling, general and administrative expenses . . . . . . . $ 32,129 $ 42,659 $ 37,925 $ 44,070Operating income . . . . . . . . . . . . . . . . . . . . . . . . . . . . $ 13,276 $ 12,034 $ 17,250 $ 29,116Net (loss) income . . . . . . . . . . . . . . . . . . . . . . . . . . . . $ 2,897 $ 6,485 $ 10,464 $ 16,937Basic weighted average common shares
outstanding(2) . . . . . . . . . . . . . . . . . . . . . . . . . . . . . . 52,536,224 63,838,736 67,866,667 67,866,667Diluted weighted average common shares
outstanding(2) . . . . . . . . . . . . . . . . . . . . . . . . . . . . . . 52,536,224 63,838,825 67,867,667 67,866,991Basic earnings per common share(2) . . . . . . . . . . . . . . $ 0.06 $ 0.10 $ 0.15 $ 0.25Diluted earnings per common share(2) . . . . . . . . . . . . . $ 0.06 $ 0.10 $ 0.15 $ 0.25Dividend expense on mandatorily redeemable
preferred stock and preferred equity interests . . . . . $ 6,286 $ 1,606 $ — $ —
(1) Year-over-year growth % compares net sales for a particular period with net sales for the comparable prior year interim period.(2) Gives effect to the 101.200929-for-1 common stock split effected on April 4, 2012 and the 1.037857-for-1 common stock split effective
April 19, 2012.
- II-36 -
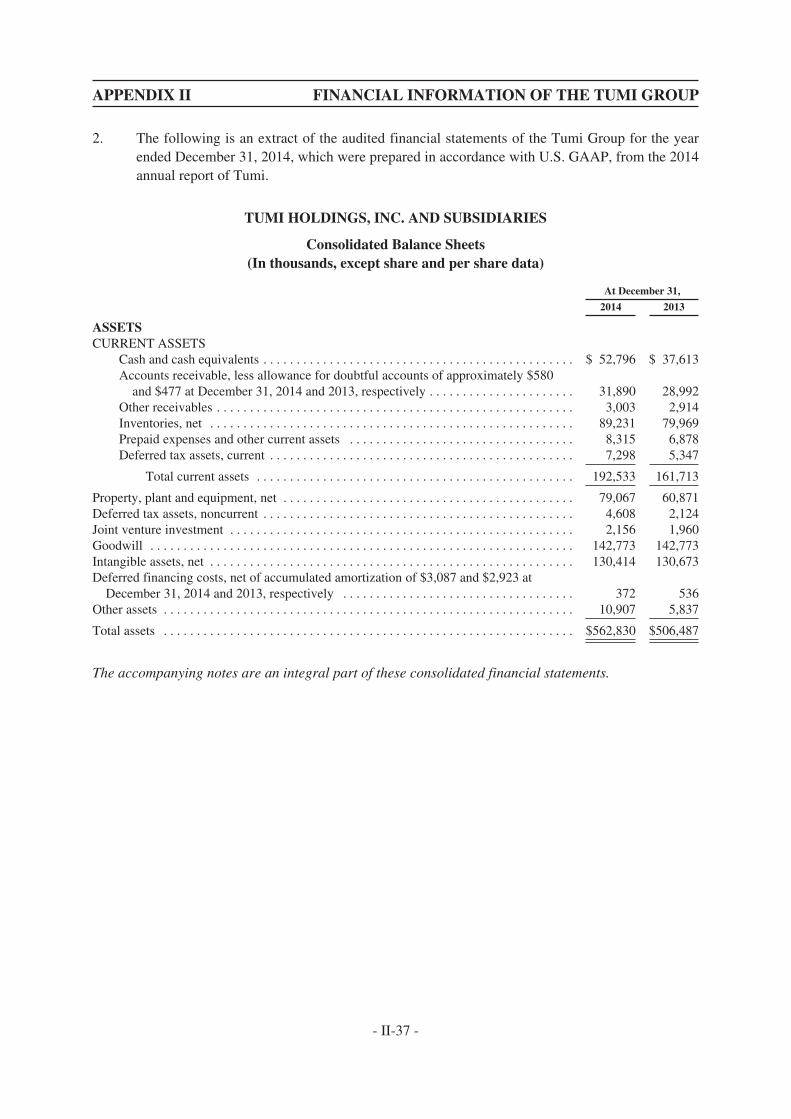
APPENDIX II FINANCIAL INFORMATION OF THE TUMI GROUP
2. The following is an extract of the audited financial statements of the Tumi Group for the yearended December 31, 2014, which were prepared in accordance with U.S. GAAP, from the 2014annual report of Tumi.
TUMI HOLDINGS, INC. AND SUBSIDIARIES
Consolidated Balance Sheets(In thousands, except share and per share data)
At December 31,
2014 2013
ASSETSCURRENT ASSETS
Cash and cash equivalents . . . . . . . . . . . . . . . . . . . . . . . . . . . . . . . . . . . . . . . . . . . . . . . $ 52,796 $ 37,613Accounts receivable, less allowance for doubtful accounts of approximately $580
and $477 at December 31, 2014 and 2013, respectively . . . . . . . . . . . . . . . . . . . . . . 31,890 28,992Other receivables . . . . . . . . . . . . . . . . . . . . . . . . . . . . . . . . . . . . . . . . . . . . . . . . . . . . . . 3,003 2,914Inventories, net . . . . . . . . . . . . . . . . . . . . . . . . . . . . . . . . . . . . . . . . . . . . . . . . . . . . . . . 89,231 79,969Prepaid expenses and other current assets . . . . . . . . . . . . . . . . . . . . . . . . . . . . . . . . . . 8,315 6,878Deferred tax assets, current . . . . . . . . . . . . . . . . . . . . . . . . . . . . . . . . . . . . . . . . . . . . . . 7,298 5,347
Total current assets . . . . . . . . . . . . . . . . . . . . . . . . . . . . . . . . . . . . . . . . . . . . . . . . 192,533 161,713
Property, plant and equipment, net . . . . . . . . . . . . . . . . . . . . . . . . . . . . . . . . . . . . . . . . . . . . 79,067 60,871Deferred tax assets, noncurrent . . . . . . . . . . . . . . . . . . . . . . . . . . . . . . . . . . . . . . . . . . . . . . . 4,608 2,124Joint venture investment . . . . . . . . . . . . . . . . . . . . . . . . . . . . . . . . . . . . . . . . . . . . . . . . . . . . 2,156 1,960Goodwill . . . . . . . . . . . . . . . . . . . . . . . . . . . . . . . . . . . . . . . . . . . . . . . . . . . . . . . . . . . . . . . . 142,773 142,773Intangible assets, net . . . . . . . . . . . . . . . . . . . . . . . . . . . . . . . . . . . . . . . . . . . . . . . . . . . . . . . 130,414 130,673Deferred financing costs, net of accumulated amortization of $3,087 and $2,923 at
December 31, 2014 and 2013, respectively . . . . . . . . . . . . . . . . . . . . . . . . . . . . . . . . . . . 372 536Other assets . . . . . . . . . . . . . . . . . . . . . . . . . . . . . . . . . . . . . . . . . . . . . . . . . . . . . . . . . . . . . . 10,907 5,837
Total assets . . . . . . . . . . . . . . . . . . . . . . . . . . . . . . . . . . . . . . . . . . . . . . . . . . . . . . . . . . . . . . $562,830 $506,487
The accompanying notes are an integral part of these consolidated financial statements.
- II-37 -
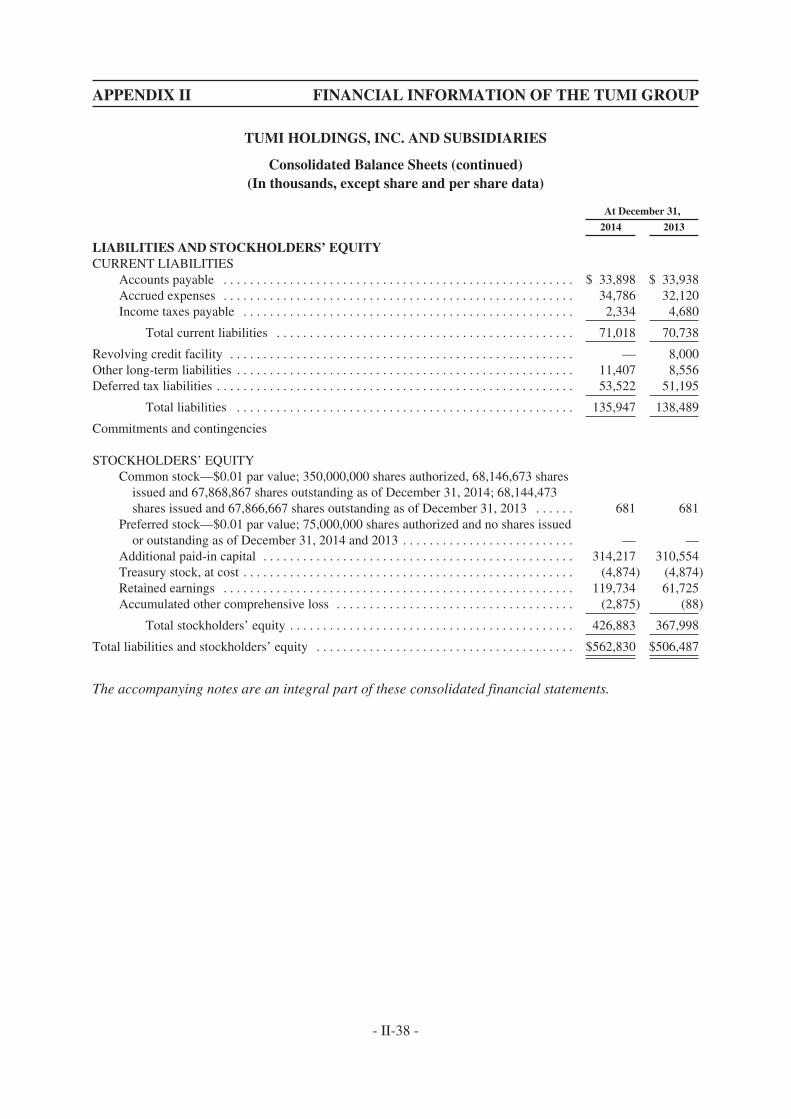
APPENDIX II FINANCIAL INFORMATION OF THE TUMI GROUP
TUMI HOLDINGS, INC. AND SUBSIDIARIES
Consolidated Balance Sheets (continued)(In thousands, except share and per share data)
At December 31,
2014 2013
LIABILITIES AND STOCKHOLDERS’ EQUITYCURRENT LIABILITIES
Accounts payable . . . . . . . . . . . . . . . . . . . . . . . . . . . . . . . . . . . . . . . . . . . . . . . . . . . . . $ 33,898 $ 33,938Accrued expenses . . . . . . . . . . . . . . . . . . . . . . . . . . . . . . . . . . . . . . . . . . . . . . . . . . . . . 34,786 32,120Income taxes payable . . . . . . . . . . . . . . . . . . . . . . . . . . . . . . . . . . . . . . . . . . . . . . . . . . 2,334 4,680
Total current liabilities . . . . . . . . . . . . . . . . . . . . . . . . . . . . . . . . . . . . . . . . . . . . . 71,018 70,738
Revolving credit facility . . . . . . . . . . . . . . . . . . . . . . . . . . . . . . . . . . . . . . . . . . . . . . . . . . . . — 8,000Other long-term liabilities . . . . . . . . . . . . . . . . . . . . . . . . . . . . . . . . . . . . . . . . . . . . . . . . . . . 11,407 8,556Deferred tax liabilities . . . . . . . . . . . . . . . . . . . . . . . . . . . . . . . . . . . . . . . . . . . . . . . . . . . . . . 53,522 51,195
Total liabilities . . . . . . . . . . . . . . . . . . . . . . . . . . . . . . . . . . . . . . . . . . . . . . . . . . . 135,947 138,489
Commitments and contingencies
STOCKHOLDERS’ EQUITYCommon stock—$0.01 par value; 350,000,000 shares authorized, 68,146,673 shares
issued and 67,868,867 shares outstanding as of December 31, 2014; 68,144,473shares issued and 67,866,667 shares outstanding as of December 31, 2013 . . . . . . 681 681
Preferred stock—$0.01 par value; 75,000,000 shares authorized and no shares issuedor outstanding as of December 31, 2014 and 2013 . . . . . . . . . . . . . . . . . . . . . . . . . . — —
Additional paid-in capital . . . . . . . . . . . . . . . . . . . . . . . . . . . . . . . . . . . . . . . . . . . . . . . 314,217 310,554Treasury stock, at cost . . . . . . . . . . . . . . . . . . . . . . . . . . . . . . . . . . . . . . . . . . . . . . . . . . (4,874) (4,874)Retained earnings . . . . . . . . . . . . . . . . . . . . . . . . . . . . . . . . . . . . . . . . . . . . . . . . . . . . . 119,734 61,725Accumulated other comprehensive loss . . . . . . . . . . . . . . . . . . . . . . . . . . . . . . . . . . . . (2,875) (88)
Total stockholders’ equity . . . . . . . . . . . . . . . . . . . . . . . . . . . . . . . . . . . . . . . . . . . 426,883 367,998
Total liabilities and stockholders’ equity . . . . . . . . . . . . . . . . . . . . . . . . . . . . . . . . . . . . . . . $562,830 $506,487
The accompanying notes are an integral part of these consolidated financial statements.
- II-38 -
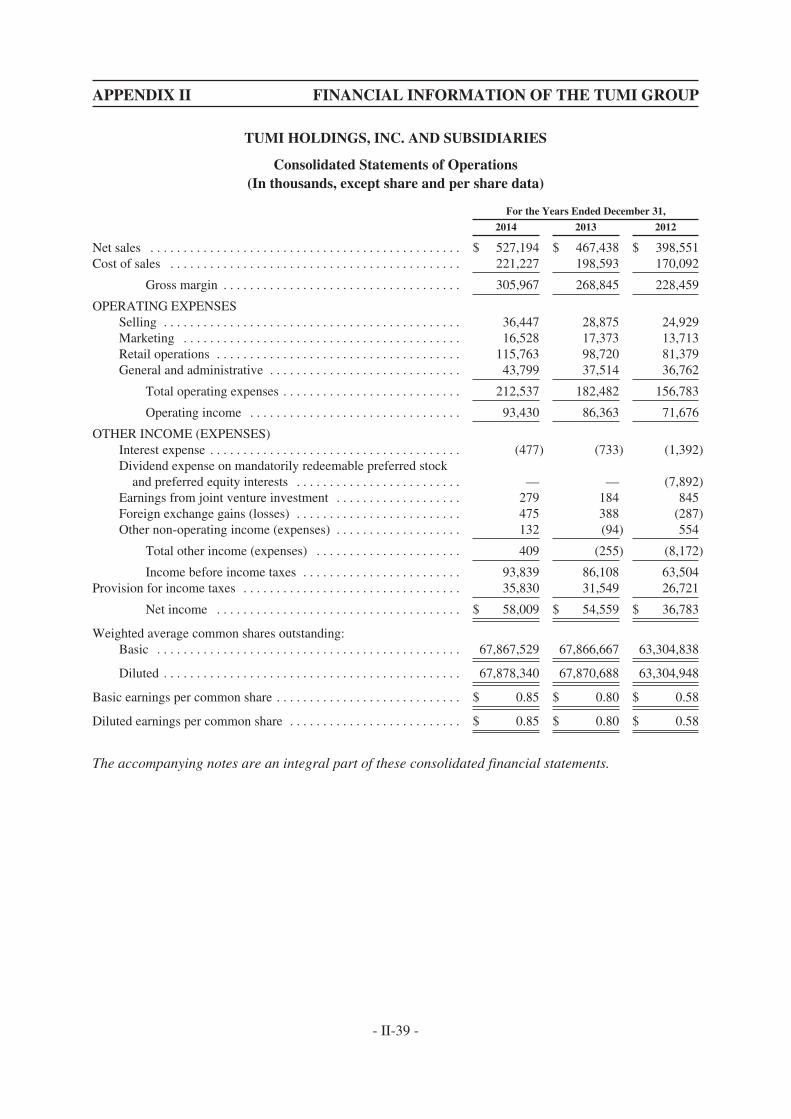
APPENDIX II FINANCIAL INFORMATION OF THE TUMI GROUP
TUMI HOLDINGS, INC. AND SUBSIDIARIES
Consolidated Statements of Operations(In thousands, except share and per share data)
For the Years Ended December 31,
2014 2013 2012
Net sales . . . . . . . . . . . . . . . . . . . . . . . . . . . . . . . . . . . . . . . . . . . . . . . $ 527,194 $ 467,438 $ 398,551Cost of sales . . . . . . . . . . . . . . . . . . . . . . . . . . . . . . . . . . . . . . . . . . . . 221,227 198,593 170,092
Gross margin . . . . . . . . . . . . . . . . . . . . . . . . . . . . . . . . . . . . 305,967 268,845 228,459
OPERATING EXPENSESSelling . . . . . . . . . . . . . . . . . . . . . . . . . . . . . . . . . . . . . . . . . . . . . 36,447 28,875 24,929Marketing . . . . . . . . . . . . . . . . . . . . . . . . . . . . . . . . . . . . . . . . . . 16,528 17,373 13,713Retail operations . . . . . . . . . . . . . . . . . . . . . . . . . . . . . . . . . . . . . 115,763 98,720 81,379General and administrative . . . . . . . . . . . . . . . . . . . . . . . . . . . . . 43,799 37,514 36,762
Total operating expenses . . . . . . . . . . . . . . . . . . . . . . . . . . . 212,537 182,482 156,783
Operating income . . . . . . . . . . . . . . . . . . . . . . . . . . . . . . . . 93,430 86,363 71,676
OTHER INCOME (EXPENSES)Interest expense . . . . . . . . . . . . . . . . . . . . . . . . . . . . . . . . . . . . . . (477) (733) (1,392)Dividend expense on mandatorily redeemable preferred stock
and preferred equity interests . . . . . . . . . . . . . . . . . . . . . . . . . — — (7,892)Earnings from joint venture investment . . . . . . . . . . . . . . . . . . . 279 184 845Foreign exchange gains (losses) . . . . . . . . . . . . . . . . . . . . . . . . . 475 388 (287)Other non-operating income (expenses) . . . . . . . . . . . . . . . . . . . 132 (94) 554
Total other income (expenses) . . . . . . . . . . . . . . . . . . . . . . 409 (255) (8,172)
Income before income taxes . . . . . . . . . . . . . . . . . . . . . . . . 93,839 86,108 63,504Provision for income taxes . . . . . . . . . . . . . . . . . . . . . . . . . . . . . . . . . 35,830 31,549 26,721
Net income . . . . . . . . . . . . . . . . . . . . . . . . . . . . . . . . . . . . . $ 58,009 $ 54,559 $ 36,783
Weighted average common shares outstanding:Basic . . . . . . . . . . . . . . . . . . . . . . . . . . . . . . . . . . . . . . . . . . . . . . 67,867,529 67,866,667 63,304,838
Diluted . . . . . . . . . . . . . . . . . . . . . . . . . . . . . . . . . . . . . . . . . . . . . 67,878,340 67,870,688 63,304,948
Basic earnings per common share . . . . . . . . . . . . . . . . . . . . . . . . . . . . $ 0.85 $ 0.80 $ 0.58
Diluted earnings per common share . . . . . . . . . . . . . . . . . . . . . . . . . . $ 0.85 $ 0.80 $ 0.58
The accompanying notes are an integral part of these consolidated financial statements.
- II-39 -

APPENDIX II FINANCIAL INFORMATION OF THE TUMI GROUP
TUMI HOLDINGS, INC. AND SUBSIDIARIES
Consolidated Statements of Comprehensive Income(In thousands)
For the Years Ended December 31,
2014 2013 2012
Net income . . . . . . . . . . . . . . . . . . . . . . . . . . . . . . . . . . . . . . . . . . . . . . . . . . . . . $58,009 $54,559 $36,783OTHER COMPREHENSIVE INCOME
Foreign currency translation adjustment, net of tax . . . . . . . . . . . . . . . . . . (2,787) 345 552
Comprehensive income . . . . . . . . . . . . . . . . . . . . . . . . . . . . . . . . . . . $55,222 $54,904 $37,335
The accompanying notes are an integral part of these consolidated financial statements.
- II-40 -
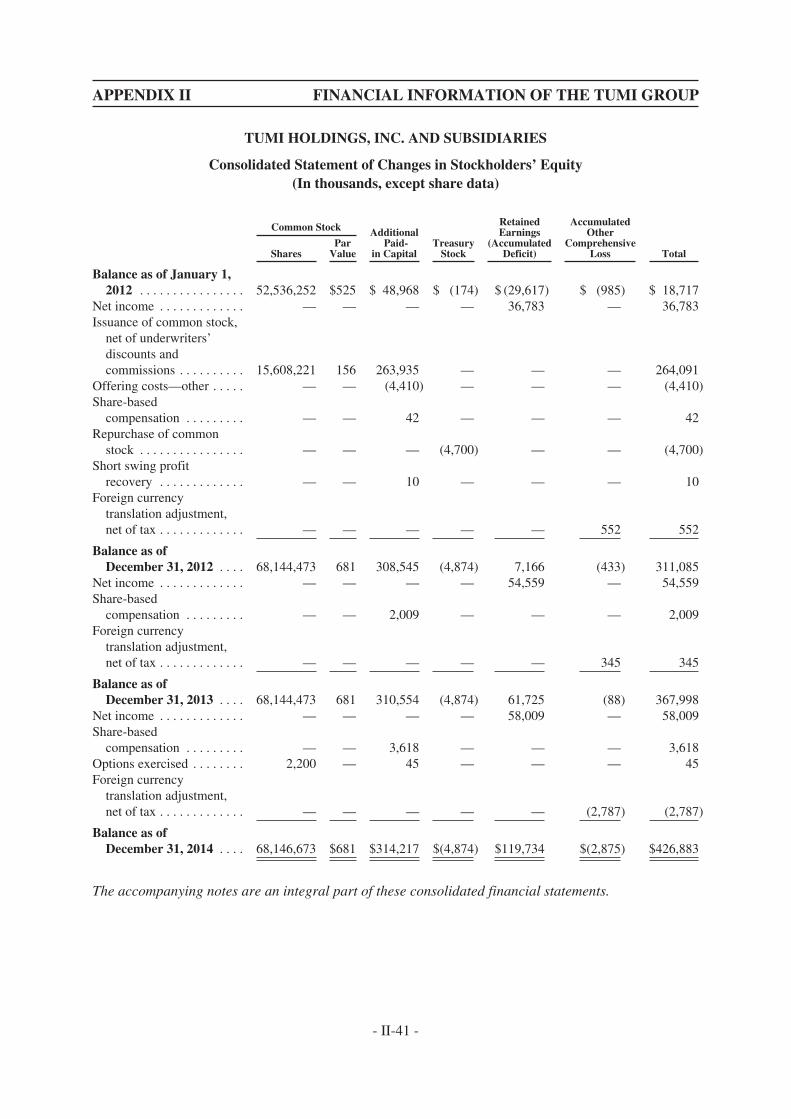
APPENDIX II FINANCIAL INFORMATION OF THE TUMI GROUP
TUMI HOLDINGS, INC. AND SUBSIDIARIES
Consolidated Statement of Changes in Stockholders’ Equity(In thousands, except share data)
Common Stock AdditionalPaid-
in CapitalTreasury
Stock
RetainedEarnings
(AccumulatedDeficit)
AccumulatedOther
ComprehensiveLoss TotalShares
ParValue
Balance as of January 1,2012 . . . . . . . . . . . . . . . . 52,536,252 $525 $ 48,968 $ (174) $ (29,617) $ (985) $ 18,717
Net income . . . . . . . . . . . . . — — — — 36,783 — 36,783Issuance of common stock,
net of underwriters’discounts andcommissions . . . . . . . . . . 15,608,221 156 263,935 — — — 264,091
Offering costs—other . . . . . — — (4,410) — — — (4,410)Share-based
compensation . . . . . . . . . — — 42 — — — 42Repurchase of common
stock . . . . . . . . . . . . . . . . — — — (4,700) — — (4,700)Short swing profit
recovery . . . . . . . . . . . . . — — 10 — — — 10Foreign currency
translation adjustment,net of tax . . . . . . . . . . . . . — — — — — 552 552
Balance as ofDecember 31, 2012 . . . . 68,144,473 681 308,545 (4,874) 7,166 (433) 311,085
Net income . . . . . . . . . . . . . — — — — 54,559 — 54,559Share-based
compensation . . . . . . . . . — — 2,009 — — — 2,009Foreign currency
translation adjustment,net of tax . . . . . . . . . . . . . — — — — — 345 345
Balance as ofDecember 31, 2013 . . . . 68,144,473 681 310,554 (4,874) 61,725 (88) 367,998
Net income . . . . . . . . . . . . . — — — — 58,009 — 58,009Share-based
compensation . . . . . . . . . — — 3,618 — — — 3,618Options exercised . . . . . . . . 2,200 — 45 — — — 45Foreign currency
translation adjustment,net of tax . . . . . . . . . . . . . — — — — — (2,787) (2,787)
Balance as ofDecember 31, 2014 . . . . 68,146,673 $681 $314,217 $(4,874) $119,734 $(2,875) $426,883
The accompanying notes are an integral part of these consolidated financial statements.
- II-41 -

APPENDIX II FINANCIAL INFORMATION OF THE TUMI GROUP
TUMI HOLDINGS, INC. AND SUBSIDIARIES
Consolidated Statements of Cash Flows(In thousands)
For the Years Ended December 31,
2014 2013 2012
CASH FLOWS FROM OPERATING ACTIVITIESNet income . . . . . . . . . . . . . . . . . . . . . . . . . . . . . . . . . . . . . . . . . . . . . . . . . . $ 58,009 $ 54,559 $ 36,783Adjustments to reconcile net income to net cash provided by operating
activitiesDeferred income tax benefit . . . . . . . . . . . . . . . . . . . . . . . . . . . . . . . . . (86) 483 (698)Depreciation and amortization . . . . . . . . . . . . . . . . . . . . . . . . . . . . . . . 18,156 14,187 11,504Share-based compensation expense . . . . . . . . . . . . . . . . . . . . . . . . . . . 3,618 2,009 42Amortization of deferred financing costs . . . . . . . . . . . . . . . . . . . . . . . 164 165 218Allowance for doubtful accounts . . . . . . . . . . . . . . . . . . . . . . . . . . . . . (103) 137 (122)Earnings from joint venture . . . . . . . . . . . . . . . . . . . . . . . . . . . . . . . . . (279) (184) (845)Loss on disposal of fixed assets . . . . . . . . . . . . . . . . . . . . . . . . . . . . . . 1,096 261 422Dividend expense on mandatorily redeemable preferred stock and
preferred equity interests . . . . . . . . . . . . . . . . . . . . . . . . . . . . . . . . . — — 7,892Other non-cash charges . . . . . . . . . . . . . . . . . . . . . . . . . . . . . . . . . . . . 350 482 742Changes in operating assets and liabilities
Accounts receivable . . . . . . . . . . . . . . . . . . . . . . . . . . . . . . . . . . . (5,328) (7,882) 1,638Other receivables . . . . . . . . . . . . . . . . . . . . . . . . . . . . . . . . . . . . . (220) (1,213) 70Inventories . . . . . . . . . . . . . . . . . . . . . . . . . . . . . . . . . . . . . . . . . . (10,843) (8,773) (10,290)Prepaid expenses and other current assets . . . . . . . . . . . . . . . . . . (1,566) (3,606) (167)Other assets . . . . . . . . . . . . . . . . . . . . . . . . . . . . . . . . . . . . . . . . . (6,070) (861) 1,005Prepaid income taxes . . . . . . . . . . . . . . . . . . . . . . . . . . . . . . . . . . 2,334 384 (384)Accounts payable . . . . . . . . . . . . . . . . . . . . . . . . . . . . . . . . . . . . . 91 6,525 50Accrued expenses . . . . . . . . . . . . . . . . . . . . . . . . . . . . . . . . . . . . . 2,830 606 3,914Income tax payable . . . . . . . . . . . . . . . . . . . . . . . . . . . . . . . . . . . . (4,565) 4,680 (4,336)Other liabilities . . . . . . . . . . . . . . . . . . . . . . . . . . . . . . . . . . . . . . . 2,946 1,257 1,002
Total adjustments . . . . . . . . . . . . . . . . . . . . . . . . . . . . . . . . . 2,525 8,657 11,657
Net cash provided by operating activities . . . . . . . . . . . . . . 60,534 63,216 48,440
CASH FLOWS FROM INVESTING ACTIVITIESCapital expenditures . . . . . . . . . . . . . . . . . . . . . . . . . . . . . . . . . . . . . . . . . . . (36,576) (25,440) (21,286)
Net cash used in investing activities . . . . . . . . . . . . . . . . . . (36,576) (25,440) (21,286)
The accompanying notes are an integral part of these consolidated financial statements.
- II-42 -
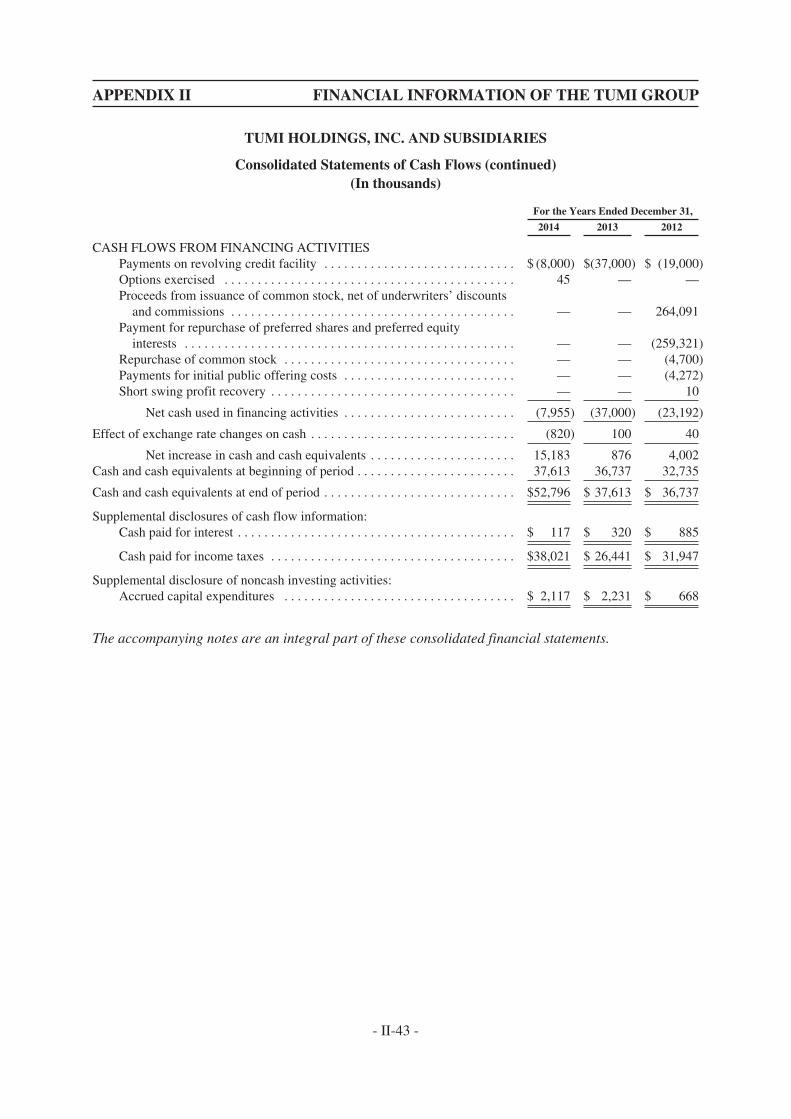
APPENDIX II FINANCIAL INFORMATION OF THE TUMI GROUP
TUMI HOLDINGS, INC. AND SUBSIDIARIES
Consolidated Statements of Cash Flows (continued)(In thousands)
For the Years Ended December 31,
2014 2013 2012
CASH FLOWS FROM FINANCING ACTIVITIESPayments on revolving credit facility . . . . . . . . . . . . . . . . . . . . . . . . . . . . . $ (8,000) $(37,000) $ (19,000)Options exercised . . . . . . . . . . . . . . . . . . . . . . . . . . . . . . . . . . . . . . . . . . . . 45 — —Proceeds from issuance of common stock, net of underwriters’ discounts
and commissions . . . . . . . . . . . . . . . . . . . . . . . . . . . . . . . . . . . . . . . . . . . — — 264,091Payment for repurchase of preferred shares and preferred equity
interests . . . . . . . . . . . . . . . . . . . . . . . . . . . . . . . . . . . . . . . . . . . . . . . . . . — — (259,321)Repurchase of common stock . . . . . . . . . . . . . . . . . . . . . . . . . . . . . . . . . . . — — (4,700)Payments for initial public offering costs . . . . . . . . . . . . . . . . . . . . . . . . . . — — (4,272)Short swing profit recovery . . . . . . . . . . . . . . . . . . . . . . . . . . . . . . . . . . . . . — — 10
Net cash used in financing activities . . . . . . . . . . . . . . . . . . . . . . . . . . (7,955) (37,000) (23,192)
Effect of exchange rate changes on cash . . . . . . . . . . . . . . . . . . . . . . . . . . . . . . . (820) 100 40
Net increase in cash and cash equivalents . . . . . . . . . . . . . . . . . . . . . . 15,183 876 4,002Cash and cash equivalents at beginning of period . . . . . . . . . . . . . . . . . . . . . . . . 37,613 36,737 32,735
Cash and cash equivalents at end of period . . . . . . . . . . . . . . . . . . . . . . . . . . . . . $52,796 $ 37,613 $ 36,737
Supplemental disclosures of cash flow information:Cash paid for interest . . . . . . . . . . . . . . . . . . . . . . . . . . . . . . . . . . . . . . . . . . $ 117 $ 320 $ 885
Cash paid for income taxes . . . . . . . . . . . . . . . . . . . . . . . . . . . . . . . . . . . . . $38,021 $ 26,441 $ 31,947
Supplemental disclosure of noncash investing activities:Accrued capital expenditures . . . . . . . . . . . . . . . . . . . . . . . . . . . . . . . . . . . $ 2,117 $ 2,231 $ 668
The accompanying notes are an integral part of these consolidated financial statements.
- II-43 -
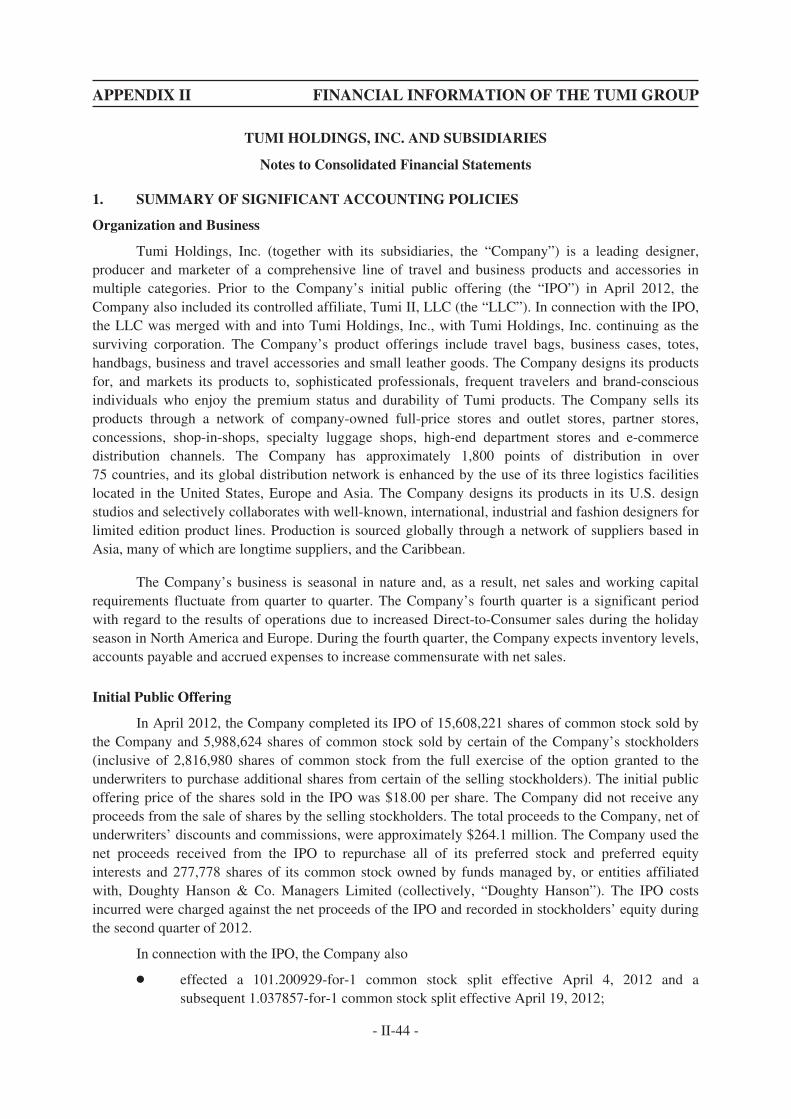
APPENDIX II FINANCIAL INFORMATION OF THE TUMI GROUP
TUMI HOLDINGS, INC. AND SUBSIDIARIES
Notes to Consolidated Financial Statements
1. SUMMARY OF SIGNIFICANT ACCOUNTING POLICIES
Organization and Business
Tumi Holdings, Inc. (together with its subsidiaries, the “Company”) is a leading designer,producer and marketer of a comprehensive line of travel and business products and accessories inmultiple categories. Prior to the Company’s initial public offering (the “IPO”) in April 2012, theCompany also included its controlled affiliate, Tumi II, LLC (the “LLC”). In connection with the IPO,the LLC was merged with and into Tumi Holdings, Inc., with Tumi Holdings, Inc. continuing as thesurviving corporation. The Company’s product offerings include travel bags, business cases, totes,handbags, business and travel accessories and small leather goods. The Company designs its productsfor, and markets its products to, sophisticated professionals, frequent travelers and brand-consciousindividuals who enjoy the premium status and durability of Tumi products. The Company sells itsproducts through a network of company-owned full-price stores and outlet stores, partner stores,concessions, shop-in-shops, specialty luggage shops, high-end department stores and e-commercedistribution channels. The Company has approximately 1,800 points of distribution in over75 countries, and its global distribution network is enhanced by the use of its three logistics facilitieslocated in the United States, Europe and Asia. The Company designs its products in its U.S. designstudios and selectively collaborates with well-known, international, industrial and fashion designers forlimited edition product lines. Production is sourced globally through a network of suppliers based inAsia, many of which are longtime suppliers, and the Caribbean.
The Company’s business is seasonal in nature and, as a result, net sales and working capitalrequirements fluctuate from quarter to quarter. The Company’s fourth quarter is a significant periodwith regard to the results of operations due to increased Direct-to-Consumer sales during the holidayseason in North America and Europe. During the fourth quarter, the Company expects inventory levels,accounts payable and accrued expenses to increase commensurate with net sales.
Initial Public Offering
In April 2012, the Company completed its IPO of 15,608,221 shares of common stock sold bythe Company and 5,988,624 shares of common stock sold by certain of the Company’s stockholders(inclusive of 2,816,980 shares of common stock from the full exercise of the option granted to theunderwriters to purchase additional shares from certain of the selling stockholders). The initial publicoffering price of the shares sold in the IPO was $18.00 per share. The Company did not receive anyproceeds from the sale of shares by the selling stockholders. The total proceeds to the Company, net ofunderwriters’ discounts and commissions, were approximately $264.1 million. The Company used thenet proceeds received from the IPO to repurchase all of its preferred stock and preferred equityinterests and 277,778 shares of its common stock owned by funds managed by, or entities affiliatedwith, Doughty Hanson & Co. Managers Limited (collectively, “Doughty Hanson”). The IPO costsincurred were charged against the net proceeds of the IPO and recorded in stockholders’ equity duringthe second quarter of 2012.
In connection with the IPO, the Company also
Š effected a 101.200929-for-1 common stock split effective April 4, 2012 and asubsequent 1.037857-for-1 common stock split effective April 19, 2012;
- II-44 -
APPENDIX II FINANCIAL INFORMATION OF THE TUMI GROUP
TUMI HOLDINGS, INC. AND SUBSIDIARIES
Notes to Consolidated Financial Statements
Š merged the LLC with and into Tumi Holdings, Inc., with Tumi Holdings, Inc.continuing as the surviving corporation, and cancelled all common interests in the LLC;
Š increased its authorized shares of common stock to 350,000,000 and authorized75,000,000 shares of preferred stock;
Š entered into an amended and restated credit facility effective April 4, 2012;
Š paid a one-time special bonus of $5,511,693 to its CEO, which was expensed by theCompany in the second quarter of 2012; and
Š adopted its 2012 Long-Term Incentive Plan (the “2012 Plan”).
Registered Secondary Offerings of the Company’s Common Stock
In November 2012, the Company completed a secondary offering of common stock sold bycertain of the Company’s stockholders. The selling stockholders, which included certain of theCompany’s officers, sold 11,375,975 shares of our common stock in the offering (inclusive of1,275,975 shares of common stock from the partial exercise of the option granted to the underwriters topurchase additional shares from certain of the selling stockholders). The Company did not receive anyproceeds from the sale of shares by the selling stockholders. The offering expenses incurred by theCompany were approximately $634,000, which included legal and accounting costs and various otherfees associated with the offering.
In April 2013, the Company completed an additional secondary offering of common stock soldby certain of the Company’s stockholders. The selling stockholders, which included certain of theCompany’s officers, sold 11,661,000 shares of our common stock in the offering (inclusive of1,521,000 shares of common stock from the full exercise of the option granted to the underwriters topurchase additional shares from certain of the selling stockholders). The Company did not receive anyproceeds from the sale of shares by the selling stockholders. The offering expenses incurred by theCompany were approximately $477,000, which included legal and accounting costs and various otherfees associated with the offering.
In September 2014, the Company completed an additional secondary offering of common stocksold by certain of the Company’s stockholders. The selling stockholders, comprised of funds managedby, or affiliated with, Doughty Hanson sold 8,000,000 shares of our common stock in the offering. TheCompany did not receive any proceeds from the sale of shares by the selling stockholders. The offeringexpenses incurred by the Company were approximately $196,000, which included legal andaccounting costs and various other fees associated with the offering.
Principles of Consolidation
The consolidated financial statements of the Company include the accounts of Tumi Holdings,Inc. and its subsidiaries. Intercompany accounts and transactions have been eliminated inconsolidation.
The Company uses the equity method of accounting for its joint venture investment, which is50% owned, as the Company has the ability to exercise significant influence over the operating and
- II-45 -
APPENDIX II FINANCIAL INFORMATION OF THE TUMI GROUP
TUMI HOLDINGS, INC. AND SUBSIDIARIES
Notes to Consolidated Financial Statements
financial policies of the joint venture but does not control the joint venture. The Company’s share ofthe earnings or losses of the joint venture is included in the Consolidated Statements of Operations as“Earnings from Joint Venture Investment.”
Segment Reporting
The Company became subject to and adopted the provisions of the Financial AccountingStandards Board’s (the “FASB”) guidance for segment reporting in 2011. Segment information hasbeen provided on the basis of the Company’s four reportable segments for all periods presented (seeNote 15—Segment Information), which are: (i) Direct-to-Consumer North America; (ii) Indirect-to-Consumer North America; (iii) Direct-to-Consumer International; and (iv) Indirect-to-ConsumerInternational.
Estimates
The preparation of financial statements in conformity with accounting principles generallyaccepted in the United States of America requires management to make estimates and assumptions thataffect the reported amounts of assets and liabilities and disclosure of contingent assets and liabilities atthe date of the financial statements and the reported amounts of revenues and expenses during thereporting period. Significant estimates include valuation of goodwill and intangibles, allowance fordoubtful accounts, adjustments for slow-moving and obsolete inventory, accrued warranties,realization of deferred tax assets, income tax uncertainties, the valuation of share-based compensationand related forfeiture rates, and useful lives of assets. Actual results could differ materially from thoseestimates.
Reclassification
Certain prior period amounts have been reclassified to conform to the current year presentation.
Revenue Recognition
Revenue is generated from the sale of the Company’s products and is classified as “Net Sales”in the Company’s Consolidated Statements of Operations. The Company recognizes revenue in itsDirect-to-Consumer segment when inventory is received by the customer and the related title passes. Inthe Company’s Indirect-to-Consumer segment, revenue is recognized when inventory is in possessionof the wholesale customers or their appointed carriers, at which point the related title passes.Provisions for discounts, rebates to customers and returns are recorded as a reduction of revenue in thesame period as the related sales. Revenue associated with gift cards is recognized upon redemption.Revenue from gift cards and the amount of revenue recognized for gift cards not redeemed(“breakage”) is immaterial to these consolidated financial statements. Amounts billed to customers fordelivery costs are classified as a component of net sales and the related delivery costs are classified asa component of cost of sales. Sales and value added tax collected from customers and remitted togovernmental authorities are accounted for on a net basis and are excluded from net sales in theConsolidated Statements of Operations.
- II-46 -
APPENDIX II FINANCIAL INFORMATION OF THE TUMI GROUP
TUMI HOLDINGS, INC. AND SUBSIDIARIES
Notes to Consolidated Financial Statements
Cash and Cash Equivalents
The Company’s cash and cash equivalents are defined as cash and short-term highly liquidinvestments with an original maturity of three months or less from the date of purchase. TheCompany’s cash and cash equivalents consist of cash in banks as of December 31, 2014 and 2013.
Effective January 1, 2013, funds held in “noninterest-bearing transaction accounts” areaggregated with any interest-bearing accounts, and the combined total is insured up to a maximum of$250,000. The term “noninterest-bearing transaction account” includes a traditional checking accountor demand deposit account on which the insured depository institution pays no interest. The totalexcess of the bank account balances over the Federal Deposit Insurance Corporation (“ FDIC”) limiteffective at each period end was approximately $46,300,000 and $26,590,000 at December 31, 2014and 2013, respectively. The total cash in international bank accounts, which is not covered under theFDIC, was approximately $6,245,000 and $10,720,000 at December 31, 2014 and 2013, respectively.
Accounts Receivable and Allowance for Doubtful Accounts
Credit is extended to customers based on evaluation of a customer’s financial condition.Generally, collateral is not required. Accounts receivable are due within 30 days to 90 days and arestated at amounts due from customers net of an allowance for doubtful accounts. Accounts receivableoutstanding longer than the contractual payment terms are considered past due.
The Company determines its allowance for doubtful accounts by considering a number offactors, including the length of time trade receivables are past due, the Company’s previous losshistory, the customer’s current ability to pay its obligation and the condition of the general economyand the industry as a whole. The Company writes off accounts receivable when they becomeuncollectible, and payments subsequently received on such receivables are credited to the allowancefor doubtful accounts.
The following table summarizes the activity in the allowance for doubtful accounts for theyears ended December 31, 2014, 2013 and 2012:
For the Years Ended December 31,
2014 2013 2012
(In thousands)
Balance, beginning of year . . . . . . . . . . . . . . . . . . . . . . . . . . . . . . . . . . . . . . . . . $(477) $(340) $(462)Provision charged to expense . . . . . . . . . . . . . . . . . . . . . . . . . . . . . . . . . . . . . . . (119) (271) 34Amounts written off . . . . . . . . . . . . . . . . . . . . . . . . . . . . . . . . . . . . . . . . . . . . . . 16 134 88
Balance, end of year . . . . . . . . . . . . . . . . . . . . . . . . . . . . . . . . . . . . . . . . . . . . . . $(580) $(477) $(340)
Inventories
Inventories consist primarily of finished goods and are valued at the lower of cost ormarket. Cost is determined using the first-in, first-out method. Inventory includes material, labor,overhead, freight, and duty and is adjusted for slow-moving and obsolete inventory.
- II-47 -
APPENDIX II FINANCIAL INFORMATION OF THE TUMI GROUP
TUMI HOLDINGS, INC. AND SUBSIDIARIES
Notes to Consolidated Financial Statements
Property, Plant and Equipment
Property, plant and equipment are recorded at cost. Depreciation is calculated using thestraight-line method over the estimated useful lives of the assets. Leasehold improvements areamortized over the lesser of their estimated useful lives or the terms of the respective leases. Repairsand maintenance costs are expensed as incurred; major renewals or betterments are capitalized.
Long-Lived Assets
The Company reviews long-lived assets, such as property, plant and equipment and certainidentifiable intangibles with finite lives, for possible impairment whenever events or changes incircumstances indicate that the carrying amount of an asset may not be recoverable. Some factors theCompany considers important which could trigger an impairment review include: (i) significantunderperformance compared to expected historical or projected future operating results; (ii) significantchanges in the Company’s use of the acquired assets or the strategy for its overall business; and(iii) significant negative industry or economic trends. No impairment was recognized during the yearsended December 31, 2014, 2013 and 2012.
Deferred Financing Costs
The net balance of the costs incurred for obtaining debt financing was $372,000 and $536,000as of December 31, 2014 and 2013, respectively. The Company amortizes deferred financing costs tointerest expense over the lives of the related financing agreements. During the years endedDecember 31, 2014, 2013 and 2012, respectively, $164,000, $165,000 and $218,000 was amortized tointerest expense.
Offering Costs
In 2011, the Company commenced the process for its initial public offering of the shares of itscommon stock. The specific incremental costs directly attributable to the offering were initiallydeferred and recorded as “Deferred Offering Costs” in the consolidated balance sheet as ofDecember 31, 2011. The offering was completed in April 2012 and the deferred offering costs werecharged against the net proceeds of the IPO and recorded in stockholders’ equity during the secondquarter of 2012.
In November 2012, April 2013 and September 2014, the Company completed secondaryofferings of common stock sold by certain of the Company’s stockholders. The Company did not issueor sell any shares in the offerings or receive any proceeds from the sale of shares and the offeringexpenses incurred were expensed directly to operating expenses.
Goodwill and Intangible Assets
Goodwill represents the excess of the purchase price over the fair value of net assets acquired,including intangible assets. Indefinite-lived intangible assets consist of brand/trade name. Goodwilland brand/trade name are not being amortized in accordance with the provisions of the FASB’sguidance, which requires these assets to be tested for impairment annually and whenever events or
- II-48 -

APPENDIX II FINANCIAL INFORMATION OF THE TUMI GROUP
TUMI HOLDINGS, INC. AND SUBSIDIARIES
Notes to Consolidated Financial Statements
changes in circumstances indicate that the carrying value may not be recoverable. The Company’sannual impairment testing date is the first day of its fourth quarter. No impairment was recognized inthe years ended December 31, 2014, 2013 and 2012.
The quantitative goodwill impairment test, if necessary, is a two-step process. Under the first oftwo steps, the Company compares the fair value of a reporting unit to its carrying amount, includinggoodwill, to identify a potential impairment. If the fair value of the reporting unit is less than itscarrying value, an indication of goodwill impairment exists for such reporting unit and the enterprisemust perform step two of the impairment test to measure the impairment, if any. Under step two, animpairment loss is recognized for any excess of the carrying amount of the reporting unit’s goodwillover the implied fair value of that goodwill. The implied fair value of goodwill is determined byallocating the fair value of the reporting unit in a manner similar to a purchase price allocation: the fairvalue of the reporting unit is allocated to all of the assets and liabilities of that unit (including anyunrecognized intangible assets) and the residual fair value after this allocation is the implied fair valueof the reporting unit goodwill.
The Company uses techniques including discounted expected future cash flows (Level 3 input),or DCF, to test goodwill. Indefinite-lived intangible assets are tested for impairment through an incomeapproach known as the relief from royalty method. A discounted cash flow analysis calculates the fairvalue by estimating the after-tax cash flows attributable to a reporting unit or asset and thendiscounting the after-tax cash flows to a present value using a risk-adjusted discount rate. Assumptionsused in DCF and the relief from royalty method require the exercise of significant judgment includingjudgment about appropriate royalty rates, discount rates and terminal values, growth rates and theamount and timing of expected future cash flows. Although the Company believes the historicalassumptions and estimates made are reasonable and appropriate, different assumptions and estimatescould materially impact its reported financial results.
The Company’s reporting units for the purpose of goodwill impairment testing are thereportable business segments: (i) Direct-to-Consumer North America, (ii) Indirect-to-Consumer NorthAmerica, (iii) Direct-to-Consumer International and (iv) Indirect-to-Consumer International. Thereporting units were determined in accordance with the guidance on reportable segments in FASBASC 280-10-50-1. There is no discrete financial information available to the Company for itsoperations below its reportable business segments.
Share-Based Compensation
Share-based compensation represents the cost related to equity awards granted to employeesunder the 2012 Plan. The Company measures share-based compensation cost at the grant date based onthe estimated fair value of the award and recognizes the cost on a straight-line basis (net of estimatedforfeitures) over the vesting period. The Company estimates the fair value of stock options using theBlack-Scholes valuation model. All share-based compensation costs are recorded in cost of sales or thevarious operating expense lines in the consolidated statements of operations based on the employee’srespective function (see Note 17—Share-Based Compensation Plans and Awards).
- II-49 -

APPENDIX II FINANCIAL INFORMATION OF THE TUMI GROUP
TUMI HOLDINGS, INC. AND SUBSIDIARIES
Notes to Consolidated Financial Statements
Performance-based RSUs are awards denominated in units that are settled in shares of theCompany’s common stock upon vesting. The vesting of these units is subject to the employee’scontinuing employment and the Company’s achievement of certain performance goals during theapplicable vesting period. The fair value of performance-based RSUs is based on the fair value of theCompany’s common stock on the date of grant. Expense for performance-based RSUs is recognizedover the employees’ requisite service period when the attainment of the performance goal is deemedprobable.
Service-based RSUs have been granted to the Board of Directors and generally vest over aone-year period, subject to the director’s continuing service on the Board of Directors. The fair valueof service-based RSUs is based on the fair value of the Company’s common stock on the date of grant.
Fair Value Measurements
The Company applies the FASB’s guidance for “Fair Value Measurements.” Under thisstandard, fair value is defined as the price that would be received to sell an asset or paid to transfer aliability (i.e., the “exit price”) in an orderly transaction between market participants at the measurementdate.
In determining fair value, the Company uses various valuation approaches. The hierarchy ofthose valuation approaches is broken down into three levels based on the reliability of inputs asfollows:
Level 1— Inputs that are quoted prices in active markets for identical assets or liabilities that theCompany has the ability to access at the measurement date. An active market for the assetor liability is a market in which transactions for the asset or liability occur with sufficientfrequency and volume to provide pricing information on an ongoing basis. The valuationunder this approach does not entail a significant degree of judgment.
Level 2— Inputs, other than quoted prices included within Level 1, that are observable for the assetor liability, either directly or indirectly. Level 2 inputs include: quoted prices for similarassets or liabilities in active markets, inputs other than quoted prices that are observablefor the asset or liability (e.g., interest rates and yield curves observable at commonlyquoted intervals or current market) and contractual prices for the underlying financialinstrument, as well as other relevant economic measures.
Level 3— Inputs that are unobservable for the asset or liability. Unobservable inputs are used tomeasure fair value to the extent that observable inputs are not available, thereby allowingfor situations in which there is little, if any, market activity for the asset or liability at themeasurement date.
The Company’s non-financial assets which are subject to nonrecurring fair value measurementsinclude goodwill, intangible assets and property, plant and equipment. These assets are recorded atcarrying value. However, whenever events or changes in circumstances indicate that their carryingvalue may not be fully recoverable (or at least annually for goodwill and indefinite-lived intangible
- II-50 -
APPENDIX II FINANCIAL INFORMATION OF THE TUMI GROUP
TUMI HOLDINGS, INC. AND SUBSIDIARIES
Notes to Consolidated Financial Statements
assets), such assets are assessed for impairment and, if applicable, written down to and recorded at fairvalue. To measure fair value for such assets, the Company uses techniques including DCF.
The carrying amounts of cash and cash equivalents, accounts receivable and accounts payable,were reasonable estimates of their fair value as of December 31, 2014 and 2013. The Company’svariable interest rate credit facility (See Note 8—Credit Facilities) was paid in full during 2014. As ofDecember 31, 2013 the carrying amount was a reasonable estimate of its fair value. If measured at fairvalue in the financial statements, the Company’s variable interest rate credit facility would beclassified as Level 2 in the fair value hierarchy.
Income Taxes
The Company utilizes the asset and liability method of accounting for income taxes, underwhich deferred income taxes are recognized for the tax consequences of temporary differences byapplying enacted statutory tax rates applicable to future years to differences between the financialstatement carrying amounts and the tax basis of existing assets and liabilities. The effect on deferredtaxes of a change in tax rates is recognized in income in the period that includes the enactment date. Avaluation allowance is provided when it is more likely than not that some portion or all of the deferredtax assets will not be realized.
The Company applies the FASB’s provisions for uncertain tax positions. The Company utilizesthe two step process to determine the amount of recognized tax benefit. For tax positions meeting themore-likely-than-not threshold, the amount recognized in the consolidated financial statements is thelargest benefit that has a greater than 50% likelihood of being realized upon ultimate settlement withthe relevant tax authority. The Company recognizes interest and penalties associated with uncertain taxpositions as a component of income tax expense.
Foreign Currency Translation
The financial statements of the Company’s branch offices and subsidiaries in Europe aremeasured using a currency other than the U.S. dollar.
Assets and liabilities recorded in functional currencies other than U.S. dollars are translated intoU.S. dollars at the year-end rate of exchange. Revenues and expenses are translated at the averageexchange rates for the year. The resulting translation adjustments are charged or credited to othercomprehensive income.
Realized foreign currency transaction gains and losses on transactions denominated incurrencies other than the functional currency, such as those resulting from the settlement of receivablesand payables denominated in foreign currency, are included in the earnings of the current period in“Foreign Exchange Gains (Losses).”
Unrealized gains and losses on intercompany foreign currency transactions that are of along-term investment nature (that is settlement is not planned or anticipated in the foreseeable future)are recorded in other comprehensive income. Unrealized gains and losses on intercompany foreign
- II-51 -
APPENDIX II FINANCIAL INFORMATION OF THE TUMI GROUP
TUMI HOLDINGS, INC. AND SUBSIDIARIES
Notes to Consolidated Financial Statements
currency transactions for which settlement is anticipated are included in the determination of netincome. During the year ended December 31, 2014, the Company deemed $36,500,000 ofintercompany receivables from its German subsidiary to be permanently invested. Accordingly, theseamounts have been reclassified to contributed capital, reflecting the permanent nature of theinvestment.
Advertising Costs
The Company expenses advertising costs as incurred. Total advertising expenses, excludingcooperative advertising costs, included in operating expenses in the accompanying ConsolidatedStatements of Operations were approximately $7,935,000, $8,502,000 and $6,443,000 for the yearsended December 31, 2014, 2013 and 2012, respectively.
Cooperative Advertising Costs
The Company accounts for certain advertising costs in accordance with the FASB’s guidancefor “Customer Payments and Incentives,” ASC Topic 605-50. This standard provides guidance withrespect to the statement of operations classification of and the accounting for recognition andmeasurement of consideration given by a vendor to a customer, which includes sales incentive offerslabeled as discounts, coupons, rebates and free products or services as well as arrangements labeled asslotting fees, cooperative advertising and buy downs. As per the FASB’s guidance, the Companyrecords cooperative advertising costs in marketing expenses, as it receives a “separately identifiablebenefit in exchange for the consideration.” Additionally, the Company is able to establish the fair valueof the cooperative advertising costs from the information obtained from the retailer. Based on thisinformation, the Company has determined that the amount of consideration paid does not exceed thefair value of the benefit received. The Company recognized cooperative advertising expense ofapproximately $3,148,000, $3,234,000 and $2,619,000 as a marketing expense in the accompanyingConsolidated Statements of Operations for the years ended December 31, 2014, 2013 and 2012,respectively.
Store Preopening Expenses
Costs incurred prior to the opening of a new store are expensed as incurred.
Warranties
The Company provides its customers with a product warranty subsequent to the sale of itsproducts. The Company’s warranty policy provides for one year of worry-free service as well as anadditional warranty against manufacturers’ defects or flaws in construction for between two and fiveyears, depending on the product line. The Company recognizes estimated costs associated with thelimited warranty at the time of sale of its products. The warranty reserve is based on historicalexperience.
- II-52 -
APPENDIX II FINANCIAL INFORMATION OF THE TUMI GROUP
TUMI HOLDINGS, INC. AND SUBSIDIARIES
Notes to Consolidated Financial Statements
Treasury Stock
In the past, the Company has repurchased treasury stock. These treasury stock transactions havebeen recorded using the cost method.
Dividend Expense on Mandatorily Redeemable Preferred Stock and Preferred Equity Interests
Dividends accrued on the Company’s mandatorily redeemable preferred stock and preferredequity interests (see Note 12—Mandatorily Redeemable Preferred Stock and Preferred EquityInterests) are presented in other income (expenses) in the consolidated statements of operations for theyear ended December 31, 2012. All of the Company’s preferred stock and preferred equity interestswere repurchased at carrying value (inclusive of all accrued dividends) in connection with our IPO inApril 2012.
Earnings per Common Share
Basic earnings per common share is computed by dividing income available to commonstockholders by the weighted-average common shares outstanding for the period. Diluted earnings percommon share is computed on the basis of the weighted-average number of common sharesoutstanding plus the effect of dilutive potential common shares outstanding during the period using thetreasury stock method.
2. RECENTLY ISSUED ACCOUNTING PRONOUNCEMENTS
In July 2013, the FASB issued ASU No. 2013-11, “Income Taxes (Topic 740): Presentation ofan Unrecognized Tax Benefit When a Net Operating Loss Carryforward, a Similar Tax Loss, or a TaxCredit Carryforward exists.” This amended guidance requires an entity to present an unrecognized taxbenefit as a reduction of a deferred tax asset for a net operating loss carryforward, a similar tax loss ora tax credit carry forward. If an applicable deferred tax asset is not available or a company does notexpect to use the applicable deferred tax asset, the unrecognized tax benefit should be presented as aliability in the financial statements and should not be combined with an unrelated deferred tax asset.The new guidance is effective prospectively for fiscal years and interim periods beginning afterDecember 15, 2013, with early adoption permitted. The Company adopted the amended guidanceeffective January 1, 2014 and it did not have a material effect on its consolidated financial statements.
In May 2014, the FASB issued ASU No. 2014-09, “Revenue from Contracts with Customers(Topic 606)” which amended the existing accounting standards for revenue recognition. ASU 2014-09establishes principles for recognizing revenue upon the transfer of promised goods or services tocustomers, in an amount that reflects the expected consideration received in exchange for those goodsor services. It is effective for annual reporting periods beginning after December 15, 2016. Earlyadoption is not permitted. The amendments may be applied retrospectively to each prior periodpresented or retrospectively with the cumulative effect recognized as of the date of initial application.The Company is currently in the process of evaluating the impact of adoption of the ASU on itsconsolidated financial statements, but does not expect the impact to be material.
In June 2014, the FASB issued ASU 2014-12, “Accounting for Share-Based Payments Whenthe Terms of an Award Provide That a Performance Target Could Be Achieved after the Requisite
- II-53 -
APPENDIX II FINANCIAL INFORMATION OF THE TUMI GROUP
TUMI HOLDINGS, INC. AND SUBSIDIARIES
Notes to Consolidated Financial Statements
Service Period (Topic 718)”. ASU 2014-12 requires that a performance target that affects vesting andthat could be achieved after the requisite service period be treated as a performance condition. As such,the performance target should not be reflected in estimating the grant-date fair value of the award.ASU 2014-12 is effective for annual reporting periods beginning after December 15, 2015, with earlyadoption permitted. The Company is evaluating the potential impacts of the new standard on itsexisting share-based compensation plans, but does not expect the impact to be material.
3. INVENTORIES, NET
Inventories, net consist of the following:
At December 31,
2014 2013
(In thousands)
Raw materials . . . . . . . . . . . . . . . . . . . . . . . . . . . . . . . . . . . . . . . . . . . . . . . . . . . . . . . . . . . . . . $ 318 $ 367Finished goods . . . . . . . . . . . . . . . . . . . . . . . . . . . . . . . . . . . . . . . . . . . . . . . . . . . . . . . . . . . . . . 88,913 79,602
Total inventories, net . . . . . . . . . . . . . . . . . . . . . . . . . . . . . . . . . . . . . . . . . . . . . . . . . . . . . $89,231 $79,969
4. PROPERTY, PLANT AND EQUIPMENT, NET
Property, plant and equipment, net consists of the following:
At December 31,
2014 2013
(In thousands)Useful Life
Land . . . . . . . . . . . . . . . . . . . . . . . . . . . . . . . . . . . . . . . . . . . . . . . . . . . . . . . — $ 485 $ 485Buildings and improvements . . . . . . . . . . . . . . . . . . . . . . . . . . . . . . . . . . . . 25 years 5,395 5,066Leasehold and store enhancements . . . . . . . . . . . . . . . . . . . . . . . . . . . . . . . . 5 to 10 years 102,168 87,917Furniture, computers and equipment . . . . . . . . . . . . . . . . . . . . . . . . . . . . . . 3 to 5 years 18,673 17,011Capitalized software . . . . . . . . . . . . . . . . . . . . . . . . . . . . . . . . . . . . . . . . . . . 5 years 9,908 5,443Fixtures, dies and autos . . . . . . . . . . . . . . . . . . . . . . . . . . . . . . . . . . . . . . . . 3 to 5 years 19,994 17,196Construction in progress . . . . . . . . . . . . . . . . . . . . . . . . . . . . . . . . . . . . . . . . 5,590 5,926
162,213 139,044Less accumulated depreciation and amortization . . . . . . . . . . . . . . . . . . . . . (83,146) (78,173)
$ 79,067 $ 60,871
Depreciation and amortization expense on property, plant and equipment was $17,897,000,$13,914,000 and $11,231,000 for the years ended December 31, 2014, 2013 and 2012, respectively.
5. JOINT VENTURE
Tumi Japan
In June 2003, the Company entered into a Joint Venture Agreement (“JV Agreement”) withACE Co., Ltd. (“Ace”) and Itochu Corporation (“Itochu”) to form the Tumi Japan Joint Venture(“Tumi Japan”) and contributed $213,000 at inception. The purpose of Tumi Japan is to sell, promoteand distribute the Company’s products in Japan. As of December 31, 2014 and 2013, the Companyowned 50% of Tumi Japan.
- II-54 -
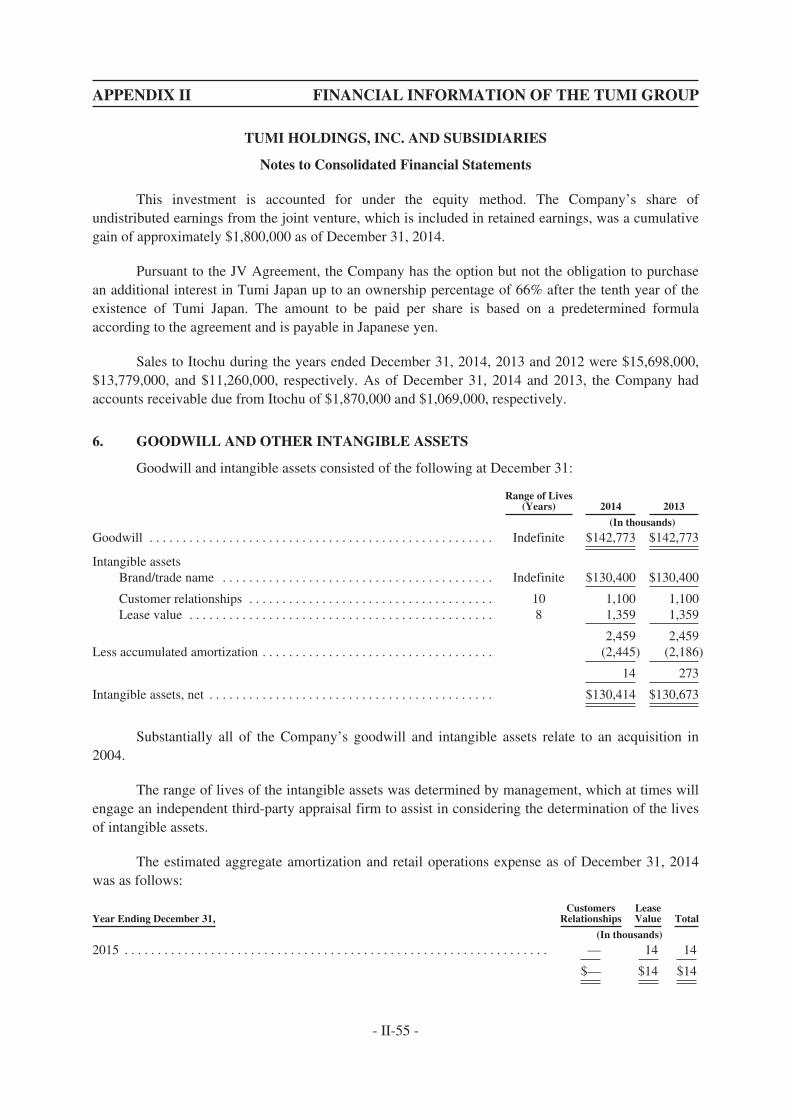
APPENDIX II FINANCIAL INFORMATION OF THE TUMI GROUP
TUMI HOLDINGS, INC. AND SUBSIDIARIES
Notes to Consolidated Financial Statements
This investment is accounted for under the equity method. The Company’s share ofundistributed earnings from the joint venture, which is included in retained earnings, was a cumulativegain of approximately $1,800,000 as of December 31, 2014.
Pursuant to the JV Agreement, the Company has the option but not the obligation to purchasean additional interest in Tumi Japan up to an ownership percentage of 66% after the tenth year of theexistence of Tumi Japan. The amount to be paid per share is based on a predetermined formulaaccording to the agreement and is payable in Japanese yen.
Sales to Itochu during the years ended December 31, 2014, 2013 and 2012 were $15,698,000,$13,779,000, and $11,260,000, respectively. As of December 31, 2014 and 2013, the Company hadaccounts receivable due from Itochu of $1,870,000 and $1,069,000, respectively.
6. GOODWILL AND OTHER INTANGIBLE ASSETS
Goodwill and intangible assets consisted of the following at December 31:
Range of Lives(Years) 2014 2013
(In thousands)
Goodwill . . . . . . . . . . . . . . . . . . . . . . . . . . . . . . . . . . . . . . . . . . . . . . . . . . . . Indefinite $142,773 $142,773
Intangible assetsBrand/trade name . . . . . . . . . . . . . . . . . . . . . . . . . . . . . . . . . . . . . . . . . Indefinite $130,400 $130,400
Customer relationships . . . . . . . . . . . . . . . . . . . . . . . . . . . . . . . . . . . . . 10 1,100 1,100Lease value . . . . . . . . . . . . . . . . . . . . . . . . . . . . . . . . . . . . . . . . . . . . . . 8 1,359 1,359
2,459 2,459Less accumulated amortization . . . . . . . . . . . . . . . . . . . . . . . . . . . . . . . . . . . (2,445) (2,186)
14 273
Intangible assets, net . . . . . . . . . . . . . . . . . . . . . . . . . . . . . . . . . . . . . . . . . . . $130,414 $130,673
Substantially all of the Company’s goodwill and intangible assets relate to an acquisition in2004.
The range of lives of the intangible assets was determined by management, which at times willengage an independent third-party appraisal firm to assist in considering the determination of the livesof intangible assets.
The estimated aggregate amortization and retail operations expense as of December 31, 2014was as follows:
Year Ending December 31,Customers
RelationshipsLeaseValue Total
(In thousands)
2015 . . . . . . . . . . . . . . . . . . . . . . . . . . . . . . . . . . . . . . . . . . . . . . . . . . . . . . . . . . . . . . . . — 14 14
$— $14 $14
- II-55 -
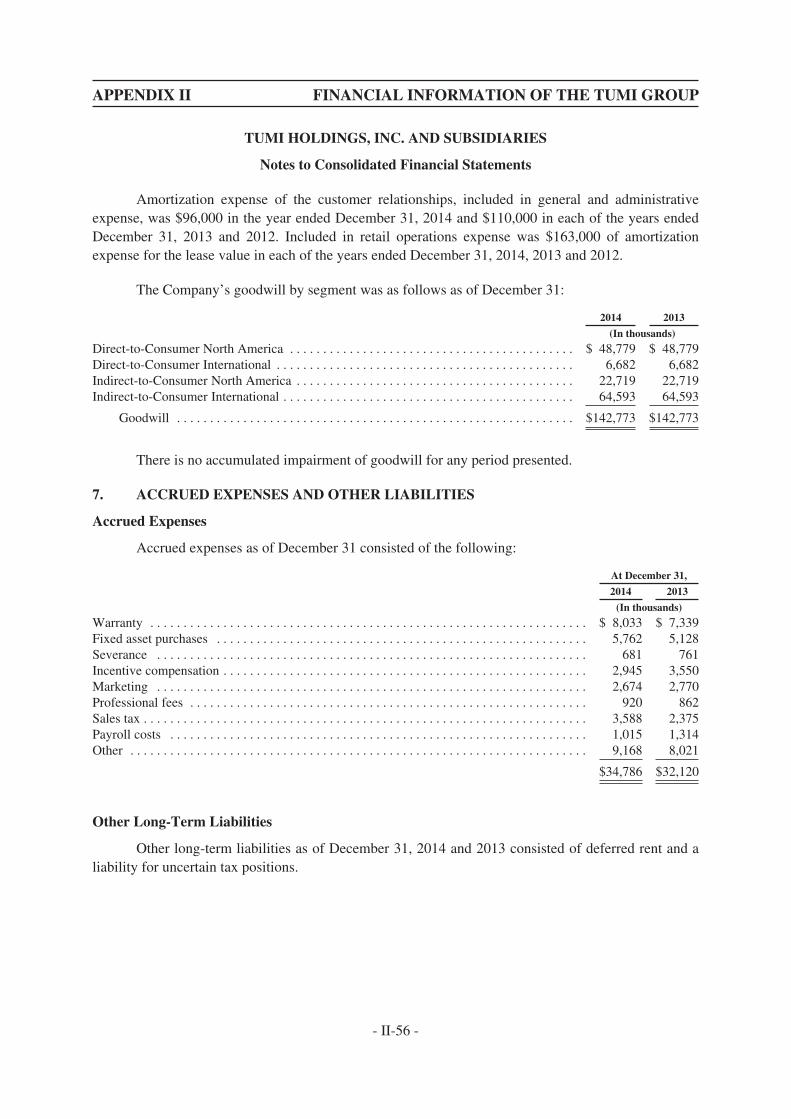
APPENDIX II FINANCIAL INFORMATION OF THE TUMI GROUP
TUMI HOLDINGS, INC. AND SUBSIDIARIES
Notes to Consolidated Financial Statements
Amortization expense of the customer relationships, included in general and administrativeexpense, was $96,000 in the year ended December 31, 2014 and $110,000 in each of the years endedDecember 31, 2013 and 2012. Included in retail operations expense was $163,000 of amortizationexpense for the lease value in each of the years ended December 31, 2014, 2013 and 2012.
The Company’s goodwill by segment was as follows as of December 31:
2014 2013
(In thousands)
Direct-to-Consumer North America . . . . . . . . . . . . . . . . . . . . . . . . . . . . . . . . . . . . . . . . . . . $ 48,779 $ 48,779Direct-to-Consumer International . . . . . . . . . . . . . . . . . . . . . . . . . . . . . . . . . . . . . . . . . . . . . 6,682 6,682Indirect-to-Consumer North America . . . . . . . . . . . . . . . . . . . . . . . . . . . . . . . . . . . . . . . . . . 22,719 22,719Indirect-to-Consumer International . . . . . . . . . . . . . . . . . . . . . . . . . . . . . . . . . . . . . . . . . . . . 64,593 64,593
Goodwill . . . . . . . . . . . . . . . . . . . . . . . . . . . . . . . . . . . . . . . . . . . . . . . . . . . . . . . . . . . . $142,773 $142,773
There is no accumulated impairment of goodwill for any period presented.
7. ACCRUED EXPENSES AND OTHER LIABILITIES
Accrued Expenses
Accrued expenses as of December 31 consisted of the following:
At December 31,
2014 2013
(In thousands)
Warranty . . . . . . . . . . . . . . . . . . . . . . . . . . . . . . . . . . . . . . . . . . . . . . . . . . . . . . . . . . . . . . . . . . $ 8,033 $ 7,339Fixed asset purchases . . . . . . . . . . . . . . . . . . . . . . . . . . . . . . . . . . . . . . . . . . . . . . . . . . . . . . . . 5,762 5,128Severance . . . . . . . . . . . . . . . . . . . . . . . . . . . . . . . . . . . . . . . . . . . . . . . . . . . . . . . . . . . . . . . . . 681 761Incentive compensation . . . . . . . . . . . . . . . . . . . . . . . . . . . . . . . . . . . . . . . . . . . . . . . . . . . . . . . 2,945 3,550Marketing . . . . . . . . . . . . . . . . . . . . . . . . . . . . . . . . . . . . . . . . . . . . . . . . . . . . . . . . . . . . . . . . . 2,674 2,770Professional fees . . . . . . . . . . . . . . . . . . . . . . . . . . . . . . . . . . . . . . . . . . . . . . . . . . . . . . . . . . . . 920 862Sales tax . . . . . . . . . . . . . . . . . . . . . . . . . . . . . . . . . . . . . . . . . . . . . . . . . . . . . . . . . . . . . . . . . . . 3,588 2,375Payroll costs . . . . . . . . . . . . . . . . . . . . . . . . . . . . . . . . . . . . . . . . . . . . . . . . . . . . . . . . . . . . . . . 1,015 1,314Other . . . . . . . . . . . . . . . . . . . . . . . . . . . . . . . . . . . . . . . . . . . . . . . . . . . . . . . . . . . . . . . . . . . . . 9,168 8,021
$34,786 $32,120
Other Long-Term Liabilities
Other long-term liabilities as of December 31, 2014 and 2013 consisted of deferred rent and aliability for uncertain tax positions.
- II-56 -
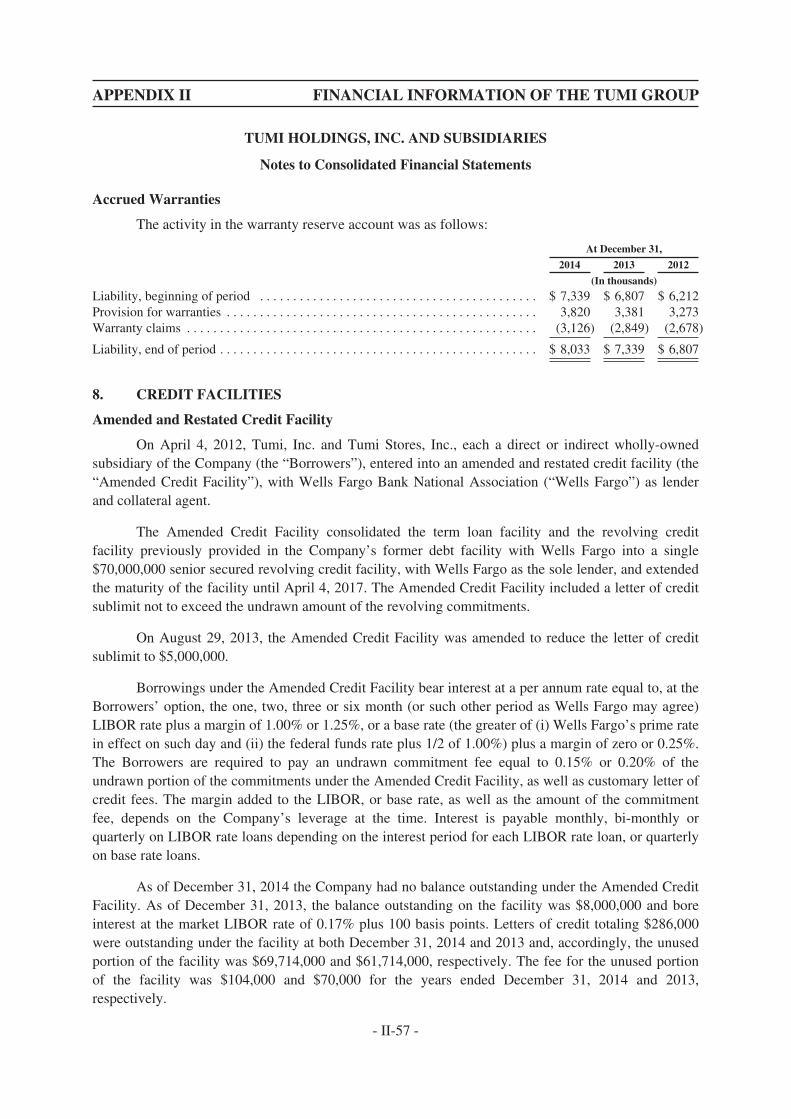
APPENDIX II FINANCIAL INFORMATION OF THE TUMI GROUP
TUMI HOLDINGS, INC. AND SUBSIDIARIES
Notes to Consolidated Financial Statements
Accrued Warranties
The activity in the warranty reserve account was as follows:
At December 31,
2014 2013 2012
(In thousands)
Liability, beginning of period . . . . . . . . . . . . . . . . . . . . . . . . . . . . . . . . . . . . . . . . . . $ 7,339 $ 6,807 $ 6,212Provision for warranties . . . . . . . . . . . . . . . . . . . . . . . . . . . . . . . . . . . . . . . . . . . . . . . 3,820 3,381 3,273Warranty claims . . . . . . . . . . . . . . . . . . . . . . . . . . . . . . . . . . . . . . . . . . . . . . . . . . . . . (3,126) (2,849) (2,678)
Liability, end of period . . . . . . . . . . . . . . . . . . . . . . . . . . . . . . . . . . . . . . . . . . . . . . . . $ 8,033 $ 7,339 $ 6,807
8. CREDIT FACILITIES
Amended and Restated Credit Facility
On April 4, 2012, Tumi, Inc. and Tumi Stores, Inc., each a direct or indirect wholly-ownedsubsidiary of the Company (the “Borrowers”), entered into an amended and restated credit facility (the“Amended Credit Facility”), with Wells Fargo Bank National Association (“Wells Fargo”) as lenderand collateral agent.
The Amended Credit Facility consolidated the term loan facility and the revolving creditfacility previously provided in the Company’s former debt facility with Wells Fargo into a single$70,000,000 senior secured revolving credit facility, with Wells Fargo as the sole lender, and extendedthe maturity of the facility until April 4, 2017. The Amended Credit Facility included a letter of creditsublimit not to exceed the undrawn amount of the revolving commitments.
On August 29, 2013, the Amended Credit Facility was amended to reduce the letter of creditsublimit to $5,000,000.
Borrowings under the Amended Credit Facility bear interest at a per annum rate equal to, at theBorrowers’ option, the one, two, three or six month (or such other period as Wells Fargo may agree)LIBOR rate plus a margin of 1.00% or 1.25%, or a base rate (the greater of (i) Wells Fargo’s prime ratein effect on such day and (ii) the federal funds rate plus 1/2 of 1.00%) plus a margin of zero or 0.25%.The Borrowers are required to pay an undrawn commitment fee equal to 0.15% or 0.20% of theundrawn portion of the commitments under the Amended Credit Facility, as well as customary letter ofcredit fees. The margin added to the LIBOR, or base rate, as well as the amount of the commitmentfee, depends on the Company’s leverage at the time. Interest is payable monthly, bi-monthly orquarterly on LIBOR rate loans depending on the interest period for each LIBOR rate loan, or quarterlyon base rate loans.
As of December 31, 2014 the Company had no balance outstanding under the Amended CreditFacility. As of December 31, 2013, the balance outstanding on the facility was $8,000,000 and boreinterest at the market LIBOR rate of 0.17% plus 100 basis points. Letters of credit totaling $286,000were outstanding under the facility at both December 31, 2014 and 2013 and, accordingly, the unusedportion of the facility was $69,714,000 and $61,714,000, respectively. The fee for the unused portionof the facility was $104,000 and $70,000 for the years ended December 31, 2014 and 2013,respectively.
- II-57 -

APPENDIX II FINANCIAL INFORMATION OF THE TUMI GROUP
TUMI HOLDINGS, INC. AND SUBSIDIARIES
Notes to Consolidated Financial Statements
All obligations under the Amended Credit Facility are required to be guaranteed by each of theBorrowers’ material domestic subsidiaries, subject to certain exclusions. The obligations under theAmended Credit Facility are secured by substantially all of the Borrowers’ assets and, if applicable,those of the Borrowers’ subsidiary guarantors. Currently the Borrowers do not have any subsidiaryguarantors.
The Amended Credit Facility contains customary events of default, including, but not limitedto, payment defaults, breaches of representations and warranties, covenant defaults, cross-defaultsunder material debt, certain events of bankruptcy and insolvency, defaults based on certain judgments,failure of any material provision of any loan document to be in full force and effect, change of control,and certain ERISA defaults. If an event of default were to occur and continue, amounts due under theAmended Credit Facility would be accelerated and the commitments to extend credit thereunderterminated, and the rights and remedies of Wells Fargo under the Amended Credit Facility availableunder the applicable loan documents could be exercised, including rights with respect to the collateralsecuring the obligations under the Amended Credit Facility.
The Company reviewed the terms of the Amended Credit Facility and was satisfied that allconditions were met, pursuant to the FASB’s guidance, to treat the transaction as a debt modification,which required the Company to expense third party fees and add the related fees paid to Wells Fargo tothe existing debt issuance costs.
Debt Covenants
The Amended Credit Facility contains customary covenants, including, but not limited to,limitations on the ability of the Borrowers and their subsidiaries to incur additional debt and liens,dispose of assets, and make certain investments and restricted payments, including the prepayment ofcertain debt and cash dividends. In addition, the Amended Credit Facility contains financial covenantsrequiring that the Borrowers maintain (a) a minimum ratio of consolidated adjusted EBITDA toconsolidated cash interest expense (as such terms are defined in the Amended Credit Facility) of notless than 4.00 to 1.00 and (b) a maximum ratio of consolidated total debt to consolidated adjustedEBITDA of no greater than 2.25 to 1.00. The Company was in compliance in all material respects withall such covenants as of December 31, 2014.
Long-Term Debt
Long-term debt as of the indicated dates consisted of the following:
At December 31,
2014 2013
(In thousands)
Amended Credit Facility: Revolver loan payable April 4, 2017, including interest ata LIBOR rate (0.17% at December 31, 2013) plus 1.00% at December 31,2013. . . . . . . . . . . . . . . . . . . . . . . . . . . . . . . . . . . . . . . . . . . . . . . . . . . . . . . . . . . . . $— $8,000
$— $8,000
- II-58 -
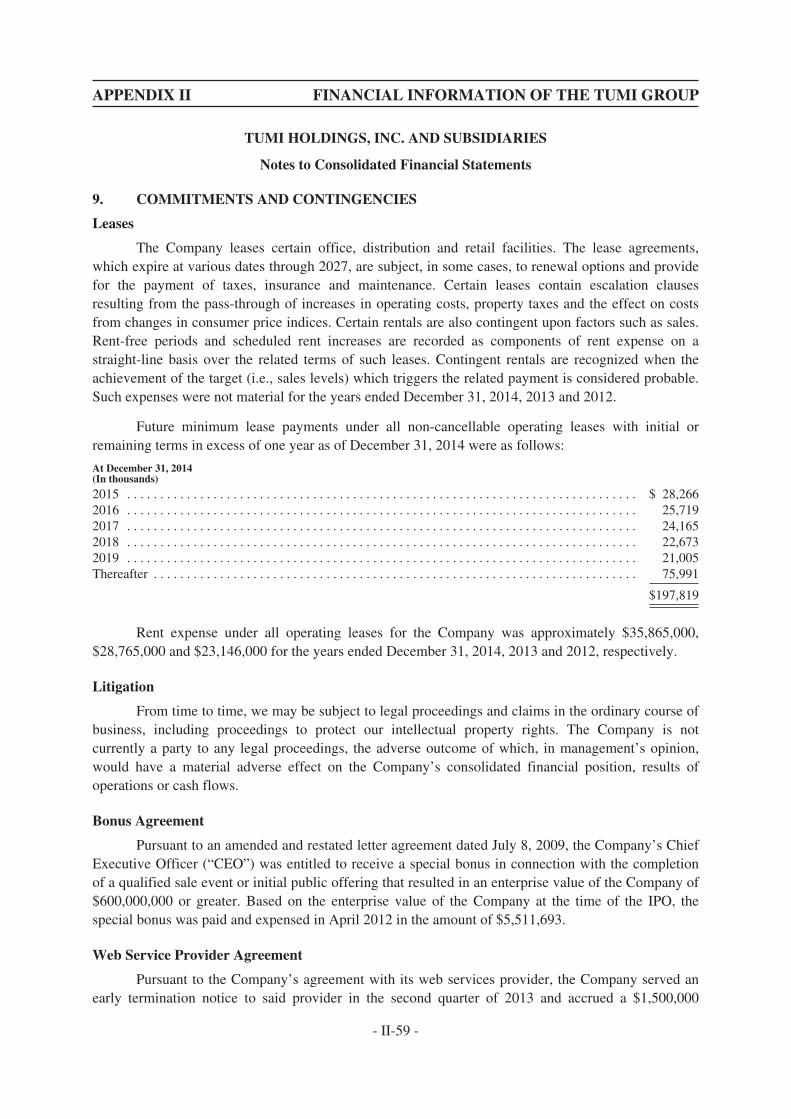
APPENDIX II FINANCIAL INFORMATION OF THE TUMI GROUP
TUMI HOLDINGS, INC. AND SUBSIDIARIES
Notes to Consolidated Financial Statements
9. COMMITMENTS AND CONTINGENCIES
Leases
The Company leases certain office, distribution and retail facilities. The lease agreements,which expire at various dates through 2027, are subject, in some cases, to renewal options and providefor the payment of taxes, insurance and maintenance. Certain leases contain escalation clausesresulting from the pass-through of increases in operating costs, property taxes and the effect on costsfrom changes in consumer price indices. Certain rentals are also contingent upon factors such as sales.Rent-free periods and scheduled rent increases are recorded as components of rent expense on astraight-line basis over the related terms of such leases. Contingent rentals are recognized when theachievement of the target (i.e., sales levels) which triggers the related payment is considered probable.Such expenses were not material for the years ended December 31, 2014, 2013 and 2012.
Future minimum lease payments under all non-cancellable operating leases with initial orremaining terms in excess of one year as of December 31, 2014 were as follows:
At December 31, 2014(In thousands)
2015 . . . . . . . . . . . . . . . . . . . . . . . . . . . . . . . . . . . . . . . . . . . . . . . . . . . . . . . . . . . . . . . . . . . . . . . . . . . . . $ 28,2662016 . . . . . . . . . . . . . . . . . . . . . . . . . . . . . . . . . . . . . . . . . . . . . . . . . . . . . . . . . . . . . . . . . . . . . . . . . . . . . 25,7192017 . . . . . . . . . . . . . . . . . . . . . . . . . . . . . . . . . . . . . . . . . . . . . . . . . . . . . . . . . . . . . . . . . . . . . . . . . . . . . 24,1652018 . . . . . . . . . . . . . . . . . . . . . . . . . . . . . . . . . . . . . . . . . . . . . . . . . . . . . . . . . . . . . . . . . . . . . . . . . . . . . 22,6732019 . . . . . . . . . . . . . . . . . . . . . . . . . . . . . . . . . . . . . . . . . . . . . . . . . . . . . . . . . . . . . . . . . . . . . . . . . . . . . 21,005Thereafter . . . . . . . . . . . . . . . . . . . . . . . . . . . . . . . . . . . . . . . . . . . . . . . . . . . . . . . . . . . . . . . . . . . . . . . . . 75,991
$197,819
Rent expense under all operating leases for the Company was approximately $35,865,000,$28,765,000 and $23,146,000 for the years ended December 31, 2014, 2013 and 2012, respectively.
Litigation
From time to time, we may be subject to legal proceedings and claims in the ordinary course ofbusiness, including proceedings to protect our intellectual property rights. The Company is notcurrently a party to any legal proceedings, the adverse outcome of which, in management’s opinion,would have a material adverse effect on the Company’s consolidated financial position, results ofoperations or cash flows.
Bonus Agreement
Pursuant to an amended and restated letter agreement dated July 8, 2009, the Company’s ChiefExecutive Officer (“CEO”) was entitled to receive a special bonus in connection with the completionof a qualified sale event or initial public offering that resulted in an enterprise value of the Company of$600,000,000 or greater. Based on the enterprise value of the Company at the time of the IPO, thespecial bonus was paid and expensed in April 2012 in the amount of $5,511,693.
Web Service Provider Agreement
Pursuant to the Company’s agreement with its web services provider, the Company served anearly termination notice to said provider in the second quarter of 2013 and accrued a $1,500,000
- II-59 -
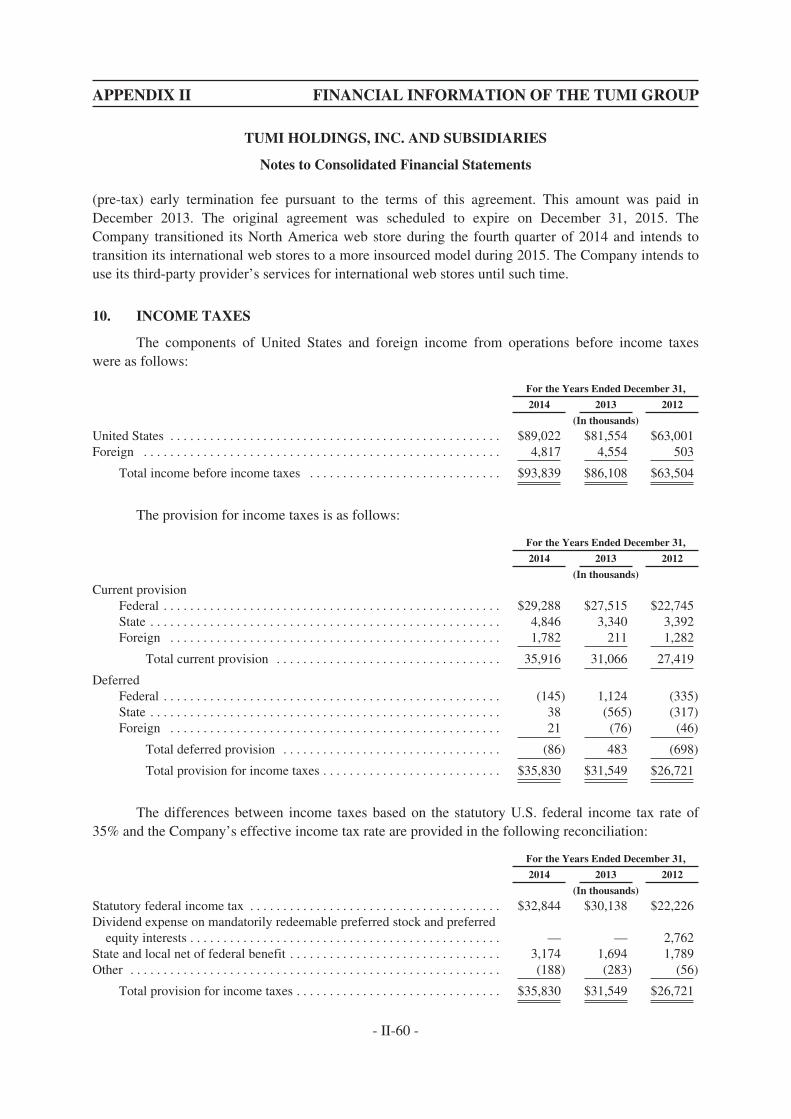
APPENDIX II FINANCIAL INFORMATION OF THE TUMI GROUP
TUMI HOLDINGS, INC. AND SUBSIDIARIES
Notes to Consolidated Financial Statements
(pre-tax) early termination fee pursuant to the terms of this agreement. This amount was paid inDecember 2013. The original agreement was scheduled to expire on December 31, 2015. TheCompany transitioned its North America web store during the fourth quarter of 2014 and intends totransition its international web stores to a more insourced model during 2015. The Company intends touse its third-party provider’s services for international web stores until such time.
10. INCOME TAXES
The components of United States and foreign income from operations before income taxeswere as follows:
For the Years Ended December 31,
2014 2013 2012
(In thousands)
United States . . . . . . . . . . . . . . . . . . . . . . . . . . . . . . . . . . . . . . . . . . . . . . . . . . $89,022 $81,554 $63,001Foreign . . . . . . . . . . . . . . . . . . . . . . . . . . . . . . . . . . . . . . . . . . . . . . . . . . . . . . 4,817 4,554 503
Total income before income taxes . . . . . . . . . . . . . . . . . . . . . . . . . . . . . $93,839 $86,108 $63,504
The provision for income taxes is as follows:
For the Years Ended December 31,
2014 2013 2012
(In thousands)
Current provisionFederal . . . . . . . . . . . . . . . . . . . . . . . . . . . . . . . . . . . . . . . . . . . . . . . . . . . $29,288 $27,515 $22,745State . . . . . . . . . . . . . . . . . . . . . . . . . . . . . . . . . . . . . . . . . . . . . . . . . . . . . 4,846 3,340 3,392Foreign . . . . . . . . . . . . . . . . . . . . . . . . . . . . . . . . . . . . . . . . . . . . . . . . . . 1,782 211 1,282
Total current provision . . . . . . . . . . . . . . . . . . . . . . . . . . . . . . . . . . 35,916 31,066 27,419
DeferredFederal . . . . . . . . . . . . . . . . . . . . . . . . . . . . . . . . . . . . . . . . . . . . . . . . . . . (145) 1,124 (335)State . . . . . . . . . . . . . . . . . . . . . . . . . . . . . . . . . . . . . . . . . . . . . . . . . . . . . 38 (565) (317)Foreign . . . . . . . . . . . . . . . . . . . . . . . . . . . . . . . . . . . . . . . . . . . . . . . . . . 21 (76) (46)
Total deferred provision . . . . . . . . . . . . . . . . . . . . . . . . . . . . . . . . . (86) 483 (698)
Total provision for income taxes . . . . . . . . . . . . . . . . . . . . . . . . . . . $35,830 $31,549 $26,721
The differences between income taxes based on the statutory U.S. federal income tax rate of35% and the Company’s effective income tax rate are provided in the following reconciliation:
For the Years Ended December 31,
2014 2013 2012
(In thousands)
Statutory federal income tax . . . . . . . . . . . . . . . . . . . . . . . . . . . . . . . . . . . . . . $32,844 $30,138 $22,226Dividend expense on mandatorily redeemable preferred stock and preferred
equity interests . . . . . . . . . . . . . . . . . . . . . . . . . . . . . . . . . . . . . . . . . . . . . . . — — 2,762State and local net of federal benefit . . . . . . . . . . . . . . . . . . . . . . . . . . . . . . . . 3,174 1,694 1,789Other . . . . . . . . . . . . . . . . . . . . . . . . . . . . . . . . . . . . . . . . . . . . . . . . . . . . . . . . (188) (283) (56)
Total provision for income taxes . . . . . . . . . . . . . . . . . . . . . . . . . . . . . . . $35,830 $31,549 $26,721
- II-60 -
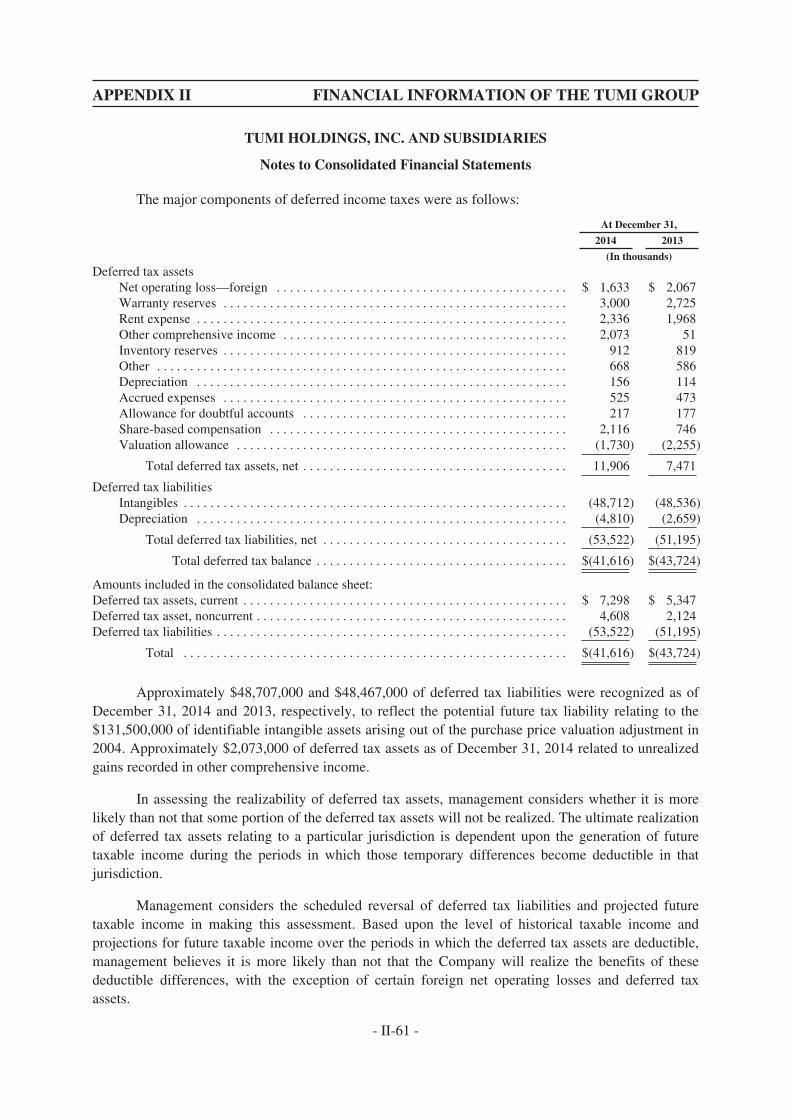
APPENDIX II FINANCIAL INFORMATION OF THE TUMI GROUP
TUMI HOLDINGS, INC. AND SUBSIDIARIES
Notes to Consolidated Financial Statements
The major components of deferred income taxes were as follows:
At December 31,
2014 2013
(In thousands)
Deferred tax assetsNet operating loss—foreign . . . . . . . . . . . . . . . . . . . . . . . . . . . . . . . . . . . . . . . . . . . . $ 1,633 $ 2,067Warranty reserves . . . . . . . . . . . . . . . . . . . . . . . . . . . . . . . . . . . . . . . . . . . . . . . . . . . . 3,000 2,725Rent expense . . . . . . . . . . . . . . . . . . . . . . . . . . . . . . . . . . . . . . . . . . . . . . . . . . . . . . . . 2,336 1,968Other comprehensive income . . . . . . . . . . . . . . . . . . . . . . . . . . . . . . . . . . . . . . . . . . . 2,073 51Inventory reserves . . . . . . . . . . . . . . . . . . . . . . . . . . . . . . . . . . . . . . . . . . . . . . . . . . . . 912 819Other . . . . . . . . . . . . . . . . . . . . . . . . . . . . . . . . . . . . . . . . . . . . . . . . . . . . . . . . . . . . . . 668 586Depreciation . . . . . . . . . . . . . . . . . . . . . . . . . . . . . . . . . . . . . . . . . . . . . . . . . . . . . . . . 156 114Accrued expenses . . . . . . . . . . . . . . . . . . . . . . . . . . . . . . . . . . . . . . . . . . . . . . . . . . . . 525 473Allowance for doubtful accounts . . . . . . . . . . . . . . . . . . . . . . . . . . . . . . . . . . . . . . . . 217 177Share-based compensation . . . . . . . . . . . . . . . . . . . . . . . . . . . . . . . . . . . . . . . . . . . . . 2,116 746Valuation allowance . . . . . . . . . . . . . . . . . . . . . . . . . . . . . . . . . . . . . . . . . . . . . . . . . . (1,730) (2,255)
Total deferred tax assets, net . . . . . . . . . . . . . . . . . . . . . . . . . . . . . . . . . . . . . . . . 11,906 7,471
Deferred tax liabilitiesIntangibles . . . . . . . . . . . . . . . . . . . . . . . . . . . . . . . . . . . . . . . . . . . . . . . . . . . . . . . . . . (48,712) (48,536)Depreciation . . . . . . . . . . . . . . . . . . . . . . . . . . . . . . . . . . . . . . . . . . . . . . . . . . . . . . . . (4,810) (2,659)
Total deferred tax liabilities, net . . . . . . . . . . . . . . . . . . . . . . . . . . . . . . . . . . . . . (53,522) (51,195)
Total deferred tax balance . . . . . . . . . . . . . . . . . . . . . . . . . . . . . . . . . . . . . . $(41,616) $(43,724)
Amounts included in the consolidated balance sheet:Deferred tax assets, current . . . . . . . . . . . . . . . . . . . . . . . . . . . . . . . . . . . . . . . . . . . . . . . . . $ 7,298 $ 5,347Deferred tax asset, noncurrent . . . . . . . . . . . . . . . . . . . . . . . . . . . . . . . . . . . . . . . . . . . . . . . 4,608 2,124Deferred tax liabilities . . . . . . . . . . . . . . . . . . . . . . . . . . . . . . . . . . . . . . . . . . . . . . . . . . . . . (53,522) (51,195)
Total . . . . . . . . . . . . . . . . . . . . . . . . . . . . . . . . . . . . . . . . . . . . . . . . . . . . . . . . . . $(41,616) $(43,724)
Approximately $48,707,000 and $48,467,000 of deferred tax liabilities were recognized as ofDecember 31, 2014 and 2013, respectively, to reflect the potential future tax liability relating to the$131,500,000 of identifiable intangible assets arising out of the purchase price valuation adjustment in2004. Approximately $2,073,000 of deferred tax assets as of December 31, 2014 related to unrealizedgains recorded in other comprehensive income.
In assessing the realizability of deferred tax assets, management considers whether it is morelikely than not that some portion of the deferred tax assets will not be realized. The ultimate realizationof deferred tax assets relating to a particular jurisdiction is dependent upon the generation of futuretaxable income during the periods in which those temporary differences become deductible in thatjurisdiction.
Management considers the scheduled reversal of deferred tax liabilities and projected futuretaxable income in making this assessment. Based upon the level of historical taxable income andprojections for future taxable income over the periods in which the deferred tax assets are deductible,management believes it is more likely than not that the Company will realize the benefits of thesedeductible differences, with the exception of certain foreign net operating losses and deferred taxassets.
- II-61 -
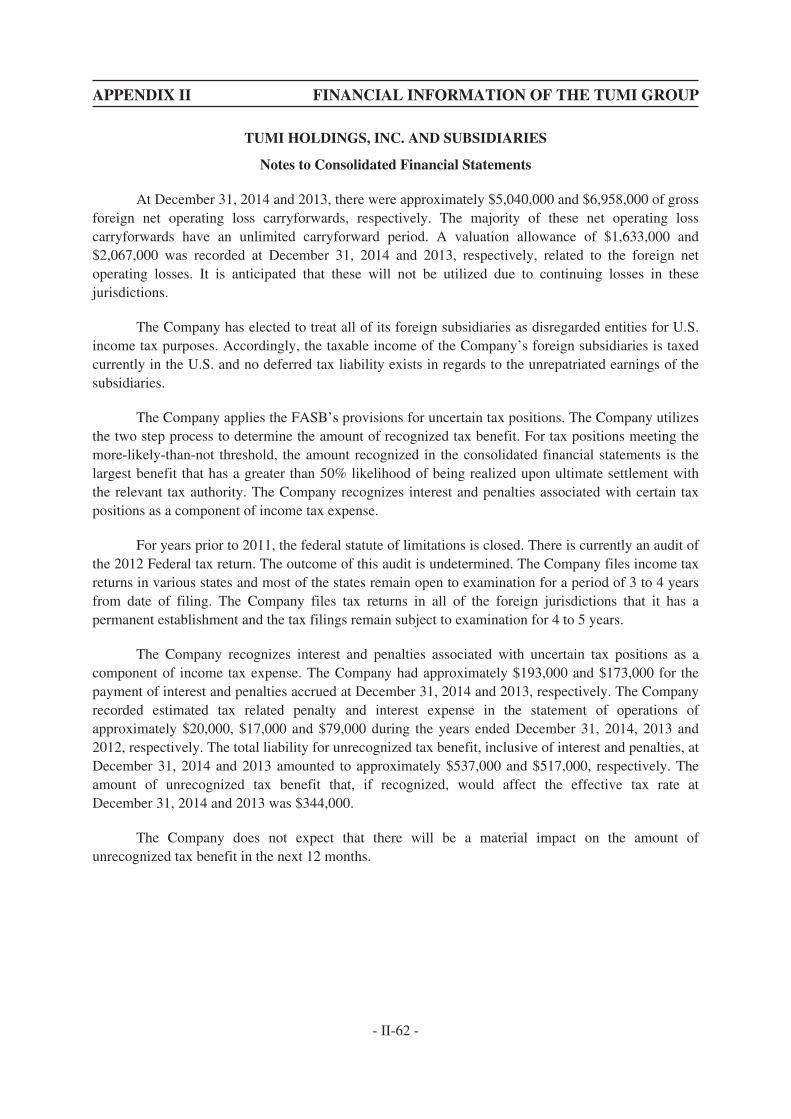
APPENDIX II FINANCIAL INFORMATION OF THE TUMI GROUP
TUMI HOLDINGS, INC. AND SUBSIDIARIES
Notes to Consolidated Financial Statements
At December 31, 2014 and 2013, there were approximately $5,040,000 and $6,958,000 of grossforeign net operating loss carryforwards, respectively. The majority of these net operating losscarryforwards have an unlimited carryforward period. A valuation allowance of $1,633,000 and$2,067,000 was recorded at December 31, 2014 and 2013, respectively, related to the foreign netoperating losses. It is anticipated that these will not be utilized due to continuing losses in thesejurisdictions.
The Company has elected to treat all of its foreign subsidiaries as disregarded entities for U.S.income tax purposes. Accordingly, the taxable income of the Company’s foreign subsidiaries is taxedcurrently in the U.S. and no deferred tax liability exists in regards to the unrepatriated earnings of thesubsidiaries.
The Company applies the FASB’s provisions for uncertain tax positions. The Company utilizesthe two step process to determine the amount of recognized tax benefit. For tax positions meeting themore-likely-than-not threshold, the amount recognized in the consolidated financial statements is thelargest benefit that has a greater than 50% likelihood of being realized upon ultimate settlement withthe relevant tax authority. The Company recognizes interest and penalties associated with certain taxpositions as a component of income tax expense.
For years prior to 2011, the federal statute of limitations is closed. There is currently an audit ofthe 2012 Federal tax return. The outcome of this audit is undetermined. The Company files income taxreturns in various states and most of the states remain open to examination for a period of 3 to 4 yearsfrom date of filing. The Company files tax returns in all of the foreign jurisdictions that it has apermanent establishment and the tax filings remain subject to examination for 4 to 5 years.
The Company recognizes interest and penalties associated with uncertain tax positions as acomponent of income tax expense. The Company had approximately $193,000 and $173,000 for thepayment of interest and penalties accrued at December 31, 2014 and 2013, respectively. The Companyrecorded estimated tax related penalty and interest expense in the statement of operations ofapproximately $20,000, $17,000 and $79,000 during the years ended December 31, 2014, 2013 and2012, respectively. The total liability for unrecognized tax benefit, inclusive of interest and penalties, atDecember 31, 2014 and 2013 amounted to approximately $537,000 and $517,000, respectively. Theamount of unrecognized tax benefit that, if recognized, would affect the effective tax rate atDecember 31, 2014 and 2013 was $344,000.
The Company does not expect that there will be a material impact on the amount ofunrecognized tax benefit in the next 12 months.
- II-62 -
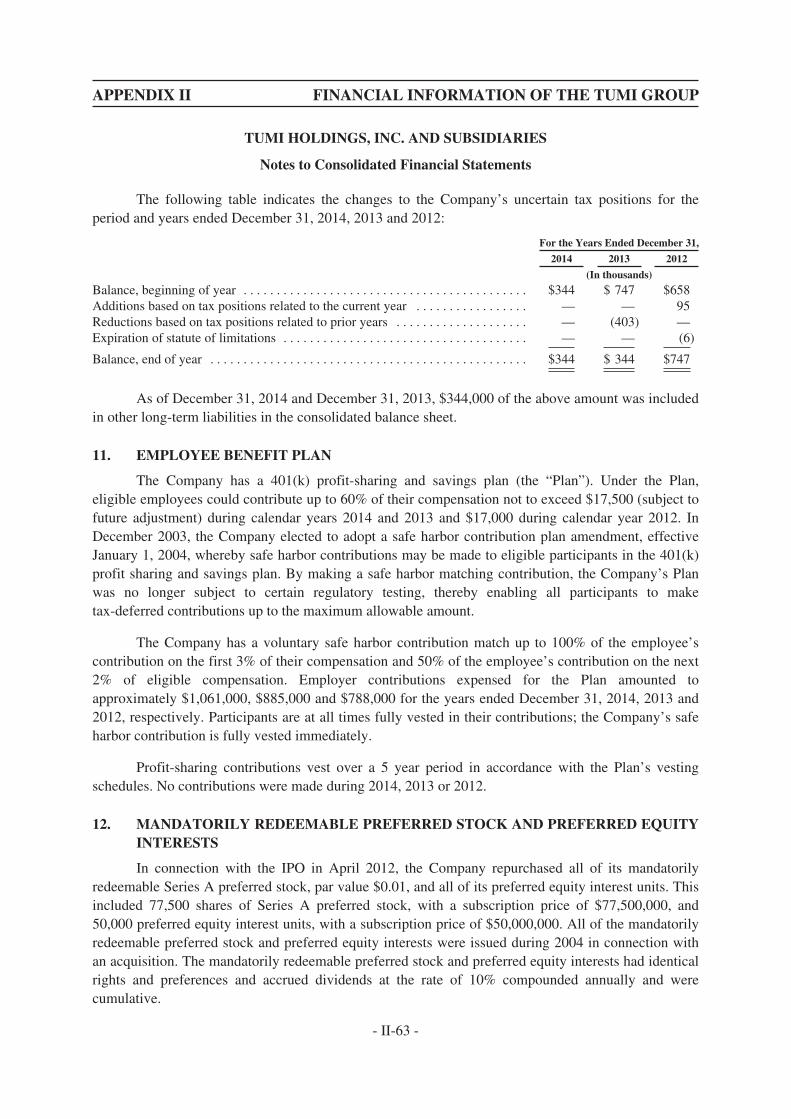
APPENDIX II FINANCIAL INFORMATION OF THE TUMI GROUP
TUMI HOLDINGS, INC. AND SUBSIDIARIES
Notes to Consolidated Financial Statements
The following table indicates the changes to the Company’s uncertain tax positions for theperiod and years ended December 31, 2014, 2013 and 2012:
For the Years Ended December 31,
2014 2013 2012
(In thousands)
Balance, beginning of year . . . . . . . . . . . . . . . . . . . . . . . . . . . . . . . . . . . . . . . . . . . $344 $ 747 $658Additions based on tax positions related to the current year . . . . . . . . . . . . . . . . . — — 95Reductions based on tax positions related to prior years . . . . . . . . . . . . . . . . . . . . — (403) —Expiration of statute of limitations . . . . . . . . . . . . . . . . . . . . . . . . . . . . . . . . . . . . . — — (6)
Balance, end of year . . . . . . . . . . . . . . . . . . . . . . . . . . . . . . . . . . . . . . . . . . . . . . . . $344 $ 344 $747
As of December 31, 2014 and December 31, 2013, $344,000 of the above amount was includedin other long-term liabilities in the consolidated balance sheet.
11. EMPLOYEE BENEFIT PLAN
The Company has a 401(k) profit-sharing and savings plan (the “Plan”). Under the Plan,eligible employees could contribute up to 60% of their compensation not to exceed $17,500 (subject tofuture adjustment) during calendar years 2014 and 2013 and $17,000 during calendar year 2012. InDecember 2003, the Company elected to adopt a safe harbor contribution plan amendment, effectiveJanuary 1, 2004, whereby safe harbor contributions may be made to eligible participants in the 401(k)profit sharing and savings plan. By making a safe harbor matching contribution, the Company’s Planwas no longer subject to certain regulatory testing, thereby enabling all participants to maketax-deferred contributions up to the maximum allowable amount.
The Company has a voluntary safe harbor contribution match up to 100% of the employee’scontribution on the first 3% of their compensation and 50% of the employee’s contribution on the next2% of eligible compensation. Employer contributions expensed for the Plan amounted toapproximately $1,061,000, $885,000 and $788,000 for the years ended December 31, 2014, 2013 and2012, respectively. Participants are at all times fully vested in their contributions; the Company’s safeharbor contribution is fully vested immediately.
Profit-sharing contributions vest over a 5 year period in accordance with the Plan’s vestingschedules. No contributions were made during 2014, 2013 or 2012.
12. MANDATORILY REDEEMABLE PREFERRED STOCK AND PREFERRED EQUITYINTERESTS
In connection with the IPO in April 2012, the Company repurchased all of its mandatorilyredeemable Series A preferred stock, par value $0.01, and all of its preferred equity interest units. Thisincluded 77,500 shares of Series A preferred stock, with a subscription price of $77,500,000, and50,000 preferred equity interest units, with a subscription price of $50,000,000. All of the mandatorilyredeemable preferred stock and preferred equity interests were issued during 2004 in connection withan acquisition. The mandatorily redeemable preferred stock and preferred equity interests had identicalrights and preferences and accrued dividends at the rate of 10% compounded annually and werecumulative.
- II-63 -
APPENDIX II FINANCIAL INFORMATION OF THE TUMI GROUP
TUMI HOLDINGS, INC. AND SUBSIDIARIES
Notes to Consolidated Financial Statements
The mandatorily redeemable preferred stock and preferred equity interests repurchased in 2012totaled $259,321,000, comprised of $157,627,000 of Series A preferred stock, inclusive of $80,127,000of accrued dividends, and $101,694,000 of preferred equity interests, inclusive of $51,694,000 ofaccrued dividends.
13. STOCKHOLDERS’ EQUITY
As of December 31, 2014 and 2013, there were 350,000,000 shares of common stockauthorized, with a par value of $0.01, of which 67,868,867 and 67,866,667 shares, net of treasurystock, were outstanding, respectively. Common stock represents 100% of the ownership and votingcontrol of Tumi Holdings, Inc. and does not accrue dividends.
In connection with the IPO, 75,000,000 shares of preferred stock were authorized, with a parvalue of $0.01, of which no shares were issued or outstanding as of December 31, 2014 and 2013.
As of December 31, 2014 and 2013, the Company held 277,806 shares of common stock intreasury.
Stock Splits
In connection with the IPO, the Company’s Board of Directors approved a 101.200929-for-1common stock split and a subsequent 1.037857-for-1 common stock split, which were effectiveApril 4, 2012 and April 19, 2012, respectively.
All common share and per share amounts in the consolidated financial statements have beenadjusted retrospectively for all periods presented to reflect the 101.200929-for-1 and 1.037857-for-1common stock splits.
Accumulated Other Comprehensive Loss
The balance in accumulated other comprehensive loss consists only of foreign currencytranslation adjustments, net of tax.
- II-64 -
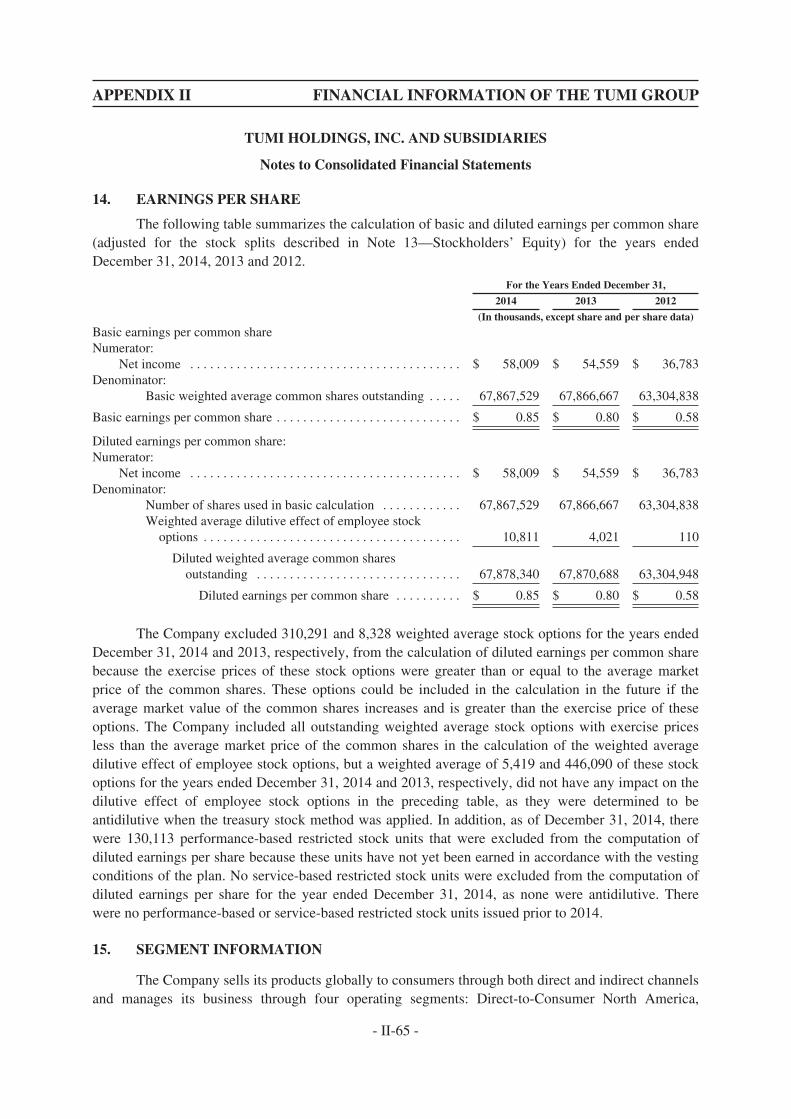
APPENDIX II FINANCIAL INFORMATION OF THE TUMI GROUP
TUMI HOLDINGS, INC. AND SUBSIDIARIES
Notes to Consolidated Financial Statements
14. EARNINGS PER SHARE
The following table summarizes the calculation of basic and diluted earnings per common share(adjusted for the stock splits described in Note 13—Stockholders’ Equity) for the years endedDecember 31, 2014, 2013 and 2012.
For the Years Ended December 31,
2014 2013 2012
(In thousands, except share and per share data)
Basic earnings per common shareNumerator:
Net income . . . . . . . . . . . . . . . . . . . . . . . . . . . . . . . . . . . . . . . . . $ 58,009 $ 54,559 $ 36,783Denominator:
Basic weighted average common shares outstanding . . . . . 67,867,529 67,866,667 63,304,838
Basic earnings per common share . . . . . . . . . . . . . . . . . . . . . . . . . . . . $ 0.85 $ 0.80 $ 0.58
Diluted earnings per common share:Numerator:
Net income . . . . . . . . . . . . . . . . . . . . . . . . . . . . . . . . . . . . . . . . . $ 58,009 $ 54,559 $ 36,783Denominator:
Number of shares used in basic calculation . . . . . . . . . . . . 67,867,529 67,866,667 63,304,838Weighted average dilutive effect of employee stock
options . . . . . . . . . . . . . . . . . . . . . . . . . . . . . . . . . . . . . . . 10,811 4,021 110
Diluted weighted average common sharesoutstanding . . . . . . . . . . . . . . . . . . . . . . . . . . . . . . . 67,878,340 67,870,688 63,304,948
Diluted earnings per common share . . . . . . . . . . $ 0.85 $ 0.80 $ 0.58
The Company excluded 310,291 and 8,328 weighted average stock options for the years endedDecember 31, 2014 and 2013, respectively, from the calculation of diluted earnings per common sharebecause the exercise prices of these stock options were greater than or equal to the average marketprice of the common shares. These options could be included in the calculation in the future if theaverage market value of the common shares increases and is greater than the exercise price of theseoptions. The Company included all outstanding weighted average stock options with exercise pricesless than the average market price of the common shares in the calculation of the weighted averagedilutive effect of employee stock options, but a weighted average of 5,419 and 446,090 of these stockoptions for the years ended December 31, 2014 and 2013, respectively, did not have any impact on thedilutive effect of employee stock options in the preceding table, as they were determined to beantidilutive when the treasury stock method was applied. In addition, as of December 31, 2014, therewere 130,113 performance-based restricted stock units that were excluded from the computation ofdiluted earnings per share because these units have not yet been earned in accordance with the vestingconditions of the plan. No service-based restricted stock units were excluded from the computation ofdiluted earnings per share for the year ended December 31, 2014, as none were antidilutive. Therewere no performance-based or service-based restricted stock units issued prior to 2014.
15. SEGMENT INFORMATION
The Company sells its products globally to consumers through both direct and indirect channelsand manages its business through four operating segments: Direct-to-Consumer North America,
- II-65 -
APPENDIX II FINANCIAL INFORMATION OF THE TUMI GROUP
TUMI HOLDINGS, INC. AND SUBSIDIARIES
Notes to Consolidated Financial Statements
Direct-to-Consumer International, Indirect-to-Consumer North America and Indirect-to-ConsumerInternational. The Company’s Chief Executive Officer and Chief Financial Officer are its chiefoperating decision makers (the “CODM’s”) as defined in the FASB’s guidance relating to segmentreporting. The CODM’s evaluate net sales and operating income of the Company’s segments toallocate resources and evaluate performance. Operating income of the Company’s segments ismeasured on net sales, less cost of goods sold and direct expenses of each segment and certainoperating expenses allocated to each segment. Expenses not specifically allocated to the individualsegments include costs such as product design and development, certain general and administrative,shipping, warehouse and other expenses. The CODM’s do not receive information related to totalassets by segment. Although the Company’s products fall into three major categories: travel, businessand accessories, the Company’s classification of individual product codes into these categories is fluidand dynamic; while the Company collects gross sales data, the Company does not collect financialinformation to derive net sales (including discounts and allowances) and markdowns by productcategory in sufficient detail to report such data in its financial statements in the aggregate or bysegment.
Following is a description of our segments:
Direct-to-Consumer North America
The Company’s Direct-to-Consumer North America segment sells the Company’s productsdirectly to consumers through a network of company-owned retail stores consisting of full-price storesand outlet stores strategically positioned in high-end retail malls or street venues. In addition, sales ofthe Company’s products to consumers through our e-commerce website are included in this segment.
Indirect-to-Consumer North America
The Company sells to wholesale customers, including specialty luggage retailers, prestigedepartment stores and business to business channels. Many of the Company’s wholesale customersalso operate their own e-commerce websites through which they sell the Company’s products. TheCompany also sells its products in partner stores, which are operated by local distributors or retailers,that carry only Tumi products and are governed by strict operating guidelines that the Companydictates.
Direct-to-Consumer International
The Company sells directly to consumers through a network of company-owned full-price andoutlet stores in high-end street venues and select malls in international locations. The Company alsosells its products directly to consumers through our e-commerce website.
Indirect-to-Consumer International
The Company sells its products through wholesale distribution channels in Europe, the MiddleEast and Africa, the Asia-Pacific region and Central and South America. The Company also sells itsproducts in partner stores, operated by local distributors or retailers, that carry only Tumi products and
- II-66 -
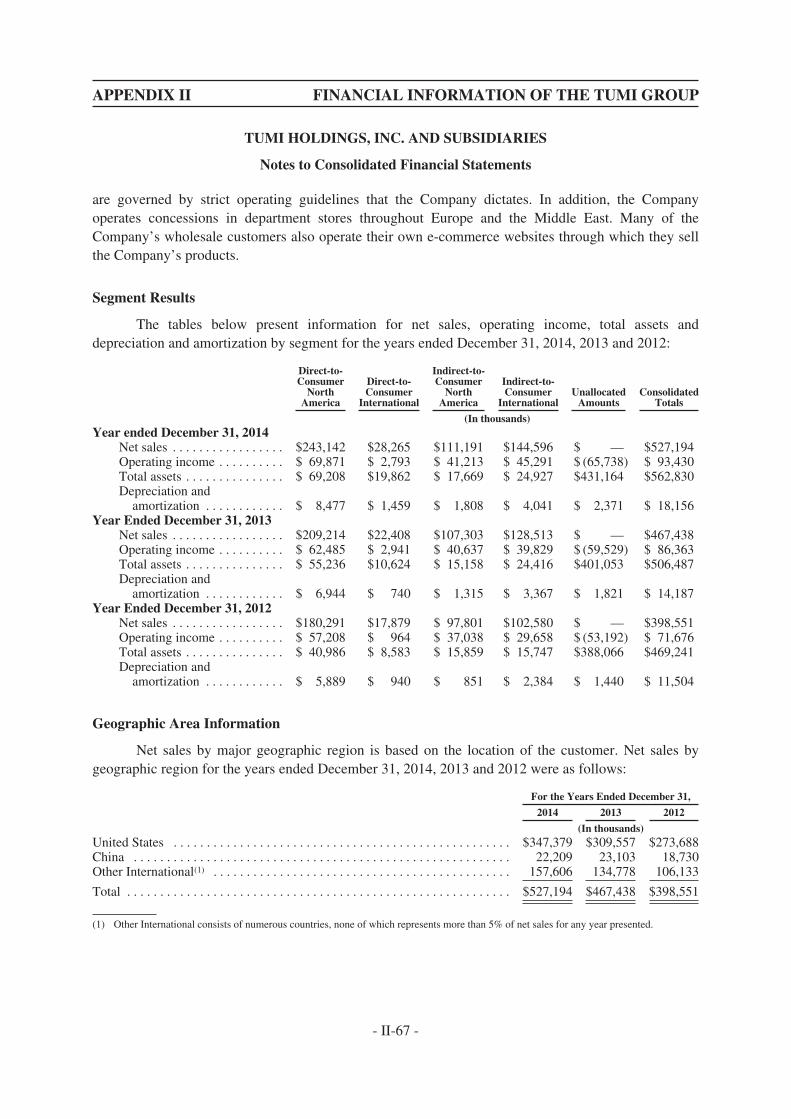
APPENDIX II FINANCIAL INFORMATION OF THE TUMI GROUP
TUMI HOLDINGS, INC. AND SUBSIDIARIES
Notes to Consolidated Financial Statements
are governed by strict operating guidelines that the Company dictates. In addition, the Companyoperates concessions in department stores throughout Europe and the Middle East. Many of theCompany’s wholesale customers also operate their own e-commerce websites through which they sellthe Company’s products.
Segment Results
The tables below present information for net sales, operating income, total assets anddepreciation and amortization by segment for the years ended December 31, 2014, 2013 and 2012:
Direct-to-Consumer
NorthAmerica
Direct-to-Consumer
International
Indirect-to-Consumer
NorthAmerica
Indirect-to-Consumer
InternationalUnallocated
AmountsConsolidated
Totals
(In thousands)Year ended December 31, 2014
Net sales . . . . . . . . . . . . . . . . . $243,142 $28,265 $111,191 $144,596 $ — $527,194Operating income . . . . . . . . . . $ 69,871 $ 2,793 $ 41,213 $ 45,291 $ (65,738) $ 93,430Total assets . . . . . . . . . . . . . . . $ 69,208 $19,862 $ 17,669 $ 24,927 $431,164 $562,830Depreciation and
amortization . . . . . . . . . . . . $ 8,477 $ 1,459 $ 1,808 $ 4,041 $ 2,371 $ 18,156Year Ended December 31, 2013
Net sales . . . . . . . . . . . . . . . . . $209,214 $22,408 $107,303 $128,513 $ — $467,438Operating income . . . . . . . . . . $ 62,485 $ 2,941 $ 40,637 $ 39,829 $ (59,529) $ 86,363Total assets . . . . . . . . . . . . . . . $ 55,236 $10,624 $ 15,158 $ 24,416 $401,053 $506,487Depreciation and
amortization . . . . . . . . . . . . $ 6,944 $ 740 $ 1,315 $ 3,367 $ 1,821 $ 14,187Year Ended December 31, 2012
Net sales . . . . . . . . . . . . . . . . . $180,291 $17,879 $ 97,801 $102,580 $ — $398,551Operating income . . . . . . . . . . $ 57,208 $ 964 $ 37,038 $ 29,658 $ (53,192) $ 71,676Total assets . . . . . . . . . . . . . . . $ 40,986 $ 8,583 $ 15,859 $ 15,747 $388,066 $469,241Depreciation and
amortization . . . . . . . . . . . . $ 5,889 $ 940 $ 851 $ 2,384 $ 1,440 $ 11,504
Geographic Area Information
Net sales by major geographic region is based on the location of the customer. Net sales bygeographic region for the years ended December 31, 2014, 2013 and 2012 were as follows:
For the Years Ended December 31,
2014 2013 2012
(In thousands)United States . . . . . . . . . . . . . . . . . . . . . . . . . . . . . . . . . . . . . . . . . . . . . . . . . . . $347,379 $309,557 $273,688China . . . . . . . . . . . . . . . . . . . . . . . . . . . . . . . . . . . . . . . . . . . . . . . . . . . . . . . . . 22,209 23,103 18,730Other International(1) . . . . . . . . . . . . . . . . . . . . . . . . . . . . . . . . . . . . . . . . . . . . . 157,606 134,778 106,133
Total . . . . . . . . . . . . . . . . . . . . . . . . . . . . . . . . . . . . . . . . . . . . . . . . . . . . . . . . . . $527,194 $467,438 $398,551
(1) Other International consists of numerous countries, none of which represents more than 5% of net sales for any year presented.
- II-67 -

APPENDIX II FINANCIAL INFORMATION OF THE TUMI GROUP
TUMI HOLDINGS, INC. AND SUBSIDIARIES
Notes to Consolidated Financial Statements
Property, plant and equipment, net by country of domicile as of December 31, 2014, 2013 and2012 were as follows:
For the Years Ended December 31,
2014 2013 2012
(In thousands)United States . . . . . . . . . . . . . . . . . . . . . . . . . . . . . . . . . . . . . . . . . . . . . . . . . . . . . . $57,679 $45,479 $33,906Germany . . . . . . . . . . . . . . . . . . . . . . . . . . . . . . . . . . . . . . . . . . . . . . . . . . . . . . . . . . 4,097 4,185 4,179China . . . . . . . . . . . . . . . . . . . . . . . . . . . . . . . . . . . . . . . . . . . . . . . . . . . . . . . . . . . . 2,999 2,456 3,120Other International(2) . . . . . . . . . . . . . . . . . . . . . . . . . . . . . . . . . . . . . . . . . . . . . . . . 14,292 8,751 5,799
Total . . . . . . . . . . . . . . . . . . . . . . . . . . . . . . . . . . . . . . . . . . . . . . . . . . . . . . . . . . . . . $79,067 $60,871 $47,004
(2) Other International consists of numerous countries, none of which represents more than 5% of property, plant and equipment, net, for anyyear presented.
16. CONCENTRATION OF RISK
Credit Risk
The Company’s accounts receivable are comprised primarily of large balances due from a smallnumber of major customers, principally distribution partners in the Asia-Pacific region and largedepartment and specialty luggage stores dispersed throughout the United States. Failure of one of themajor customers to pay its balance could have a significant impact on the financial position, results ofoperations and cash flows of the Company. Five of the Company’s largest customers in the aggregateaccounted for 26.2% and 18.5% of consolidated trade accounts receivable at December 31, 2014 and2013, respectively. These five customers accounted for 11.9%, 10.8% and 11.1% of consolidated netsales for the years ended December 31, 2014, 2013 and 2012, respectively.
Supplier Risk
The Company’s product offerings are enhanced by custom raw materials that have specifictechnical requirements. The Company has selected a limited number of key suppliers with thecapability to support these manufacturing requirements and manufactures the majority of its productsin Asia. Although alternatives in the supply chain exist, a change in suppliers could cause a delay inmanufacturing and have a short-term adverse effect on operating results. Additionally, purchases fromthese key suppliers are denominated in U.S. dollars. Foreign currency risk associated with these supplyarrangements is shared with these suppliers. Five of the Company’s largest suppliers accounted for47.2% and 41.9% of accounts payable at December 31, 2014 and 2013, respectively. These fivesuppliers accounted for 81.3%, 77.6% and 71.9% of total product purchases for the years endedDecember 31, 2014, 2013 and 2012, respectively.
17. SHARE-BASED COMPENSATION PLANS AND AWARDS
2012 Long-Term Incentive Plan
The Company adopted the 2012 Plan effective April 18, 2012, which has a term of 10 years.The Company’s compensation committee will generally designate those individuals eligible toparticipate in the 2012 Plan. Subject to adjustment in the event of a merger, recapitalization, stock split,
- II-68 -
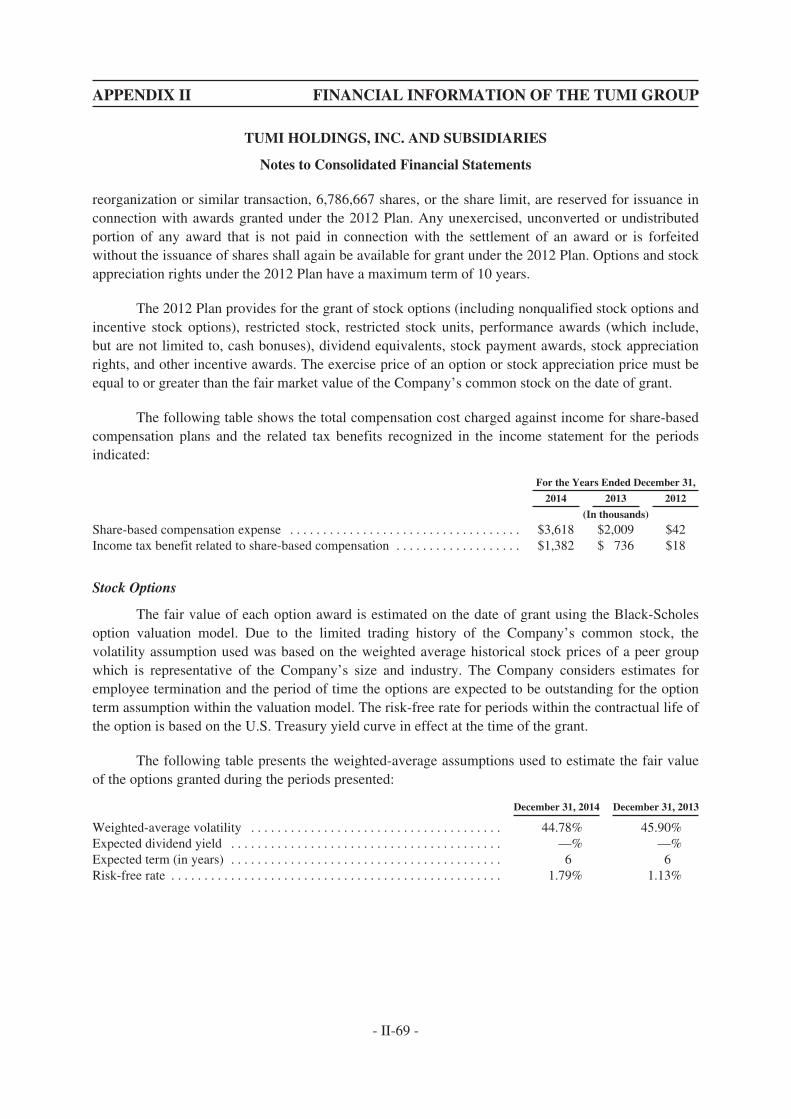
APPENDIX II FINANCIAL INFORMATION OF THE TUMI GROUP
TUMI HOLDINGS, INC. AND SUBSIDIARIES
Notes to Consolidated Financial Statements
reorganization or similar transaction, 6,786,667 shares, or the share limit, are reserved for issuance inconnection with awards granted under the 2012 Plan. Any unexercised, unconverted or undistributedportion of any award that is not paid in connection with the settlement of an award or is forfeitedwithout the issuance of shares shall again be available for grant under the 2012 Plan. Options and stockappreciation rights under the 2012 Plan have a maximum term of 10 years.
The 2012 Plan provides for the grant of stock options (including nonqualified stock options andincentive stock options), restricted stock, restricted stock units, performance awards (which include,but are not limited to, cash bonuses), dividend equivalents, stock payment awards, stock appreciationrights, and other incentive awards. The exercise price of an option or stock appreciation price must beequal to or greater than the fair market value of the Company’s common stock on the date of grant.
The following table shows the total compensation cost charged against income for share-basedcompensation plans and the related tax benefits recognized in the income statement for the periodsindicated:
For the Years Ended December 31,
2014 2013 2012
(In thousands)
Share-based compensation expense . . . . . . . . . . . . . . . . . . . . . . . . . . . . . . . . . . . $3,618 $2,009 $42Income tax benefit related to share-based compensation . . . . . . . . . . . . . . . . . . . $1,382 $ 736 $18
Stock Options
The fair value of each option award is estimated on the date of grant using the Black-Scholesoption valuation model. Due to the limited trading history of the Company’s common stock, thevolatility assumption used was based on the weighted average historical stock prices of a peer groupwhich is representative of the Company’s size and industry. The Company considers estimates foremployee termination and the period of time the options are expected to be outstanding for the optionterm assumption within the valuation model. The risk-free rate for periods within the contractual life ofthe option is based on the U.S. Treasury yield curve in effect at the time of the grant.
The following table presents the weighted-average assumptions used to estimate the fair valueof the options granted during the periods presented:
December 31, 2014 December 31, 2013
Weighted-average volatility . . . . . . . . . . . . . . . . . . . . . . . . . . . . . . . . . . . . . . 44.78% 45.90%Expected dividend yield . . . . . . . . . . . . . . . . . . . . . . . . . . . . . . . . . . . . . . . . . —% —%Expected term (in years) . . . . . . . . . . . . . . . . . . . . . . . . . . . . . . . . . . . . . . . . . 6 6Risk-free rate . . . . . . . . . . . . . . . . . . . . . . . . . . . . . . . . . . . . . . . . . . . . . . . . . . 1.79% 1.13%
- II-69 -
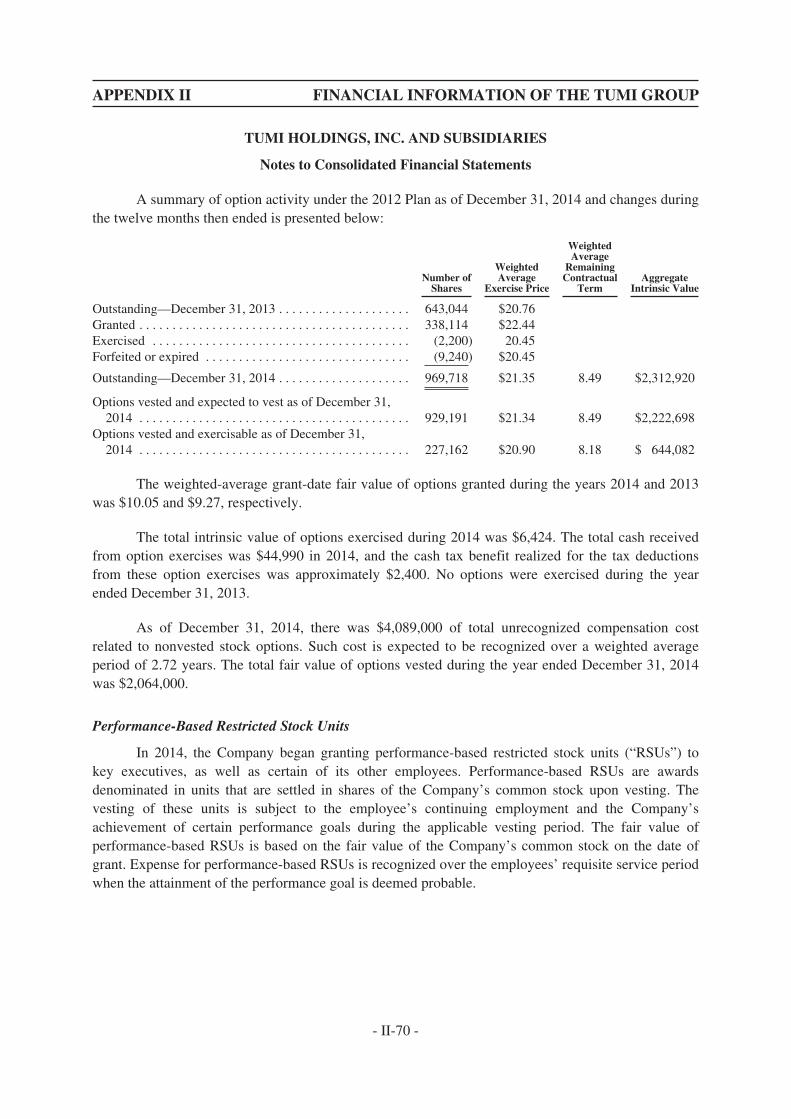
APPENDIX II FINANCIAL INFORMATION OF THE TUMI GROUP
TUMI HOLDINGS, INC. AND SUBSIDIARIES
Notes to Consolidated Financial Statements
A summary of option activity under the 2012 Plan as of December 31, 2014 and changes duringthe twelve months then ended is presented below:
Number ofShares
WeightedAverage
Exercise Price
WeightedAverage
RemainingContractual
TermAggregate
Intrinsic Value
Outstanding—December 31, 2013 . . . . . . . . . . . . . . . . . . . . 643,044 $20.76Granted . . . . . . . . . . . . . . . . . . . . . . . . . . . . . . . . . . . . . . . . . 338,114 $22.44Exercised . . . . . . . . . . . . . . . . . . . . . . . . . . . . . . . . . . . . . . . (2,200) 20.45Forfeited or expired . . . . . . . . . . . . . . . . . . . . . . . . . . . . . . . (9,240) $20.45
Outstanding—December 31, 2014 . . . . . . . . . . . . . . . . . . . . 969,718 $21.35 8.49 $2,312,920
Options vested and expected to vest as of December 31,2014 . . . . . . . . . . . . . . . . . . . . . . . . . . . . . . . . . . . . . . . . . 929,191 $21.34 8.49 $2,222,698
Options vested and exercisable as of December 31,2014 . . . . . . . . . . . . . . . . . . . . . . . . . . . . . . . . . . . . . . . . . 227,162 $20.90 8.18 $ 644,082
The weighted-average grant-date fair value of options granted during the years 2014 and 2013was $10.05 and $9.27, respectively.
The total intrinsic value of options exercised during 2014 was $6,424. The total cash receivedfrom option exercises was $44,990 in 2014, and the cash tax benefit realized for the tax deductionsfrom these option exercises was approximately $2,400. No options were exercised during the yearended December 31, 2013.
As of December 31, 2014, there was $4,089,000 of total unrecognized compensation costrelated to nonvested stock options. Such cost is expected to be recognized over a weighted averageperiod of 2.72 years. The total fair value of options vested during the year ended December 31, 2014was $2,064,000.
Performance-Based Restricted Stock Units
In 2014, the Company began granting performance-based restricted stock units (“RSUs”) tokey executives, as well as certain of its other employees. Performance-based RSUs are awardsdenominated in units that are settled in shares of the Company’s common stock upon vesting. Thevesting of these units is subject to the employee’s continuing employment and the Company’sachievement of certain performance goals during the applicable vesting period. The fair value ofperformance-based RSUs is based on the fair value of the Company’s common stock on the date ofgrant. Expense for performance-based RSUs is recognized over the employees’ requisite service periodwhen the attainment of the performance goal is deemed probable.
- II-70 -
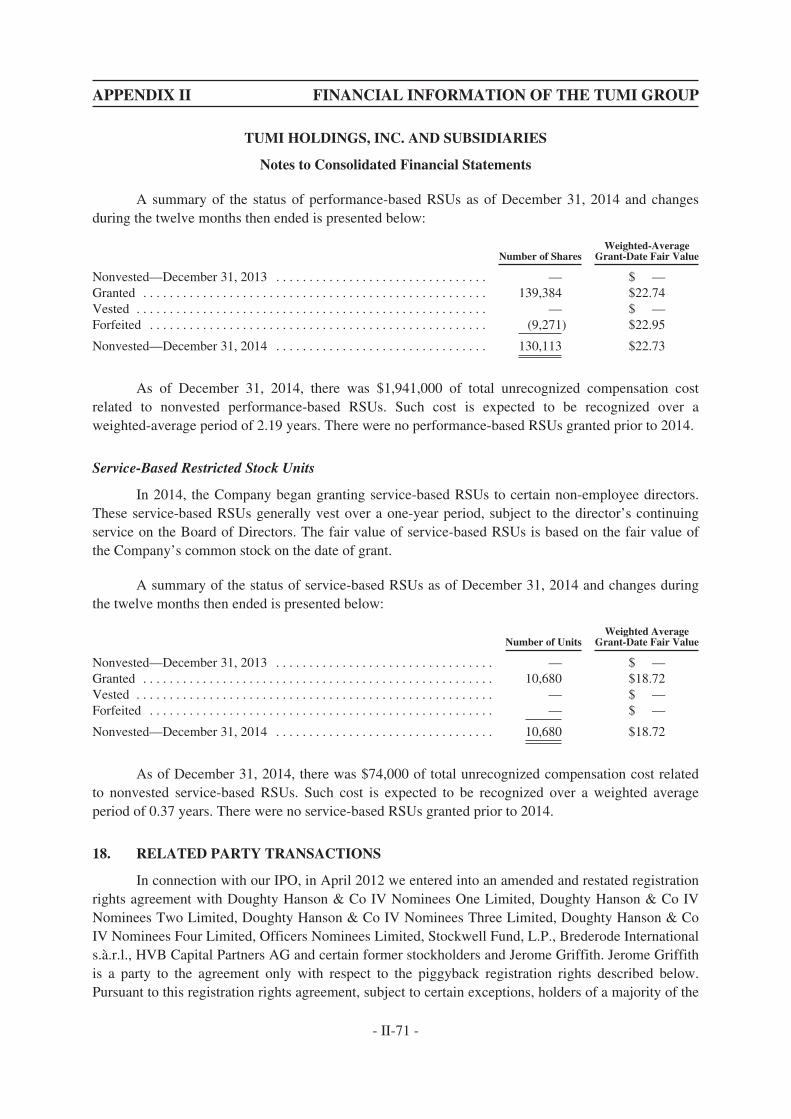
APPENDIX II FINANCIAL INFORMATION OF THE TUMI GROUP
TUMI HOLDINGS, INC. AND SUBSIDIARIES
Notes to Consolidated Financial Statements
A summary of the status of performance-based RSUs as of December 31, 2014 and changesduring the twelve months then ended is presented below:
Number of SharesWeighted-Average
Grant-Date Fair Value
Nonvested—December 31, 2013 . . . . . . . . . . . . . . . . . . . . . . . . . . . . . . . . — $ —Granted . . . . . . . . . . . . . . . . . . . . . . . . . . . . . . . . . . . . . . . . . . . . . . . . . . . . 139,384 $22.74Vested . . . . . . . . . . . . . . . . . . . . . . . . . . . . . . . . . . . . . . . . . . . . . . . . . . . . . — $ —Forfeited . . . . . . . . . . . . . . . . . . . . . . . . . . . . . . . . . . . . . . . . . . . . . . . . . . . (9,271) $22.95
Nonvested—December 31, 2014 . . . . . . . . . . . . . . . . . . . . . . . . . . . . . . . . 130,113 $22.73
As of December 31, 2014, there was $1,941,000 of total unrecognized compensation costrelated to nonvested performance-based RSUs. Such cost is expected to be recognized over aweighted-average period of 2.19 years. There were no performance-based RSUs granted prior to 2014.
Service-Based Restricted Stock Units
In 2014, the Company began granting service-based RSUs to certain non-employee directors.These service-based RSUs generally vest over a one-year period, subject to the director’s continuingservice on the Board of Directors. The fair value of service-based RSUs is based on the fair value ofthe Company’s common stock on the date of grant.
A summary of the status of service-based RSUs as of December 31, 2014 and changes duringthe twelve months then ended is presented below:
Number of UnitsWeighted Average
Grant-Date Fair Value
Nonvested—December 31, 2013 . . . . . . . . . . . . . . . . . . . . . . . . . . . . . . . . . — $ —Granted . . . . . . . . . . . . . . . . . . . . . . . . . . . . . . . . . . . . . . . . . . . . . . . . . . . . . 10,680 $18.72Vested . . . . . . . . . . . . . . . . . . . . . . . . . . . . . . . . . . . . . . . . . . . . . . . . . . . . . . — $ —Forfeited . . . . . . . . . . . . . . . . . . . . . . . . . . . . . . . . . . . . . . . . . . . . . . . . . . . . — $ —
Nonvested—December 31, 2014 . . . . . . . . . . . . . . . . . . . . . . . . . . . . . . . . . 10,680 $18.72
As of December 31, 2014, there was $74,000 of total unrecognized compensation cost relatedto nonvested service-based RSUs. Such cost is expected to be recognized over a weighted averageperiod of 0.37 years. There were no service-based RSUs granted prior to 2014.
18. RELATED PARTY TRANSACTIONS
In connection with our IPO, in April 2012 we entered into an amended and restated registrationrights agreement with Doughty Hanson & Co IV Nominees One Limited, Doughty Hanson & Co IVNominees Two Limited, Doughty Hanson & Co IV Nominees Three Limited, Doughty Hanson & CoIV Nominees Four Limited, Officers Nominees Limited, Stockwell Fund, L.P., Brederode Internationals.à.r.l., HVB Capital Partners AG and certain former stockholders and Jerome Griffith. Jerome Griffithis a party to the agreement only with respect to the piggyback registration rights described below.Pursuant to this registration rights agreement, subject to certain exceptions, holders of a majority of the
- II-71 -

APPENDIX II FINANCIAL INFORMATION OF THE TUMI GROUP
TUMI HOLDINGS, INC. AND SUBSIDIARIES
Notes to Consolidated Financial Statements
then registrable common stock collectively have the right to require us to register for public sale underthe Securities Act all shares of common stock that it requests be registered. The registration rightsagreement limits the requests for registrations pursuant to a fully marketed underwritten offering tothree requests per 365-day period, provided that such request covers at least that number of shares withan anticipated gross offering price of $25,000,000. In addition, whenever we propose to file aregistration statement under the Securities Act (other than a registration on Form S-4 or Form S-8), weare required to give notice of such registration to all parties to the registration rights agreement thathold registrable securities. Such notified persons have piggyback registration rights providing them theright to have us include their shares of common stock in any such registration, subject to the provisionsof the registration rights agreement. All expenses of such registrations (including both demand andpiggyback registrations), other than underwriting discounts and commissions incurred in connectionwith registrations, filings or qualifications, will be paid by us.
Pursuant to the Company’s obligation under the amended and restated registration rightsagreement, the Company incurred $634,000, $477,000 and $196,000 in connection with the November2012, April 2013 and September 2014 secondary offerings of the Company’s common stock describedin Note 1—Summary of Significant Accounting Policies, respectively.
19. UNAUDITED SELECTED QUARTERLY FINANCIAL DATA
The following tables set forth unaudited selected quarterly financial data for the years endedDecember 31, 2014 and 2013. In the opinion of management, the following selected quarterlyinformation includes all adjustments, consisting solely of normal recurring adjustments, necessary forthe fair statement of the results of operations for these periods. This quarterly data is not necessarilyindicative of our operating results for any future period.
For the Three Months Ended
March 30,2014
June 29,2014
September 28,2014
December 31,2014
(In thousands, except share and per share data)
Net sales . . . . . . . . . . . . . . . . . . . . . . . . . . . . . . . . . . . $ 108,602 $ 124,582 $ 130,195 $ 163,815Year over year growth %(1) . . . . . . . . . . . . . . . . . 6% 15% 20% 11%
Gross margin . . . . . . . . . . . . . . . . . . . . . . . . . . . . . . . . $ 63,083 $ 72,102 $ 76,307 $ 94,475Selling, general and administrative expenses . . . . . . . $ 49,702 $ 52,246 $ 53,040 $ 57,549Operating income . . . . . . . . . . . . . . . . . . . . . . . . . . . . $ 13,381 $ 19,856 $ 23,267 $ 36,926Net income . . . . . . . . . . . . . . . . . . . . . . . . . . . . . . . . . $ 8,153 $ 12,219 $ 13,917 $ 23,720Basic weighted average common shares
outstanding . . . . . . . . . . . . . . . . . . . . . . . . . . . . . . . 67,866,667 67,866,667 67,867,852 67,868,867Diluted weighted average common shares
outstanding . . . . . . . . . . . . . . . . . . . . . . . . . . . . . . . 67,867,852 67,872,947 67,876,522 67,895,249Basic earnings per common share . . . . . . . . . . . . . . . . $ 0.12 $ 0.18 $ 0.21 $ 0.35Diluted earnings per common share . . . . . . . . . . . . . . $ 0.12 $ 0.18 $ 0.21 $ 0.35
- II-72 -
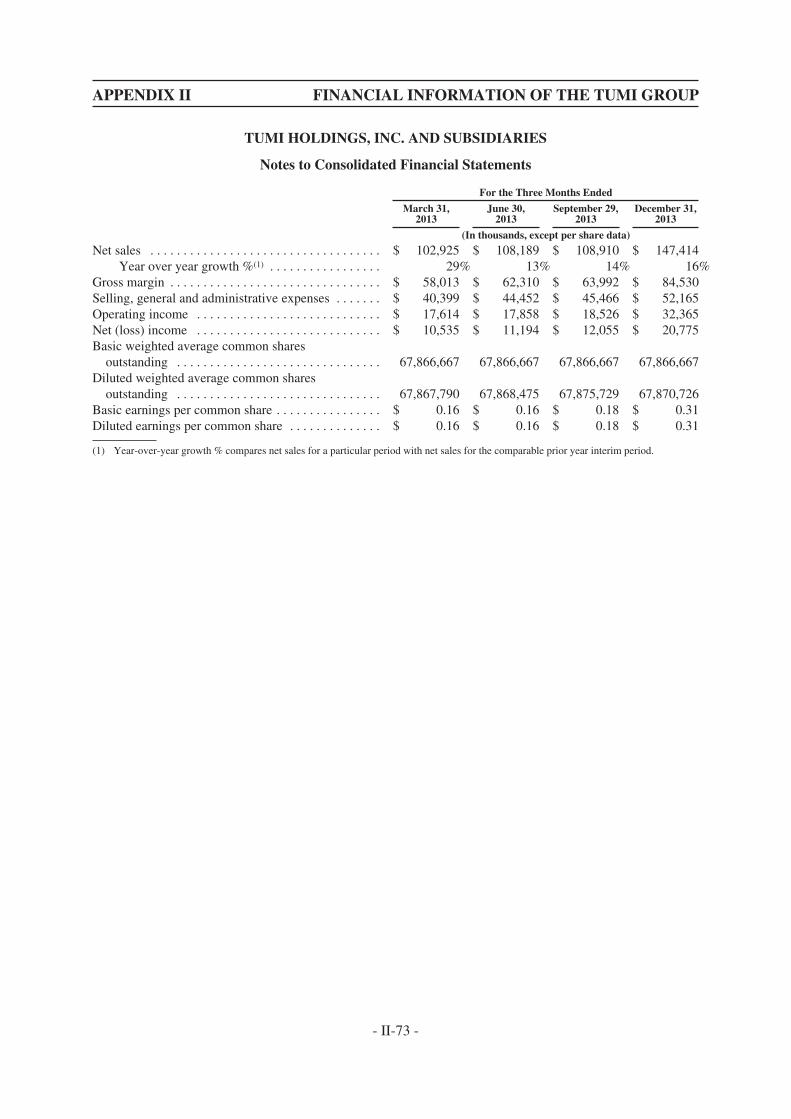
APPENDIX II FINANCIAL INFORMATION OF THE TUMI GROUP
TUMI HOLDINGS, INC. AND SUBSIDIARIES
Notes to Consolidated Financial Statements
For the Three Months Ended
March 31,2013
June 30,2013
September 29,2013
December 31,2013
(In thousands, except per share data)
Net sales . . . . . . . . . . . . . . . . . . . . . . . . . . . . . . . . . . . $ 102,925 $ 108,189 $ 108,910 $ 147,414Year over year growth %(1) . . . . . . . . . . . . . . . . . 29% 13% 14% 16%
Gross margin . . . . . . . . . . . . . . . . . . . . . . . . . . . . . . . . $ 58,013 $ 62,310 $ 63,992 $ 84,530Selling, general and administrative expenses . . . . . . . $ 40,399 $ 44,452 $ 45,466 $ 52,165Operating income . . . . . . . . . . . . . . . . . . . . . . . . . . . . $ 17,614 $ 17,858 $ 18,526 $ 32,365Net (loss) income . . . . . . . . . . . . . . . . . . . . . . . . . . . . $ 10,535 $ 11,194 $ 12,055 $ 20,775Basic weighted average common shares
outstanding . . . . . . . . . . . . . . . . . . . . . . . . . . . . . . . 67,866,667 67,866,667 67,866,667 67,866,667Diluted weighted average common shares
outstanding . . . . . . . . . . . . . . . . . . . . . . . . . . . . . . . 67,867,790 67,868,475 67,875,729 67,870,726Basic earnings per common share . . . . . . . . . . . . . . . . $ 0.16 $ 0.16 $ 0.18 $ 0.31Diluted earnings per common share . . . . . . . . . . . . . . $ 0.16 $ 0.16 $ 0.18 $ 0.31
(1) Year-over-year growth % compares net sales for a particular period with net sales for the comparable prior year interim period.
- II-73 -
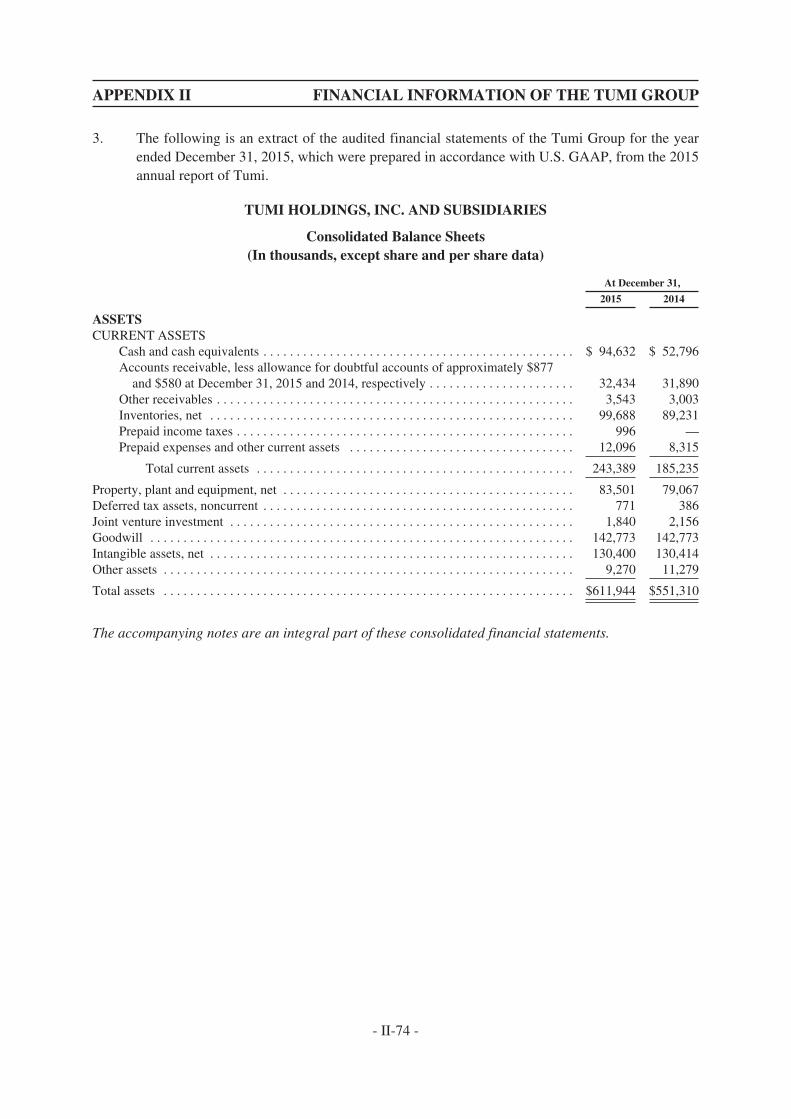
APPENDIX II FINANCIAL INFORMATION OF THE TUMI GROUP
3. The following is an extract of the audited financial statements of the Tumi Group for the yearended December 31, 2015, which were prepared in accordance with U.S. GAAP, from the 2015annual report of Tumi.
TUMI HOLDINGS, INC. AND SUBSIDIARIES
Consolidated Balance Sheets(In thousands, except share and per share data)
At December 31,
2015 2014
ASSETSCURRENT ASSETS
Cash and cash equivalents . . . . . . . . . . . . . . . . . . . . . . . . . . . . . . . . . . . . . . . . . . . . . . . $ 94,632 $ 52,796Accounts receivable, less allowance for doubtful accounts of approximately $877
and $580 at December 31, 2015 and 2014, respectively . . . . . . . . . . . . . . . . . . . . . . 32,434 31,890Other receivables . . . . . . . . . . . . . . . . . . . . . . . . . . . . . . . . . . . . . . . . . . . . . . . . . . . . . . 3,543 3,003Inventories, net . . . . . . . . . . . . . . . . . . . . . . . . . . . . . . . . . . . . . . . . . . . . . . . . . . . . . . . 99,688 89,231Prepaid income taxes . . . . . . . . . . . . . . . . . . . . . . . . . . . . . . . . . . . . . . . . . . . . . . . . . . . 996 —Prepaid expenses and other current assets . . . . . . . . . . . . . . . . . . . . . . . . . . . . . . . . . . 12,096 8,315
Total current assets . . . . . . . . . . . . . . . . . . . . . . . . . . . . . . . . . . . . . . . . . . . . . . . . 243,389 185,235
Property, plant and equipment, net . . . . . . . . . . . . . . . . . . . . . . . . . . . . . . . . . . . . . . . . . . . . 83,501 79,067Deferred tax assets, noncurrent . . . . . . . . . . . . . . . . . . . . . . . . . . . . . . . . . . . . . . . . . . . . . . . 771 386Joint venture investment . . . . . . . . . . . . . . . . . . . . . . . . . . . . . . . . . . . . . . . . . . . . . . . . . . . . 1,840 2,156Goodwill . . . . . . . . . . . . . . . . . . . . . . . . . . . . . . . . . . . . . . . . . . . . . . . . . . . . . . . . . . . . . . . . 142,773 142,773Intangible assets, net . . . . . . . . . . . . . . . . . . . . . . . . . . . . . . . . . . . . . . . . . . . . . . . . . . . . . . . 130,400 130,414Other assets . . . . . . . . . . . . . . . . . . . . . . . . . . . . . . . . . . . . . . . . . . . . . . . . . . . . . . . . . . . . . . 9,270 11,279
Total assets . . . . . . . . . . . . . . . . . . . . . . . . . . . . . . . . . . . . . . . . . . . . . . . . . . . . . . . . . . . . . . $611,944 $551,310
The accompanying notes are an integral part of these consolidated financial statements.
- II-74 -

APPENDIX II FINANCIAL INFORMATION OF THE TUMI GROUP
TUMI HOLDINGS, INC. AND SUBSIDIARIES
Consolidated Balance Sheets (continued)(In thousands, except share and per share data)
At December 31,
2015 2014
LIABILITIES AND STOCKHOLDERS’ EQUITYCURRENT LIABILITIES
Accounts payable . . . . . . . . . . . . . . . . . . . . . . . . . . . . . . . . . . . . . . . . . . . . . . . . . . . . . $ 35,844 $ 33,898Accrued expenses . . . . . . . . . . . . . . . . . . . . . . . . . . . . . . . . . . . . . . . . . . . . . . . . . . . . . 39,130 34,786Income taxes payable . . . . . . . . . . . . . . . . . . . . . . . . . . . . . . . . . . . . . . . . . . . . . . . . . . 615 2,334
Total current liabilities . . . . . . . . . . . . . . . . . . . . . . . . . . . . . . . . . . . . . . . . . . . . . 75,589 71,018
Other long-term liabilities . . . . . . . . . . . . . . . . . . . . . . . . . . . . . . . . . . . . . . . . . . . . . . . . . . . 12,775 11,407Deferred tax liabilities . . . . . . . . . . . . . . . . . . . . . . . . . . . . . . . . . . . . . . . . . . . . . . . . . . . . . . 42,734 42,002
Total liabilities . . . . . . . . . . . . . . . . . . . . . . . . . . . . . . . . . . . . . . . . . . . . . . . . . . . 131,098 124,427
Commitments and contingencies
STOCKHOLDERS’ EQUITYCommon stock—$0.01 par value; 350,000,000 shares authorized, 68,158,428 shares
issued and 67,394,756 shares outstanding as of December 31, 2015; 68,146,673shares issued and 67,868,867 shares outstanding as of December 31, 2014 . . . . . . 681 681
Preferred stock—$0.01 par value; 75,000,000 shares authorized and no shares issuedor outstanding as of December 31, 2015 and 2014 . . . . . . . . . . . . . . . . . . . . . . . . . . — —
Additional paid-in capital . . . . . . . . . . . . . . . . . . . . . . . . . . . . . . . . . . . . . . . . . . . . . . . 317,140 314,217Treasury stock, at cost; 763,672 and 277,806 shares as of December 31, 2015 and
December 31, 2014, respectively . . . . . . . . . . . . . . . . . . . . . . . . . . . . . . . . . . . . . . . (13,338) (4,874)Retained earnings . . . . . . . . . . . . . . . . . . . . . . . . . . . . . . . . . . . . . . . . . . . . . . . . . . . . . 182,747 119,734Accumulated other comprehensive loss . . . . . . . . . . . . . . . . . . . . . . . . . . . . . . . . . . . . (6,384) (2,875)
Total stockholders’ equity . . . . . . . . . . . . . . . . . . . . . . . . . . . . . . . . . . . . . . . . . . . 480,846 426,883
Total liabilities and stockholders’ equity . . . . . . . . . . . . . . . . . . . . . . . . . . . . . . . . . . . . . . . $611,944 $551,310
The accompanying notes are an integral part of these consolidated financial statements.
- II-75 -
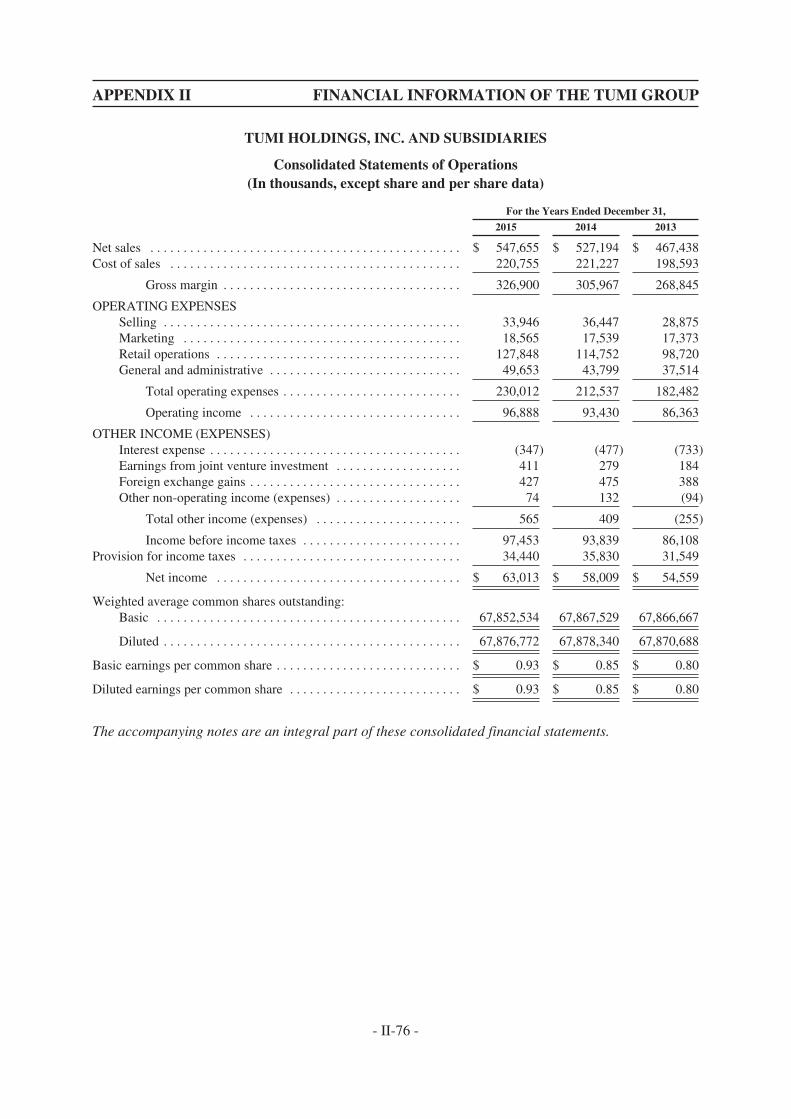
APPENDIX II FINANCIAL INFORMATION OF THE TUMI GROUP
TUMI HOLDINGS, INC. AND SUBSIDIARIES
Consolidated Statements of Operations(In thousands, except share and per share data)
For the Years Ended December 31,
2015 2014 2013
Net sales . . . . . . . . . . . . . . . . . . . . . . . . . . . . . . . . . . . . . . . . . . . . . . . $ 547,655 $ 527,194 $ 467,438Cost of sales . . . . . . . . . . . . . . . . . . . . . . . . . . . . . . . . . . . . . . . . . . . . 220,755 221,227 198,593
Gross margin . . . . . . . . . . . . . . . . . . . . . . . . . . . . . . . . . . . . 326,900 305,967 268,845
OPERATING EXPENSESSelling . . . . . . . . . . . . . . . . . . . . . . . . . . . . . . . . . . . . . . . . . . . . . 33,946 36,447 28,875Marketing . . . . . . . . . . . . . . . . . . . . . . . . . . . . . . . . . . . . . . . . . . 18,565 17,539 17,373Retail operations . . . . . . . . . . . . . . . . . . . . . . . . . . . . . . . . . . . . . 127,848 114,752 98,720General and administrative . . . . . . . . . . . . . . . . . . . . . . . . . . . . . 49,653 43,799 37,514
Total operating expenses . . . . . . . . . . . . . . . . . . . . . . . . . . . 230,012 212,537 182,482
Operating income . . . . . . . . . . . . . . . . . . . . . . . . . . . . . . . . 96,888 93,430 86,363
OTHER INCOME (EXPENSES)Interest expense . . . . . . . . . . . . . . . . . . . . . . . . . . . . . . . . . . . . . . (347) (477) (733)Earnings from joint venture investment . . . . . . . . . . . . . . . . . . . 411 279 184Foreign exchange gains . . . . . . . . . . . . . . . . . . . . . . . . . . . . . . . . 427 475 388Other non-operating income (expenses) . . . . . . . . . . . . . . . . . . . 74 132 (94)
Total other income (expenses) . . . . . . . . . . . . . . . . . . . . . . 565 409 (255)
Income before income taxes . . . . . . . . . . . . . . . . . . . . . . . . 97,453 93,839 86,108Provision for income taxes . . . . . . . . . . . . . . . . . . . . . . . . . . . . . . . . . 34,440 35,830 31,549
Net income . . . . . . . . . . . . . . . . . . . . . . . . . . . . . . . . . . . . . $ 63,013 $ 58,009 $ 54,559
Weighted average common shares outstanding:Basic . . . . . . . . . . . . . . . . . . . . . . . . . . . . . . . . . . . . . . . . . . . . . . 67,852,534 67,867,529 67,866,667
Diluted . . . . . . . . . . . . . . . . . . . . . . . . . . . . . . . . . . . . . . . . . . . . . 67,876,772 67,878,340 67,870,688
Basic earnings per common share . . . . . . . . . . . . . . . . . . . . . . . . . . . . $ 0.93 $ 0.85 $ 0.80
Diluted earnings per common share . . . . . . . . . . . . . . . . . . . . . . . . . . $ 0.93 $ 0.85 $ 0.80
The accompanying notes are an integral part of these consolidated financial statements.
- II-76 -
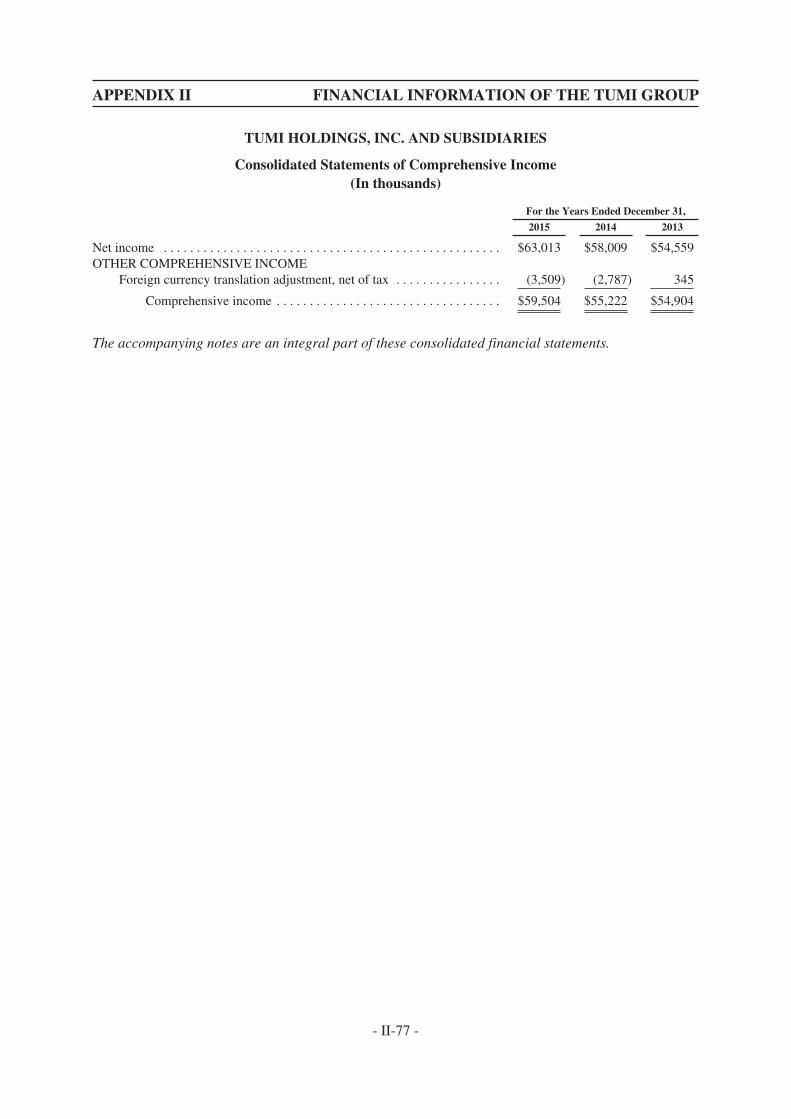
APPENDIX II FINANCIAL INFORMATION OF THE TUMI GROUP
TUMI HOLDINGS, INC. AND SUBSIDIARIES
Consolidated Statements of Comprehensive Income(In thousands)
For the Years Ended December 31,
2015 2014 2013
Net income . . . . . . . . . . . . . . . . . . . . . . . . . . . . . . . . . . . . . . . . . . . . . . . . . . . $63,013 $58,009 $54,559OTHER COMPREHENSIVE INCOME
Foreign currency translation adjustment, net of tax . . . . . . . . . . . . . . . . (3,509) (2,787) 345
Comprehensive income . . . . . . . . . . . . . . . . . . . . . . . . . . . . . . . . . . $59,504 $55,222 $54,904
The accompanying notes are an integral part of these consolidated financial statements.
- II-77 -
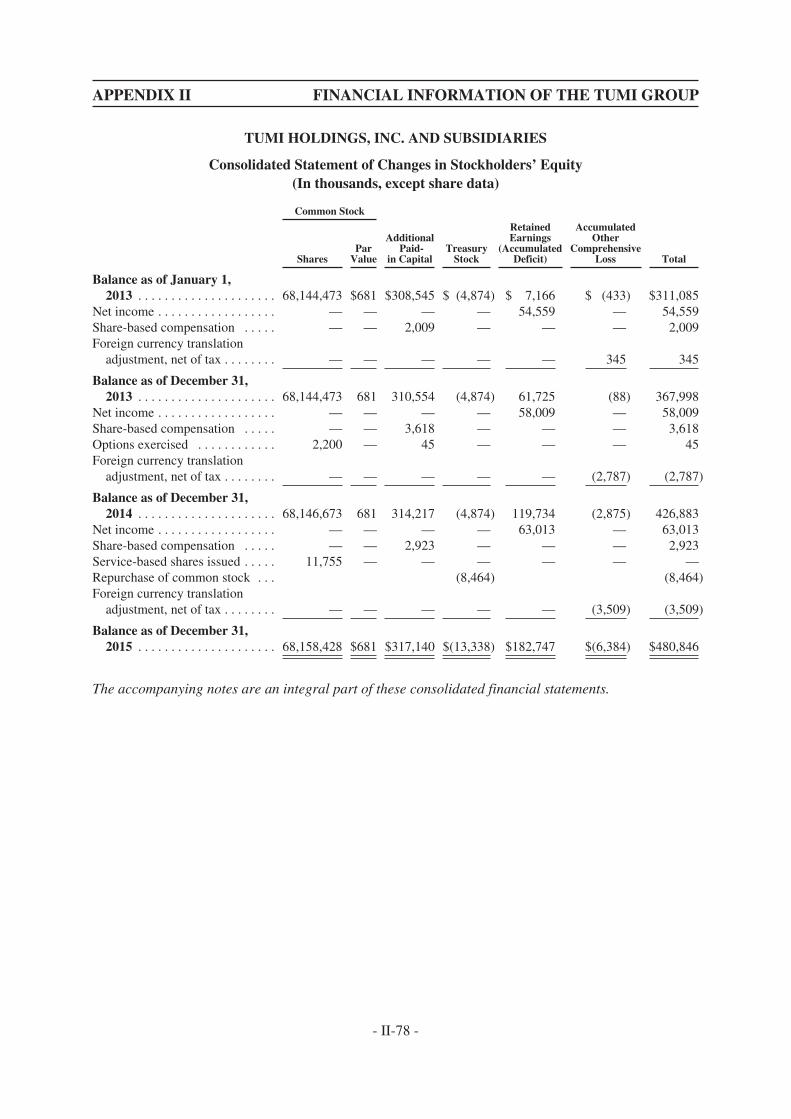
APPENDIX II FINANCIAL INFORMATION OF THE TUMI GROUP
TUMI HOLDINGS, INC. AND SUBSIDIARIES
Consolidated Statement of Changes in Stockholders’ Equity(In thousands, except share data)
Common Stock
SharesPar
Value
AdditionalPaid-
in CapitalTreasury
Stock
RetainedEarnings
(AccumulatedDeficit)
AccumulatedOther
ComprehensiveLoss Total
Balance as of January 1,2013 . . . . . . . . . . . . . . . . . . . . . 68,144,473 $681 $308,545 $ (4,874) $ 7,166 $ (433) $311,085
Net income . . . . . . . . . . . . . . . . . . — — — — 54,559 — 54,559Share-based compensation . . . . . — — 2,009 — — — 2,009Foreign currency translation
adjustment, net of tax . . . . . . . . — — — — — 345 345
Balance as of December 31,2013 . . . . . . . . . . . . . . . . . . . . . 68,144,473 681 310,554 (4,874) 61,725 (88) 367,998
Net income . . . . . . . . . . . . . . . . . . — — — — 58,009 — 58,009Share-based compensation . . . . . — — 3,618 — — — 3,618Options exercised . . . . . . . . . . . . 2,200 — 45 — — — 45Foreign currency translation
adjustment, net of tax . . . . . . . . — — — — — (2,787) (2,787)
Balance as of December 31,2014 . . . . . . . . . . . . . . . . . . . . . 68,146,673 681 314,217 (4,874) 119,734 (2,875) 426,883
Net income . . . . . . . . . . . . . . . . . . — — — — 63,013 — 63,013Share-based compensation . . . . . — — 2,923 — — — 2,923Service-based shares issued . . . . . 11,755 — — — — — —Repurchase of common stock . . . (8,464) (8,464)Foreign currency translation
adjustment, net of tax . . . . . . . . — — — — — (3,509) (3,509)
Balance as of December 31,2015 . . . . . . . . . . . . . . . . . . . . . 68,158,428 $681 $317,140 $(13,338) $182,747 $(6,384) $480,846
The accompanying notes are an integral part of these consolidated financial statements.
- II-78 -
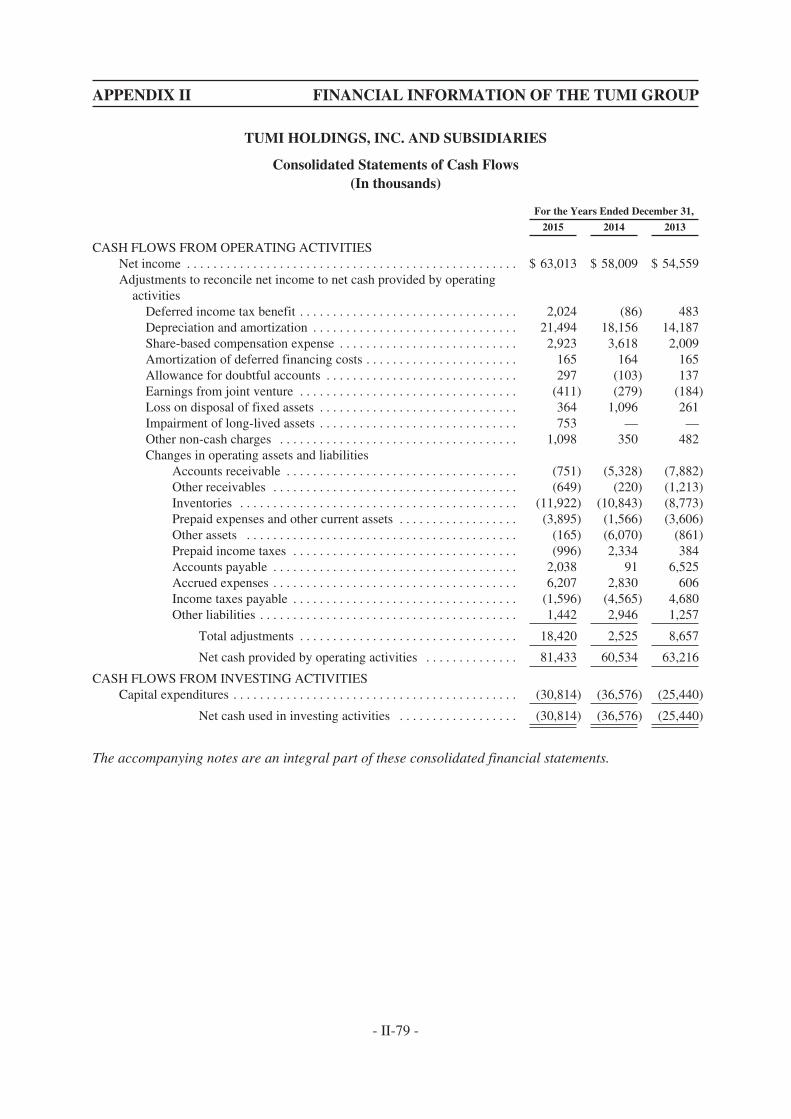
APPENDIX II FINANCIAL INFORMATION OF THE TUMI GROUP
TUMI HOLDINGS, INC. AND SUBSIDIARIES
Consolidated Statements of Cash Flows(In thousands)
For the Years Ended December 31,
2015 2014 2013
CASH FLOWS FROM OPERATING ACTIVITIESNet income . . . . . . . . . . . . . . . . . . . . . . . . . . . . . . . . . . . . . . . . . . . . . . . . . . $ 63,013 $ 58,009 $ 54,559Adjustments to reconcile net income to net cash provided by operating
activitiesDeferred income tax benefit . . . . . . . . . . . . . . . . . . . . . . . . . . . . . . . . . 2,024 (86) 483Depreciation and amortization . . . . . . . . . . . . . . . . . . . . . . . . . . . . . . . 21,494 18,156 14,187Share-based compensation expense . . . . . . . . . . . . . . . . . . . . . . . . . . . 2,923 3,618 2,009Amortization of deferred financing costs . . . . . . . . . . . . . . . . . . . . . . . 165 164 165Allowance for doubtful accounts . . . . . . . . . . . . . . . . . . . . . . . . . . . . . 297 (103) 137Earnings from joint venture . . . . . . . . . . . . . . . . . . . . . . . . . . . . . . . . . (411) (279) (184)Loss on disposal of fixed assets . . . . . . . . . . . . . . . . . . . . . . . . . . . . . . 364 1,096 261Impairment of long-lived assets . . . . . . . . . . . . . . . . . . . . . . . . . . . . . . 753 — —Other non-cash charges . . . . . . . . . . . . . . . . . . . . . . . . . . . . . . . . . . . . 1,098 350 482Changes in operating assets and liabilities
Accounts receivable . . . . . . . . . . . . . . . . . . . . . . . . . . . . . . . . . . . (751) (5,328) (7,882)Other receivables . . . . . . . . . . . . . . . . . . . . . . . . . . . . . . . . . . . . . (649) (220) (1,213)Inventories . . . . . . . . . . . . . . . . . . . . . . . . . . . . . . . . . . . . . . . . . . (11,922) (10,843) (8,773)Prepaid expenses and other current assets . . . . . . . . . . . . . . . . . . (3,895) (1,566) (3,606)Other assets . . . . . . . . . . . . . . . . . . . . . . . . . . . . . . . . . . . . . . . . . (165) (6,070) (861)Prepaid income taxes . . . . . . . . . . . . . . . . . . . . . . . . . . . . . . . . . . (996) 2,334 384Accounts payable . . . . . . . . . . . . . . . . . . . . . . . . . . . . . . . . . . . . . 2,038 91 6,525Accrued expenses . . . . . . . . . . . . . . . . . . . . . . . . . . . . . . . . . . . . . 6,207 2,830 606Income taxes payable . . . . . . . . . . . . . . . . . . . . . . . . . . . . . . . . . . (1,596) (4,565) 4,680Other liabilities . . . . . . . . . . . . . . . . . . . . . . . . . . . . . . . . . . . . . . . 1,442 2,946 1,257
Total adjustments . . . . . . . . . . . . . . . . . . . . . . . . . . . . . . . . . 18,420 2,525 8,657
Net cash provided by operating activities . . . . . . . . . . . . . . 81,433 60,534 63,216
CASH FLOWS FROM INVESTING ACTIVITIESCapital expenditures . . . . . . . . . . . . . . . . . . . . . . . . . . . . . . . . . . . . . . . . . . . (30,814) (36,576) (25,440)
Net cash used in investing activities . . . . . . . . . . . . . . . . . . (30,814) (36,576) (25,440)
The accompanying notes are an integral part of these consolidated financial statements.
- II-79 -

APPENDIX II FINANCIAL INFORMATION OF THE TUMI GROUP
TUMI HOLDINGS, INC. AND SUBSIDIARIES
Consolidated Statements of Cash Flows (continued)(In thousands)
For the Years Ended December 31,
2015 2014 2013
CASH FLOWS FROM FINANCING ACTIVITIESPayments on revolving credit facility . . . . . . . . . . . . . . . . . . . . . . . . . . . . . . . $ — $ (8,000) $(37,000)Options exercised . . . . . . . . . . . . . . . . . . . . . . . . . . . . . . . . . . . . . . . . . . . . . . — 45 —Repurchases of common stock, including shares withheld in satisfaction of
tax obligations . . . . . . . . . . . . . . . . . . . . . . . . . . . . . . . . . . . . . . . . . . . . . . . (8,464) — —
Net cash used in financing activities . . . . . . . . . . . . . . . . . . . . . . . . . . . . (8,464) (7,955) (37,000)
Effect of exchange rate changes on cash . . . . . . . . . . . . . . . . . . . . . . . . . . . . . . . . (319) (820) 100
Net increase in cash and cash equivalents . . . . . . . . . . . . . . . . . . . . . . . 41,836 15,183 876Cash and cash equivalents at beginning of period . . . . . . . . . . . . . . . . . . . . . . . . . 52,796 37,613 36,737
Cash and cash equivalents at end of period . . . . . . . . . . . . . . . . . . . . . . . . . . . . . . $94,632 $52,796 $ 37,613
Supplemental disclosures of cash flow information:Cash paid for interest . . . . . . . . . . . . . . . . . . . . . . . . . . . . . . . . . . . . . . . . . . . $ 105 $ 117 $ 320
Cash paid for income taxes . . . . . . . . . . . . . . . . . . . . . . . . . . . . . . . . . . . . . . . $34,584 $38,021 $ 26,441
Supplemental disclosure of noncash investing activities:Accrued capital expenditures . . . . . . . . . . . . . . . . . . . . . . . . . . . . . . . . . . . . . $ 5,641 $ 7,894 $ 5,904
The accompanying notes are an integral part of these consolidated financial statements.
- II-80 -
APPENDIX II FINANCIAL INFORMATION OF THE TUMI GROUP
TUMI HOLDINGS, INC. AND SUBSIDIARIES
Notes to Consolidated Financial Statements
1. SUMMARY OF SIGNIFICANT ACCOUNTING POLICIES
Organization and Business
Tumi Holdings, Inc. (together with its subsidiaries, the “Company”) is a leading designer,producer and marketer of a comprehensive line of travel and business products and accessories inmultiple categories. The Company’s product offerings include travel bags, business cases, totes,handbags, business and travel accessories and small leather goods. The Company designs its productsfor, and markets its products to, sophisticated professionals, frequent travelers and brand-consciousindividuals who enjoy the premium status and durability of Tumi products. The Company sells itsproducts through a network of company-owned full-price stores and outlet stores, partner stores,concessions, shop-in-shops, specialty luggage shops, high-end department stores and e-commercedistribution channels. The Company has approximately 2,000 points of distribution in over 75countries, and its global distribution network is enhanced by the use of its three logistics facilitieslocated in the United States, Europe and Asia. The Company designs its products in its U.S. designstudios and selectively collaborates with well-known, international, industrial and fashion designers forlimited edition product lines. Production is sourced globally through a network of suppliers based inAsia, many of which are longtime suppliers, and the Caribbean.
The Company’s business is seasonal in nature and, as a result, net sales and working capitalrequirements fluctuate from quarter to quarter. The Company’s fourth quarter is a significant periodwith regard to the results of operations due to increased Direct-to-Consumer sales during the holidayseason in North America and Europe. During the fourth quarter, the Company expects inventory levels,accounts payable and accrued expenses to increase commensurate with net sales.
Registered Secondary Offerings of the Company’s Common Stock
In April 2013, the Company completed a secondary offering of common stock sold by certainof the Company’s stockholders. The selling stockholders, which included certain of the Company’sofficers, sold 11,661,000 shares of our common stock in the offering (inclusive of 1,521,000 shares ofcommon stock from the full exercise of the option granted to the underwriters to purchase additionalshares from certain of the selling stockholders). The Company did not receive any proceeds from thesale of shares by the selling stockholders. The offering expenses incurred by the Company wereapproximately $477,000, which included legal and accounting costs and various other fees associatedwith the offering.
In September 2014, the Company completed an additional secondary offering of common stocksold by certain of the Company’s stockholders. The selling stockholders, comprised of funds managedby, or affiliated with, Doughty Hanson sold 8,000,000 shares of our common stock in the offering. TheCompany did not receive any proceeds from the sale of shares by the selling stockholders. The offeringexpenses incurred by the Company were approximately $196,000, which included legal andaccounting costs and various other fees associated with the offering.
- II-81 -
APPENDIX II FINANCIAL INFORMATION OF THE TUMI GROUP
TUMI HOLDINGS, INC. AND SUBSIDIARIES
Notes to Consolidated Financial Statements
Principles of Consolidation
The consolidated financial statements of the Company include the accounts of Tumi Holdings,Inc. and its subsidiaries. Intercompany accounts and transactions have been eliminated inconsolidation.
The Company used the equity method of accounting for its joint venture investment, which was50% owned during the years ended December 31, 2015 and December 31, 2014, as the Company hadthe ability to exercise significant influence over the operating and financial policies of the joint venturebut did not control the joint venture. The Company’s share of the earnings or losses of the joint venturewas included in the Consolidated Statements of Operations as “Earnings from Joint VentureInvestment.” During the first quarter of 2016, the Company completed its acquisition of the remaining50% stake in its joint venture.
Segment Reporting
Segment information has been provided on the basis of the Company’s four reportablesegments for all periods presented (see Note 14—Segment Information), which are: (i) Direct-to-Consumer North America; (ii) Indirect-to-Consumer North America; (iii) Direct-to-ConsumerInternational; and (iv) Indirect-to-Consumer International.
Estimates
The preparation of financial statements in conformity with accounting principles generallyaccepted in the United States of America requires management to make estimates and assumptions thataffect the reported amounts of assets and liabilities and disclosure of contingent assets and liabilities atthe date of the financial statements and the reported amounts of revenues and expenses during thereporting period. Significant estimates include valuation of goodwill and intangibles, allowance fordoubtful accounts, adjustments for slow-moving and obsolete inventory, accrued warranties,realization of deferred tax assets, income tax uncertainties, the valuation of share-based compensationand related forfeiture rates, and useful lives of assets. Actual results could differ materially from thoseestimates.
Reclassification
Certain prior period amounts have been reclassified to conform to the current year presentation.
Revenue Recognition
Revenue is generated from the sale of the Company’s products and is classified as “Net Sales”in the Company’s Consolidated Statements of Operations. The Company recognizes revenue in itsDirect-to-Consumer segments, including e-commerce, when inventory is received by the customer andthe related title passes. Revenue related to concession and consignment locations is recognized wheninventory is received by the end customer and the related title passes. In the Company’sIndirect-to-Consumer segments (which includes wholesale arrangements), revenue related to partnerstores, shop-in-shops and Tumi-defined corners, each of which is owned and operated by an
- II-82 -
APPENDIX II FINANCIAL INFORMATION OF THE TUMI GROUP
TUMI HOLDINGS, INC. AND SUBSIDIARIES
Notes to Consolidated Financial Statements
independent third-party wholesaler, is recognized when inventory is in possession of the wholesalecustomers or their appointed carriers, at which point the related title passes. Provisions for discounts,rebates to customers and returns are recorded as a reduction of revenue in the same period as therelated sales. Revenue associated with gift cards is recognized upon redemption. Revenue from giftcards and the amount of revenue recognized for gift cards not redeemed (“breakage”) is immaterial tothese consolidated financial statements. Amounts billed to customers for delivery costs are classified asa component of net sales and the related delivery costs are classified as a component of cost of sales.Sales and value added tax collected from customers and remitted to governmental authorities areaccounted for on a net basis and are excluded from net sales in the Consolidated Statements ofOperations.
Cash and Cash Equivalents
The Company’s cash and cash equivalents are defined as cash and short-term highly liquidinvestments with an original maturity of three months or less from the date of purchase. TheCompany’s cash and cash equivalents consist of cash in banks as of December 31, 2015 and 2014.
Effective January 1, 2013, funds held in “noninterest-bearing transaction accounts” areaggregated with any interest-bearing accounts, and the combined total is insured up to a maximum of$250,000. The term “noninterest-bearing transaction account” includes a traditional checking accountor demand deposit account on which the insured depository institution pays no interest. The totalexcess of the bank account balances over the Federal Deposit Insurance Corporation (“ FDIC”) limiteffective at each period end was approximately $83,728,000 and $46,300,000 at December 31, 2015and 2014, respectively. The total cash in international bank accounts, which is not covered under theFDIC, was approximately $10,330,000 and $6,245,000 at December 31, 2015 and 2014, respectively.
Accounts Receivable and Allowance for Doubtful Accounts
Credit is extended to customers based on evaluation of a customer’s financial condition.Generally, collateral is not required. Accounts receivable are due within 30 days to 90 days and arestated at amounts due from customers net of an allowance for doubtful accounts. Accounts receivableoutstanding longer than the contractual payment terms are considered past due.
The Company determines its allowance for doubtful accounts by considering a number offactors, including the length of time trade receivables are past due, the Company’s previous losshistory, the customer’s current ability to pay its obligation and the condition of the general economyand the industry as a whole. The Company writes off accounts receivable when they becomeuncollectible, and payments subsequently received on such receivables are credited to the allowancefor doubtful accounts.
- II-83 -
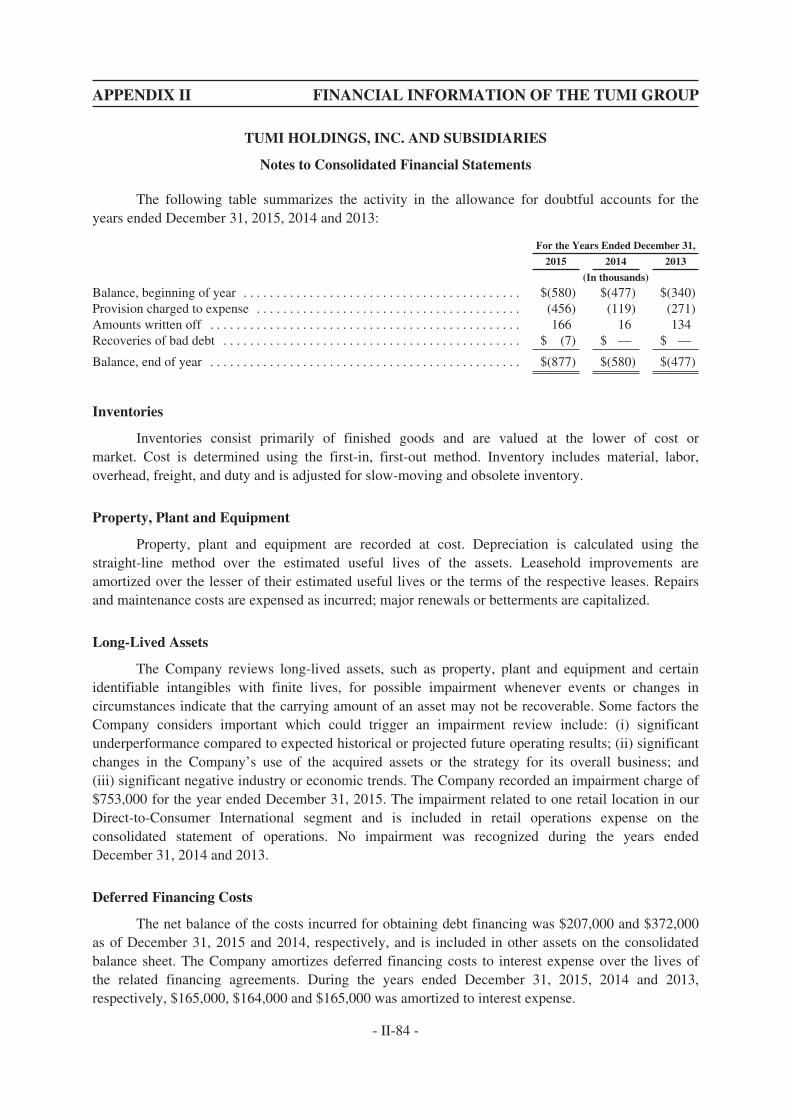
APPENDIX II FINANCIAL INFORMATION OF THE TUMI GROUP
TUMI HOLDINGS, INC. AND SUBSIDIARIES
Notes to Consolidated Financial Statements
The following table summarizes the activity in the allowance for doubtful accounts for theyears ended December 31, 2015, 2014 and 2013:
For the Years Ended December 31,
2015 2014 2013
(In thousands)
Balance, beginning of year . . . . . . . . . . . . . . . . . . . . . . . . . . . . . . . . . . . . . . . . . . $(580) $(477) $(340)Provision charged to expense . . . . . . . . . . . . . . . . . . . . . . . . . . . . . . . . . . . . . . . . (456) (119) (271)Amounts written off . . . . . . . . . . . . . . . . . . . . . . . . . . . . . . . . . . . . . . . . . . . . . . . 166 16 134Recoveries of bad debt . . . . . . . . . . . . . . . . . . . . . . . . . . . . . . . . . . . . . . . . . . . . . $ (7) $ — $ —
Balance, end of year . . . . . . . . . . . . . . . . . . . . . . . . . . . . . . . . . . . . . . . . . . . . . . . $(877) $(580) $(477)
Inventories
Inventories consist primarily of finished goods and are valued at the lower of cost ormarket. Cost is determined using the first-in, first-out method. Inventory includes material, labor,overhead, freight, and duty and is adjusted for slow-moving and obsolete inventory.
Property, Plant and Equipment
Property, plant and equipment are recorded at cost. Depreciation is calculated using thestraight-line method over the estimated useful lives of the assets. Leasehold improvements areamortized over the lesser of their estimated useful lives or the terms of the respective leases. Repairsand maintenance costs are expensed as incurred; major renewals or betterments are capitalized.
Long-Lived Assets
The Company reviews long-lived assets, such as property, plant and equipment and certainidentifiable intangibles with finite lives, for possible impairment whenever events or changes incircumstances indicate that the carrying amount of an asset may not be recoverable. Some factors theCompany considers important which could trigger an impairment review include: (i) significantunderperformance compared to expected historical or projected future operating results; (ii) significantchanges in the Company’s use of the acquired assets or the strategy for its overall business; and(iii) significant negative industry or economic trends. The Company recorded an impairment charge of$753,000 for the year ended December 31, 2015. The impairment related to one retail location in ourDirect-to-Consumer International segment and is included in retail operations expense on theconsolidated statement of operations. No impairment was recognized during the years endedDecember 31, 2014 and 2013.
Deferred Financing Costs
The net balance of the costs incurred for obtaining debt financing was $207,000 and $372,000as of December 31, 2015 and 2014, respectively, and is included in other assets on the consolidatedbalance sheet. The Company amortizes deferred financing costs to interest expense over the lives ofthe related financing agreements. During the years ended December 31, 2015, 2014 and 2013,respectively, $165,000, $164,000 and $165,000 was amortized to interest expense.
- II-84 -
APPENDIX II FINANCIAL INFORMATION OF THE TUMI GROUP
TUMI HOLDINGS, INC. AND SUBSIDIARIES
Notes to Consolidated Financial Statements
Goodwill and Intangible Assets
Goodwill represents the excess of the purchase price over the fair value of net assets acquired,including intangible assets. Indefinite-lived intangible assets consist of brand/trade name. Goodwilland brand/trade name are not being amortized in accordance with the provisions of the FASB’sguidance, which requires these assets to be tested for impairment annually and whenever events orchanges in circumstances indicate that the carrying value may not be recoverable. The Company’sannual impairment testing date is the first day of its fourth quarter. No impairment was recognized inthe years ended December 31, 2015, 2014 and 2013.
The quantitative goodwill impairment test, if necessary, is a two-step process. Under the first oftwo steps, the Company compares the fair value of a reporting unit to its carrying amount, includinggoodwill, to identify a potential impairment. If the fair value of the reporting unit is less than itscarrying value, an indication of goodwill impairment exists for such reporting unit and the enterprisemust perform step two of the impairment test to measure the impairment, if any. Under step two, animpairment loss is recognized for any excess of the carrying amount of the reporting unit’s goodwillover the implied fair value of that goodwill. The implied fair value of goodwill is determined byallocating the fair value of the reporting unit in a manner similar to a purchase price allocation: the fairvalue of the reporting unit is allocated to all of the assets and liabilities of that unit (including anyunrecognized intangible assets) and the residual fair value after this allocation is the implied fair valueof the reporting unit goodwill.
In 2015, the Company performed a qualitative analysis and determined that it is more likelythan not that the fair values of each of the Company’s reporting units and indefinite-lived tradename isgreater than their respective carrying values. As a result, the Company believes the fair values of eachof the Company’s reporting units and indefinite-lived tradename substantially exceeds their respectivecarrying values.
The Company uses techniques including discounted expected future cash flows (Level 3 input),or DCF, to test goodwill. Indefinite-lived intangible assets are tested for impairment through an incomeapproach known as the relief from royalty method. A discounted cash flow analysis calculates the fairvalue by estimating the after-tax cash flows attributable to a reporting unit or asset and thendiscounting the after-tax cash flows to a present value using a risk-adjusted discount rate. Assumptionsused in DCF and the relief from royalty method require the exercise of significant judgment includingjudgment about appropriate royalty rates, discount rates and terminal values, growth rates and theamount and timing of expected future cash flows. Although the Company believes the historicalassumptions and estimates made are reasonable and appropriate, different assumptions and estimatescould materially impact its reported financial results.
The Company’s reporting units for the purpose of goodwill impairment testing are thereportable business segments: (i) Direct-to-Consumer North America, (ii) Indirect-to-Consumer NorthAmerica, (iii) Direct-to-Consumer International and (iv) Indirect-to-Consumer International. Thereporting units were determined in accordance with the guidance on reportable segments in FASBASC 280-10-50-1. There is no discrete financial information available to the Company for itsoperations below its reportable business segments.
- II-85 -
APPENDIX II FINANCIAL INFORMATION OF THE TUMI GROUP
TUMI HOLDINGS, INC. AND SUBSIDIARIES
Notes to Consolidated Financial Statements
Share-Based Compensation
Share-based compensation represents the cost related to equity awards granted to employeesunder the 2012 Plan. The Company measures share-based compensation cost at the grant date based onthe estimated fair value of the award and recognizes the cost on a straight-line basis (net of estimatedforfeitures) over the vesting period. The Company estimates the fair value of stock options using theBlack-Scholes valuation model. All share-based compensation costs are recorded in cost of sales or thevarious operating expense lines in the consolidated statements of operations based on the employee’srespective function (see Note 16—Share-Based Compensation Plans and Awards).
Performance-based RSUs are awards denominated in units that are settled in shares of theCompany’s common stock upon vesting. The vesting of these units is subject to the employee’scontinuing employment and the Company’s achievement of certain performance goals during theapplicable vesting period. The fair value of performance-based RSUs is based on the fair value of theCompany’s common stock on the date of grant. Expense for performance-based RSUs is recognizedover the employees’ requisite service period when the attainment of the performance goal is deemedprobable.
Service-based RSUs are awards denominated in units that are settled in shares of theCompany’s common stock upon vesting. The vesting of these units is subject to the employee’scontinuing employment or a director’s continuing service on the Board of Directors over a definedperiod of time. The fair value of service-based RSUs is based on the fair value of the Company’scommon stock on the date of grant.
Fair Value Measurements
The Company applies the FASB’s guidance for “Fair Value Measurements.” Under thisstandard, fair value is defined as the price that would be received to sell an asset or paid to transfer aliability (i.e., the “exit price”) in an orderly transaction between market participants at the measurementdate.
In determining fair value, the Company uses various valuation approaches. The hierarchy ofthose valuation approaches is broken down into three levels based on the reliability of inputs asfollows:
Level 1— Inputs that are quoted prices in active markets for identical assets or liabilities that theCompany has the ability to access at the measurement date. An active market for theasset or liability is a market in which transactions for the asset or liability occur withsufficient frequency and volume to provide pricing information on an ongoing basis.The valuation under this approach does not entail a significant degree of judgment.
Level 2— Inputs, other than quoted prices included within Level 1, that are observable for theasset or liability, either directly or indirectly. Level 2 inputs include: quoted prices forsimilar assets or liabilities in active markets, inputs other than quoted prices that areobservable for the asset or liability (e.g., interest rates and yield curves observable atcommonly quoted intervals or current market) and contractual prices for the underlyingfinancial instrument, as well as other relevant economic measures.
- II-86 -
APPENDIX II FINANCIAL INFORMATION OF THE TUMI GROUP
TUMI HOLDINGS, INC. AND SUBSIDIARIES
Notes to Consolidated Financial Statements
Level 3— Inputs that are unobservable for the asset or liability. Unobservable inputs are used tomeasure fair value to the extent that observable inputs are not available, therebyallowing for situations in which there is little, if any, market activity for the asset orliability at the measurement date.
The Company’s non-financial assets which are subject to nonrecurring fair value measurementsinclude goodwill, intangible assets and property, plant and equipment. These assets are recorded atcarrying value. However, whenever events or changes in circumstances indicate that their carryingvalue may not be fully recoverable (or at least annually for goodwill and indefinite-lived intangibleassets), such assets are assessed for impairment and, if applicable, written down to and recorded at fairvalue. To measure fair value for such assets, the Company uses techniques including DCF. Thesemeasures of fair value, and related inputs, are considered level 2 measures under the fair valuehierarchy.
Due to their short term maturity, management believes the carrying amounts of cash and cashequivalents, accounts receivable and accounts payable were reasonable estimates of their fair value asof December 31, 2015 and 2014.
Income Taxes
The Company utilizes the asset and liability method of accounting for income taxes, underwhich deferred income taxes are recognized for the tax consequences of temporary differences byapplying enacted statutory tax rates applicable to future years to differences between the financialstatement carrying amounts and the tax basis of existing assets and liabilities. The effect on deferredtaxes of a change in tax rates is recognized in income in the period that includes the enactment date. Avaluation allowance is provided when it is more likely than not that some portion or all of the deferredtax assets will not be realized.
The Company applies the FASB’s provisions for uncertain tax positions. The Company utilizesthe two step process to determine the amount of recognized tax benefit. For tax positions meeting themore-likely-than-not threshold, the amount recognized in the consolidated financial statements is thelargest benefit that has a greater than 50% likelihood of being realized upon ultimate settlement withthe relevant tax authority. The Company recognizes interest and penalties associated with uncertain taxpositions as a component of income tax expense.
Foreign Currency Translation
The financial statements of the Company’s branch offices and subsidiaries in Europe aremeasured using a currency other than the U.S. dollar.
Assets and liabilities recorded in functional currencies other than U.S. dollars are translated intoU.S. dollars at the year-end rate of exchange. Revenues and expenses are translated at the averageexchange rates for the year. The resulting translation adjustments are charged or credited to othercomprehensive income.
- II-87 -

APPENDIX II FINANCIAL INFORMATION OF THE TUMI GROUP
TUMI HOLDINGS, INC. AND SUBSIDIARIES
Notes to Consolidated Financial Statements
Realized foreign currency transaction gains and losses on transactions denominated incurrencies other than the functional currency, such as those resulting from the settlement of receivablesand payables denominated in foreign currency, are included in the earnings of the current period in“Foreign Exchange Gains (Losses).”
Unrealized gains and losses on intercompany foreign currency transactions that are of a long-term investment nature (that is settlement is not planned or anticipated in the foreseeable future) arerecorded in other comprehensive income. Unrealized gains and losses on intercompany foreigncurrency transactions for which settlement is anticipated are included in the determination of netincome.
During the year ended December 31, 2014, the Company deemed $36,500,000 of intercompanyreceivables from its German subsidiary to be permanently invested. Accordingly, these amounts havebeen reclassified to contributed capital, reflecting the permanent nature of the investment.
Advertising Costs
The Company expenses advertising costs as incurred. Total advertising expenses, excludingcooperative advertising costs, included in operating expenses in the accompanying ConsolidatedStatements of Operations were approximately $9,383,000, $7,935,000 and $8,502,000 for the yearsended December 31, 2015, 2014 and 2013, respectively.
Cooperative Advertising Costs
The Company accounts for certain advertising costs in accordance with the FASB’s guidancefor “Customer Payments and Incentives,” ASC Topic 605-50. This standard provides guidance withrespect to the statement of operations classification of and the accounting for recognition andmeasurement of consideration given by a vendor to a customer, which includes sales incentive offerslabeled as discounts, coupons, rebates and free products or services as well as arrangements labeled asslotting fees, cooperative advertising and buy downs. As per the FASB’s guidance, the Companyrecords cooperative advertising costs in marketing expenses, as it receives a “separately identifiablebenefit in exchange for the consideration.” Additionally, the Company is able to establish the fair valueof the cooperative advertising costs from the information obtained from the retailer. Based on thisinformation, the Company has determined that the amount of consideration paid does not exceed thefair value of the benefit received. The Company recognized cooperative advertising expense ofapproximately $3,212,000, $3,148,000 and $3,234,000 as a marketing expense in the accompanyingConsolidated Statements of Operations for the years ended December 31, 2015, 2014 and 2013,respectively.
Store Preopening Expenses
Costs incurred prior to the opening of a new store are expensed as incurred.
Warranties
The Company provides its customers with a product warranty subsequent to the sale of itsproducts. The Company’s warranty policy provides for one year of worry-free service as well as an
- II-88 -

APPENDIX II FINANCIAL INFORMATION OF THE TUMI GROUP
TUMI HOLDINGS, INC. AND SUBSIDIARIES
Notes to Consolidated Financial Statements
additional warranty against manufacturers’ defects or flaws in construction for between two and fiveyears, depending on the product line. The Company recognizes estimated costs associated with thelimited warranty at the time of sale of its products. The warranty reserve is based on historicalexperience.
Leases
The Company leases certain office, distribution and retail facilities. In some cases, the leaseagreements are subject to renewal options and provide for the payment of taxes, insurance andmaintenance. Certain leases contain escalation clauses resulting from the pass-through of increases inoperating costs, property taxes and the effect on costs from changes in consumer price indices. Rentexpense for noncancelable operating leases with scheduled rent increases and/or landlord incentives isrecognized on a straight-line basis over the lease term, including any applicable rent holidays,beginning on the earlier of the lease commencement date or the date the Company takes possesion ofthe leased space. The excess of straight-line rent expense over the scheduled payment amounts andlandlord incentives is recorded as a deferred rent obligation. As of December 31, 2015 andDecember 31, 2014, deferred rent obligations of approximately $12,026,000 and $10,826,000,respectively, were classified within other long-term liabilities in the Company’s consolidated balancesheets.
Certain rentals are also contingent upon factors such as sales. Contingent rentals are recognizedwhen the achievement of the target (i.e., sales levels) which triggers the related payment is consideredprobable. Such expenses were not material for the years ended December 31, 2015, 2014 and 2013.
Treasury Stock
The Company periodically repurchases treasury stock. These treasury stock transactions havebeen recorded using the cost method.
Earnings per Common Share
Basic earnings per common share is computed by dividing income available to commonstockholders by the weighted-average common shares outstanding for the period. Diluted earnings percommon share is computed on the basis of the weighted-average number of common sharesoutstanding plus the effect of dilutive potential common shares outstanding during the period using thetreasury stock method.
2. RECENTLY ISSUED ACCOUNTING PRONOUNCEMENTS
In May 2014, the FASB issued ASU No. 2014-09, “Revenue from Contracts with Customers(Topic 606)” which amended the existing accounting standards for revenue recognition. ASU 2014-09establishes principles for recognizing revenue upon the transfer of promised goods or services tocustomers, in an amount that reflects the expected consideration received in exchange for those goodsor services. The guidance was effective for fiscal years beginning after December 15, 2016 and forinterim periods within those fiscal years. In recent re-deliberations, the FASB approved a one-yeardeferral of the effective date of this guidance, such that it will be effective on January 1, 2018. Early
- II-89 -
APPENDIX II FINANCIAL INFORMATION OF THE TUMI GROUP
TUMI HOLDINGS, INC. AND SUBSIDIARIES
Notes to Consolidated Financial Statements
adoption is not permitted. The amendments may be applied retrospectively to each prior periodpresented or retrospectively with the cumulative effect recognized as of the date of initial application.The Company is currently in the process of evaluating the impact of adoption of the ASU on itsconsolidated financial statements, but does not expect the impact to be material.
In June 2014, the FASB issued ASU 2014-12, “Accounting for Share-Based Payments Whenthe Terms of an Award Provide That a Performance Target Could Be Achieved After the RequisiteService Period (Topic 718)”. ASU 2014-12 requires that a performance target that affects vesting andthat could be achieved after the requisite service period be treated as a performance condition. As such,the performance target should not be reflected in estimating the grant-date fair value of the award.ASU 2014-12 is effective for annual reporting periods beginning after December 15, 2015, with earlyadoption permitted. The Company is currently in the process of evaluating the impact of adoption ofthe ASU on its consolidated financial statements, but does not expect the impact to be material.
In August 2014, the FASB issued ASU 2014-15, “Presentation of Financial Statements—GoingConcern (Subtopic 205-40): Disclosure of Uncertainties about an Entity’s Ability to Continue as aGoing Concern”. ASU 2014-15 addresses management’s responsibility in evaluating whether there issubstantial doubt about a company’s ability to continue as a going concern and to provide relatedfootnote disclosures. Management’s evaluation should be based on relevant conditions and events thatare known and reasonably knowable at the date that the financial statements are issued. This guidanceis effective for fiscal years ending after December 15, 2016 and for interim periods within those fiscalyears, with early adoption permitted. The Company is currently in the process of evaluating the impactof adoption of the ASU on its consolidated financial statements, but does not expect the impact to bematerial.
In April 2015, the FASB issued ASU 2015-03, “Simplifying the Presentation of Debt IssuanceCosts (Subtopic 835-30)” which requires debt issuance costs related to a recognized debt liability to bepresented in the balance sheet as a direct deduction from the carrying amount of that debt liability,consistent with debt discounts or premiums. ASU 2015-03 is effective for annual reporting periodsbeginning after December 15, 2015, with early adoption permitted. The Company is currently in theprocess of evaluating the impact of adoption of the ASU on its consolidated financial statements, butdoes not expect the impact to be material.
In July 2015, the FASB issued ASU 2015-11, “Simplifying the Measurement of Inventory.”Under this ASU, inventory will be measured at the “lower of cost and net realizable value” and optionsthat currently exist for “market value” will be eliminated. The ASU defines net realizable value as the“estimated selling prices in the ordinary course of business, less reasonably predictable costs ofcompletion, disposal, and transportation.” No other changes were made to the current guidance oninventory measurement. ASU 2015-11 is effective for interim and annual periods beginning afterDecember 15, 2016, with early adoption permitted. The Company is currently in the process ofevaluating the impact of adoption of the ASU on its consolidated financial statements, but does notexpect the impact to be material.
In September 2015, the FASB issued ASU 2015-16, “Simplifying the Accounting forMeasurement-Period Adjustments (Topic 805: Business Combinations)” which eliminates the
- II-90 -
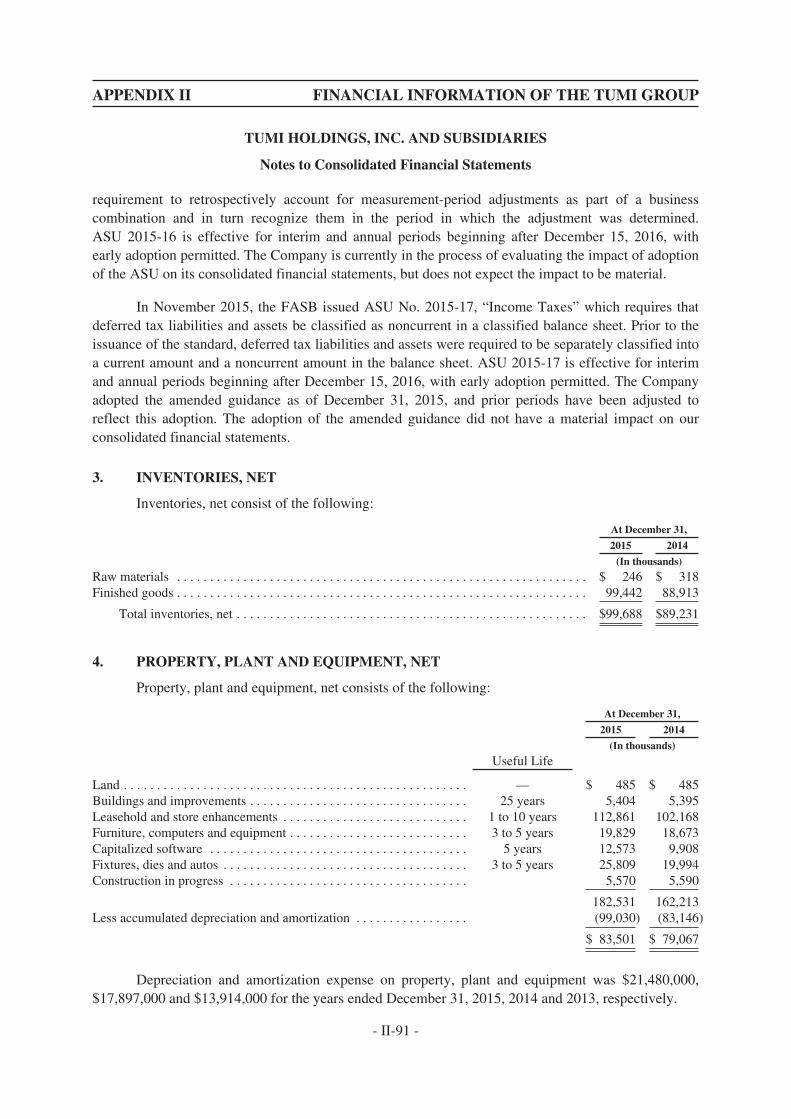
APPENDIX II FINANCIAL INFORMATION OF THE TUMI GROUP
TUMI HOLDINGS, INC. AND SUBSIDIARIES
Notes to Consolidated Financial Statements
requirement to retrospectively account for measurement-period adjustments as part of a businesscombination and in turn recognize them in the period in which the adjustment was determined.ASU 2015-16 is effective for interim and annual periods beginning after December 15, 2016, withearly adoption permitted. The Company is currently in the process of evaluating the impact of adoptionof the ASU on its consolidated financial statements, but does not expect the impact to be material.
In November 2015, the FASB issued ASU No. 2015-17, “Income Taxes” which requires thatdeferred tax liabilities and assets be classified as noncurrent in a classified balance sheet. Prior to theissuance of the standard, deferred tax liabilities and assets were required to be separately classified intoa current amount and a noncurrent amount in the balance sheet. ASU 2015-17 is effective for interimand annual periods beginning after December 15, 2016, with early adoption permitted. The Companyadopted the amended guidance as of December 31, 2015, and prior periods have been adjusted toreflect this adoption. The adoption of the amended guidance did not have a material impact on ourconsolidated financial statements.
3. INVENTORIES, NET
Inventories, net consist of the following:
At December 31,
2015 2014
(In thousands)
Raw materials . . . . . . . . . . . . . . . . . . . . . . . . . . . . . . . . . . . . . . . . . . . . . . . . . . . . . . . . . . . . . . $ 246 $ 318Finished goods . . . . . . . . . . . . . . . . . . . . . . . . . . . . . . . . . . . . . . . . . . . . . . . . . . . . . . . . . . . . . . 99,442 88,913
Total inventories, net . . . . . . . . . . . . . . . . . . . . . . . . . . . . . . . . . . . . . . . . . . . . . . . . . . . . . $99,688 $89,231
4. PROPERTY, PLANT AND EQUIPMENT, NET
Property, plant and equipment, net consists of the following:
At December 31,
2015 2014
(In thousands)
Useful Life
Land . . . . . . . . . . . . . . . . . . . . . . . . . . . . . . . . . . . . . . . . . . . . . . . . . . . . — $ 485 $ 485Buildings and improvements . . . . . . . . . . . . . . . . . . . . . . . . . . . . . . . . . 25 years 5,404 5,395Leasehold and store enhancements . . . . . . . . . . . . . . . . . . . . . . . . . . . . 1 to 10 years 112,861 102,168Furniture, computers and equipment . . . . . . . . . . . . . . . . . . . . . . . . . . . 3 to 5 years 19,829 18,673Capitalized software . . . . . . . . . . . . . . . . . . . . . . . . . . . . . . . . . . . . . . . 5 years 12,573 9,908Fixtures, dies and autos . . . . . . . . . . . . . . . . . . . . . . . . . . . . . . . . . . . . . 3 to 5 years 25,809 19,994Construction in progress . . . . . . . . . . . . . . . . . . . . . . . . . . . . . . . . . . . . 5,570 5,590
182,531 162,213Less accumulated depreciation and amortization . . . . . . . . . . . . . . . . . (99,030) (83,146)
$ 83,501 $ 79,067
Depreciation and amortization expense on property, plant and equipment was $21,480,000,$17,897,000 and $13,914,000 for the years ended December 31, 2015, 2014 and 2013, respectively.
- II-91 -
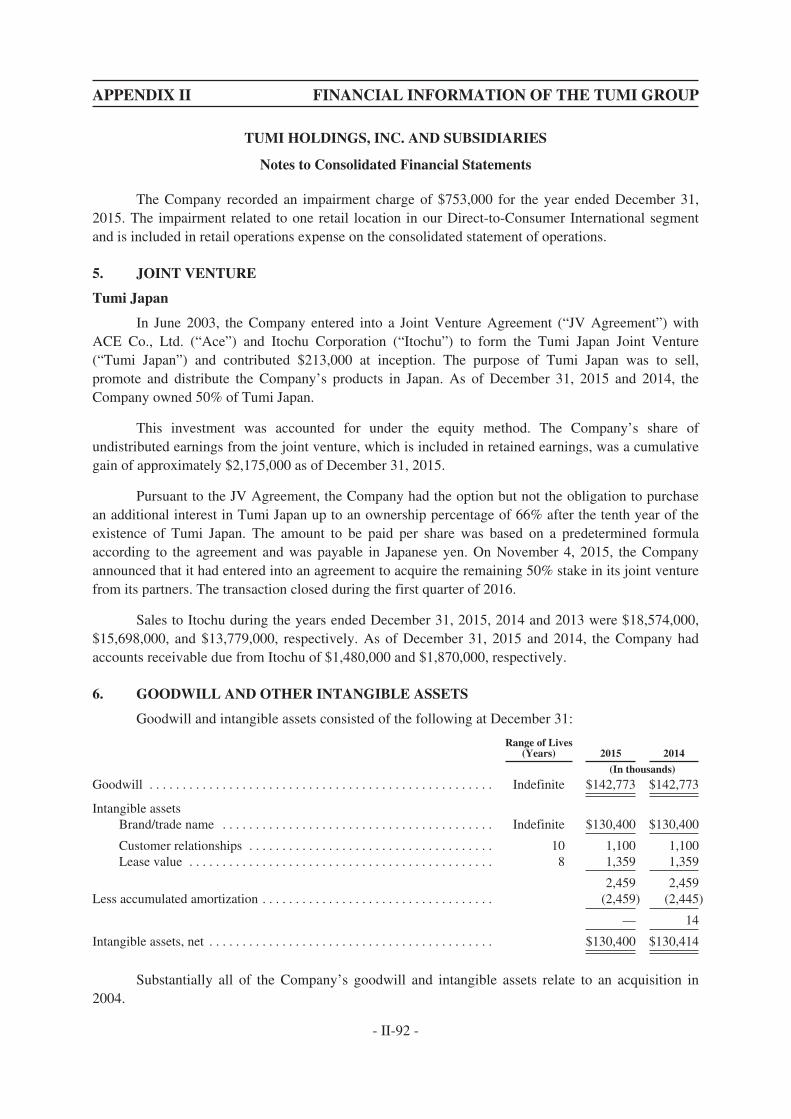
APPENDIX II FINANCIAL INFORMATION OF THE TUMI GROUP
TUMI HOLDINGS, INC. AND SUBSIDIARIES
Notes to Consolidated Financial Statements
The Company recorded an impairment charge of $753,000 for the year ended December 31,2015. The impairment related to one retail location in our Direct-to-Consumer International segmentand is included in retail operations expense on the consolidated statement of operations.
5. JOINT VENTURE
Tumi Japan
In June 2003, the Company entered into a Joint Venture Agreement (“JV Agreement”) withACE Co., Ltd. (“Ace”) and Itochu Corporation (“Itochu”) to form the Tumi Japan Joint Venture(“Tumi Japan”) and contributed $213,000 at inception. The purpose of Tumi Japan was to sell,promote and distribute the Company’s products in Japan. As of December 31, 2015 and 2014, theCompany owned 50% of Tumi Japan.
This investment was accounted for under the equity method. The Company’s share ofundistributed earnings from the joint venture, which is included in retained earnings, was a cumulativegain of approximately $2,175,000 as of December 31, 2015.
Pursuant to the JV Agreement, the Company had the option but not the obligation to purchasean additional interest in Tumi Japan up to an ownership percentage of 66% after the tenth year of theexistence of Tumi Japan. The amount to be paid per share was based on a predetermined formulaaccording to the agreement and was payable in Japanese yen. On November 4, 2015, the Companyannounced that it had entered into an agreement to acquire the remaining 50% stake in its joint venturefrom its partners. The transaction closed during the first quarter of 2016.
Sales to Itochu during the years ended December 31, 2015, 2014 and 2013 were $18,574,000,$15,698,000, and $13,779,000, respectively. As of December 31, 2015 and 2014, the Company hadaccounts receivable due from Itochu of $1,480,000 and $1,870,000, respectively.
6. GOODWILL AND OTHER INTANGIBLE ASSETS
Goodwill and intangible assets consisted of the following at December 31:
Range of Lives(Years) 2015 2014
(In thousands)
Goodwill . . . . . . . . . . . . . . . . . . . . . . . . . . . . . . . . . . . . . . . . . . . . . . . . . . . . Indefinite $142,773 $142,773
Intangible assetsBrand/trade name . . . . . . . . . . . . . . . . . . . . . . . . . . . . . . . . . . . . . . . . . Indefinite $130,400 $130,400
Customer relationships . . . . . . . . . . . . . . . . . . . . . . . . . . . . . . . . . . . . . 10 1,100 1,100Lease value . . . . . . . . . . . . . . . . . . . . . . . . . . . . . . . . . . . . . . . . . . . . . . 8 1,359 1,359
2,459 2,459Less accumulated amortization . . . . . . . . . . . . . . . . . . . . . . . . . . . . . . . . . . . (2,459) (2,445)
— 14
Intangible assets, net . . . . . . . . . . . . . . . . . . . . . . . . . . . . . . . . . . . . . . . . . . . $130,400 $130,414
Substantially all of the Company’s goodwill and intangible assets relate to an acquisition in2004.
- II-92 -

APPENDIX II FINANCIAL INFORMATION OF THE TUMI GROUP
TUMI HOLDINGS, INC. AND SUBSIDIARIES
Notes to Consolidated Financial Statements
The range of lives of the intangible assets was determined by management, which at times willengage an independent third-party appraisal firm to assist in considering the determination of the livesof intangible assets.
As of December 31, 2015, the Company’s intangible assets were fully amortized. Amortizationexpense of the customer relationships, included in general and administrative expense, was $96,000and $110,000 in the years ended December 31, 2014 and 2013, respectively. Included in retailoperations expense was $14,000 of amortization expense for the lease value in the year endedDecember 31, 2015 and $163,000 in each of the years ended December 31, 2014 and 2013.
The Company’s goodwill by segment was as follows as of December 31:
2015 2014
(In thousands)
Direct-to-Consumer North America . . . . . . . . . . . . . . . . . . . . . . . . . . . . . . . . . . . . . . . . . . . $ 48,779 $ 48,779Direct-to-Consumer International . . . . . . . . . . . . . . . . . . . . . . . . . . . . . . . . . . . . . . . . . . . . . 6,682 6,682Indirect-to-Consumer North America . . . . . . . . . . . . . . . . . . . . . . . . . . . . . . . . . . . . . . . . . . 22,719 22,719Indirect-to-Consumer International . . . . . . . . . . . . . . . . . . . . . . . . . . . . . . . . . . . . . . . . . . . . 64,593 64,593
Goodwill . . . . . . . . . . . . . . . . . . . . . . . . . . . . . . . . . . . . . . . . . . . . . . . . . . . . . . . . . . . . $142,773 $142,773
There is no accumulated impairment of goodwill for any period presented.
7. ACCRUED EXPENSES AND OTHER LIABILITIES
Accrued Expenses
Accrued expenses as of December 31 consisted of the following:
At December 31,
2015 2014
(In thousands)
Warranty . . . . . . . . . . . . . . . . . . . . . . . . . . . . . . . . . . . . . . . . . . . . . . . . . . . . . . . . . . . . . . . $ 9,001 $ 8,033Fixed asset purchases . . . . . . . . . . . . . . . . . . . . . . . . . . . . . . . . . . . . . . . . . . . . . . . . . . . . . 3,895 5,762Payroll and related costs . . . . . . . . . . . . . . . . . . . . . . . . . . . . . . . . . . . . . . . . . . . . . . . . . . . 7,289 4,641Marketing . . . . . . . . . . . . . . . . . . . . . . . . . . . . . . . . . . . . . . . . . . . . . . . . . . . . . . . . . . . . . . 3,208 2,674Professional fees . . . . . . . . . . . . . . . . . . . . . . . . . . . . . . . . . . . . . . . . . . . . . . . . . . . . . . . . . 1,383 920Sales tax . . . . . . . . . . . . . . . . . . . . . . . . . . . . . . . . . . . . . . . . . . . . . . . . . . . . . . . . . . . . . . . . 4,495 3,588Gift cards and store credits . . . . . . . . . . . . . . . . . . . . . . . . . . . . . . . . . . . . . . . . . . . . . . . . . 3,220 2,710Other . . . . . . . . . . . . . . . . . . . . . . . . . . . . . . . . . . . . . . . . . . . . . . . . . . . . . . . . . . . . . . . . . . 6,639 6,458
$39,130 $34,786
Other Long-Term Liabilities
Other long-term liabilities as of December 31, 2015 and 2014 consisted of deferred rent and aliability for uncertain tax positions.
- II-93 -
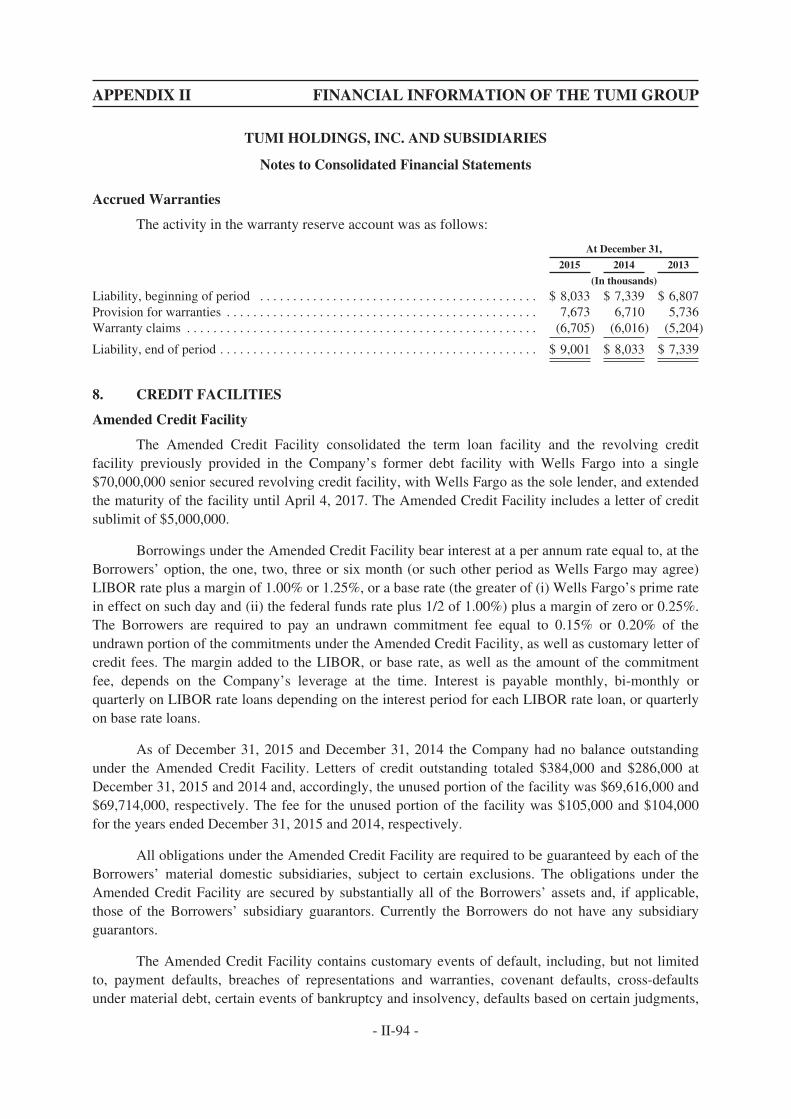
APPENDIX II FINANCIAL INFORMATION OF THE TUMI GROUP
TUMI HOLDINGS, INC. AND SUBSIDIARIES
Notes to Consolidated Financial Statements
Accrued Warranties
The activity in the warranty reserve account was as follows:
At December 31,
2015 2014 2013
(In thousands)
Liability, beginning of period . . . . . . . . . . . . . . . . . . . . . . . . . . . . . . . . . . . . . . . . . . $ 8,033 $ 7,339 $ 6,807Provision for warranties . . . . . . . . . . . . . . . . . . . . . . . . . . . . . . . . . . . . . . . . . . . . . . . 7,673 6,710 5,736Warranty claims . . . . . . . . . . . . . . . . . . . . . . . . . . . . . . . . . . . . . . . . . . . . . . . . . . . . . (6,705) (6,016) (5,204)
Liability, end of period . . . . . . . . . . . . . . . . . . . . . . . . . . . . . . . . . . . . . . . . . . . . . . . . $ 9,001 $ 8,033 $ 7,339
8. CREDIT FACILITIES
Amended Credit Facility
The Amended Credit Facility consolidated the term loan facility and the revolving creditfacility previously provided in the Company’s former debt facility with Wells Fargo into a single$70,000,000 senior secured revolving credit facility, with Wells Fargo as the sole lender, and extendedthe maturity of the facility until April 4, 2017. The Amended Credit Facility includes a letter of creditsublimit of $5,000,000.
Borrowings under the Amended Credit Facility bear interest at a per annum rate equal to, at theBorrowers’ option, the one, two, three or six month (or such other period as Wells Fargo may agree)LIBOR rate plus a margin of 1.00% or 1.25%, or a base rate (the greater of (i) Wells Fargo’s prime ratein effect on such day and (ii) the federal funds rate plus 1/2 of 1.00%) plus a margin of zero or 0.25%.The Borrowers are required to pay an undrawn commitment fee equal to 0.15% or 0.20% of theundrawn portion of the commitments under the Amended Credit Facility, as well as customary letter ofcredit fees. The margin added to the LIBOR, or base rate, as well as the amount of the commitmentfee, depends on the Company’s leverage at the time. Interest is payable monthly, bi-monthly orquarterly on LIBOR rate loans depending on the interest period for each LIBOR rate loan, or quarterlyon base rate loans.
As of December 31, 2015 and December 31, 2014 the Company had no balance outstandingunder the Amended Credit Facility. Letters of credit outstanding totaled $384,000 and $286,000 atDecember 31, 2015 and 2014 and, accordingly, the unused portion of the facility was $69,616,000 and$69,714,000, respectively. The fee for the unused portion of the facility was $105,000 and $104,000for the years ended December 31, 2015 and 2014, respectively.
All obligations under the Amended Credit Facility are required to be guaranteed by each of theBorrowers’ material domestic subsidiaries, subject to certain exclusions. The obligations under theAmended Credit Facility are secured by substantially all of the Borrowers’ assets and, if applicable,those of the Borrowers’ subsidiary guarantors. Currently the Borrowers do not have any subsidiaryguarantors.
The Amended Credit Facility contains customary events of default, including, but not limitedto, payment defaults, breaches of representations and warranties, covenant defaults, cross-defaultsunder material debt, certain events of bankruptcy and insolvency, defaults based on certain judgments,
- II-94 -
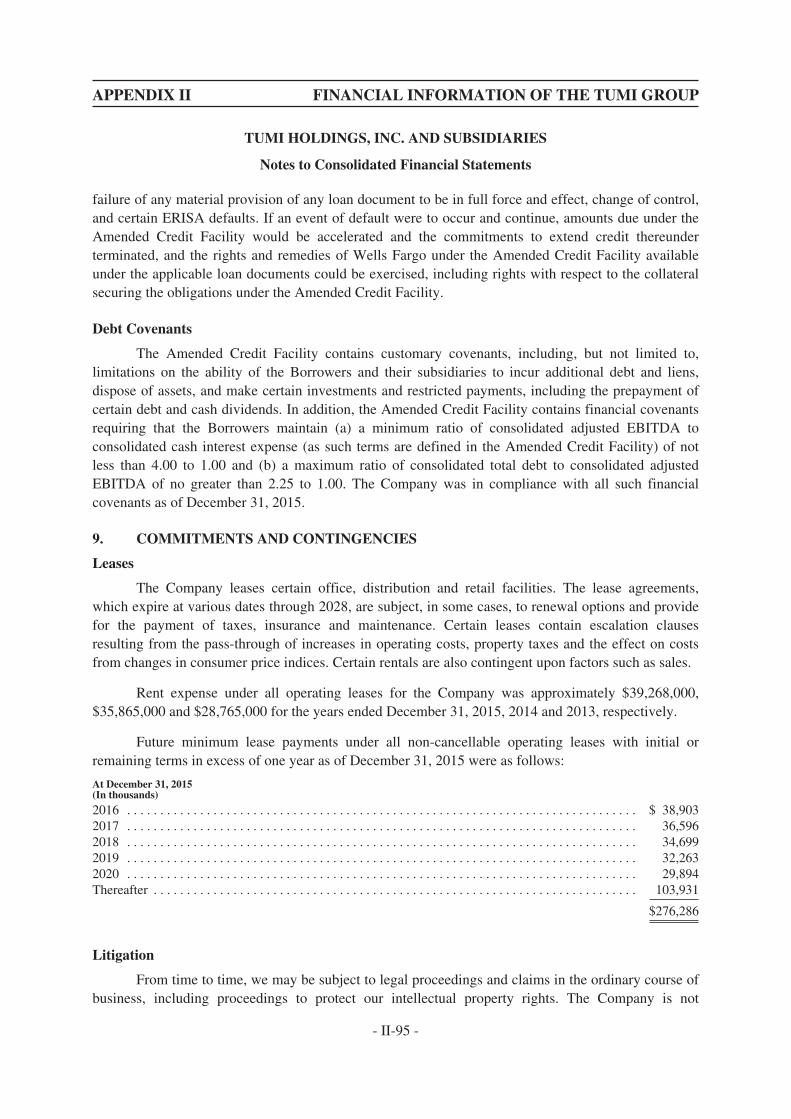
APPENDIX II FINANCIAL INFORMATION OF THE TUMI GROUP
TUMI HOLDINGS, INC. AND SUBSIDIARIES
Notes to Consolidated Financial Statements
failure of any material provision of any loan document to be in full force and effect, change of control,and certain ERISA defaults. If an event of default were to occur and continue, amounts due under theAmended Credit Facility would be accelerated and the commitments to extend credit thereunderterminated, and the rights and remedies of Wells Fargo under the Amended Credit Facility availableunder the applicable loan documents could be exercised, including rights with respect to the collateralsecuring the obligations under the Amended Credit Facility.
Debt Covenants
The Amended Credit Facility contains customary covenants, including, but not limited to,limitations on the ability of the Borrowers and their subsidiaries to incur additional debt and liens,dispose of assets, and make certain investments and restricted payments, including the prepayment ofcertain debt and cash dividends. In addition, the Amended Credit Facility contains financial covenantsrequiring that the Borrowers maintain (a) a minimum ratio of consolidated adjusted EBITDA toconsolidated cash interest expense (as such terms are defined in the Amended Credit Facility) of notless than 4.00 to 1.00 and (b) a maximum ratio of consolidated total debt to consolidated adjustedEBITDA of no greater than 2.25 to 1.00. The Company was in compliance with all such financialcovenants as of December 31, 2015.
9. COMMITMENTS AND CONTINGENCIES
Leases
The Company leases certain office, distribution and retail facilities. The lease agreements,which expire at various dates through 2028, are subject, in some cases, to renewal options and providefor the payment of taxes, insurance and maintenance. Certain leases contain escalation clausesresulting from the pass-through of increases in operating costs, property taxes and the effect on costsfrom changes in consumer price indices. Certain rentals are also contingent upon factors such as sales.
Rent expense under all operating leases for the Company was approximately $39,268,000,$35,865,000 and $28,765,000 for the years ended December 31, 2015, 2014 and 2013, respectively.
Future minimum lease payments under all non-cancellable operating leases with initial orremaining terms in excess of one year as of December 31, 2015 were as follows:
At December 31, 2015(In thousands)
2016 . . . . . . . . . . . . . . . . . . . . . . . . . . . . . . . . . . . . . . . . . . . . . . . . . . . . . . . . . . . . . . . . . . . . . . . . . . . . . $ 38,9032017 . . . . . . . . . . . . . . . . . . . . . . . . . . . . . . . . . . . . . . . . . . . . . . . . . . . . . . . . . . . . . . . . . . . . . . . . . . . . . 36,5962018 . . . . . . . . . . . . . . . . . . . . . . . . . . . . . . . . . . . . . . . . . . . . . . . . . . . . . . . . . . . . . . . . . . . . . . . . . . . . . 34,6992019 . . . . . . . . . . . . . . . . . . . . . . . . . . . . . . . . . . . . . . . . . . . . . . . . . . . . . . . . . . . . . . . . . . . . . . . . . . . . . 32,2632020 . . . . . . . . . . . . . . . . . . . . . . . . . . . . . . . . . . . . . . . . . . . . . . . . . . . . . . . . . . . . . . . . . . . . . . . . . . . . . 29,894Thereafter . . . . . . . . . . . . . . . . . . . . . . . . . . . . . . . . . . . . . . . . . . . . . . . . . . . . . . . . . . . . . . . . . . . . . . . . . 103,931
$276,286
Litigation
From time to time, we may be subject to legal proceedings and claims in the ordinary course ofbusiness, including proceedings to protect our intellectual property rights. The Company is not
- II-95 -
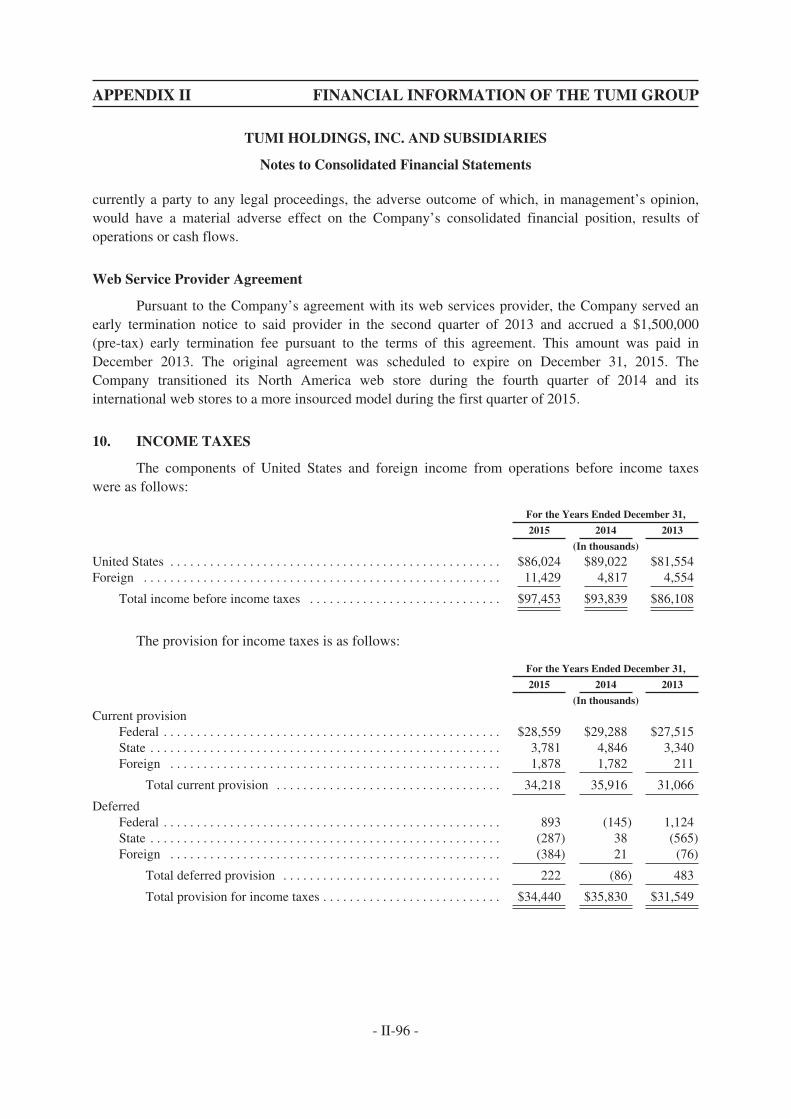
APPENDIX II FINANCIAL INFORMATION OF THE TUMI GROUP
TUMI HOLDINGS, INC. AND SUBSIDIARIES
Notes to Consolidated Financial Statements
currently a party to any legal proceedings, the adverse outcome of which, in management’s opinion,would have a material adverse effect on the Company’s consolidated financial position, results ofoperations or cash flows.
Web Service Provider Agreement
Pursuant to the Company’s agreement with its web services provider, the Company served anearly termination notice to said provider in the second quarter of 2013 and accrued a $1,500,000(pre-tax) early termination fee pursuant to the terms of this agreement. This amount was paid inDecember 2013. The original agreement was scheduled to expire on December 31, 2015. TheCompany transitioned its North America web store during the fourth quarter of 2014 and itsinternational web stores to a more insourced model during the first quarter of 2015.
10. INCOME TAXES
The components of United States and foreign income from operations before income taxeswere as follows:
For the Years Ended December 31,
2015 2014 2013
(In thousands)
United States . . . . . . . . . . . . . . . . . . . . . . . . . . . . . . . . . . . . . . . . . . . . . . . . . . $86,024 $89,022 $81,554Foreign . . . . . . . . . . . . . . . . . . . . . . . . . . . . . . . . . . . . . . . . . . . . . . . . . . . . . . 11,429 4,817 4,554
Total income before income taxes . . . . . . . . . . . . . . . . . . . . . . . . . . . . . $97,453 $93,839 $86,108
The provision for income taxes is as follows:
For the Years Ended December 31,
2015 2014 2013
(In thousands)
Current provisionFederal . . . . . . . . . . . . . . . . . . . . . . . . . . . . . . . . . . . . . . . . . . . . . . . . . . . $28,559 $29,288 $27,515State . . . . . . . . . . . . . . . . . . . . . . . . . . . . . . . . . . . . . . . . . . . . . . . . . . . . . 3,781 4,846 3,340Foreign . . . . . . . . . . . . . . . . . . . . . . . . . . . . . . . . . . . . . . . . . . . . . . . . . . 1,878 1,782 211
Total current provision . . . . . . . . . . . . . . . . . . . . . . . . . . . . . . . . . . 34,218 35,916 31,066
DeferredFederal . . . . . . . . . . . . . . . . . . . . . . . . . . . . . . . . . . . . . . . . . . . . . . . . . . . 893 (145) 1,124State . . . . . . . . . . . . . . . . . . . . . . . . . . . . . . . . . . . . . . . . . . . . . . . . . . . . . (287) 38 (565)Foreign . . . . . . . . . . . . . . . . . . . . . . . . . . . . . . . . . . . . . . . . . . . . . . . . . . (384) 21 (76)
Total deferred provision . . . . . . . . . . . . . . . . . . . . . . . . . . . . . . . . . 222 (86) 483
Total provision for income taxes . . . . . . . . . . . . . . . . . . . . . . . . . . . $34,440 $35,830 $31,549
- II-96 -
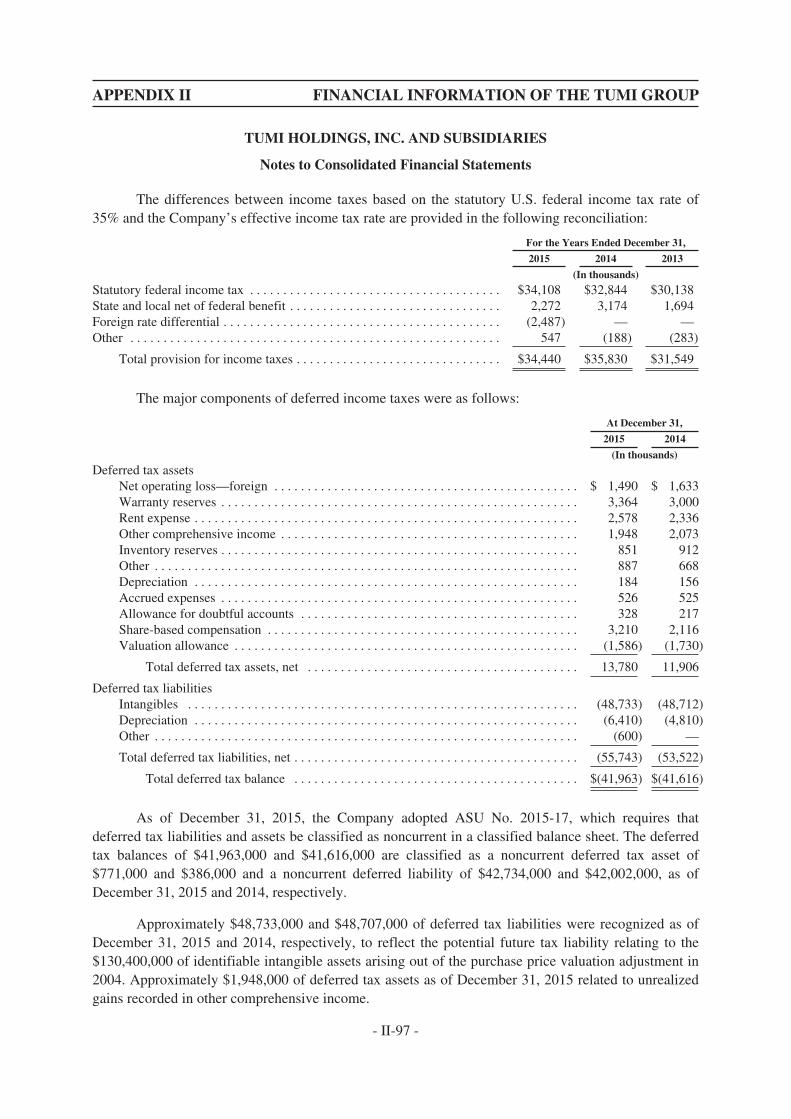
APPENDIX II FINANCIAL INFORMATION OF THE TUMI GROUP
TUMI HOLDINGS, INC. AND SUBSIDIARIES
Notes to Consolidated Financial Statements
The differences between income taxes based on the statutory U.S. federal income tax rate of35% and the Company’s effective income tax rate are provided in the following reconciliation:
For the Years Ended December 31,
2015 2014 2013
(In thousands)
Statutory federal income tax . . . . . . . . . . . . . . . . . . . . . . . . . . . . . . . . . . . . . . $34,108 $32,844 $30,138State and local net of federal benefit . . . . . . . . . . . . . . . . . . . . . . . . . . . . . . . . 2,272 3,174 1,694Foreign rate differential . . . . . . . . . . . . . . . . . . . . . . . . . . . . . . . . . . . . . . . . . . (2,487) — —Other . . . . . . . . . . . . . . . . . . . . . . . . . . . . . . . . . . . . . . . . . . . . . . . . . . . . . . . . 547 (188) (283)
Total provision for income taxes . . . . . . . . . . . . . . . . . . . . . . . . . . . . . . . $34,440 $35,830 $31,549
The major components of deferred income taxes were as follows:
At December 31,
2015 2014
(In thousands)
Deferred tax assetsNet operating loss—foreign . . . . . . . . . . . . . . . . . . . . . . . . . . . . . . . . . . . . . . . . . . . . . . $ 1,490 $ 1,633Warranty reserves . . . . . . . . . . . . . . . . . . . . . . . . . . . . . . . . . . . . . . . . . . . . . . . . . . . . . . 3,364 3,000Rent expense . . . . . . . . . . . . . . . . . . . . . . . . . . . . . . . . . . . . . . . . . . . . . . . . . . . . . . . . . . 2,578 2,336Other comprehensive income . . . . . . . . . . . . . . . . . . . . . . . . . . . . . . . . . . . . . . . . . . . . . 1,948 2,073Inventory reserves . . . . . . . . . . . . . . . . . . . . . . . . . . . . . . . . . . . . . . . . . . . . . . . . . . . . . . 851 912Other . . . . . . . . . . . . . . . . . . . . . . . . . . . . . . . . . . . . . . . . . . . . . . . . . . . . . . . . . . . . . . . . 887 668Depreciation . . . . . . . . . . . . . . . . . . . . . . . . . . . . . . . . . . . . . . . . . . . . . . . . . . . . . . . . . . 184 156Accrued expenses . . . . . . . . . . . . . . . . . . . . . . . . . . . . . . . . . . . . . . . . . . . . . . . . . . . . . . 526 525Allowance for doubtful accounts . . . . . . . . . . . . . . . . . . . . . . . . . . . . . . . . . . . . . . . . . . 328 217Share-based compensation . . . . . . . . . . . . . . . . . . . . . . . . . . . . . . . . . . . . . . . . . . . . . . . 3,210 2,116Valuation allowance . . . . . . . . . . . . . . . . . . . . . . . . . . . . . . . . . . . . . . . . . . . . . . . . . . . . (1,586) (1,730)
Total deferred tax assets, net . . . . . . . . . . . . . . . . . . . . . . . . . . . . . . . . . . . . . . . . . 13,780 11,906
Deferred tax liabilitiesIntangibles . . . . . . . . . . . . . . . . . . . . . . . . . . . . . . . . . . . . . . . . . . . . . . . . . . . . . . . . . . . (48,733) (48,712)Depreciation . . . . . . . . . . . . . . . . . . . . . . . . . . . . . . . . . . . . . . . . . . . . . . . . . . . . . . . . . . (6,410) (4,810)Other . . . . . . . . . . . . . . . . . . . . . . . . . . . . . . . . . . . . . . . . . . . . . . . . . . . . . . . . . . . . . . . . (600) —
Total deferred tax liabilities, net . . . . . . . . . . . . . . . . . . . . . . . . . . . . . . . . . . . . . . . . . . . (55,743) (53,522)
Total deferred tax balance . . . . . . . . . . . . . . . . . . . . . . . . . . . . . . . . . . . . . . . . . . . $(41,963) $(41,616)
As of December 31, 2015, the Company adopted ASU No. 2015-17, which requires thatdeferred tax liabilities and assets be classified as noncurrent in a classified balance sheet. The deferredtax balances of $41,963,000 and $41,616,000 are classified as a noncurrent deferred tax asset of$771,000 and $386,000 and a noncurrent deferred liability of $42,734,000 and $42,002,000, as ofDecember 31, 2015 and 2014, respectively.
Approximately $48,733,000 and $48,707,000 of deferred tax liabilities were recognized as ofDecember 31, 2015 and 2014, respectively, to reflect the potential future tax liability relating to the$130,400,000 of identifiable intangible assets arising out of the purchase price valuation adjustment in2004. Approximately $1,948,000 of deferred tax assets as of December 31, 2015 related to unrealizedgains recorded in other comprehensive income.
- II-97 -
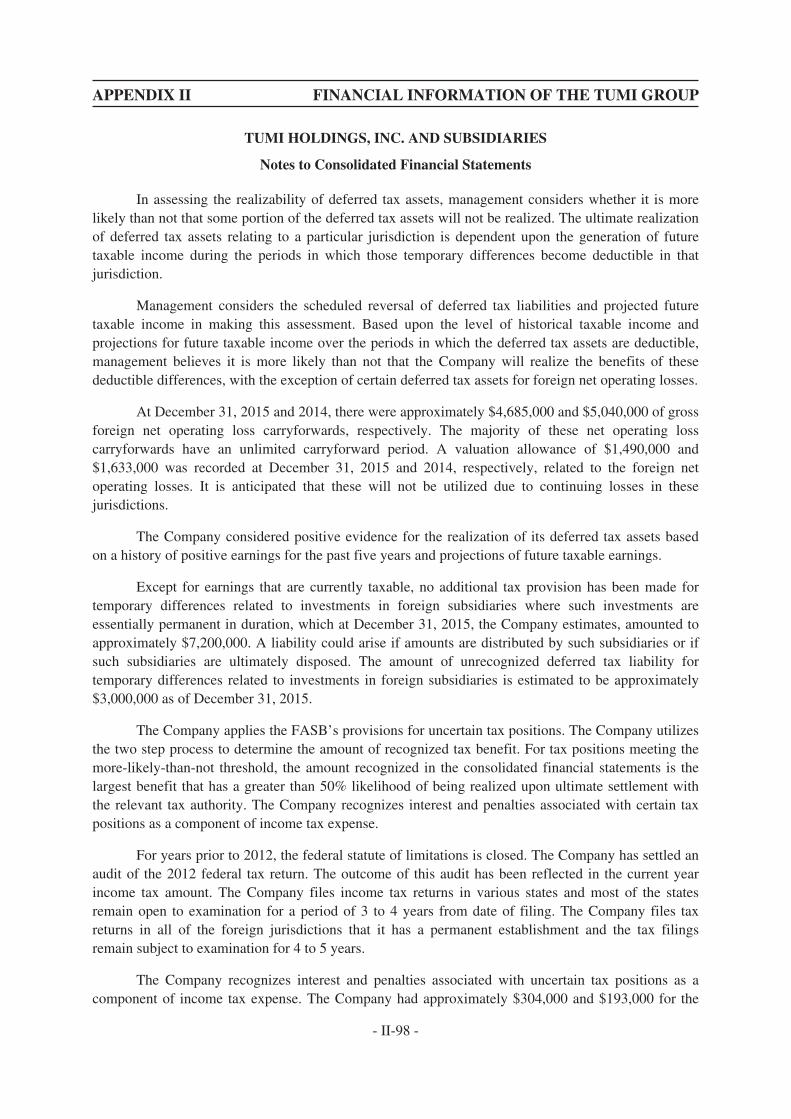
APPENDIX II FINANCIAL INFORMATION OF THE TUMI GROUP
TUMI HOLDINGS, INC. AND SUBSIDIARIES
Notes to Consolidated Financial Statements
In assessing the realizability of deferred tax assets, management considers whether it is morelikely than not that some portion of the deferred tax assets will not be realized. The ultimate realizationof deferred tax assets relating to a particular jurisdiction is dependent upon the generation of futuretaxable income during the periods in which those temporary differences become deductible in thatjurisdiction.
Management considers the scheduled reversal of deferred tax liabilities and projected futuretaxable income in making this assessment. Based upon the level of historical taxable income andprojections for future taxable income over the periods in which the deferred tax assets are deductible,management believes it is more likely than not that the Company will realize the benefits of thesedeductible differences, with the exception of certain deferred tax assets for foreign net operating losses.
At December 31, 2015 and 2014, there were approximately $4,685,000 and $5,040,000 of grossforeign net operating loss carryforwards, respectively. The majority of these net operating losscarryforwards have an unlimited carryforward period. A valuation allowance of $1,490,000 and$1,633,000 was recorded at December 31, 2015 and 2014, respectively, related to the foreign netoperating losses. It is anticipated that these will not be utilized due to continuing losses in thesejurisdictions.
The Company considered positive evidence for the realization of its deferred tax assets basedon a history of positive earnings for the past five years and projections of future taxable earnings.
Except for earnings that are currently taxable, no additional tax provision has been made fortemporary differences related to investments in foreign subsidiaries where such investments areessentially permanent in duration, which at December 31, 2015, the Company estimates, amounted toapproximately $7,200,000. A liability could arise if amounts are distributed by such subsidiaries or ifsuch subsidiaries are ultimately disposed. The amount of unrecognized deferred tax liability fortemporary differences related to investments in foreign subsidiaries is estimated to be approximately$3,000,000 as of December 31, 2015.
The Company applies the FASB’s provisions for uncertain tax positions. The Company utilizesthe two step process to determine the amount of recognized tax benefit. For tax positions meeting themore-likely-than-not threshold, the amount recognized in the consolidated financial statements is thelargest benefit that has a greater than 50% likelihood of being realized upon ultimate settlement withthe relevant tax authority. The Company recognizes interest and penalties associated with certain taxpositions as a component of income tax expense.
For years prior to 2012, the federal statute of limitations is closed. The Company has settled anaudit of the 2012 federal tax return. The outcome of this audit has been reflected in the current yearincome tax amount. The Company files income tax returns in various states and most of the statesremain open to examination for a period of 3 to 4 years from date of filing. The Company files taxreturns in all of the foreign jurisdictions that it has a permanent establishment and the tax filingsremain subject to examination for 4 to 5 years.
The Company recognizes interest and penalties associated with uncertain tax positions as acomponent of income tax expense. The Company had approximately $304,000 and $193,000 for the
- II-98 -
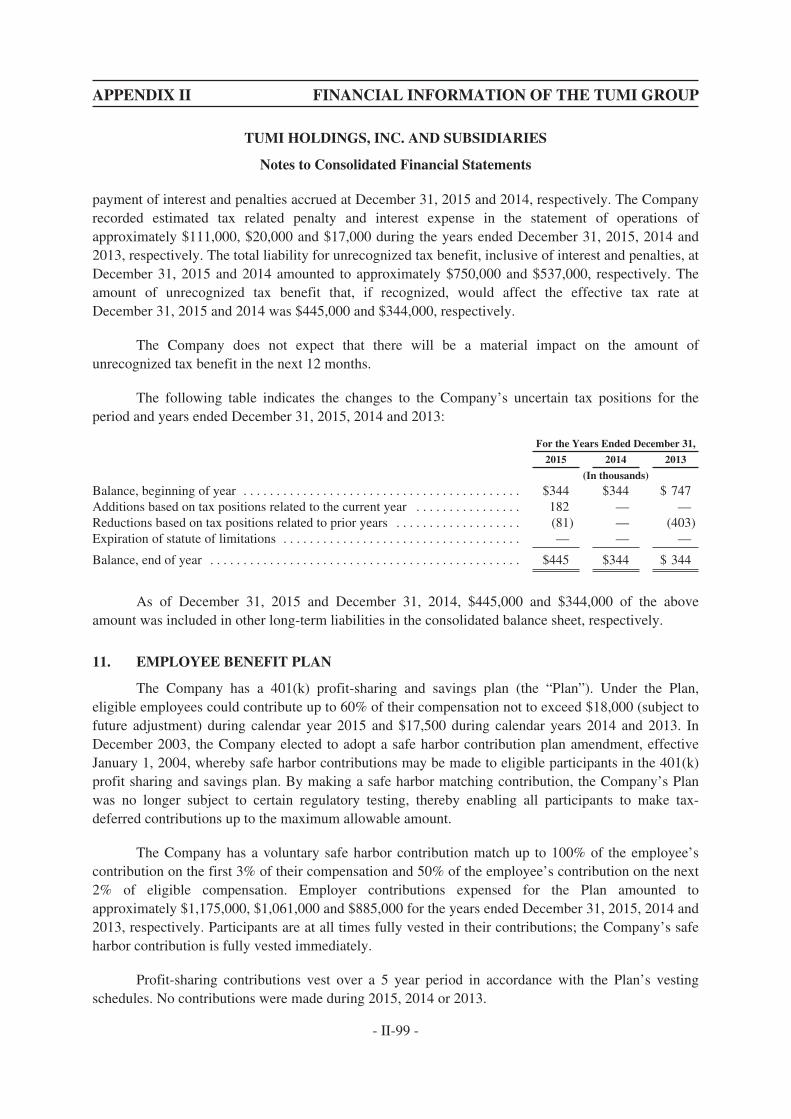
APPENDIX II FINANCIAL INFORMATION OF THE TUMI GROUP
TUMI HOLDINGS, INC. AND SUBSIDIARIES
Notes to Consolidated Financial Statements
payment of interest and penalties accrued at December 31, 2015 and 2014, respectively. The Companyrecorded estimated tax related penalty and interest expense in the statement of operations ofapproximately $111,000, $20,000 and $17,000 during the years ended December 31, 2015, 2014 and2013, respectively. The total liability for unrecognized tax benefit, inclusive of interest and penalties, atDecember 31, 2015 and 2014 amounted to approximately $750,000 and $537,000, respectively. Theamount of unrecognized tax benefit that, if recognized, would affect the effective tax rate atDecember 31, 2015 and 2014 was $445,000 and $344,000, respectively.
The Company does not expect that there will be a material impact on the amount ofunrecognized tax benefit in the next 12 months.
The following table indicates the changes to the Company’s uncertain tax positions for theperiod and years ended December 31, 2015, 2014 and 2013:
For the Years Ended December 31,
2015 2014 2013
(In thousands)
Balance, beginning of year . . . . . . . . . . . . . . . . . . . . . . . . . . . . . . . . . . . . . . . . . . $344 $344 $ 747Additions based on tax positions related to the current year . . . . . . . . . . . . . . . . 182 — —Reductions based on tax positions related to prior years . . . . . . . . . . . . . . . . . . . (81) — (403)Expiration of statute of limitations . . . . . . . . . . . . . . . . . . . . . . . . . . . . . . . . . . . . — — —
Balance, end of year . . . . . . . . . . . . . . . . . . . . . . . . . . . . . . . . . . . . . . . . . . . . . . . $445 $344 $ 344
As of December 31, 2015 and December 31, 2014, $445,000 and $344,000 of the aboveamount was included in other long-term liabilities in the consolidated balance sheet, respectively.
11. EMPLOYEE BENEFIT PLAN
The Company has a 401(k) profit-sharing and savings plan (the “Plan”). Under the Plan,eligible employees could contribute up to 60% of their compensation not to exceed $18,000 (subject tofuture adjustment) during calendar year 2015 and $17,500 during calendar years 2014 and 2013. InDecember 2003, the Company elected to adopt a safe harbor contribution plan amendment, effectiveJanuary 1, 2004, whereby safe harbor contributions may be made to eligible participants in the 401(k)profit sharing and savings plan. By making a safe harbor matching contribution, the Company’s Planwas no longer subject to certain regulatory testing, thereby enabling all participants to make tax-deferred contributions up to the maximum allowable amount.
The Company has a voluntary safe harbor contribution match up to 100% of the employee’scontribution on the first 3% of their compensation and 50% of the employee’s contribution on the next2% of eligible compensation. Employer contributions expensed for the Plan amounted toapproximately $1,175,000, $1,061,000 and $885,000 for the years ended December 31, 2015, 2014 and2013, respectively. Participants are at all times fully vested in their contributions; the Company’s safeharbor contribution is fully vested immediately.
Profit-sharing contributions vest over a 5 year period in accordance with the Plan’s vestingschedules. No contributions were made during 2015, 2014 or 2013.
- II-99 -

APPENDIX II FINANCIAL INFORMATION OF THE TUMI GROUP
TUMI HOLDINGS, INC. AND SUBSIDIARIES
Notes to Consolidated Financial Statements
12. STOCKHOLDERS’ EQUITY
As of December 31, 2015 and 2014, there were 350,000,000 shares of common stockauthorized, with a par value of $0.01, of which 67,394,756 and 67,868,867 shares, net of treasurystock, were outstanding, respectively. Common stock represents 100% of the ownership and votingcontrol of Tumi Holdings, Inc. and does not accrue dividends. In addition, 75,000,000 shares ofpreferred stock were authorized, with a par value of $0.01, of which no shares were issued oroutstanding.
As of December 31, 2015 and 2014, the Company held 763,672 and 277,806 shares of commonstock in treasury, respectively. During 2015, 466 shares of common stock were withheld by theCompany in satisfaction of statutory minimum withholding taxes in connection with the vesting ofawards under the Company’s 2012 Long-Term Incentive Plan. Shares withheld in satisfaction of taxobligations are accounted for as treasury stock at cost.
Share Repurchase Program
On November 4, 2015, the Company announced that its Board of Directors authorized therepurchase of up to $150 million of the Company’s common stock over the next twelve months. Underthe program, the Company may purchase its shares from time to time in the open market or in privatelynegotiated transactions. The Company expects that purchases will be funded through existing cash onhand, cash from operations, borrowings or a combination of the foregoing. The amount and timing ofthe purchases will depend on a number of factors including the price and availability of the Company’sshares, trading volume and general market conditions. Repurchases in the future may also be madeunder a Rule 10b5-1 plan, which would permit shares to be repurchased when the Company mightotherwise be precluded from doing so under insider trading laws. The share repurchase program maybe suspended or discontinued at any time.
During the fourth quarter of 2015, the Company repurchased 485,400 shares of its outstandingcommon stock at an average price of $17.42 per share for a total of $8,454,000. As of December 31,2015, the remaining availability under the Company’s share repurchase program was approximately$141,546,000. All repurchased shares of common stock have been accounted for as treasury stock atcost.
Accumulated Other Comprehensive Loss
The balance in accumulated other comprehensive loss consists only of foreign currencytranslation adjustments, net of tax. During the year ended December 31, 2014, the Company deemed$36,500,000 of intercompany receivables from its German subsidiary to be permanently invested.Accordingly, these amounts have been reclassified to contributed capital, reflecting the permanentnature of the investment. Unrealized gains and losses on these transactions are recorded in othercomprehensive income.
- II-100 -
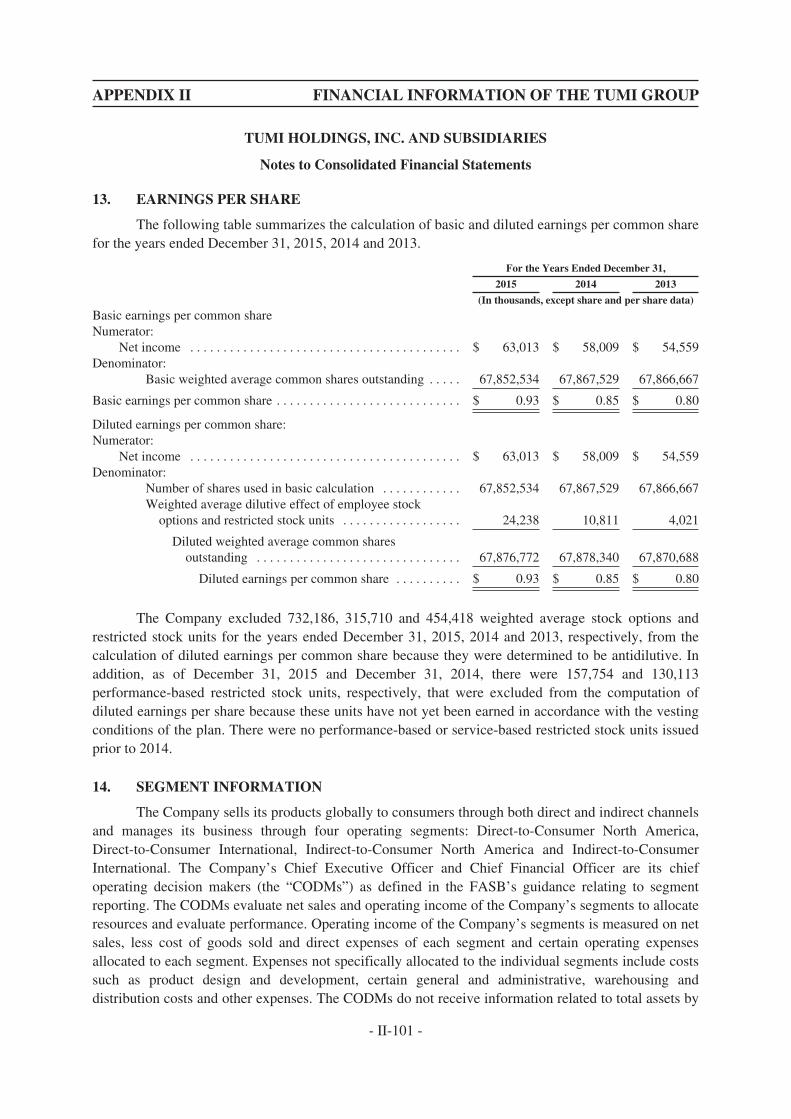
APPENDIX II FINANCIAL INFORMATION OF THE TUMI GROUP
TUMI HOLDINGS, INC. AND SUBSIDIARIES
Notes to Consolidated Financial Statements
13. EARNINGS PER SHARE
The following table summarizes the calculation of basic and diluted earnings per common sharefor the years ended December 31, 2015, 2014 and 2013.
For the Years Ended December 31,
2015 2014 2013
(In thousands, except share and per share data)
Basic earnings per common shareNumerator:
Net income . . . . . . . . . . . . . . . . . . . . . . . . . . . . . . . . . . . . . . . . . $ 63,013 $ 58,009 $ 54,559Denominator:
Basic weighted average common shares outstanding . . . . . 67,852,534 67,867,529 67,866,667
Basic earnings per common share . . . . . . . . . . . . . . . . . . . . . . . . . . . . $ 0.93 $ 0.85 $ 0.80
Diluted earnings per common share:Numerator:
Net income . . . . . . . . . . . . . . . . . . . . . . . . . . . . . . . . . . . . . . . . . $ 63,013 $ 58,009 $ 54,559Denominator:
Number of shares used in basic calculation . . . . . . . . . . . . 67,852,534 67,867,529 67,866,667Weighted average dilutive effect of employee stock
options and restricted stock units . . . . . . . . . . . . . . . . . . 24,238 10,811 4,021
Diluted weighted average common sharesoutstanding . . . . . . . . . . . . . . . . . . . . . . . . . . . . . . . 67,876,772 67,878,340 67,870,688
Diluted earnings per common share . . . . . . . . . . $ 0.93 $ 0.85 $ 0.80
The Company excluded 732,186, 315,710 and 454,418 weighted average stock options andrestricted stock units for the years ended December 31, 2015, 2014 and 2013, respectively, from thecalculation of diluted earnings per common share because they were determined to be antidilutive. Inaddition, as of December 31, 2015 and December 31, 2014, there were 157,754 and 130,113performance-based restricted stock units, respectively, that were excluded from the computation ofdiluted earnings per share because these units have not yet been earned in accordance with the vestingconditions of the plan. There were no performance-based or service-based restricted stock units issuedprior to 2014.
14. SEGMENT INFORMATION
The Company sells its products globally to consumers through both direct and indirect channelsand manages its business through four operating segments: Direct-to-Consumer North America,Direct-to-Consumer International, Indirect-to-Consumer North America and Indirect-to-ConsumerInternational. The Company’s Chief Executive Officer and Chief Financial Officer are its chiefoperating decision makers (the “CODMs”) as defined in the FASB’s guidance relating to segmentreporting. The CODMs evaluate net sales and operating income of the Company’s segments to allocateresources and evaluate performance. Operating income of the Company’s segments is measured on netsales, less cost of goods sold and direct expenses of each segment and certain operating expensesallocated to each segment. Expenses not specifically allocated to the individual segments include costssuch as product design and development, certain general and administrative, warehousing anddistribution costs and other expenses. The CODMs do not receive information related to total assets by
- II-101 -
APPENDIX II FINANCIAL INFORMATION OF THE TUMI GROUP
TUMI HOLDINGS, INC. AND SUBSIDIARIES
Notes to Consolidated Financial Statements
segment. Although the Company’s products fall into three major categories: travel, business andaccessories, the Company’s classification of individual product codes into these categories is fluid anddynamic; while the Company collects gross sales data, the Company does not collect financialinformation to derive net sales (including discounts and allowances) and markdowns by productcategory in sufficient detail to report such data in its financial statements in the aggregate or bysegment.
Following is a description of our segments:
Direct-to-Consumer North America
The Company’s Direct-to-Consumer North America segment sells the Company’s productsdirectly to consumers through a network of company-owned retail stores consisting of full-price storesand outlet stores strategically positioned in high-end retail malls or street venues. In addition, sales ofthe Company’s products to consumers through our e-commerce website are included in this segment.
Indirect-to-Consumer North America
The Company sells to wholesale customers, including specialty luggage retailers, prestigedepartment stores and business to business channels. Many of the Company’s wholesale customersalso operate their own e-commerce websites through which they sell the Company’s products. TheCompany also sells its products in partner stores, which are owned and operated by local distributors orretailers that purchase Tumi products from the Company through a wholesale arrangement. Theselocations carry only Tumi products and are governed by strict operating guidelines that we dictate withregard to brand presentation. The employees at partner store locations are not our employees but ratherthose of the distributors or retailers.
Direct-to-Consumer International
The Company sells directly to consumers through a network of company-owned full-price andoutlet stores in high-end street venues and select malls in international locations. The Company alsosells its products directly to consumers through our e-commerce website.
Indirect-to-Consumer International
The Company sells its products through wholesale distribution channels in Europe, the MiddleEast and Africa, the Asia-Pacific region and Central and South America. The Company also sells itsproducts in partner stores, which are owned and operated by local distributors or retailers that purchaseTumi products from the Company through a wholesale arrangement. These locations carry only Tumiproducts and are governed by strict operating guidelines that we dictate with regard to brandpresentation. The employees at partner store locations are not our employees but rather those of thedistributors or retailers. In addition, the Company operates concessions in department stores throughoutEurope and the Middle East. Many of the Company’s wholesale customers also operate their own e-commerce websites through which they sell the Company’s products.
- II-102 -
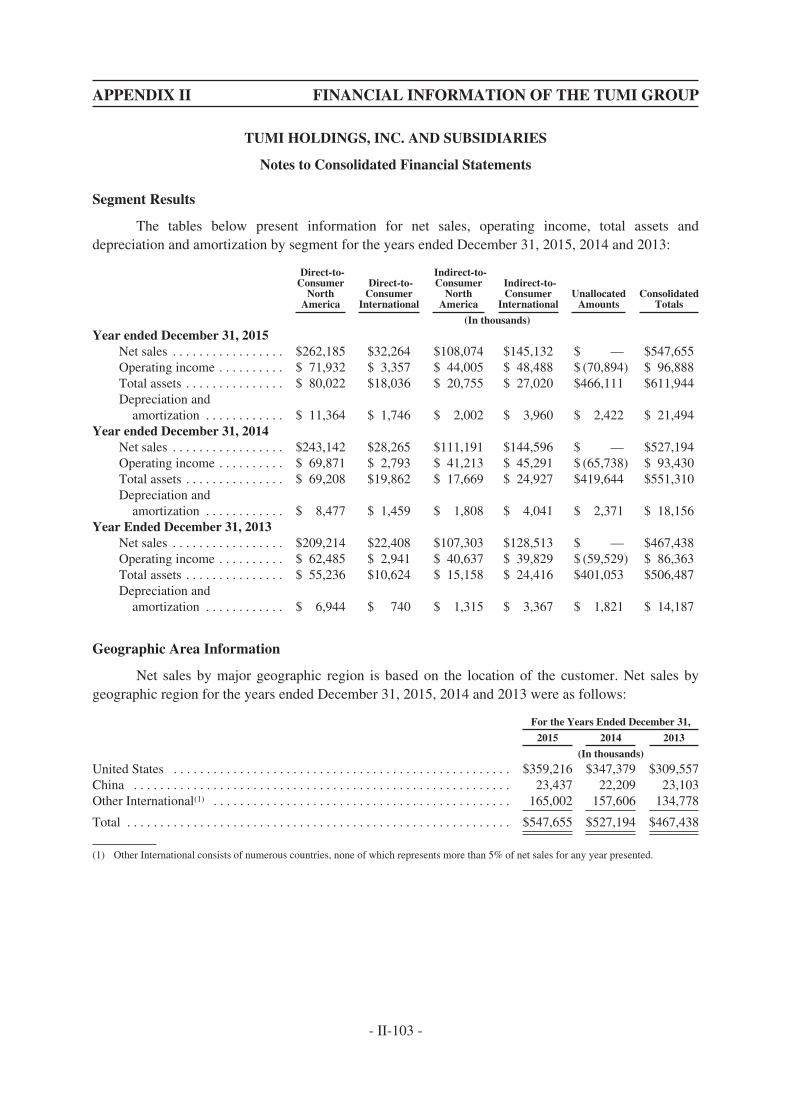
APPENDIX II FINANCIAL INFORMATION OF THE TUMI GROUP
TUMI HOLDINGS, INC. AND SUBSIDIARIES
Notes to Consolidated Financial Statements
Segment Results
The tables below present information for net sales, operating income, total assets anddepreciation and amortization by segment for the years ended December 31, 2015, 2014 and 2013:
Direct-to-Consumer
NorthAmerica
Direct-to-Consumer
International
Indirect-to-Consumer
NorthAmerica
Indirect-to-Consumer
InternationalUnallocated
AmountsConsolidated
Totals
(In thousands)
Year ended December 31, 2015Net sales . . . . . . . . . . . . . . . . . $262,185 $32,264 $108,074 $145,132 $ — $547,655Operating income . . . . . . . . . . $ 71,932 $ 3,357 $ 44,005 $ 48,488 $ (70,894) $ 96,888Total assets . . . . . . . . . . . . . . . $ 80,022 $18,036 $ 20,755 $ 27,020 $466,111 $611,944Depreciation and
amortization . . . . . . . . . . . . $ 11,364 $ 1,746 $ 2,002 $ 3,960 $ 2,422 $ 21,494Year ended December 31, 2014
Net sales . . . . . . . . . . . . . . . . . $243,142 $28,265 $111,191 $144,596 $ — $527,194Operating income . . . . . . . . . . $ 69,871 $ 2,793 $ 41,213 $ 45,291 $ (65,738) $ 93,430Total assets . . . . . . . . . . . . . . . $ 69,208 $19,862 $ 17,669 $ 24,927 $419,644 $551,310Depreciation and
amortization . . . . . . . . . . . . $ 8,477 $ 1,459 $ 1,808 $ 4,041 $ 2,371 $ 18,156Year Ended December 31, 2013
Net sales . . . . . . . . . . . . . . . . . $209,214 $22,408 $107,303 $128,513 $ — $467,438Operating income . . . . . . . . . . $ 62,485 $ 2,941 $ 40,637 $ 39,829 $ (59,529) $ 86,363Total assets . . . . . . . . . . . . . . . $ 55,236 $10,624 $ 15,158 $ 24,416 $401,053 $506,487Depreciation and
amortization . . . . . . . . . . . . $ 6,944 $ 740 $ 1,315 $ 3,367 $ 1,821 $ 14,187
Geographic Area Information
Net sales by major geographic region is based on the location of the customer. Net sales bygeographic region for the years ended December 31, 2015, 2014 and 2013 were as follows:
For the Years Ended December 31,
2015 2014 2013
(In thousands)
United States . . . . . . . . . . . . . . . . . . . . . . . . . . . . . . . . . . . . . . . . . . . . . . . . . . . $359,216 $347,379 $309,557China . . . . . . . . . . . . . . . . . . . . . . . . . . . . . . . . . . . . . . . . . . . . . . . . . . . . . . . . . 23,437 22,209 23,103Other International(1) . . . . . . . . . . . . . . . . . . . . . . . . . . . . . . . . . . . . . . . . . . . . . 165,002 157,606 134,778
Total . . . . . . . . . . . . . . . . . . . . . . . . . . . . . . . . . . . . . . . . . . . . . . . . . . . . . . . . . . $547,655 $527,194 $467,438
(1) Other International consists of numerous countries, none of which represents more than 5% of net sales for any year presented.
- II-103 -
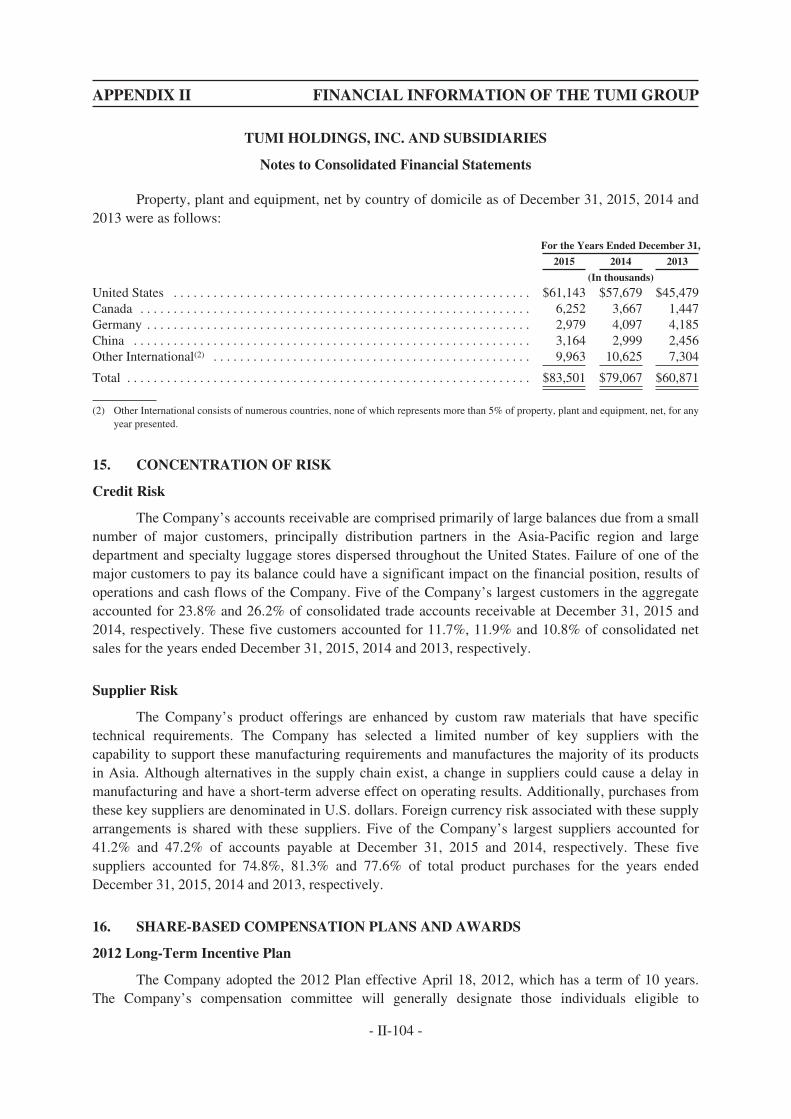
APPENDIX II FINANCIAL INFORMATION OF THE TUMI GROUP
TUMI HOLDINGS, INC. AND SUBSIDIARIES
Notes to Consolidated Financial Statements
Property, plant and equipment, net by country of domicile as of December 31, 2015, 2014 and2013 were as follows:
For the Years Ended December 31,
2015 2014 2013
(In thousands)
United States . . . . . . . . . . . . . . . . . . . . . . . . . . . . . . . . . . . . . . . . . . . . . . . . . . . . . . $61,143 $57,679 $45,479Canada . . . . . . . . . . . . . . . . . . . . . . . . . . . . . . . . . . . . . . . . . . . . . . . . . . . . . . . . . . . 6,252 3,667 1,447Germany . . . . . . . . . . . . . . . . . . . . . . . . . . . . . . . . . . . . . . . . . . . . . . . . . . . . . . . . . . 2,979 4,097 4,185China . . . . . . . . . . . . . . . . . . . . . . . . . . . . . . . . . . . . . . . . . . . . . . . . . . . . . . . . . . . . 3,164 2,999 2,456Other International(2) . . . . . . . . . . . . . . . . . . . . . . . . . . . . . . . . . . . . . . . . . . . . . . . . 9,963 10,625 7,304
Total . . . . . . . . . . . . . . . . . . . . . . . . . . . . . . . . . . . . . . . . . . . . . . . . . . . . . . . . . . . . . $83,501 $79,067 $60,871
(2) Other International consists of numerous countries, none of which represents more than 5% of property, plant and equipment, net, for anyyear presented.
15. CONCENTRATION OF RISK
Credit Risk
The Company’s accounts receivable are comprised primarily of large balances due from a smallnumber of major customers, principally distribution partners in the Asia-Pacific region and largedepartment and specialty luggage stores dispersed throughout the United States. Failure of one of themajor customers to pay its balance could have a significant impact on the financial position, results ofoperations and cash flows of the Company. Five of the Company’s largest customers in the aggregateaccounted for 23.8% and 26.2% of consolidated trade accounts receivable at December 31, 2015 and2014, respectively. These five customers accounted for 11.7%, 11.9% and 10.8% of consolidated netsales for the years ended December 31, 2015, 2014 and 2013, respectively.
Supplier Risk
The Company’s product offerings are enhanced by custom raw materials that have specifictechnical requirements. The Company has selected a limited number of key suppliers with thecapability to support these manufacturing requirements and manufactures the majority of its productsin Asia. Although alternatives in the supply chain exist, a change in suppliers could cause a delay inmanufacturing and have a short-term adverse effect on operating results. Additionally, purchases fromthese key suppliers are denominated in U.S. dollars. Foreign currency risk associated with these supplyarrangements is shared with these suppliers. Five of the Company’s largest suppliers accounted for41.2% and 47.2% of accounts payable at December 31, 2015 and 2014, respectively. These fivesuppliers accounted for 74.8%, 81.3% and 77.6% of total product purchases for the years endedDecember 31, 2015, 2014 and 2013, respectively.
16. SHARE-BASED COMPENSATION PLANS AND AWARDS
2012 Long-Term Incentive Plan
The Company adopted the 2012 Plan effective April 18, 2012, which has a term of 10 years.The Company’s compensation committee will generally designate those individuals eligible to
- II-104 -
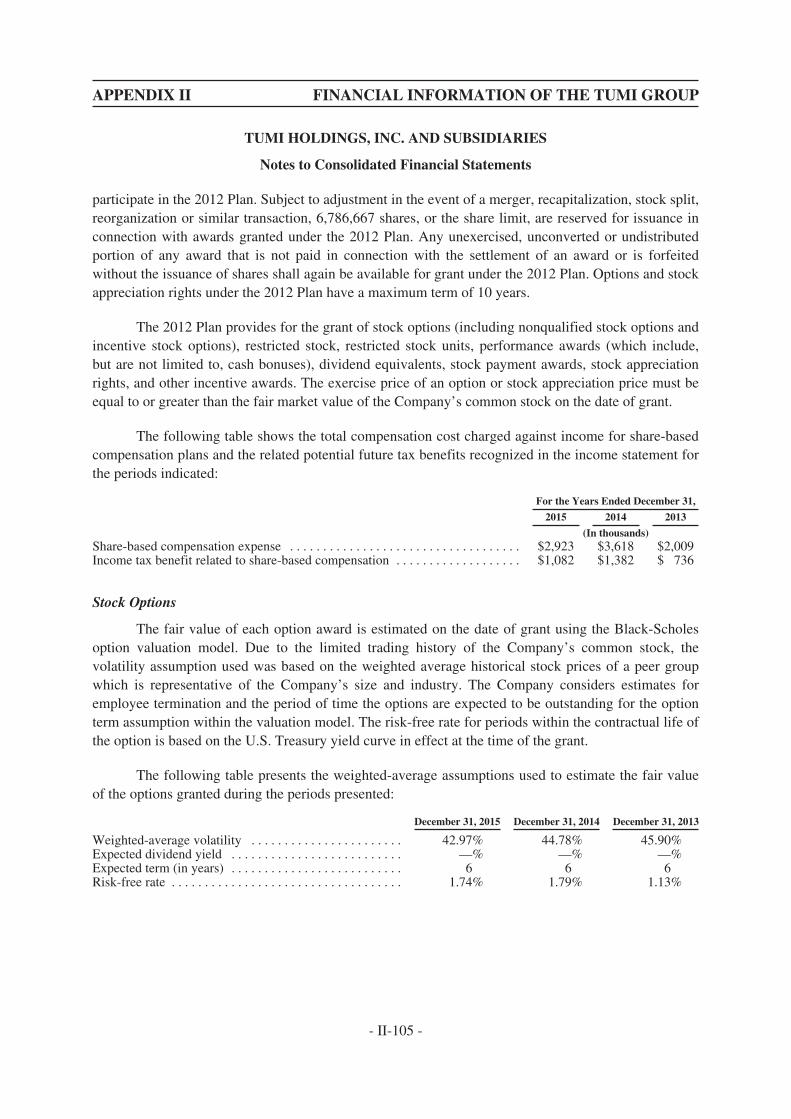
APPENDIX II FINANCIAL INFORMATION OF THE TUMI GROUP
TUMI HOLDINGS, INC. AND SUBSIDIARIES
Notes to Consolidated Financial Statements
participate in the 2012 Plan. Subject to adjustment in the event of a merger, recapitalization, stock split,reorganization or similar transaction, 6,786,667 shares, or the share limit, are reserved for issuance inconnection with awards granted under the 2012 Plan. Any unexercised, unconverted or undistributedportion of any award that is not paid in connection with the settlement of an award or is forfeitedwithout the issuance of shares shall again be available for grant under the 2012 Plan. Options and stockappreciation rights under the 2012 Plan have a maximum term of 10 years.
The 2012 Plan provides for the grant of stock options (including nonqualified stock options andincentive stock options), restricted stock, restricted stock units, performance awards (which include,but are not limited to, cash bonuses), dividend equivalents, stock payment awards, stock appreciationrights, and other incentive awards. The exercise price of an option or stock appreciation price must beequal to or greater than the fair market value of the Company’s common stock on the date of grant.
The following table shows the total compensation cost charged against income for share-basedcompensation plans and the related potential future tax benefits recognized in the income statement forthe periods indicated:
For the Years Ended December 31,
2015 2014 2013
(In thousands)Share-based compensation expense . . . . . . . . . . . . . . . . . . . . . . . . . . . . . . . . . . . $2,923 $3,618 $2,009Income tax benefit related to share-based compensation . . . . . . . . . . . . . . . . . . . $1,082 $1,382 $ 736
Stock Options
The fair value of each option award is estimated on the date of grant using the Black-Scholesoption valuation model. Due to the limited trading history of the Company’s common stock, thevolatility assumption used was based on the weighted average historical stock prices of a peer groupwhich is representative of the Company’s size and industry. The Company considers estimates foremployee termination and the period of time the options are expected to be outstanding for the optionterm assumption within the valuation model. The risk-free rate for periods within the contractual life ofthe option is based on the U.S. Treasury yield curve in effect at the time of the grant.
The following table presents the weighted-average assumptions used to estimate the fair valueof the options granted during the periods presented:
December 31, 2015 December 31, 2014 December 31, 2013
Weighted-average volatility . . . . . . . . . . . . . . . . . . . . . . . 42.97% 44.78% 45.90%Expected dividend yield . . . . . . . . . . . . . . . . . . . . . . . . . . —% —% —%Expected term (in years) . . . . . . . . . . . . . . . . . . . . . . . . . . 6 6 6Risk-free rate . . . . . . . . . . . . . . . . . . . . . . . . . . . . . . . . . . . 1.74% 1.79% 1.13%
- II-105 -

APPENDIX II FINANCIAL INFORMATION OF THE TUMI GROUP
TUMI HOLDINGS, INC. AND SUBSIDIARIES
Notes to Consolidated Financial Statements
A summary of option activity under the 2012 Plan as of December 31, 2015 and changes duringthe twelve months then ended is presented below:
Number ofShares
WeightedAverageExercise
Price
WeightedAverage
RemainingContractual
Term
AggregateIntrinsic
Value
Outstanding—December 31, 2014 . . . . . . . . . . . . . . . . . . . . . . . . 969,718 $21.35Granted . . . . . . . . . . . . . . . . . . . . . . . . . . . . . . . . . . . . . . . . . . . . . 435,681 $22.47Exercised . . . . . . . . . . . . . . . . . . . . . . . . . . . . . . . . . . . . . . . . . . . . — —Forfeited or expired . . . . . . . . . . . . . . . . . . . . . . . . . . . . . . . . . . . . (123,466) $21.81
Outstanding—December 31, 2015 . . . . . . . . . . . . . . . . . . . . . . . . 1,281,933 $21.69 8.05 $—
Options vested and expected to vest as of December 31, 2015 . . 1,244,866 $21.68 8.03 $—Options vested and exercisable as of December 31, 2015 . . . . . . 471,187 $21.29 7.44 $—
The weighted-average grant-date fair value of options granted during the years 2015, 2014 and2013 was $9.73, $10.05 and $9.27, respectively.
The total intrinsic value of options exercised during 2014 was $6,424. The total cash receivedfrom option exercises was $44,990 in 2014, and the cash tax benefit realized for the tax deductionsfrom these option exercises was approximately $2,400. No options were exercised during the yearsended December 31, 2015 and 2013.
As of December 31, 2015, there was $4,348,000 of total unrecognized compensation costrelated to nonvested stock options. Such cost is expected to be recognized over a weighted averageperiod of 1.90 years. The total fair value of options vested during the years ended December 31, 2015,2014 and 2013 was $2,381,000, $2,064,000 and $53,320, respectively.
Performance-Based Restricted Stock Units
In 2014, the Company began granting performance-based restricted stock units (“RSUs”) tokey executives, as well as certain of its other employees. Performance-based RSUs are awardsdenominated in units that are settled in shares of the Company’s common stock upon vesting. Thevesting of these units is subject to the employee’s continuing employment and the Company’sachievement of certain performance goals during the applicable vesting period. The fair value ofperformance-based RSUs is based on the fair value of the Company’s common stock on the date ofgrant. Expense for performance-based RSUs is recognized over the employees’ requisite service periodwhen the attainment of the performance goal is deemed probable.
A summary of the status of performance-based RSUs as of December 31, 2015 and changesduring the twelve months then ended is presented below:
Number of SharesWeighted-Average Grant-
Date Fair Value
Nonvested—December 31, 2014 . . . . . . . . . . . . . . . . . . . . . . . . . . . . . . 130,113 $22.73Granted . . . . . . . . . . . . . . . . . . . . . . . . . . . . . . . . . . . . . . . . . . . . . . . . . . 68,009 $23.15Vested . . . . . . . . . . . . . . . . . . . . . . . . . . . . . . . . . . . . . . . . . . . . . . . . . . . — $ —Forfeited . . . . . . . . . . . . . . . . . . . . . . . . . . . . . . . . . . . . . . . . . . . . . . . . . (40,368) $22.59
Nonvested—December 31, 2015 . . . . . . . . . . . . . . . . . . . . . . . . . . . . . . 157,754 $22.94
- II-106 -

APPENDIX II FINANCIAL INFORMATION OF THE TUMI GROUP
TUMI HOLDINGS, INC. AND SUBSIDIARIES
Notes to Consolidated Financial Statements
During the year ended December 31, 2015, the Company reduced its estimate of the number ofperformance-based RSUs that it expects will vest. Based on current projections, the attainment ofcertain performance goals is no longer deemed probable. This resulted in a cumulative adjustment toexpense of approximately $1,612,000 as of December 31, 2015.
Service-Based Restricted Stock Units
In 2014, the Company began granting service-based RSUs to certain non-employee directors.These service-based RSUs generally vest over a one-year period, subject to the director’s continuingservice. In 2015, the Company began granting service-based RSUs to key executives, as well as certainof its other employees. These service-based RSUs generally vest over a three-year period, subject tothe employee’s continuing service. The fair value of service-based RSUs is based on the fair value ofthe Company’s common stock on the date of grant.
A summary of the status of service-based RSUs as of December 31, 2015 and changes duringthe twelve months then ended is presented below:
Number of UnitsWeighted Average Grant-
Date Fair Value
Nonvested—December 31, 2014 . . . . . . . . . . . . . . . . . . . . . . . . . . . . . . . 10,680 $18.72Granted . . . . . . . . . . . . . . . . . . . . . . . . . . . . . . . . . . . . . . . . . . . . . . . . . . . 81,665 $23.20Vested . . . . . . . . . . . . . . . . . . . . . . . . . . . . . . . . . . . . . . . . . . . . . . . . . . . . (11,755) $19.13Forfeited . . . . . . . . . . . . . . . . . . . . . . . . . . . . . . . . . . . . . . . . . . . . . . . . . . (7,310) $23.25
Nonvested—December 31, 2015 . . . . . . . . . . . . . . . . . . . . . . . . . . . . . . . 73,280 $23.19
The weighted-average grant-date fair value of service-based RSUs granted during the years2015 and 2014 was $23.20 and $18.72, respectively. The were no service-based RSUs granted prior to2014.
As of December 31, 2015, there was $892,000 of total unrecognized compensation cost relatedto nonvested service-based RSUs. Such cost is expected to be recognized over a weighted averageperiod of 1.84 years. The total fair value of service-based RSUs vested during the year endedDecember 31, 2015 was $225,000. There were no service-based RSUs vested prior to 2015.
17. RELATED PARTY TRANSACTIONS
In connection with our IPO, in April 2012 we entered into an amended and restated registrationrights agreement with Doughty Hanson & Co IV Nominees One Limited, Doughty Hanson &Co IV Nominees Two Limited, Doughty Hanson & Co IV Nominees Three Limited, DoughtyHanson & Co IV Nominees Four Limited, Officers Nominees Limited, Stockwell Fund, L.P.,Brederode International s.à.r.l., HVB Capital Partners AG and certain former stockholders and JeromeGriffith. Jerome Griffith is a party to the agreement only with respect to the piggyback registrationrights described below. Pursuant to this registration rights agreement, subject to certain exceptions,holders of a majority of the then registrable common stock collectively have the right to require us toregister for public sale under the Securities Act all shares of common stock that it requests beregistered. The registration rights agreement limits the requests for registrations pursuant to a fully
- II-107 -
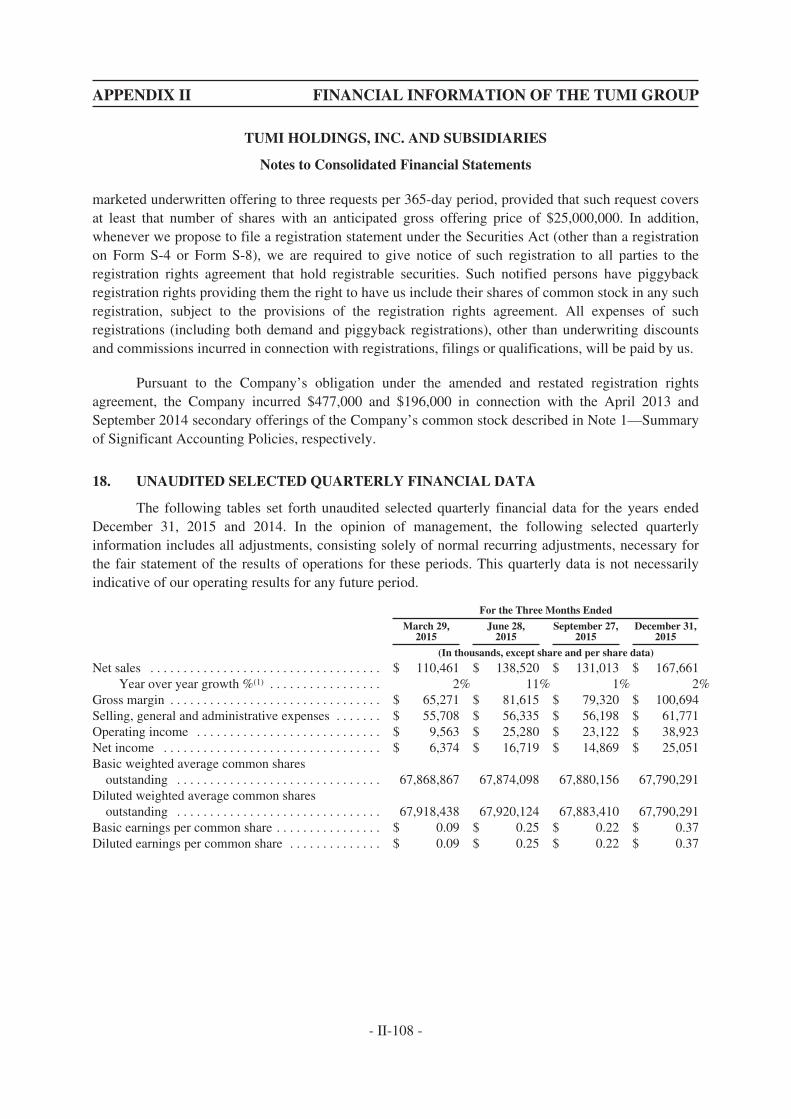
APPENDIX II FINANCIAL INFORMATION OF THE TUMI GROUP
TUMI HOLDINGS, INC. AND SUBSIDIARIES
Notes to Consolidated Financial Statements
marketed underwritten offering to three requests per 365-day period, provided that such request coversat least that number of shares with an anticipated gross offering price of $25,000,000. In addition,whenever we propose to file a registration statement under the Securities Act (other than a registrationon Form S-4 or Form S-8), we are required to give notice of such registration to all parties to theregistration rights agreement that hold registrable securities. Such notified persons have piggybackregistration rights providing them the right to have us include their shares of common stock in any suchregistration, subject to the provisions of the registration rights agreement. All expenses of suchregistrations (including both demand and piggyback registrations), other than underwriting discountsand commissions incurred in connection with registrations, filings or qualifications, will be paid by us.
Pursuant to the Company’s obligation under the amended and restated registration rightsagreement, the Company incurred $477,000 and $196,000 in connection with the April 2013 andSeptember 2014 secondary offerings of the Company’s common stock described in Note 1—Summaryof Significant Accounting Policies, respectively.
18. UNAUDITED SELECTED QUARTERLY FINANCIAL DATA
The following tables set forth unaudited selected quarterly financial data for the years endedDecember 31, 2015 and 2014. In the opinion of management, the following selected quarterlyinformation includes all adjustments, consisting solely of normal recurring adjustments, necessary forthe fair statement of the results of operations for these periods. This quarterly data is not necessarilyindicative of our operating results for any future period.
For the Three Months Ended
March 29,2015
June 28,2015
September 27,2015
December 31,2015
(In thousands, except share and per share data)
Net sales . . . . . . . . . . . . . . . . . . . . . . . . . . . . . . . . . . . $ 110,461 $ 138,520 $ 131,013 $ 167,661Year over year growth %(1) . . . . . . . . . . . . . . . . . 2% 11% 1% 2%
Gross margin . . . . . . . . . . . . . . . . . . . . . . . . . . . . . . . . $ 65,271 $ 81,615 $ 79,320 $ 100,694Selling, general and administrative expenses . . . . . . . $ 55,708 $ 56,335 $ 56,198 $ 61,771Operating income . . . . . . . . . . . . . . . . . . . . . . . . . . . . $ 9,563 $ 25,280 $ 23,122 $ 38,923Net income . . . . . . . . . . . . . . . . . . . . . . . . . . . . . . . . . $ 6,374 $ 16,719 $ 14,869 $ 25,051Basic weighted average common shares
outstanding . . . . . . . . . . . . . . . . . . . . . . . . . . . . . . . 67,868,867 67,874,098 67,880,156 67,790,291Diluted weighted average common shares
outstanding . . . . . . . . . . . . . . . . . . . . . . . . . . . . . . . 67,918,438 67,920,124 67,883,410 67,790,291Basic earnings per common share . . . . . . . . . . . . . . . . $ 0.09 $ 0.25 $ 0.22 $ 0.37Diluted earnings per common share . . . . . . . . . . . . . . $ 0.09 $ 0.25 $ 0.22 $ 0.37
- II-108 -
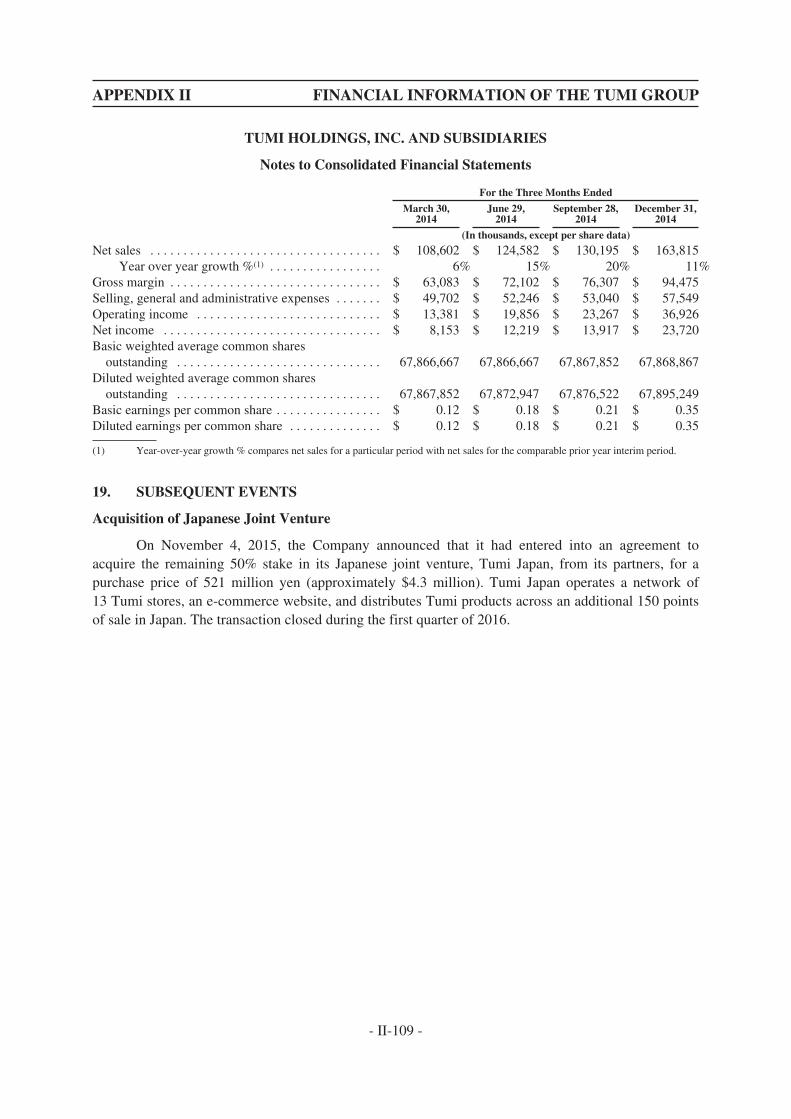
APPENDIX II FINANCIAL INFORMATION OF THE TUMI GROUP
TUMI HOLDINGS, INC. AND SUBSIDIARIES
Notes to Consolidated Financial Statements
For the Three Months Ended
March 30,2014
June 29,2014
September 28,2014
December 31,2014
(In thousands, except per share data)
Net sales . . . . . . . . . . . . . . . . . . . . . . . . . . . . . . . . . . . $ 108,602 $ 124,582 $ 130,195 $ 163,815Year over year growth %(1) . . . . . . . . . . . . . . . . . 6% 15% 20% 11%
Gross margin . . . . . . . . . . . . . . . . . . . . . . . . . . . . . . . . $ 63,083 $ 72,102 $ 76,307 $ 94,475Selling, general and administrative expenses . . . . . . . $ 49,702 $ 52,246 $ 53,040 $ 57,549Operating income . . . . . . . . . . . . . . . . . . . . . . . . . . . . $ 13,381 $ 19,856 $ 23,267 $ 36,926Net income . . . . . . . . . . . . . . . . . . . . . . . . . . . . . . . . . $ 8,153 $ 12,219 $ 13,917 $ 23,720Basic weighted average common shares
outstanding . . . . . . . . . . . . . . . . . . . . . . . . . . . . . . . 67,866,667 67,866,667 67,867,852 67,868,867Diluted weighted average common shares
outstanding . . . . . . . . . . . . . . . . . . . . . . . . . . . . . . . 67,867,852 67,872,947 67,876,522 67,895,249Basic earnings per common share . . . . . . . . . . . . . . . . $ 0.12 $ 0.18 $ 0.21 $ 0.35Diluted earnings per common share . . . . . . . . . . . . . . $ 0.12 $ 0.18 $ 0.21 $ 0.35
(1) Year-over-year growth % compares net sales for a particular period with net sales for the comparable prior year interim period.
19. SUBSEQUENT EVENTS
Acquisition of Japanese Joint Venture
On November 4, 2015, the Company announced that it had entered into an agreement toacquire the remaining 50% stake in its Japanese joint venture, Tumi Japan, from its partners, for apurchase price of 521 million yen (approximately $4.3 million). Tumi Japan operates a network of13 Tumi stores, an e-commerce website, and distributes Tumi products across an additional 150 pointsof sale in Japan. The transaction closed during the first quarter of 2016.
- II-109 -
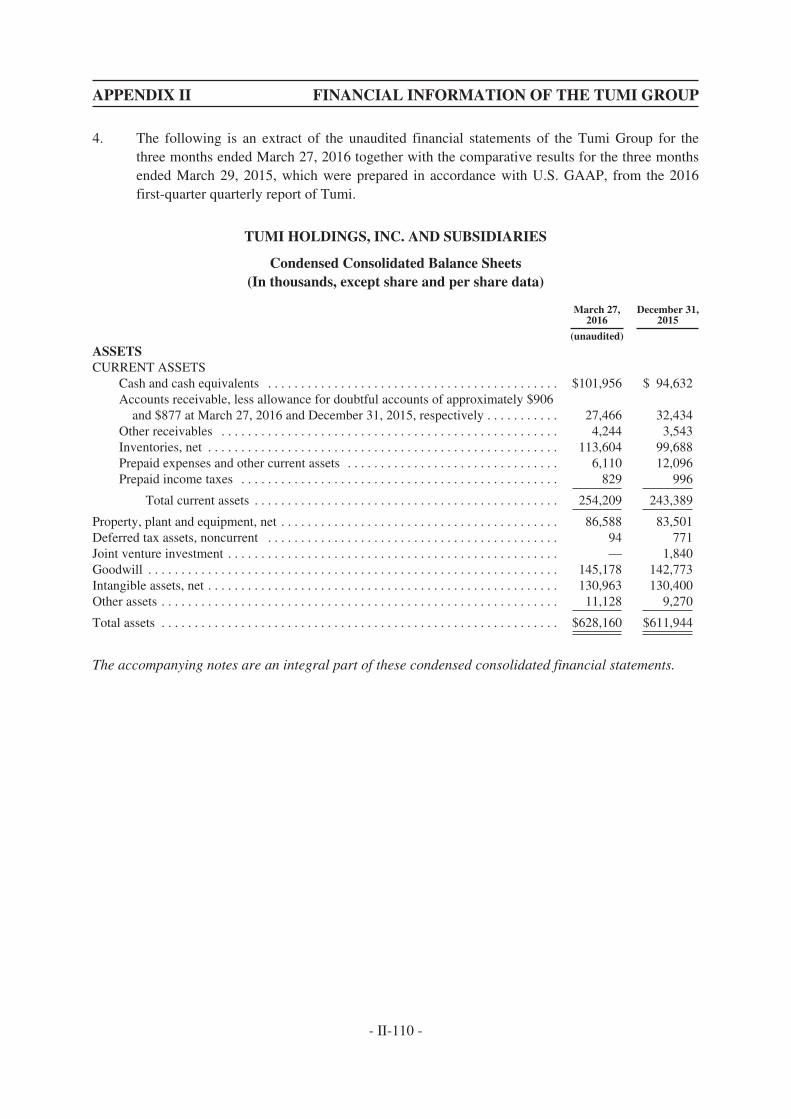
APPENDIX II FINANCIAL INFORMATION OF THE TUMI GROUP
4. The following is an extract of the unaudited financial statements of the Tumi Group for thethree months ended March 27, 2016 together with the comparative results for the three monthsended March 29, 2015, which were prepared in accordance with U.S. GAAP, from the 2016first-quarter quarterly report of Tumi.
TUMI HOLDINGS, INC. AND SUBSIDIARIES
Condensed Consolidated Balance Sheets(In thousands, except share and per share data)
March 27,2016
December 31,2015
(unaudited)
ASSETSCURRENT ASSETS
Cash and cash equivalents . . . . . . . . . . . . . . . . . . . . . . . . . . . . . . . . . . . . . . . . . . . . $101,956 $ 94,632Accounts receivable, less allowance for doubtful accounts of approximately $906
and $877 at March 27, 2016 and December 31, 2015, respectively . . . . . . . . . . . 27,466 32,434Other receivables . . . . . . . . . . . . . . . . . . . . . . . . . . . . . . . . . . . . . . . . . . . . . . . . . . . 4,244 3,543Inventories, net . . . . . . . . . . . . . . . . . . . . . . . . . . . . . . . . . . . . . . . . . . . . . . . . . . . . . 113,604 99,688Prepaid expenses and other current assets . . . . . . . . . . . . . . . . . . . . . . . . . . . . . . . . 6,110 12,096Prepaid income taxes . . . . . . . . . . . . . . . . . . . . . . . . . . . . . . . . . . . . . . . . . . . . . . . . 829 996
Total current assets . . . . . . . . . . . . . . . . . . . . . . . . . . . . . . . . . . . . . . . . . . . . . . 254,209 243,389
Property, plant and equipment, net . . . . . . . . . . . . . . . . . . . . . . . . . . . . . . . . . . . . . . . . . . 86,588 83,501Deferred tax assets, noncurrent . . . . . . . . . . . . . . . . . . . . . . . . . . . . . . . . . . . . . . . . . . . . 94 771Joint venture investment . . . . . . . . . . . . . . . . . . . . . . . . . . . . . . . . . . . . . . . . . . . . . . . . . . — 1,840Goodwill . . . . . . . . . . . . . . . . . . . . . . . . . . . . . . . . . . . . . . . . . . . . . . . . . . . . . . . . . . . . . . 145,178 142,773Intangible assets, net . . . . . . . . . . . . . . . . . . . . . . . . . . . . . . . . . . . . . . . . . . . . . . . . . . . . . 130,963 130,400Other assets . . . . . . . . . . . . . . . . . . . . . . . . . . . . . . . . . . . . . . . . . . . . . . . . . . . . . . . . . . . . 11,128 9,270
Total assets . . . . . . . . . . . . . . . . . . . . . . . . . . . . . . . . . . . . . . . . . . . . . . . . . . . . . . . . . . . . $628,160 $611,944
The accompanying notes are an integral part of these condensed consolidated financial statements.
- II-110 -
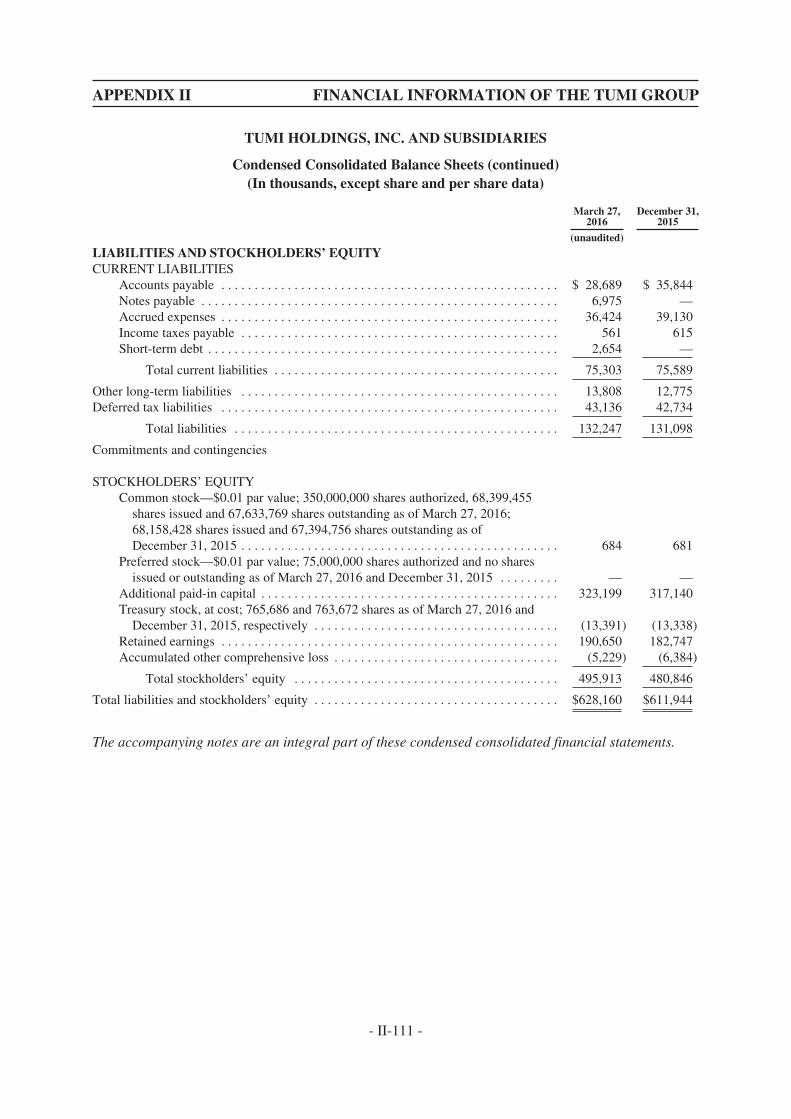
APPENDIX II FINANCIAL INFORMATION OF THE TUMI GROUP
TUMI HOLDINGS, INC. AND SUBSIDIARIES
Condensed Consolidated Balance Sheets (continued)(In thousands, except share and per share data)
March 27,2016
December 31,2015
(unaudited)
LIABILITIES AND STOCKHOLDERS’ EQUITYCURRENT LIABILITIES
Accounts payable . . . . . . . . . . . . . . . . . . . . . . . . . . . . . . . . . . . . . . . . . . . . . . . . . . . $ 28,689 $ 35,844Notes payable . . . . . . . . . . . . . . . . . . . . . . . . . . . . . . . . . . . . . . . . . . . . . . . . . . . . . . 6,975 —Accrued expenses . . . . . . . . . . . . . . . . . . . . . . . . . . . . . . . . . . . . . . . . . . . . . . . . . . . 36,424 39,130Income taxes payable . . . . . . . . . . . . . . . . . . . . . . . . . . . . . . . . . . . . . . . . . . . . . . . . 561 615Short-term debt . . . . . . . . . . . . . . . . . . . . . . . . . . . . . . . . . . . . . . . . . . . . . . . . . . . . . 2,654 —
Total current liabilities . . . . . . . . . . . . . . . . . . . . . . . . . . . . . . . . . . . . . . . . . . . 75,303 75,589
Other long-term liabilities . . . . . . . . . . . . . . . . . . . . . . . . . . . . . . . . . . . . . . . . . . . . . . . . 13,808 12,775Deferred tax liabilities . . . . . . . . . . . . . . . . . . . . . . . . . . . . . . . . . . . . . . . . . . . . . . . . . . . 43,136 42,734
Total liabilities . . . . . . . . . . . . . . . . . . . . . . . . . . . . . . . . . . . . . . . . . . . . . . . . . 132,247 131,098
Commitments and contingencies
STOCKHOLDERS’ EQUITYCommon stock—$0.01 par value; 350,000,000 shares authorized, 68,399,455
shares issued and 67,633,769 shares outstanding as of March 27, 2016;68,158,428 shares issued and 67,394,756 shares outstanding as ofDecember 31, 2015 . . . . . . . . . . . . . . . . . . . . . . . . . . . . . . . . . . . . . . . . . . . . . . . . 684 681
Preferred stock—$0.01 par value; 75,000,000 shares authorized and no sharesissued or outstanding as of March 27, 2016 and December 31, 2015 . . . . . . . . . — —
Additional paid-in capital . . . . . . . . . . . . . . . . . . . . . . . . . . . . . . . . . . . . . . . . . . . . . 323,199 317,140Treasury stock, at cost; 765,686 and 763,672 shares as of March 27, 2016 and
December 31, 2015, respectively . . . . . . . . . . . . . . . . . . . . . . . . . . . . . . . . . . . . . (13,391) (13,338)Retained earnings . . . . . . . . . . . . . . . . . . . . . . . . . . . . . . . . . . . . . . . . . . . . . . . . . . . 190,650 182,747Accumulated other comprehensive loss . . . . . . . . . . . . . . . . . . . . . . . . . . . . . . . . . . (5,229) (6,384)
Total stockholders’ equity . . . . . . . . . . . . . . . . . . . . . . . . . . . . . . . . . . . . . . . . 495,913 480,846
Total liabilities and stockholders’ equity . . . . . . . . . . . . . . . . . . . . . . . . . . . . . . . . . . . . . $628,160 $611,944
The accompanying notes are an integral part of these condensed consolidated financial statements.
- II-111 -
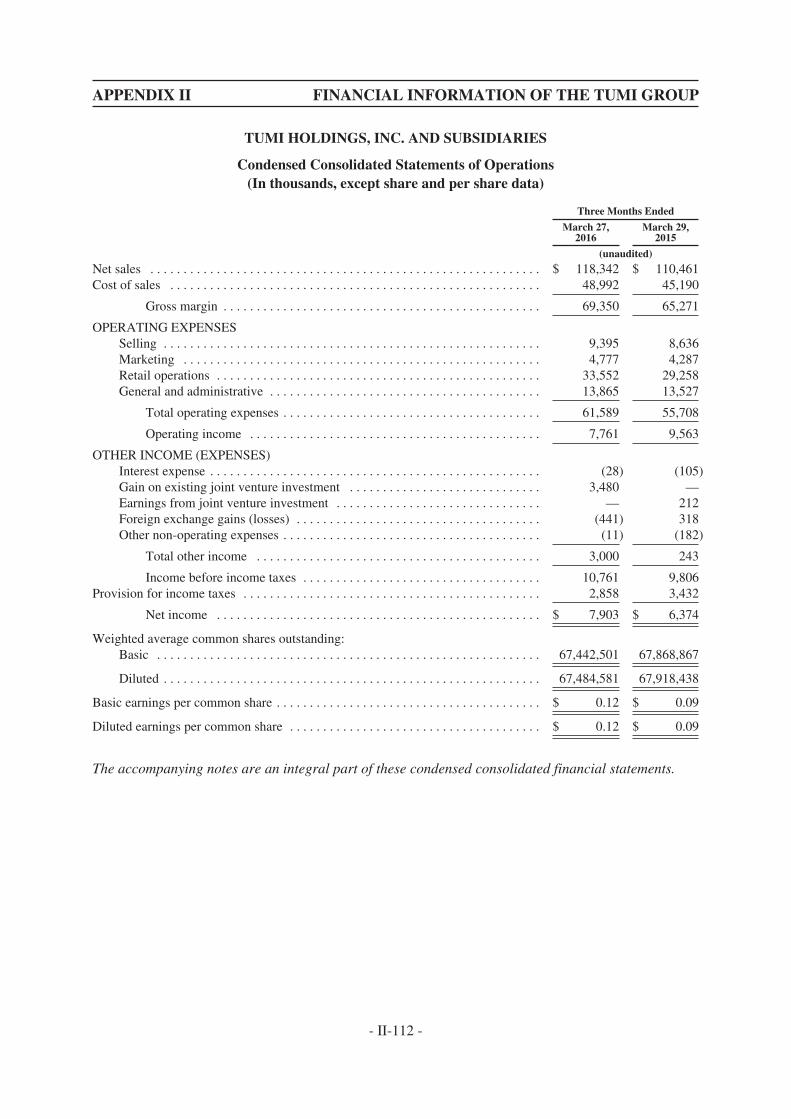
APPENDIX II FINANCIAL INFORMATION OF THE TUMI GROUP
TUMI HOLDINGS, INC. AND SUBSIDIARIES
Condensed Consolidated Statements of Operations(In thousands, except share and per share data)
Three Months Ended
March 27,2016
March 29,2015
(unaudited)
Net sales . . . . . . . . . . . . . . . . . . . . . . . . . . . . . . . . . . . . . . . . . . . . . . . . . . . . . . . . . . . $ 118,342 $ 110,461Cost of sales . . . . . . . . . . . . . . . . . . . . . . . . . . . . . . . . . . . . . . . . . . . . . . . . . . . . . . . . 48,992 45,190
Gross margin . . . . . . . . . . . . . . . . . . . . . . . . . . . . . . . . . . . . . . . . . . . . . . . . 69,350 65,271
OPERATING EXPENSESSelling . . . . . . . . . . . . . . . . . . . . . . . . . . . . . . . . . . . . . . . . . . . . . . . . . . . . . . . . . 9,395 8,636Marketing . . . . . . . . . . . . . . . . . . . . . . . . . . . . . . . . . . . . . . . . . . . . . . . . . . . . . . 4,777 4,287Retail operations . . . . . . . . . . . . . . . . . . . . . . . . . . . . . . . . . . . . . . . . . . . . . . . . . 33,552 29,258General and administrative . . . . . . . . . . . . . . . . . . . . . . . . . . . . . . . . . . . . . . . . . 13,865 13,527
Total operating expenses . . . . . . . . . . . . . . . . . . . . . . . . . . . . . . . . . . . . . . . 61,589 55,708
Operating income . . . . . . . . . . . . . . . . . . . . . . . . . . . . . . . . . . . . . . . . . . . . 7,761 9,563
OTHER INCOME (EXPENSES)Interest expense . . . . . . . . . . . . . . . . . . . . . . . . . . . . . . . . . . . . . . . . . . . . . . . . . . (28) (105)Gain on existing joint venture investment . . . . . . . . . . . . . . . . . . . . . . . . . . . . . 3,480 —Earnings from joint venture investment . . . . . . . . . . . . . . . . . . . . . . . . . . . . . . . — 212Foreign exchange gains (losses) . . . . . . . . . . . . . . . . . . . . . . . . . . . . . . . . . . . . . (441) 318Other non-operating expenses . . . . . . . . . . . . . . . . . . . . . . . . . . . . . . . . . . . . . . . (11) (182)
Total other income . . . . . . . . . . . . . . . . . . . . . . . . . . . . . . . . . . . . . . . . . . . 3,000 243
Income before income taxes . . . . . . . . . . . . . . . . . . . . . . . . . . . . . . . . . . . . 10,761 9,806Provision for income taxes . . . . . . . . . . . . . . . . . . . . . . . . . . . . . . . . . . . . . . . . . . . . . 2,858 3,432
Net income . . . . . . . . . . . . . . . . . . . . . . . . . . . . . . . . . . . . . . . . . . . . . . . . . $ 7,903 $ 6,374
Weighted average common shares outstanding:Basic . . . . . . . . . . . . . . . . . . . . . . . . . . . . . . . . . . . . . . . . . . . . . . . . . . . . . . . . . . 67,442,501 67,868,867
Diluted . . . . . . . . . . . . . . . . . . . . . . . . . . . . . . . . . . . . . . . . . . . . . . . . . . . . . . . . . 67,484,581 67,918,438
Basic earnings per common share . . . . . . . . . . . . . . . . . . . . . . . . . . . . . . . . . . . . . . . . $ 0.12 $ 0.09
Diluted earnings per common share . . . . . . . . . . . . . . . . . . . . . . . . . . . . . . . . . . . . . . $ 0.12 $ 0.09
The accompanying notes are an integral part of these condensed consolidated financial statements.
- II-112 -
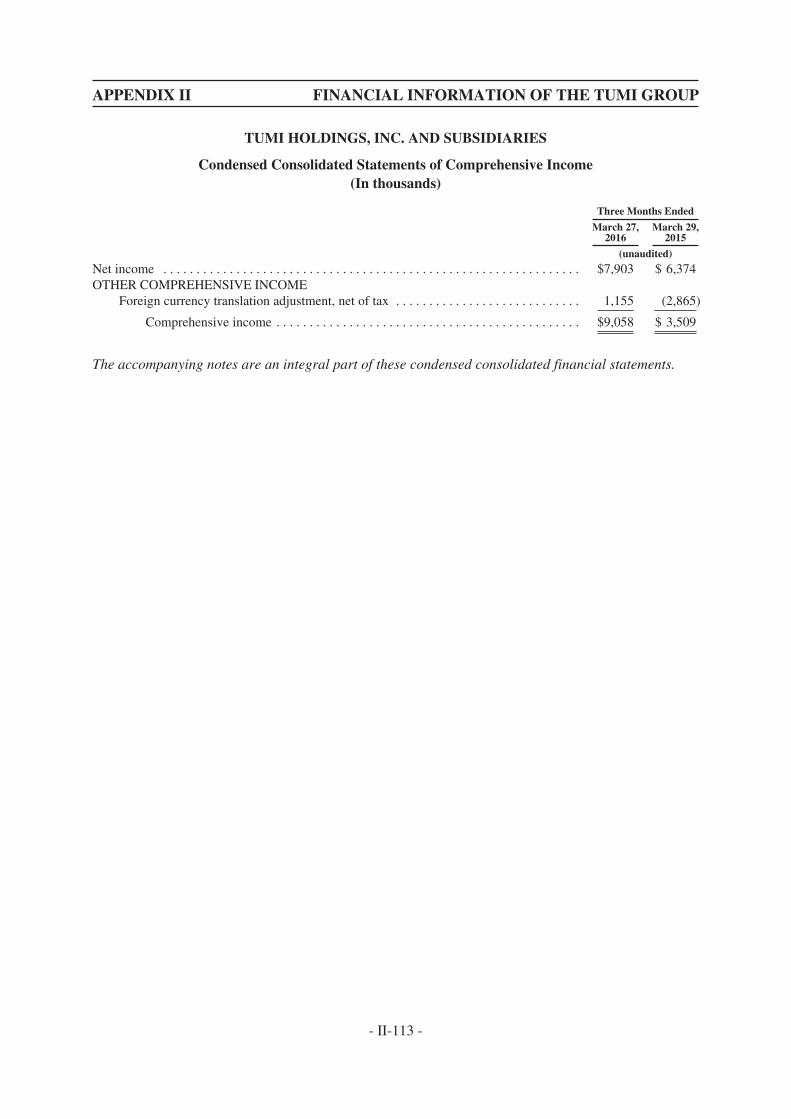
APPENDIX II FINANCIAL INFORMATION OF THE TUMI GROUP
TUMI HOLDINGS, INC. AND SUBSIDIARIES
Condensed Consolidated Statements of Comprehensive Income(In thousands)
Three Months Ended
March 27,2016
March 29,2015
(unaudited)
Net income . . . . . . . . . . . . . . . . . . . . . . . . . . . . . . . . . . . . . . . . . . . . . . . . . . . . . . . . . . . . . . . $7,903 $ 6,374OTHER COMPREHENSIVE INCOME
Foreign currency translation adjustment, net of tax . . . . . . . . . . . . . . . . . . . . . . . . . . . . 1,155 (2,865)
Comprehensive income . . . . . . . . . . . . . . . . . . . . . . . . . . . . . . . . . . . . . . . . . . . . . . $9,058 $ 3,509
The accompanying notes are an integral part of these condensed consolidated financial statements.
- II-113 -
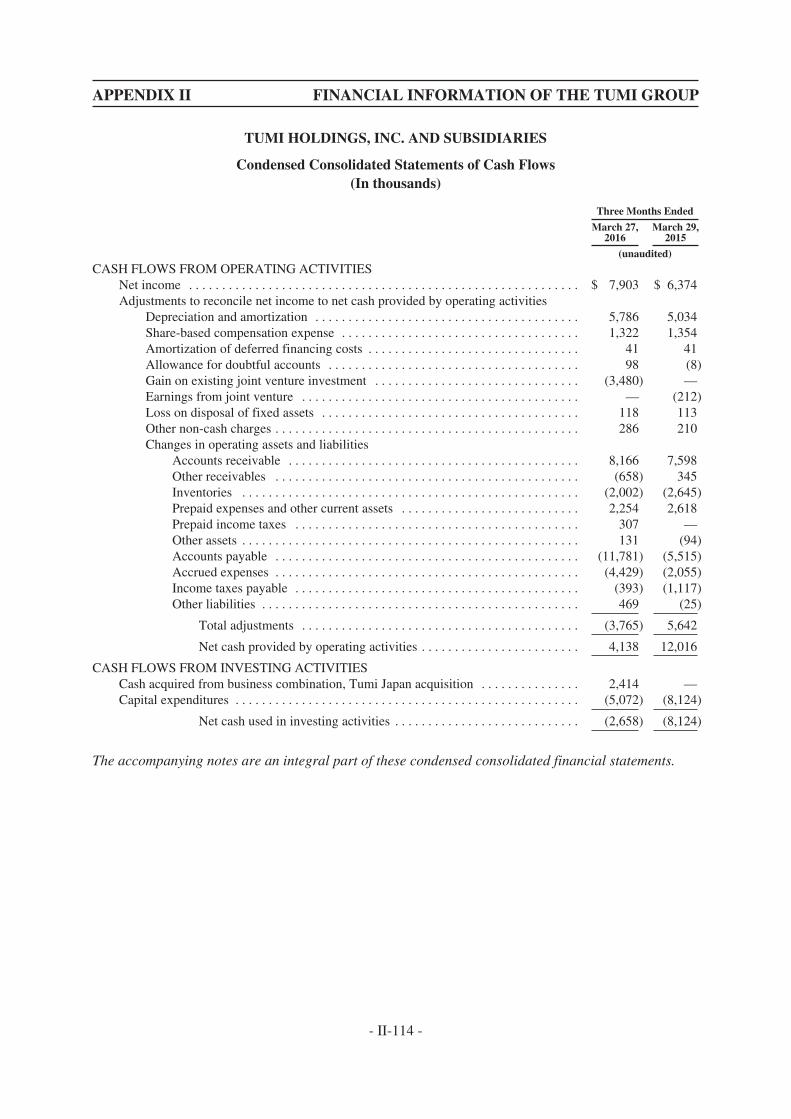
APPENDIX II FINANCIAL INFORMATION OF THE TUMI GROUP
TUMI HOLDINGS, INC. AND SUBSIDIARIES
Condensed Consolidated Statements of Cash Flows(In thousands)
Three Months Ended
March 27,2016
March 29,2015
(unaudited)
CASH FLOWS FROM OPERATING ACTIVITIESNet income . . . . . . . . . . . . . . . . . . . . . . . . . . . . . . . . . . . . . . . . . . . . . . . . . . . . . . . . . . . $ 7,903 $ 6,374Adjustments to reconcile net income to net cash provided by operating activities
Depreciation and amortization . . . . . . . . . . . . . . . . . . . . . . . . . . . . . . . . . . . . . . . . 5,786 5,034Share-based compensation expense . . . . . . . . . . . . . . . . . . . . . . . . . . . . . . . . . . . . 1,322 1,354Amortization of deferred financing costs . . . . . . . . . . . . . . . . . . . . . . . . . . . . . . . . 41 41Allowance for doubtful accounts . . . . . . . . . . . . . . . . . . . . . . . . . . . . . . . . . . . . . . 98 (8)Gain on existing joint venture investment . . . . . . . . . . . . . . . . . . . . . . . . . . . . . . . (3,480) —Earnings from joint venture . . . . . . . . . . . . . . . . . . . . . . . . . . . . . . . . . . . . . . . . . . — (212)Loss on disposal of fixed assets . . . . . . . . . . . . . . . . . . . . . . . . . . . . . . . . . . . . . . . 118 113Other non-cash charges . . . . . . . . . . . . . . . . . . . . . . . . . . . . . . . . . . . . . . . . . . . . . . 286 210Changes in operating assets and liabilities
Accounts receivable . . . . . . . . . . . . . . . . . . . . . . . . . . . . . . . . . . . . . . . . . . . . 8,166 7,598Other receivables . . . . . . . . . . . . . . . . . . . . . . . . . . . . . . . . . . . . . . . . . . . . . . (658) 345Inventories . . . . . . . . . . . . . . . . . . . . . . . . . . . . . . . . . . . . . . . . . . . . . . . . . . . (2,002) (2,645)Prepaid expenses and other current assets . . . . . . . . . . . . . . . . . . . . . . . . . . . 2,254 2,618Prepaid income taxes . . . . . . . . . . . . . . . . . . . . . . . . . . . . . . . . . . . . . . . . . . . 307 —Other assets . . . . . . . . . . . . . . . . . . . . . . . . . . . . . . . . . . . . . . . . . . . . . . . . . . . 131 (94)Accounts payable . . . . . . . . . . . . . . . . . . . . . . . . . . . . . . . . . . . . . . . . . . . . . . (11,781) (5,515)Accrued expenses . . . . . . . . . . . . . . . . . . . . . . . . . . . . . . . . . . . . . . . . . . . . . . (4,429) (2,055)Income taxes payable . . . . . . . . . . . . . . . . . . . . . . . . . . . . . . . . . . . . . . . . . . . (393) (1,117)Other liabilities . . . . . . . . . . . . . . . . . . . . . . . . . . . . . . . . . . . . . . . . . . . . . . . . 469 (25)
Total adjustments . . . . . . . . . . . . . . . . . . . . . . . . . . . . . . . . . . . . . . . . . . (3,765) 5,642
Net cash provided by operating activities . . . . . . . . . . . . . . . . . . . . . . . . 4,138 12,016
CASH FLOWS FROM INVESTING ACTIVITIESCash acquired from business combination, Tumi Japan acquisition . . . . . . . . . . . . . . . 2,414 —Capital expenditures . . . . . . . . . . . . . . . . . . . . . . . . . . . . . . . . . . . . . . . . . . . . . . . . . . . . (5,072) (8,124)
Net cash used in investing activities . . . . . . . . . . . . . . . . . . . . . . . . . . . . (2,658) (8,124)
The accompanying notes are an integral part of these condensed consolidated financial statements.
- II-114 -
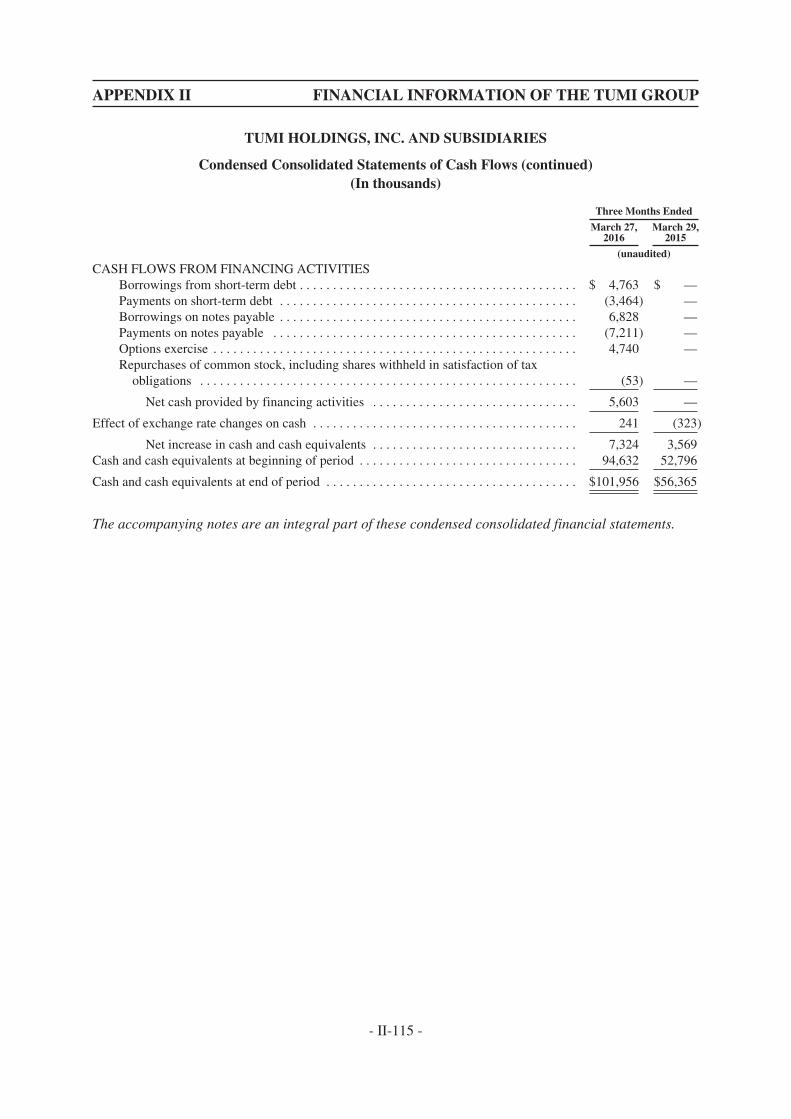
APPENDIX II FINANCIAL INFORMATION OF THE TUMI GROUP
TUMI HOLDINGS, INC. AND SUBSIDIARIES
Condensed Consolidated Statements of Cash Flows (continued)(In thousands)
Three Months Ended
March 27,2016
March 29,2015
(unaudited)
CASH FLOWS FROM FINANCING ACTIVITIESBorrowings from short-term debt . . . . . . . . . . . . . . . . . . . . . . . . . . . . . . . . . . . . . . . . . . $ 4,763 $ —Payments on short-term debt . . . . . . . . . . . . . . . . . . . . . . . . . . . . . . . . . . . . . . . . . . . . . (3,464) —Borrowings on notes payable . . . . . . . . . . . . . . . . . . . . . . . . . . . . . . . . . . . . . . . . . . . . . 6,828 —Payments on notes payable . . . . . . . . . . . . . . . . . . . . . . . . . . . . . . . . . . . . . . . . . . . . . . (7,211) —Options exercise . . . . . . . . . . . . . . . . . . . . . . . . . . . . . . . . . . . . . . . . . . . . . . . . . . . . . . . 4,740 —Repurchases of common stock, including shares withheld in satisfaction of tax
obligations . . . . . . . . . . . . . . . . . . . . . . . . . . . . . . . . . . . . . . . . . . . . . . . . . . . . . . . . . (53) —
Net cash provided by financing activities . . . . . . . . . . . . . . . . . . . . . . . . . . . . . . . 5,603 —
Effect of exchange rate changes on cash . . . . . . . . . . . . . . . . . . . . . . . . . . . . . . . . . . . . . . . . 241 (323)
Net increase in cash and cash equivalents . . . . . . . . . . . . . . . . . . . . . . . . . . . . . . . 7,324 3,569Cash and cash equivalents at beginning of period . . . . . . . . . . . . . . . . . . . . . . . . . . . . . . . . . 94,632 52,796
Cash and cash equivalents at end of period . . . . . . . . . . . . . . . . . . . . . . . . . . . . . . . . . . . . . . $101,956 $56,365
The accompanying notes are an integral part of these condensed consolidated financial statements.
- II-115 -
APPENDIX II FINANCIAL INFORMATION OF THE TUMI GROUP
TUMI HOLDINGS, INC. AND SUBSIDIARIES
Notes to the Condensed Consolidated Financial Statements(unaudited)
1. BASIS OF PRESENTATION AND ORGANIZATION
Nature of Operations
Tumi Holdings, Inc. (together with its subsidiaries, the “Company”) is a leading designer,producer and marketer of a comprehensive line of travel and business products and accessories inmultiple categories. The Company’s product offerings include travel bags, business cases, totes,handbags, business and travel accessories and small leather goods. The Company designs its productsfor, and markets its products to, sophisticated professionals, frequent travelers and brand-consciousindividuals who enjoy the premium status and durability of Tumi products. The Company sells itsproducts through a network of company-owned full-price stores and outlet stores, partner stores,concessions, shop-in-shops, specialty luggage shops, high-end department stores and e-commercedistribution channels. The Company has approximately 2,100 points of distribution in over75 countries, and its global distribution network is enhanced by the use of its four logistics facilitieslocated in the United States, Europe and Asia. The Company designs its products in its U.S. designstudios and selectively collaborates with well-known, international, industrial and fashion designers forlimited edition product lines. Production is sourced globally through a network of suppliers based inAsia, many of which are longtime suppliers, and in the Caribbean.
The Company’s business is seasonal in nature and, as a result, net sales and working capitalrequirements fluctuate from quarter to quarter. The Company’s fourth quarter is a significant periodwith regard to the results of operations due to increased Direct-to-Consumer sales during the holidayseason in North America and Europe. During the fourth quarter, the Company expects inventory levels,accounts payable and accrued expenses to increase commensurate with net sales.
Merger Agreement with Samsonite
On March 3, 2016, Tumi Holdings, Inc. (the “Company”) entered into an Agreement and Planof Merger (the “Merger Agreement”) with Samsonite International S.A., a public limited liabilitycompany (société anonyme) incorporated and governed by the laws of the Grand-Duchy ofLuxembourg (“Samsonite”), and PTL Acquisition Inc., a Delaware corporation and an indirect whollyowned subsidiary of Samsonite (“Merger Sub”).
The Merger Agreement provides that, among other things and in accordance with the terms andsubject to the conditions thereof, Merger Sub will be merged with and into the Company (the“Merger”) with the Company continuing as the surviving corporation in the Merger, and, at theeffective time of the Merger (the “Effective Time”), each outstanding share of common stock of theCompany, par value $0.01 per share (“Company Common Stock”) (other than shares owned by theCompany or any of its subsidiaries or Samsonite or any of its subsidiaries (including Merger Sub),which shall be cancelled, and any Dissenting Shares (as defined in the Merger Agreement)), willautomatically be cancelled and converted into the right to receive $26.75 in cash, without interest (the“Merger Consideration”).
The closing of the Merger is subject to customary closing conditions, including adoption of theMerger Agreement by the affirmative vote of the holders of at least a majority of all outstanding shares
- II-116 -
APPENDIX II FINANCIAL INFORMATION OF THE TUMI GROUP
TUMI HOLDINGS, INC. AND SUBSIDIARIES
Notes to the Condensed Consolidated Financial Statements(unaudited)
of Company Common Stock entitled to vote thereon and the absence of a Company Material AdverseEffect (as defined in the Merger Agreement) after the date of the Merger Agreement. Consummation ofthe Merger also is subject to approval of the Merger Agreement and the transactions contemplatedthereby, including the Merger, by an ordinary resolution of the shareholders of Samsonite.Consummation of the Merger is not subject to a financing condition.
Basis of Presentation
The accompanying unaudited condensed consolidated financial statements have been preparedin accordance with U.S. generally accepted accounting principles (“US GAAP”) and applicable rulesand regulations of the SEC regarding interim financial reporting. Certain information and notedisclosures normally included in financial statements prepared in accordance with US GAAP havebeen condensed or omitted pursuant to such rules and regulations. Therefore, these condensedconsolidated financial statements should be read in conjunction with the consolidated financialstatements and notes included in the Company’s Annual Report on Form 10-K for the year endedDecember 31, 2015, filed with the SEC on February 25, 2016.
The condensed consolidated balance sheet as of December 31, 2015 included herein wasderived from the audited financial statements as of that date.
The Company has historically accounted for its Japanese joint venture (“Tumi Japan”) underthe equity method of accounting. During the first quarter of 2016, the Company acquired the remaininginterest in its joint venture from its partners. As such, beginning with the first quarter of 2016, theCompany now consolidates Tumi Japan into its operations. See Note 6 for additional information.
In the opinion of management, the accompanying unaudited condensed consolidated financialstatements reflect all normal recurring adjustments necessary to present fairly the financial position,results of operations and cash flows for the interim periods, but are not necessarily indicative of theresults of operations for the full year 2016 or any future period.
Reporting Periods
The reporting periods for the Company’s unaudited interim quarterly financial information arebased on the first month of each fiscal quarter including five Sundays and the second and third monthsof each fiscal quarter including four Sundays, with the fourth quarter always ending on December 31.Accordingly, the three-month reporting periods for the unaudited interim condensed consolidatedfinancial statements included herein commenced on January 1, 2016 and January 1, 2015 and ended onMarch 27, 2016 and March 29, 2015, respectively.
Estimates
The preparation of the Company’s condensed consolidated financial statements in conformitywith US GAAP requires management to make estimates and assumptions that affect the reportedamounts of assets and liabilities and disclosure of contingent assets and liabilities at the date of the
- II-117 -
APPENDIX II FINANCIAL INFORMATION OF THE TUMI GROUP
TUMI HOLDINGS, INC. AND SUBSIDIARIES
Notes to the Condensed Consolidated Financial Statements(unaudited)
financial statements and the reported amounts of revenues and expenses during the reporting period.Significant estimates include valuation of goodwill and intangibles, allowance for doubtful accounts,adjustments for slow-moving and obsolete inventory, accrued warranties, realization of deferred taxassets, income tax uncertainties, the valuation of share-based compensation and related forfeiture ratesand useful lives of assets. Actual results could differ materially from those estimates.
Reclassification
Certain prior period amounts have been reclassified to conform to the current year presentation.
Cash and Cash Equivalents
As of March 27, 2016, the total balance in U.S. bank accounts over the Federal DepositInsurance Company limit then in effect was approximately $87,412,000. The total balance ininternational bank accounts at March 27, 2016, which is not covered under the FDIC, wasapproximately $13,195,000.
Fair Value Measurements
The Company applies the Financial Accounting Standards Board’s (the “FASB”) guidance for“Fair Value Measurements.” Under this standard, fair value is defined as the price that would bereceived to sell an asset or paid to transfer a liability (i.e., the “exit price”) in an orderly transactionbetween market participants at the measurement date.
In determining fair value, the Company uses various valuation approaches. The hierarchy ofthose valuation approaches is broken down into three levels based on the reliability of inputs asfollows:
Level 1— Inputs that are quoted prices in active markets for identical assets or liabilities that theCompany has the ability to access at the measurement date. An active market for the assetor liability is a market in which transactions for the asset or liability occur with sufficientfrequency and volume to provide pricing information on an ongoing basis. The valuationunder this approach does not entail a significant degree of judgment.
Level 2— Inputs, other than quoted prices included within Level 1, that are observable for the assetor liability, either directly or indirectly. Level 2 inputs include quoted prices for similarassets or liabilities in active markets, inputs other than quoted prices that are observablefor the asset or liability (e.g., interest rates and yield curves observable at commonlyquoted intervals or current market) and contractual prices for the underlying financialinstrument, as well as other relevant economic measures.
Level 3— Inputs that are unobservable for the asset or liability. Unobservable inputs are used tomeasure fair value to the extent that observable inputs are not available, thereby allowingfor situations in which there is little, if any, market activity for the asset or liability at themeasurement date.
- II-118 -
APPENDIX II FINANCIAL INFORMATION OF THE TUMI GROUP
TUMI HOLDINGS, INC. AND SUBSIDIARIES
Notes to the Condensed Consolidated Financial Statements(unaudited)
The Company’s non-financial assets which are subject to nonrecurring fair value measurementsinclude goodwill, intangible assets and property, plant and equipment. These assets are recorded atcarrying value. However, whenever events or changes in circumstances indicate that their carryingvalue may not be fully recoverable (or at least annually for goodwill and indefinite-lived intangibleassets), such assets are assessed for impairment and, if applicable, written down to and recorded at fairvalue. To measure fair value for such assets, the Company uses techniques including discountedexpected future cash flows (“DCF”). These measures of fair value, and related inputs, are consideredlevel 2 measures under the fair value hierarchy.
Due to their short term maturity, management believes the carrying amounts of cash and cashequivalents, accounts receivable and accounts payable were reasonable estimates of their fair value asof March 27, 2016.
2. RECENTLY ISSUED ACCOUNTING PRONOUNCEMENTS
In May 2014, the FASB issued ASU No. 2014-09, “Revenue from Contracts with Customers(Topic 606)” which amended the existing accounting standards for revenue recognition. ASU 2014-09establishes principles for recognizing revenue upon the transfer of promised goods or services tocustomers, in an amount that reflects the expected consideration received in exchange for those goodsor services. The guidance was effective for fiscal years beginning after December 15, 2016 and forinterim periods within those fiscal years. In recent re-deliberations, the FASB approved a one-yeardeferral of the effective date of this guidance, such that it will be effective on January 1, 2018. Earlyadoption is not permitted. In March 2016, the FASB issued final amendments (ASU No. 2016-08 andASU No. 2016-10) to clarify the implementation guidance for principal versus agent considerations,identifying performance obligations and the accounting for licenses of intellectual property. Theamendments can be applied retrospectively to each prior reporting period or retrospectively with thecumulative effect of initially applying this update recognized at the date of initial application. Earlyapplication is permitted but not before the original public entity effective date, i.e., annual periodsbeginning after December 15, 2016. The Company is currently in the process of evaluating the impactof adoption of the ASU on its condensed consolidated financial statements, but does not expect theimpact to be material.
In June 2014, the FASB issued ASU 2014-12, “Accounting for Share-Based Payments Whenthe Terms of an Award Provide That a Performance Target Could Be Achieved After the RequisiteService Period (Topic 718)”. ASU 2014-12 requires that a performance target that affects vesting andthat could be achieved after the requisite service period be treated as a performance condition. As such,the performance target should not be reflected in estimating the grant-date fair value of the award.ASU 2014-12 is effective for annual reporting periods beginning after December 15, 2015, with earlyadoption permitted. The Company adopted the amended guidance effective January 1, 2016 and it didnot have a material effect on its condensed consolidated financial statements.
In August 2014, the FASB issued ASU 2014-15, “Presentation of Financial Statements—GoingConcern (Subtopic 205-40): Disclosure of Uncertainties about an Entity’s Ability to Continue as a
- II-119 -
APPENDIX II FINANCIAL INFORMATION OF THE TUMI GROUP
TUMI HOLDINGS, INC. AND SUBSIDIARIES
Notes to the Condensed Consolidated Financial Statements(unaudited)
Going Concern”. ASU 2014-15 addresses management’s responsibility in evaluating whether there issubstantial doubt about a company’s ability to continue as a going concern and to provide relatedfootnote disclosures. Management’s evaluation should be based on relevant conditions and events thatare known and reasonably knowable at the date that the financial statements are issued. This guidanceis effective for fiscal years ending after December 15, 2016 and for interim periods within those fiscalyears, with early adoption permitted. The Company adopted the guidance effective January 1, 2016and it did not have a material effect on its condensed consolidated financial statements.
In April 2015, the FASB issued ASU 2015-03, “Simplifying the Presentation of Debt IssuanceCosts (Subtopic 835-30)” which requires debt issuance costs related to a recognized debt liability to bepresented in the balance sheet as a direct deduction from the carrying amount of that debt liability,consistent with debt discounts or premiums. ASU 2015-03 is effective for annual reporting periodsbeginning after December 15, 2015, with early adoption permitted. The Company adopted theamended guidance effective January 1, 2016 and it did not have a material effect on its condensedconsolidated financial statements.
In July 2015, the FASB issued ASU 2015-11, “Simplifying the Measurement of Inventory.”Under this ASU, inventory will be measured at the “lower of cost and net realizable value” and optionsthat currently exist for “market value” will be eliminated. The ASU defines net realizable value as the“estimated selling prices in the ordinary course of business, less reasonably predictable costs ofcompletion, disposal, and transportation.” No other changes were made to the current guidance oninventory measurement. ASU 2015-11 is effective for interim and annual periods beginning afterDecember 15, 2016, with early adoption permitted. The Company is currently in the process ofevaluating the impact of adoption of the ASU on its condensed consolidated financial statements, butdoes not expect the impact to be material.
In September 2015, the FASB issued ASU 2015-16, “Simplifying the Accounting forMeasurement-Period Adjustments (Topic 805: Business Combinations)” which eliminates therequirement to retrospectively account for measurement-period adjustments as part of a businesscombination and in turn recognize them in the period in which the adjustment was determined. ASU2015-16 is effective for interim and annual periods beginning after December 15, 2016, with earlyadoption permitted. The Company is currently in the process of evaluating the impact of adoption ofthe ASU on its condensed consolidated financial statements, but does not expect the impact to bematerial.
In February 2016, the FASB issued ASU No. 2016-02 “Leases (Topic 842).” ASU 2016-02establishes a right of use model that requires a lessee to record a right of use asset and a lease liabilityfor all leases with terms longer than 12 months. Leases will be classified as either finance or operating,with classification affecting the pattern of expense recognition in the income statement. For lessors, theguidance modifies the classification criteria and the accounting for sales-type and direct financingleases. A lease will be treated as sale if it transfers all of the risks and rewards, as well as control of theunderlying asset, to the lessee. If risks and rewards are conveyed without the transfer of control, thelease is treated as a financing. If the lessor doesn’t convey risks and rewards or control, an operating
- II-120 -

APPENDIX II FINANCIAL INFORMATION OF THE TUMI GROUP
TUMI HOLDINGS, INC. AND SUBSIDIARIES
Notes to the Condensed Consolidated Financial Statements(unaudited)
lease results. The amendments are effective for fiscal years beginning after December 15, 2018,including interim periods within those fiscal years for public business entities. Entities are required touse a modified retrospective approach for leases that exist or are entered into after the beginning of theearliest comparative period in the financial statements, with certain practical expedients available.Early adoption is permitted. The Company is currently in the process of evaluating the impact of ASU2016-02 on its condensed consolidated financial statements.
In March 2016, the FASB issued ASU No. 2016-09, “Compensation—Stock Compensation(Topic 718)—Improvements to Employee Share-Based Payment Accounting.” ASU 2016-09 requiresall income tax effects of awards to be recognized in the income statement when the awards vest or aresettled. It also allows an employer to repurchase more of an employee’s shares than it can today for taxwithholding purposes without triggering liability accounting and to make a policy election forforfeitures as they occur. ASU 2016-09 is effective for fiscal years beginning after December 15, 2016,and interim periods within those years, with early adoption is permitted. The Company is currently inthe process of evaluating the impact of adoption of the ASU on its condensed consolidated financialstatements, but does not expect the impact to be material.
3. STOCKHOLDERS’ EQUITY
Activity for the three months ended March 27, 2016 in the accounts of Stockholders’ Equity issummarized below:
Common Stock
SharesPar
Value
AdditionalPaid-inCapital
TreasuryStock
RetainedEarnings
AccumulatedOther
ComprehensiveLoss Total
(In thousands, except share data)
Balance as of January 1, 2016 . . . . . 68,158,428 $681 $317,140 $(13,338) $182,747 $(6,384) $480,846Net income . . . . . . . . . . . . . . . . . . . . . — — — — 7,903 — 7,903Share-based compensation . . . . . . . . . — — 1,322 — — — 1,322Stock options exercised . . . . . . . . . . . 221,610 3 4,737 — — — 4,740Service-based shares issued . . . . . . . . 19,417 — — — — — —Repurchase of common stock . . . . . . . — — — (53) — — (53)Foreign currency translation
adjustment, net of tax . . . . . . . . . . . — — — — — 1,155 1,155
Balance as of March 27, 2016 . . . . . 68,399,455 $684 $323,199 $(13,391) $190,650 $(5,229) $495,913
As of March 27, 2016 and December 31, 2015, the Company held 765,686 and 763,672 sharesof common stock in treasury, respectively. During the first quarter of 2016, 2,014 shares of commonstock were withheld by the Company in satisfaction of withholding taxes in connection with thevesting of awards under the Company’s 2012 Long-Term Incentive Plan. Shares withheld insatisfaction of tax obligations are accounted for as treasury stock at cost.
- II-121 -
APPENDIX II FINANCIAL INFORMATION OF THE TUMI GROUP
TUMI HOLDINGS, INC. AND SUBSIDIARIES
Notes to the Condensed Consolidated Financial Statements(unaudited)
Share Repurchase Program
On November 4, 2015, the Company announced that its Board of Directors authorized therepurchase of up to $150 million of the Company’s common stock over the next twelve months. Underthe program, the Company may purchase its shares from time to time in the open market or in privatelynegotiated transactions. The Company expects that purchases will be funded through existing cash onhand, cash from operations, borrowings or a combination of the foregoing. The amount and timing ofthe purchases will depend on a number of factors including the price and availability of the Company’sshares, trading volume and general market conditions. Repurchases in the future may also be madeunder a Rule 10b5-1 plan, which would permit shares to be repurchased when the Company mightotherwise be precluded from doing so under insider trading laws. The share repurchase program maybe suspended or discontinued at any time.
There were no repurchases made during the first quarter of 2016. As of March 27, 2016, theremaining availability under the Company’s share repurchase program was approximately$141,546,000. All repurchased shares of common stock have been accounted for as treasury stock atcost.
As part of the Merger Agreement with Samsonite, the Company agreed that during theexecutory period beginning on March 3, 2016, the date of the Merger Agreement, and ending on theearlier of the termination of the Merger Agreement, per its terms, and the effective time of the merger,it would not repurchase any shares of its capital stock.
4. INVENTORIES, NET
Inventories, net consist of the following:
March 27,2016
December 31,2015
(In thousands)
Raw materials . . . . . . . . . . . . . . . . . . . . . . . . . . . . . . . . . . . . . . . . . . . . . . . . . . . . . . . . . . $ 193 $ 246Finished goods . . . . . . . . . . . . . . . . . . . . . . . . . . . . . . . . . . . . . . . . . . . . . . . . . . . . . . . . . . 113,411 99,442
Total inventories, net . . . . . . . . . . . . . . . . . . . . . . . . . . . . . . . . . . . . . . . . . . . . . . . . . $113,604 $99,688
- II-122 -
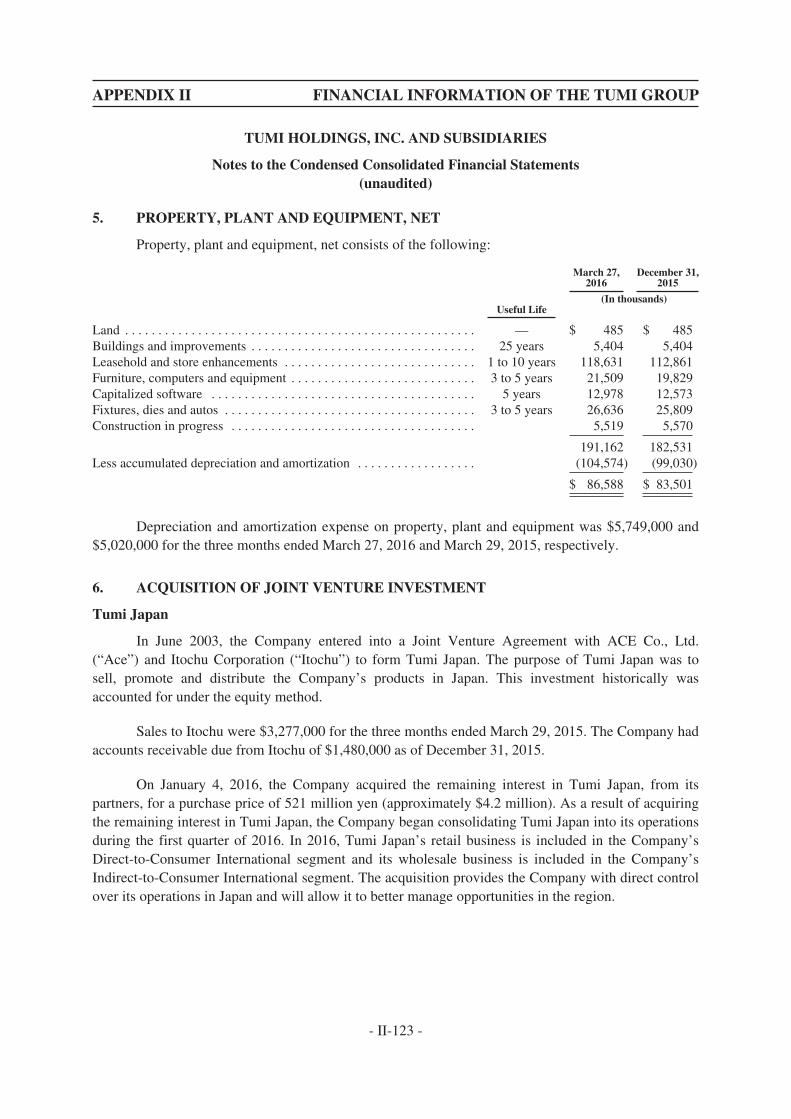
APPENDIX II FINANCIAL INFORMATION OF THE TUMI GROUP
TUMI HOLDINGS, INC. AND SUBSIDIARIES
Notes to the Condensed Consolidated Financial Statements(unaudited)
5. PROPERTY, PLANT AND EQUIPMENT, NET
Property, plant and equipment, net consists of the following:
March 27,2016
December 31,2015
(In thousands)Useful Life
Land . . . . . . . . . . . . . . . . . . . . . . . . . . . . . . . . . . . . . . . . . . . . . . . . . . . . . — $ 485 $ 485Buildings and improvements . . . . . . . . . . . . . . . . . . . . . . . . . . . . . . . . . . 25 years 5,404 5,404Leasehold and store enhancements . . . . . . . . . . . . . . . . . . . . . . . . . . . . . 1 to 10 years 118,631 112,861Furniture, computers and equipment . . . . . . . . . . . . . . . . . . . . . . . . . . . . 3 to 5 years 21,509 19,829Capitalized software . . . . . . . . . . . . . . . . . . . . . . . . . . . . . . . . . . . . . . . . 5 years 12,978 12,573Fixtures, dies and autos . . . . . . . . . . . . . . . . . . . . . . . . . . . . . . . . . . . . . . 3 to 5 years 26,636 25,809Construction in progress . . . . . . . . . . . . . . . . . . . . . . . . . . . . . . . . . . . . . 5,519 5,570
191,162 182,531Less accumulated depreciation and amortization . . . . . . . . . . . . . . . . . . (104,574) (99,030)
$ 86,588 $ 83,501
Depreciation and amortization expense on property, plant and equipment was $5,749,000 and$5,020,000 for the three months ended March 27, 2016 and March 29, 2015, respectively.
6. ACQUISITION OF JOINT VENTURE INVESTMENT
Tumi Japan
In June 2003, the Company entered into a Joint Venture Agreement with ACE Co., Ltd.(“Ace”) and Itochu Corporation (“Itochu”) to form Tumi Japan. The purpose of Tumi Japan was tosell, promote and distribute the Company’s products in Japan. This investment historically wasaccounted for under the equity method.
Sales to Itochu were $3,277,000 for the three months ended March 29, 2015. The Company hadaccounts receivable due from Itochu of $1,480,000 as of December 31, 2015.
On January 4, 2016, the Company acquired the remaining interest in Tumi Japan, from itspartners, for a purchase price of 521 million yen (approximately $4.2 million). As a result of acquiringthe remaining interest in Tumi Japan, the Company began consolidating Tumi Japan into its operationsduring the first quarter of 2016. In 2016, Tumi Japan’s retail business is included in the Company’sDirect-to-Consumer International segment and its wholesale business is included in the Company’sIndirect-to-Consumer International segment. The acquisition provides the Company with direct controlover its operations in Japan and will allow it to better manage opportunities in the region.
- II-123 -
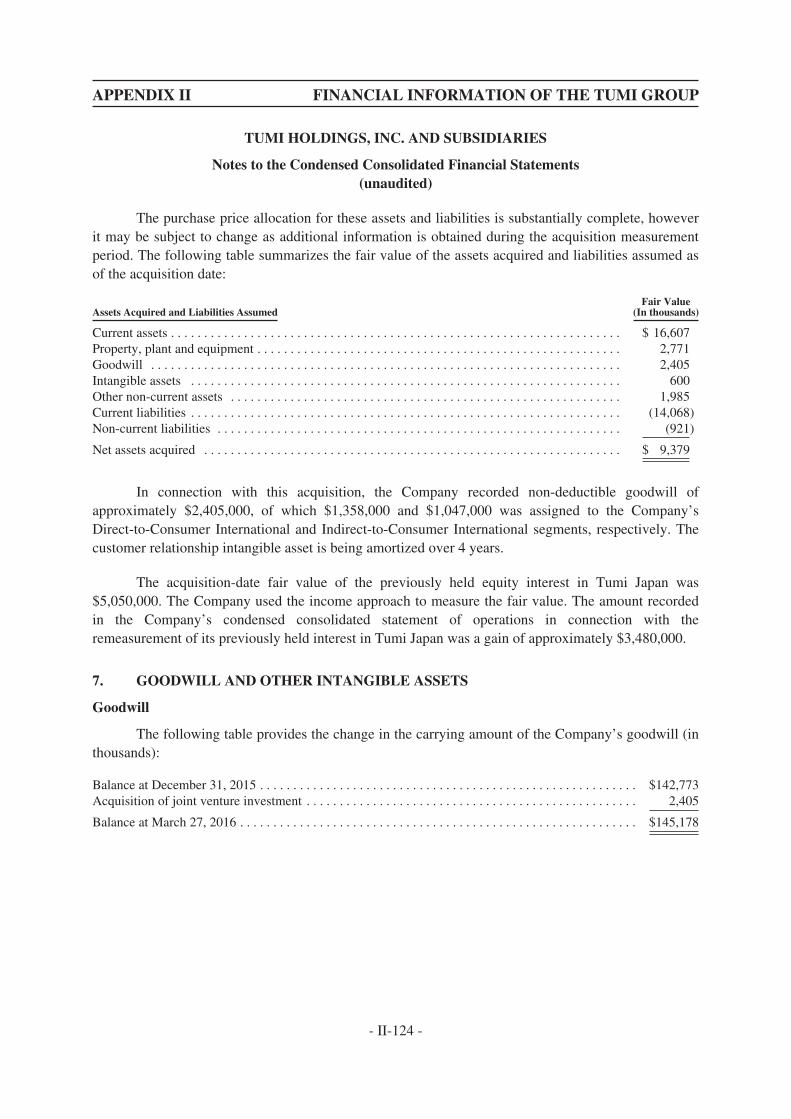
APPENDIX II FINANCIAL INFORMATION OF THE TUMI GROUP
TUMI HOLDINGS, INC. AND SUBSIDIARIES
Notes to the Condensed Consolidated Financial Statements(unaudited)
The purchase price allocation for these assets and liabilities is substantially complete, howeverit may be subject to change as additional information is obtained during the acquisition measurementperiod. The following table summarizes the fair value of the assets acquired and liabilities assumed asof the acquisition date:
Fair ValueAssets Acquired and Liabilities Assumed (In thousands)
Current assets . . . . . . . . . . . . . . . . . . . . . . . . . . . . . . . . . . . . . . . . . . . . . . . . . . . . . . . . . . . . . . . . . . . . $ 16,607Property, plant and equipment . . . . . . . . . . . . . . . . . . . . . . . . . . . . . . . . . . . . . . . . . . . . . . . . . . . . . . . 2,771Goodwill . . . . . . . . . . . . . . . . . . . . . . . . . . . . . . . . . . . . . . . . . . . . . . . . . . . . . . . . . . . . . . . . . . . . . . . 2,405Intangible assets . . . . . . . . . . . . . . . . . . . . . . . . . . . . . . . . . . . . . . . . . . . . . . . . . . . . . . . . . . . . . . . . . 600Other non-current assets . . . . . . . . . . . . . . . . . . . . . . . . . . . . . . . . . . . . . . . . . . . . . . . . . . . . . . . . . . . 1,985Current liabilities . . . . . . . . . . . . . . . . . . . . . . . . . . . . . . . . . . . . . . . . . . . . . . . . . . . . . . . . . . . . . . . . . (14,068)Non-current liabilities . . . . . . . . . . . . . . . . . . . . . . . . . . . . . . . . . . . . . . . . . . . . . . . . . . . . . . . . . . . . . (921)
Net assets acquired . . . . . . . . . . . . . . . . . . . . . . . . . . . . . . . . . . . . . . . . . . . . . . . . . . . . . . . . . . . . . . . $ 9,379
In connection with this acquisition, the Company recorded non-deductible goodwill ofapproximately $2,405,000, of which $1,358,000 and $1,047,000 was assigned to the Company’sDirect-to-Consumer International and Indirect-to-Consumer International segments, respectively. Thecustomer relationship intangible asset is being amortized over 4 years.
The acquisition-date fair value of the previously held equity interest in Tumi Japan was$5,050,000. The Company used the income approach to measure the fair value. The amount recordedin the Company’s condensed consolidated statement of operations in connection with theremeasurement of its previously held interest in Tumi Japan was a gain of approximately $3,480,000.
7. GOODWILL AND OTHER INTANGIBLE ASSETS
Goodwill
The following table provides the change in the carrying amount of the Company’s goodwill (inthousands):
Balance at December 31, 2015 . . . . . . . . . . . . . . . . . . . . . . . . . . . . . . . . . . . . . . . . . . . . . . . . . . . . . . . . . $142,773Acquisition of joint venture investment . . . . . . . . . . . . . . . . . . . . . . . . . . . . . . . . . . . . . . . . . . . . . . . . . . 2,405
Balance at March 27, 2016 . . . . . . . . . . . . . . . . . . . . . . . . . . . . . . . . . . . . . . . . . . . . . . . . . . . . . . . . . . . . $145,178
- II-124 -

APPENDIX II FINANCIAL INFORMATION OF THE TUMI GROUP
TUMI HOLDINGS, INC. AND SUBSIDIARIES
Notes to the Condensed Consolidated Financial Statements(unaudited)
Other Intangible Assets
The following table provides the gross carrying value and accumulated amortization for eachmajor class of intangible asset:
March 27, 2016 December 31, 2015
Gross CarryingAmount
AccumulatedAmortization
Net CarryingAmount
Gross CarryingAmount
AccumulatedAmortization
Net CarryingAmount
(In thousands) (In thousands)
Amortized intangible assets:
Customerrelationships . . . . . . . $ 1,700 $(1,137) $ 563 $ 1,100 $(1,100) $ —
Lease value . . . . . . . . . 1,359 (1,359) — 1,359 (1,359) —
Total . . . . . . . . . . . . . . . . . . . . . . . $ 3,059 $(2,496) $ 563 $ 2,459 $(2,459) $ —
Unamortized intangible assets:
Brand/trade name . . . . . . . . . $130,400 $ — $130,400 $130,400 $ — $130,400
Total intangible assets . . . . . . . . . $133,459 $(2,496) 130,963 $132,859 (2,459) 130,400
Amortization expense was $37,000 and $14,000 for the three months ended March 27, 2016and March 29, 2015, respectively.
8. ACCRUED WARRANTIES
The Company provides its customers with a product warranty subsequent to the sale of itsproducts. Our warranty policy provides for one year of worry-free service as well as an additionalwarranty against manufacturers’ defects or flaws in construction for between two and five years,depending on the product line. The Company recognizes estimated costs associated with the limitedwarranty at the time of sale of its products. The warranty reserve, which is included in accrued expenses,is based on historical experience. The activity in the warranty reserve account was as follows:
Three Months Ended
March 27, 2016 March 29, 2015
(In thousands)
Liability, beginning of period . . . . . . . . . . . . . . . . . . . . . . . . . . . . . . . . . . . . . . . . . . $ 9,001 $ 8,033Provision for warranties . . . . . . . . . . . . . . . . . . . . . . . . . . . . . . . . . . . . . . . . . . . . . . 1,003 1,707Warranty claims . . . . . . . . . . . . . . . . . . . . . . . . . . . . . . . . . . . . . . . . . . . . . . . . . . . . (1,362) (1,593)
Liability, end of period . . . . . . . . . . . . . . . . . . . . . . . . . . . . . . . . . . . . . . . . . . . . . . . $ 8,642 $ 8,147
9. DEBT OBLIGATIONS
Amended Credit Facility
The Amended Credit Facility consolidated the term loan facility and the revolving creditfacility previously provided in the Company’s former credit facility into a single $70,000,000 seniorsecured revolving credit facility, with Wells Fargo as the sole lender, and extended the maturity of thefacility until April 4, 2017. The Amended Credit Facility includes a letter of credit sublimit of$5,000,000.
- II-125 -
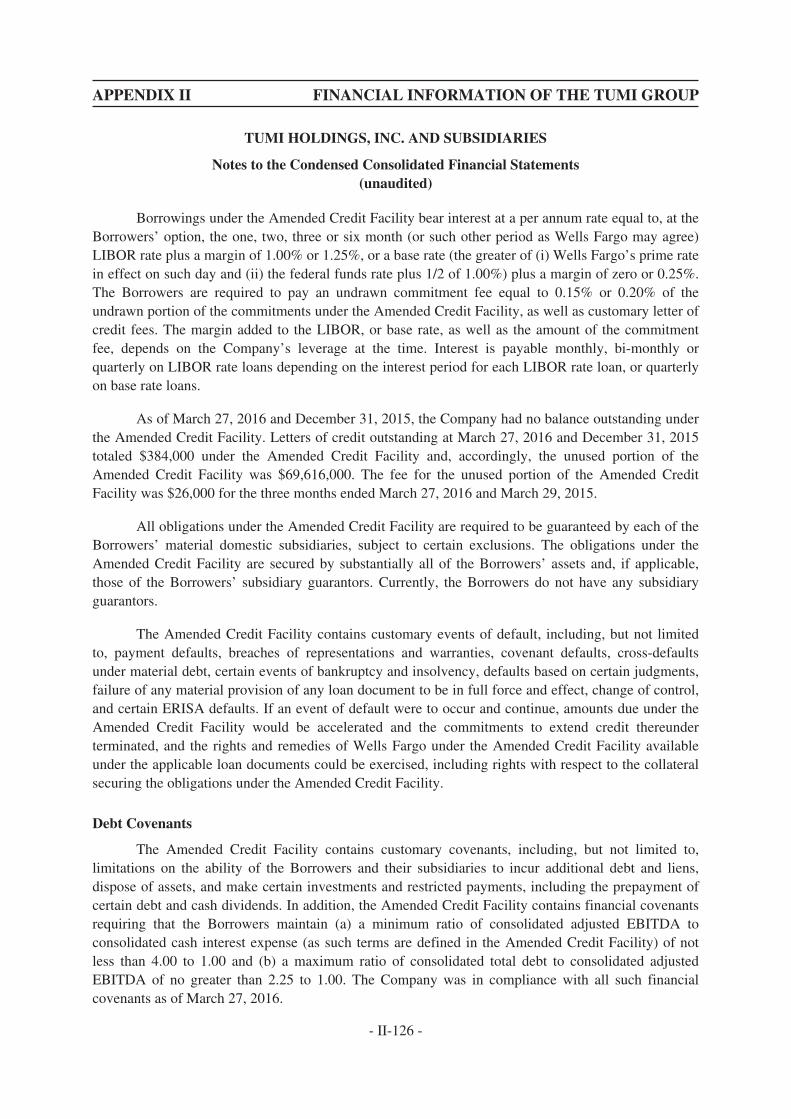
APPENDIX II FINANCIAL INFORMATION OF THE TUMI GROUP
TUMI HOLDINGS, INC. AND SUBSIDIARIES
Notes to the Condensed Consolidated Financial Statements(unaudited)
Borrowings under the Amended Credit Facility bear interest at a per annum rate equal to, at theBorrowers’ option, the one, two, three or six month (or such other period as Wells Fargo may agree)LIBOR rate plus a margin of 1.00% or 1.25%, or a base rate (the greater of (i) Wells Fargo’s prime ratein effect on such day and (ii) the federal funds rate plus 1/2 of 1.00%) plus a margin of zero or 0.25%.The Borrowers are required to pay an undrawn commitment fee equal to 0.15% or 0.20% of theundrawn portion of the commitments under the Amended Credit Facility, as well as customary letter ofcredit fees. The margin added to the LIBOR, or base rate, as well as the amount of the commitmentfee, depends on the Company’s leverage at the time. Interest is payable monthly, bi-monthly orquarterly on LIBOR rate loans depending on the interest period for each LIBOR rate loan, or quarterlyon base rate loans.
As of March 27, 2016 and December 31, 2015, the Company had no balance outstanding underthe Amended Credit Facility. Letters of credit outstanding at March 27, 2016 and December 31, 2015totaled $384,000 under the Amended Credit Facility and, accordingly, the unused portion of theAmended Credit Facility was $69,616,000. The fee for the unused portion of the Amended CreditFacility was $26,000 for the three months ended March 27, 2016 and March 29, 2015.
All obligations under the Amended Credit Facility are required to be guaranteed by each of theBorrowers’ material domestic subsidiaries, subject to certain exclusions. The obligations under theAmended Credit Facility are secured by substantially all of the Borrowers’ assets and, if applicable,those of the Borrowers’ subsidiary guarantors. Currently, the Borrowers do not have any subsidiaryguarantors.
The Amended Credit Facility contains customary events of default, including, but not limitedto, payment defaults, breaches of representations and warranties, covenant defaults, cross-defaultsunder material debt, certain events of bankruptcy and insolvency, defaults based on certain judgments,failure of any material provision of any loan document to be in full force and effect, change of control,and certain ERISA defaults. If an event of default were to occur and continue, amounts due under theAmended Credit Facility would be accelerated and the commitments to extend credit thereunderterminated, and the rights and remedies of Wells Fargo under the Amended Credit Facility availableunder the applicable loan documents could be exercised, including rights with respect to the collateralsecuring the obligations under the Amended Credit Facility.
Debt Covenants
The Amended Credit Facility contains customary covenants, including, but not limited to,limitations on the ability of the Borrowers and their subsidiaries to incur additional debt and liens,dispose of assets, and make certain investments and restricted payments, including the prepayment ofcertain debt and cash dividends. In addition, the Amended Credit Facility contains financial covenantsrequiring that the Borrowers maintain (a) a minimum ratio of consolidated adjusted EBITDA toconsolidated cash interest expense (as such terms are defined in the Amended Credit Facility) of notless than 4.00 to 1.00 and (b) a maximum ratio of consolidated total debt to consolidated adjustedEBITDA of no greater than 2.25 to 1.00. The Company was in compliance with all such financialcovenants as of March 27, 2016.
- II-126 -
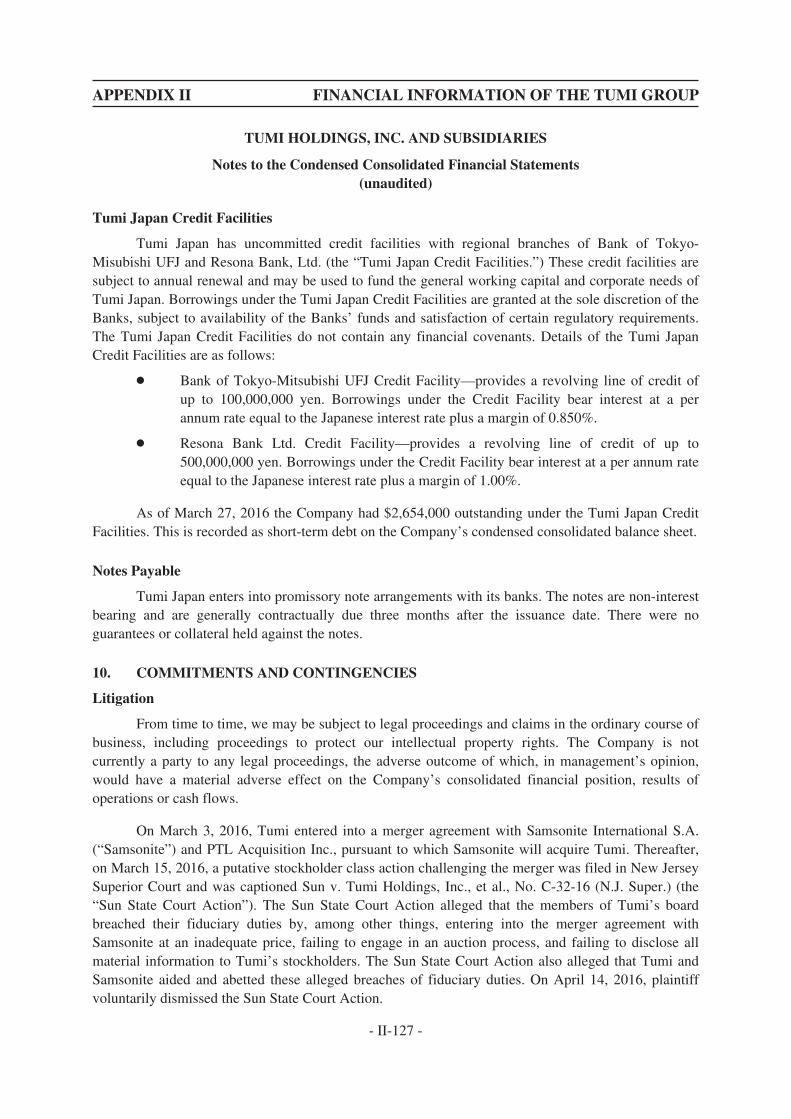
APPENDIX II FINANCIAL INFORMATION OF THE TUMI GROUP
TUMI HOLDINGS, INC. AND SUBSIDIARIES
Notes to the Condensed Consolidated Financial Statements(unaudited)
Tumi Japan Credit Facilities
Tumi Japan has uncommitted credit facilities with regional branches of Bank of Tokyo-Misubishi UFJ and Resona Bank, Ltd. (the “Tumi Japan Credit Facilities.”) These credit facilities aresubject to annual renewal and may be used to fund the general working capital and corporate needs ofTumi Japan. Borrowings under the Tumi Japan Credit Facilities are granted at the sole discretion of theBanks, subject to availability of the Banks’ funds and satisfaction of certain regulatory requirements.The Tumi Japan Credit Facilities do not contain any financial covenants. Details of the Tumi JapanCredit Facilities are as follows:
Š Bank of Tokyo-Mitsubishi UFJ Credit Facility—provides a revolving line of credit ofup to 100,000,000 yen. Borrowings under the Credit Facility bear interest at a perannum rate equal to the Japanese interest rate plus a margin of 0.850%.
Š Resona Bank Ltd. Credit Facility—provides a revolving line of credit of up to500,000,000 yen. Borrowings under the Credit Facility bear interest at a per annum rateequal to the Japanese interest rate plus a margin of 1.00%.
As of March 27, 2016 the Company had $2,654,000 outstanding under the Tumi Japan CreditFacilities. This is recorded as short-term debt on the Company’s condensed consolidated balance sheet.
Notes Payable
Tumi Japan enters into promissory note arrangements with its banks. The notes are non-interestbearing and are generally contractually due three months after the issuance date. There were noguarantees or collateral held against the notes.
10. COMMITMENTS AND CONTINGENCIES
Litigation
From time to time, we may be subject to legal proceedings and claims in the ordinary course ofbusiness, including proceedings to protect our intellectual property rights. The Company is notcurrently a party to any legal proceedings, the adverse outcome of which, in management’s opinion,would have a material adverse effect on the Company’s consolidated financial position, results ofoperations or cash flows.
On March 3, 2016, Tumi entered into a merger agreement with Samsonite International S.A.(“Samsonite”) and PTL Acquisition Inc., pursuant to which Samsonite will acquire Tumi. Thereafter,on March 15, 2016, a putative stockholder class action challenging the merger was filed in New JerseySuperior Court and was captioned Sun v. Tumi Holdings, Inc., et al., No. C-32-16 (N.J. Super.) (the“Sun State Court Action”). The Sun State Court Action alleged that the members of Tumi’s boardbreached their fiduciary duties by, among other things, entering into the merger agreement withSamsonite at an inadequate price, failing to engage in an auction process, and failing to disclose allmaterial information to Tumi’s stockholders. The Sun State Court Action also alleged that Tumi andSamsonite aided and abetted these alleged breaches of fiduciary duties. On April 14, 2016, plaintiffvoluntarily dismissed the Sun State Court Action.
- II-127 -
APPENDIX II FINANCIAL INFORMATION OF THE TUMI GROUP
TUMI HOLDINGS, INC. AND SUBSIDIARIES
Notes to the Condensed Consolidated Financial Statements(unaudited)
On April 19, 2016, the same plaintiff who filed the Sun State Court Action, filed an action inthe District of New Jersey, captioned Sun v. Tumi Holdings, Inc., et al., No. 2:16-cv-02184-JMV-JBC(D. NJ.) (the “Sun Federal Court Action”). The Sun Federal Court Action makes only disclosureclaims, alleging an individual claim for violation of Section 14(a) of the Securities Exchange Act of1934, as amended to date (“1934 Act”) against Tumi and the members of its board, as well as anindividual claim for violation of Section 20(a) of the 1934 Act against Samsonite and the members ofTumi’s board. Tumi and the board believes these claims are wholly without merit.
Leases
The Company leases certain office, distribution and retail facilities. The lease agreements,which expire at various dates through 2028, are subject, in some cases, to renewal options and providefor the payment of taxes, insurance and maintenance. Certain leases contain escalation clausesresulting from the pass-through of increases in operating costs, property taxes and the effect on costsfrom changes in consumer price indices. Certain rentals are also contingent upon factors such as sales.Rent-free periods and scheduled rent increases are recorded as components of rent expense on astraight-line basis over the related terms of such leases. Contingent rentals are recognized when theachievement of the target (i.e., sales levels) which triggers the related payment is considered probable.Such expenses were not material for the three months ended March 27, 2016 and March 29, 2015,respectively.
11. INCOME TAXES
Income tax expense has been recognized based on the Company’s estimated annual effectivetax rate, which is based upon the tax rate expected for the full calendar year applied to the pre-taxincome of the interim period, as well as for the impact of discrete events that have taken place duringthe current reporting period. The Company’s consolidated effective tax rate was 26.6% and 35.0% forthe three months ended March 27, 2016 and March 29, 2015, respectively. The decrease in theeffective tax rate is primarily related to the benefit from the pre-tax gain on the existing joint ventureinvestment recorded in connection with the Tumi Japan acquisition, which is non-taxable. The benefitof approximately $1.0 million has been accounted for as a discrete item in the Company’s taxprovision for the first quarter of 2016.
- II-128 -
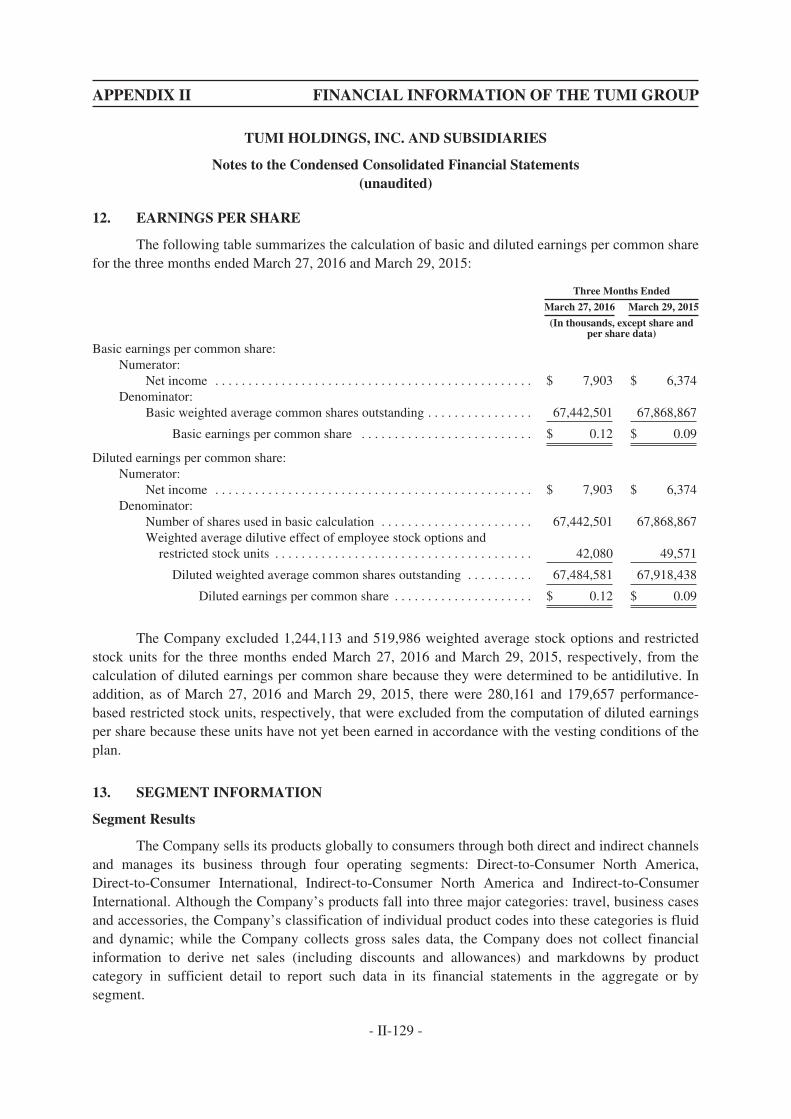
APPENDIX II FINANCIAL INFORMATION OF THE TUMI GROUP
TUMI HOLDINGS, INC. AND SUBSIDIARIES
Notes to the Condensed Consolidated Financial Statements(unaudited)
12. EARNINGS PER SHARE
The following table summarizes the calculation of basic and diluted earnings per common sharefor the three months ended March 27, 2016 and March 29, 2015:
Three Months Ended
March 27, 2016 March 29, 2015
(In thousands, except share andper share data)
Basic earnings per common share:Numerator:
Net income . . . . . . . . . . . . . . . . . . . . . . . . . . . . . . . . . . . . . . . . . . . . . . . . $ 7,903 $ 6,374Denominator:
Basic weighted average common shares outstanding . . . . . . . . . . . . . . . . 67,442,501 67,868,867
Basic earnings per common share . . . . . . . . . . . . . . . . . . . . . . . . . . $ 0.12 $ 0.09
Diluted earnings per common share:Numerator:
Net income . . . . . . . . . . . . . . . . . . . . . . . . . . . . . . . . . . . . . . . . . . . . . . . . $ 7,903 $ 6,374Denominator:
Number of shares used in basic calculation . . . . . . . . . . . . . . . . . . . . . . . 67,442,501 67,868,867Weighted average dilutive effect of employee stock options and
restricted stock units . . . . . . . . . . . . . . . . . . . . . . . . . . . . . . . . . . . . . . . 42,080 49,571
Diluted weighted average common shares outstanding . . . . . . . . . . 67,484,581 67,918,438
Diluted earnings per common share . . . . . . . . . . . . . . . . . . . . . $ 0.12 $ 0.09
The Company excluded 1,244,113 and 519,986 weighted average stock options and restrictedstock units for the three months ended March 27, 2016 and March 29, 2015, respectively, from thecalculation of diluted earnings per common share because they were determined to be antidilutive. Inaddition, as of March 27, 2016 and March 29, 2015, there were 280,161 and 179,657 performance-based restricted stock units, respectively, that were excluded from the computation of diluted earningsper share because these units have not yet been earned in accordance with the vesting conditions of theplan.
13. SEGMENT INFORMATION
Segment Results
The Company sells its products globally to consumers through both direct and indirect channelsand manages its business through four operating segments: Direct-to-Consumer North America,Direct-to-Consumer International, Indirect-to-Consumer North America and Indirect-to-ConsumerInternational. Although the Company’s products fall into three major categories: travel, business casesand accessories, the Company’s classification of individual product codes into these categories is fluidand dynamic; while the Company collects gross sales data, the Company does not collect financialinformation to derive net sales (including discounts and allowances) and markdowns by productcategory in sufficient detail to report such data in its financial statements in the aggregate or bysegment.
- II-129 -
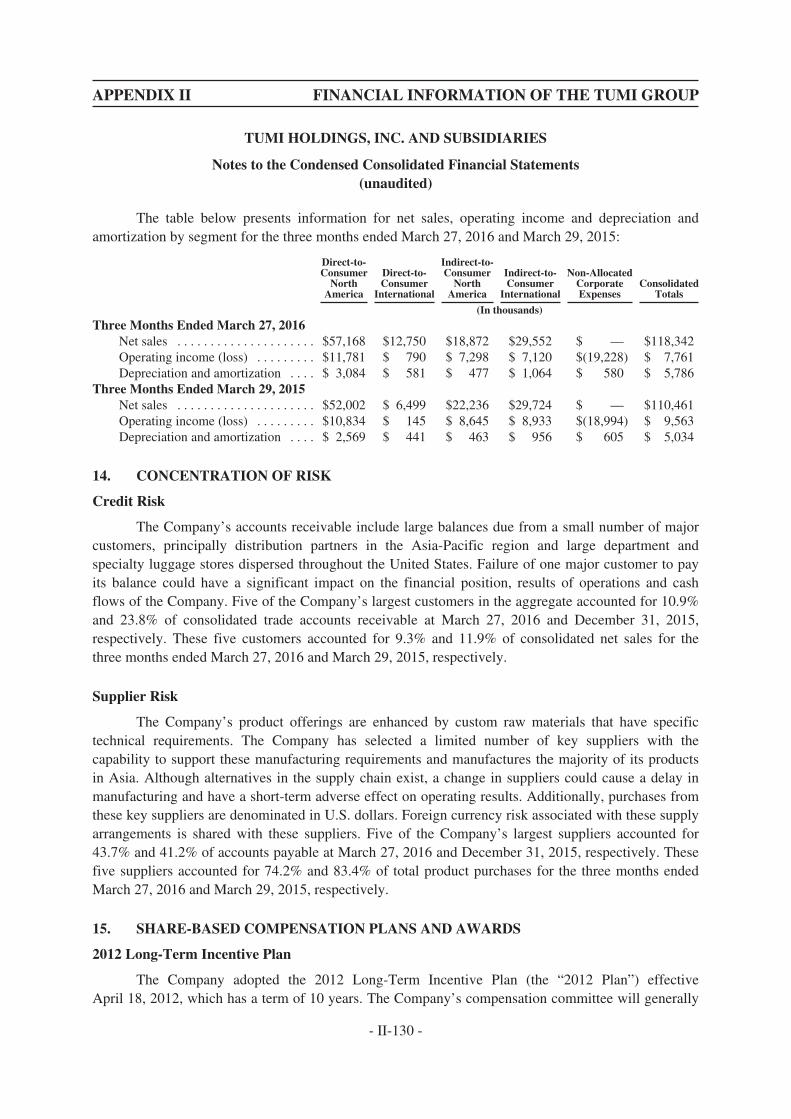
APPENDIX II FINANCIAL INFORMATION OF THE TUMI GROUP
TUMI HOLDINGS, INC. AND SUBSIDIARIES
Notes to the Condensed Consolidated Financial Statements(unaudited)
The table below presents information for net sales, operating income and depreciation andamortization by segment for the three months ended March 27, 2016 and March 29, 2015:
Direct-to-Consumer
NorthAmerica
Direct-to-Consumer
International
Indirect-to-Consumer
NorthAmerica
Indirect-to-Consumer
International
Non-AllocatedCorporateExpenses
ConsolidatedTotals
(In thousands)
Three Months Ended March 27, 2016Net sales . . . . . . . . . . . . . . . . . . . . . $57,168 $12,750 $18,872 $29,552 $ — $118,342Operating income (loss) . . . . . . . . . $11,781 $ 790 $ 7,298 $ 7,120 $(19,228) $ 7,761Depreciation and amortization . . . . $ 3,084 $ 581 $ 477 $ 1,064 $ 580 $ 5,786
Three Months Ended March 29, 2015Net sales . . . . . . . . . . . . . . . . . . . . . $52,002 $ 6,499 $22,236 $29,724 $ — $110,461Operating income (loss) . . . . . . . . . $10,834 $ 145 $ 8,645 $ 8,933 $(18,994) $ 9,563Depreciation and amortization . . . . $ 2,569 $ 441 $ 463 $ 956 $ 605 $ 5,034
14. CONCENTRATION OF RISK
Credit Risk
The Company’s accounts receivable include large balances due from a small number of majorcustomers, principally distribution partners in the Asia-Pacific region and large department andspecialty luggage stores dispersed throughout the United States. Failure of one major customer to payits balance could have a significant impact on the financial position, results of operations and cashflows of the Company. Five of the Company’s largest customers in the aggregate accounted for 10.9%and 23.8% of consolidated trade accounts receivable at March 27, 2016 and December 31, 2015,respectively. These five customers accounted for 9.3% and 11.9% of consolidated net sales for thethree months ended March 27, 2016 and March 29, 2015, respectively.
Supplier Risk
The Company’s product offerings are enhanced by custom raw materials that have specifictechnical requirements. The Company has selected a limited number of key suppliers with thecapability to support these manufacturing requirements and manufactures the majority of its productsin Asia. Although alternatives in the supply chain exist, a change in suppliers could cause a delay inmanufacturing and have a short-term adverse effect on operating results. Additionally, purchases fromthese key suppliers are denominated in U.S. dollars. Foreign currency risk associated with these supplyarrangements is shared with these suppliers. Five of the Company’s largest suppliers accounted for43.7% and 41.2% of accounts payable at March 27, 2016 and December 31, 2015, respectively. Thesefive suppliers accounted for 74.2% and 83.4% of total product purchases for the three months endedMarch 27, 2016 and March 29, 2015, respectively.
15. SHARE-BASED COMPENSATION PLANS AND AWARDS
2012 Long-Term Incentive Plan
The Company adopted the 2012 Long-Term Incentive Plan (the “2012 Plan”) effectiveApril 18, 2012, which has a term of 10 years. The Company’s compensation committee will generally
- II-130 -
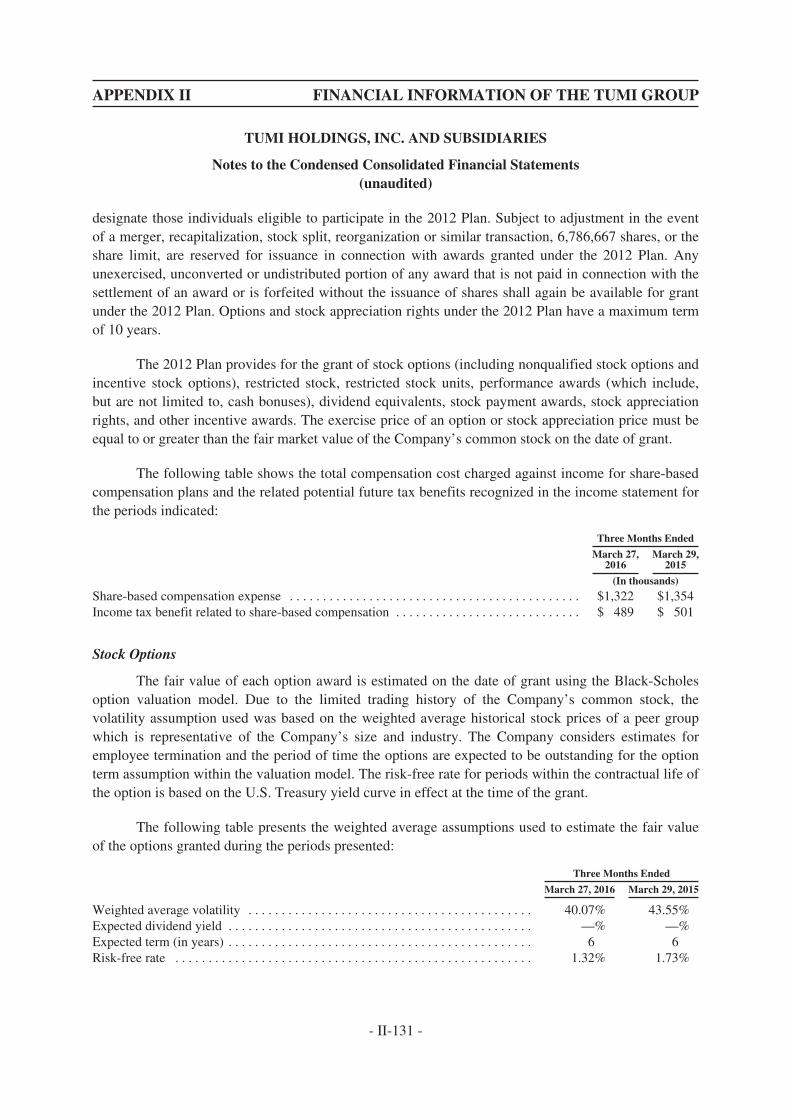
APPENDIX II FINANCIAL INFORMATION OF THE TUMI GROUP
TUMI HOLDINGS, INC. AND SUBSIDIARIES
Notes to the Condensed Consolidated Financial Statements(unaudited)
designate those individuals eligible to participate in the 2012 Plan. Subject to adjustment in the eventof a merger, recapitalization, stock split, reorganization or similar transaction, 6,786,667 shares, or theshare limit, are reserved for issuance in connection with awards granted under the 2012 Plan. Anyunexercised, unconverted or undistributed portion of any award that is not paid in connection with thesettlement of an award or is forfeited without the issuance of shares shall again be available for grantunder the 2012 Plan. Options and stock appreciation rights under the 2012 Plan have a maximum termof 10 years.
The 2012 Plan provides for the grant of stock options (including nonqualified stock options andincentive stock options), restricted stock, restricted stock units, performance awards (which include,but are not limited to, cash bonuses), dividend equivalents, stock payment awards, stock appreciationrights, and other incentive awards. The exercise price of an option or stock appreciation price must beequal to or greater than the fair market value of the Company’s common stock on the date of grant.
The following table shows the total compensation cost charged against income for share-basedcompensation plans and the related potential future tax benefits recognized in the income statement forthe periods indicated:
Three Months Ended
March 27,2016
March 29,2015
(In thousands)
Share-based compensation expense . . . . . . . . . . . . . . . . . . . . . . . . . . . . . . . . . . . . . . . . . . . . $1,322 $1,354Income tax benefit related to share-based compensation . . . . . . . . . . . . . . . . . . . . . . . . . . . . $ 489 $ 501
Stock Options
The fair value of each option award is estimated on the date of grant using the Black-Scholesoption valuation model. Due to the limited trading history of the Company’s common stock, thevolatility assumption used was based on the weighted average historical stock prices of a peer groupwhich is representative of the Company’s size and industry. The Company considers estimates foremployee termination and the period of time the options are expected to be outstanding for the optionterm assumption within the valuation model. The risk-free rate for periods within the contractual life ofthe option is based on the U.S. Treasury yield curve in effect at the time of the grant.
The following table presents the weighted average assumptions used to estimate the fair valueof the options granted during the periods presented:
Three Months Ended
March 27, 2016 March 29, 2015
Weighted average volatility . . . . . . . . . . . . . . . . . . . . . . . . . . . . . . . . . . . . . . . . . . . 40.07% 43.55%Expected dividend yield . . . . . . . . . . . . . . . . . . . . . . . . . . . . . . . . . . . . . . . . . . . . . . —% —%Expected term (in years) . . . . . . . . . . . . . . . . . . . . . . . . . . . . . . . . . . . . . . . . . . . . . . 6 6Risk-free rate . . . . . . . . . . . . . . . . . . . . . . . . . . . . . . . . . . . . . . . . . . . . . . . . . . . . . . 1.32% 1.73%
- II-131 -
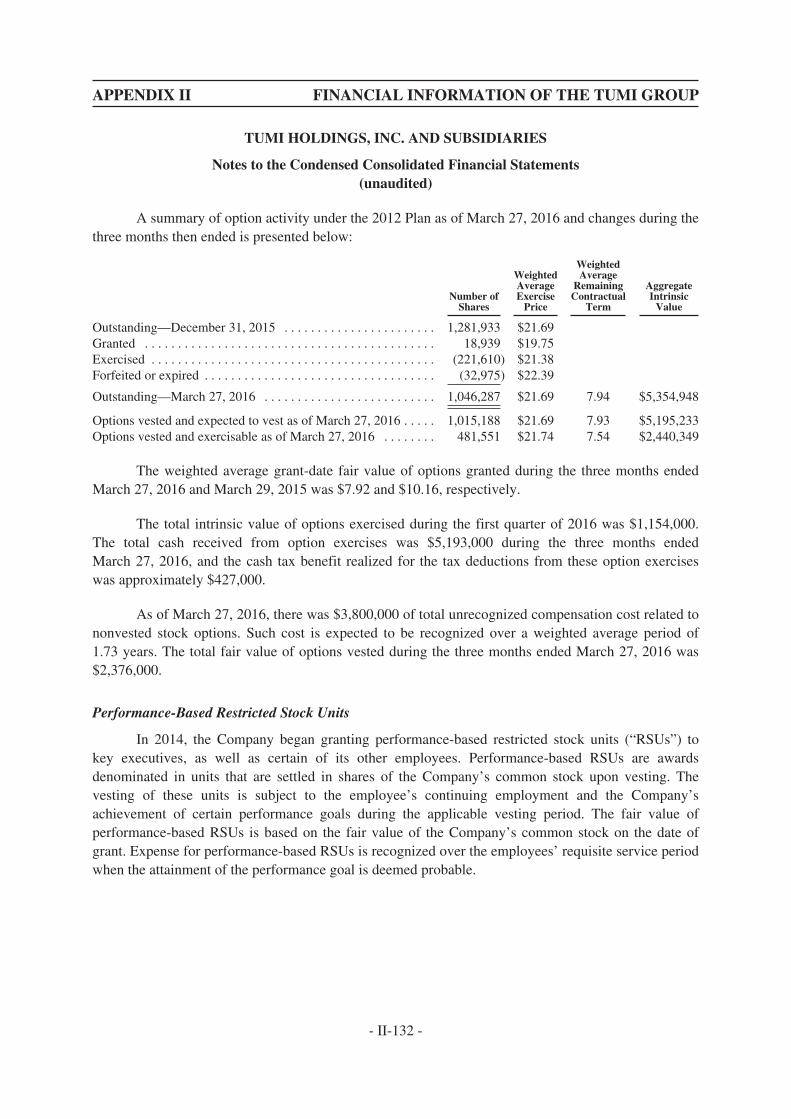
APPENDIX II FINANCIAL INFORMATION OF THE TUMI GROUP
TUMI HOLDINGS, INC. AND SUBSIDIARIES
Notes to the Condensed Consolidated Financial Statements(unaudited)
A summary of option activity under the 2012 Plan as of March 27, 2016 and changes during thethree months then ended is presented below:
Number ofShares
WeightedAverageExercise
Price
WeightedAverage
RemainingContractual
Term
AggregateIntrinsic
Value
Outstanding—December 31, 2015 . . . . . . . . . . . . . . . . . . . . . . . 1,281,933 $21.69Granted . . . . . . . . . . . . . . . . . . . . . . . . . . . . . . . . . . . . . . . . . . . . 18,939 $19.75Exercised . . . . . . . . . . . . . . . . . . . . . . . . . . . . . . . . . . . . . . . . . . . (221,610) $21.38Forfeited or expired . . . . . . . . . . . . . . . . . . . . . . . . . . . . . . . . . . . (32,975) $22.39
Outstanding—March 27, 2016 . . . . . . . . . . . . . . . . . . . . . . . . . . 1,046,287 $21.69 7.94 $5,354,948
Options vested and expected to vest as of March 27, 2016 . . . . . 1,015,188 $21.69 7.93 $5,195,233Options vested and exercisable as of March 27, 2016 . . . . . . . . 481,551 $21.74 7.54 $2,440,349
The weighted average grant-date fair value of options granted during the three months endedMarch 27, 2016 and March 29, 2015 was $7.92 and $10.16, respectively.
The total intrinsic value of options exercised during the first quarter of 2016 was $1,154,000.The total cash received from option exercises was $5,193,000 during the three months endedMarch 27, 2016, and the cash tax benefit realized for the tax deductions from these option exerciseswas approximately $427,000.
As of March 27, 2016, there was $3,800,000 of total unrecognized compensation cost related tononvested stock options. Such cost is expected to be recognized over a weighted average period of1.73 years. The total fair value of options vested during the three months ended March 27, 2016 was$2,376,000.
Performance-Based Restricted Stock Units
In 2014, the Company began granting performance-based restricted stock units (“RSUs”) tokey executives, as well as certain of its other employees. Performance-based RSUs are awardsdenominated in units that are settled in shares of the Company’s common stock upon vesting. Thevesting of these units is subject to the employee’s continuing employment and the Company’sachievement of certain performance goals during the applicable vesting period. The fair value ofperformance-based RSUs is based on the fair value of the Company’s common stock on the date ofgrant. Expense for performance-based RSUs is recognized over the employees’ requisite service periodwhen the attainment of the performance goal is deemed probable.
- II-132 -
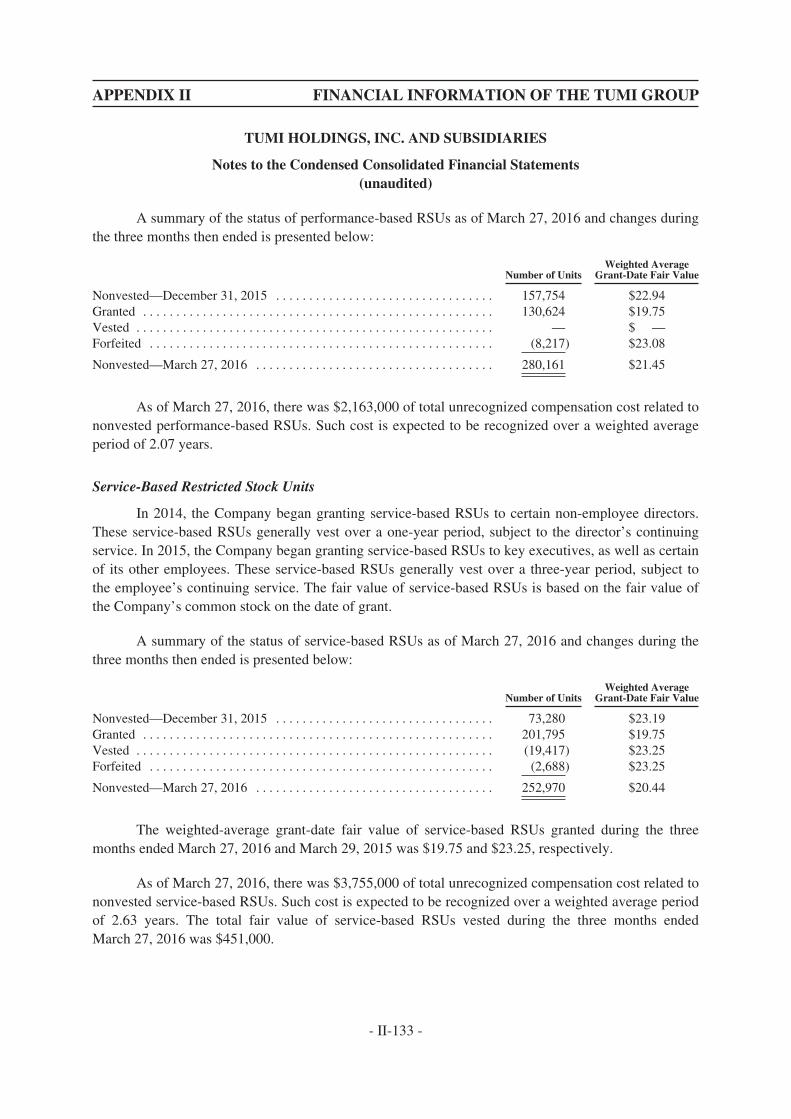
APPENDIX II FINANCIAL INFORMATION OF THE TUMI GROUP
TUMI HOLDINGS, INC. AND SUBSIDIARIES
Notes to the Condensed Consolidated Financial Statements(unaudited)
A summary of the status of performance-based RSUs as of March 27, 2016 and changes duringthe three months then ended is presented below:
Number of UnitsWeighted Average
Grant-Date Fair Value
Nonvested—December 31, 2015 . . . . . . . . . . . . . . . . . . . . . . . . . . . . . . . . . 157,754 $22.94Granted . . . . . . . . . . . . . . . . . . . . . . . . . . . . . . . . . . . . . . . . . . . . . . . . . . . . . 130,624 $19.75Vested . . . . . . . . . . . . . . . . . . . . . . . . . . . . . . . . . . . . . . . . . . . . . . . . . . . . . . — $ —Forfeited . . . . . . . . . . . . . . . . . . . . . . . . . . . . . . . . . . . . . . . . . . . . . . . . . . . . (8,217) $23.08
Nonvested—March 27, 2016 . . . . . . . . . . . . . . . . . . . . . . . . . . . . . . . . . . . . 280,161 $21.45
As of March 27, 2016, there was $2,163,000 of total unrecognized compensation cost related tononvested performance-based RSUs. Such cost is expected to be recognized over a weighted averageperiod of 2.07 years.
Service-Based Restricted Stock Units
In 2014, the Company began granting service-based RSUs to certain non-employee directors.These service-based RSUs generally vest over a one-year period, subject to the director’s continuingservice. In 2015, the Company began granting service-based RSUs to key executives, as well as certainof its other employees. These service-based RSUs generally vest over a three-year period, subject tothe employee’s continuing service. The fair value of service-based RSUs is based on the fair value ofthe Company’s common stock on the date of grant.
A summary of the status of service-based RSUs as of March 27, 2016 and changes during thethree months then ended is presented below:
Number of UnitsWeighted Average
Grant-Date Fair Value
Nonvested—December 31, 2015 . . . . . . . . . . . . . . . . . . . . . . . . . . . . . . . . . 73,280 $23.19Granted . . . . . . . . . . . . . . . . . . . . . . . . . . . . . . . . . . . . . . . . . . . . . . . . . . . . . 201,795 $19.75Vested . . . . . . . . . . . . . . . . . . . . . . . . . . . . . . . . . . . . . . . . . . . . . . . . . . . . . . (19,417) $23.25Forfeited . . . . . . . . . . . . . . . . . . . . . . . . . . . . . . . . . . . . . . . . . . . . . . . . . . . . (2,688) $23.25
Nonvested—March 27, 2016 . . . . . . . . . . . . . . . . . . . . . . . . . . . . . . . . . . . . 252,970 $20.44
The weighted-average grant-date fair value of service-based RSUs granted during the threemonths ended March 27, 2016 and March 29, 2015 was $19.75 and $23.25, respectively.
As of March 27, 2016, there was $3,755,000 of total unrecognized compensation cost related tononvested service-based RSUs. Such cost is expected to be recognized over a weighted average periodof 2.63 years. The total fair value of service-based RSUs vested during the three months endedMarch 27, 2016 was $451,000.
- II-133 -
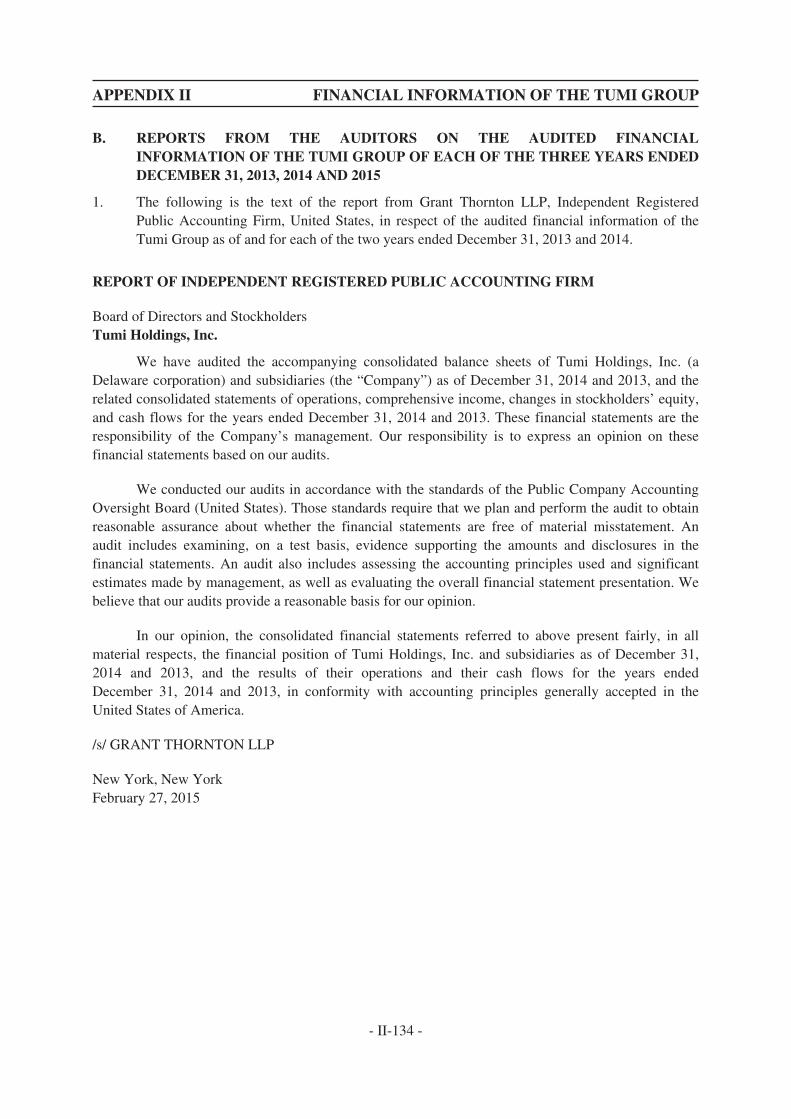
APPENDIX II FINANCIAL INFORMATION OF THE TUMI GROUP
B. REPORTS FROM THE AUDITORS ON THE AUDITED FINANCIALINFORMATION OF THE TUMI GROUP OF EACH OF THE THREE YEARS ENDEDDECEMBER 31, 2013, 2014 AND 2015
1. The following is the text of the report from Grant Thornton LLP, Independent RegisteredPublic Accounting Firm, United States, in respect of the audited financial information of theTumi Group as of and for each of the two years ended December 31, 2013 and 2014.
REPORT OF INDEPENDENT REGISTERED PUBLIC ACCOUNTING FIRM
Board of Directors and StockholdersTumi Holdings, Inc.
We have audited the accompanying consolidated balance sheets of Tumi Holdings, Inc. (aDelaware corporation) and subsidiaries (the “Company”) as of December 31, 2014 and 2013, and therelated consolidated statements of operations, comprehensive income, changes in stockholders’ equity,and cash flows for the years ended December 31, 2014 and 2013. These financial statements are theresponsibility of the Company’s management. Our responsibility is to express an opinion on thesefinancial statements based on our audits.
We conducted our audits in accordance with the standards of the Public Company AccountingOversight Board (United States). Those standards require that we plan and perform the audit to obtainreasonable assurance about whether the financial statements are free of material misstatement. Anaudit includes examining, on a test basis, evidence supporting the amounts and disclosures in thefinancial statements. An audit also includes assessing the accounting principles used and significantestimates made by management, as well as evaluating the overall financial statement presentation. Webelieve that our audits provide a reasonable basis for our opinion.
In our opinion, the consolidated financial statements referred to above present fairly, in allmaterial respects, the financial position of Tumi Holdings, Inc. and subsidiaries as of December 31,2014 and 2013, and the results of their operations and their cash flows for the years endedDecember 31, 2014 and 2013, in conformity with accounting principles generally accepted in theUnited States of America.
/s/ GRANT THORNTON LLP
New York, New YorkFebruary 27, 2015
- II-134 -
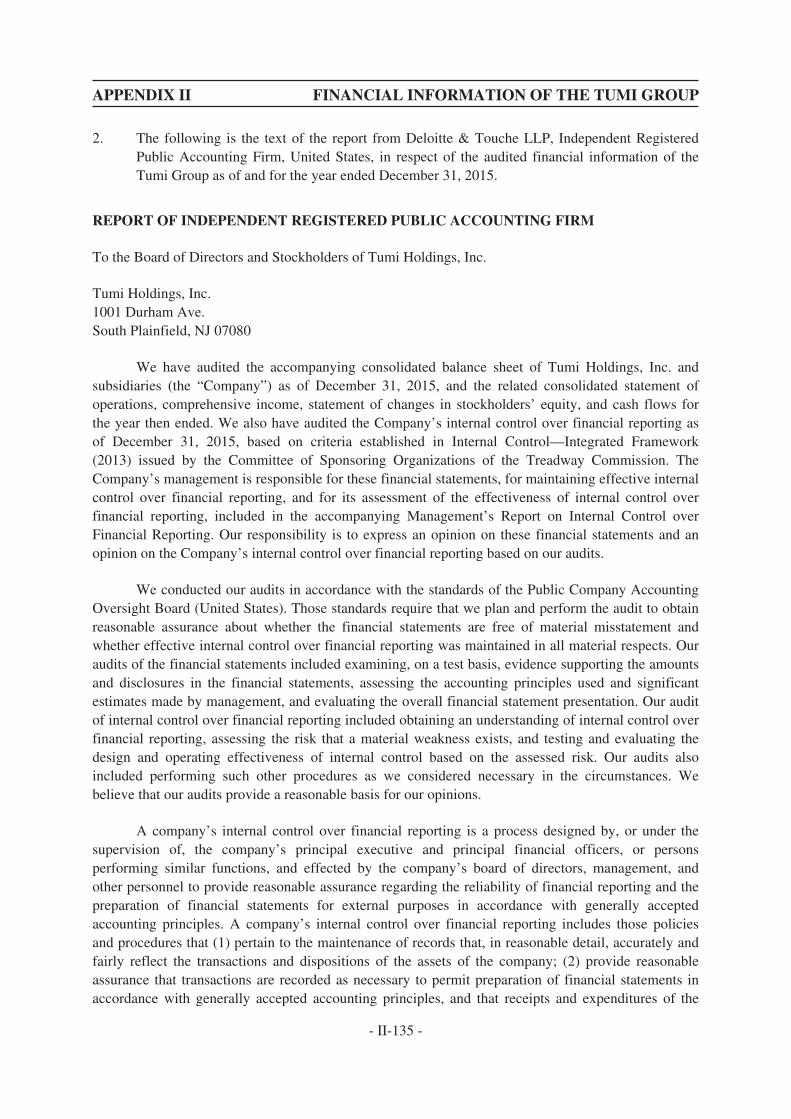
APPENDIX II FINANCIAL INFORMATION OF THE TUMI GROUP
2. The following is the text of the report from Deloitte & Touche LLP, Independent RegisteredPublic Accounting Firm, United States, in respect of the audited financial information of theTumi Group as of and for the year ended December 31, 2015.
REPORT OF INDEPENDENT REGISTERED PUBLIC ACCOUNTING FIRM
To the Board of Directors and Stockholders of Tumi Holdings, Inc.
Tumi Holdings, Inc.1001 Durham Ave.South Plainfield, NJ 07080
We have audited the accompanying consolidated balance sheet of Tumi Holdings, Inc. andsubsidiaries (the “Company”) as of December 31, 2015, and the related consolidated statement ofoperations, comprehensive income, statement of changes in stockholders’ equity, and cash flows forthe year then ended. We also have audited the Company’s internal control over financial reporting asof December 31, 2015, based on criteria established in Internal Control—Integrated Framework(2013) issued by the Committee of Sponsoring Organizations of the Treadway Commission. TheCompany’s management is responsible for these financial statements, for maintaining effective internalcontrol over financial reporting, and for its assessment of the effectiveness of internal control overfinancial reporting, included in the accompanying Management’s Report on Internal Control overFinancial Reporting. Our responsibility is to express an opinion on these financial statements and anopinion on the Company’s internal control over financial reporting based on our audits.
We conducted our audits in accordance with the standards of the Public Company AccountingOversight Board (United States). Those standards require that we plan and perform the audit to obtainreasonable assurance about whether the financial statements are free of material misstatement andwhether effective internal control over financial reporting was maintained in all material respects. Ouraudits of the financial statements included examining, on a test basis, evidence supporting the amountsand disclosures in the financial statements, assessing the accounting principles used and significantestimates made by management, and evaluating the overall financial statement presentation. Our auditof internal control over financial reporting included obtaining an understanding of internal control overfinancial reporting, assessing the risk that a material weakness exists, and testing and evaluating thedesign and operating effectiveness of internal control based on the assessed risk. Our audits alsoincluded performing such other procedures as we considered necessary in the circumstances. Webelieve that our audits provide a reasonable basis for our opinions.
A company’s internal control over financial reporting is a process designed by, or under thesupervision of, the company’s principal executive and principal financial officers, or personsperforming similar functions, and effected by the company’s board of directors, management, andother personnel to provide reasonable assurance regarding the reliability of financial reporting and thepreparation of financial statements for external purposes in accordance with generally acceptedaccounting principles. A company’s internal control over financial reporting includes those policiesand procedures that (1) pertain to the maintenance of records that, in reasonable detail, accurately andfairly reflect the transactions and dispositions of the assets of the company; (2) provide reasonableassurance that transactions are recorded as necessary to permit preparation of financial statements inaccordance with generally accepted accounting principles, and that receipts and expenditures of the
- II-135 -
APPENDIX II FINANCIAL INFORMATION OF THE TUMI GROUP
company are being made only in accordance with authorizations of management and directors of thecompany; and (3) provide reasonable assurance regarding prevention or timely detection ofunauthorized acquisition, use, or disposition of the company’s assets that could have a material effecton the financial statements.
Because of the inherent limitations of internal control over financial reporting, including thepossibility of collusion or improper management override of controls, material misstatements due toerror or fraud may not be prevented or detected on a timely basis. Also, projections of any evaluationof the effectiveness of the internal control over financial reporting to future periods are subject to therisk that the controls may become inadequate because of changes in conditions, or that the degree ofcompliance with the policies or procedures may deteriorate.
In our opinion, the consolidated financial statements referred to above present fairly, in allmaterial respects, the financial position of Tumi Holdings, Inc. and subsidiaries as of December 31,2015 and the results of their operations and their cash flows for the year then ended December 31,2015, in conformity with accounting principles generally accepted in the United States of America.Also, in our opinion, the Company maintained, in all material respects, effective internal control overfinancial reporting as of December 31, 2015, based on the criteria established in Internal Control—Integrated Framework (2013) issued by the Committee of Sponsoring Organizations of the TreadwayCommission.
/s/ DELOITTE & TOUCHE LLP
Parsippany, New JerseyFebruary 25, 2016
- II-136 -
APPENDIX II FINANCIAL INFORMATION OF THE TUMI GROUP
C. DIFFERENCES BETWEEN THE ACCOUNTING POLICIES ADOPTED BY THECOMPANY (IFRS) AND TUMI (U.S. GAAP)
As described in “Letter from the Board—Waiver from Strict Compliance with the ListingRules”, the Company has applied to the Stock Exchange for, and been granted, a waiver from therequirement to produce an accountants’ report on Tumi in accordance with Rule 14.67(6)(a)(i) of theListing Rules.
Instead, this circular contains a copy of:
(a) the audited consolidated financial statements of Tumi for the financial years endedDecember 31, 2013, 2014 and 2015 prepared in accordance with U.S. GAAP, includingthe management discussion and analysis, extracted from the annual reports of Tumi foreach of those years (together the “Tumi Historical Track Record Accounts”); and
(b) the unaudited condensed consolidated financial statements of Tumi for the three monthsended March 31, 2016, including the management discussion and analysis, extractedfrom the quarterly report of Tumi for the aforementioned period (the “Tumi Q1 2016Accounts”).
The Tumi Historical Track Record Accounts cover the financial positions of Tumi as ofDecember 31, 2013, 2014 and 2015 and the results of Tumi for each of the three years endedDecember 31, 2013, 2014 and 2015 (the “Relevant Periods”).
The accounting policies adopted in the preparation of the Tumi Historical Track RecordAccounts differ in certain material respects from the accounting policies presently adopted by theCompany which comply with IFRS. Differences which would have a significant effect on the TumiHistorical Track Record Accounts, had they been prepared in accordance with the accounting policiespresently adopted by the Company rather than in accordance with U.S. GAAP, are set out below in“Tumi’s Unaudited Adjusted Financial Information under the Company’s Policies”, with the followingdisclosures:
(a) a comparison between Tumi’s consolidated statements of operations and consolidatedstatements of comprehensive income as extracted from the Tumi Historical TrackRecord Accounts, prepared in accordance with U.S. GAAP, and adjusted consolidatedincome statement and consolidated statement of comprehensive income had theyinstead been prepared in accordance with the accounting policies adopted by theCompany which are in compliance with IFRS. The process applied in the preparation ofsuch a comparison is set out in the “Basis of Preparation” and “Reconciliation Process”sections below;
(b) a comparison between Tumi’s consolidated balance sheets as extracted from the TumiHistorical Track Record Accounts, prepared in accordance with U.S. GAAP, andadjusted consolidated statement of financial position had they instead been prepared inaccordance with the accounting policies adopted by the Company which are incompliance with IFRS. The process applied in the preparation of such a comparison isalso set out in the “Basis of Preparation” and “Reconciliation Process” sections below;and
- II-137 -
(c) a discussion of the material financial statement line item differences arising out of theexercise outlined in (a) and (b) above.
The above referenced items are collectively referred to as the “Reconciliation Information”.
The Tumi Q1 2016 Accounts are included in this circular on a voluntary basis to provideShareholders with the most up to date published financial information in relation to Tumi. The TumiQ1 2016 Accounts were prepared in accordance with U.S. GAAP, and are not covered by theReconciliation Information.
Basis of Preparation
The Reconciliation Information for the Relevant Periods, which presents the “UnadjustedFinancial Information under U.S. GAAP” of Tumi as if it had been prepared in accordance with theaccounting policies presently adopted by the Company which are in compliance with IFRS, has beenprepared on the assumption that the transition provisions of IFRS 1, First-time Adoption ofInternational Financial Reporting Standards (“IFRS 1”) are applicable to Tumi. Tumi’s IFRS transitiondate is deemed to be January 1, 2013 and as such, Tumi has applied the mandatory exceptions andcertain optional exemptions afforded by IFRS 1 for the preparation of the Reconciliation Informationfor the Relevant Periods.
Reconciliation Process
The Reconciliation Information has been prepared by Tumi by comparing and analyzing thedifferences between the accounting policies adopted by Tumi for the preparation of the Tumi HistoricalTrack Record Accounts in accordance with U.S. GAAP and the accounting policies adopted by theCompany which are in compliance with IFRS, and quantifying the relevant material financial effects ofsuch differences.
Deloitte Touche Tohmatsu (“Deloitte Hong Kong”) was engaged by the Company to conductwork in accordance with the Hong Kong Standard on Assurance Engagements 3000 “AssuranceEngagements Other Than Audits or Reviews of Historical Financial Information” (“HKSAE 3000”)issued by the HKICPA on the Reconciliation Information. The work consisted primarily of:
(i) comparing the “Unadjusted Financial Information under U.S. GAAP” as set out belowin the section “Tumi’s Unaudited Adjusted Financial Information under the Company’sPolicies” with the Tumi Historical Track Record Accounts prepared under U.S. GAAP;
(ii) considering the adjustments made and evidence supporting the adjustments made inarriving at the “Adjusted Financial Information under the Company’s Policies” also setout below in the section “Tumi’s Unaudited Adjusted Financial Information under theCompany’s Policies”, which included examining the differences between Tumi’saccounting policies and the Company’s accounting policies; and
(iii) checking the arithmetic accuracy of the computation of the “Adjusted FinancialInformation under the Company’s Policies”.
Deloitte Hong Kong’s engagement did not involve independent examination of any of theunderlying financial information. The work carried out in accordance with HKSAE 3000 is different inscope from an audit or a review conducted in accordance with Hong Kong Standards on Auditing orHong Kong Standards on Review Engagements issued by the HKICPA and consequently, DeloitteHong Kong did not express an audit opinion nor a review conclusion on the ReconciliationInformation. Deloitte Hong Kong’s engagement was intended solely for the use of the Directors in
- II-138 -
APPENDIX II FINANCIAL INFORMATION OF THE TUMI GROUP
connection with this circular and may not be suitable for another purpose. Based on the workperformed, Deloitte Hong Kong has concluded that:
(i) the “Unadjusted Financial Information under U.S. GAAP” as set out in the section“Tumi’s Unaudited Adjusted Financial Information under the Company’s Policies” is inagreement with the Tumi Historical Track Record Accounts;
(ii) the adjustments reflect, in all material respects, the differences between Tumi’saccounting policies and the Company’s accounting policies; and
(iii) the computation of the “Adjusted Financial Information under the Company’s Policies”is arithmetically accurate.
Tumi’s Unaudited Adjusted Financial Information under the Company’s Policies
The Tumi Historical Track Record Accounts for the Relevant Periods have been prepared andpresented in accordance with U.S. GAAP. There are no material measurement differences between theTumi Historical Track Record Accounts, as prepared in accordance with U.S. GAAP, compared to thatapplying the accounting policies presently adopted by the Company which are in compliance withIFRS, other than as set out below:
1— Share-based Payments (note n)
2— Income Taxes (note o)
The Reconciliation Information also includes reclassification adjustments to align thepresentation of the Tumi Historical Track Record Accounts with the Company’s presentation.
- II-139 -
APPENDIX II FINANCIAL INFORMATION OF THE TUMI GROUP
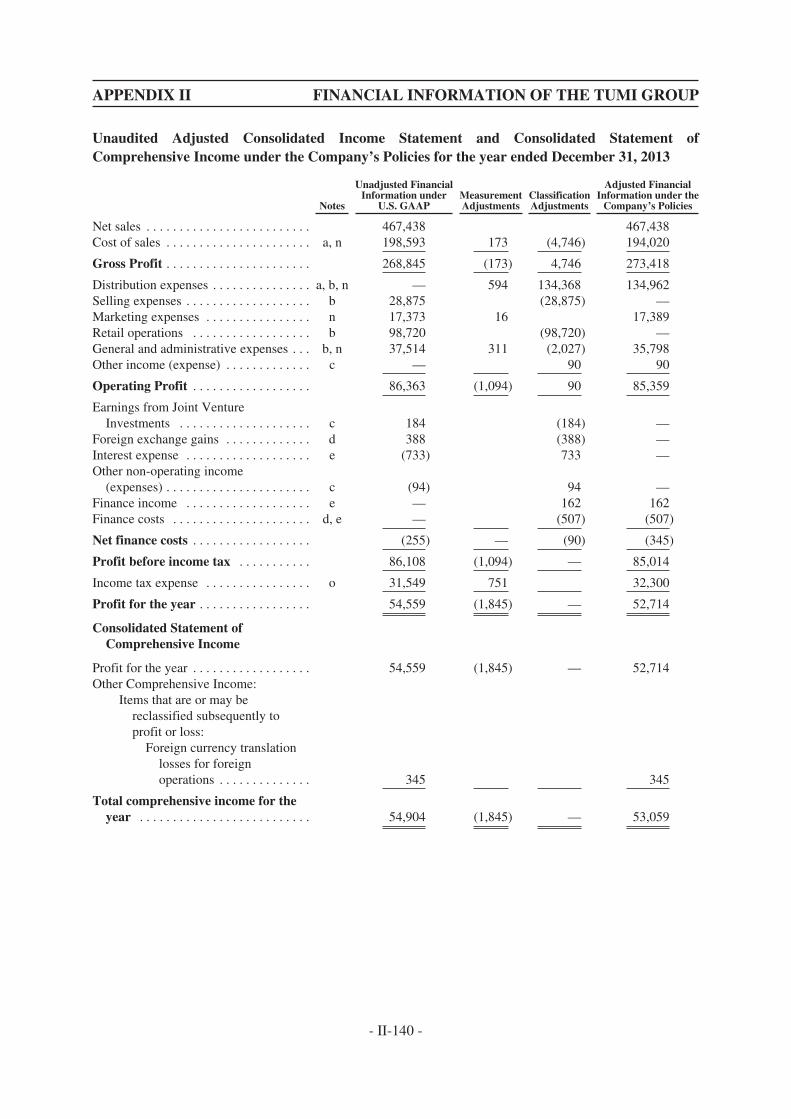
Unaudited Adjusted Consolidated Income Statement and Consolidated Statement ofComprehensive Income under the Company’s Policies for the year ended December 31, 2013
Notes
Unadjusted FinancialInformation under
U.S. GAAPMeasurementAdjustments
ClassificationAdjustments
Adjusted FinancialInformation under the
Company’s Policies
Net sales . . . . . . . . . . . . . . . . . . . . . . . . . 467,438 467,438Cost of sales . . . . . . . . . . . . . . . . . . . . . . a, n 198,593 173 (4,746) 194,020
Gross Profit . . . . . . . . . . . . . . . . . . . . . . 268,845 (173) 4,746 273,418
Distribution expenses . . . . . . . . . . . . . . . a, b, n — 594 134,368 134,962Selling expenses . . . . . . . . . . . . . . . . . . . b 28,875 (28,875) —Marketing expenses . . . . . . . . . . . . . . . . n 17,373 16 17,389Retail operations . . . . . . . . . . . . . . . . . . b 98,720 (98,720) —General and administrative expenses . . . b, n 37,514 311 (2,027) 35,798Other income (expense) . . . . . . . . . . . . . c — 90 90
Operating Profit . . . . . . . . . . . . . . . . . . 86,363 (1,094) 90 85,359
Earnings from Joint VentureInvestments . . . . . . . . . . . . . . . . . . . . c 184 (184) —
Foreign exchange gains . . . . . . . . . . . . . d 388 (388) —Interest expense . . . . . . . . . . . . . . . . . . . e (733) 733 —Other non-operating income
(expenses) . . . . . . . . . . . . . . . . . . . . . . c (94) 94 —Finance income . . . . . . . . . . . . . . . . . . . e — 162 162Finance costs . . . . . . . . . . . . . . . . . . . . . d, e — (507) (507)
Net finance costs . . . . . . . . . . . . . . . . . . (255) — (90) (345)
Profit before income tax . . . . . . . . . . . 86,108 (1,094) — 85,014
Income tax expense . . . . . . . . . . . . . . . . o 31,549 751 32,300
Profit for the year . . . . . . . . . . . . . . . . . 54,559 (1,845) — 52,714
Consolidated Statement ofComprehensive Income
Profit for the year . . . . . . . . . . . . . . . . . . 54,559 (1,845) — 52,714Other Comprehensive Income:
Items that are or may bereclassified subsequently toprofit or loss:
Foreign currency translationlosses for foreignoperations . . . . . . . . . . . . . . 345 345
Total comprehensive income for theyear . . . . . . . . . . . . . . . . . . . . . . . . . . 54,904 (1,845) — 53,059
- II-140 -
APPENDIX II FINANCIAL INFORMATION OF THE TUMI GROUP
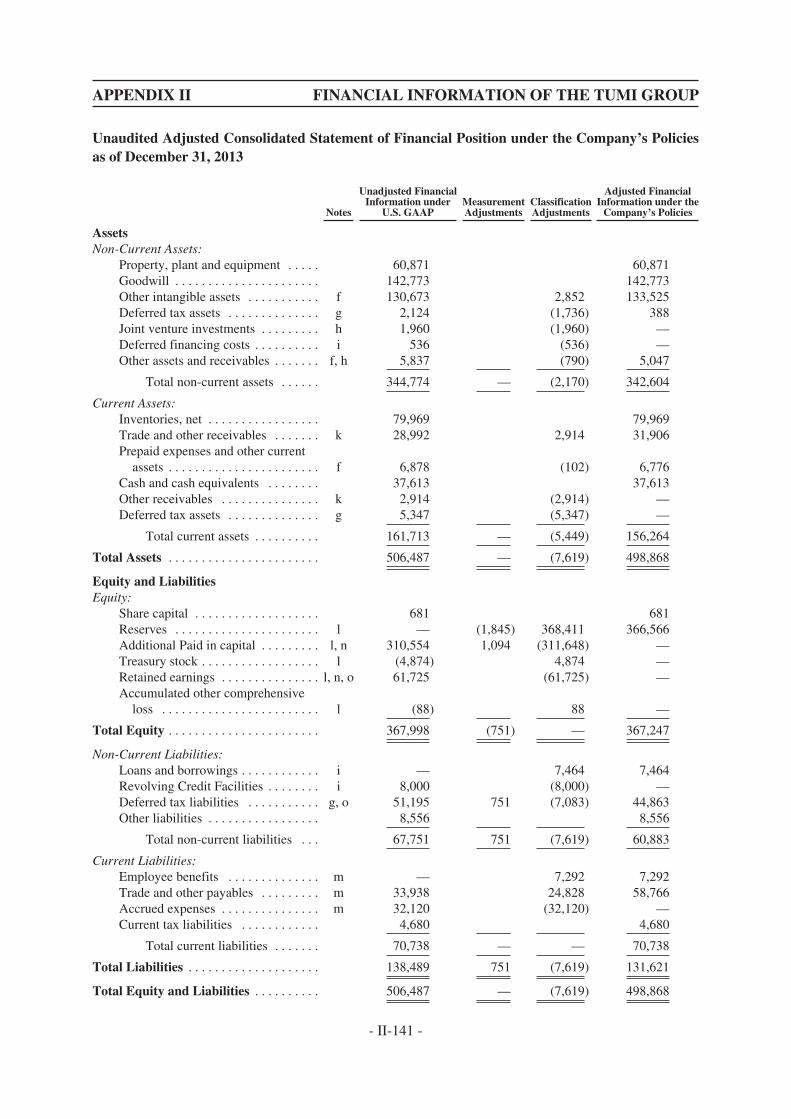
Unaudited Adjusted Consolidated Statement of Financial Position under the Company’s Policiesas of December 31, 2013
Notes
Unadjusted FinancialInformation under
U.S. GAAPMeasurementAdjustments
ClassificationAdjustments
Adjusted FinancialInformation under the
Company’s Policies
AssetsNon-Current Assets:
Property, plant and equipment . . . . . 60,871 60,871Goodwill . . . . . . . . . . . . . . . . . . . . . . 142,773 142,773Other intangible assets . . . . . . . . . . . f 130,673 2,852 133,525Deferred tax assets . . . . . . . . . . . . . . g 2,124 (1,736) 388Joint venture investments . . . . . . . . . h 1,960 (1,960) —Deferred financing costs . . . . . . . . . . i 536 (536) —Other assets and receivables . . . . . . . f, h 5,837 (790) 5,047
Total non-current assets . . . . . . 344,774 — (2,170) 342,604
Current Assets:Inventories, net . . . . . . . . . . . . . . . . . 79,969 79,969Trade and other receivables . . . . . . . k 28,992 2,914 31,906Prepaid expenses and other current
assets . . . . . . . . . . . . . . . . . . . . . . . f 6,878 (102) 6,776Cash and cash equivalents . . . . . . . . 37,613 37,613Other receivables . . . . . . . . . . . . . . . k 2,914 (2,914) —Deferred tax assets . . . . . . . . . . . . . . g 5,347 (5,347) —
Total current assets . . . . . . . . . . 161,713 — (5,449) 156,264
Total Assets . . . . . . . . . . . . . . . . . . . . . . . 506,487 — (7,619) 498,868
Equity and LiabilitiesEquity:
Share capital . . . . . . . . . . . . . . . . . . . 681 681Reserves . . . . . . . . . . . . . . . . . . . . . . l — (1,845) 368,411 366,566Additional Paid in capital . . . . . . . . . l, n 310,554 1,094 (311,648) —Treasury stock . . . . . . . . . . . . . . . . . . l (4,874) 4,874 —Retained earnings . . . . . . . . . . . . . . . l, n, o 61,725 (61,725) —Accumulated other comprehensive
loss . . . . . . . . . . . . . . . . . . . . . . . . l (88) 88 —
Total Equity . . . . . . . . . . . . . . . . . . . . . . . 367,998 (751) — 367,247
Non-Current Liabilities:Loans and borrowings . . . . . . . . . . . . i — 7,464 7,464Revolving Credit Facilities . . . . . . . . i 8,000 (8,000) —Deferred tax liabilities . . . . . . . . . . . g, o 51,195 751 (7,083) 44,863Other liabilities . . . . . . . . . . . . . . . . . 8,556 8,556
Total non-current liabilities . . . 67,751 751 (7,619) 60,883
Current Liabilities:Employee benefits . . . . . . . . . . . . . . m — 7,292 7,292Trade and other payables . . . . . . . . . m 33,938 24,828 58,766Accrued expenses . . . . . . . . . . . . . . . m 32,120 (32,120) —Current tax liabilities . . . . . . . . . . . . 4,680 4,680
Total current liabilities . . . . . . . 70,738 — — 70,738
Total Liabilities . . . . . . . . . . . . . . . . . . . . 138,489 751 (7,619) 131,621
Total Equity and Liabilities . . . . . . . . . . 506,487 — (7,619) 498,868
- II-141 -
APPENDIX II FINANCIAL INFORMATION OF THE TUMI GROUP

Unaudited Adjusted Consolidated Income Statement and Consolidated Statement ofComprehensive Income under the Company’s Policies for the year ended December 31, 2014
Notes
Unadjusted FinancialInformation under
U.S. GAAPMeasurementAdjustments
ClassificationAdjustments
Adjusted FinancialInformation under the
Company’s Policies
Net sales . . . . . . . . . . . . . . . . . . . . . . . . . . 527,194 527,194Cost of sales . . . . . . . . . . . . . . . . . . . . . . . a, n 221,227 (11) (6,005) 215,211
Gross Profit . . . . . . . . . . . . . . . . . . . . . . . 305,967 11 6,005 311,983
Distribution expenses . . . . . . . . . . . . . . . . a, b, n — 86 159,836 159,922Selling expenses . . . . . . . . . . . . . . . . . . . . b 36,447 (36,447) —Marketing expenses . . . . . . . . . . . . . . . . . n 17,539 20 17,559Retail operations . . . . . . . . . . . . . . . . . . . b 114,752 (114,752) —General and administrative expenses . . . . b, n 43,799 474 (2,632) 41,641Other income (expense) . . . . . . . . . . . . . . c — 411 411
Operating Profit . . . . . . . . . . . . . . . . . . . 93,430 (569) 411 93,272
Earnings from Joint VentureInvestments . . . . . . . . . . . . . . . . . . . . . c 279 (279) —
Foreign exchange gains . . . . . . . . . . . . . . d 475 (475) —Interest expense . . . . . . . . . . . . . . . . . . . . e (477) 477 —Other non-operating income
(expenses) . . . . . . . . . . . . . . . . . . . . . . . c 132 (132) —Finance income . . . . . . . . . . . . . . . . . . . . e — 147 147Finance costs . . . . . . . . . . . . . . . . . . . . . . d, e — (149) (149)
Net finance costs . . . . . . . . . . . . . . . . . . . 409 — (411) (2)
Profit before income tax . . . . . . . . . . . . 93,839 (569) — 93,270
Income tax expense . . . . . . . . . . . . . . . . . o 35,830 604 36,434
Profit for the year . . . . . . . . . . . . . . . . . . 58,009 (1,173) — 56,836
Consolidated Statements ofComprehensive Income
Profit for the year . . . . . . . . . . . . . . . . . . . 58,009 (1,173) — 56,836Other Comprehensive Income (loss):
Items that are or may be reclassifiedsubsequently to profit or loss:
Foreign currency translationlosses for foreignoperations . . . . . . . . . . . . . . . (2,787) (2,787)
Total comprehensive income for theyear . . . . . . . . . . . . . . . . . . . . . . . . . . . 55,222 (1,173) — 54,049
- II-142 -
APPENDIX II FINANCIAL INFORMATION OF THE TUMI GROUP
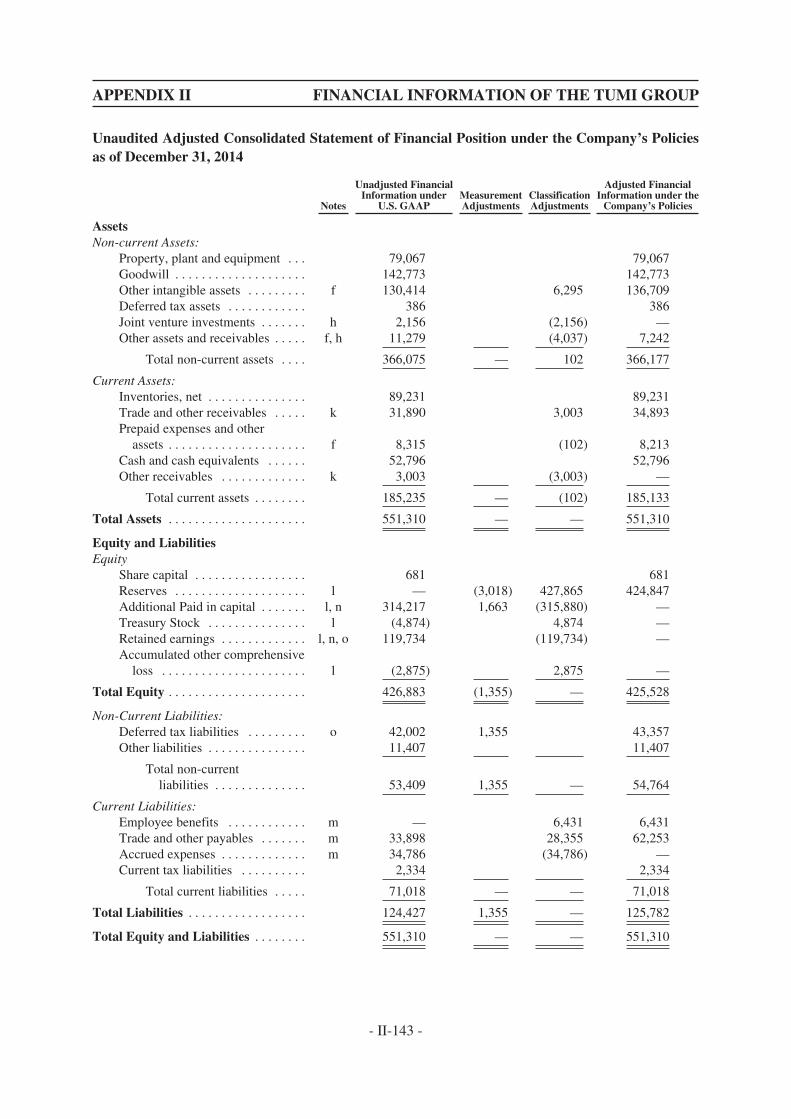
Unaudited Adjusted Consolidated Statement of Financial Position under the Company’s Policiesas of December 31, 2014
Notes
Unadjusted FinancialInformation under
U.S. GAAPMeasurementAdjustments
ClassificationAdjustments
Adjusted FinancialInformation under the
Company’s Policies
AssetsNon-current Assets:
Property, plant and equipment . . . 79,067 79,067Goodwill . . . . . . . . . . . . . . . . . . . . 142,773 142,773Other intangible assets . . . . . . . . . f 130,414 6,295 136,709Deferred tax assets . . . . . . . . . . . . 386 386Joint venture investments . . . . . . . h 2,156 (2,156) —Other assets and receivables . . . . . f, h 11,279 (4,037) 7,242
Total non-current assets . . . . 366,075 — 102 366,177
Current Assets:Inventories, net . . . . . . . . . . . . . . . 89,231 89,231Trade and other receivables . . . . . k 31,890 3,003 34,893Prepaid expenses and other
assets . . . . . . . . . . . . . . . . . . . . . f 8,315 (102) 8,213Cash and cash equivalents . . . . . . 52,796 52,796Other receivables . . . . . . . . . . . . . k 3,003 (3,003) —
Total current assets . . . . . . . . 185,235 — (102) 185,133
Total Assets . . . . . . . . . . . . . . . . . . . . . 551,310 — — 551,310
Equity and LiabilitiesEquity
Share capital . . . . . . . . . . . . . . . . . 681 681Reserves . . . . . . . . . . . . . . . . . . . . l — (3,018) 427,865 424,847Additional Paid in capital . . . . . . . l, n 314,217 1,663 (315,880) —Treasury Stock . . . . . . . . . . . . . . . l (4,874) 4,874 —Retained earnings . . . . . . . . . . . . . l, n, o 119,734 (119,734) —Accumulated other comprehensive
loss . . . . . . . . . . . . . . . . . . . . . . l (2,875) 2,875 —
Total Equity . . . . . . . . . . . . . . . . . . . . . 426,883 (1,355) — 425,528
Non-Current Liabilities:Deferred tax liabilities . . . . . . . . . o 42,002 1,355 43,357Other liabilities . . . . . . . . . . . . . . . 11,407 11,407
Total non-currentliabilities . . . . . . . . . . . . . . 53,409 1,355 — 54,764
Current Liabilities:Employee benefits . . . . . . . . . . . . m — 6,431 6,431Trade and other payables . . . . . . . m 33,898 28,355 62,253Accrued expenses . . . . . . . . . . . . . m 34,786 (34,786) —Current tax liabilities . . . . . . . . . . 2,334 2,334
Total current liabilities . . . . . 71,018 — — 71,018
Total Liabilities . . . . . . . . . . . . . . . . . . 124,427 1,355 — 125,782
Total Equity and Liabilities . . . . . . . . 551,310 — — 551,310
- II-143 -
APPENDIX II FINANCIAL INFORMATION OF THE TUMI GROUP
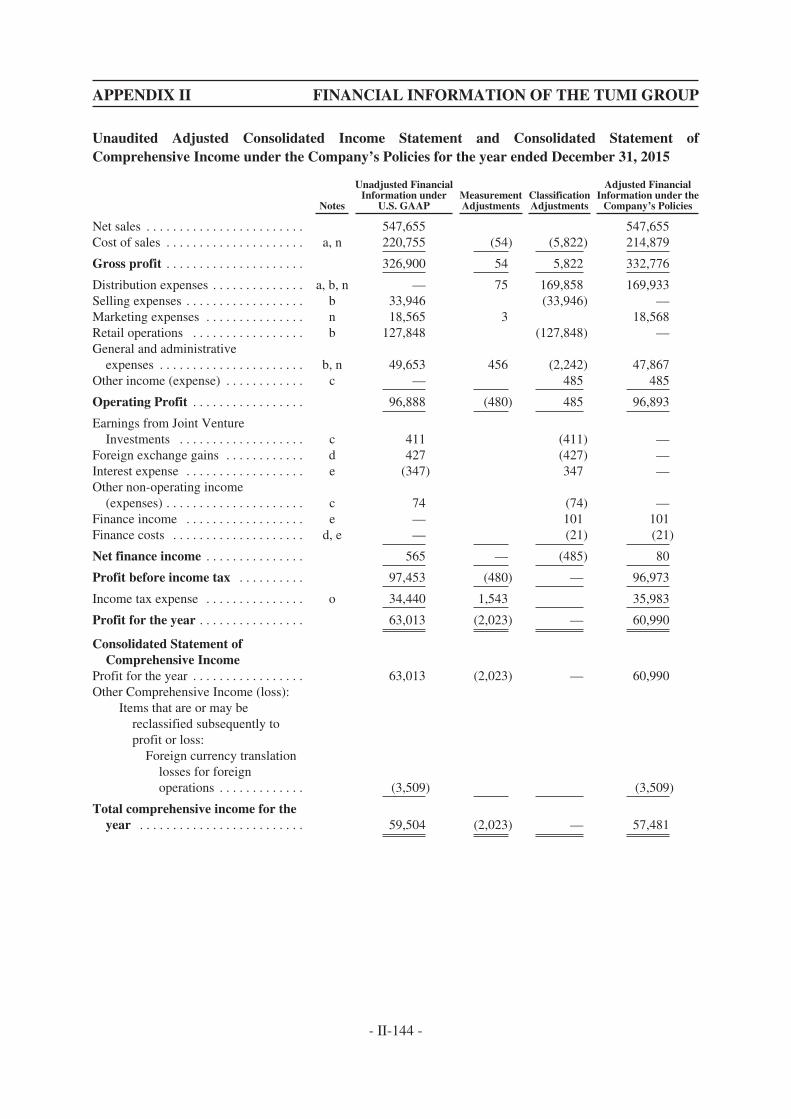
Unaudited Adjusted Consolidated Income Statement and Consolidated Statement ofComprehensive Income under the Company’s Policies for the year ended December 31, 2015
Notes
Unadjusted FinancialInformation under
U.S. GAAPMeasurementAdjustments
ClassificationAdjustments
Adjusted FinancialInformation under the
Company’s Policies
Net sales . . . . . . . . . . . . . . . . . . . . . . . . 547,655 547,655Cost of sales . . . . . . . . . . . . . . . . . . . . . a, n 220,755 (54) (5,822) 214,879
Gross profit . . . . . . . . . . . . . . . . . . . . . 326,900 54 5,822 332,776
Distribution expenses . . . . . . . . . . . . . . a, b, n — 75 169,858 169,933Selling expenses . . . . . . . . . . . . . . . . . . b 33,946 (33,946) —Marketing expenses . . . . . . . . . . . . . . . n 18,565 3 18,568Retail operations . . . . . . . . . . . . . . . . . b 127,848 (127,848) —General and administrative
expenses . . . . . . . . . . . . . . . . . . . . . . b, n 49,653 456 (2,242) 47,867Other income (expense) . . . . . . . . . . . . c — 485 485
Operating Profit . . . . . . . . . . . . . . . . . 96,888 (480) 485 96,893
Earnings from Joint VentureInvestments . . . . . . . . . . . . . . . . . . . c 411 (411) —
Foreign exchange gains . . . . . . . . . . . . d 427 (427) —Interest expense . . . . . . . . . . . . . . . . . . e (347) 347 —Other non-operating income
(expenses) . . . . . . . . . . . . . . . . . . . . . c 74 (74) —Finance income . . . . . . . . . . . . . . . . . . e — 101 101Finance costs . . . . . . . . . . . . . . . . . . . . d, e — (21) (21)
Net finance income . . . . . . . . . . . . . . . 565 — (485) 80
Profit before income tax . . . . . . . . . . 97,453 (480) — 96,973
Income tax expense . . . . . . . . . . . . . . . o 34,440 1,543 35,983
Profit for the year . . . . . . . . . . . . . . . . 63,013 (2,023) — 60,990
Consolidated Statement ofComprehensive Income
Profit for the year . . . . . . . . . . . . . . . . . 63,013 (2,023) — 60,990Other Comprehensive Income (loss):
Items that are or may bereclassified subsequently toprofit or loss:
Foreign currency translationlosses for foreignoperations . . . . . . . . . . . . . (3,509) (3,509)
Total comprehensive income for theyear . . . . . . . . . . . . . . . . . . . . . . . . . 59,504 (2,023) — 57,481
- II-144 -
APPENDIX II FINANCIAL INFORMATION OF THE TUMI GROUP
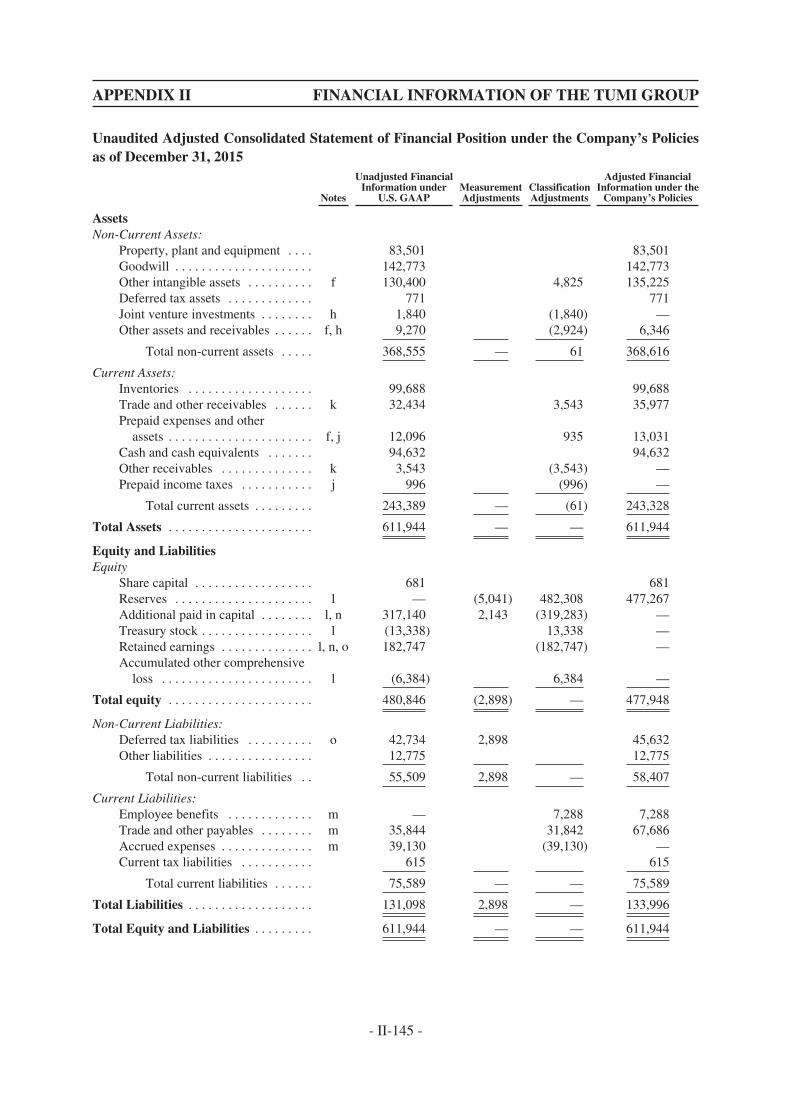
Unaudited Adjusted Consolidated Statement of Financial Position under the Company’s Policiesas of December 31, 2015
Notes
Unadjusted FinancialInformation under
U.S. GAAPMeasurementAdjustments
ClassificationAdjustments
Adjusted FinancialInformation under the
Company’s Policies
AssetsNon-Current Assets:
Property, plant and equipment . . . . 83,501 83,501Goodwill . . . . . . . . . . . . . . . . . . . . . 142,773 142,773Other intangible assets . . . . . . . . . . f 130,400 4,825 135,225Deferred tax assets . . . . . . . . . . . . . 771 771Joint venture investments . . . . . . . . h 1,840 (1,840) —Other assets and receivables . . . . . . f, h 9,270 (2,924) 6,346
Total non-current assets . . . . . 368,555 — 61 368,616
Current Assets:Inventories . . . . . . . . . . . . . . . . . . . 99,688 99,688Trade and other receivables . . . . . . k 32,434 3,543 35,977Prepaid expenses and other
assets . . . . . . . . . . . . . . . . . . . . . . f, j 12,096 935 13,031Cash and cash equivalents . . . . . . . 94,632 94,632Other receivables . . . . . . . . . . . . . . k 3,543 (3,543) —Prepaid income taxes . . . . . . . . . . . j 996 (996) —
Total current assets . . . . . . . . . 243,389 — (61) 243,328
Total Assets . . . . . . . . . . . . . . . . . . . . . . 611,944 — — 611,944
Equity and LiabilitiesEquity
Share capital . . . . . . . . . . . . . . . . . . 681 681Reserves . . . . . . . . . . . . . . . . . . . . . l — (5,041) 482,308 477,267Additional paid in capital . . . . . . . . l, n 317,140 2,143 (319,283) —Treasury stock . . . . . . . . . . . . . . . . . l (13,338) 13,338 —Retained earnings . . . . . . . . . . . . . . l, n, o 182,747 (182,747) —Accumulated other comprehensive
loss . . . . . . . . . . . . . . . . . . . . . . . l (6,384) 6,384 —
Total equity . . . . . . . . . . . . . . . . . . . . . . 480,846 (2,898) — 477,948
Non-Current Liabilities:Deferred tax liabilities . . . . . . . . . . o 42,734 2,898 45,632Other liabilities . . . . . . . . . . . . . . . . 12,775 12,775
Total non-current liabilities . . 55,509 2,898 — 58,407
Current Liabilities:Employee benefits . . . . . . . . . . . . . m — 7,288 7,288Trade and other payables . . . . . . . . m 35,844 31,842 67,686Accrued expenses . . . . . . . . . . . . . . m 39,130 (39,130) —Current tax liabilities . . . . . . . . . . . 615 615
Total current liabilities . . . . . . 75,589 — — 75,589
Total Liabilities . . . . . . . . . . . . . . . . . . . 131,098 2,898 — 133,996
Total Equity and Liabilities . . . . . . . . . 611,944 — — 611,944
- II-145 -
APPENDIX II FINANCIAL INFORMATION OF THE TUMI GROUP
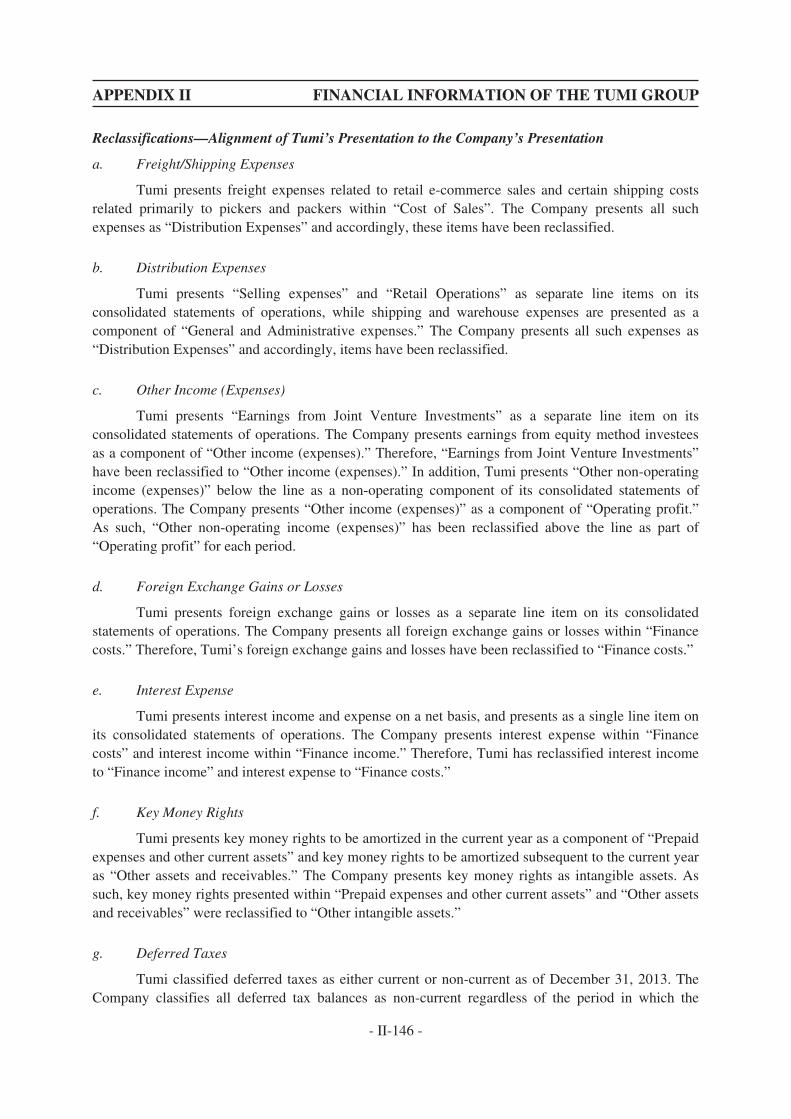
Reclassifications—Alignment of Tumi’s Presentation to the Company’s Presentation
a. Freight/Shipping Expenses
Tumi presents freight expenses related to retail e-commerce sales and certain shipping costsrelated primarily to pickers and packers within “Cost of Sales”. The Company presents all suchexpenses as “Distribution Expenses” and accordingly, these items have been reclassified.
b. Distribution Expenses
Tumi presents “Selling expenses” and “Retail Operations” as separate line items on itsconsolidated statements of operations, while shipping and warehouse expenses are presented as acomponent of “General and Administrative expenses.” The Company presents all such expenses as“Distribution Expenses” and accordingly, items have been reclassified.
c. Other Income (Expenses)
Tumi presents “Earnings from Joint Venture Investments” as a separate line item on itsconsolidated statements of operations. The Company presents earnings from equity method investeesas a component of “Other income (expenses).” Therefore, “Earnings from Joint Venture Investments”have been reclassified to “Other income (expenses).” In addition, Tumi presents “Other non-operatingincome (expenses)” below the line as a non-operating component of its consolidated statements ofoperations. The Company presents “Other income (expenses)” as a component of “Operating profit.”As such, “Other non-operating income (expenses)” has been reclassified above the line as part of“Operating profit” for each period.
d. Foreign Exchange Gains or Losses
Tumi presents foreign exchange gains or losses as a separate line item on its consolidatedstatements of operations. The Company presents all foreign exchange gains or losses within “Financecosts.” Therefore, Tumi’s foreign exchange gains and losses have been reclassified to “Finance costs.”
e. Interest Expense
Tumi presents interest income and expense on a net basis, and presents as a single line item onits consolidated statements of operations. The Company presents interest expense within “Financecosts” and interest income within “Finance income.” Therefore, Tumi has reclassified interest incometo “Finance income” and interest expense to “Finance costs.”
f. Key Money Rights
Tumi presents key money rights to be amortized in the current year as a component of “Prepaidexpenses and other current assets” and key money rights to be amortized subsequent to the current yearas “Other assets and receivables.” The Company presents key money rights as intangible assets. Assuch, key money rights presented within “Prepaid expenses and other current assets” and “Other assetsand receivables” were reclassified to “Other intangible assets.”
g. Deferred Taxes
Tumi classified deferred taxes as either current or non-current as of December 31, 2013. TheCompany classifies all deferred tax balances as non-current regardless of the period in which the
- II-146 -
APPENDIX II FINANCIAL INFORMATION OF THE TUMI GROUP
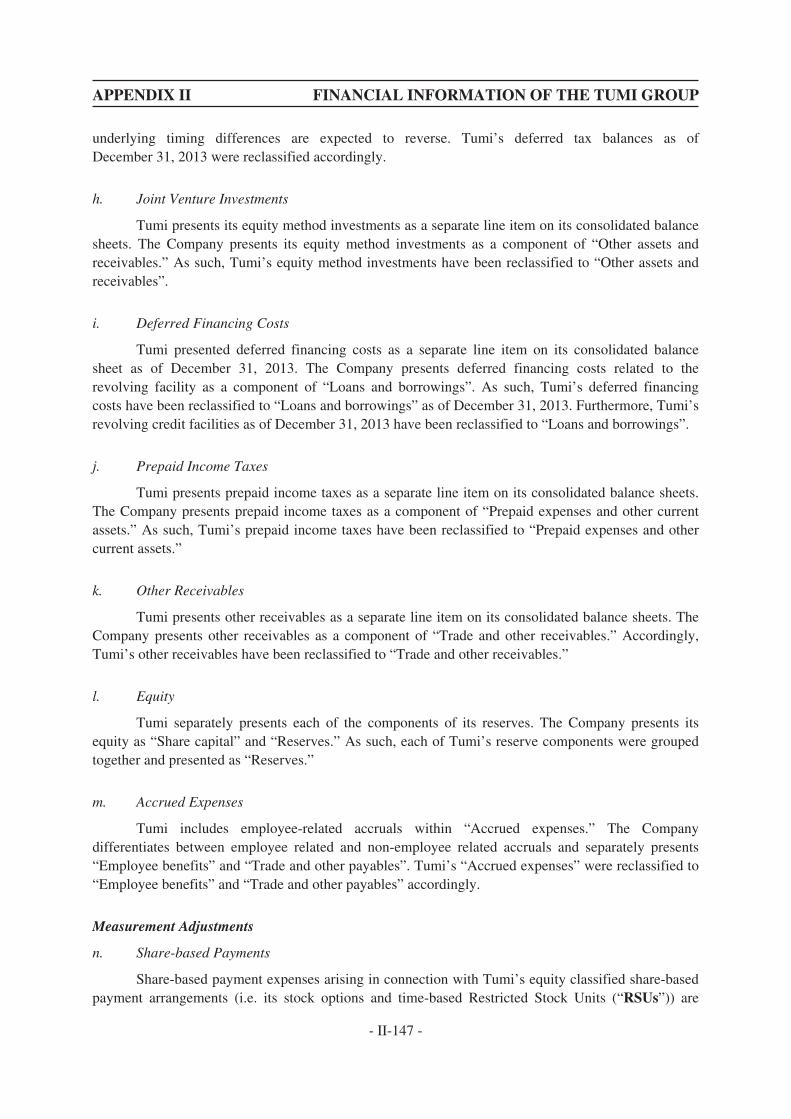
underlying timing differences are expected to reverse. Tumi’s deferred tax balances as ofDecember 31, 2013 were reclassified accordingly.
h. Joint Venture Investments
Tumi presents its equity method investments as a separate line item on its consolidated balancesheets. The Company presents its equity method investments as a component of “Other assets andreceivables.” As such, Tumi’s equity method investments have been reclassified to “Other assets andreceivables”.
i. Deferred Financing Costs
Tumi presented deferred financing costs as a separate line item on its consolidated balancesheet as of December 31, 2013. The Company presents deferred financing costs related to therevolving facility as a component of “Loans and borrowings”. As such, Tumi’s deferred financingcosts have been reclassified to “Loans and borrowings” as of December 31, 2013. Furthermore, Tumi’srevolving credit facilities as of December 31, 2013 have been reclassified to “Loans and borrowings”.
j. Prepaid Income Taxes
Tumi presents prepaid income taxes as a separate line item on its consolidated balance sheets.The Company presents prepaid income taxes as a component of “Prepaid expenses and other currentassets.” As such, Tumi’s prepaid income taxes have been reclassified to “Prepaid expenses and othercurrent assets.”
k. Other Receivables
Tumi presents other receivables as a separate line item on its consolidated balance sheets. TheCompany presents other receivables as a component of “Trade and other receivables.” Accordingly,Tumi’s other receivables have been reclassified to “Trade and other receivables.”
l. Equity
Tumi separately presents each of the components of its reserves. The Company presents itsequity as “Share capital” and “Reserves.” As such, each of Tumi’s reserve components were groupedtogether and presented as “Reserves.”
m. Accrued Expenses
Tumi includes employee-related accruals within “Accrued expenses.” The Companydifferentiates between employee related and non-employee related accruals and separately presents“Employee benefits” and “Trade and other payables”. Tumi’s “Accrued expenses” were reclassified to“Employee benefits” and “Trade and other payables” accordingly.
Measurement Adjustments
n. Share-based Payments
Share-based payment expenses arising in connection with Tumi’s equity classified share-basedpayment arrangements (i.e. its stock options and time-based Restricted Stock Units (“RSUs”)) are
- II-147 -
APPENDIX II FINANCIAL INFORMATION OF THE TUMI GROUP

recognized on a straight-line basis over the vesting period. The Company accounts for each awardseparately and accordingly, recognizes expenses over the period that the employees unconditionallybecome entitled to the awards. The difference between expense attribution under Tumi’s policy versusthe Company’s policy resulted in additional pre-tax share-based payment expense of $1.1 million,$0.6 million, and $0.5 million for the fiscal years ended December 31, 2013, 2014 and 2015,respectively.
o. Income Taxes
Income tax adjustments reflect the following:
i) The tax effect of the measurement adjustments noted in n above; and
ii) The re-measurement of the deferred tax balances related to share-based payments ateach period end, having regard to Tumi’s share price at each of the respective periodends. Historically, Tumi’s measurement of the deferred tax balances were based oncumulative expense recognized irrespective of changes in the underlying share price.
- II-148 -
APPENDIX II FINANCIAL INFORMATION OF THE TUMI GROUP
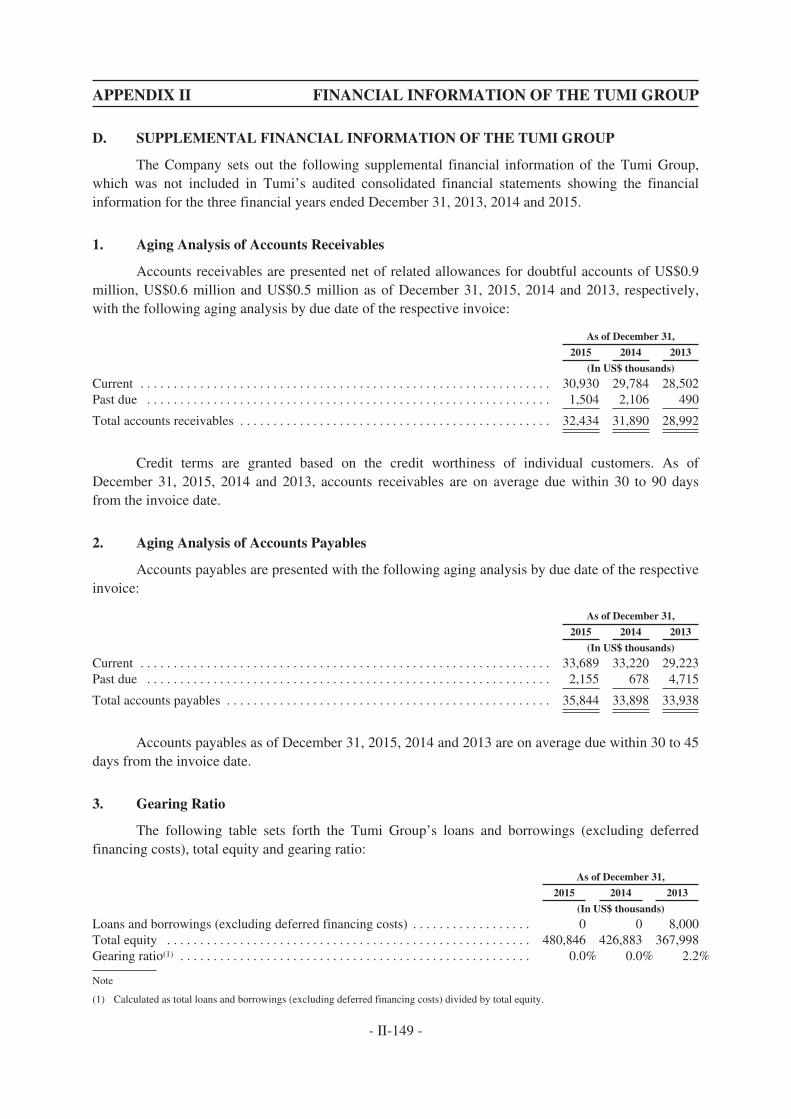
APPENDIX II FINANCIAL INFORMATION OF THE TUMI GROUP
D. SUPPLEMENTAL FINANCIAL INFORMATION OF THE TUMI GROUP
The Company sets out the following supplemental financial information of the Tumi Group,which was not included in Tumi’s audited consolidated financial statements showing the financialinformation for the three financial years ended December 31, 2013, 2014 and 2015.
1. Aging Analysis of Accounts Receivables
Accounts receivables are presented net of related allowances for doubtful accounts of US$0.9million, US$0.6 million and US$0.5 million as of December 31, 2015, 2014 and 2013, respectively,with the following aging analysis by due date of the respective invoice:
As of December 31,
2015 2014 2013
(In US$ thousands)
Current . . . . . . . . . . . . . . . . . . . . . . . . . . . . . . . . . . . . . . . . . . . . . . . . . . . . . . . . . . . . . . 30,930 29,784 28,502Past due . . . . . . . . . . . . . . . . . . . . . . . . . . . . . . . . . . . . . . . . . . . . . . . . . . . . . . . . . . . . . 1,504 2,106 490
Total accounts receivables . . . . . . . . . . . . . . . . . . . . . . . . . . . . . . . . . . . . . . . . . . . . . . . 32,434 31,890 28,992
Credit terms are granted based on the credit worthiness of individual customers. As ofDecember 31, 2015, 2014 and 2013, accounts receivables are on average due within 30 to 90 daysfrom the invoice date.
2. Aging Analysis of Accounts Payables
Accounts payables are presented with the following aging analysis by due date of the respectiveinvoice:
As of December 31,
2015 2014 2013
(In US$ thousands)
Current . . . . . . . . . . . . . . . . . . . . . . . . . . . . . . . . . . . . . . . . . . . . . . . . . . . . . . . . . . . . . . 33,689 33,220 29,223Past due . . . . . . . . . . . . . . . . . . . . . . . . . . . . . . . . . . . . . . . . . . . . . . . . . . . . . . . . . . . . . 2,155 678 4,715
Total accounts payables . . . . . . . . . . . . . . . . . . . . . . . . . . . . . . . . . . . . . . . . . . . . . . . . . 35,844 33,898 33,938
Accounts payables as of December 31, 2015, 2014 and 2013 are on average due within 30 to 45days from the invoice date.
3. Gearing Ratio
The following table sets forth the Tumi Group’s loans and borrowings (excluding deferredfinancing costs), total equity and gearing ratio:
As of December 31,
2015 2014 2013
(In US$ thousands)
Loans and borrowings (excluding deferred financing costs) . . . . . . . . . . . . . . . . . . 0 0 8,000Total equity . . . . . . . . . . . . . . . . . . . . . . . . . . . . . . . . . . . . . . . . . . . . . . . . . . . . . . . 480,846 426,883 367,998Gearing ratio(1) . . . . . . . . . . . . . . . . . . . . . . . . . . . . . . . . . . . . . . . . . . . . . . . . . . . . . 0.0% 0.0% 2.2%
Note
(1) Calculated as total loans and borrowings (excluding deferred financing costs) divided by total equity.
- II-149 -

APPENDIX II FINANCIAL INFORMATION OF THE TUMI GROUP
4. Charge on Assets
The Tumi Group maintains a US$70.0 million senior secured revolving credit facility (the“Amended Credit Facility”) with Wells Fargo Bank National Association (“Wells Fargo”). TheAmended Credit Facility includes a letter of credit sublimit of US$5.0 million.
As of December 31, 2015 and 2014 the Tumi Group had no balance outstanding under theAmended Credit Facility. As of December 31, 2013, the Tumi Group had US$8.0 million outstandingunder the Amended Credit Facility. Letters of credit outstanding totaled US$0.4 million, US$0.3million and US$0.3 million at December 31, 2015, 2014 and 2013, and, accordingly, the unusedportion of the Amended Credit Facility was US$69.6 million, US$69.7 million and US$61.7 million,respectively.
All obligations under the Amended Credit Facility are required to be guaranteed by each of theTumi Group’s material domestic subsidiaries, subject to certain exclusions. The obligations under theAmended Credit Facility are secured by substantially all of the Tumi Group’s assets and, if applicable,those of the Tumi Group’s subsidiary guarantors. As of December 31, 2015, 2014 and 2013, the TumiGroup had pledged assets totaling US$611.9 million, US$551.3 million and US$506.5 million,respectively. As of December 31, 2015, 2014 and 2013, the Tumi Group did not have any subsidiaryguarantors.
5. Significant Investments
The Tumi Group did not hold any significant investments for each of the financial years endedDecember 31, 2015, 2014 and 2013, and it does not anticipate making any significant investmentsduring 2016.
6. Employees’ Remuneration
As of December 31, 2015, December 31, 2014 and December 31, 2013, the Tumi Group had1,577, 1,484 and 1,307, employees, respectively. The increase in headcount was largely driven by theaddition of new retail stores, both domestically and internationally. The Tumi Group regularly reviewsremuneration and benefits of its employees according to the relevant market practice, employeeperformance and the financial performance of the Tumi Group.
Share-based compensation plans and awards
The Tumi Group adopted the 2012 Long-Term Incentive Plan (the “2012 Plan”) effectiveApril 18, 2012, which has a term of 10 years. The Tumi Group’s compensation committee willgenerally designate those individuals eligible to participate in the 2012 Plan. Subject to adjustment inthe event of a merger, recapitalization, stock split, reorganization or similar transaction, 6,786,667Tumi Shares, or the share limit, are reserved for issuance in connection with awards granted under the2012 Plan. Any unexercised, unconverted or undistributed portion of any award that is not paid inconnection with the settlement of an award or is forfeited without the issuance of Tumi Shares shallagain be available for grant under the 2012 Plan. Options and stock appreciation rights under the 2012Plan have a maximum term of 10 years.
The 2012 Plan provides for the grant of stock options (including nonqualified stock options andincentive stock options), restricted stock, restricted stock units, performance awards (which include,but are not limited to, cash bonuses), dividend equivalents, stock payment awards, stock appreciationrights, and other incentive awards. The exercise price of an option or stock appreciation price must beequal to or greater than the fair market value of the Tumi Group’s common stock on the date of grant.
- II-150 -

APPENDIX II FINANCIAL INFORMATION OF THE TUMI GROUP
For further details of Tumi’s share-based compensation awards and arrangements under the2012 Plan, please refer to notes 16, 17 and 17 to the consolidated financial statements of the TumiGroup for each of the financial years ended December 31, 2015, 2014 and 2013, respectively, asextracted in the section “Published Financial Information of the Tumi Group of each of the ThreeYears Ended December 31, 2013, 2014 and 2015 and the Three Months Ended March 27, 2016” in thisAppendix II.
7. Subsequent Events
On November 4, 2015, the Tumi Group announced that it had entered into an agreement toacquire the remaining 50% stake in its Japanese joint venture, Tumi Japan, from its partners, for apurchase price of 521 million yen (approximately US$4.3 million). Tumi Japan operates a network of13 Tumi stores, an e-commerce website, and distributes Tumi products across an additional 150 pointsof sale in Japan. The transaction closed on January 4, 2016.
On March 3, 2016, the Tumi Group entered into the Merger Agreement with the Company andPTL Acquisition, pursuant to which the Company agreed to acquire Tumi, subject to the terms andconditions set out in the Merger Agreement. The acquisition is proposed to be effected by way of amerger of PTL Acquisition with and into Tumi, with Tumi surviving the merger as an indirect wholly-owned subsidiary of the Company. Please refer to “Letter from the Board” in this circular for furtherdetails of the Merger Agreement.
8. Subsequent Financial Statements
No audited financial statements have been prepared by any of the entities comprising the TumiGroup in respect of any period subsequent to December 31, 2015.
- II-151 -
APPENDIX II FINANCIAL INFORMATION OF THE TUMI GROUP
E. MANAGEMENT DISCUSSION AND ANALYSIS OF TUMI
For the purpose of this section only, unless the context requires otherwise, references to the“Company”, “we”, “us” and “our” refer to Tumi and references to “$” refer to US$.
1. The following is an extract of the management discussion and analysis of the results of Tumifor the year ended December 31, 2013 from the 2013 annual report of Tumi.
MANAGEMENT’S DISCUSSION AND ANALYSIS OF FINANCIAL CONDITION ANDRESULTS OF OPERATIONS
The following discussion should be read in conjunction with “Selected Consolidated FinancialData” and our audited consolidated financial statements and notes thereto included elsewhere in thisreport. In addition to historical information, this discussion contains forward-looking statements thatinvolve risks, uncertainties and assumptions that could cause actual results to differ materially frommanagement’s expectations. For this purpose, any statements contained herein that are not statementsof historical fact may be deemed to be forward-looking statements. We generally identify forward-looking statements by words such as “anticipate,” “estimate,” “expect,” “intend,” “project,” “plan,”“predict,” “believe,” “seek,” “continue,” “outlook,” “may,” “might,” “will,” “should,” “can have,”“likely” or the negative version of these words or comparable words. Factors that can cause actualresults to differ materially from those reflected in the forward-looking statements include, amongothers, those discussed in “Risk Factors” and elsewhere in this report. We urge you not to place unduereliance on these forward-looking statements, which reflect management’s analysis, judgment, beliefor expectation only as of the date hereof. We expressly disclaim any obligation to update or revise anyforward-looking statement, whether as a result of new information, future events or otherwise, exceptas required by applicable securities laws and regulations. Historical results are not necessarilyindicative of the results expected for any future period.
Executive Overview
We are a high-growth, global, premium lifestyle brand whose products offer superior quality,durability and innovative design. We offer a comprehensive line of travel and business products andaccessories in multiple categories. We design our products for, and market our products to,sophisticated professionals, frequent travelers and brand-conscious individuals who enjoy the premiumstatus of Tumi products. We sell our products through a network of company-owned full-price storesand outlet stores, partner stores, concessions, shop-in-shops, specialty luggage shops, high-enddepartment stores and e-commerce distribution channels. We have approximately 1,900 points ofdistribution in over 75 countries, and our global distribution network is enhanced by the use of ourthree logistics facilities located in the United States, Europe and Asia. We design our products in ourU.S. design studios and selectively collaborate with well-known, international, industrial and fashiondesigners for limited edition product lines. Production is sourced globally through a network ofsuppliers based in Asia, many of which are longtime suppliers, and the Caribbean.
In April 2012, we completed our IPO, at which time we sold a total of 15,608,221 shares of ourcommon stock and certain of our stockholders sold a total of 5,988,624 shares of common stock(inclusive of 2,816,980 shares of common stock from the full exercise of the option granted to theunderwriters to purchase additional shares from certain of the selling stockholders). The initial publicoffering price of the shares sold in the offering was $18.00 per share. We did not receive any proceedsfrom the sale of shares by the selling stockholders. The total proceeds to us, net of underwriters’
- II-152 -
APPENDIX II FINANCIAL INFORMATION OF THE TUMI GROUP
discounts and commissions, were approximately $264.1 million. We used the net proceeds receivedfrom the IPO to repurchase all of our preferred stock and preferred equity interests and 277,778 sharesof our common stock owned by Doughty Hanson.
Subsequent to our IPO, we completed a secondary offering in November 2012 and another inApril 2013. These offerings, however, did not have any effect on the number of shares outstanding, asall shares in such offerings were sold by existing stockholders.
Since 2005, we have expanded our global presence by successfully implementing our growthstrategies, which have included opening additional company-owned stores and increasing wholesalepoints of distribution. Our net sales have grown from $165.0 million in 2005 to $467.4 million in 2013,representing a compound annual growth rate of 14%. This increase in net sales resulted primarily froman increase in the number of our company-owned stores from 25 as of January 1, 2005 to 130 as ofDecember 31, 2013, as well as an increase in average net sales per square foot in company-ownedstores from $642 for the year ended December 31, 2005 to $1,088 for the year ended December 31,2013, and continuous growth in our e-commerce business and international wholesale sales. Our abilityto expand our points of distribution and to grow our net sales in existing stores has been driven byincreasing demand for our products, as well as growing recognition of the Tumi brand. We haverecently increased our focus on our women’s line, which we estimate has grown from representingapproximately 9% of our net sales in 2008 to approximately 11% of our net sales in 2013, and onincreasing our overall online presence, for which net sales grew approximately 22% from 2012 to2013. Since 2006, Direct-to-Consumer e-commerce net sales per fiscal year have ranged from 12% to14% of total Direct-to-Consumer net sales.
Despite an industry-wide decrease in consumer purchases of discretionary products because ofthe financial crisis of 2008/2009, our performance remained strong, in part because our flexible operatingmodel enabled us to efficiently manage our operating expenses and quickly respond to changing businessconditions. Beginning in the fourth quarter of 2009, we began to see an increase in consumer visits,conversion and store productivity. As general business and economic conditions improved, businesstravel and consumer traffic and shopping increased, which contributed to a rebound in the performance ofour business. Our wholesale accounts began to restock inventories which had been depleted as a result ofcutbacks in wholesale orders in reaction to the economic crisis. We also increased our store developmentactivities which had been temporarily decelerated during the financial crisis. We believe many consumersdeferred purchases of our products during the financial crisis, and post-crisis sales appear to be increasingdue in part to these deferred purchases. We have grown at a compound annual growth rate of 14% in netsales and 17% in operating income from 2005 through 2013. Our return to a high-growth model in 2010and through 2013 was attributable to the effective implementation of the elements of our growth strategyas well as the general improvement in economic conditions.
In recent years, the travel products industry has seen a trend in consumer preferences towardslighter-weight luggage and travel accessories, as well as merchandise that makes mobile computingand communication more convenient. In light of these trends, we have developed products that fulfillthose identified needs, such as our Vapor and Tegra-Lite lines. We have also developed a variety ofmobile electronic accessories designed for frequent travelers. We estimate that the accessories categoryhas grown from representing approximately 8% of our net sales in 2008 to 14% of our net sales in2013. Additionally, we have seen an increase in the relative percentage of our net sales derived fromour premium product line, and a decrease in the relative percentage of our net sales derived from ourcore product line in recent years.
- II-153 -
APPENDIX II FINANCIAL INFORMATION OF THE TUMI GROUP
We believe there is a significant opportunity to continue to expand our store base globally, andwe plan to add new company-owned and partner stores in upscale malls and prestige street venues. Weopened 17 new company-owned stores in the twelve months ended December 31, 2013. We expect toopen 18 to 22 company-owned stores in North America and Western Europe in each of 2014 and 2015while also expanding our online presence. Most of the locations we have identified for new company-owned stores are for full-price stores, while the remaining locations are for outlet stores. We alsobelieve there are opportunities to open additional stores in airport locations.
We believe we have the capacity to increase our Indirect-to-Consumer net sales, both inNorth America and internationally. In particular, we plan to continue to grow in key Asian markets,particularly China. Currently, more than one third of our net sales in the Asia-Pacific region are toChina, with Japan and South Korea being the next largest contributors. Additionally, Indirect-to-Consumer net sales in the Asia-Pacific region have more than tripled in the past five years. We alsoplan to increase the number of wholesale doors in key European markets including Germany, Franceand the United Kingdom, and to expand wholesale distribution in Central and South America, whilealso expanding our product portfolio offered in existing wholesale doors. We believe there is alsosignificant opportunity to open additional points of distribution in airport locations in many of theseregions. In North America, we expect to grow net sales by increasing our wholesale door presence,expanding our accessories business in department stores, increasing the variety of products available tothird party e-commerce providers and increasing penetration of the Canadian market throughdepartment stores, specialty stores, e-commerce sales and new distribution partners. Since 2008,Indirect-to-Consumer net sales have increased in EMEA, the Asia-Pacific region and North Americaand have decreased slightly in Central and South America.
We generally expect the payback of our investment in a new company-owned store to occur inless than two and a half years. We also believe we can increase our average net sales per square foot bycontinuing to improve store efficiency. Our new product development efforts help drive store trafficwhile our retail performance maximization program and associate training efforts contribute toimproved store efficiency. We also believe we can continue to increase our net sales by capitalizing onour flexible distribution model. For example, in 2010, we converted certain company-owned stores inthe Asia-Pacific region into wholesale distribution points in order to improve our operationaleffectiveness and profitability in that market. In particular, this enabled us to incentivize our localdistributors to accelerate store development in a manner that would optimize net sales. We willcontinue to look for ways to improve our capital efficiency in both current and new markets in thefuture.
One-time charges
Pursuant to an amended and restated letter agreement dated July 8, 2009, Jerome Griffith, ourChief Executive Officer, President and Director, was entitled to receive a one-time special bonus uponthe consummation of a qualified sale event or initial public offering that resulted in an enterprise valueof our company of $600.0 million or greater. Mr. Griffith received a special bonus payment of $5.5million (pre-tax) in connection with the IPO. We recorded this compensation expense during thesecond quarter of 2012, which thereby reduced operating income and net income. In addition, theCompany incurred $0.6 and $0.5 million in one-time costs associated with our secondary offeringscompleted in November 2012 and April 2013, respectively, which included legal and accounting costsand various other fees associated with these offerings.
- II-154 -
APPENDIX II FINANCIAL INFORMATION OF THE TUMI GROUP
Pursuant to the Company’s agreement with its current web services provider, the Companyserved an early termination notice to said provider in the second quarter of 2013 and accrued a$1,500,000 (pre-tax) early termination fee pursuant to the terms of this agreement. This amount waspaid in December 2013. The original agreement was scheduled to expire on December 31, 2015. TheCompany intends to transition its web stores to a more efficient and cost effective technology platformduring 2014. The Company will continue using its current provider’s services until such time.
Key Performance Indicators
Key performance indicators that we use to manage our business and evaluate our financialresults and operating performance include adjusted EBITDA and average net sales per square foot.Adjusted EBITDA provides us with a measure of our financial performance that we use to evaluateprofitability. In addition, we have historically used adjusted EBITDA in determining our incentivecompensation. Average net sales per square foot, which relates to company-owned stores only,provides us with a measure to evaluate our store sales trends and to assess the operational performanceof our stores. These measures are supplemented by a number of non-financial operating metrics relatedto store performance, which provide benchmarks against which to evaluate store efficiencies but arenot considered by management to be reliable financial metrics.
Adjusted EBITDA and net income before preferred dividend expense (non-cash) are non-GAAP financial measures. Adjusted EBITDA is defined as net income plus dividend expense onmandatorily redeemable preferred stock and preferred equity interests, interest expense, provision forincome taxes, depreciation and amortization, loss on disposal of fixed assets and other specified non-cash charges. Net income before preferred dividend expense (non-cash) is defined as net income plusdividend expense on mandatorily redeemable preferred stock and preferred equity interests. AdjustedEBITDA and net income before preferred dividend expense (non-cash) are not measures of operatingincome or operating performance presented in accordance with U.S. GAAP.
Adjusted EBITDA and net income before preferred dividend expense (non-cash) are importantsupplemental measures of our internal reporting, including for our board of directors and management,and are key measures we use to evaluate profitability and operating performance. Historically, ourincentive compensation plan has been based on the attainment of certain adjusted EBITDA objectives.Additionally, adjusted EBITDA and net income before preferred dividend expense (non-cash), whenviewed in conjunction with our consolidated financial statements, provide investors and other users ofour financial information consistency and comparability with our past financial performance, facilitateperiod-to-period comparisons of operating performance and facilitate comparisons with othercompanies. We use these metrics in conjunction with U.S. GAAP operating performance measures aspart of our overall assessment of our performance. U.S. GAAP measures of performance remain ourprimary means of assessing our overall financial results.
Undue reliance should not be placed on these measures as our only measures of operatingperformance. Adjusted EBITDA and net income before preferred dividend expense (non-cash) havelimitations as analytical tools. When assessing our operating performance, investors should notconsider adjusted EBITDA and net income before preferred dividend expense (non-cash) in isolationor as substitutes for net income.
Adjusted EBITDA increased by approximately $17.2 million, or 20%, to $102.1 million for theyear ended December 31, 2013 from $84.9 million for the year ended December 31, 2012. This
- II-155 -
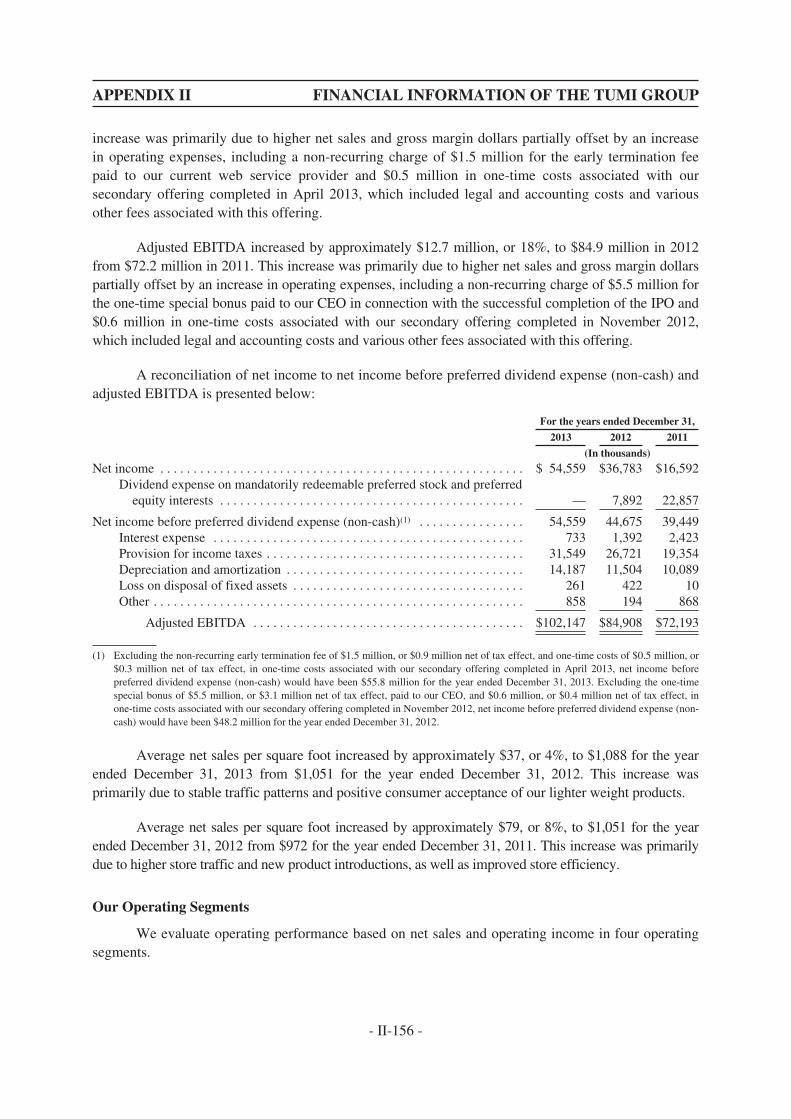
APPENDIX II FINANCIAL INFORMATION OF THE TUMI GROUP
increase was primarily due to higher net sales and gross margin dollars partially offset by an increasein operating expenses, including a non-recurring charge of $1.5 million for the early termination feepaid to our current web service provider and $0.5 million in one-time costs associated with oursecondary offering completed in April 2013, which included legal and accounting costs and variousother fees associated with this offering.
Adjusted EBITDA increased by approximately $12.7 million, or 18%, to $84.9 million in 2012from $72.2 million in 2011. This increase was primarily due to higher net sales and gross margin dollarspartially offset by an increase in operating expenses, including a non-recurring charge of $5.5 million forthe one-time special bonus paid to our CEO in connection with the successful completion of the IPO and$0.6 million in one-time costs associated with our secondary offering completed in November 2012,which included legal and accounting costs and various other fees associated with this offering.
A reconciliation of net income to net income before preferred dividend expense (non-cash) andadjusted EBITDA is presented below:
For the years ended December 31,
2013 2012 2011
(In thousands)
Net income . . . . . . . . . . . . . . . . . . . . . . . . . . . . . . . . . . . . . . . . . . . . . . . . . . . . . . . $ 54,559 $36,783 $16,592Dividend expense on mandatorily redeemable preferred stock and preferred
equity interests . . . . . . . . . . . . . . . . . . . . . . . . . . . . . . . . . . . . . . . . . . . . . . — 7,892 22,857
Net income before preferred dividend expense (non-cash)(1) . . . . . . . . . . . . . . . . 54,559 44,675 39,449Interest expense . . . . . . . . . . . . . . . . . . . . . . . . . . . . . . . . . . . . . . . . . . . . . . . 733 1,392 2,423Provision for income taxes . . . . . . . . . . . . . . . . . . . . . . . . . . . . . . . . . . . . . . . 31,549 26,721 19,354Depreciation and amortization . . . . . . . . . . . . . . . . . . . . . . . . . . . . . . . . . . . . 14,187 11,504 10,089Loss on disposal of fixed assets . . . . . . . . . . . . . . . . . . . . . . . . . . . . . . . . . . . 261 422 10Other . . . . . . . . . . . . . . . . . . . . . . . . . . . . . . . . . . . . . . . . . . . . . . . . . . . . . . . . 858 194 868
Adjusted EBITDA . . . . . . . . . . . . . . . . . . . . . . . . . . . . . . . . . . . . . . . . . $102,147 $84,908 $72,193
(1) Excluding the non-recurring early termination fee of $1.5 million, or $0.9 million net of tax effect, and one-time costs of $0.5 million, or$0.3 million net of tax effect, in one-time costs associated with our secondary offering completed in April 2013, net income beforepreferred dividend expense (non-cash) would have been $55.8 million for the year ended December 31, 2013. Excluding the one-timespecial bonus of $5.5 million, or $3.1 million net of tax effect, paid to our CEO, and $0.6 million, or $0.4 million net of tax effect, inone-time costs associated with our secondary offering completed in November 2012, net income before preferred dividend expense (non-cash) would have been $48.2 million for the year ended December 31, 2012.
Average net sales per square foot increased by approximately $37, or 4%, to $1,088 for the yearended December 31, 2013 from $1,051 for the year ended December 31, 2012. This increase wasprimarily due to stable traffic patterns and positive consumer acceptance of our lighter weight products.
Average net sales per square foot increased by approximately $79, or 8%, to $1,051 for the yearended December 31, 2012 from $972 for the year ended December 31, 2011. This increase was primarilydue to higher store traffic and new product introductions, as well as improved store efficiency.
Our Operating Segments
We evaluate operating performance based on net sales and operating income in four operatingsegments.
- II-156 -

APPENDIX II FINANCIAL INFORMATION OF THE TUMI GROUP
Direct-to-Consumer North America
As of December 31, 2013, we sold our products directly to consumers through a network of114 company-owned retail stores consisting of full-price stores and outlet stores strategicallypositioned in high-end retail malls or street venues. We also sell our products directly to consumersthrough our e-commerce website.
Direct-to-Consumer International
As of December 31, 2013, we sold directly to consumers through a network of 16 company-owned full-price and outlet stores in high-end street venues and select malls in international locations.We also sell our products directly to consumers through our two international e-commerce websites.
Indirect-to-Consumer North America
As of December 31, 2013, we sold to wholesale customers in North America throughapproximately 800 doors, including specialty luggage retailers, prestige department stores andbusiness-to-business channels. Many of our wholesale customers also operate their own e-commercewebsites through which they sell our products. Our products are also sold in partner stores, operated bylocal distributors or retailers, that carry only Tumi products and are governed by strict operatingguidelines that we dictate.
Indirect-to-Consumer International
As of December 31, 2013, we sold our products to international wholesale customers throughapproximately 1,000 doors, approximately 55% of which are in the EMEA region, 40% of which are inthe Asia-Pacific region, and 5% of which are in Central and South America. We have distributionchannels in Australia, China, Europe, Hong Kong, the Middle East, South Africa, South Korea,Southeast Asia and Taiwan, among others. Our products are also sold in partner stores, operated bylocal distributors or retailers, that carry only Tumi products and are governed by strict operatingguidelines that we dictate. We also operate concessions in department stores throughout Europe andthe Middle East. Many of our wholesale customers also operate their own e-commerce websitesthrough which they sell our products.
Certain corporate expenses are not specifically allocated to individual operating segments, suchas product design and development, certain general and administrative, certain marketing, shipping,warehouse and other expenses.
For an explanation of the financial statement components discussed in this section, see“—Financial Statement Components” and Note 1 to our audited consolidated financial statements.
- II-157 -
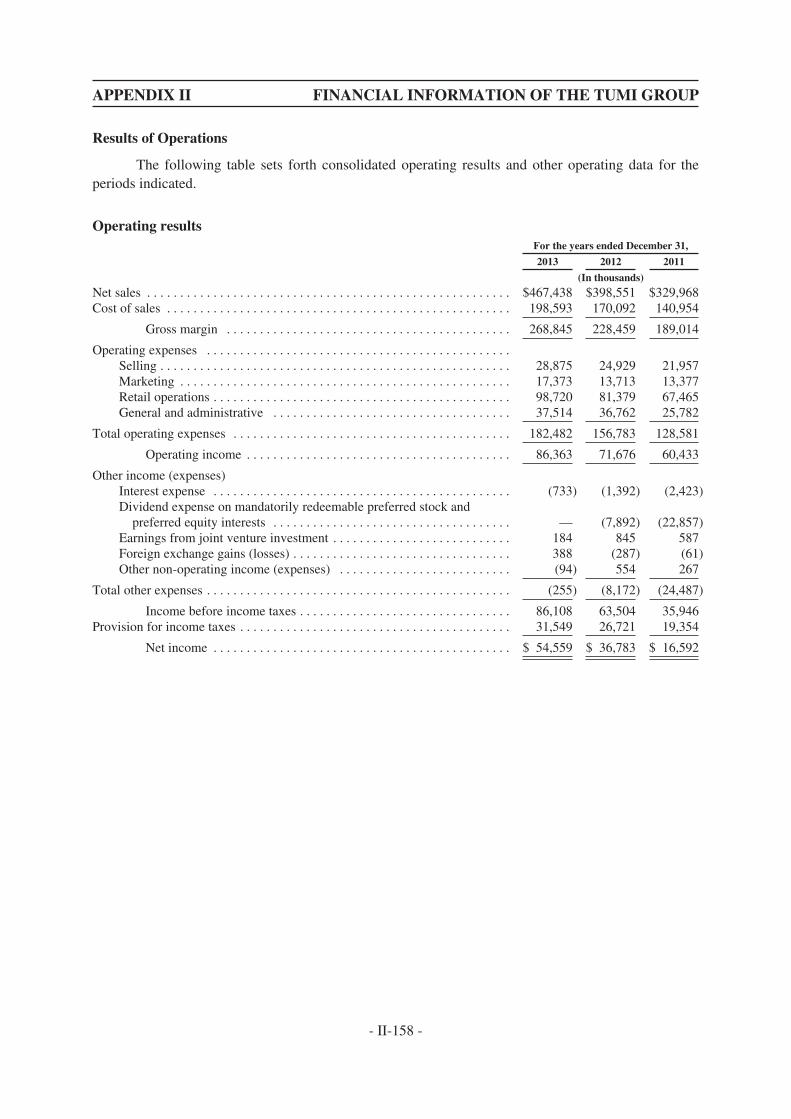
APPENDIX II FINANCIAL INFORMATION OF THE TUMI GROUP
Results of Operations
The following table sets forth consolidated operating results and other operating data for theperiods indicated.
Operating resultsFor the years ended December 31,
2013 2012 2011
(In thousands)
Net sales . . . . . . . . . . . . . . . . . . . . . . . . . . . . . . . . . . . . . . . . . . . . . . . . . . . . . . . $467,438 $398,551 $329,968Cost of sales . . . . . . . . . . . . . . . . . . . . . . . . . . . . . . . . . . . . . . . . . . . . . . . . . . . . 198,593 170,092 140,954
Gross margin . . . . . . . . . . . . . . . . . . . . . . . . . . . . . . . . . . . . . . . . . . . 268,845 228,459 189,014
Operating expenses . . . . . . . . . . . . . . . . . . . . . . . . . . . . . . . . . . . . . . . . . . . . . .Selling . . . . . . . . . . . . . . . . . . . . . . . . . . . . . . . . . . . . . . . . . . . . . . . . . . . . . 28,875 24,929 21,957Marketing . . . . . . . . . . . . . . . . . . . . . . . . . . . . . . . . . . . . . . . . . . . . . . . . . . 17,373 13,713 13,377Retail operations . . . . . . . . . . . . . . . . . . . . . . . . . . . . . . . . . . . . . . . . . . . . . 98,720 81,379 67,465General and administrative . . . . . . . . . . . . . . . . . . . . . . . . . . . . . . . . . . . . 37,514 36,762 25,782
Total operating expenses . . . . . . . . . . . . . . . . . . . . . . . . . . . . . . . . . . . . . . . . . . 182,482 156,783 128,581
Operating income . . . . . . . . . . . . . . . . . . . . . . . . . . . . . . . . . . . . . . . . 86,363 71,676 60,433
Other income (expenses)Interest expense . . . . . . . . . . . . . . . . . . . . . . . . . . . . . . . . . . . . . . . . . . . . . (733) (1,392) (2,423)Dividend expense on mandatorily redeemable preferred stock and
preferred equity interests . . . . . . . . . . . . . . . . . . . . . . . . . . . . . . . . . . . . — (7,892) (22,857)Earnings from joint venture investment . . . . . . . . . . . . . . . . . . . . . . . . . . . 184 845 587Foreign exchange gains (losses) . . . . . . . . . . . . . . . . . . . . . . . . . . . . . . . . . 388 (287) (61)Other non-operating income (expenses) . . . . . . . . . . . . . . . . . . . . . . . . . . (94) 554 267
Total other expenses . . . . . . . . . . . . . . . . . . . . . . . . . . . . . . . . . . . . . . . . . . . . . . (255) (8,172) (24,487)
Income before income taxes . . . . . . . . . . . . . . . . . . . . . . . . . . . . . . . . 86,108 63,504 35,946Provision for income taxes . . . . . . . . . . . . . . . . . . . . . . . . . . . . . . . . . . . . . . . . . 31,549 26,721 19,354
Net income . . . . . . . . . . . . . . . . . . . . . . . . . . . . . . . . . . . . . . . . . . . . . $ 54,559 $ 36,783 $ 16,592
- II-158 -
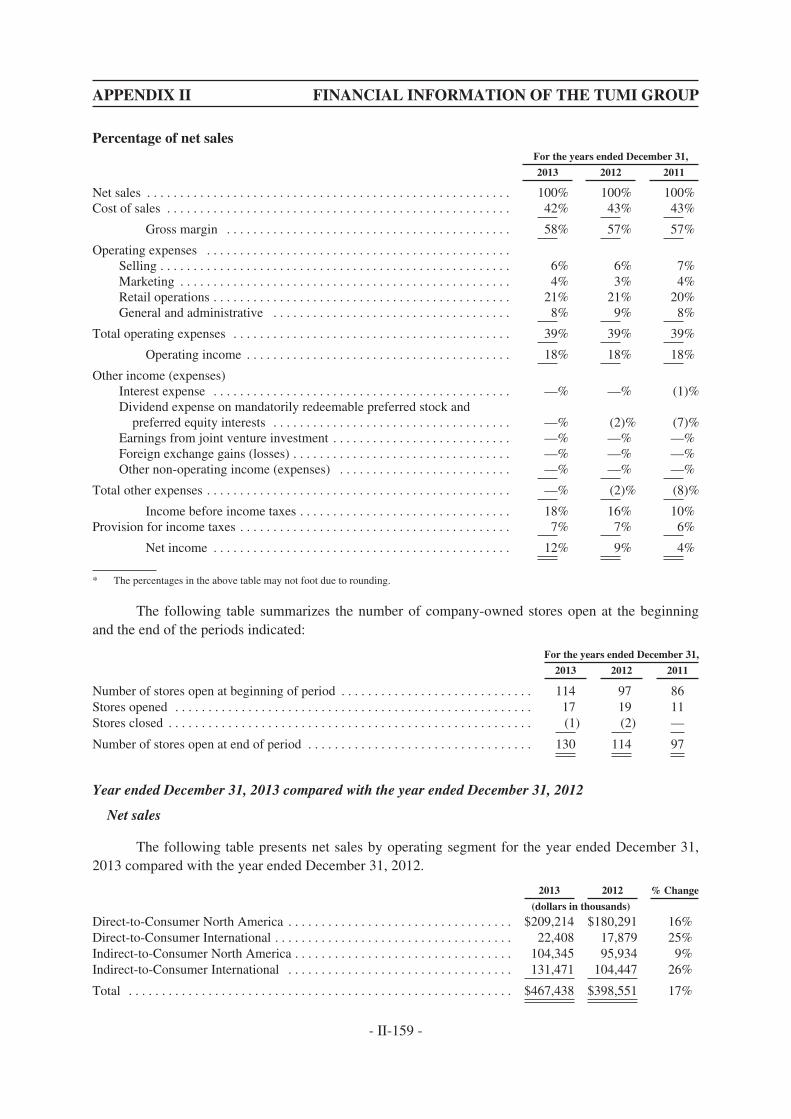
APPENDIX II FINANCIAL INFORMATION OF THE TUMI GROUP
Percentage of net salesFor the years ended December 31,
2013 2012 2011
Net sales . . . . . . . . . . . . . . . . . . . . . . . . . . . . . . . . . . . . . . . . . . . . . . . . . . . . . . . 100% 100% 100%Cost of sales . . . . . . . . . . . . . . . . . . . . . . . . . . . . . . . . . . . . . . . . . . . . . . . . . . . . 42% 43% 43%
Gross margin . . . . . . . . . . . . . . . . . . . . . . . . . . . . . . . . . . . . . . . . . . . 58% 57% 57%
Operating expenses . . . . . . . . . . . . . . . . . . . . . . . . . . . . . . . . . . . . . . . . . . . . . .Selling . . . . . . . . . . . . . . . . . . . . . . . . . . . . . . . . . . . . . . . . . . . . . . . . . . . . . 6% 6% 7%Marketing . . . . . . . . . . . . . . . . . . . . . . . . . . . . . . . . . . . . . . . . . . . . . . . . . . 4% 3% 4%Retail operations . . . . . . . . . . . . . . . . . . . . . . . . . . . . . . . . . . . . . . . . . . . . . 21% 21% 20%General and administrative . . . . . . . . . . . . . . . . . . . . . . . . . . . . . . . . . . . . 8% 9% 8%
Total operating expenses . . . . . . . . . . . . . . . . . . . . . . . . . . . . . . . . . . . . . . . . . . 39% 39% 39%
Operating income . . . . . . . . . . . . . . . . . . . . . . . . . . . . . . . . . . . . . . . . 18% 18% 18%
Other income (expenses)Interest expense . . . . . . . . . . . . . . . . . . . . . . . . . . . . . . . . . . . . . . . . . . . . . —% —% (1)%Dividend expense on mandatorily redeemable preferred stock and
preferred equity interests . . . . . . . . . . . . . . . . . . . . . . . . . . . . . . . . . . . . —% (2)% (7)%Earnings from joint venture investment . . . . . . . . . . . . . . . . . . . . . . . . . . . —% —% —%Foreign exchange gains (losses) . . . . . . . . . . . . . . . . . . . . . . . . . . . . . . . . . —% —% —%Other non-operating income (expenses) . . . . . . . . . . . . . . . . . . . . . . . . . . —% —% —%
Total other expenses . . . . . . . . . . . . . . . . . . . . . . . . . . . . . . . . . . . . . . . . . . . . . . —% (2)% (8)%
Income before income taxes . . . . . . . . . . . . . . . . . . . . . . . . . . . . . . . . 18% 16% 10%Provision for income taxes . . . . . . . . . . . . . . . . . . . . . . . . . . . . . . . . . . . . . . . . . 7% 7% 6%
Net income . . . . . . . . . . . . . . . . . . . . . . . . . . . . . . . . . . . . . . . . . . . . . 12% 9% 4%
* The percentages in the above table may not foot due to rounding.
The following table summarizes the number of company-owned stores open at the beginningand the end of the periods indicated:
For the years ended December 31,
2013 2012 2011
Number of stores open at beginning of period . . . . . . . . . . . . . . . . . . . . . . . . . . . . . 114 97 86Stores opened . . . . . . . . . . . . . . . . . . . . . . . . . . . . . . . . . . . . . . . . . . . . . . . . . . . . . . 17 19 11Stores closed . . . . . . . . . . . . . . . . . . . . . . . . . . . . . . . . . . . . . . . . . . . . . . . . . . . . . . . (1) (2) —
Number of stores open at end of period . . . . . . . . . . . . . . . . . . . . . . . . . . . . . . . . . . 130 114 97
Year ended December 31, 2013 compared with the year ended December 31, 2012
Net sales
The following table presents net sales by operating segment for the year ended December 31,2013 compared with the year ended December 31, 2012.
2013 2012 % Change
(dollars in thousands)
Direct-to-Consumer North America . . . . . . . . . . . . . . . . . . . . . . . . . . . . . . . . . . $209,214 $180,291 16%Direct-to-Consumer International . . . . . . . . . . . . . . . . . . . . . . . . . . . . . . . . . . . . 22,408 17,879 25%Indirect-to-Consumer North America . . . . . . . . . . . . . . . . . . . . . . . . . . . . . . . . . 104,345 95,934 9%Indirect-to-Consumer International . . . . . . . . . . . . . . . . . . . . . . . . . . . . . . . . . . 131,471 104,447 26%
Total . . . . . . . . . . . . . . . . . . . . . . . . . . . . . . . . . . . . . . . . . . . . . . . . . . . . . . . . . . $467,438 $398,551 17%
- II-159 -
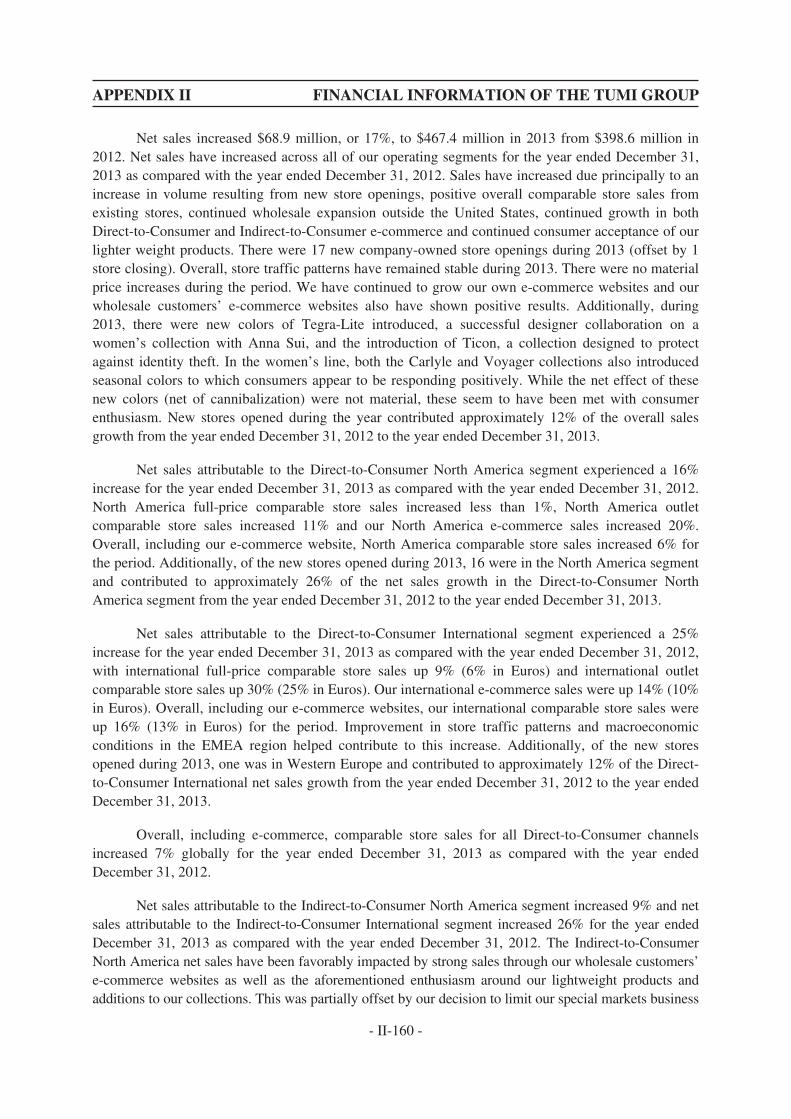
APPENDIX II FINANCIAL INFORMATION OF THE TUMI GROUP
Net sales increased $68.9 million, or 17%, to $467.4 million in 2013 from $398.6 million in2012. Net sales have increased across all of our operating segments for the year ended December 31,2013 as compared with the year ended December 31, 2012. Sales have increased due principally to anincrease in volume resulting from new store openings, positive overall comparable store sales fromexisting stores, continued wholesale expansion outside the United States, continued growth in bothDirect-to-Consumer and Indirect-to-Consumer e-commerce and continued consumer acceptance of ourlighter weight products. There were 17 new company-owned store openings during 2013 (offset by 1store closing). Overall, store traffic patterns have remained stable during 2013. There were no materialprice increases during the period. We have continued to grow our own e-commerce websites and ourwholesale customers’ e-commerce websites also have shown positive results. Additionally, during2013, there were new colors of Tegra-Lite introduced, a successful designer collaboration on awomen’s collection with Anna Sui, and the introduction of Ticon, a collection designed to protectagainst identity theft. In the women’s line, both the Carlyle and Voyager collections also introducedseasonal colors to which consumers appear to be responding positively. While the net effect of thesenew colors (net of cannibalization) were not material, these seem to have been met with consumerenthusiasm. New stores opened during the year contributed approximately 12% of the overall salesgrowth from the year ended December 31, 2012 to the year ended December 31, 2013.
Net sales attributable to the Direct-to-Consumer North America segment experienced a 16%increase for the year ended December 31, 2013 as compared with the year ended December 31, 2012.North America full-price comparable store sales increased less than 1%, North America outletcomparable store sales increased 11% and our North America e-commerce sales increased 20%.Overall, including our e-commerce website, North America comparable store sales increased 6% forthe period. Additionally, of the new stores opened during 2013, 16 were in the North America segmentand contributed to approximately 26% of the net sales growth in the Direct-to-Consumer NorthAmerica segment from the year ended December 31, 2012 to the year ended December 31, 2013.
Net sales attributable to the Direct-to-Consumer International segment experienced a 25%increase for the year ended December 31, 2013 as compared with the year ended December 31, 2012,with international full-price comparable store sales up 9% (6% in Euros) and international outletcomparable store sales up 30% (25% in Euros). Our international e-commerce sales were up 14% (10%in Euros). Overall, including our e-commerce websites, our international comparable store sales wereup 16% (13% in Euros) for the period. Improvement in store traffic patterns and macroeconomicconditions in the EMEA region helped contribute to this increase. Additionally, of the new storesopened during 2013, one was in Western Europe and contributed to approximately 12% of the Direct-to-Consumer International net sales growth from the year ended December 31, 2012 to the year endedDecember 31, 2013.
Overall, including e-commerce, comparable store sales for all Direct-to-Consumer channelsincreased 7% globally for the year ended December 31, 2013 as compared with the year endedDecember 31, 2012.
Net sales attributable to the Indirect-to-Consumer North America segment increased 9% and netsales attributable to the Indirect-to-Consumer International segment increased 26% for the year endedDecember 31, 2013 as compared with the year ended December 31, 2012. The Indirect-to-ConsumerNorth America net sales have been favorably impacted by strong sales through our wholesale customers’e-commerce websites as well as the aforementioned enthusiasm around our lightweight products andadditions to our collections. This was partially offset by our decision to limit our special markets business
- II-160 -
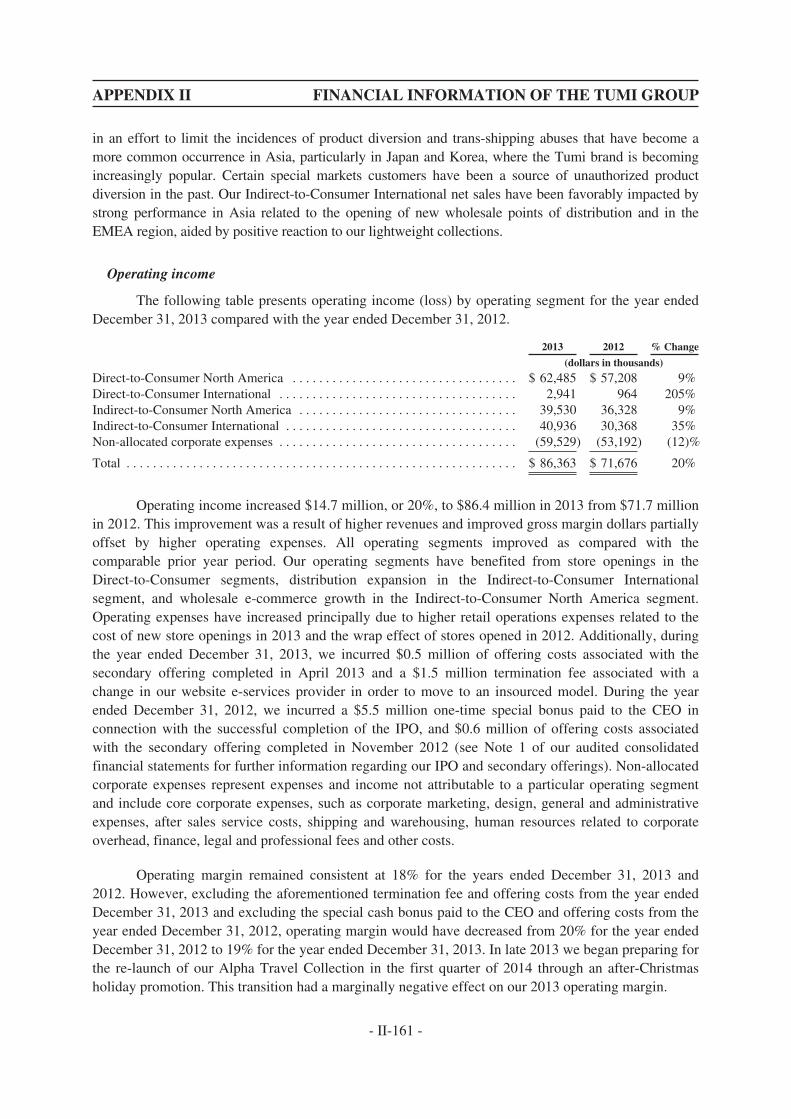
APPENDIX II FINANCIAL INFORMATION OF THE TUMI GROUP
in an effort to limit the incidences of product diversion and trans-shipping abuses that have become amore common occurrence in Asia, particularly in Japan and Korea, where the Tumi brand is becomingincreasingly popular. Certain special markets customers have been a source of unauthorized productdiversion in the past. Our Indirect-to-Consumer International net sales have been favorably impacted bystrong performance in Asia related to the opening of new wholesale points of distribution and in theEMEA region, aided by positive reaction to our lightweight collections.
Operating income
The following table presents operating income (loss) by operating segment for the year endedDecember 31, 2013 compared with the year ended December 31, 2012.
2013 2012 % Change
(dollars in thousands)
Direct-to-Consumer North America . . . . . . . . . . . . . . . . . . . . . . . . . . . . . . . . . . $ 62,485 $ 57,208 9%Direct-to-Consumer International . . . . . . . . . . . . . . . . . . . . . . . . . . . . . . . . . . . . 2,941 964 205%Indirect-to-Consumer North America . . . . . . . . . . . . . . . . . . . . . . . . . . . . . . . . . 39,530 36,328 9%Indirect-to-Consumer International . . . . . . . . . . . . . . . . . . . . . . . . . . . . . . . . . . . 40,936 30,368 35%Non-allocated corporate expenses . . . . . . . . . . . . . . . . . . . . . . . . . . . . . . . . . . . . (59,529) (53,192) (12)%
Total . . . . . . . . . . . . . . . . . . . . . . . . . . . . . . . . . . . . . . . . . . . . . . . . . . . . . . . . . . . $ 86,363 $ 71,676 20%
Operating income increased $14.7 million, or 20%, to $86.4 million in 2013 from $71.7 millionin 2012. This improvement was a result of higher revenues and improved gross margin dollars partiallyoffset by higher operating expenses. All operating segments improved as compared with thecomparable prior year period. Our operating segments have benefited from store openings in theDirect-to-Consumer segments, distribution expansion in the Indirect-to-Consumer Internationalsegment, and wholesale e-commerce growth in the Indirect-to-Consumer North America segment.Operating expenses have increased principally due to higher retail operations expenses related to thecost of new store openings in 2013 and the wrap effect of stores opened in 2012. Additionally, duringthe year ended December 31, 2013, we incurred $0.5 million of offering costs associated with thesecondary offering completed in April 2013 and a $1.5 million termination fee associated with achange in our website e-services provider in order to move to an insourced model. During the yearended December 31, 2012, we incurred a $5.5 million one-time special bonus paid to the CEO inconnection with the successful completion of the IPO, and $0.6 million of offering costs associatedwith the secondary offering completed in November 2012 (see Note 1 of our audited consolidatedfinancial statements for further information regarding our IPO and secondary offerings). Non-allocatedcorporate expenses represent expenses and income not attributable to a particular operating segmentand include core corporate expenses, such as corporate marketing, design, general and administrativeexpenses, after sales service costs, shipping and warehousing, human resources related to corporateoverhead, finance, legal and professional fees and other costs.
Operating margin remained consistent at 18% for the years ended December 31, 2013 and2012. However, excluding the aforementioned termination fee and offering costs from the year endedDecember 31, 2013 and excluding the special cash bonus paid to the CEO and offering costs from theyear ended December 31, 2012, operating margin would have decreased from 20% for the year endedDecember 31, 2012 to 19% for the year ended December 31, 2013. In late 2013 we began preparing forthe re-launch of our Alpha Travel Collection in the first quarter of 2014 through an after-Christmasholiday promotion. This transition had a marginally negative effect on our 2013 operating margin.
- II-161 -
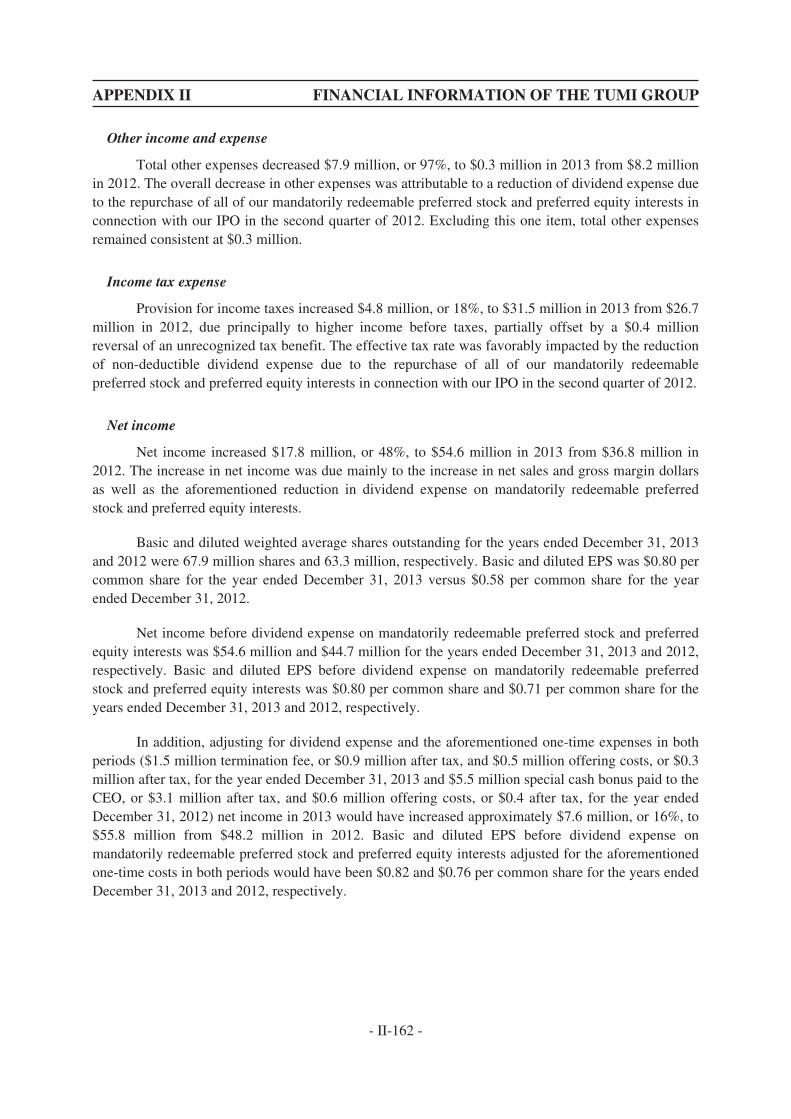
APPENDIX II FINANCIAL INFORMATION OF THE TUMI GROUP
Other income and expense
Total other expenses decreased $7.9 million, or 97%, to $0.3 million in 2013 from $8.2 millionin 2012. The overall decrease in other expenses was attributable to a reduction of dividend expense dueto the repurchase of all of our mandatorily redeemable preferred stock and preferred equity interests inconnection with our IPO in the second quarter of 2012. Excluding this one item, total other expensesremained consistent at $0.3 million.
Income tax expense
Provision for income taxes increased $4.8 million, or 18%, to $31.5 million in 2013 from $26.7million in 2012, due principally to higher income before taxes, partially offset by a $0.4 millionreversal of an unrecognized tax benefit. The effective tax rate was favorably impacted by the reductionof non-deductible dividend expense due to the repurchase of all of our mandatorily redeemablepreferred stock and preferred equity interests in connection with our IPO in the second quarter of 2012.
Net income
Net income increased $17.8 million, or 48%, to $54.6 million in 2013 from $36.8 million in2012. The increase in net income was due mainly to the increase in net sales and gross margin dollarsas well as the aforementioned reduction in dividend expense on mandatorily redeemable preferredstock and preferred equity interests.
Basic and diluted weighted average shares outstanding for the years ended December 31, 2013and 2012 were 67.9 million shares and 63.3 million, respectively. Basic and diluted EPS was $0.80 percommon share for the year ended December 31, 2013 versus $0.58 per common share for the yearended December 31, 2012.
Net income before dividend expense on mandatorily redeemable preferred stock and preferredequity interests was $54.6 million and $44.7 million for the years ended December 31, 2013 and 2012,respectively. Basic and diluted EPS before dividend expense on mandatorily redeemable preferredstock and preferred equity interests was $0.80 per common share and $0.71 per common share for theyears ended December 31, 2013 and 2012, respectively.
In addition, adjusting for dividend expense and the aforementioned one-time expenses in bothperiods ($1.5 million termination fee, or $0.9 million after tax, and $0.5 million offering costs, or $0.3million after tax, for the year ended December 31, 2013 and $5.5 million special cash bonus paid to theCEO, or $3.1 million after tax, and $0.6 million offering costs, or $0.4 after tax, for the year endedDecember 31, 2012) net income in 2013 would have increased approximately $7.6 million, or 16%, to$55.8 million from $48.2 million in 2012. Basic and diluted EPS before dividend expense onmandatorily redeemable preferred stock and preferred equity interests adjusted for the aforementionedone-time costs in both periods would have been $0.82 and $0.76 per common share for the years endedDecember 31, 2013 and 2012, respectively.
- II-162 -
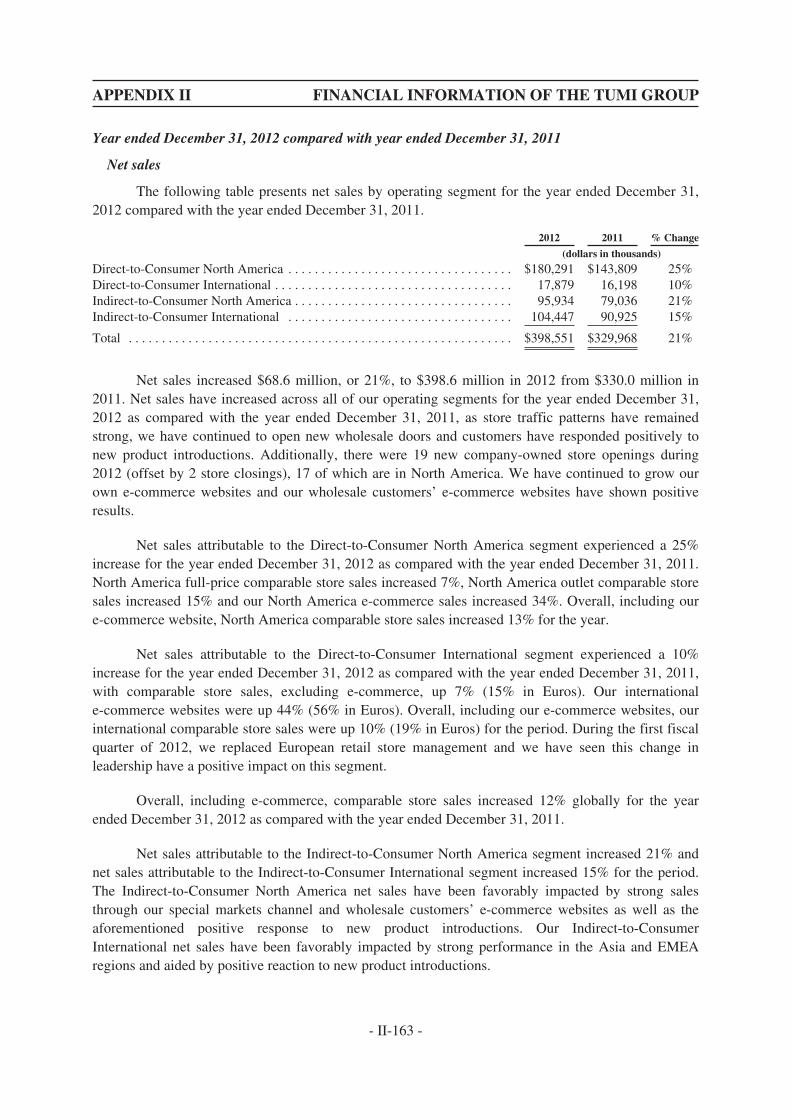
APPENDIX II FINANCIAL INFORMATION OF THE TUMI GROUP
Year ended December 31, 2012 compared with year ended December 31, 2011
Net sales
The following table presents net sales by operating segment for the year ended December 31,2012 compared with the year ended December 31, 2011.
2012 2011 % Change
(dollars in thousands)
Direct-to-Consumer North America . . . . . . . . . . . . . . . . . . . . . . . . . . . . . . . . . . $180,291 $143,809 25%Direct-to-Consumer International . . . . . . . . . . . . . . . . . . . . . . . . . . . . . . . . . . . . 17,879 16,198 10%Indirect-to-Consumer North America . . . . . . . . . . . . . . . . . . . . . . . . . . . . . . . . . 95,934 79,036 21%Indirect-to-Consumer International . . . . . . . . . . . . . . . . . . . . . . . . . . . . . . . . . . 104,447 90,925 15%
Total . . . . . . . . . . . . . . . . . . . . . . . . . . . . . . . . . . . . . . . . . . . . . . . . . . . . . . . . . . $398,551 $329,968 21%
Net sales increased $68.6 million, or 21%, to $398.6 million in 2012 from $330.0 million in2011. Net sales have increased across all of our operating segments for the year ended December 31,2012 as compared with the year ended December 31, 2011, as store traffic patterns have remainedstrong, we have continued to open new wholesale doors and customers have responded positively tonew product introductions. Additionally, there were 19 new company-owned store openings during2012 (offset by 2 store closings), 17 of which are in North America. We have continued to grow ourown e-commerce websites and our wholesale customers’ e-commerce websites have shown positiveresults.
Net sales attributable to the Direct-to-Consumer North America segment experienced a 25%increase for the year ended December 31, 2012 as compared with the year ended December 31, 2011.North America full-price comparable store sales increased 7%, North America outlet comparable storesales increased 15% and our North America e-commerce sales increased 34%. Overall, including oure-commerce website, North America comparable store sales increased 13% for the year.
Net sales attributable to the Direct-to-Consumer International segment experienced a 10%increase for the year ended December 31, 2012 as compared with the year ended December 31, 2011,with comparable store sales, excluding e-commerce, up 7% (15% in Euros). Our internationale-commerce websites were up 44% (56% in Euros). Overall, including our e-commerce websites, ourinternational comparable store sales were up 10% (19% in Euros) for the period. During the first fiscalquarter of 2012, we replaced European retail store management and we have seen this change inleadership have a positive impact on this segment.
Overall, including e-commerce, comparable store sales increased 12% globally for the yearended December 31, 2012 as compared with the year ended December 31, 2011.
Net sales attributable to the Indirect-to-Consumer North America segment increased 21% andnet sales attributable to the Indirect-to-Consumer International segment increased 15% for the period.The Indirect-to-Consumer North America net sales have been favorably impacted by strong salesthrough our special markets channel and wholesale customers’ e-commerce websites as well as theaforementioned positive response to new product introductions. Our Indirect-to-ConsumerInternational net sales have been favorably impacted by strong performance in the Asia and EMEAregions and aided by positive reaction to new product introductions.
- II-163 -
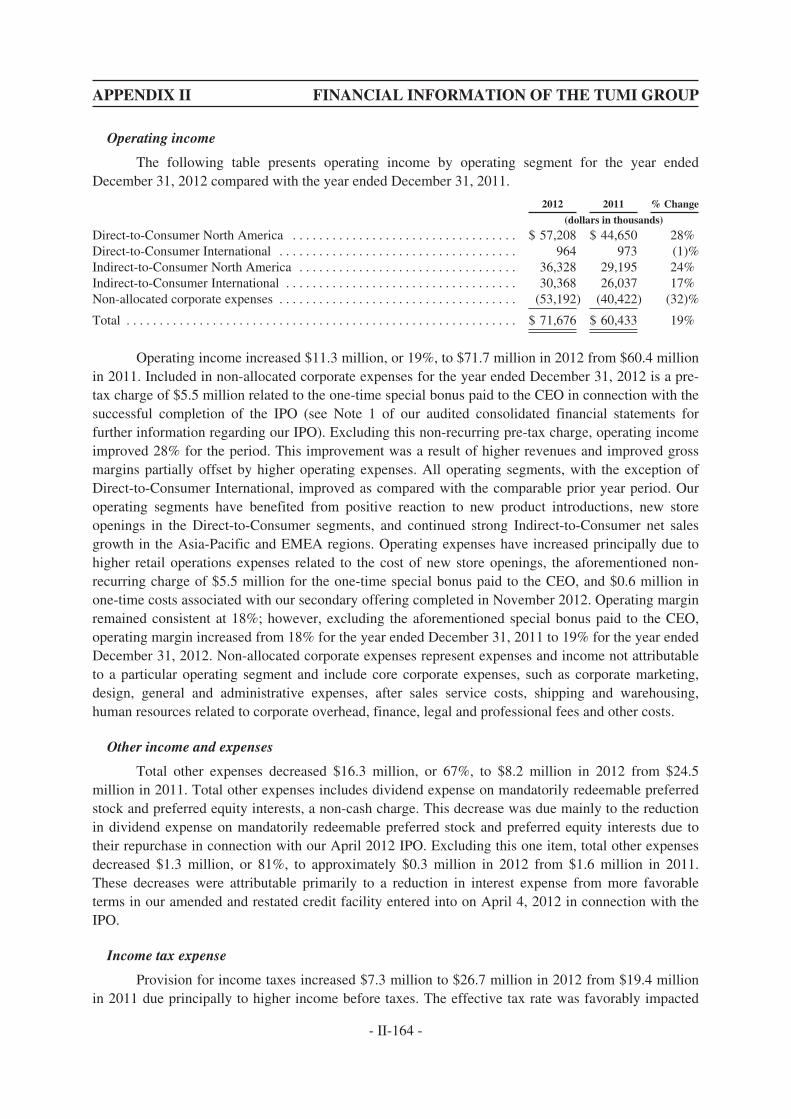
APPENDIX II FINANCIAL INFORMATION OF THE TUMI GROUP
Operating income
The following table presents operating income by operating segment for the year endedDecember 31, 2012 compared with the year ended December 31, 2011.
2012 2011 % Change
(dollars in thousands)
Direct-to-Consumer North America . . . . . . . . . . . . . . . . . . . . . . . . . . . . . . . . . . $ 57,208 $ 44,650 28%Direct-to-Consumer International . . . . . . . . . . . . . . . . . . . . . . . . . . . . . . . . . . . . 964 973 (1)%Indirect-to-Consumer North America . . . . . . . . . . . . . . . . . . . . . . . . . . . . . . . . . 36,328 29,195 24%Indirect-to-Consumer International . . . . . . . . . . . . . . . . . . . . . . . . . . . . . . . . . . . 30,368 26,037 17%Non-allocated corporate expenses . . . . . . . . . . . . . . . . . . . . . . . . . . . . . . . . . . . . (53,192) (40,422) (32)%
Total . . . . . . . . . . . . . . . . . . . . . . . . . . . . . . . . . . . . . . . . . . . . . . . . . . . . . . . . . . . $ 71,676 $ 60,433 19%
Operating income increased $11.3 million, or 19%, to $71.7 million in 2012 from $60.4 millionin 2011. Included in non-allocated corporate expenses for the year ended December 31, 2012 is a pre-tax charge of $5.5 million related to the one-time special bonus paid to the CEO in connection with thesuccessful completion of the IPO (see Note 1 of our audited consolidated financial statements forfurther information regarding our IPO). Excluding this non-recurring pre-tax charge, operating incomeimproved 28% for the period. This improvement was a result of higher revenues and improved grossmargins partially offset by higher operating expenses. All operating segments, with the exception ofDirect-to-Consumer International, improved as compared with the comparable prior year period. Ouroperating segments have benefited from positive reaction to new product introductions, new storeopenings in the Direct-to-Consumer segments, and continued strong Indirect-to-Consumer net salesgrowth in the Asia-Pacific and EMEA regions. Operating expenses have increased principally due tohigher retail operations expenses related to the cost of new store openings, the aforementioned non-recurring charge of $5.5 million for the one-time special bonus paid to the CEO, and $0.6 million inone-time costs associated with our secondary offering completed in November 2012. Operating marginremained consistent at 18%; however, excluding the aforementioned special bonus paid to the CEO,operating margin increased from 18% for the year ended December 31, 2011 to 19% for the year endedDecember 31, 2012. Non-allocated corporate expenses represent expenses and income not attributableto a particular operating segment and include core corporate expenses, such as corporate marketing,design, general and administrative expenses, after sales service costs, shipping and warehousing,human resources related to corporate overhead, finance, legal and professional fees and other costs.
Other income and expenses
Total other expenses decreased $16.3 million, or 67%, to $8.2 million in 2012 from $24.5million in 2011. Total other expenses includes dividend expense on mandatorily redeemable preferredstock and preferred equity interests, a non-cash charge. This decrease was due mainly to the reductionin dividend expense on mandatorily redeemable preferred stock and preferred equity interests due totheir repurchase in connection with our April 2012 IPO. Excluding this one item, total other expensesdecreased $1.3 million, or 81%, to approximately $0.3 million in 2012 from $1.6 million in 2011.These decreases were attributable primarily to a reduction in interest expense from more favorableterms in our amended and restated credit facility entered into on April 4, 2012 in connection with theIPO.
Income tax expense
Provision for income taxes increased $7.3 million to $26.7 million in 2012 from $19.4 millionin 2011 due principally to higher income before taxes. The effective tax rate was favorably impacted
- II-164 -
APPENDIX II FINANCIAL INFORMATION OF THE TUMI GROUP
by the reduction of dividend expense due to the repurchase of all of our mandatorily redeemablepreferred stock and preferred equity interests in connection with our IPO in the second quarter of 2012.
Net income
Net income increased $20.2 million, or 122%, to net income of $36.8 million in 2012 from netincome of $16.6 million in 2011. The increase in net income was due mainly to the increase in netsales and gross margin dollars as well as the reduction in dividend expense on mandatorily redeemablepreferred stock and preferred equity interests due to their repurchase in connection with our April 2012IPO.
Basic and diluted weighted average shares outstanding for the years ended December 31, 2012and 2011 were 63.3 million and 52.5 million shares, respectively. Basic and diluted earnings per sharewas $0.58 per share for the year ended December 31, 2012 versus $0.32 per share for the year endedDecember 31, 2011.
Net income before preferred dividend expense (non-cash) increased $5.3 million, or 13%, to$44.7 million in 2012 from $39.4 million in 2011. Basic and diluted earnings per share before dividendexpense on mandatorily redeemable preferred stock and preferred equity interests was $0.71 per shareand $0.75 per share for the years ended December 31, 2012 and 2011, respectively.
Seasonality
Our business is seasonal in nature and as a result, our net sales and working capitalrequirements fluctuate from quarter to quarter. Our fourth quarter is a significant period for our resultsof operations due to increased Direct-to-Consumer sales during the holiday season in North Americaand Europe. We expect inventory levels, along with an increase in accounts payable and accruedexpenses, to reach their highest levels in anticipation of the increased net sales during this period. In2013 and 2012, fourth quarter net sales represented approximately 32% of our total annual net sales.Operating income in the same periods represented approximately 37% and 41% of our total annualoperating income, respectively.
Liquidity and Capital Resources
Historically, our primary source of liquidity has been cash flows from operations. Our long-term credit facility has not historically been used to finance our capital requirements, but insteadrepresents remaining refinanced acquisition indebtedness originally incurred when Doughty Hansonand certain members of management at that time acquired the Company in 2004. We have from time totime drawn down on our revolving line of credit as short-term liquidity needs arise. We use our cashflows from operations to fund our store development activities.
Inflationary factors such as increases in the cost of sales, including raw materials costs andtransportation costs, may adversely affect our operating results. Although we do not believe thatinflation has had a material impact on our financial position to date, a high rate of inflation in the futuremay have an adverse effect on our ability to maintain our gross margin levels and our current levels ofselling expenses and general and administrative expenses as a percentage of net sales if the sale pricesof our products do not increase with any increase in cost of sales.
We believe we have sufficient working capital and liquidity to support our operations for atleast the next twelve months.
- II-165 -
APPENDIX II FINANCIAL INFORMATION OF THE TUMI GROUP
Cash and cash equivalents
At December 31, 2013, 2012 and 2011, we had cash and cash equivalents of $37.6 million,$36.7 million and $32.7 million, respectively. A summary of our cash flows provided by and used inoperating, investing and financing activities is presented below.
Cash flows from operating activities
Cash flows from operating activities consisted primarily of net income adjusted for certain non-cash items, including depreciation and amortization, share-based compensation expense, dividendexpense on mandatorily redeemable preferred stock and preferred equity interests and other non-cashcharges. Our cash flows from operations are largely dependent on sales to consumers and wholesalecustomers, which are in turn dependent on consumer confidence, store traffic, conversion, businesstravel and general economic conditions. We believe we have the ability to conserve liquidity wheneconomic conditions become less favorable through any number of strategies including curtailment ofstore expansion plans and cutting discretionary spending.
We generated cash flows from operations of $62.6 million and $48.0 million during the yearsended December 31, 2013 and 2012, respectively. The principal reason for this increase was theimprovement in net income.
We generated cash flows from operations of $48.0 million and $40.0 million during the yearsended December 31, 2012 and 2011, respectively. This increase was mainly due to higher net incomebefore preferred dividend expense (non-cash) in 2012 compared to 2011.
Investing activities
Cash flows used for investing activities consisted of capital expenditures for store expansionplans, store renovations, store openings, information technology infrastructure, distributioninfrastructure and product tooling costs.
Cash used for capital expenditures was $24.8 million and $20.9 million for the years endedDecember 31, 2013 and 2012, respectively. The increase was due principally to the investment in anew point of sale system, store openings, and the completion of our warehouse expansion project.
Cash used for capital expenditures was $20.9 million and $14.5 million for the years endedDecember 31, 2012 and 2011, respectively. The increase was due principally to additional storeopenings during 2012.
Financing activities
Cash flows used for financing activities was $37.0 million and $23.2 million for the yearsended December 31, 2013 and 2012, respectively. The increase was mainly attributable to the paydown of the revolving credit facility during 2013.
Cash flows used for financing activities was $23.2 million and $11.9 million for the yearsended December 31, 2012 and 2011, respectively. The increase was mainly attributable to additionalrepayments of bank debt and transaction costs related to the IPO.
- II-166 -
APPENDIX II FINANCIAL INFORMATION OF THE TUMI GROUP
Amended and restated credit facility
In connection with the IPO, on April 4, 2012, Tumi, Inc. and Tumi Stores, Inc. (the“Borrowers”) entered into an amended and restated credit facility (the “Amended Credit Facility”),with Wells Fargo Bank National Association (“Wells Fargo”) as lender and collateral agent.
On April 4, 2012, we had $60,000,000 outstanding on our then-current term loan facility and nobalance outstanding on our revolving credit facility for which the total capacity was $10,000,000. Wehad, however, utilized $250,000 under the revolving facility for letters of credit. Based on ourcalculated leverage ratio at the time, the facility bore interest at either the market LIBOR rate plus 175basis points or the prime rate plus 75 basis points.
The Amended Credit Facility consolidated the term loan facility and the revolving creditfacility previously provided in our former debt facility with Wells Fargo into a single $70,000,000senior secured revolving credit facility, with Wells Fargo as the sole lender, and extended the maturityof the facility until April 4, 2017. The Amended Credit Facility included a letter of credit sublimit notto exceed the undrawn amount of the revolving commitments.
On August 29, 2013, the Amended Credit Facility was amended to reduce the letter of creditsublimit to $5,000,000.
Borrowings under the Amended Credit Facility bear interest at a per annum rate equal to, at theBorrowers’ option, the one, two, three or six month (or such other period as Wells Fargo may agree)LIBOR rate plus a margin of 1.00% or 1.25%, or a base rate (the greater of (i) Wells Fargo’s prime ratein effect on such day and (ii) the federal funds rate plus 1/2 of 1.00%) plus a margin of zero or 0.25%.The Borrowers are required to pay an undrawn commitment fee equal to 0.15% or 0.20% of theundrawn portion of the commitments under the Amended Credit Facility, as well as customary letter ofcredit fees. The margin added to the LIBOR, or base rate, as well as the amount of the commitmentfee, depends on our leverage at the time. Interest is payable monthly, bi-monthly or quarterly onLIBOR rate loans depending on the interest period for each LIBOR rate loan, or quarterly on base rateloans.
As of December 31, 2013 and 2012, we had $8,000,000 and $45,000,000 outstanding under theAmended Credit Facility, respectively. As of December 31, 2013 and 2012, the facility bore interest atthe market LIBOR rate of 0.17% and 0.22%, respectively, plus 100 basis points. Letters of creditoutstanding at December 31, 2013 and 2012 totaled $286,000 under the facility and, accordingly, theunused portion of the facility was $61,714,000 and $24,714,000, respectively. The fee for the unusedportion of the facility was $70,000 and $18,000 for the years ended December 31, 2013 and 2012,respectively.
All obligations under the Amended Credit Facility are required to be guaranteed by each of theBorrowers’ material domestic subsidiaries, subject to certain exclusions. The obligations under theAmended Credit Facility are secured by substantially all of the Borrowers’ assets and, if applicable,those of the Borrowers’ subsidiary guarantors. Currently the Borrowers do not have any subsidiaryguarantors.
The Amended Credit Facility contains customary covenants, including, but not limited to,limitations on the ability of the Borrowers and their subsidiaries to incur additional debt and liens,dispose of assets, and make certain investments and restricted payments, including the prepayment of
- II-167 -
APPENDIX II FINANCIAL INFORMATION OF THE TUMI GROUP
certain debt and cash dividends. In addition, the Amended Credit Facility contains financial covenantsrequiring that the Borrowers maintain (a) a minimum ratio of consolidated adjusted EBITDA toconsolidated cash interest expense (as such terms are defined in the Amended Credit Facility) of notless than 4.00 to 1.00 and (b) a maximum ratio of consolidated total debt to consolidated adjustedEBITDA of no greater than 2.25 to 1.00. The Borrowers were in compliance in all material respectswith all such covenants as of December 31, 2013.
The Amended Credit Facility also contains customary events of default, including, but notlimited to, payment defaults, breaches of representations and warranties, covenant defaults, cross-defaults under material debt, certain events of bankruptcy and insolvency, defaults based on certainjudgments, failure of any material provision of any loan document to be in full force and effect, changeof control, and certain ERISA defaults. If an event of default were to occur and continue, amounts dueunder the Amended Credit Facility would be accelerated and the commitments to extend creditthereunder terminated, and the rights and remedies of Wells Fargo under the Amended Credit Facilityavailable under the applicable loan documents could be exercised, including rights with respect to thecollateral securing the obligations under the Amended Credit Facility.
The foregoing summaries of certain provisions of the Amended Credit Facility do not purportto be complete and are qualified in their entirety by reference to the full text of the Amended CreditFacility.
Contractual Obligations
The following table represents our obligations and commitments to make future paymentsunder contracts, such as lease agreements and debt obligations, and under contingent commitments asof December 31, 2013:
Payments due by period
Less than 1 year 1-3 years 3-5 yearsMore than
5 years Total
(in millions)
Minimum lease payments(1) . . . . . . . . . . . . . . . . . . . . . . $24.5 $43.5 $37.5 $70.4 $175.9Revolving credit facility(2) . . . . . . . . . . . . . . . . . . . . . . . — — 8.0 — 8.0Interest payments on credit facility(3) . . . . . . . . . . . . . . . 0.1 0.2 — — 0.3
Total . . . . . . . . . . . . . . . . . . . . . . . . . . . . . . . . . . . . . . . . $24.6 $43.7 $45.5 $70.4 $184.2
(1) Our store leases generally have initial lease terms of 10 years and include renewal options upon substantially the same terms andconditions as the original lease. We had no material construction commitments for leasehold improvements at December 31, 2013, 2012and 2011, respectively.
(2) In connection with the IPO in April 2012, we amended our former credit facility by entering into the Amended Credit Facility. See“—Liquidity and Capital Resources—Amended and restated credit facility.”
(3) Represents estimated future cash interest payments using the weighted average balance and interest rate at December 31, 2013.
Off-Balance Sheet Arrangements
We have not entered into any off-balance sheet arrangements.
Critical Accounting Policies and Estimates
Our discussion and analysis of financial condition and results of operations is based upon ouraudited consolidated financial statements which have been prepared in accordance with GAAP. The
- II-168 -

APPENDIX II FINANCIAL INFORMATION OF THE TUMI GROUP
preparation of these financial statements requires estimates and judgments that affect the reportedamounts of our assets, liabilities, net sales and operating expenses and related disclosure of contingentassets and liabilities. We base our estimates on historical experience and various other assumptions webelieve to be reasonable given the circumstances and we evaluate these estimates on an ongoing basis.Actual results may differ from these estimates under different assumptions or conditions.
We believe that our critical accounting policies and estimates require us to make difficult,subjective or complex judgments about matters that are inherently uncertain. See Note 1 to our auditedconsolidated financial statements, which are included elsewhere in this report, for a completediscussion of our significant accounting policies. The following reflect the significant estimates andjudgments used in the preparation of our consolidated financial statements.
Revenue recognition
Revenue is generated from the sale of our products and is classified as “net sales” in ourconsolidated statements of operations. We recognize revenue in our Direct-to-Consumer segment wheninventory is received by customers and the related title passes. In our Indirect-to-Consumer segments,revenue is recognized when inventory is in possession of our wholesale customers or their appointedcarriers, at which point the related title passes. Provisions for discounts, rebates to customers andreturns are recorded as a reduction of net sales in the same period as the related sale. Revenueassociated with gift cards is recognized upon redemption. Determining our provision for discounts,rebates and returns requires significant judgment based on historical information and estimates offuture activity.
Accounts receivable and allowance for doubtful accounts
We determine our allowance for doubtful accounts for accounts receivable by considering anumber of factors including the length of time trade receivables are past due, our previous loss history,our customer’s current ability to pay its obligation and the condition of the general economy and theindustry as a whole. Unanticipated events and circumstances may occur that affect the accuracy orvalidity of such assumptions, estimates or actual results.
Inventories
Inventories consist primarily of finished goods and are valued at the lower of cost or market.Cost is determined by the first-in, first-out method. Inventory includes material, labor, overhead,freight, and duty and is adjusted for allowances for slow-moving and obsolete inventory. Slow-movingand obsolete inventory is determined through an evaluation of both historical usage and expectedfuture demand.
Income taxes
We utilize the asset and liability method of accounting for income taxes, under which deferredincome taxes are recognized for the tax consequences of temporary differences by applying enactedstatutory tax rates applicable to future years to differences between the financial statement carryingamounts and the tax basis of existing assets and liabilities. The effect on deferred taxes of a change intax rates is recognized in net income in the period that includes the enactment date. A valuationallowance is provided when it is more likely than not that some portion or all of the deferred tax assetswill not be realized. In assessing the realizability of deferred tax assets, management considers whether
- II-169 -
APPENDIX II FINANCIAL INFORMATION OF THE TUMI GROUP
it is more likely than not that some portion or all of the deferred tax assets will not be realized. Theultimate realization of deferred tax assets is dependent upon the generation of future taxable incomeduring the periods in which those temporary differences become deductible.
We apply the provisions of the FASB’s guidance relating to uncertain tax positions. We utilizethe two step process to determine the amount of recognized tax benefit. For tax positions meeting themore-likely-than-not threshold, the amount recognized in the consolidated financial statements is thelargest benefit that has a greater than 50% likelihood of being realized upon ultimate settlement withthe relevant tax authority.
Goodwill and intangible assets
Goodwill represents the excess of the purchase price over the fair value of net assets acquired,including intangible assets. Indefinite-lived intangible assets consist of brand/trade name. Goodwilland brand/trade name are not being amortized in accordance with the provisions of the FASB’sguidance, which requires these assets to be tested for impairment annually and whenever events orchanges in circumstances indicate that the carrying value may not be recoverable. Our annualimpairment testing date is the first day of our fourth quarter. No impairment was recognized in theyears ended December 31, 2013, 2012 and 2011.
The quantitative goodwill impairment test, if necessary, is a two-step process. Under the first oftwo steps, the Company compares the fair value of a reporting unit to its carrying amount, includinggoodwill, to identify a potential impairment. If the fair value of the reporting unit is less than itscarrying value, an indication of goodwill impairment exists for such reporting unit and the enterprisemust perform step two of the impairment test to measure the impairment, if any. Under step two, animpairment loss is recognized for any excess of the carrying amount of the reporting unit’s goodwillover the implied fair value of that goodwill. The implied fair value of goodwill is determined byallocating the fair value of the reporting unit in a manner similar to a purchase price allocation: the fairvalue of the reporting unit is allocated to all of the assets and liabilities of that unit (including anyunrecognized intangible assets) and the residual fair value after this allocation is the implied fair valueof the reporting unit goodwill.
The Company uses techniques including discounted expected future cash flows (Level 3 input),or DCF, to test goodwill. Indefinite-lived intangible assets are tested for impairment through an incomeapproach known as the relief from royalty method. A discounted cash flow analysis calculates the fairvalue by estimating the after-tax cash flows attributable to a reporting unit or asset and thendiscounting the after-tax cash flows to a present value using a risk-adjusted discount rate. Assumptionsused in DCF and the relief from royalty method require the exercise of significant judgment includingjudgment about appropriate royalty rates, discount rates and terminal values, growth rates and theamount and timing of expected future cash flows. Although the Company believes the historicalassumptions and estimates made are reasonable and appropriate, different assumptions and estimatescould materially impact its reported financial results.
The Company’s reporting units for the purpose of goodwill impairment testing are ourreportable business segments: (i) Direct-to-Consumer North America, (ii) Indirect-to-Consumer NorthAmerica, (iii) Direct-to-Consumer International and (iv) Indirect-to-Consumer International. Thereporting units were determined in accordance with the guidance on reportable segments in FASB ASC280-10-50-1. There is no discrete financial information available to the Company for its operationsbelow our reportable business segments.
- II-170 -
APPENDIX II FINANCIAL INFORMATION OF THE TUMI GROUP
Warranties
We provide our customers with a product warranty subsequent to the sale of our products. Ourwarranty policy provides for one year of worry-free service as well as an additional warranty againstmanufacturers’ defects or flaws in construction for between two and five years, depending on theproduct line. We recognize estimated costs associated with the limited warranty at the time of sale ofour products. The warranty reserve is based on historical experience.
Recently Issued Accounting Pronouncements
In February 2013, the FASB issued ASU No. 2013-02, “Comprehensive Income (Topic 220):Reporting of Amounts Reclassified Out of Accumulated Comprehensive Income.” The new guidancerequires an entity to report the effect of significant reclassifications out of accumulated othercomprehensive income on the respective line items in net income if the amounts are required to bereclassified in their entirety to net income. For other amounts that are not required to be reclassified intheir entirety to net income in the same reporting period, an entity is required to cross-reference toother disclosures that provide additional detail about those amounts. The new guidance was effectiveprospectively for fiscal years and interim periods beginning after December 15, 2012, with earlyadoption permitted. The Company adopted the amended guidance effective January 1, 2013 and it didnot have a material effect on its consolidated financial statements.
In July 2013, the FASB issued ASU No. 2013-11, “Income Taxes (Topic 740): Presentation ofan Unrecognized Tax Benefit When a Net Operating Loss Carryforward, a Similar Tax Loss, or a TaxCredit Carryforward exists.” This amended guidance requires an entity to present an unrecognized taxbenefit as a reduction of a deferred tax asset for a net operating loss carry forward, a similar tax loss ora tax credit carry forward. If an applicable deferred tax asset is not available or a company does notexpect to use the applicable deferred tax asset, the unrecognized tax benefit should be presented as aliability in the financial statements and should not be combined with an unrelated deferred tax asset.The new guidance is effective prospectively for fiscal years and interim periods beginning afterDecember 15, 2013, with early adoption permitted. The Company does not expect the adoption of thisamended guidance to have a significant impact on its consolidated financial statements.
Financial Statement Components
Net sales
Net sales consists of revenue from the sale of products, less returns, discounts and allowancesand other offsets to net sales. In our Direct-to-Consumer segments, revenue is recognized when aconsumer purchase occurs and the consumer receives the merchandise. In our Indirect-to-Consumersegments, revenue is recognized when inventory is in possession of our wholesale customers or theirappointed carriers, at which point the related title passes. Provisions for discounts, rebates toconsumers and returns are recorded as a reduction of net sales in the same period as the related sale.Revenue associated with gift cards is recognized upon redemption. Revenue from gift cards and theamount of revenue recognized for gift cards not redeemed (“breakage”) is immaterial to our results ofoperations. Amounts billed to customers for delivery costs are classified as a component of net sales,and any other related delivery costs are classified as a component of cost of sales. Sales and valueadded tax collected from consumers and remitted to governmental authorities are accounted for on anet basis and are excluded from net sales on our consolidated results of operations.
- II-171 -
APPENDIX II FINANCIAL INFORMATION OF THE TUMI GROUP
Comparable store sales are calculated based on our company-owned stores that have been openfor at least a full calendar year as of the end of our annual reporting period. For example, a storeopened in October 2012 will not impact the comparable store comparison until January 1, 2014. Theremay be variations in the way in which some of our competitors and other retailers calculate comparableor “same store” sales. As a result, data in this Annual Report on Form 10-K regarding our comparablestore sales may not be comparable with similar data made available by other companies.
Cost of sales
Cost of sales includes the cost of finished goods purchased from our suppliers plus the cost offreight to deliver the product to our distribution centers, packaging and related duties and applicableoverhead incurred to bring the merchandise to its condition for sale. Gross margin is defined as netsales less the cost of sales.
Operating expenses
Operating expenses consist of selling, marketing, retail operations and general andadministrative expenses.
Selling. Selling expenses consist of wholesale-related salaries, benefits, commissions,incentive programs, concession fees, travel and entertainment, meetings and seminars and other sellingcosts and expenses, in each case related to our global wholesale business.
Marketing. Marketing expenses consist of in-store and consumer advertising, marketing-related salaries and benefits, travel and entertainment, lease-required advertising, consumer catalogs,market research and other consulting costs and expenses related to marketing.
Retail operations. Retail operations expenses include occupancy and staffing costs associatedwith our company-owned stores, store depreciation expense, operator fees for our e-commercewebsites, depreciation on point-of-sale fixtures, travel and entertainment, meetings and seminars,insurance and other related administrative costs and expenses.
General and administrative. General and administrative expenses consist of productdevelopment costs related to tools, dies, design and travel; shipping and distribution costs; costsassociated with running our global distribution network such as occupancy and employment expenses;costs associated with warranty and after-sales service such as employee and repair-related expensesand warranty claims; employee-related costs associated with our executive, finance, informationtechnology and human resource functions; costs associated with our corporate headquarters andproduct showrooms; and legal, tax and accounting fees.
Operating income
Operating income consists of gross margin less operating expenses, and excludes other incomeand expenses (i.e., non-operating income and expenses).
Other income (expenses)
Interest expense. Interest expense consists of interest payments made pursuant to ouramended and restated credit facility and our former credit and guaranty agreement with, among others,Wells Fargo, as well as amortization of deferred financing costs, net of minimal interest income.
- II-172 -
APPENDIX II FINANCIAL INFORMATION OF THE TUMI GROUP
Dividend expense on mandatorily redeemable preferred stock and preferred equity interests.Dividend expense on mandatorily redeemable preferred stock and preferred equity interests consistssolely of non-cash accrued preferred dividends on our mandatorily redeemable preferred stock andpreferred equity interests. These amounts had not been paid but were due upon redemption.
Earnings (losses) from joint venture investment. Earnings (losses) from joint ventureinvestment relate exclusively to Tumi Japan, a joint venture (corporation) in which we hold a 50%interest and which sells Tumi products in 12 retail stores and to various high-end wholesale customersin Japan.
Foreign exchange gains (losses). Foreign currency exposures arise in our branch offices andsubsidiaries in Europe where transactions are denominated in a currency other than the U.S. dollar.Gains and losses such as those resulting from the settlement of receivables and payables denominatedin foreign currency are included in the earnings of the current period in “foreign exchange gains(losses).” We are also exposed to foreign currency exchange rate fluctuations with respect to ourEuropean operations as a result of its U.S. dollar-denominated historical rate intercompany loanbalance. Prior to May 2007, we did not plan or anticipate the settlement of certain intercompanyforeign currency transactions and had considered the transactions to be of a long-term investmentnature. Because of refinements in our cash management strategies, we now anticipate settlement ofcertain amounts in the foreseeable future. Gains and losses on transactions that arise after May 2007, tothe extent they are considered current, are included in the determination of net income under foreignexchange gains (losses). We believe that exposure to adverse changes in exchange rates associatedwith revenues and expenses of our foreign branch offices and subsidiaries are immaterial to ourconsolidated financial statements.
Other non-operating income (expenses). Other non-operating income (expenses) includes allother non-operating income and expenses.
Provision for income taxes
We record income tax expenses related to federal, state, local and foreign income.
QUANTITATIVE AND QUALITATIVE DISCLOSURES ABOUT MARKET RISK
Market risk represents the risk of loss that may impact our financial position due to adversechanges in financial market prices and rates. Our market risk exposure is primarily a result offluctuations in foreign currency exchange rates and interest rates. We do not currently hold or issuefinancial instruments for trading purposes, although we have in the past entered into interest ratehedges for the purposes of limiting our exposure to fluctuations in interest rates.
Foreign currency exchange risk
Although the majority of our international net sales are billed and collected in U.S. dollars, ourEuropean sales are billed and collected in Euros, and we are therefore subject to risk associated withexchange rate fluctuations. During 2013, we recorded gains related to the exchange rate fluctuationeffect on remittances from our European affiliates and other transactions relating to our internationaloperations of $388,000. We recorded a $287,000 loss and a $61,000 loss in 2012 and 2011,respectively, related to the exchange rate fluctuation effect on those remittances. Because a portion ofour net sales (approximately 10% in each of 2013, 2012 and 2011) are denominated in Euros, exchange
- II-173 -
APPENDIX II FINANCIAL INFORMATION OF THE TUMI GROUP
rate fluctuations can have an impact on our reported net sales. For example, if the U.S. dollarstrengthens against the Euro, this could have a negative effect on our European operating results whenthose results are translated into U.S. dollars. Any hypothetical loss in net sales could be partially orcompletely offset by lower cost of sales and lower selling expenses and general and administrativeexpenses that are generated in Euros.
Substantially all of our purchases from our foreign suppliers are denominated in U.S. dollars. Aprecipitous decline in the value of the U.S. dollar could cause our foreign suppliers to seek priceincreases on the goods they supply to us. This could impact our gross margin if market conditionsprevent us from passing those costs on to consumers. We do not currently use the derivative markets tohedge foreign currency fluctuations but may in the future consider entering into derivative financialinstruments to mitigate losses associated with these risks. We do not, and do not intend to, engage inthe practice of trading derivative securities for profit.
Interest rate risk
In connection with the IPO, on April 4, 2012, Tumi, Inc. and Tumi Stores, Inc., entered into theAmended Credit Facility, with Wells Fargo as lender and as collateral agent. The Amended CreditFacility consolidated the term loan facility and the revolving credit facility previously provided in ourformer debt facility into a single $70,000,000 senior secured revolving credit facility. See “—Liquidityand Capital Resources—Amended and restated credit facility.”
Amended credit facility. Under the Amended Credit Facility, borrowings bear interest payablequarterly or, in the case of loans subject to the LIBOR rate, monthly, bi-monthly or quarterlydepending on the interest period for such loans. Borrowings under the Amended Credit Facility willbear interest at a per annum rate equal to, at our option, the one, two, three or six-month (or such otherperiod as Wells Fargo may agree) LIBOR rate plus a margin of 1.00% or 1.25%, or a base rate plus amargin of zero or 0.25%. The margin added to the LIBOR, or base rate, will depend on our leverage atthe time. Accordingly, under the Amended Credit Facility, we continue to be exposed to market riskfrom changes in the underlying variable interest rates, which affect our cost of borrowings. We willcarefully monitor the interest rates on our borrowings under the Amended Credit Facility.
We do not currently have any interest rate hedging activities in place, but we may in the futureengage in hedging activities, based on, among other things, market conditions. We do not, and do notintend to, engage in the practice of trading derivative securities for profit. A 10% increase in theapplicable interest rate would not have or have had a material effect on interest expense to us under ourformer credit facility or the Amended Credit Facility.
Inflation
Inflationary factors such as increases in the cost of sales, including raw materials costs andtransportation costs, may adversely affect our operating results. Although we do not believe thatinflation has had a material impact on our financial position to date, a high rate of inflation in the futuremay have an adverse effect on our ability to maintain our gross margin levels and our current levels ofselling expenses and general and administrative expenses as a percentage of net sales if the sale pricesof our products do not increase with any increase in cost of sales.
- II-174 -
APPENDIX II FINANCIAL INFORMATION OF THE TUMI GROUP
2. The following is an extract of the management discussion and analysis of the results of Tumifor the year ended December 31, 2014 from the 2014 annual report of Tumi.
MANAGEMENT’S DISCUSSION AND ANALYSIS OF FINANCIAL CONDITION ANDRESULTS OF OPERATIONS
The following discussion should be read in conjunction with “Selected Consolidated FinancialData” and our audited consolidated financial statements and notes thereto included elsewhere in thisreport. In addition to historical information, this discussion contains forward-looking statements thatinvolve risks, uncertainties and assumptions that could cause actual results to differ materially frommanagement’s expectations. For this purpose, any statements contained herein that are not statementsof historical fact may be deemed to be forward-looking statements. We generally identify forward-looking statements by words such as “anticipate,” “estimate,” “expect,” “intend,” “project,” “plan,”“predict,” “believe,” “seek,” “continue,” “outlook,” “may,” “might,” “will,” “should,” “can have,”“likely” or the negative version of these words or comparable words. Factors that can cause actualresults to differ materially from those reflected in the forward-looking statements include, amongothers, those discussed in “Risk Factors” and elsewhere in this report. We urge you not to place unduereliance on these forward-looking statements, which reflect management’s analysis, judgment, beliefor expectation only as of the date hereof. We expressly disclaim any obligation to update or revise anyforward-looking statement, whether as a result of new information, future events or otherwise, exceptas required by applicable securities laws and regulations. Historical results are not necessarilyindicative of the results expected for any future period.
Executive Overview
We are a leading, growing, global, premium lifestyle brand whose products offer superiorquality, durability and innovative design. We offer a comprehensive line of travel and businessproducts and accessories in multiple categories. We design our products for, and market our productsto, sophisticated professionals, frequent travelers and brand-conscious individuals who enjoy thepremium status of Tumi products. We sell our products through a network of company-owned full-price stores and outlet stores, partner stores, concessions, shop-in-shops, specialty luggage shops, high-end department stores and e-commerce distribution channels. We have approximately 1,800 points ofdistribution in over 75 countries, and our global distribution network is enhanced by the use of ourthree logistics facilities located in the United States, Europe and Asia. We design our products in ourU.S. design studios and selectively collaborate with well-known, international, industrial and fashiondesigners for limited edition product lines. Production is sourced globally through a network ofsuppliers based in Asia, many of which are longtime suppliers, and the Caribbean.
In April 2012, we completed our IPO, at which time we sold a total of 15,608,221 shares ofour common stock and certain of our stockholders sold a total of 5,988,624 shares of common stock(inclusive of 2,816,980 shares of common stock from the full exercise of the option granted to theunderwriters to purchase additional shares from certain of the selling stockholders). The initial publicoffering price of the shares sold in the offering was $18.00 per share. We did not receive any proceedsfrom the sale of shares by the selling stockholders. The total proceeds to us, net of underwriters’discounts and commissions, were approximately $264.1 million. We used the net proceeds receivedfrom the IPO to repurchase all of our preferred stock and preferred equity interests and 277,778 sharesof our common stock owned by Doughty Hanson.
- II-175 -
APPENDIX II FINANCIAL INFORMATION OF THE TUMI GROUP
Subsequent to our IPO, we completed secondary offerings in November 2012, April 2013and September 2014. These offerings, however, did not have any effect on the number of sharesoutstanding, as all shares in such offerings were sold by existing stockholders.
Since 2010, we have expanded our global presence by successfully implementing our growthstrategies, which have included opening additional company-owned stores and increasing wholesalepoints of distribution. Our net sales have grown from $252.8 million in 2010 to $527.2 million in 2014,representing a compound annual growth rate of 20%. This increase in net sales resulted primarily froman increase in the number of our company-owned stores from 84 as of January 1, 2010 to 152 as ofDecember 31, 2014, as well as an increase in average net sales per square foot in company-ownedstores from $821 for the year ended December 31, 2010 to $1,082 for the year ended December 31,2014, and continuous growth in our e-commerce business and international wholesale sales. Our abilityto expand our points of distribution and to grow our net sales in existing stores has been driven byincreasing demand for our products, as well as growing recognition of the Tumi brand. We haverecently increased our focus on our women’s line, which we estimate has grown from representingapproximately 10% of our net sales in 2010 to approximately 13% of our net sales in 2014, and onincreasing our overall online presence, for which net sales grew approximately 31% from 2013 to2014. Since 2010, Direct-to-Consumer e-commerce net sales per fiscal year have ranged from 12% to15% of total Direct-to-Consumer net sales.
In recent years, the travel products industry has seen a trend in consumer preferences towardslighter-weight luggage and travel accessories, as well as merchandise that makes mobile computingand communication more convenient. In light of these trends, we have developed products that fulfillthose identified needs, such as our Vapor and Tegra-Lite lines. We have also developed a variety ofmobile electronic accessories designed for frequent travelers. We estimate that the accessories categoryrepresents approximately 14% of our net sales in 2014. Additionally, we have seen an increase in therelative percentage of our net sales derived from our premium product line and updates of our coreproduct line, and a decrease in the relative percentage of our net sales derived from our legacy coreproduct line in recent years.
We believe there is a significant opportunity to continue to expand our store base globally, andwe plan to add new company-owned and partner stores in upscale malls and prestige street venues. Weopened 25 new company-owned stores in the year ended December 31, 2014. We currently expect tocontinue to open company-owned stores in the foreseeable future. Most of the locations we haveidentified for new company-owned stores are for full-price stores, while the remaining locations are foroutlet stores. We also believe there are opportunities to open additional stores in airport locations, aswell as luxury casinos.
We believe we have the capacity to increase our Indirect-to-Consumer net sales, both in NorthAmerica and internationally. In particular, we plan to continue to grow in key Asian markets,particularly China. Currently, more than 20% of our net sales in the Asia-Pacific region are to greaterChina, with Japan and South Korea being the next largest contributors. Additionally, Indirect-to-Consumer net sales in the Asia-Pacific region have more than doubled in the past five years. We alsoplan to increase the number of wholesale doors in key European markets including Germany, Franceand the United Kingdom, and to expand wholesale distribution in Central and South America, whilealso expanding our product portfolio offered in existing wholesale doors. We believe there is alsosignificant opportunity to open additional points of distribution in airport locations in many of theseregions. In North America, we expect to grow net sales by increasing our wholesale door presence,
- II-176 -

APPENDIX II FINANCIAL INFORMATION OF THE TUMI GROUP
expanding our accessories business in department stores, increasing the variety of products available tothird party e-commerce providers and increasing penetration of the Canadian market throughdepartment stores, specialty stores, e-commerce sales and new distribution partners. Since 2010,Indirect-to-Consumer net sales have increased in EMEA, the Asia-Pacific region, North Americaand Central and South America.
We generally expect the payback of our investment in a new company-owned store to occur inless than two and a half years. We also believe we can increase our average net sales per square foot bycontinuing to improve store efficiency. Our new product development efforts help drive store trafficwhile our retail performance maximization program and associate training efforts contribute toimproved store efficiency. We also believe we can continue to increase our net sales by capitalizing onour flexible distribution model. We will continue to look for ways to improve our capital efficiency inboth current and new markets in the future.
One-time charges
Pursuant to an amended and restated letter agreement dated July 8, 2009, Jerome Griffith, ourChief Executive Officer, President and Director, was entitled to receive a one-time special bonus uponthe consummation of a qualified sale event or initial public offering that resulted in an enterprise valueof our company of $600.0 million or greater. Mr. Griffith received a special bonus payment of $5.5million (pre-tax) in connection with the IPO. We recorded this compensation expense during thesecond quarter of 2012, which thereby reduced operating income and net income. In addition, theCompany incurred $0.6, $0.5 and $0.2 million in one-time costs associated with our secondaryofferings completed in November 2012, April 2013, and September 2014 respectively, which includedlegal and accounting costs and various other fees associated with these offerings.
Pursuant to the Company’s agreement with its web services provider, the Company served anearly termination notice to said provider in the second quarter of 2013 and accrued a $1,500,000 (pre-tax) early termination fee pursuant to the terms of this agreement. This amount was paid in December2013. The original agreement was scheduled to expire on December 31, 2015. The Companytransitioned its North America web store during the fourth quarter of 2014 and intends to transition itsinternational web stores to a more insourced model during 2015. The Company intends to continue touse the third-party provider’s services for its international web stores until such time.
Key Performance Indicators
A key performance indicator that we use to manage our business and evaluate our financialresults and operating performance is average net sales per square foot. Average net sales per squarefoot, which relates to company-owned stores only, provides us with a measure to evaluate our storesales trends and to assess the operational performance of our stores. This measure is supplemented by anumber of non-financial operating metrics related to store performance, which provide benchmarksagainst which to evaluate store efficiencies but are not considered by management to be reliablefinancial metrics. Undue reliance should not be placed on this measure as our only measure ofoperating performance.
Average net sales per square foot decreased by approximately $6, or less than 1%, to $1,082 forthe year ended December 31, 2014 from $1,088 for the year ended December 31, 2013. This decreasewas primarily due to the effect of the relocation of certain highly productive stores and their relatedexclusion from the square footage base, as well as the addition of certain large but less mature stores tothe square footage base during 2014.
- II-177 -
APPENDIX II FINANCIAL INFORMATION OF THE TUMI GROUP
Average net sales per square foot increased by approximately $37, or 4%, to $1,088 for the yearended December 31, 2013 from $1,051 for the year ended December 31, 2012. This increase wasprimarily due to higher store traffic and new product introductions, as well as improved storeefficiency.
In previous years, we considered adjusted EBITDA and net income before preferred dividendexpense (non-cash) to be key performance indicators that we used to manage our business.Management no longer uses this information to evaluate profitability or operating performance, andtherefore, these metrics are not included in this report.
Our Operating Segments
We evaluate operating performance based on net sales and operating income in four operatingsegments.
Direct-to-Consumer North America
As of December 31, 2014, we sold our products directly to consumers through a network of 133company-owned retail stores consisting of full-price stores and outlet stores strategically positioned inhigh-end retail malls or street venues. We also sell our products directly to consumers through our e-commerce website.
Direct-to-Consumer International
As of December 31, 2014, we sold directly to consumers through a network of 19 company-owned full-price and outlet stores in high-end street venues and select malls in international locations.We also sell our products directly to consumers through our two international e-commerce websites.
Indirect-to-Consumer North America
As of December 31, 2014, we sold to wholesale customers in North America throughapproximately 700 doors, including specialty luggage retailers, prestige department stores andbusiness-to-business channels. Many of our wholesale customers also operate their own e-commercewebsites through which they sell our products. Our products are also sold in partner stores, operated bylocal distributors or retailers, that carry only Tumi products and are governed by strict operatingguidelines that we dictate.
Indirect-to-Consumer International
As of December 31, 2014, we sold our products to international wholesale customers throughapproximately 1,000 doors, approximately 54% of which are in the EMEA region, 41% of which are inthe Asia-Pacific region, and 5% of which are in Central and South America. We have distributionchannels in Australia, China, Europe, Hong Kong, the Middle East, South Africa, Japan, South Korea,Southeast Asia and Taiwan, among others. Our products are also sold in partner stores, operated bylocal distributors or retailers, that carry only Tumi products and are governed by strict operatingguidelines that we dictate. We also operate concessions in department stores throughout Europe andthe Middle East. Many of our wholesale customers also operate their own e-commerce websitesthrough which they sell our products.
- II-178 -
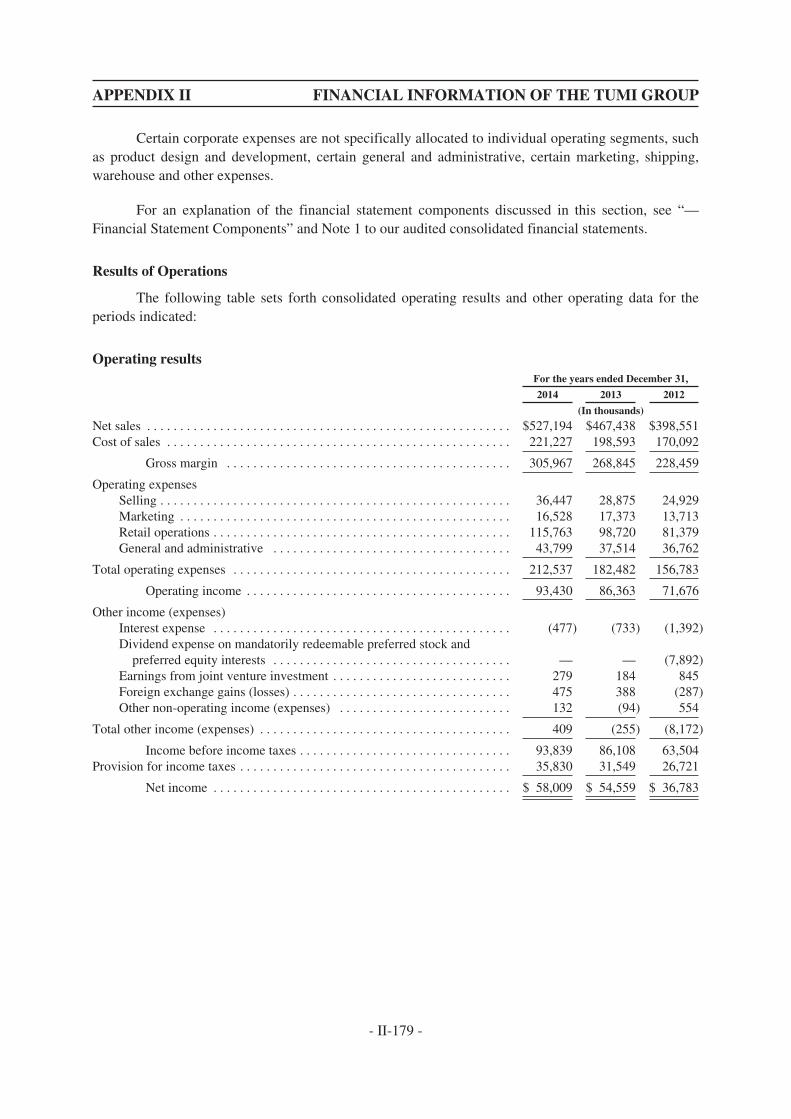
APPENDIX II FINANCIAL INFORMATION OF THE TUMI GROUP
Certain corporate expenses are not specifically allocated to individual operating segments, suchas product design and development, certain general and administrative, certain marketing, shipping,warehouse and other expenses.
For an explanation of the financial statement components discussed in this section, see “—Financial Statement Components” and Note 1 to our audited consolidated financial statements.
Results of Operations
The following table sets forth consolidated operating results and other operating data for theperiods indicated:
Operating resultsFor the years ended December 31,
2014 2013 2012
(In thousands)
Net sales . . . . . . . . . . . . . . . . . . . . . . . . . . . . . . . . . . . . . . . . . . . . . . . . . . . . . . . $527,194 $467,438 $398,551Cost of sales . . . . . . . . . . . . . . . . . . . . . . . . . . . . . . . . . . . . . . . . . . . . . . . . . . . . 221,227 198,593 170,092
Gross margin . . . . . . . . . . . . . . . . . . . . . . . . . . . . . . . . . . . . . . . . . . . 305,967 268,845 228,459
Operating expensesSelling . . . . . . . . . . . . . . . . . . . . . . . . . . . . . . . . . . . . . . . . . . . . . . . . . . . . . 36,447 28,875 24,929Marketing . . . . . . . . . . . . . . . . . . . . . . . . . . . . . . . . . . . . . . . . . . . . . . . . . . 16,528 17,373 13,713Retail operations . . . . . . . . . . . . . . . . . . . . . . . . . . . . . . . . . . . . . . . . . . . . . 115,763 98,720 81,379General and administrative . . . . . . . . . . . . . . . . . . . . . . . . . . . . . . . . . . . . 43,799 37,514 36,762
Total operating expenses . . . . . . . . . . . . . . . . . . . . . . . . . . . . . . . . . . . . . . . . . . 212,537 182,482 156,783
Operating income . . . . . . . . . . . . . . . . . . . . . . . . . . . . . . . . . . . . . . . . 93,430 86,363 71,676
Other income (expenses)Interest expense . . . . . . . . . . . . . . . . . . . . . . . . . . . . . . . . . . . . . . . . . . . . . (477) (733) (1,392)Dividend expense on mandatorily redeemable preferred stock and
preferred equity interests . . . . . . . . . . . . . . . . . . . . . . . . . . . . . . . . . . . . — — (7,892)Earnings from joint venture investment . . . . . . . . . . . . . . . . . . . . . . . . . . . 279 184 845Foreign exchange gains (losses) . . . . . . . . . . . . . . . . . . . . . . . . . . . . . . . . . 475 388 (287)Other non-operating income (expenses) . . . . . . . . . . . . . . . . . . . . . . . . . . 132 (94) 554
Total other income (expenses) . . . . . . . . . . . . . . . . . . . . . . . . . . . . . . . . . . . . . . 409 (255) (8,172)
Income before income taxes . . . . . . . . . . . . . . . . . . . . . . . . . . . . . . . . 93,839 86,108 63,504Provision for income taxes . . . . . . . . . . . . . . . . . . . . . . . . . . . . . . . . . . . . . . . . . 35,830 31,549 26,721
Net income . . . . . . . . . . . . . . . . . . . . . . . . . . . . . . . . . . . . . . . . . . . . . $ 58,009 $ 54,559 $ 36,783
- II-179 -
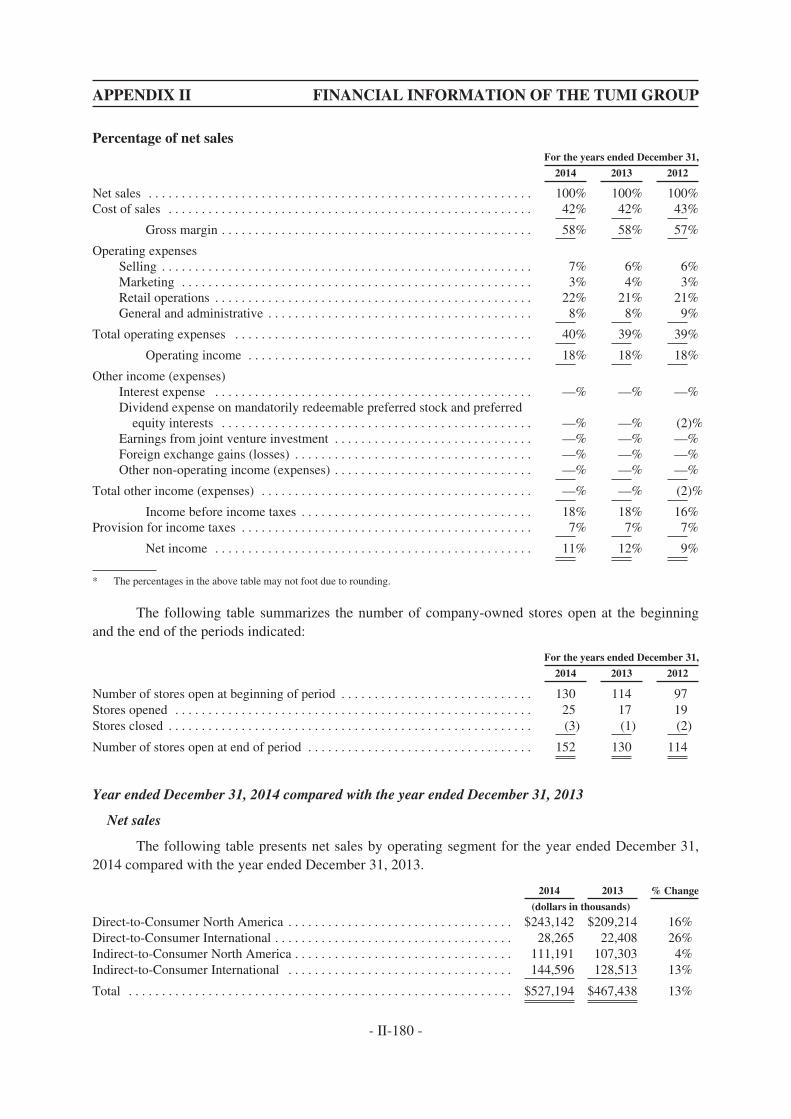
APPENDIX II FINANCIAL INFORMATION OF THE TUMI GROUP
Percentage of net salesFor the years ended December 31,
2014 2013 2012
Net sales . . . . . . . . . . . . . . . . . . . . . . . . . . . . . . . . . . . . . . . . . . . . . . . . . . . . . . . . . . 100% 100% 100%Cost of sales . . . . . . . . . . . . . . . . . . . . . . . . . . . . . . . . . . . . . . . . . . . . . . . . . . . . . . . 42% 42% 43%
Gross margin . . . . . . . . . . . . . . . . . . . . . . . . . . . . . . . . . . . . . . . . . . . . . . . 58% 58% 57%
Operating expensesSelling . . . . . . . . . . . . . . . . . . . . . . . . . . . . . . . . . . . . . . . . . . . . . . . . . . . . . . . . 7% 6% 6%Marketing . . . . . . . . . . . . . . . . . . . . . . . . . . . . . . . . . . . . . . . . . . . . . . . . . . . . . 3% 4% 3%Retail operations . . . . . . . . . . . . . . . . . . . . . . . . . . . . . . . . . . . . . . . . . . . . . . . . 22% 21% 21%General and administrative . . . . . . . . . . . . . . . . . . . . . . . . . . . . . . . . . . . . . . . . 8% 8% 9%
Total operating expenses . . . . . . . . . . . . . . . . . . . . . . . . . . . . . . . . . . . . . . . . . . . . . 40% 39% 39%
Operating income . . . . . . . . . . . . . . . . . . . . . . . . . . . . . . . . . . . . . . . . . . . 18% 18% 18%
Other income (expenses)Interest expense . . . . . . . . . . . . . . . . . . . . . . . . . . . . . . . . . . . . . . . . . . . . . . . . —% —% —%Dividend expense on mandatorily redeemable preferred stock and preferred
equity interests . . . . . . . . . . . . . . . . . . . . . . . . . . . . . . . . . . . . . . . . . . . . . . . —% —% (2)%Earnings from joint venture investment . . . . . . . . . . . . . . . . . . . . . . . . . . . . . . —% —% —%Foreign exchange gains (losses) . . . . . . . . . . . . . . . . . . . . . . . . . . . . . . . . . . . . —% —% —%Other non-operating income (expenses) . . . . . . . . . . . . . . . . . . . . . . . . . . . . . . —% —% —%
Total other income (expenses) . . . . . . . . . . . . . . . . . . . . . . . . . . . . . . . . . . . . . . . . . —% —% (2)%
Income before income taxes . . . . . . . . . . . . . . . . . . . . . . . . . . . . . . . . . . . 18% 18% 16%Provision for income taxes . . . . . . . . . . . . . . . . . . . . . . . . . . . . . . . . . . . . . . . . . . . . 7% 7% 7%
Net income . . . . . . . . . . . . . . . . . . . . . . . . . . . . . . . . . . . . . . . . . . . . . . . . 11% 12% 9%
* The percentages in the above table may not foot due to rounding.
The following table summarizes the number of company-owned stores open at the beginningand the end of the periods indicated:
For the years ended December 31,
2014 2013 2012
Number of stores open at beginning of period . . . . . . . . . . . . . . . . . . . . . . . . . . . . . 130 114 97Stores opened . . . . . . . . . . . . . . . . . . . . . . . . . . . . . . . . . . . . . . . . . . . . . . . . . . . . . . 25 17 19Stores closed . . . . . . . . . . . . . . . . . . . . . . . . . . . . . . . . . . . . . . . . . . . . . . . . . . . . . . . (3) (1) (2)
Number of stores open at end of period . . . . . . . . . . . . . . . . . . . . . . . . . . . . . . . . . . 152 130 114
Year ended December 31, 2014 compared with the year ended December 31, 2013
Net sales
The following table presents net sales by operating segment for the year ended December 31,2014 compared with the year ended December 31, 2013.
2014 2013 % Change
(dollars in thousands)
Direct-to-Consumer North America . . . . . . . . . . . . . . . . . . . . . . . . . . . . . . . . . . $243,142 $209,214 16%Direct-to-Consumer International . . . . . . . . . . . . . . . . . . . . . . . . . . . . . . . . . . . . 28,265 22,408 26%Indirect-to-Consumer North America . . . . . . . . . . . . . . . . . . . . . . . . . . . . . . . . . 111,191 107,303 4%Indirect-to-Consumer International . . . . . . . . . . . . . . . . . . . . . . . . . . . . . . . . . . 144,596 128,513 13%
Total . . . . . . . . . . . . . . . . . . . . . . . . . . . . . . . . . . . . . . . . . . . . . . . . . . . . . . . . . . $527,194 $467,438 13%
- II-180 -
APPENDIX II FINANCIAL INFORMATION OF THE TUMI GROUP
Net sales increased $59.8 million, or 13%, to $527.2 million in 2014 from $467.4 million in2013. Net sales increased across all of our operating segments for the year ended December 31, 2014as compared with the year ended December 31, 2013. Net sales increased due principally to anincrease in volume resulting from new store openings, positive overall comparable store sales fromexisting stores, increased sales growth from our wholesale customers in the EMEA and Asia-Pacificregions, continued growth in both Direct-to-Consumer and Indirect-to-Consumer e-commerce andcontinued consumer acceptance of our lighter weight product and new product introductions. Duringthe year ended December 31, 2014, we successfully re-launched our Alpha Travel Collection (Alpha2), re-launched our Voyageur collection, launched our Tegra-lite Max collection and introducedseasonal colors which continue to receive positive consumer acceptance. Overall, store traffic patternsimproved slightly during the year, particularly in outlets. While there were no significant priceincreases on existing products during the period, we did slightly raise price points on Alpha 2. Theeffect on net sales was immaterial. As previously disclosed, weaker than expected first quarterwholesale sales in Asia and North America had a moderating effect on these positive factors. Webelieve that the inclement weather in the first quarter of 2014 in certain North American markets alsohad a negative effect on sales. Additionally, there were 25 new company-owned store openings, 2 storerelocations, 8 store renovations and 3 store closures during the year ended December 31, 2014. Newstores opened during the year contributed approximately 18% of the overall sales growth from the yearended December 31, 2013 to the year ended December 31, 2014.
Net sales attributable to the Direct-to-Consumer North America segment experienced a 16%increase for the year ended December 31, 2014 as compared with the year ended December 31, 2013.North America full-price comparable store sales increased 4%, North America outlet comparable storesales increased 8% and our North America e-commerce sales increased 27%. Overall, including our e-commerce website, North America comparable store sales increased 9% for the period. Additionally,of the new stores opened during 2014, 21 were in the North America segment and contributed toapproximately 23% of the net sales growth in the Direct-to-Consumer North America segment fromthe year ended December 31, 2013 to the year ended December 31, 2014.
Net sales attributable to the Direct-to-Consumer International segment experienced a 26%increase for the year ended December 31, 2014 as compared with the year ended December 31, 2013,with international full-price comparable store sales up 5% in US dollars and in Euros and internationaloutlet comparable store sales up 29% in US dollars and in Euros. Our international e-commerce saleswere up 31% in US dollars and in Euros. Overall, including our e-commerce websites, ourinternational comparable store sales were up 18% in US dollars and in Euros for the period. Of the newstores opened during 2014, 4 were in Western Europe and contributed to approximately 47% of theDirect-to-Consumer International net sales growth from the year ended December 31, 2013 to the yearended December 31, 2014.
Overall, including e-commerce, comparable store sales for all Direct-to-Consumer channelsincreased 10% globally for the year ended December 31, 2014 as compared with the year endedDecember 31, 2013.
Net sales attributable to the Indirect-to-Consumer North America segment increased 4% for theyear ended December 31, 2014 as compared with the year ended December 31, 2013. The Indirect-to-Consumer North America net sales have been favorably impacted by strong sales through ourwholesale customers’ e-commerce websites, as well as the aforementioned enthusiasm around ourlightweight products and additions to our collections. This was partially offset by our decision to limit
- II-181 -
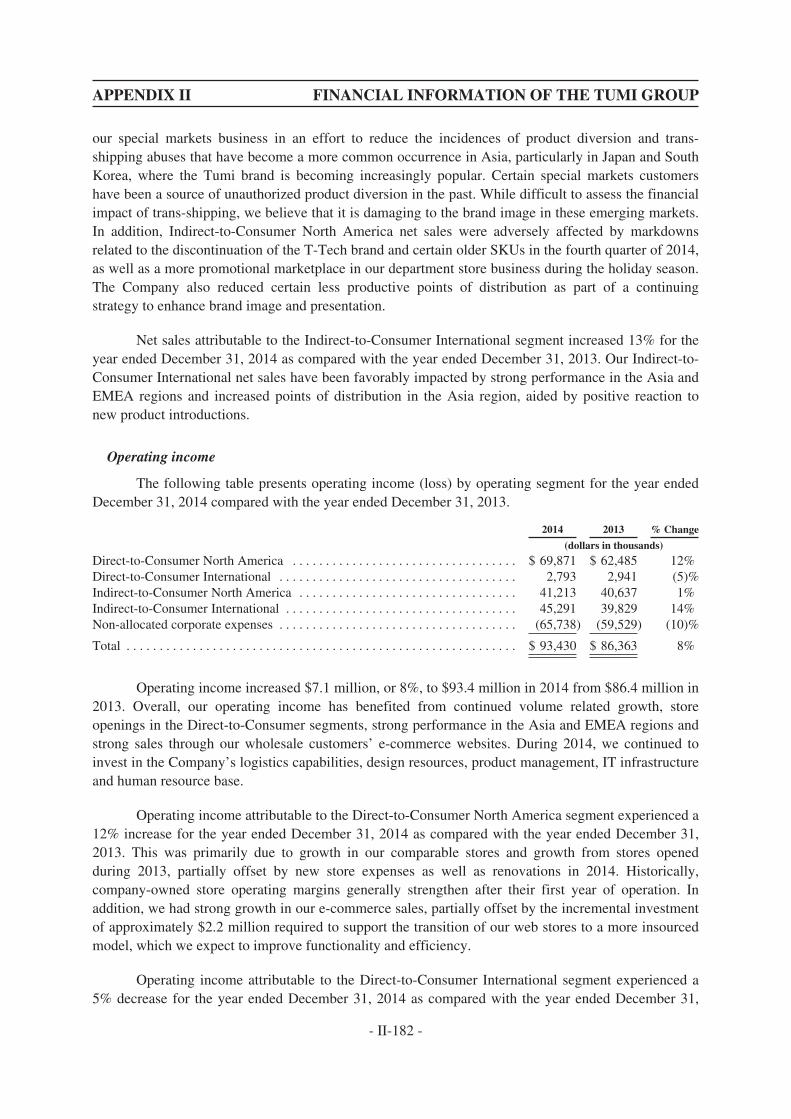
APPENDIX II FINANCIAL INFORMATION OF THE TUMI GROUP
our special markets business in an effort to reduce the incidences of product diversion and trans-shipping abuses that have become a more common occurrence in Asia, particularly in Japan and SouthKorea, where the Tumi brand is becoming increasingly popular. Certain special markets customershave been a source of unauthorized product diversion in the past. While difficult to assess the financialimpact of trans-shipping, we believe that it is damaging to the brand image in these emerging markets.In addition, Indirect-to-Consumer North America net sales were adversely affected by markdownsrelated to the discontinuation of the T-Tech brand and certain older SKUs in the fourth quarter of 2014,as well as a more promotional marketplace in our department store business during the holiday season.The Company also reduced certain less productive points of distribution as part of a continuingstrategy to enhance brand image and presentation.
Net sales attributable to the Indirect-to-Consumer International segment increased 13% for theyear ended December 31, 2014 as compared with the year ended December 31, 2013. Our Indirect-to-Consumer International net sales have been favorably impacted by strong performance in the Asia andEMEA regions and increased points of distribution in the Asia region, aided by positive reaction tonew product introductions.
Operating income
The following table presents operating income (loss) by operating segment for the year endedDecember 31, 2014 compared with the year ended December 31, 2013.
2014 2013 % Change
(dollars in thousands)
Direct-to-Consumer North America . . . . . . . . . . . . . . . . . . . . . . . . . . . . . . . . . . $ 69,871 $ 62,485 12%Direct-to-Consumer International . . . . . . . . . . . . . . . . . . . . . . . . . . . . . . . . . . . . 2,793 2,941 (5)%Indirect-to-Consumer North America . . . . . . . . . . . . . . . . . . . . . . . . . . . . . . . . . 41,213 40,637 1%Indirect-to-Consumer International . . . . . . . . . . . . . . . . . . . . . . . . . . . . . . . . . . . 45,291 39,829 14%Non-allocated corporate expenses . . . . . . . . . . . . . . . . . . . . . . . . . . . . . . . . . . . . (65,738) (59,529) (10)%
Total . . . . . . . . . . . . . . . . . . . . . . . . . . . . . . . . . . . . . . . . . . . . . . . . . . . . . . . . . . . $ 93,430 $ 86,363 8%
Operating income increased $7.1 million, or 8%, to $93.4 million in 2014 from $86.4 million in2013. Overall, our operating income has benefited from continued volume related growth, storeopenings in the Direct-to-Consumer segments, strong performance in the Asia and EMEA regions andstrong sales through our wholesale customers’ e-commerce websites. During 2014, we continued toinvest in the Company’s logistics capabilities, design resources, product management, IT infrastructureand human resource base.
Operating income attributable to the Direct-to-Consumer North America segment experienced a12% increase for the year ended December 31, 2014 as compared with the year ended December 31,2013. This was primarily due to growth in our comparable stores and growth from stores openedduring 2013, partially offset by new store expenses as well as renovations in 2014. Historically,company-owned store operating margins generally strengthen after their first year of operation. Inaddition, we had strong growth in our e-commerce sales, partially offset by the incremental investmentof approximately $2.2 million required to support the transition of our web stores to a more insourcedmodel, which we expect to improve functionality and efficiency.
Operating income attributable to the Direct-to-Consumer International segment experienced a5% decrease for the year ended December 31, 2014 as compared with the year ended December 31,
- II-182 -
APPENDIX II FINANCIAL INFORMATION OF THE TUMI GROUP
2013. This decrease was principally related to the pre-opening expenses and start-up costs for our newflagship store on Regent Street in London, as well as our new store in Marseille, France, both of whichopened in the second quarter of 2014.
Operating income attributable to the Indirect-to-Consumer North America segment experienceda 1% increase for the year ended December 31, 2014 as compared with the year ended December 31,2013. This was primarily due to the mix of sales in the channel. Operating margin was positivelyimpacted by strong sales through our wholesale customers’ e-commerce websites. Sales in ourspecialty stores and special markets business were down during the year ended December 31, 2014,both of which are generally strong from a margin perspective.
Operating income attributable to the Indirect-to-Consumer International segment experienced a14% increase for the year ended December 31, 2014 as compared with the year ended December 31,2013. This increase was primarily due to an increase in gross margin dollars resulting from strong salesgrowth during the year, partially offset by additional investment in personnel and infrastructure in Asiaof approximately $0.7 million.
Non-allocated corporate expenses increased 10% for the year ended December 31, 2014 ascompared with the year ended December 31, 2013. This increase was primarily due to the addition ofseveral designers, creative talent and product management personnel to help support our existingproduct lines and to aid in the development of our expanded product line. These aforementionedinvestments resulted in approximately $2.2 million of additional cost in the the year endedDecember 31, 2014. We have also invested approximately $1.5 million in our legal and financeresources, as well as related outside service fees to help accommodate our growth, and $1.0 million inour after sales service capabilities. In addition, we invested in our logistics capabilities in WesternEurope by moving to an expanded warehouse facility to serve our growing business in the EMEAregion, while continuing to operate our existing warehouse in transition, which resulted in incrementalcosts of approximately $0.4 million during the year ended December 31, 2014.
Operating margin remained consistent at 18% for the years ended December 31, 2014 and2013, as the previously mentioned investments in our human resource base and our insourced webstores, which launched during the fourth quarter of 2014, as well as retail operations expense for newstores and the wrap effect of stores opened in 2014, offset some of our fixed cost leverage. During theyear ended December 31, 2013, we incurred $0.5 million of offering costs associated with thesecondary offering completed in April 2013 and the aforementioned $1.5 million termination fee to ourwebsite e-services provider in order to move to a more insourced model. Excluding the aforementionedtermination fee and offering costs from the year ended December 31, 2013, operating income wouldhave been $88.3 million and operating margin would have been 19%.
Other income and expense
Total other income, net increased $0.7 million, or 260%, to income of $0.4 million in 2014from expense of $0.3 million in 2013. The overall increase was attributable to a reduction of interestexpense due to the full repayment of debt in the second quarter of 2014.
Income tax expense
Provision for income taxes increased $4.3 million, or 14%, to $35.8 million in 2014 from $31.5million in 2013, due principally to higher income before taxes, as well as a higher effective tax rate for
- II-183 -
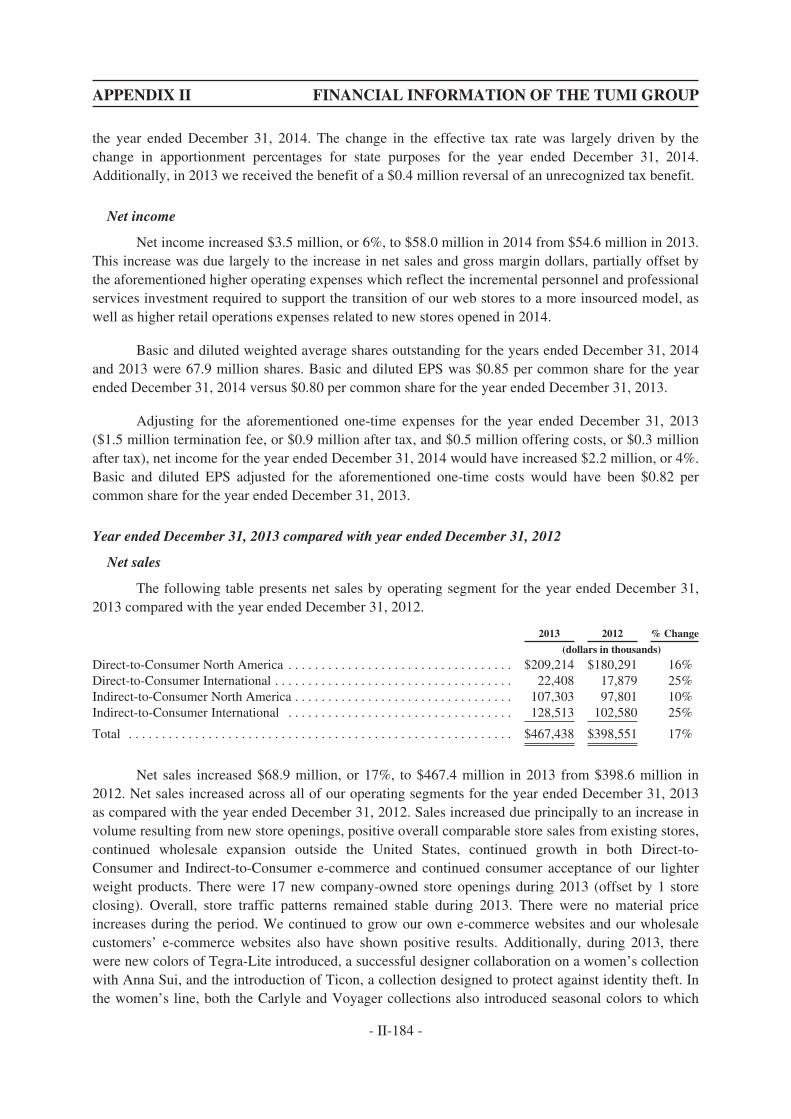
APPENDIX II FINANCIAL INFORMATION OF THE TUMI GROUP
the year ended December 31, 2014. The change in the effective tax rate was largely driven by thechange in apportionment percentages for state purposes for the year ended December 31, 2014.Additionally, in 2013 we received the benefit of a $0.4 million reversal of an unrecognized tax benefit.
Net income
Net income increased $3.5 million, or 6%, to $58.0 million in 2014 from $54.6 million in 2013.This increase was due largely to the increase in net sales and gross margin dollars, partially offset bythe aforementioned higher operating expenses which reflect the incremental personnel and professionalservices investment required to support the transition of our web stores to a more insourced model, aswell as higher retail operations expenses related to new stores opened in 2014.
Basic and diluted weighted average shares outstanding for the years ended December 31, 2014and 2013 were 67.9 million shares. Basic and diluted EPS was $0.85 per common share for the yearended December 31, 2014 versus $0.80 per common share for the year ended December 31, 2013.
Adjusting for the aforementioned one-time expenses for the year ended December 31, 2013($1.5 million termination fee, or $0.9 million after tax, and $0.5 million offering costs, or $0.3 millionafter tax), net income for the year ended December 31, 2014 would have increased $2.2 million, or 4%.Basic and diluted EPS adjusted for the aforementioned one-time costs would have been $0.82 percommon share for the year ended December 31, 2013.
Year ended December 31, 2013 compared with year ended December 31, 2012
Net sales
The following table presents net sales by operating segment for the year ended December 31,2013 compared with the year ended December 31, 2012.
2013 2012 % Change
(dollars in thousands)
Direct-to-Consumer North America . . . . . . . . . . . . . . . . . . . . . . . . . . . . . . . . . . $209,214 $180,291 16%Direct-to-Consumer International . . . . . . . . . . . . . . . . . . . . . . . . . . . . . . . . . . . . 22,408 17,879 25%Indirect-to-Consumer North America . . . . . . . . . . . . . . . . . . . . . . . . . . . . . . . . . 107,303 97,801 10%Indirect-to-Consumer International . . . . . . . . . . . . . . . . . . . . . . . . . . . . . . . . . . 128,513 102,580 25%
Total . . . . . . . . . . . . . . . . . . . . . . . . . . . . . . . . . . . . . . . . . . . . . . . . . . . . . . . . . . $467,438 $398,551 17%
Net sales increased $68.9 million, or 17%, to $467.4 million in 2013 from $398.6 million in2012. Net sales increased across all of our operating segments for the year ended December 31, 2013as compared with the year ended December 31, 2012. Sales increased due principally to an increase involume resulting from new store openings, positive overall comparable store sales from existing stores,continued wholesale expansion outside the United States, continued growth in both Direct-to-Consumer and Indirect-to-Consumer e-commerce and continued consumer acceptance of our lighterweight products. There were 17 new company-owned store openings during 2013 (offset by 1 storeclosing). Overall, store traffic patterns remained stable during 2013. There were no material priceincreases during the period. We continued to grow our own e-commerce websites and our wholesalecustomers’ e-commerce websites also have shown positive results. Additionally, during 2013, therewere new colors of Tegra-Lite introduced, a successful designer collaboration on a women’s collectionwith Anna Sui, and the introduction of Ticon, a collection designed to protect against identity theft. Inthe women’s line, both the Carlyle and Voyager collections also introduced seasonal colors to which
- II-184 -
APPENDIX II FINANCIAL INFORMATION OF THE TUMI GROUP
consumers appeared to respond positively. While the net effect of these new colors (net ofcannibalization) were not material, these seem to have been met with consumer enthusiasm. Newstores opened during the year contributed approximately 12% of the overall sales growth from the yearended December 31, 2012 to the year ended December 31, 2013.
Net sales attributable to the Direct-to-Consumer North America segment experienced a 16%increase for the year ended December 31, 2013 as compared with the year ended December 31, 2012.North America full-price comparable store sales increased less than 1%, North America outletcomparable store sales increased 11% and our North America e-commerce sales increased 20%.Overall, including our e-commerce website, North America comparable store sales increased 6% forthe period. Additionally, of the new stores opened during 2013, 16 were in the North America segmentand contributed to approximately 26% of the net sales growth in the Direct-to-Consumer NorthAmerica segment from the year ended December 31, 2012 to the year ended December 31, 2013.
Net sales attributable to the Direct-to-Consumer International segment experienced a 25%increase for the year ended December 31, 2013 as compared with the year ended December 31, 2012,with international full-price comparable store sales up 9% (6% in Euros) and international outletcomparable store sales up 30% (25% in Euros). Our international e-commerce sales were up 14% (10%in Euros). Overall, including our e-commerce websites, our international comparable store sales wereup 16% (13% in Euros) for the period. Improvement in store traffic patterns and macroeconomicconditions in the EMEA region helped contribute to this increase. Additionally, of the new storesopened during 2013, one was in Western Europe and contributed to approximately 12% of the Direct-to-Consumer International net sales growth from the year ended December 31, 2012 to the year endedDecember 31, 2013.
Overall, including e-commerce, comparable store sales for all Direct-to-Consumer channelsincreased 7% globally for the year ended December 31, 2013 as compared with the year endedDecember 31, 2012.
Net sales attributable to the Indirect-to-Consumer North America segment increased 10% andnet sales attributable to the Indirect-to-Consumer International segment increased 25% for the yearended December 31, 2013 as compared with the year ended December 31, 2012. The Indirect-to-Consumer North America net sales were favorably impacted by strong sales through our wholesalecustomers’ e-commerce websites as well as the aforementioned enthusiasm around our lightweightproducts and additions to our collections. This was partially offset by our decision to limit our specialmarkets business in an effort to limit the incidences of product diversion and trans-shipping abuses thathave become a more common occurrence in Asia, particularly in Japan and South Korea, where theTumi brand is becoming increasingly popular. Certain special markets customers have been a source ofunauthorized product diversion in the past. Our Indirect-to-Consumer International net sales have beenfavorably impacted by strong performance in Asia related to the opening of new wholesale points ofdistribution and in the EMEA region, aided by positive reaction to our lightweight collections.
- II-185 -
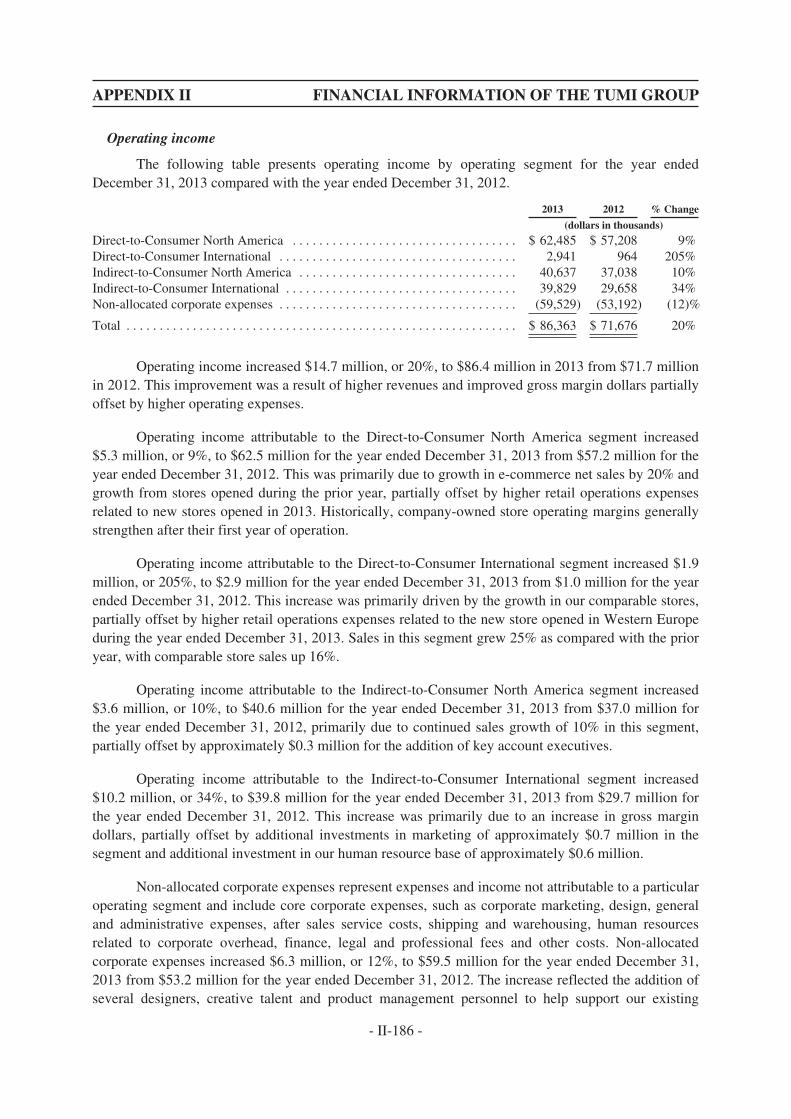
APPENDIX II FINANCIAL INFORMATION OF THE TUMI GROUP
Operating income
The following table presents operating income by operating segment for the year endedDecember 31, 2013 compared with the year ended December 31, 2012.
2013 2012 % Change
(dollars in thousands)
Direct-to-Consumer North America . . . . . . . . . . . . . . . . . . . . . . . . . . . . . . . . . . $ 62,485 $ 57,208 9%Direct-to-Consumer International . . . . . . . . . . . . . . . . . . . . . . . . . . . . . . . . . . . . 2,941 964 205%Indirect-to-Consumer North America . . . . . . . . . . . . . . . . . . . . . . . . . . . . . . . . . 40,637 37,038 10%Indirect-to-Consumer International . . . . . . . . . . . . . . . . . . . . . . . . . . . . . . . . . . . 39,829 29,658 34%Non-allocated corporate expenses . . . . . . . . . . . . . . . . . . . . . . . . . . . . . . . . . . . . (59,529) (53,192) (12)%
Total . . . . . . . . . . . . . . . . . . . . . . . . . . . . . . . . . . . . . . . . . . . . . . . . . . . . . . . . . . . $ 86,363 $ 71,676 20%
Operating income increased $14.7 million, or 20%, to $86.4 million in 2013 from $71.7 millionin 2012. This improvement was a result of higher revenues and improved gross margin dollars partiallyoffset by higher operating expenses.
Operating income attributable to the Direct-to-Consumer North America segment increased$5.3 million, or 9%, to $62.5 million for the year ended December 31, 2013 from $57.2 million for theyear ended December 31, 2012. This was primarily due to growth in e-commerce net sales by 20% andgrowth from stores opened during the prior year, partially offset by higher retail operations expensesrelated to new stores opened in 2013. Historically, company-owned store operating margins generallystrengthen after their first year of operation.
Operating income attributable to the Direct-to-Consumer International segment increased $1.9million, or 205%, to $2.9 million for the year ended December 31, 2013 from $1.0 million for the yearended December 31, 2012. This increase was primarily driven by the growth in our comparable stores,partially offset by higher retail operations expenses related to the new store opened in Western Europeduring the year ended December 31, 2013. Sales in this segment grew 25% as compared with the prioryear, with comparable store sales up 16%.
Operating income attributable to the Indirect-to-Consumer North America segment increased$3.6 million, or 10%, to $40.6 million for the year ended December 31, 2013 from $37.0 million forthe year ended December 31, 2012, primarily due to continued sales growth of 10% in this segment,partially offset by approximately $0.3 million for the addition of key account executives.
Operating income attributable to the Indirect-to-Consumer International segment increased$10.2 million, or 34%, to $39.8 million for the year ended December 31, 2013 from $29.7 million forthe year ended December 31, 2012. This increase was primarily due to an increase in gross margindollars, partially offset by additional investments in marketing of approximately $0.7 million in thesegment and additional investment in our human resource base of approximately $0.6 million.
Non-allocated corporate expenses represent expenses and income not attributable to a particularoperating segment and include core corporate expenses, such as corporate marketing, design, generaland administrative expenses, after sales service costs, shipping and warehousing, human resourcesrelated to corporate overhead, finance, legal and professional fees and other costs. Non-allocatedcorporate expenses increased $6.3 million, or 12%, to $59.5 million for the year ended December 31,2013 from $53.2 million for the year ended December 31, 2012. The increase reflected the addition ofseveral designers, creative talent and product management personnel to help support our existing
- II-186 -
APPENDIX II FINANCIAL INFORMATION OF THE TUMI GROUP
product lines and to aid in the development of our expanded product line. These aforementionedinvestments resulted in approximately $1.4 million of additional cost for the year ended December 31,2013. We increased marketing spending by approximately $2.5 million, as well as increased spendingby approximately $0.5 million to expand our after sales service capabilities. We also increased ourhuman resource base, which resulted in approximately $2.3 million of additional cost. In addition,during the year ended December 31, 2013, we incurred $0.5 million of offering costs associated withthe secondary offering completed in April 2013 and a $1.5 million termination fee associated with achange in our website e-services provider in order to move to a more insourced model. During the yearended December 31, 2012, we incurred a $5.5 million one-time special bonus paid to the ChiefExecutive Office (“CEO”) in connection with the successful completion of the IPO and $0.6 million ofoffering costs associated with the secondary offering completed in November 2012 (see Note 1 of ouraudited consolidated financial statements for further information regarding our IPO and secondaryofferings).
Operating margin remained consistent at 18% for the years ended December 31, 2013 and2012. However, excluding the aforementioned termination fee and offering costs from the year endedDecember 31, 2013 and excluding the special cash bonus paid to the CEO and offering costs from theyear ended December 31, 2012, operating margin would have decreased from 20% for the year endedDecember 31, 2012 to 19% for the year ended December 31, 2013. In late 2013 we began preparing forthe re-launch of our Alpha Travel Collection in the first quarter of 2014 through an after-Christmasholiday promotion. This transition had a marginally negative effect on our 2013 operating margin.
Other income and expense
Total other expenses decreased $7.9 million, or 97%, to $0.3 million in 2013 from $8.2 millionin 2012. The overall decrease in other expenses was attributable to a reduction of dividend expense dueto the repurchase of all of our mandatorily redeemable preferred stock and preferred equity interests inconnection with our IPO in the second quarter of 2012. Excluding this one item, total other expensesremained consistent at $0.3 million.
Income tax expense
Provision for income taxes increased $4.8 million, or 18%, to $31.5 million in 2013 from $26.7million in 2012, due principally to higher income before taxes, partially offset by a $0.4 millionreversal of an unrecognized tax benefit. The effective tax rate was favorably impacted by the reductionof non-deductible dividend expense due to the repurchase of all of our mandatorily redeemablepreferred stock and preferred equity interests in connection with our IPO in the second quarter of 2012.
Net income
Net income increased $17.8 million, or 48%, to $54.6 million in 2013 from $36.8 million in2012. The increase in net income was due mainly to the increase in net sales and gross margin dollarsas well as the aforementioned reduction in dividend expense on mandatorily redeemable preferredstock and preferred equity interests.
Basic and diluted weighted average shares outstanding for the years ended December 31, 2013and 2012 were 67.9 million shares and 63.3 million, respectively. Basic and diluted EPS was $0.80 percommon share for the year ended December 31, 2013 versus $0.58 per common share for the yearended December 31, 2012.
- II-187 -
APPENDIX II FINANCIAL INFORMATION OF THE TUMI GROUP
Net income before dividend expense on mandatorily redeemable preferred stock and preferredequity interests was $54.6 million and $44.7 million for the years ended December 31, 2013 and 2012,respectively. Basic and diluted EPS before dividend expense on mandatorily redeemable preferredstock and preferred equity interests was $0.80 per common share and $0.71 per common share for theyears ended December 31, 2013 and 2012, respectively.
In addition, adjusting for dividend expense and the aforementioned one-time expenses in bothperiods ($1.5 million termination fee, or $0.9 million after tax, and $0.5 million offering costs, or $0.3million after tax, for the year ended December 31, 2013 and $5.5 million special cash bonus paid to theCEO, or $3.1 million after tax, and $0.6 million offering costs, or $0.4 after tax, for the year endedDecember 31, 2012) net income in 2013 would have increased approximately $7.6 million, or 16%, to$55.8 million from $48.2 million in 2012. Basic and diluted EPS before dividend expense onmandatorily redeemable preferred stock and preferred equity interests adjusted for the aforementionedone-time costs in both periods would have been $0.82 and $0.76 per common share for the years endedDecember 31, 2013 and 2012, respectively.
Seasonality
Our business is seasonal in nature and as a result, our net sales and working capitalrequirements fluctuate from quarter to quarter. Our fourth quarter is a significant period for our resultsof operations due to increased Direct-to-Consumer sales during the holiday season in North Americaand Europe. We expect inventory levels, along with an increase in accounts payable and accruedexpenses, to reach their highest levels in anticipation of the increased net sales during this period. In2014 and 2013, fourth quarter net sales represented approximately 31% and 32% of our total annualnet sales. Operating income in the same periods represented approximately 40% and 37% of our totalannual operating income, respectively.
Liquidity and Capital Resources
Historically, our primary source of liquidity has been cash flows from operations. Our long-term credit facility has not historically been used to finance our capital requirements, but instead wasused to refinance acquisition indebtedness originally incurred when Doughty Hanson and certainmembers of management at that time acquired the Company in 2004. We have from time to timedrawn down on our revolving line of credit as short-term liquidity needs arise. We use our cash flowsfrom operations to fund our store development activities.
Inflationary factors such as increases in the cost of sales, including raw materials costs andtransportation costs, may adversely affect our operating results. Although we do not believe thatinflation has had a material impact on our financial position to date, a high rate of inflation in the futuremay have an adverse effect on our ability to maintain our gross margin levels and our current levels ofselling expenses and general and administrative expenses as a percentage of net sales if the sale pricesof our products do not increase with any increase in cost of sales.
We believe we have sufficient working capital and liquidity to support our operations for atleast the next twelve months.
- II-188 -
APPENDIX II FINANCIAL INFORMATION OF THE TUMI GROUP
Cash and cash equivalents
At December 31, 2014, 2013 and 2012, we had cash and cash equivalents of $52.8 million,$37.6 million and $36.7 million, respectively. A summary of our cash flows provided by and used inoperating, investing and financing activities is presented below.
Cash flows from operating activities
Cash flows from operating activities consisted primarily of net income adjusted for certain non-cash items, including depreciation and amortization, share-based compensation expense, dividendexpense on mandatorily redeemable preferred stock and preferred equity interests, loss on disposal offixed assets and other non-cash charges. Our cash flows from operations are largely dependent on salesto consumers and wholesale customers, which are in turn dependent on consumer confidence, storetraffic, conversion, business travel and general economic conditions. We believe we have the ability toconserve liquidity when economic conditions become less favorable through any number of strategiesincluding curtailment of store expansion plans and cutting discretionary spending.
We generated cash flows from operations of $60.5 million and $63.2 million during the yearsended December 31, 2014 and December 31, 2013, respectively. The principal reason for the decreasewas the prepayments made for our estimated income taxes.
We generated cash flows from operations of $63.2 million and $48.4 million during the yearsended December 31, 2013 and 2012, respectively. The principal reason for this increase was theimprovement in net income.
Investing activities
Cash flows used for investing activities consisted of capital expenditures for store expansionplans, store renovations, store openings, store relocations, information technology infrastructure,distribution infrastructure and product tooling costs.
Cash used for capital expenditures was $36.6 million and $25.4 million for the years endedDecember 31, 2014 and 2013, respectively. The increase was due principally to the investment in ourinsourced web platform and stores opened or renovated during 2014 as well as stores expected to openin the first quarter of 2015.
Cash used for capital expenditures was $25.4 million and $21.3 million for the years endedDecember 31, 2013 and 2012, respectively. The increase was due principally to the investment in anew point of sale system, store openings, and the completion of our warehouse expansion project.
Financing activities
Cash flows used for financing activities was $8.0 million and $37.0 million for the years endedDecember 31, 2014 and 2013, respectively. The decrease was mainly attributable to lower repaymentsof bank debt during the year ended December 31, 2014, during which the balance outstanding was paidin full.
Cash flows used for financing activities was $37.0 million and $23.2 million for the yearsended December 31, 2013 and 2012, respectively. The increase was mainly attributable to the paydown of the revolving credit facility during 2013.
- II-189 -
APPENDIX II FINANCIAL INFORMATION OF THE TUMI GROUP
Amended and restated credit facility
On April 4, 2012, Tumi, Inc. and Tumi Stores, Inc., each a direct or indirect wholly-ownedsubsidiary of the Company (the “Borrowers”), entered into an amended and restated credit facility (the“Amended Credit Facility”), with Wells Fargo Bank National Association (“Wells Fargo”) as lenderand collateral agent.
The Amended Credit Facility consolidated the term loan facility and the revolving creditfacility previously provided in the Company’s former debt facility with Wells Fargo into a single$70,000,000 senior secured revolving credit facility, with Wells Fargo as the sole lender, and extendedthe maturity of the facility until April 4, 2017. The Amended Credit Facility included a letter of creditsublimit not to exceed the undrawn amount of the revolving commitments.
On August 29, 2013, the Amended Credit Facility was amended to reduce the letter of creditsublimit to $5,000,000.
Borrowings under the Amended Credit Facility bear interest at a per annum rate equal to, at theBorrowers’ option, the one, two, three or six month (or such other period as Wells Fargo may agree)LIBOR rate plus a margin of 1.00% or 1.25%, or a base rate (the greater of (i) Wells Fargo’s prime ratein effect on such day and (ii) the federal funds rate plus 1/2 of 1.00%) plus a margin of zero or 0.25%.The Borrowers are required to pay an undrawn commitment fee equal to 0.15% or 0.20% of theundrawn portion of the commitments under the Amended Credit Facility, as well as customary letter ofcredit fees. The margin added to the LIBOR, or base rate, as well as the amount of the commitmentfee, depends on the Company’s leverage at the time. Interest is payable monthly, bi-monthly orquarterly on LIBOR rate loans depending on the interest period for each LIBOR rate loan, or quarterlyon base rate loans.
As of December 31, 2014 the Company had no balance outstanding under the Amended CreditFacility. As of December 31, 2013, the balance outstanding on the facility was $8,000,000 and boreinterest at the market LIBOR rate of 0.17% plus 100 basis points. Letters of credit totaling $286,000were outstanding under the facility at both December 31, 2014 and 2013 and, accordingly, the unusedportion of the facility was $69,714,000 and $61,714,000, respectively. The fee for the unused portionof the facility was $104,000 and $70,000 for the years ended December 31, 2014 and 2013,respectively.
All obligations under the Amended Credit Facility are required to be guaranteed by each of theBorrowers’ material domestic subsidiaries, subject to certain exclusions. The obligations under theAmended Credit Facility are secured by substantially all of the Borrowers’ assets and, if applicable,those of the Borrowers’ subsidiary guarantors. Currently the Borrowers do not have any subsidiaryguarantors.
The Amended Credit Facility contains customary events of default, including, but not limitedto, payment defaults, breaches of representations and warranties, covenant defaults, cross-defaultsunder material debt, certain events of bankruptcy and insolvency, defaults based on certain judgments,failure of any material provision of any loan document to be in full force and effect, change of control,and certain ERISA defaults. If an event of default were to occur and continue, amounts due under theAmended Credit Facility would be accelerated and the commitments to extend credit thereunderterminated, and the rights and remedies of Wells Fargo under the Amended Credit Facility available
- II-190 -
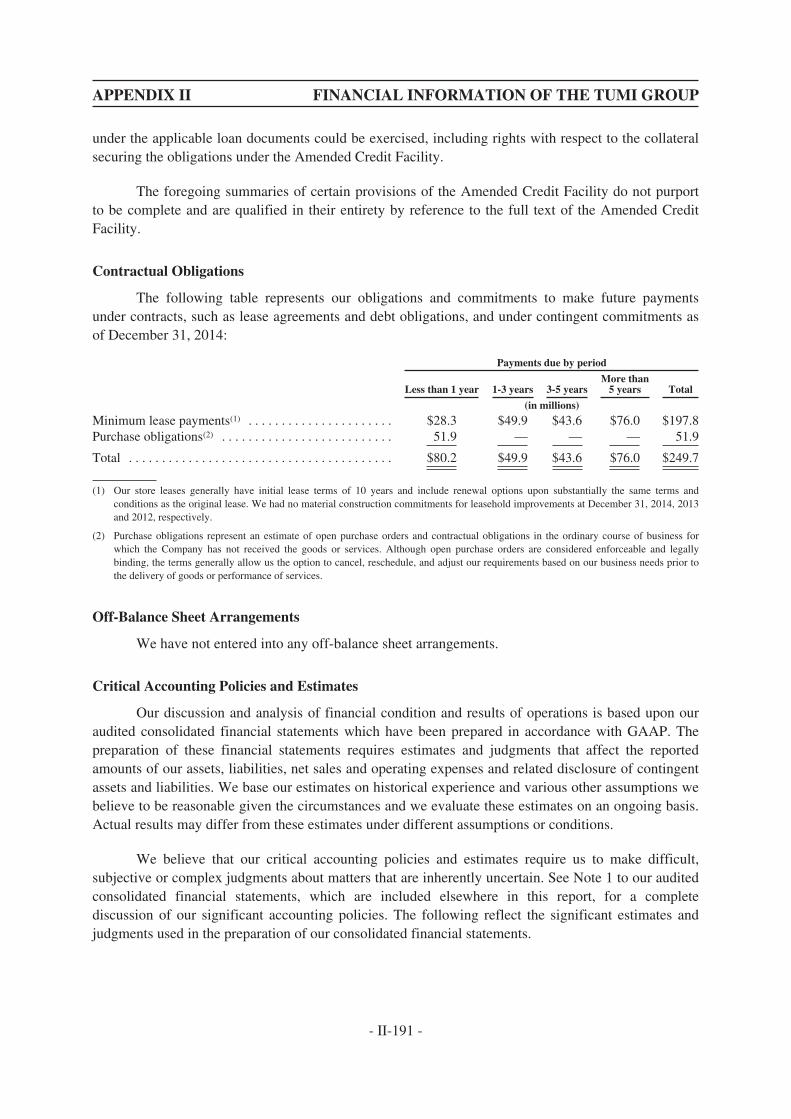
APPENDIX II FINANCIAL INFORMATION OF THE TUMI GROUP
under the applicable loan documents could be exercised, including rights with respect to the collateralsecuring the obligations under the Amended Credit Facility.
The foregoing summaries of certain provisions of the Amended Credit Facility do not purportto be complete and are qualified in their entirety by reference to the full text of the Amended CreditFacility.
Contractual Obligations
The following table represents our obligations and commitments to make future paymentsunder contracts, such as lease agreements and debt obligations, and under contingent commitments asof December 31, 2014:
Payments due by period
Less than 1 year 1-3 years 3-5 yearsMore than
5 years Total
(in millions)
Minimum lease payments(1) . . . . . . . . . . . . . . . . . . . . . . $28.3 $49.9 $43.6 $76.0 $197.8Purchase obligations(2) . . . . . . . . . . . . . . . . . . . . . . . . . . 51.9 — — — 51.9
Total . . . . . . . . . . . . . . . . . . . . . . . . . . . . . . . . . . . . . . . . $80.2 $49.9 $43.6 $76.0 $249.7
(1) Our store leases generally have initial lease terms of 10 years and include renewal options upon substantially the same terms andconditions as the original lease. We had no material construction commitments for leasehold improvements at December 31, 2014, 2013and 2012, respectively.
(2) Purchase obligations represent an estimate of open purchase orders and contractual obligations in the ordinary course of business forwhich the Company has not received the goods or services. Although open purchase orders are considered enforceable and legallybinding, the terms generally allow us the option to cancel, reschedule, and adjust our requirements based on our business needs prior tothe delivery of goods or performance of services.
Off-Balance Sheet Arrangements
We have not entered into any off-balance sheet arrangements.
Critical Accounting Policies and Estimates
Our discussion and analysis of financial condition and results of operations is based upon ouraudited consolidated financial statements which have been prepared in accordance with GAAP. Thepreparation of these financial statements requires estimates and judgments that affect the reportedamounts of our assets, liabilities, net sales and operating expenses and related disclosure of contingentassets and liabilities. We base our estimates on historical experience and various other assumptions webelieve to be reasonable given the circumstances and we evaluate these estimates on an ongoing basis.Actual results may differ from these estimates under different assumptions or conditions.
We believe that our critical accounting policies and estimates require us to make difficult,subjective or complex judgments about matters that are inherently uncertain. See Note 1 to our auditedconsolidated financial statements, which are included elsewhere in this report, for a completediscussion of our significant accounting policies. The following reflect the significant estimates andjudgments used in the preparation of our consolidated financial statements.
- II-191 -
APPENDIX II FINANCIAL INFORMATION OF THE TUMI GROUP
Revenue recognition
Revenue is generated from the sale of our products and is classified as “net sales” in ourconsolidated statements of operations. We recognize revenue in our Direct-to-Consumer segment wheninventory is received by customers and the related title passes. In our Indirect-to-Consumer segments,revenue is recognized when inventory is in possession of our wholesale customers or their appointedcarriers, at which point the related title passes. Provisions for discounts, rebates to customers andreturns are recorded as a reduction of net sales in the same period as the related sale. Revenueassociated with gift cards is recognized upon redemption. Determining our provision for discounts,rebates and returns requires significant judgment based on historical information and estimates offuture activity.
Accounts receivable and allowance for doubtful accounts
We determine our allowance for doubtful accounts for accounts receivable by considering anumber of factors including the length of time trade receivables are past due, our previous loss history,our customer’s current ability to pay its obligation and the condition of the general economy and theindustry as a whole. Unanticipated events and circumstances may occur that affect the accuracy orvalidity of such assumptions, estimates or actual results.
Inventories
Inventories consist primarily of finished goods and are valued at the lower of cost or market.Cost is recorded using the first-in, first-out method. Inventory includes material, labor, overhead,freight, and duty and is adjusted for allowances for slow-moving and obsolete inventory. Slow-movingand obsolete inventory is determined through an evaluation of both historical usage and expectedfuture demand.
Income taxes
We utilize the asset and liability method of accounting for income taxes, under which deferredincome taxes are recognized for the tax consequences of temporary differences by applying enactedstatutory tax rates applicable to future years to differences between the financial statement carryingamounts and the tax basis of existing assets and liabilities. The effect on deferred taxes of a change intax rates is recognized in net income in the period that includes the enactment date. A valuationallowance is provided when it is more likely than not that some portion or all of the deferred tax assetswill not be realized. In assessing the realizability of deferred tax assets, management considers whetherit is more likely than not that some portion or all of the deferred tax assets will not be realized. Theultimate realization of deferred tax assets is dependent upon the generation of future taxable incomeduring the periods in which those temporary differences become deductible.
We apply the provisions of the FASB’s guidance relating to uncertain tax positions. We utilizethe two step process to determine the amount of recognized tax benefit. For tax positions meeting themore-likely-than-not threshold, the amount recognized in the consolidated financial statements is thelargest benefit that has a greater than 50% likelihood of being realized upon ultimate settlement withthe relevant tax authority.
- II-192 -

APPENDIX II FINANCIAL INFORMATION OF THE TUMI GROUP
Goodwill and intangible assets
Goodwill represents the excess of the purchase price over the fair value of net assets acquired,including intangible assets. Indefinite-lived intangible assets consist of brand/trade name. Goodwilland brand/trade name are not being amortized in accordance with the provisions of the FASB’sguidance, which requires these assets to be tested for impairment annually and whenever events orchanges in circumstances indicate that the carrying value may not be recoverable. Our annualimpairment testing date is the first day of our fourth quarter. No impairment was recognized in theyears ended December 31, 2014, 2013 and 2012.
The quantitative goodwill impairment test, if necessary, is a two-step process. Under the first oftwo steps, the Company compares the fair value of a reporting unit to its carrying amount, includinggoodwill, to identify a potential impairment. If the fair value of the reporting unit is less than itscarrying value, an indication of goodwill impairment exists for such reporting unit and the enterprisemust perform step two of the impairment test to measure the impairment, if any. Under step two, animpairment loss is recognized for any excess of the carrying amount of the reporting unit’s goodwillover the implied fair value of that goodwill. The implied fair value of goodwill is determined byallocating the fair value of the reporting unit in a manner similar to a purchase price allocation: the fairvalue of the reporting unit is allocated to all of the assets and liabilities of that unit (including anyunrecognized intangible assets) and the residual fair value after this allocation is the implied fair valueof the reporting unit goodwill.
The Company uses techniques including discounted expected future cash flows (Level 3 input),or DCF, to test goodwill. Indefinite-lived intangible assets are tested for impairment through an incomeapproach known as the relief from royalty method. A discounted cash flow analysis calculates the fairvalue by estimating the after-tax cash flows attributable to a reporting unit or asset and thendiscounting the after-tax cash flows to a present value using a risk-adjusted discount rate. Assumptionsused in DCF and the relief from royalty method require the exercise of significant judgment includingjudgment about appropriate royalty rates, discount rates and terminal values, growth rates and theamount and timing of expected future cash flows. Although the Company believes the historicalassumptions and estimates made are reasonable and appropriate, different assumptions and estimatescould materially impact its reported financial results.
The Company’s reporting units for the purpose of goodwill impairment testing are ourreportable business segments: (i) Direct-to-Consumer North America, (ii) Indirect-to-Consumer NorthAmerica, (iii) Direct-to-Consumer International and (iv) Indirect-to-Consumer International. Thereporting units were determined in accordance with the guidance on reportable segments in FASB ASC280-10-50-1. There is no discrete financial information available to the Company for its operationsbelow our reportable business segments.
Warranties
We provide our customers with a product warranty subsequent to the sale of our products. Ourwarranty policy provides for one year of worry-free service as well as an additional warranty againstmanufacturers’ defects or flaws in construction for between two and five years, depending on theproduct line. We recognize estimated costs associated with the limited warranty at the time of sale ofour products. The warranty reserve is based on historical experience.
- II-193 -
APPENDIX II FINANCIAL INFORMATION OF THE TUMI GROUP
Recently Issued Accounting Pronouncements
In July 2013, the FASB issued ASU No. 2013-11, “Income Taxes (Topic 740): Presentation ofan Unrecognized Tax Benefit When a Net Operating Loss Carryforward, a Similar Tax Loss, or a TaxCredit Carryforward exists.” This amended guidance requires an entity to present an unrecognized taxbenefit as a reduction of a deferred tax asset for a net operating loss carryforward, a similar tax loss ora tax credit carry forward. If an applicable deferred tax asset is not available or a company does notexpect to use the applicable deferred tax asset, the unrecognized tax benefit should be presented as aliability in the financial statements and should not be combined with an unrelated deferred tax asset.The new guidance is effective prospectively for fiscal years and interim periods beginning afterDecember 15, 2013, with early adoption permitted. The Company adopted the amended guidanceeffective January 1, 2014 and it did not have a material effect on its consolidated financial statements.
In May 2014, the FASB issued ASU No. 2014-09, “Revenue from Contracts with Customers(Topic 606)” which amended the existing accounting standards for revenue recognition. ASU 2014-09establishes principles for recognizing revenue upon the transfer of promised goods or services tocustomers, in an amount that reflects the expected consideration received in exchange for those goodsor services. It is effective for annual reporting periods beginning after December 15, 2016. Earlyadoption is not permitted. The amendments may be applied retrospectively to each prior periodpresented or retrospectively with the cumulative effect recognized as of the date of initial application.The Company is currently in the process of evaluating the impact of adoption of the ASU on itsconsolidated financial statements, but does not expect the impact to be material.
In June 2014, the FASB issued ASU 2014-12, “Accounting for Share-Based Payments Whenthe Terms of an Award Provide That a Performance Target Could Be Achieved after the RequisiteService Period (Topic 718)”. ASU 2014-12 requires that a performance target that affects vesting andthat could be achieved after the requisite service period be treated as a performance condition. As such,the performance target should not be reflected in estimating the grant-date fair value of the award.ASU 2014-12 is effective for annual reporting periods beginning after December 15, 2015, with earlyadoption permitted. The Company is evaluating the potential impacts of the new standard on itsexisting share-based compensation plans, but does not expect the impact to be material.
Financial Statement Components
Net sales
Net sales consists of revenue from the sale of products, less returns, discounts and allowancesand other offsets to net sales. In our Direct-to-Consumer segments, revenue is recognized when aconsumer purchase occurs and the consumer receives the merchandise. In our Indirect-to-Consumersegments, revenue is recognized when inventory is in possession of our wholesale customers or theirappointed carriers, at which point the risk and related title passes. Provisions for discounts, rebates toconsumers and returns are recorded as a reduction of net sales in the same period as the related sale.Revenue associated with gift cards is recognized upon redemption. Revenue from gift cards and theamount of revenue recognized for gift cards not redeemed (“breakage”) is immaterial to our results ofoperations. Amounts billed to customers for delivery costs are classified as a component of net sales,and any other related delivery costs are classified as a component of cost of sales. Sales and valueadded tax collected from consumers and remitted to governmental authorities are accounted for on anet basis and are excluded from net sales on our consolidated results of operations.
- II-194 -
APPENDIX II FINANCIAL INFORMATION OF THE TUMI GROUP
Comparable store sales are calculated based on our company-owned stores that have been openfor at least a full calendar year as of the end of our annual reporting period. For example, a storeopened in October 2014 will not impact the comparable store comparison until January 1, 2016.Additionally, temporary store closings, store expansions and store relocations are excluded from thecomparable store base under most circumstances. There may be variations in the way in which some ofour competitors and other retailers calculate comparable or “same store” sales. As a result, data in thisAnnual Report on Form 10-K regarding our comparable store sales may not be comparable withsimilar data made available by other companies.
Cost of sales
Cost of sales includes the cost of finished goods purchased from our suppliers plus the cost offreight to deliver the product to our distribution centers, packaging and related duties and applicableoverhead incurred to bring the merchandise to its condition for sale. Gross margin is defined as netsales less the cost of sales.
Operating expenses
Operating expenses consist of selling, marketing, retail operations and general andadministrative expenses.
Selling. Selling expenses consist of wholesale-related salaries, benefits, commissions,incentive programs, concession fees, travel and entertainment, meetings and seminars and other sellingcosts and expenses, in each case related to our global wholesale business.
Marketing. Marketing expenses consist of in-store and consumer advertising, marketing-related salaries and benefits, travel and entertainment, lease-required advertising, consumer catalogs,market research and other consulting costs and expenses related to marketing.
Retail operations. Retail operations expenses include occupancy and staffing costs associatedwith our company-owned stores, store depreciation expense, operator fees for our e-commercewebsites, depreciation on point-of-sale fixtures, travel and entertainment, meetings and seminars,insurance and other related administrative costs and expenses.
General and administrative. General and administrative expenses consist of productdevelopment costs related to tools, dies, design and travel; shipping and distribution costs; costsassociated with running our global distribution network such as occupancy and employment expenses;costs associated with warranty and after-sales service such as employee and repair-related expensesand warranty claims; employee-related costs associated with our executive, finance, informationtechnology, legal and human resource functions; costs associated with our corporate headquarters andproduct showrooms; and legal, tax and accounting fees.
Operating income
Operating income consists of gross margin less operating expenses, and excludes other incomeand expenses (i.e., non-operating income and expenses).
- II-195 -
APPENDIX II FINANCIAL INFORMATION OF THE TUMI GROUP
Other income (expenses)
Interest expense. Interest expense consists of interest payments made pursuant to ouramended and restated credit facility and our former credit and guaranty agreement with, among others,Wells Fargo, as well as amortization of deferred financing costs, net of minimal interest income.
Dividend expense on mandatorily redeemable preferred stock and preferred equity interests.Dividend expense on mandatorily redeemable preferred stock and preferred equity interests consistssolely of non-cash accrued preferred dividends on our mandatorily redeemable preferred stock andpreferred equity interests. These amounts had not been paid but were due upon redemption.
Earnings from joint venture investment. Earnings from joint venture investment relateexclusively to Tumi Japan, a joint venture (corporation) in which we hold a 50% interest and whichsells Tumi products in 14 retail stores and to various high-end wholesale customers in Japan.
Foreign exchange gains (losses). Foreign currency exposures arise in our branch offices andsubsidiaries in Europe where transactions are denominated in a currency other than the U.S. dollar.Gains and losses such as those resulting from the settlement of receivables and payables denominatedin foreign currency are included in the earnings of the current period in “foreign exchange gains(losses).” We are also exposed to foreign currency exchange rate fluctuations with respect to ourEuropean operations as a result of its U.S. dollar-denominated historical rate intercompany loanbalance. We believe that exposure to adverse changes in exchange rates associated with revenues andexpenses of our foreign branch offices and subsidiaries are immaterial to our consolidated financialstatements. Gains and losses arising from currency exchange rate fluctuations on intercompanytransactions deemed to be long-term in nature remain in other comprehensive income.
Other non-operating income (expenses). Other non-operating income (expenses) includes allother non-operating income and expenses.
Provision for income taxes
We record income tax expenses related to federal, state, local and foreign income.
QUANTITATIVE AND QUALITATIVE DISCLOSURES ABOUT MARKET RISK
Market risk represents the risk of loss that may impact our financial position due to adversechanges in financial market prices and rates. Our market risk exposure is primarily a result offluctuations in foreign currency exchange rates and interest rates. We do not currently hold or issuefinancial instruments for trading purposes, although we have in the past entered into interest ratehedges for the purposes of limiting our exposure to fluctuations in interest rates.
Foreign currency exchange risk
Although the majority of our international net sales are billed and collected in U.S. dollars, ourEuropean sales are billed and collected in Euros, and we are therefore subject to risk associated withexchange rate fluctuations. During 2014 and 2013, we recorded gains related to the exchange ratefluctuation effect on remittances from our European affiliates and other transactions relating to ourinternational operations of $475,000 and $388,000, respectively. We recorded a $287,000 loss in 2012related to the exchange rate fluctuation effect on those remittances. Because a portion of our net sales
- II-196 -

APPENDIX II FINANCIAL INFORMATION OF THE TUMI GROUP
(approximately 10% in each of 2014, 2013 and 2012) are denominated in Euros, exchange ratefluctuations can have an impact on our reported net sales. For example, if the U.S. dollar strengthensagainst the Euro, this could have a negative effect on our European operating results when those resultsare translated into U.S. dollars. Any hypothetical loss in net sales could be partially or completelyoffset by lower selling expenses and general and administrative expenses that are generated in Euros.
Substantially all of our purchases from our foreign suppliers are denominated in U.S. dollars. Aprecipitous decline in the value of the U.S. dollar could cause our foreign suppliers to seek priceincreases on the goods they supply to us. This could impact our gross margin if market conditionsprevent us from passing those costs on to consumers. We do not currently use the derivative markets tohedge foreign currency fluctuations but may in the future consider entering into derivative financialinstruments to mitigate losses associated with these risks. We do not, and do not intend to, engage inthe practice of trading derivative securities for profit.
Interest rate risk
In connection with the IPO, on April 4, 2012, Tumi, Inc. and Tumi Stores, Inc., entered into theAmended Credit Facility, with Wells Fargo as lender and as collateral agent. The Amended CreditFacility consolidated the term loan facility and the revolving credit facility previously provided in ourformer debt facility into a single $70,000,000 senior secured revolving credit facility. See “—Liquidityand Capital Resources—Amended and restated credit facility.”
Amended credit facility. Under the Amended Credit Facility, borrowings bear interest payablequarterly or, in the case of loans subject to the LIBOR rate, monthly, bi-monthly or quarterlydepending on the interest period for such loans. Borrowings under the Amended Credit Facility willbear interest at a per annum rate equal to, at our option, the one, two, three or six-month (or such otherperiod as Wells Fargo may agree) LIBOR rate plus a margin of 1.00% or 1.25%, or a base rate plus amargin of zero or 0.25%. The margin added to the LIBOR, or base rate, will depend on our leverage atthe time. Accordingly, under the Amended Credit Facility, we continue to be exposed to market riskfrom changes in the underlying variable interest rates, which affect our cost of borrowings. Wecarefully monitor the interest rates on our borrowings under the Amended Credit Facility. As ofDecember 31, 2014, we had no balance outstanding under the Amended Credit Facility.
We do not currently have any interest rate hedging activities in place, but we may in the futureengage in hedging activities, based on, among other things, market conditions. We do not, and do notintend to, engage in the practice of trading derivative securities for profit. A 10% increase in theapplicable interest rate would not have had a material effect on interest expense to us under theAmended Credit Facility.
Inflation
Inflationary factors such as increases in the cost of sales, including raw materials costs andtransportation costs, may adversely affect our operating results. Although we do not believe thatinflation has had a material impact on our financial position to date, a high rate of inflation in the futuremay have an adverse effect on our ability to maintain our gross margin levels and our current levels ofselling expenses and general and administrative expenses as a percentage of net sales if the sale pricesof our products do not increase with any increase in cost of sales.
- II-197 -
APPENDIX II FINANCIAL INFORMATION OF THE TUMI GROUP
3. The following is an extract of the management discussion and analysis of the results of Tumifor the year ended December 31, 2015 from the 2015 annual report of Tumi.
MANAGEMENT’S DISCUSSION AND ANALYSIS OF FINANCIAL CONDITION ANDRESULTS OF OPERATIONS
The following discussion should be read in conjunction with “Selected Consolidated FinancialData” and our audited consolidated financial statements and notes thereto included elsewhere in thisreport. In addition to historical information, this discussion contains forward-looking statements thatinvolve risks, uncertainties and assumptions that could cause actual results to differ materially frommanagement’s expectations. For this purpose, any statements contained herein that are not statementsof historical fact may be deemed to be forward-looking statements. We generally identifyforward-looking statements by words such as “anticipate,” “estimate,” “expect,” “intend,” “project,”“plan,” “predict,” “believe,” “seek,” “continue,” “outlook,” “may,” “might,” “will,” “should,”“can have,” “likely” or the negative version of these words or comparable words. Factors that cancause actual results to differ materially from those reflected in the forward-looking statements include,among others, those discussed in “Risk Factors” and elsewhere in this report. We urge you not toplace undue reliance on these forward-looking statements, which reflect management’s analysis,judgment, belief or expectation only as of the date hereof. We expressly disclaim any obligation toupdate or revise any forward-looking statement, whether as a result of new information, future eventsor otherwise, except as required by applicable securities laws and regulations. Historical results arenot necessarily indicative of the results expected for any future period.
Executive Overview
We are a leading, growing, global, premium lifestyle brand whose products offer superiorquality, durability and innovative design. We offer a comprehensive line of travel and businessproducts and accessories in multiple categories. We design our products for, and market our productsto, sophisticated professionals, frequent travelers and brand-conscious individuals who enjoy thepremium status of Tumi products. We sell our products through a network of company-ownedfull-price stores and outlet stores, partner stores, concessions, shop-in-shops, specialty luggage shops,high-end department stores and e-commerce distribution channels. We have approximately2,000 points of distribution in over 75 countries, and our global distribution network is enhanced by theuse of our three logistics facilities located in the United States, Europe and Asia. We design ourproducts in our U.S. design studios and selectively collaborate with well-known, international,industrial and fashion designers for limited edition product lines. Production is sourced globallythrough a network of suppliers based principally in Asia, many of which are longtime suppliers, andthe Caribbean.
Since 2011, we have expanded our global presence by successfully implementing our growthstrategies, which have included opening additional company-owned stores and increasing wholesalepoints of distribution. Our net sales have grown from $330.0 million in 2011 to $547.7 million in 2015,representing a compound annual growth rate of 14%. This increase in net sales resulted primarily froman increase in the number of our company-owned stores from 86 as of January 1, 2011 to 177 as ofDecember 31, 2015, as well as an increase in average net sales per square foot in company-ownedstores from $972 for the year ended December 31, 2011 to $1,006 for the year ended December 31,2015, as well as growth in our e-commerce business and international wholesale sales. Our ability toexpand our points of distribution and to grow our net sales in existing stores has been driven by
- II-198 -
APPENDIX II FINANCIAL INFORMATION OF THE TUMI GROUP
increasing demand for our products, as well as growing recognition of the Tumi brand. We haveincreased our focus on our women’s line, which we estimate has grown from representingapproximately 11% of our net sales in 2011 to approximately 14% of our net sales in 2015, and onincreasing our overall online presence, for which net sales have more than doubled from 2011 to 2015.Since 2011, Direct-to-Consumer e-commerce net sales per fiscal year have ranged from 13% to 15% oftotal Direct-to-Consumer net sales.
In recent years, the travel products industry has seen a trend in consumer preferences towardslighter-weight luggage and travel accessories, as well as merchandise that makes mobile computingand communication more convenient. In light of these trends, we have developed products that fulfillthose identified needs, such as our Vapor-Lite and Tegra-Lite lines. We have also developed a varietyof mobile electronic accessories designed for frequent travelers. We estimate that the accessoriescategory represents approximately 14% of our net sales in 2015. Additionally, we have seen anincrease in the relative percentage of our net sales derived from our premium product line and updatesof our core product line, and a decrease in the relative percentage of our net sales derived from ourlegacy core product line in recent years.
We believe there is a significant opportunity to continue to expand our store base globally, andwe plan to add new company-owned and partner stores in upscale malls and prestige street venues. Weopened 27 new company-owned stores in the year ended December 31, 2015. We currently expect tocontinue to open company-owned stores, both in North America and internationally, in the foreseeablefuture. Most of the locations we have identified for new company-owned stores are for full-pricestores, while the remaining locations are for outlet stores. We also believe there are opportunities toopen additional stores in airport locations as well as luxury casinos.
We believe we have the capacity to increase our Indirect-to-Consumer net sales, both in NorthAmerica and internationally. In particular, we plan to continue to grow in key Asian markets,particularly China. Currently, more than 20% of our net sales in the Asia-Pacific region are to Japan,with Greater China and South Korea being the next largest contributors. Additionally,Indirect-to-Consumer net sales in the Asia-Pacific region have increased more than 70% in the pastfive years. We also plan to increase the number of wholesale doors in key European markets including,Germany, France and the United Kingdom, and to expand wholesale distribution in Central and SouthAmerica, while also expanding our product portfolio offered in existing wholesale doors. We believethere is also significant opportunity to open additional points of distribution in airport locations inmany of these regions. In North America, we expect to grow net sales by increasing our wholesaledoor presence, expanding our accessories business in department stores, targeting the assortment ofproducts available to third party e-commerce providers and increasing penetration of the Canadianmarket through department stores, specialty stores, e-commerce sales and new distribution partners.Since 2011, Indirect-to-Consumer net sales have increased in EMEA, the Asia-Pacific region, NorthAmerica and Central and South America.
We generally expect the payback of our investment in a new company-owned store to occur inless than two and a half years. Over the long-term, we also believe we can increase our average netsales per square foot by continuing to improve store efficiency. Our new product development effortshelp drive store traffic while our retail performance maximization program and associate trainingefforts contribute to improved store efficiency. Over the long-term, we also believe we can increaseour net sales by capitalizing on our flexible distribution model. We will continue to look for ways toimprove our capital efficiency in both current and new markets in the future.
- II-199 -
APPENDIX II FINANCIAL INFORMATION OF THE TUMI GROUP
Key Performance Indicators
Key performance indicators that we use to manage our business and evaluate our financialresults and operating performance are average net sales per square foot and “constant currency”performance measures.
Average net sales per square foot, which relates to company-owned stores only, provides uswith a measure to evaluate our store sales trends and to assess the operational performance of ourstores. Average net sales per square foot is calculated using net sales for the last twelve months for allstores open for the full twelve months. This measure is supplemented by a number of non-financialoperating metrics related to store performance, which provide benchmarks against which to evaluatestore efficiencies but are not considered by management to be reliable financial metrics.
While average net sales per square foot have increased over time, in the current year averagenet sales per square foot decreased by approximately $76, or 7%, to $1,006 as of December 31, 2015from $1,082 as of December 31, 2014. This decrease was primarily due to negative overall comparablestore sales in the year ended December 31, 2015, as well as the addition of several large but lessmature stores to the square footage base during the year ended December 31, 2015.
We also refer to certain financial metrics on a “constant currency” basis so that the businessresults can be viewed without the impact of translating foreign currencies into U.S. dollars and theimpact of currency rate changes on foreign currency denominated transactions, thereby facilitatingperiod-to-period comparisons of our business performance. Generally, when the dollar eitherstrengthens or weakens against other currencies, metrics at constant currency rates or adjusting forcurrency will be higher or lower than results reported at actual exchange rates.
“Constant currency” performance measures are not measures presented in accordance withU.S. GAAP. Undue reliance should not be placed on these measures as our only measures of operatingperformance. Constant currency performance measures have limitations as analytical tools. Whenassessing our operating performance, investors should not use constant currency performance measuresin isolation or as substitutes for operating income, net income or net sales.
Reconciliation of Constant Currency Financial Measures(In thousands, except per share data)
For the years ended December 31,
2015 2014 % Change
As ReportedConstantCurrency As Reported As Reported
ConstantCurrency
Net sales . . . . . . . . . . . . . . . . . . . . . . . . . . . . . . . . $547,655 $562,503 $527,194 3.9% 6.7%Operating income . . . . . . . . . . . . . . . . . . . . . . . . . $ 96,888 $100,987 $ 93,430 3.7% 8.1%Operating income margin . . . . . . . . . . . . . . . . . . . 17.7% 18.0% 17.7%Net income . . . . . . . . . . . . . . . . . . . . . . . . . . . . . . $ 63,013 $ 65,438 $ 58,009 8.6% 12.8%Diluted earnings per share . . . . . . . . . . . . . . . . . . $ 0.93 $ 0.96 $ 0.85 8.6% 12.8%
Constant currency amounts exclude both the impact of translating foreign currencies intoU.S. dollars and the impact of currency rate changes on foreign currency denominated transactions.
- II-200 -
APPENDIX II FINANCIAL INFORMATION OF THE TUMI GROUP
Our Operating Segments
We evaluate operating performance based on net sales and operating income in four operatingsegments.
Direct-to-Consumer North America
As of December 31, 2015, we sold our products directly to consumers through a network of154 company-owned retail stores consisting of full-price stores and outlet stores strategicallypositioned in high-end retail malls or street venues. We also sell our products directly to consumersthrough our e-commerce website.
Direct-to-Consumer International
As of December 31, 2015, we sold directly to consumers through a network of23 company-owned full-price and outlet stores in high-end street venues and select malls ininternational locations. We also sell our products directly to consumers through our international e-commerce websites.
Indirect-to-Consumer North America
As of December 31, 2015, we sold to wholesale customers in North America throughapproximately 800 doors, including specialty luggage retailers, prestige department stores andbusiness-to-business channels. Many of our wholesale customers also operate their own e-commercewebsites through which they sell our products. Our products are also sold in partner stores, which areowned and operated by local distributors or retailers that purchase Tumi products from the Companythrough a wholesale arrangement. These locations carry only Tumi products and are governed by strictoperating guidelines that we dictate with regard to brand presentation. The employees at partner storelocations are not our employees but rather those of the distributors or retailers.
Indirect-to-Consumer International
As of December 31, 2015, we sold our products to international wholesale customers throughapproximately 1,000 doors, approximately 55% of which are in the EMEA region, 40% of which are inthe Asia-Pacific region, and 5% of which are in Central and South America. We have distributionchannels in Australia, China, Europe, Hong Kong, the Middle East, South Africa, Japan, South Korea,Southeast Asia and Taiwan, among others. Our products are also sold in partner stores, which areowned and operated by local distributors or retailers that purchase Tumi products from the Companythrough a wholesale arrangement. These locations carry only Tumi products and are governed by strictoperating guidelines that we dictate with regard to brand presentation. The employees at partner storelocations are not our employees but rather those of the distributors or retailers. We also operateconcessions in department stores throughout Europe and the Middle East. Many of our wholesalecustomers also operate their own e-commerce websites through which they sell our products.
Certain corporate expenses are not specifically allocated to individual operating segments, suchas product design and development and certain general and administrative costs, as well as certainmarketing, warehouse and other expenses.
For an explanation of the financial statement components discussed in this section,see “—Financial Statement Components” and Note 1 to our audited consolidated financial statements.
- II-201 -
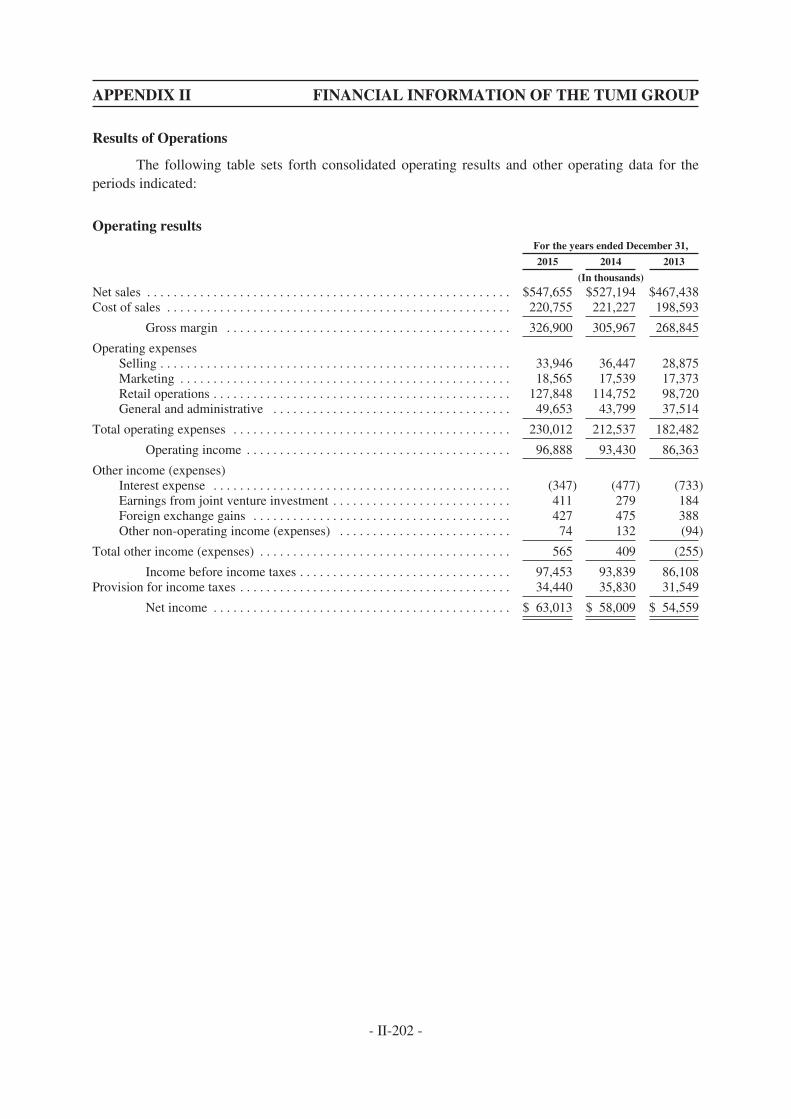
APPENDIX II FINANCIAL INFORMATION OF THE TUMI GROUP
Results of Operations
The following table sets forth consolidated operating results and other operating data for theperiods indicated:
Operating resultsFor the years ended December 31,
2015 2014 2013
(In thousands)Net sales . . . . . . . . . . . . . . . . . . . . . . . . . . . . . . . . . . . . . . . . . . . . . . . . . . . . . . . $547,655 $527,194 $467,438Cost of sales . . . . . . . . . . . . . . . . . . . . . . . . . . . . . . . . . . . . . . . . . . . . . . . . . . . . 220,755 221,227 198,593
Gross margin . . . . . . . . . . . . . . . . . . . . . . . . . . . . . . . . . . . . . . . . . . . 326,900 305,967 268,845
Operating expensesSelling . . . . . . . . . . . . . . . . . . . . . . . . . . . . . . . . . . . . . . . . . . . . . . . . . . . . . 33,946 36,447 28,875Marketing . . . . . . . . . . . . . . . . . . . . . . . . . . . . . . . . . . . . . . . . . . . . . . . . . . 18,565 17,539 17,373Retail operations . . . . . . . . . . . . . . . . . . . . . . . . . . . . . . . . . . . . . . . . . . . . . 127,848 114,752 98,720General and administrative . . . . . . . . . . . . . . . . . . . . . . . . . . . . . . . . . . . . 49,653 43,799 37,514
Total operating expenses . . . . . . . . . . . . . . . . . . . . . . . . . . . . . . . . . . . . . . . . . . 230,012 212,537 182,482
Operating income . . . . . . . . . . . . . . . . . . . . . . . . . . . . . . . . . . . . . . . . 96,888 93,430 86,363
Other income (expenses)Interest expense . . . . . . . . . . . . . . . . . . . . . . . . . . . . . . . . . . . . . . . . . . . . . (347) (477) (733)Earnings from joint venture investment . . . . . . . . . . . . . . . . . . . . . . . . . . . 411 279 184Foreign exchange gains . . . . . . . . . . . . . . . . . . . . . . . . . . . . . . . . . . . . . . . 427 475 388Other non-operating income (expenses) . . . . . . . . . . . . . . . . . . . . . . . . . . 74 132 (94)
Total other income (expenses) . . . . . . . . . . . . . . . . . . . . . . . . . . . . . . . . . . . . . . 565 409 (255)
Income before income taxes . . . . . . . . . . . . . . . . . . . . . . . . . . . . . . . . 97,453 93,839 86,108Provision for income taxes . . . . . . . . . . . . . . . . . . . . . . . . . . . . . . . . . . . . . . . . . 34,440 35,830 31,549
Net income . . . . . . . . . . . . . . . . . . . . . . . . . . . . . . . . . . . . . . . . . . . . . $ 63,013 $ 58,009 $ 54,559
- II-202 -
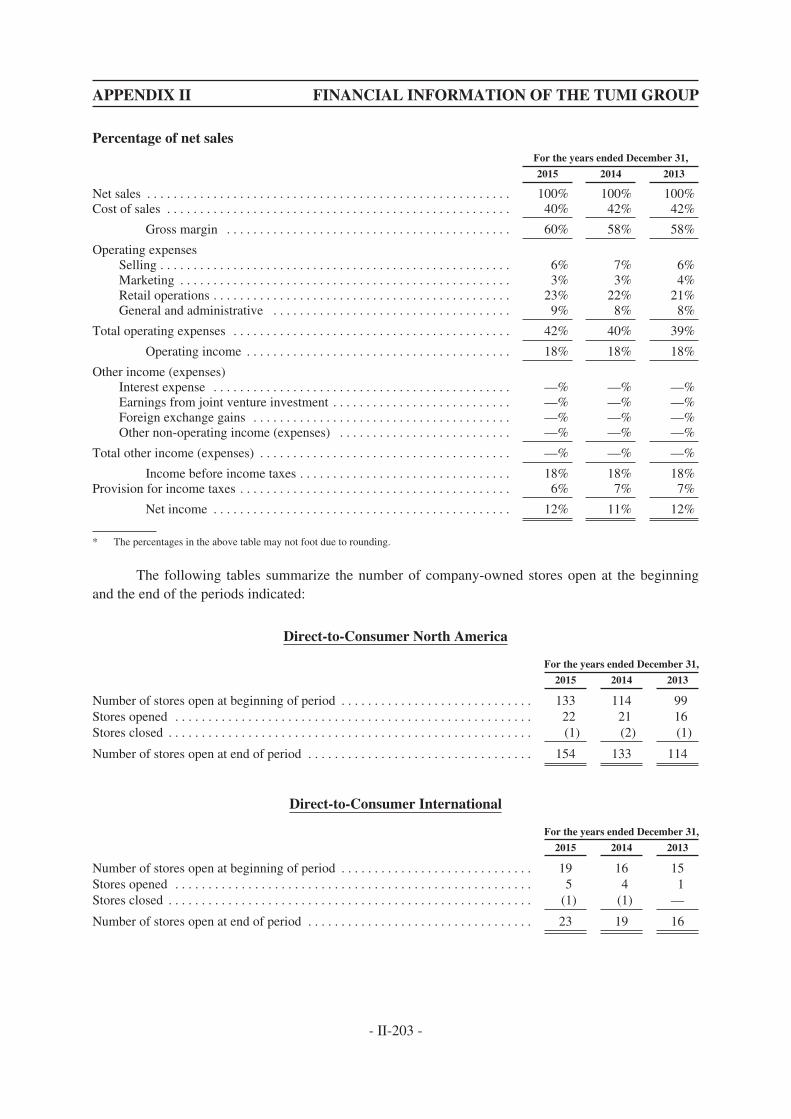
APPENDIX II FINANCIAL INFORMATION OF THE TUMI GROUP
Percentage of net salesFor the years ended December 31,
2015 2014 2013
Net sales . . . . . . . . . . . . . . . . . . . . . . . . . . . . . . . . . . . . . . . . . . . . . . . . . . . . . . . 100% 100% 100%Cost of sales . . . . . . . . . . . . . . . . . . . . . . . . . . . . . . . . . . . . . . . . . . . . . . . . . . . . 40% 42% 42%
Gross margin . . . . . . . . . . . . . . . . . . . . . . . . . . . . . . . . . . . . . . . . . . . 60% 58% 58%
Operating expensesSelling . . . . . . . . . . . . . . . . . . . . . . . . . . . . . . . . . . . . . . . . . . . . . . . . . . . . . 6% 7% 6%Marketing . . . . . . . . . . . . . . . . . . . . . . . . . . . . . . . . . . . . . . . . . . . . . . . . . . 3% 3% 4%Retail operations . . . . . . . . . . . . . . . . . . . . . . . . . . . . . . . . . . . . . . . . . . . . . 23% 22% 21%General and administrative . . . . . . . . . . . . . . . . . . . . . . . . . . . . . . . . . . . . 9% 8% 8%
Total operating expenses . . . . . . . . . . . . . . . . . . . . . . . . . . . . . . . . . . . . . . . . . . 42% 40% 39%
Operating income . . . . . . . . . . . . . . . . . . . . . . . . . . . . . . . . . . . . . . . . 18% 18% 18%
Other income (expenses)Interest expense . . . . . . . . . . . . . . . . . . . . . . . . . . . . . . . . . . . . . . . . . . . . . —% —% —%Earnings from joint venture investment . . . . . . . . . . . . . . . . . . . . . . . . . . . —% —% —%Foreign exchange gains . . . . . . . . . . . . . . . . . . . . . . . . . . . . . . . . . . . . . . . —% —% —%Other non-operating income (expenses) . . . . . . . . . . . . . . . . . . . . . . . . . . —% —% —%
Total other income (expenses) . . . . . . . . . . . . . . . . . . . . . . . . . . . . . . . . . . . . . . —% —% —%
Income before income taxes . . . . . . . . . . . . . . . . . . . . . . . . . . . . . . . . 18% 18% 18%Provision for income taxes . . . . . . . . . . . . . . . . . . . . . . . . . . . . . . . . . . . . . . . . . 6% 7% 7%
Net income . . . . . . . . . . . . . . . . . . . . . . . . . . . . . . . . . . . . . . . . . . . . . 12% 11% 12%
* The percentages in the above table may not foot due to rounding.
The following tables summarize the number of company-owned stores open at the beginningand the end of the periods indicated:
Direct-to-Consumer North America
For the years ended December 31,
2015 2014 2013
Number of stores open at beginning of period . . . . . . . . . . . . . . . . . . . . . . . . . . . . . 133 114 99Stores opened . . . . . . . . . . . . . . . . . . . . . . . . . . . . . . . . . . . . . . . . . . . . . . . . . . . . . . 22 21 16Stores closed . . . . . . . . . . . . . . . . . . . . . . . . . . . . . . . . . . . . . . . . . . . . . . . . . . . . . . . (1) (2) (1)
Number of stores open at end of period . . . . . . . . . . . . . . . . . . . . . . . . . . . . . . . . . . 154 133 114
Direct-to-Consumer International
For the years ended December 31,
2015 2014 2013
Number of stores open at beginning of period . . . . . . . . . . . . . . . . . . . . . . . . . . . . . 19 16 15Stores opened . . . . . . . . . . . . . . . . . . . . . . . . . . . . . . . . . . . . . . . . . . . . . . . . . . . . . . 5 4 1Stores closed . . . . . . . . . . . . . . . . . . . . . . . . . . . . . . . . . . . . . . . . . . . . . . . . . . . . . . . (1) (1) —
Number of stores open at end of period . . . . . . . . . . . . . . . . . . . . . . . . . . . . . . . . . . 23 19 16
- II-203 -
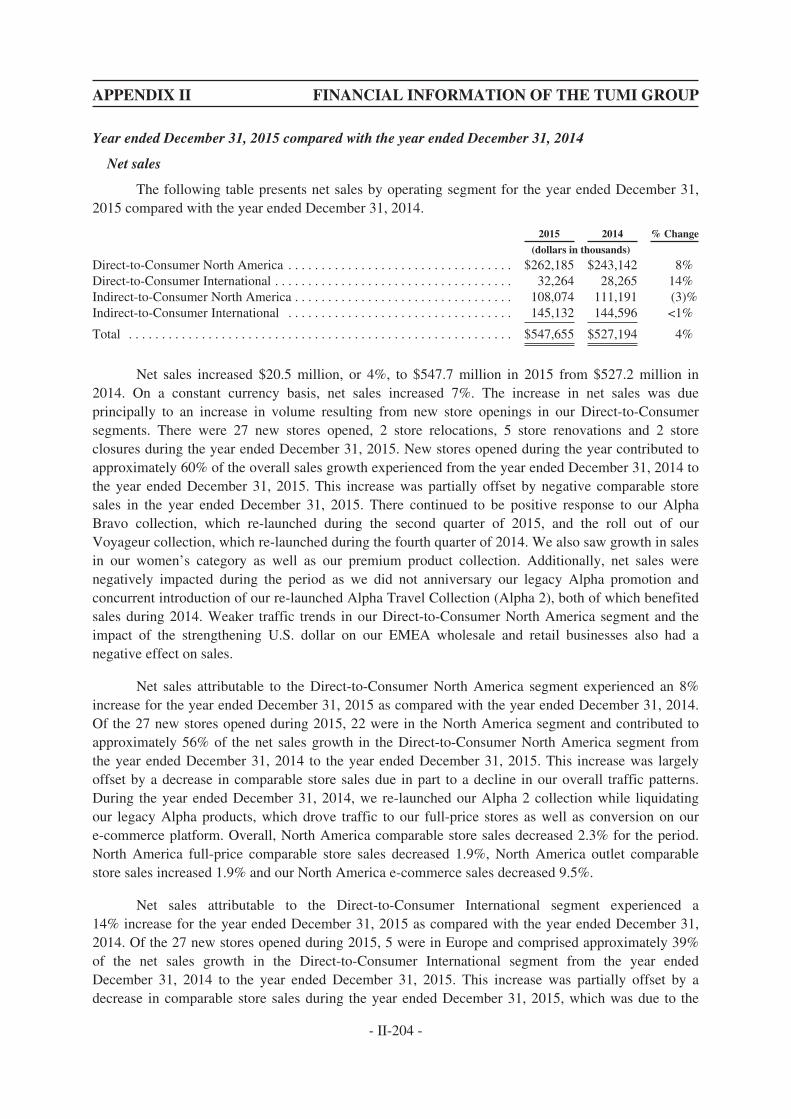
APPENDIX II FINANCIAL INFORMATION OF THE TUMI GROUP
Year ended December 31, 2015 compared with the year ended December 31, 2014
Net sales
The following table presents net sales by operating segment for the year ended December 31,2015 compared with the year ended December 31, 2014.
2015 2014 % Change
(dollars in thousands)
Direct-to-Consumer North America . . . . . . . . . . . . . . . . . . . . . . . . . . . . . . . . . . $262,185 $243,142 8%Direct-to-Consumer International . . . . . . . . . . . . . . . . . . . . . . . . . . . . . . . . . . . . 32,264 28,265 14%Indirect-to-Consumer North America . . . . . . . . . . . . . . . . . . . . . . . . . . . . . . . . . 108,074 111,191 (3)%Indirect-to-Consumer International . . . . . . . . . . . . . . . . . . . . . . . . . . . . . . . . . . 145,132 144,596 <1%
Total . . . . . . . . . . . . . . . . . . . . . . . . . . . . . . . . . . . . . . . . . . . . . . . . . . . . . . . . . . $547,655 $527,194 4%
Net sales increased $20.5 million, or 4%, to $547.7 million in 2015 from $527.2 million in2014. On a constant currency basis, net sales increased 7%. The increase in net sales was dueprincipally to an increase in volume resulting from new store openings in our Direct-to-Consumersegments. There were 27 new stores opened, 2 store relocations, 5 store renovations and 2 storeclosures during the year ended December 31, 2015. New stores opened during the year contributed toapproximately 60% of the overall sales growth experienced from the year ended December 31, 2014 tothe year ended December 31, 2015. This increase was partially offset by negative comparable storesales in the year ended December 31, 2015. There continued to be positive response to our AlphaBravo collection, which re-launched during the second quarter of 2015, and the roll out of ourVoyageur collection, which re-launched during the fourth quarter of 2014. We also saw growth in salesin our women’s category as well as our premium product collection. Additionally, net sales werenegatively impacted during the period as we did not anniversary our legacy Alpha promotion andconcurrent introduction of our re-launched Alpha Travel Collection (Alpha 2), both of which benefitedsales during 2014. Weaker traffic trends in our Direct-to-Consumer North America segment and theimpact of the strengthening U.S. dollar on our EMEA wholesale and retail businesses also had anegative effect on sales.
Net sales attributable to the Direct-to-Consumer North America segment experienced an 8%increase for the year ended December 31, 2015 as compared with the year ended December 31, 2014.Of the 27 new stores opened during 2015, 22 were in the North America segment and contributed toapproximately 56% of the net sales growth in the Direct-to-Consumer North America segment fromthe year ended December 31, 2014 to the year ended December 31, 2015. This increase was largelyoffset by a decrease in comparable store sales due in part to a decline in our overall traffic patterns.During the year ended December 31, 2014, we re-launched our Alpha 2 collection while liquidatingour legacy Alpha products, which drove traffic to our full-price stores as well as conversion on oure-commerce platform. Overall, North America comparable store sales decreased 2.3% for the period.North America full-price comparable store sales decreased 1.9%, North America outlet comparablestore sales increased 1.9% and our North America e-commerce sales decreased 9.5%.
Net sales attributable to the Direct-to-Consumer International segment experienced a14% increase for the year ended December 31, 2015 as compared with the year ended December 31,2014. Of the 27 new stores opened during 2015, 5 were in Europe and comprised approximately 39%of the net sales growth in the Direct-to-Consumer International segment from the year endedDecember 31, 2014 to the year ended December 31, 2015. This increase was partially offset by adecrease in comparable store sales during the year ended December 31, 2015, which was due to the
- II-204 -
APPENDIX II FINANCIAL INFORMATION OF THE TUMI GROUP
translation effect the strengthening of the U.S. dollar had on our sales denominated in Euros. Overall,our international comparable store sales decreased 3.9% (increased 14.9% in Euros) for the period. Ourinternational full-price comparable store sales were down 6.9% (up 11.3% in Euros) and outletcomparable store sales were down 3.2% (up 15.7% in Euros). Our international e-commerce salesincreased 4.7% (increased 25.1% in Euros).
Overall, comparable store sales for all Direct-to-Consumer channels decreased 2.5% globallyfor the year ended December 31, 2015 as compared with the year ended December 31, 2014. On aconstant currency basis, comparable store sales decreased 0.8%.
Net sales attributable to the Indirect-to-Consumer North America segment decreased 3% for theyear ended December 31, 2015 as compared with the year ended December 31, 2014. Our Indirect-to-Consumer North America net sales have been negatively impacted by our decision to limit ourspecial markets business in an effort to reduce the incidences of product diversion and trans-shippingabuses that have become a more common occurrence in Asia, particularly in Japan and Korea, wherethe Tumi brand is becoming increasingly popular. Certain special markets customers have been asource of unauthorized product diversion in the past. While difficult to assess the financial impact oftrans-shipping, we believe that it is damaging to the brand image in these emerging markets. Inaddition, we experienced a decline in sales to our specialty stores due to a decline in the number of ourspecialty store accounts as well as the discontinuation of our T-Tech line in 2014. We also experiencedweaker sales within our Canadian wholesale business where we believe the strengthening U.S. dollarhas had a dampening effect on the replenishment of our wholesalers’ orders during the year endedDecember 31, 2015.
Net sales attributable to the Indirect-to-Consumer International segment increased less than 1%for the year ended December 31, 2015 as compared with the year ended December 31, 2014. In ourEMEA region, strong sales growth in local currency has been negatively impacted by the adverseeffect the strengthening U.S. dollar has had on our wholesale business. In our Asia-Pacific region,while we continue to see a positive response to the re-launch of our Alpha Bravo collection, sales inSouth Korea were negatively impacted by the MERS virus outbreak. In addition, sales in mainlandChina and Hong Kong were negatively impacted by the slow down of the Chinese economy.
Cost of sales
Cost of sales decreased by $0.5 million, or 0.2%, to $220.8 million for the year endedDecember 31, 2015 as compared to $221.2 million for the year ended December 31, 2014. In addition,gross margin increased by $20.9 million, or 6.8%, to $326.9 million for the year ended December 31,2015 as compared to $306.0 million for the year ended December 31, 2014. The decrease in cost ofsales, despite the increase in sales, was largely driven by a shift in channel mix from wholesale toretail, as well as a change in product mix during the year ended December 31, 2015.
Gross margin as a percentage of net sales is dependent upon a variety of factors includingchanges in relative sales mix among distribution channels, changes in the mix of product sold, thetiming and level of promotional activities, fluctuations in foreign currency exchange rates, andfluctuations in material costs. These factors, among others, may cause gross margin as a percentage ofnet sales to fluctuate from year to year. Gross margin as a percentage of net sales was 59.7% for theyear ended December 31, 2015 and 58.0% for the year ended December 31, 2014. The increase wasprimarily attributable to our decision to be less promotional during the year ended December 31, 2015.
- II-205 -
APPENDIX II FINANCIAL INFORMATION OF THE TUMI GROUP
In addition, we saw a shift in channel mix from wholesale to retail, as retail sales representedapproximately 53.8% of total sales for the year ended December 31, 2015 compared to 51.5% in theyear ended December 31, 2014, as well as a shift in product mix. We continue to expand our retailfootprint as part of our long-term growth strategy and we have opened 27 new stores during the yearended December 31, 2015. We typically realize higher gross margins in our retail business ascompared to our wholesale business.
Selling expense
Selling expense decreased by $2.5 million, or 6.9%, to $33.9 million for the year endedDecember 31, 2015 as compared to $36.4 million for the year ended December 31, 2014. This decreasewas primarily driven by $1.2 million in savings from the cost reduction actions taken in thefirst quarter of 2015 as well as savings in other personnel related costs such as travel expenses,incentive compensation and commissions.
Marketing expense
Marketing expense increased by $1.0 million, or 5.8%, to $18.6 million for the year endedDecember 31, 2015 as compared to $17.5 million for the year ended December 31, 2014. The increasein marketing expense was primarily due to an increase in digital marketing during 2015. This waspartially offset by the elimination of catalog mailings and a reduction in product launch promotionalactivity.
Retail Operations expense
Retail operations expense increased by $13.1 million, or 11.4%, to $127.8 million for the yearended December 31, 2015 as compared to $114.8 million for the year ended December 31, 2014. Theincrease in retail operations expense was driven primarily by the opening of 27 new stores during theyear ended December 31, 2015. In addition, we recorded an impairment charge of $0.8 million relatedto one of our retail locations in Europe during the year ended December 31, 2015.
General and administrative expense
General and administrative expense increased by $5.9 million, or 13.4%, to $49.7 million forthe year ended December 31, 2015 as compared to $43.8 million for the year ended December 31,2014. The increase in general and administrative expense was primarily driven by the additional costsresulting from our decision to eliminate redundancies, streamline processes, and leverage fixed costswithin certain selling, general and administrative functions. Of these severance and termination costs,approximately $1.0 million were included in general and administrative expenses in the year endedDecember 31, 2015. In addition, during 2015, we incurred approximately $1.4 million for businessdevelopment activities, including the acquisition of Tumi Japan. We also increased our after salesservice expense by approximately $1.0 million and incurred costs of approximately $0.8 millionrelating to tax planning for our Asian sourcing operations.
- II-206 -
APPENDIX II FINANCIAL INFORMATION OF THE TUMI GROUP
Operating income
The following table presents operating income (loss) by operating segment for the year endedDecember 31, 2015 compared with the year ended December 31, 2014.
2015 2014 % Change
(dollars in thousands)
Direct-to-Consumer North America . . . . . . . . . . . . . . . . . . . . . . . . . . . . . . . . . . $ 71,932 $ 69,871 3%Direct-to-Consumer International . . . . . . . . . . . . . . . . . . . . . . . . . . . . . . . . . . . . 3,357 2,793 20%Indirect-to-Consumer North America . . . . . . . . . . . . . . . . . . . . . . . . . . . . . . . . . 44,005 41,213 7%Indirect-to-Consumer International . . . . . . . . . . . . . . . . . . . . . . . . . . . . . . . . . . . 48,488 45,291 7%Non-allocated corporate expenses . . . . . . . . . . . . . . . . . . . . . . . . . . . . . . . . . . . . (70,894) (65,738) (8)%
Total . . . . . . . . . . . . . . . . . . . . . . . . . . . . . . . . . . . . . . . . . . . . . . . . . . . . . . . . . . . $ 96,888 $ 93,430 4%
Operating income increased $3.5 million, or 4%, to $96.9 million in 2015 from $93.4 million in2014. On a constant currency basis, operating income increased 8%. Our operating segments havebenefited from continued growth in most segments, principally volume related, store openings in theDirect-to-Consumer segments, and strong performance in our Asia-Pacific region, partially offset bynegative comparable store performance as well as higher retail operations expenses related to the costof new store openings in 2015. Historically, company-owned store operating margins generallystrengthen after their first year of operation. Additionally, our higher operating expenses for the yearended December 31, 2015 include additional costs resulting from our decision to eliminateredundancies, streamline processes, and leverage fixed costs within certain selling, general andadministrative functions. In this regard, the Company reduced headcount and incurred relatedseverance and termination costs in the amount of approximately $2.5 million during the year endedDecember 31, 2015.
Operating income attributable to the Direct-to-Consumer North America segment experienced a3% increase for the year ended December 31, 2015 as compared with the year ended December 31,2014. This was primarily due to growth from 22 new stores opened during the year endedDecember 31, 2015, partially offset by a decline in comparable store sales during 2015.
Operating income attributable to the Direct-to-Consumer International segment experienced a20% increase for the year ended December 31, 2015 as compared with the year ended December 31,2014. This increase was primarily due to the sales growth from our new flagship store on Regent Streetin London, which opened during 2014, as well as growth in our international e-commerce business.This was partially offset by a decline in comparable store sales, which was due to the translation effectthe strengthening of the U.S. dollar had on our sales denominated in Euros, as well as an impairmentcharge of $0.8 million related to one of our retail locations in Europe.
Operating income attributable to the Indirect-to-Consumer North America segment experienceda 7% increase for the year ended December 31, 2015 as compared with the year ended December 31,2014. This increase was driven by higher gross margins due to less promotional activity during theyear ended December 31, 2015, largely offset by a decrease in sales to specialty stores and our specialmarkets business.
Operating income attributable to the Indirect-to-Consumer International segment experienced a7% increase for the year ended December 31, 2015 as compared with the year ended December 31,2014. This increase was primarily due to an increase in gross margin dollars realized during the yearended December 31, 2015, particularly in our Asia-Pacific region, as well as improved operatingexpense leverage in 2015.
- II-207 -
APPENDIX II FINANCIAL INFORMATION OF THE TUMI GROUP
Non-allocated corporate expenses increased 8% for the year ended December 31, 2015 ascompared with the year ended December 31, 2014. This increase was primarily due to our decision toeliminate redundancies, streamline processes, and leverage fixed costs within certain selling, generaland administrative functions. Of the aforementioned severance and termination costs, approximately$1.9 million were included in non-allocated corporate expenses in the year ended December 31, 2015.In addition, during 2015, we incurred approximately $1.4 million for business development activities,including the acquisition of Tumi Japan. We also increased our after sales service expense byapproximately $1.0 million and incurred additional costs of approximately $0.8 million relating to taxplanning for our Asian sourcing operations.
Operating margin remained consistent at 18% for the years ended December 31, 2015 and2014, as the previously mentioned severance and termination costs related to our cost reductionprogram, as well as retail operations expense for new stores opened during 2015, offset some of ourfixed cost leverage. Operating margin was positively impacted by an increase in sales and gross margindollars realized due primarily to our decision to be less promotional, a shift in channel mix fromwholesale to retail and a shift in product mix during the year ended December 31, 2015.
Other income and expense
Total other income, net increased $0.2 million, or 38%, to $0.6 million in 2015 from$0.4 million in 2014. This was mainly driven by an increase in earnings from our joint venture duringthe year ended December 31, 2015.
Income tax expense
Provision for income taxes decreased $1.4 million, or 4%, to $34.4 million in 2015 from$35.8 million in 2014, due primarily to a lower effective tax rate for the year ended December 31,2015. The change in the effective tax rate was largely driven by the mix in foreign and domestic sourcepre-tax income for the year ended December 31, 2015.
Net income
Net income increased $5.0 million, or 9%, to $63.0 million in 2015 from $58.0 million in 2014.This increase was primarily driven by the increase in gross margin dollars realized as well as a lowereffective tax rate, partially offset by the aforementioned increase in retail operations expense for newstores opened during 2015.
Basic and diluted weighted average shares outstanding for the years ended December 31, 2015and 2014 were 67.9 million shares. Basic and diluted EPS was $0.93 per common share for the yearended December 31, 2015 versus $0.85 per common share for the year ended December 31, 2014.
- II-208 -
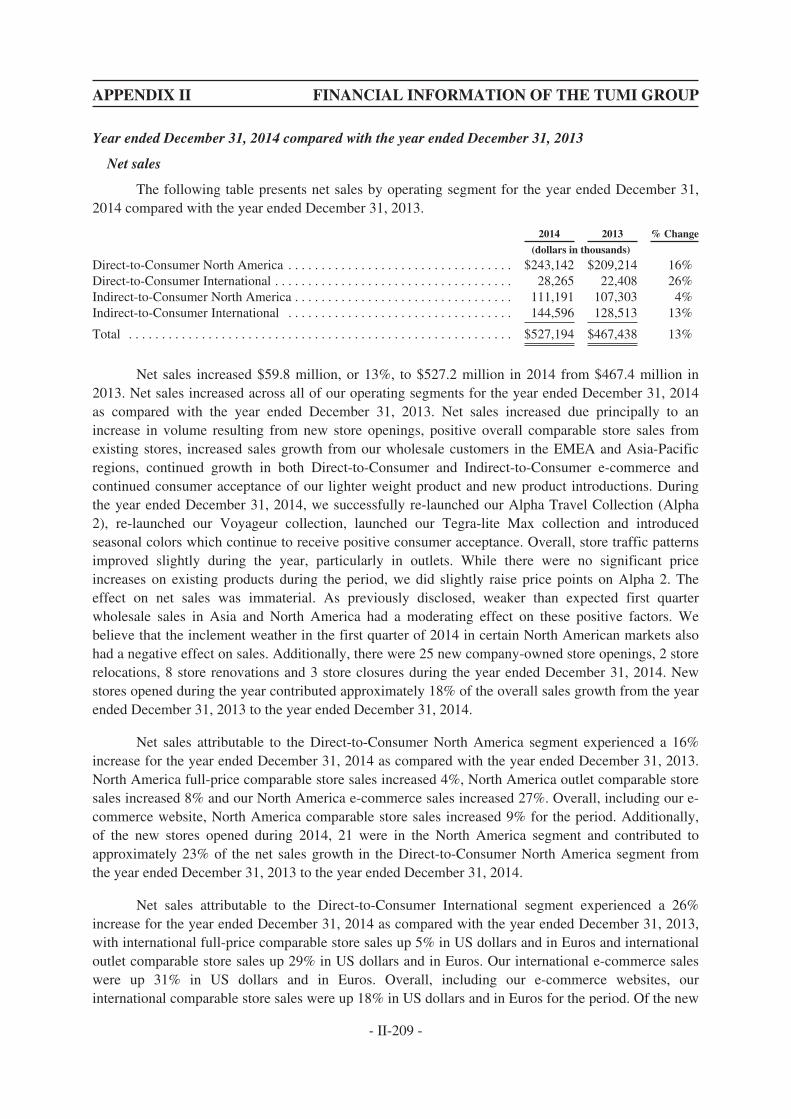
APPENDIX II FINANCIAL INFORMATION OF THE TUMI GROUP
Year ended December 31, 2014 compared with the year ended December 31, 2013
Net sales
The following table presents net sales by operating segment for the year ended December 31,2014 compared with the year ended December 31, 2013.
2014 2013 % Change
(dollars in thousands)
Direct-to-Consumer North America . . . . . . . . . . . . . . . . . . . . . . . . . . . . . . . . . . $243,142 $209,214 16%Direct-to-Consumer International . . . . . . . . . . . . . . . . . . . . . . . . . . . . . . . . . . . . 28,265 22,408 26%Indirect-to-Consumer North America . . . . . . . . . . . . . . . . . . . . . . . . . . . . . . . . . 111,191 107,303 4%Indirect-to-Consumer International . . . . . . . . . . . . . . . . . . . . . . . . . . . . . . . . . . 144,596 128,513 13%
Total . . . . . . . . . . . . . . . . . . . . . . . . . . . . . . . . . . . . . . . . . . . . . . . . . . . . . . . . . . $527,194 $467,438 13%
Net sales increased $59.8 million, or 13%, to $527.2 million in 2014 from $467.4 million in2013. Net sales increased across all of our operating segments for the year ended December 31, 2014as compared with the year ended December 31, 2013. Net sales increased due principally to anincrease in volume resulting from new store openings, positive overall comparable store sales fromexisting stores, increased sales growth from our wholesale customers in the EMEA and Asia-Pacificregions, continued growth in both Direct-to-Consumer and Indirect-to-Consumer e-commerce andcontinued consumer acceptance of our lighter weight product and new product introductions. Duringthe year ended December 31, 2014, we successfully re-launched our Alpha Travel Collection (Alpha2), re-launched our Voyageur collection, launched our Tegra-lite Max collection and introducedseasonal colors which continue to receive positive consumer acceptance. Overall, store traffic patternsimproved slightly during the year, particularly in outlets. While there were no significant priceincreases on existing products during the period, we did slightly raise price points on Alpha 2. Theeffect on net sales was immaterial. As previously disclosed, weaker than expected first quarterwholesale sales in Asia and North America had a moderating effect on these positive factors. Webelieve that the inclement weather in the first quarter of 2014 in certain North American markets alsohad a negative effect on sales. Additionally, there were 25 new company-owned store openings, 2 storerelocations, 8 store renovations and 3 store closures during the year ended December 31, 2014. Newstores opened during the year contributed approximately 18% of the overall sales growth from the yearended December 31, 2013 to the year ended December 31, 2014.
Net sales attributable to the Direct-to-Consumer North America segment experienced a 16%increase for the year ended December 31, 2014 as compared with the year ended December 31, 2013.North America full-price comparable store sales increased 4%, North America outlet comparable storesales increased 8% and our North America e-commerce sales increased 27%. Overall, including our e-commerce website, North America comparable store sales increased 9% for the period. Additionally,of the new stores opened during 2014, 21 were in the North America segment and contributed toapproximately 23% of the net sales growth in the Direct-to-Consumer North America segment fromthe year ended December 31, 2013 to the year ended December 31, 2014.
Net sales attributable to the Direct-to-Consumer International segment experienced a 26%increase for the year ended December 31, 2014 as compared with the year ended December 31, 2013,with international full-price comparable store sales up 5% in US dollars and in Euros and internationaloutlet comparable store sales up 29% in US dollars and in Euros. Our international e-commerce saleswere up 31% in US dollars and in Euros. Overall, including our e-commerce websites, ourinternational comparable store sales were up 18% in US dollars and in Euros for the period. Of the new
- II-209 -
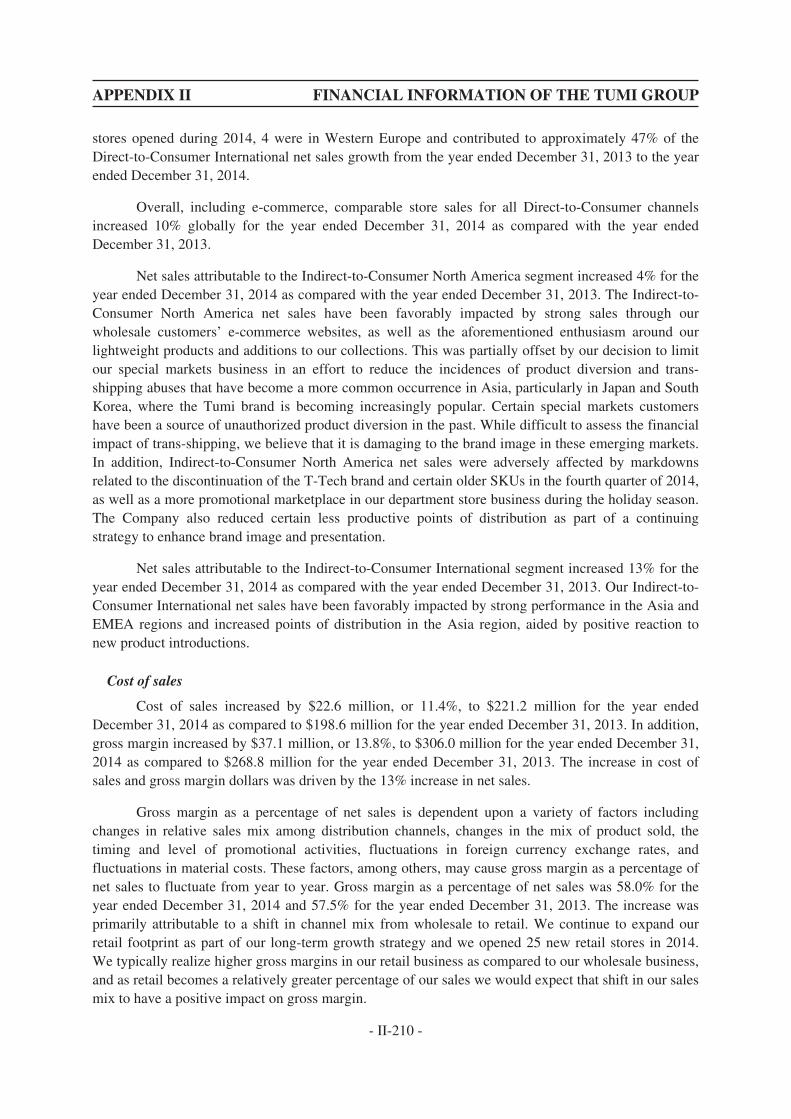
APPENDIX II FINANCIAL INFORMATION OF THE TUMI GROUP
stores opened during 2014, 4 were in Western Europe and contributed to approximately 47% of theDirect-to-Consumer International net sales growth from the year ended December 31, 2013 to the yearended December 31, 2014.
Overall, including e-commerce, comparable store sales for all Direct-to-Consumer channelsincreased 10% globally for the year ended December 31, 2014 as compared with the year endedDecember 31, 2013.
Net sales attributable to the Indirect-to-Consumer North America segment increased 4% for theyear ended December 31, 2014 as compared with the year ended December 31, 2013. The Indirect-to-Consumer North America net sales have been favorably impacted by strong sales through ourwholesale customers’ e-commerce websites, as well as the aforementioned enthusiasm around ourlightweight products and additions to our collections. This was partially offset by our decision to limitour special markets business in an effort to reduce the incidences of product diversion and trans-shipping abuses that have become a more common occurrence in Asia, particularly in Japan and SouthKorea, where the Tumi brand is becoming increasingly popular. Certain special markets customershave been a source of unauthorized product diversion in the past. While difficult to assess the financialimpact of trans-shipping, we believe that it is damaging to the brand image in these emerging markets.In addition, Indirect-to-Consumer North America net sales were adversely affected by markdownsrelated to the discontinuation of the T-Tech brand and certain older SKUs in the fourth quarter of 2014,as well as a more promotional marketplace in our department store business during the holiday season.The Company also reduced certain less productive points of distribution as part of a continuingstrategy to enhance brand image and presentation.
Net sales attributable to the Indirect-to-Consumer International segment increased 13% for theyear ended December 31, 2014 as compared with the year ended December 31, 2013. Our Indirect-to-Consumer International net sales have been favorably impacted by strong performance in the Asia andEMEA regions and increased points of distribution in the Asia region, aided by positive reaction tonew product introductions.
Cost of sales
Cost of sales increased by $22.6 million, or 11.4%, to $221.2 million for the year endedDecember 31, 2014 as compared to $198.6 million for the year ended December 31, 2013. In addition,gross margin increased by $37.1 million, or 13.8%, to $306.0 million for the year ended December 31,2014 as compared to $268.8 million for the year ended December 31, 2013. The increase in cost ofsales and gross margin dollars was driven by the 13% increase in net sales.
Gross margin as a percentage of net sales is dependent upon a variety of factors includingchanges in relative sales mix among distribution channels, changes in the mix of product sold, thetiming and level of promotional activities, fluctuations in foreign currency exchange rates, andfluctuations in material costs. These factors, among others, may cause gross margin as a percentage ofnet sales to fluctuate from year to year. Gross margin as a percentage of net sales was 58.0% for theyear ended December 31, 2014 and 57.5% for the year ended December 31, 2013. The increase wasprimarily attributable to a shift in channel mix from wholesale to retail. We continue to expand ourretail footprint as part of our long-term growth strategy and we opened 25 new retail stores in 2014.We typically realize higher gross margins in our retail business as compared to our wholesale business,and as retail becomes a relatively greater percentage of our sales we would expect that shift in our salesmix to have a positive impact on gross margin.
- II-210 -
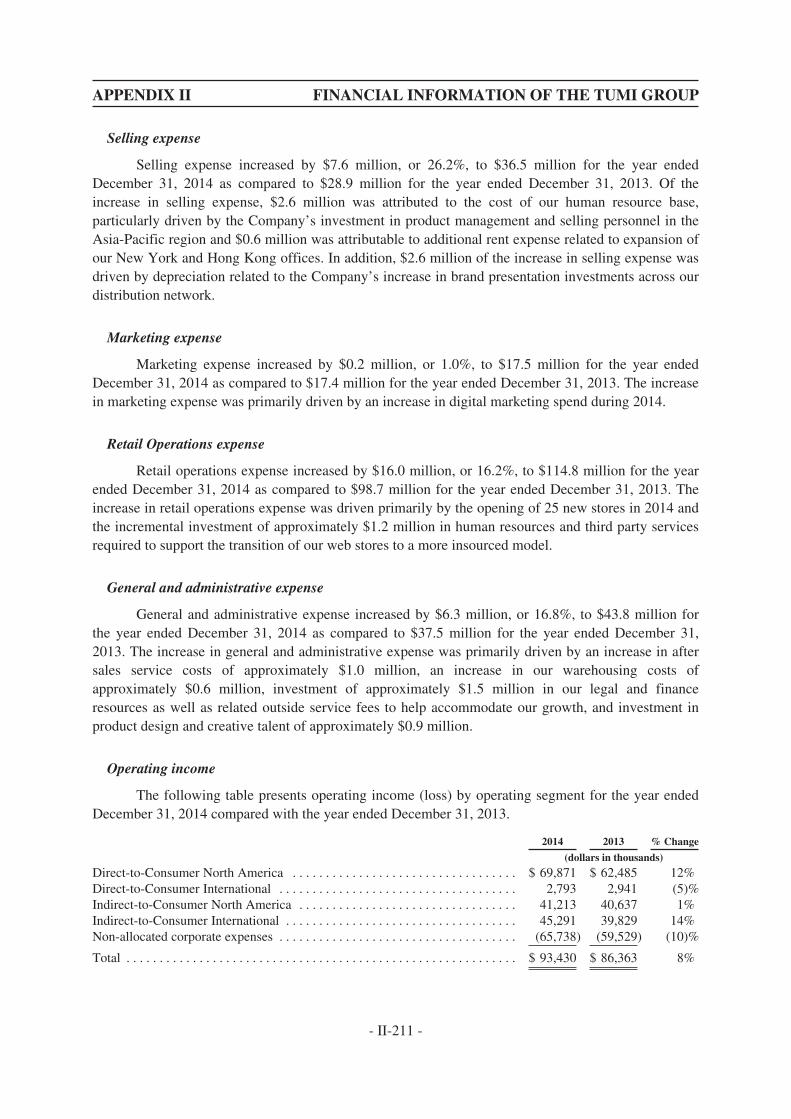
APPENDIX II FINANCIAL INFORMATION OF THE TUMI GROUP
Selling expense
Selling expense increased by $7.6 million, or 26.2%, to $36.5 million for the year endedDecember 31, 2014 as compared to $28.9 million for the year ended December 31, 2013. Of theincrease in selling expense, $2.6 million was attributed to the cost of our human resource base,particularly driven by the Company’s investment in product management and selling personnel in theAsia-Pacific region and $0.6 million was attributable to additional rent expense related to expansion ofour New York and Hong Kong offices. In addition, $2.6 million of the increase in selling expense wasdriven by depreciation related to the Company’s increase in brand presentation investments across ourdistribution network.
Marketing expense
Marketing expense increased by $0.2 million, or 1.0%, to $17.5 million for the year endedDecember 31, 2014 as compared to $17.4 million for the year ended December 31, 2013. The increasein marketing expense was primarily driven by an increase in digital marketing spend during 2014.
Retail Operations expense
Retail operations expense increased by $16.0 million, or 16.2%, to $114.8 million for the yearended December 31, 2014 as compared to $98.7 million for the year ended December 31, 2013. Theincrease in retail operations expense was driven primarily by the opening of 25 new stores in 2014 andthe incremental investment of approximately $1.2 million in human resources and third party servicesrequired to support the transition of our web stores to a more insourced model.
General and administrative expense
General and administrative expense increased by $6.3 million, or 16.8%, to $43.8 million forthe year ended December 31, 2014 as compared to $37.5 million for the year ended December 31,2013. The increase in general and administrative expense was primarily driven by an increase in aftersales service costs of approximately $1.0 million, an increase in our warehousing costs ofapproximately $0.6 million, investment of approximately $1.5 million in our legal and financeresources as well as related outside service fees to help accommodate our growth, and investment inproduct design and creative talent of approximately $0.9 million.
Operating income
The following table presents operating income (loss) by operating segment for the year endedDecember 31, 2014 compared with the year ended December 31, 2013.
2014 2013 % Change
(dollars in thousands)
Direct-to-Consumer North America . . . . . . . . . . . . . . . . . . . . . . . . . . . . . . . . . . $ 69,871 $ 62,485 12%Direct-to-Consumer International . . . . . . . . . . . . . . . . . . . . . . . . . . . . . . . . . . . . 2,793 2,941 (5)%Indirect-to-Consumer North America . . . . . . . . . . . . . . . . . . . . . . . . . . . . . . . . . 41,213 40,637 1%Indirect-to-Consumer International . . . . . . . . . . . . . . . . . . . . . . . . . . . . . . . . . . . 45,291 39,829 14%Non-allocated corporate expenses . . . . . . . . . . . . . . . . . . . . . . . . . . . . . . . . . . . . (65,738) (59,529) (10)%
Total . . . . . . . . . . . . . . . . . . . . . . . . . . . . . . . . . . . . . . . . . . . . . . . . . . . . . . . . . . . $ 93,430 $ 86,363 8%
- II-211 -
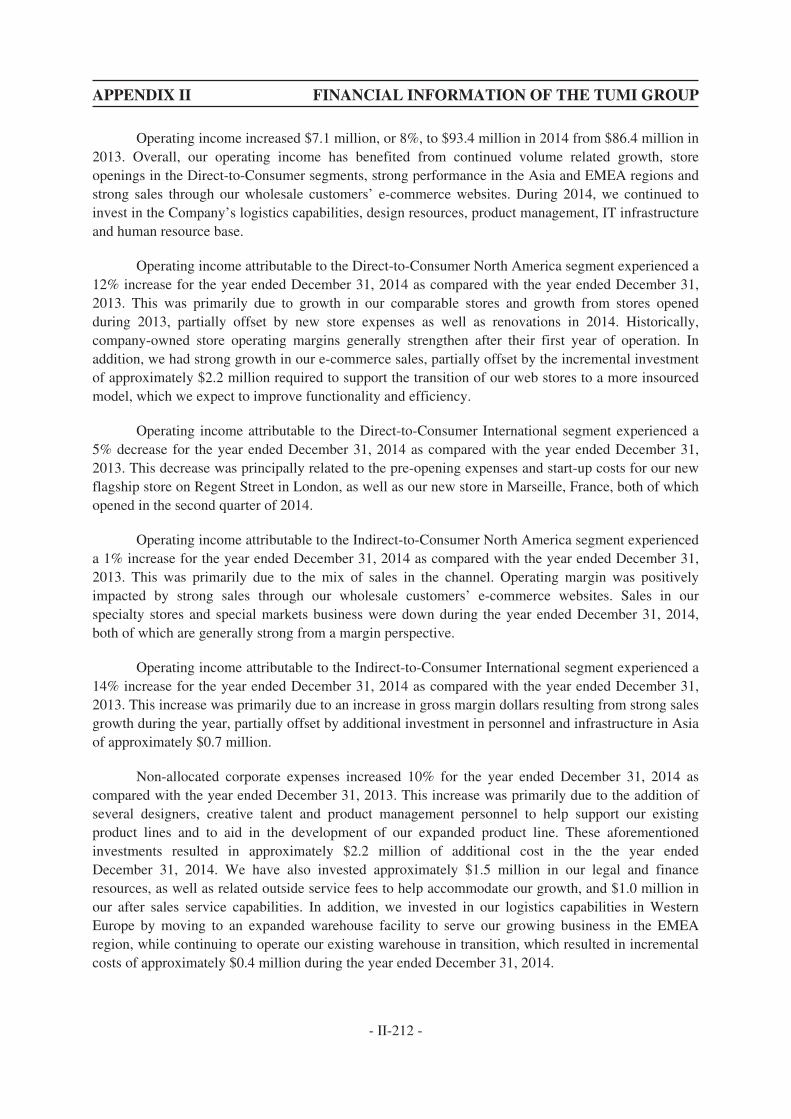
APPENDIX II FINANCIAL INFORMATION OF THE TUMI GROUP
Operating income increased $7.1 million, or 8%, to $93.4 million in 2014 from $86.4 million in2013. Overall, our operating income has benefited from continued volume related growth, storeopenings in the Direct-to-Consumer segments, strong performance in the Asia and EMEA regions andstrong sales through our wholesale customers’ e-commerce websites. During 2014, we continued toinvest in the Company’s logistics capabilities, design resources, product management, IT infrastructureand human resource base.
Operating income attributable to the Direct-to-Consumer North America segment experienced a12% increase for the year ended December 31, 2014 as compared with the year ended December 31,2013. This was primarily due to growth in our comparable stores and growth from stores openedduring 2013, partially offset by new store expenses as well as renovations in 2014. Historically,company-owned store operating margins generally strengthen after their first year of operation. Inaddition, we had strong growth in our e-commerce sales, partially offset by the incremental investmentof approximately $2.2 million required to support the transition of our web stores to a more insourcedmodel, which we expect to improve functionality and efficiency.
Operating income attributable to the Direct-to-Consumer International segment experienced a5% decrease for the year ended December 31, 2014 as compared with the year ended December 31,2013. This decrease was principally related to the pre-opening expenses and start-up costs for our newflagship store on Regent Street in London, as well as our new store in Marseille, France, both of whichopened in the second quarter of 2014.
Operating income attributable to the Indirect-to-Consumer North America segment experienceda 1% increase for the year ended December 31, 2014 as compared with the year ended December 31,2013. This was primarily due to the mix of sales in the channel. Operating margin was positivelyimpacted by strong sales through our wholesale customers’ e-commerce websites. Sales in ourspecialty stores and special markets business were down during the year ended December 31, 2014,both of which are generally strong from a margin perspective.
Operating income attributable to the Indirect-to-Consumer International segment experienced a14% increase for the year ended December 31, 2014 as compared with the year ended December 31,2013. This increase was primarily due to an increase in gross margin dollars resulting from strong salesgrowth during the year, partially offset by additional investment in personnel and infrastructure in Asiaof approximately $0.7 million.
Non-allocated corporate expenses increased 10% for the year ended December 31, 2014 ascompared with the year ended December 31, 2013. This increase was primarily due to the addition ofseveral designers, creative talent and product management personnel to help support our existingproduct lines and to aid in the development of our expanded product line. These aforementionedinvestments resulted in approximately $2.2 million of additional cost in the the year endedDecember 31, 2014. We have also invested approximately $1.5 million in our legal and financeresources, as well as related outside service fees to help accommodate our growth, and $1.0 million inour after sales service capabilities. In addition, we invested in our logistics capabilities in WesternEurope by moving to an expanded warehouse facility to serve our growing business in the EMEAregion, while continuing to operate our existing warehouse in transition, which resulted in incrementalcosts of approximately $0.4 million during the year ended December 31, 2014.
- II-212 -
APPENDIX II FINANCIAL INFORMATION OF THE TUMI GROUP
Operating margin remained consistent at 18% for the years ended December 31, 2014 and2013, as the previously mentioned investments in our human resource base and our insourced webstores, which launched during the fourth quarter of 2014, as well as retail operations expense for newstores and the wrap effect of stores opened in 2014, offset some of our fixed cost leverage.
Other income and expense
Total other income, net increased $0.7 million, or 260%, to income of $0.4 million in 2014from expense of $0.3 million in 2013. The overall increase was attributable to a reduction of interestexpense due to the full repayment of debt in the second quarter of 2014.
Income tax expense
Provision for income taxes increased $4.3 million, or 14%, to $35.8 million in 2014 from$31.5 million in 2013, due principally to higher income before taxes, as well as a higher effective taxrate for the year ended December 31, 2014. The change in the effective tax rate was largely driven bythe change in apportionment percentages for state purposes for the year ended December 31, 2014.Additionally, in 2013 we received the benefit of a $0.4 million reversal of an unrecognized tax benefit.
Net income
Net income increased $3.5 million, or 6%, to $58.0 million in 2014 from $54.6 million in 2013.This increase was due largely to the increase in net sales and gross margin dollars, partially offset bythe aforementioned higher operating expenses which reflect the incremental personnel and professionalservices investment required to support the transition of our web stores to a more insourced model, aswell as higher retail operations expenses related to new stores opened in 2014.
Basic and diluted weighted average shares outstanding for the years ended December 31, 2014and 2013 were 67.9 million shares. Basic and diluted EPS was $0.85 per common share for the yearended December 31, 2014 versus $0.80 per common share for the year ended December 31, 2013.
Seasonality
Our business is seasonal in nature and as a result, our net sales and working capitalrequirements fluctuate from quarter to quarter. Our fourth quarter is a significant period for our resultsof operations due to increased Direct-to-Consumer sales during the holiday season in North Americaand Europe. We expect inventory levels, along with an increase in accounts payable and accruedexpenses, to reach their highest levels in anticipation of the increased net sales during this period. Ineach of 2015 and 2014, fourth quarter net sales represented approximately 31% of our total annual netsales. Operating income in each of the same periods represented approximately 40% of our total annualoperating income.
Liquidity and Capital Resources
Historically, our primary source of liquidity has been cash flows from operations. Ourlong-term credit facility has not historically been used to finance our capital requirements, but insteadwas used to refinance acquisition indebtedness originally incurred when Doughty Hanson and certainmembers of management at that time acquired the Company in 2004. We have from time to time
- II-213 -
APPENDIX II FINANCIAL INFORMATION OF THE TUMI GROUP
drawn down on our revolving line of credit as short-term liquidity needs arise. We use our cash flowsfrom operations to fund our store development activities.
Inflationary factors such as increases in the cost of sales, including raw materials costs andtransportation costs, may adversely affect our operating results. Although we do not believe thatinflation has had a material impact on our financial position to date, a high rate of inflation in the futuremay have an adverse effect on our ability to maintain our gross margin levels and our current levels ofselling expenses and general and administrative expenses as a percentage of net sales if the sale pricesof our products do not increase with any increase in cost of sales.
We believe we have sufficient working capital and liquidity to support our operations for atleast the next twelve months.
Cash and cash equivalents
At December 31, 2015, 2014 and 2013, we had cash and cash equivalents of $94.6 million,$52.8 million and $37.6 million, respectively. A summary of our cash flows provided by and used inoperating, investing and financing activities is presented below.
Cash flows from operating activities
Cash flows from operating activities consisted primarily of net income adjusted for certain non-cash items, including depreciation and amortization, share-based compensation expense, loss ondisposal of fixed assets and other non-cash charges. Our cash flows from operations are largelydependent on sales to consumers and wholesale customers, which are in turn dependent on consumerconfidence, store traffic, conversion, business travel and general economic conditions. We believe wehave the ability to conserve liquidity when economic conditions become less favorable through anynumber of strategies including curtailment of store expansion plans and cutting discretionary spending.
We generated cash flows from operations of $81.4 million and $60.5 million during the yearsended December 31, 2015 and December 31, 2014, respectively. The principal reason for this increasewas an improvement in working capital, as well as higher net income during the year endedDecember 31, 2015.
We generated cash flows from operations of $60.5 million and $63.2 million during the yearsended December 31, 2014 and December 31, 2013, respectively. The principal reason for the decreasewas the prepayments made for our estimated income taxes.
Investing activities
Cash flows used for investing activities consisted of capital expenditures for store expansionplans, store renovations, store openings, store relocations, information technology infrastructure,distribution infrastructure and product tooling costs.
Cash used for capital expenditures was $30.8 million and $36.6 million for the years endedDecember 31, 2015 and 2014, respectively. The principal drivers for this decrease were the investmentin our Regent Street, London store and the expansion of our New York showroom and New Jerseyoffice space in 2014. Capital expenditures for the year ended December 31, 2016 are expected to be inthe range of $23.0 million to $28.0 million.
- II-214 -
APPENDIX II FINANCIAL INFORMATION OF THE TUMI GROUP
Cash used for capital expenditures was $36.6 million and $25.4 million for the years endedDecember 31, 2014 and 2013, respectively. The increase was due principally to the investment in ourinsourced web platform and stores opened or renovated during 2014 as well as stores expected to openin the first quarter of 2015.
Financing activities
Cash flows used for financing activities was $8.5 million and $8.0 million for the years endedDecember 31, 2015 and 2014, respectively. Financing activities in 2015 consisted of the repurchase ofshares of our outstanding common stock under the share repurchase program.
Cash flows used for financing activities was $8.0 million and $37.0 million for the yearsended December 31, 2014 and 2013, respectively. The decrease was mainly attributable to lowerrepayments of bank debt during the year ended December 31, 2014, during which the balanceoutstanding was paid in full.
Amended credit facility
The Amended Credit Facility consolidated the term loan facility and the revolving creditfacility previously provided in the Company’s former debt facility with Wells Fargo into a single$70,000,000 senior secured revolving credit facility, with Wells Fargo as the sole lender, and extendedthe maturity of the facility until April 4, 2017. The Amended Credit Facility includes a letter of creditsublimit not to exceed $5,000,000.
Borrowings under the Amended Credit Facility bear interest at a per annum rate equal to, at theBorrowers’ option, the one, two, three or six month (or such other period as Wells Fargo may agree)LIBOR rate plus a margin of 1.00% or 1.25%, or a base rate (the greater of (i) Wells Fargo’s prime ratein effect on such day and (ii) the federal funds rate plus 1/2 of 1.00%) plus a margin of zero or 0.25%.The Borrowers are required to pay an undrawn commitment fee equal to 0.15% or 0.20% of theundrawn portion of the commitments under the Amended Credit Facility, as well as customary letter ofcredit fees. The margin added to the LIBOR, or base rate, as well as the amount of the commitmentfee, depends on the Company’s leverage at the time. Interest is payable monthly, bi-monthly orquarterly on LIBOR rate loans depending on the interest period for each LIBOR rate loan, or quarterlyon base rate loans.
As of December 31, 2015 and December 31, 2014, the Company had no balance outstandingunder the Amended Credit Facility. Letters of credit outstanding totaled $384,000 and $286,000 atDecember 31, 2015 and 2014, respectively, and accordingly, the unused portion of the facility was$69,616,000 and $69,714,000, respectively. The fee for the unused portion of the facility was $105,000and $104,000 for the years ended December 31, 2015 and 2014, respectively.
All obligations under the Amended Credit Facility are required to be guaranteed by each of theBorrowers’ material domestic subsidiaries, subject to certain exclusions. The obligations under theAmended Credit Facility are secured by substantially all of the Borrowers’ assets and, if applicable,those of the Borrowers’ subsidiary guarantors. Currently the Borrowers do not have any subsidiaryguarantors.
The Amended Credit Facility contains customary events of default, including, but not limitedto, payment defaults, breaches of representations and warranties, covenant defaults, cross-defaults
- II-215 -
APPENDIX II FINANCIAL INFORMATION OF THE TUMI GROUP
under material debt, certain events of bankruptcy and insolvency, defaults based on certain judgments,failure of any material provision of any loan document to be in full force and effect, change of control,and certain ERISA defaults. If an event of default were to occur and continue, amounts due under theAmended Credit Facility would be accelerated and the commitments to extend credit thereunderterminated, and the rights and remedies of Wells Fargo under the Amended Credit Facility availableunder the applicable loan documents could be exercised, including rights with respect to the collateralsecuring the obligations under the Amended Credit Facility.
The foregoing summaries of certain provisions of the Amended Credit Facility do not purportto be complete and are qualified in their entirety by reference to the full text of the Amended CreditFacility.
Share Repurchase Program
On November 4, 2015, the Company announced that its Board of Directors authorized therepurchase of up to $150 million of the Company’s common stock over the next twelve months. Underthe program, the Company may purchase its shares from time to time in the open market or in privatelynegotiated transactions. The Company expects that purchases will be funded through existing cash onhand, cash from operations, borrowings or a combination of the foregoing. The amount and timing ofthe purchases will depend on a number of factors including the price and availability of the Company’sshares, trading volume and general market conditions. Repurchases may also be made under a Rule10b5-1 plan, which would permit shares to be repurchased when the Company might otherwise beprecluded from doing so under insider trading laws. The share repurchase program may be suspendedor discontinued at any time.
During the fourth quarter of 2015, the Company repurchased 485,400 shares of its outstandingcommon stock at an average price of $17.42 per share for a total of approximately $8,454,000. As ofDecember 31, 2015, the remaining availability under the Company’s share repurchase program wasapproximately $141,546,000. All repurchased shares of common stock have been accounted for astreasury stock at cost.
Acquisition of Japanese Joint Venture
On November 4, 2015, the Company announced that it had entered into an agreement toacquire the remaining 50% stake in its Japanese joint venture, Tumi Japan, from its partners, for apurchase price of 521 million yen (approximately $4.3 million). Tumi Japan operates a network of13 Tumi stores, an e-commerce website, and distributes Tumi products across an additional 150 pointsof sale in Japan. The Company funded the acquisition through cash on-hand and the transaction closedduring the first quarter of 2016.
- II-216 -
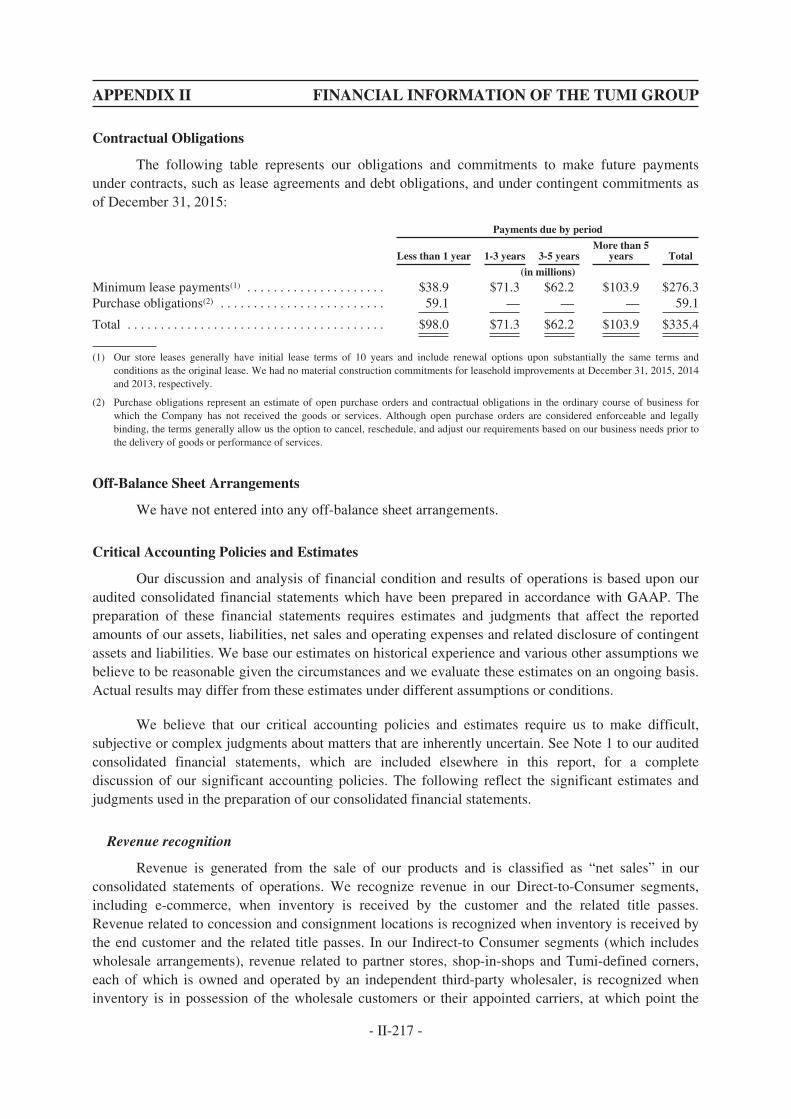
APPENDIX II FINANCIAL INFORMATION OF THE TUMI GROUP
Contractual Obligations
The following table represents our obligations and commitments to make future paymentsunder contracts, such as lease agreements and debt obligations, and under contingent commitments asof December 31, 2015:
Payments due by period
Less than 1 year 1-3 years 3-5 yearsMore than 5
years Total
(in millions)
Minimum lease payments(1) . . . . . . . . . . . . . . . . . . . . . $38.9 $71.3 $62.2 $103.9 $276.3Purchase obligations(2) . . . . . . . . . . . . . . . . . . . . . . . . . 59.1 — — — 59.1
Total . . . . . . . . . . . . . . . . . . . . . . . . . . . . . . . . . . . . . . . $98.0 $71.3 $62.2 $103.9 $335.4
(1) Our store leases generally have initial lease terms of 10 years and include renewal options upon substantially the same terms andconditions as the original lease. We had no material construction commitments for leasehold improvements at December 31, 2015, 2014and 2013, respectively.
(2) Purchase obligations represent an estimate of open purchase orders and contractual obligations in the ordinary course of business forwhich the Company has not received the goods or services. Although open purchase orders are considered enforceable and legallybinding, the terms generally allow us the option to cancel, reschedule, and adjust our requirements based on our business needs prior tothe delivery of goods or performance of services.
Off-Balance Sheet Arrangements
We have not entered into any off-balance sheet arrangements.
Critical Accounting Policies and Estimates
Our discussion and analysis of financial condition and results of operations is based upon ouraudited consolidated financial statements which have been prepared in accordance with GAAP. Thepreparation of these financial statements requires estimates and judgments that affect the reportedamounts of our assets, liabilities, net sales and operating expenses and related disclosure of contingentassets and liabilities. We base our estimates on historical experience and various other assumptions webelieve to be reasonable given the circumstances and we evaluate these estimates on an ongoing basis.Actual results may differ from these estimates under different assumptions or conditions.
We believe that our critical accounting policies and estimates require us to make difficult,subjective or complex judgments about matters that are inherently uncertain. See Note 1 to our auditedconsolidated financial statements, which are included elsewhere in this report, for a completediscussion of our significant accounting policies. The following reflect the significant estimates andjudgments used in the preparation of our consolidated financial statements.
Revenue recognition
Revenue is generated from the sale of our products and is classified as “net sales” in ourconsolidated statements of operations. We recognize revenue in our Direct-to-Consumer segments,including e-commerce, when inventory is received by the customer and the related title passes.Revenue related to concession and consignment locations is recognized when inventory is received bythe end customer and the related title passes. In our Indirect-to Consumer segments (which includeswholesale arrangements), revenue related to partner stores, shop-in-shops and Tumi-defined corners,each of which is owned and operated by an independent third-party wholesaler, is recognized wheninventory is in possession of the wholesale customers or their appointed carriers, at which point the
- II-217 -
APPENDIX II FINANCIAL INFORMATION OF THE TUMI GROUP
related title passes. Provisions for discounts, rebates to customers and returns are recorded as areduction of net sales in the same period as the related sale. Revenue associated with gift cards isrecognized upon redemption. Determining our provision for discounts, rebates and returns requiressignificant judgment based on historical information and estimates of future activity.
Accounts receivable and allowance for doubtful accounts
We determine our allowance for doubtful accounts for accounts receivable by considering anumber of factors including the length of time trade receivables are past due, our previous loss history,our customer’s current ability to pay its obligation and the condition of the general economy and theindustry as a whole. Unanticipated events and circumstances may occur that affect the accuracy orvalidity of such assumptions, estimates or actual results.
Inventories
Inventories consist primarily of finished goods and are valued at the lower of cost or market.Cost is recorded using the first-in, first-out method. Inventory includes material, labor, overhead,freight, and duty and is adjusted for allowances for slow-moving and obsolete inventory. Slow-movingand obsolete inventory is determined through an evaluation of both historical usage and expectedfuture demand.
Income taxes
We utilize the asset and liability method of accounting for income taxes, under which deferredincome taxes are recognized for the tax consequences of temporary differences by applying enactedstatutory tax rates applicable to future years to differences between the financial statement carryingamounts and the tax basis of existing assets and liabilities. The effect on deferred taxes of a change intax rates is recognized in net income in the period that includes the enactment date. A valuationallowance is provided when it is more likely than not that some portion or all of the deferred tax assetswill not be realized. In assessing the realizability of deferred tax assets, management considers whetherit is more likely than not that some portion or all of the deferred tax assets will not be realized. Theultimate realization of deferred tax assets is dependent upon the generation of future taxable incomeduring the periods in which those temporary differences become deductible.
We apply the provisions of the FASB’s guidance relating to uncertain tax positions. We utilizethe two step process to determine the amount of recognized tax benefit. For tax positions meeting themore-likely-than-not threshold, the amount recognized in the consolidated financial statements is thelargest benefit that has a greater than 50% likelihood of being realized upon ultimate settlement withthe relevant tax authority.
Goodwill and intangible assets
Goodwill represents the excess of the purchase price over the fair value of net assets acquired,including intangible assets. Indefinite-lived intangible assets consist of brand/trade name. Goodwilland brand/trade name are not being amortized in accordance with the provisions of the FASB’sguidance, which requires these assets to be tested for impairment annually and whenever events orchanges in circumstances indicate that the carrying value may not be recoverable. Our annualimpairment testing date is the first day of our fourth quarter. No impairment was recognized in theyears ended December 31, 2015, 2014 and 2013.
- II-218 -
APPENDIX II FINANCIAL INFORMATION OF THE TUMI GROUP
The quantitative goodwill impairment test, if necessary, is a two-step process. Under the first oftwo steps, the Company compares the fair value of a reporting unit to its carrying amount, includinggoodwill, to identify a potential impairment. If the fair value of the reporting unit is less than itscarrying value, an indication of goodwill impairment exists for such reporting unit and the enterprisemust perform step two of the impairment test to measure the impairment, if any. Under step two, animpairment loss is recognized for any excess of the carrying amount of the reporting unit’s goodwillover the implied fair value of that goodwill. The implied fair value of goodwill is determined byallocating the fair value of the reporting unit in a manner similar to a purchase price allocation: the fairvalue of the reporting unit is allocated to all of the assets and liabilities of that unit (including anyunrecognized intangible assets) and the residual fair value after this allocation is the implied fair valueof the reporting unit goodwill.
The Company uses techniques including discounted expected future cash flows (Level 3 input),or DCF, to test goodwill. Indefinite-lived intangible assets are tested for impairment through an incomeapproach known as the relief from royalty method. A discounted cash flow analysis calculates the fairvalue by estimating the after-tax cash flows attributable to a reporting unit or asset and thendiscounting the after-tax cash flows to a present value using a risk-adjusted discount rate. Assumptionsused in DCF and the relief from royalty method require the exercise of significant judgment includingjudgment about appropriate royalty rates, discount rates and terminal values, growth rates and theamount and timing of expected future cash flows. Although the Company believes the historicalassumptions and estimates made are reasonable and appropriate, different assumptions and estimatescould materially impact its reported financial results.
The Company’s reporting units for the purpose of goodwill impairment testing are ourreportable business segments: (i) Direct-to-Consumer North America, (ii) Indirect-to-Consumer NorthAmerica, (iii) Direct-to-Consumer International and (iv) Indirect-to-Consumer International. Thereporting units were determined in accordance with the guidance on reportable segments in FASBASC 280-10-50-1. There is no discrete financial information available to the Company for itsoperations below our reportable business segments.
Warranties
We provide our customers with a product warranty subsequent to the sale of our products. Ourwarranty policy provides for one year of worry-free service as well as an additional warranty againstmanufacturers’ defects or flaws in construction for between two and five years, depending on theproduct line. We recognize estimated costs associated with the limited warranty at the time of sale ofour products. The warranty reserve is based on historical experience.
Recently Issued Accounting Pronouncements
As discussed in Note 2—Summary of Significant Accounting Policies to our consolidatedfinancial statements included in this Annual Report on Form 10-K, we have considered all newaccounting pronouncements and have concluded that there are no new pronouncements that we expectto have a material impact on our results of operations, financial condition, or cash flows, based oncurrent information.
- II-219 -
APPENDIX II FINANCIAL INFORMATION OF THE TUMI GROUP
Financial Statement Components
Net sales
Net sales consists of revenue from the sale of products, less returns, discounts and allowancesand other offsets to net sales. In our Direct-to-Consumer segments, revenue is recognized when aconsumer purchase occurs and the consumer receives the merchandise. In our Indirect-to-Consumersegments, revenue is recognized when inventory is in possession of our wholesale customers or theirappointed carriers, at which point the risk and related title passes. Provisions for discounts, rebates toconsumers and returns are recorded as a reduction of net sales in the same period as the related sale.Revenue associated with gift cards is recognized upon redemption. Revenue from gift cards and theamount of revenue recognized for gift cards not redeemed (“breakage”) is immaterial to our results ofoperations. Amounts billed to customers for delivery costs are classified as a component of net sales,and any other related delivery costs are classified as a component of cost of sales. Sales and valueadded tax collected from consumers and remitted to governmental authorities are accounted for on anet basis and are excluded from net sales on our consolidated results of operations.
Comparable store sales are calculated based on our company-owned stores that have been openfor at least a full calendar year as of the end of our annual reporting period. For example, a storeopened in October 2015 will not impact the comparable store comparison until January 1, 2017.Additionally, temporary store closings, store expansions and store relocations are excluded from thecomparable store base under most circumstances. There may be variations in the way in which some ofour competitors and other retailers calculate comparable or “same store” sales. As a result, data in thisAnnual Report on Form 10-K regarding our comparable store sales may not be comparable withsimilar data made available by other companies.
Cost of sales
Cost of sales includes the cost of finished goods purchased from our suppliers plus the cost offreight to deliver the product to our distribution centers, packaging and related duties and applicableoverhead incurred to bring the merchandise to its condition for sale. Gross margin is defined as netsales less the cost of sales.
Operating expenses
Operating expenses consist of selling, marketing, retail operations and general andadministrative expenses.
Selling. Selling expenses consist of wholesale-related salaries, benefits, commissions,incentive programs, concession fees, travel and entertainment, meetings and seminars and other sellingcosts and expenses, in each case related to our global wholesale business.
Marketing. Marketing expenses consist of in-store and consumer advertising, marketing-related salaries and benefits, travel and entertainment, lease-required advertising, consumer catalogs,market research and other consulting costs and expenses related to marketing.
Retail operations. Retail operations expenses include occupancy and staffing costs associatedwith our company-owned stores, store depreciation expense, costs for our e-commerce websites,depreciation on point-of-sale fixtures, travel and entertainment, meetings and seminars, insurance andother related administrative costs and expenses.
- II-220 -
APPENDIX II FINANCIAL INFORMATION OF THE TUMI GROUP
General and administrative. General and administrative expenses consist of productdevelopment costs related to tools, dies, design and travel; warehousing and distribution costs; costsassociated with running our global distribution network such as occupancy and employment expenses;costs associated with warranty and after-sales service such as employee and repair-related expensesand warranty claims; employee-related costs associated with our executive, finance, informationtechnology, legal and human resource functions; costs associated with our corporate headquarters andproduct showrooms; and legal, tax and accounting fees.
Operating income
Operating income consists of gross margin less operating expenses, and excludes other incomeand expenses (i.e., non-operating income and expenses).
Other income (expenses)
Interest expense. Interest expense consists of interest payments made pursuant to ouramended credit facility with, among others, Wells Fargo, as well as amortization of deferred financingcosts, net of minimal interest income.
Earnings from joint venture investment. Earnings from joint venture investment relateexclusively to Tumi Japan, a joint venture (corporation) in which we held a 50% interest and whichsells Tumi products in 13 retail stores and to various high-end wholesale customers in Japan. Duringthe first quarter of 2016, we completed our acquisition of the remaining 50% stake in Tumi Japan.
Foreign exchange gains (losses). Foreign currency exposures arise in our branch offices andsubsidiaries in Europe where transactions are denominated in a currency other than the U.S. dollar.Gains and losses such as those resulting from the settlement of receivables and payables denominatedin foreign currency are included in the earnings of the current period in “foreign exchange gains(losses).” We are also exposed to foreign currency exchange rate fluctuations with respect to ourEuropean operations as a result of its U.S. dollar-denominated historical rate intercompany loanbalance. We believe that exposure to adverse changes in exchange rates associated with revenues andexpenses of our foreign branch offices and subsidiaries are immaterial to our consolidated financialstatements. Gains and losses arising from currency exchange rate fluctuations on intercompanytransactions deemed to be long-term in nature remain in other comprehensive income.
Other non-operating income (expenses). Other non-operating income (expenses) includes allother non-operating income and expenses.
Provision for income taxes
We record income tax expenses related to federal, state, local and foreign income.
QUANTITATIVE AND QUALITATIVE DISCLOSURES ABOUT MARKET RISK
Market risk represents the risk of loss that may impact our financial position due to adversechanges in financial market prices and rates. Our market risk exposure is primarily a result offluctuations in foreign currency exchange rates and interest rates. We do not currently hold or issuefinancial instruments for trading purposes, although we have in the past entered into interest ratehedges for the purposes of limiting our exposure to fluctuations in interest rates.
- II-221 -

APPENDIX II FINANCIAL INFORMATION OF THE TUMI GROUP
Foreign currency exchange risk
Although the majority of our international net sales are billed and collected in U.S. dollars, ourEuropean sales are billed and collected in Euros, and we are therefore subject to risk associated withexchange rate fluctuations. During 2015, 2014, and 2013 we recorded gains related to the exchangerate fluctuation effect on remittances from our European affiliates and other transactions relating to ourinternational operations of $427,000, $475,000, and $388,000, respectively. Because a portion of ournet sales (approximately 8% in 2015 and 10% in each of 2014 and 2013) are denominated in Euros,exchange rate fluctuations can have an impact on our reported net sales. For example, if the U.S. dollarstrengthens against the Euro, this could have a negative effect on our European operating results whenthose results are translated into U.S. dollars. Any hypothetical loss in net sales could be partially orcompletely offset by lower selling expenses and general and administrative expenses that are generatedin Euros.
Substantially all of our purchases from our foreign suppliers are denominated in U.S. dollars. Aprecipitous decline in the value of the U.S. dollar could cause our foreign suppliers to seek priceincreases on the goods they supply to us. This could impact our gross margin if market conditionsprevent us from passing those costs on to consumers. We do not currently use the derivative markets tohedge foreign currency fluctuations but may in the future consider entering into derivative financialinstruments to mitigate losses associated with these risks. We do not, and do not intend to, engage inthe practice of trading derivative securities for profit.
Interest rate risk
Amended credit facility. Under the Amended Credit Facility, borrowings bear interest payablequarterly or, in the case of loans subject to the LIBOR rate, monthly, bi-monthly or quarterlydepending on the interest period for such loans. Borrowings under the Amended Credit Facility willbear interest at a per annum rate equal to, at our option, the one, two, three or six-month (or such otherperiod as Wells Fargo may agree) LIBOR rate plus a margin of 1.00% or 1.25%, or a base rate plus amargin of zero or 0.25%. The margin added to the LIBOR, or base rate, will depend on our leverage atthe time. Accordingly, under the Amended Credit Facility, we continue to be exposed to market riskfrom changes in the underlying variable interest rates, which affect our cost of borrowings. Wecarefully monitor the interest rates on our borrowings under the Amended Credit Facility. As ofDecember 31, 2015, we had no balance outstanding under the Amended Credit Facility.
We do not currently have any interest rate hedging activities in place, but we may in the futureengage in hedging activities, based on, among other things, market conditions. We do not, and do notintend to, engage in the practice of trading derivative securities for profit. A 10% increase in theapplicable interest rate would not have had a material effect on interest expense to us under theAmended Credit Facility.
Inflation
Inflationary factors such as increases in the cost of sales, including raw materials costs andtransportation costs, may adversely affect our operating results. Although we do not believe thatinflation has had a material impact on our financial position to date, a high rate of inflation in the futuremay have an adverse effect on our ability to maintain our gross margin levels and our current levels ofselling expenses and general and administrative expenses as a percentage of net sales if the sale pricesof our products do not increase proportionately with any increase in cost of sales.
- II-222 -
APPENDIX II FINANCIAL INFORMATION OF THE TUMI GROUP
CONTROLS AND PROCEDURES
Evaluation of Disclosure Controls and Procedures
We maintain disclosure controls and procedures (as defined in Rules 13a-15(e) and 15d-15(e)of the Exchange Act) designed to provide reasonable assurance that information required to bedisclosed in our reports filed under the Exchange Act is recorded, processed, summarized and reportedwithin the time periods specified by the SEC’s rules and forms and that such information isaccumulated and communicated to our management, including our CEO and CFO, as appropriate, toallow for timely decisions regarding required disclosure. We recognize that any controls andprocedures, no matter how well designed and operated, can only provide reasonable assurance ofachieving desired control objectives. Judgment is required when designing and evaluating the cost-benefit relationship of potential controls and procedures.
As of the end of the period covered by this report, with the supervision and participation ofmanagement, including our CEO and CFO, we evaluated the effectiveness of the design and operationof our disclosure controls and procedures. Based on this evaluation, our CEO and CFO have concludedthat, as of December 31, 2015, our disclosure controls and procedures were effective at the reasonableassurance level.
Internal Control over Financial Reporting
Management’s Report on Internal Control over Financial Reporting
The Company’s management is responsible for establishing and maintaining adequate internalcontrols over financial reporting (as defined in Rules 13a-15(f) and 15(d)-15(f) of the Exchange Act).The Company’s internal control system was designed to provide reasonable assurance to theCompany’s management and Board regarding the preparation and fair presentation of publishedfinancial statements. Management evaluated the effectiveness of the Company’s internal control overfinancial reporting using the criteria set forth by the Committee of Sponsoring Organizations (COSO)of the Treadway Commission in Internal Control—Integrated Framework in 2013. Management, underthe supervision and with the participation of the Company’s CEO and CFO, assessed the effectivenessof the Company’s internal control over financial reporting as of December 31, 2015 and concluded thatit is effective.
Deloitte & Touche LLP, an independent registered public accounting firm, has audited theeffectiveness of our internal control over financial reporting and has issued an attestation report as ofDecember 31, 2015, which appears on page F-2 of this report.
Changes in Internal Control over Financial Reporting
There have been no changes in our internal control over financial reporting (as defined in Rules13a-15(f) and 15d-15(f) of the Exchange Act) during our most recently completed fiscal quarter thathave materially affected, or are reasonably likely to materially affect, our internal control over financialreporting.
- II-223 -
APPENDIX II FINANCIAL INFORMATION OF THE TUMI GROUP
4. The following is an extract of the management discussion and analysis of the results of Tumifor the three months ended March 27, 2016 from the 2016 first quarterly report of Tumi.
MANAGEMENT’S DISCUSSION AND ANALYSIS OF FINANCIAL CONDITION ANDRESULTS OF OPERATIONS
The following discussion should be read in conjunction with Tumi Holdings, Inc.’s (togetherwith its subsidiaries, “Tumi”, the “Company”, “we”, “us”, and “our”) condensed consolidatedfinancial statements and notes thereto included elsewhere in this report. In addition to historicalinformation, this discussion contains forward-looking statements that involve risks, uncertainties andassumptions that could cause actual results to differ materially from management’s expectations. See“Cautionary Note Regarding Forward-Looking Statements” for further information regardingforward-looking statements. We generally identify forward-looking statements by words such as“anticipate,” “estimate,” “expect,” “intend,” “project,” “plan,” “predict,” “believe,” “seek,”“continue,” “outlook,” “may,” “might,” “will,” “should,” “can have,” “likely” or the negativeversion of these words or comparable words. Factors that can cause actual results to differ materiallyfrom those reflected in the forward-looking statements include, among others, those discussed inPart I, Item 1A, “Risk Factors” in our Annual Report on Form 10-K for the year ended December 31,2015, filed with the SEC on February 25, 2016. We urge you not to place undue reliance on theseforward-looking statements, which reflect management’s analysis, judgment, belief or expectation onlyas of the date hereof. We expressly disclaim any obligation to update or revise any forward-lookingstatement, whether as a result of new information, future events or otherwise, except as required byapplicable securities laws and regulations. Historical results are not necessarily indicative of theresults expected for any future period.
The reporting periods for our unaudited quarterly financial information are based on the firstmonth of each fiscal quarter including five Sundays and the second and third months of each fiscalquarter including four Sundays, with the fourth fiscal quarter always ending on December 31.Accordingly, the three-month reporting periods for the unaudited interim condensed consolidatedfinancial statements included herein commenced on January 1, 2016 and January 1, 2015 and endedon March 27, 2016 and March 29, 2015, respectively.
Executive Overview
We are a leading, growing, global, premium lifestyle brand whose products offer superiorquality, durability and innovative design. We offer a comprehensive line of travel and businessproducts and accessories in multiple categories. We design our products for, and market our productsto, sophisticated professionals, frequent travelers and brand-conscious individuals who enjoy thepremium status of Tumi products. We sell our products through a network of company-owned full-price stores and outlet stores, partner stores, concessions, shop-in-shops, specialty luggage shops, high-end department stores and e-commerce distribution channels. We have approximately 2,100 points ofdistribution in over 75 countries, and our global distribution network is enhanced by the use of our fourlogistics facilities located in the United States, Europe and Asia. We design our products in our U.S.design studios and selectively collaborate with well-known, international, industrial and fashiondesigners for limited edition product lines. Production is sourced globally through a network ofsuppliers based principally in Asia, many of which are longtime suppliers, and in the Caribbean.
We have expanded our global presence by successfully implementing our growth strategies,which have included opening additional company-owned stores and increasing wholesale points of
- II-224 -
APPENDIX II FINANCIAL INFORMATION OF THE TUMI GROUP
distribution. Our net sales increased from $110.5 million in the three months ended March 29, 2015 to$118.3 million in the three months ended March 27, 2016. The increase was primarily driven byincremental revenue from consolidating Tumi Japan which was acquired during the first quarter of2016. Our ability to expand our points of distribution and to grow our net sales in existing stores hasbeen driven by increasing demand for our products, as well as growing recognition of the Tumi brand.We have also increased our focus on our women’s line and on increasing our overall online presence.
In recent years, the travel products industry has seen a trend in consumer preferences towardslighter weight luggage and travel accessories, as well as merchandise that makes mobile computingand communication more convenient. In light of these trends, we have developed products that fulfillthose identified needs, such as our Vapor-Lite and Tegra-Lite lines, as well as a variety of mobileelectronic accessories designed for frequent travelers. Additionally, we have seen an increase in therelative percentage of our net sales derived from our premium product line and updates of our coreproduct line, and a decrease in the relative percentage of our net sales derived from our legacy coreproduct line in recent years.
We believe there is a significant opportunity to continue to expand our store base globally, andwe plan to add new company-owned and partner stores in upscale malls and prestigious street venues.We had 3 new company-owned store openings in the quarter ended March 27, 2016. We currentlyexpect to continue to open company-owned stores, both in North America and internationally, in theforeseeable future. Most of the locations we have identified for new company-owned stores are forfull-price stores, while the remaining locations are for outlet stores. We also believe there areopportunities to open additional stores in airport locations as well as luxury casinos.
We believe we have the capacity to increase our Indirect-to-Consumer net sales, both in NorthAmerica and internationally. We plan to continue to grow in key Asian markets, particularly China.We also plan to increase the number of wholesale doors in key European markets, including Germany,France and the United Kingdom, and to expand wholesale distribution in Central and South America,while also expanding our product portfolio offered in existing wholesale doors. We believe there isalso significant opportunity to open additional points of distribution in airport locations in many ofthese regions. In North America, we expect to grow net sales by increasing our wholesale doorpresence, expanding our accessories business in department stores, targeting the assortment of productsavailable to third party e-commerce providers and increasing penetration of the Canadian marketthrough department stores, specialty stores, e-commerce sales and new distribution partners.
We generally expect the payback of our investment in a new company-owned store to occur inless than two and a half years. Over the long-term, we also believe we can increase our average netsales per square foot by continuing to improve store efficiency and increase our overall net sales bycapitalizing on our flexible distribution model. We will continue to look for ways to improve ourcapital efficiency in both current and new markets in the future.
Merger Agreement with Samsonite
On March 3, 2016, Tumi Holdings, Inc. (the “Company”) entered into an Agreement and Planof Merger (the “Merger Agreement”) with Samsonite International S.A., a public limited liabilitycompany (société anonyme) incorporated and governed by the laws of the Grand-Duchy ofLuxembourg (“Samsonite”), and PTL Acquisition Inc., a Delaware corporation and an indirect whollyowned subsidiary of Samsonite (“Merger Sub”).
- II-225 -
APPENDIX II FINANCIAL INFORMATION OF THE TUMI GROUP
The Merger Agreement provides that, among other things and in accordance with the terms andsubject to the conditions thereof, Merger Sub will be merged with and into the Company (the“Merger”) with the Company continuing as the surviving corporation in the Merger, and, at theeffective time of the Merger (the “Effective Time”), each outstanding share of common stock of theCompany, par value $0.01 per share (“Company Common Stock”) (other than shares owned by theCompany or any of its subsidiaries or Samsonite or any of its subsidiaries (including Merger Sub),which shall be cancelled, and any Dissenting Shares (as defined in the Merger Agreement)), willautomatically be cancelled and converted into the right to receive $26.75 in cash, without interest (the“Merger Consideration”).
At the Effective Time and, in each case, in respect of those outstanding immediately prior to theEffective Time, whether vested or unvested, automatically and without any required action on the partof the holder thereof and less any applicable Taxes (as defined in the Merger Agreement) required tobe withheld, (i) each Company Stock Option (as defined in the Merger Agreement) shall be cancelledand shall only entitle the holder of such Company Stock Option to receive (without interest) an amountin cash equal to the product of (x) the total number of shares of Company Common Stock subject tothe Company Stock Option multiplied by (y) the excess, if any, of the Merger Consideration over theper-share exercise price of such Company Stock Option; provided that any such Company StockOption with respect to which the per-share exercise price subject thereto is equal to or greater than theMerger Consideration shall be cancelled in exchange for no consideration, (ii) each Company ServiceRSU (as defined in the Merger Agreement) shall be cancelled and shall only entitle the holder of suchCompany Service RSU to receive (without interest) an amount in cash equal to the product of (x) thetotal number of shares of Company Common Stock subject to the Company Service RSU multiplied by(y) the Merger Consideration and (iii) each Company Performance RSU (as defined in the MergerAgreement) shall be cancelled and shall only entitle the holder of such Company Performance RSU toreceive (without interest) an amount in cash equal to the product of (x) the total number of shares ofCompany Common Stock subject to the Company Performance RSU (assuming target-levelperformance) multiplied by (y) the Merger Consideration.
The Board of Directors of the Company has unanimously (1) determined that the MergerAgreement and the Merger are fair to and in the best interests of the Company and its stockholders,(2) approved the execution, delivery and performance of the Merger Agreement and (3) resolved torecommend adoption of the Merger Agreement by the stockholders of the Company, who will be askedto vote on the adoption of the Merger Agreement at a special stockholders meeting that will be held ona date to be announced.
The closing of the Merger is subject to customary closing conditions, including adoption of theMerger Agreement by the affirmative vote of the holders of at least a majority of all outstanding sharesof Company Common Stock entitled to vote thereon and the absence of a Company Material AdverseEffect (as defined in the Merger Agreement) after the date of the Merger Agreement. Consummation ofthe Merger also is subject to approval of the Merger Agreement and the transactions contemplatedthereby, including the Merger, by an ordinary resolution of the shareholders of Samsonite.Consummation of the Merger is not subject to a financing condition.
Tumi Japan Acquisition
On January 4, 2016, the Company acquired the remaining interest in Tumi Japan, from itspartners, for a purchase price of 521 million yen (approximately $4.2 million). As a result of acquiring
- II-226 -
APPENDIX II FINANCIAL INFORMATION OF THE TUMI GROUP
the remaining interest in Tumi Japan, the Company began consolidating Tumi Japan into its operationsduring the first quarter of 2016. In 2016, Tumi Japan’s retail business is included in the Company’sDirect-to-Consumer International segment and its wholesale business is included in the Company’sIndirect-to-Consumer International segment. The acquisition provides the Company with direct controlover its operations in Japan and will allow it to better manage opportunities in the region.
Growth Strategy
The key elements of our growth strategy are:
Š Expand our store base. We believe there continues to be significant opportunity for usto expand our company-owned retail store network in North America andinternationally. We plan to add new stores in upscale mall market locations andprestigious street venues where we are currently underrepresented as well as open ourown travel retail stores. In addition, we selectively target the affluent and businessmarkets in small and mid-sized cities where there is demonstrated foot traffic and anestablished Tumi consumer base that is not being sufficiently served by multi-brandtravel goods and accessories retailers. We also believe there is further opportunity todevelop company-owned outlet stores in premium outlet malls where we currently donot have a presence. Our store-opening strategy focuses on opening profitable company-owned retail locations, as well as retail locations that enhance our brand image. Wehave opened 102 company-owned stores since January 1, 2011 (11 stores in 2011, 19stores in 2012, 17 stores in 2013, 25 stores in 2014, 27 stores in 2015 and 3 stores in thethree months ended March 27, 2016), and, as part of our Tumi Japan acquisition, weadded 13 additional stores in the first quarter of 2016, bringing our total to 192company-owned stores as of March 27, 2016. While we may be unable to successfullyopen new company-owned stores according to plan, we have identified several locationsfor new company-owned stores and believe we have a market opportunity to continue toexpand our company-owned store base over the long term.
Š Expand wholesale distribution globally. We currently sell products in approximately1,900 wholesale doors in over 75 countries. We plan to continue expanding wholesaledistribution globally, with a focus on key markets in Asia (including mainland China,India, Japan and South Korea), Eastern Europe and Central and South America. As partof this strategy, we will continue to develop relationships with wholesale distributors inthese attractive geographies (in both new and existing markets) and increase wholesaleand distribution opportunities as well as expand into additional airport locationsworldwide. We expect this distribution expansion will take several forms as appropriatefor the specific market opportunity, including Tumi shop-in-shops, Tumi-definedcorners within existing wholesale accounts or concession and consignmentarrangements.
Š Continue to increase our brand awareness. We seek to increase our brand awarenessamong our targeted consumer base through retail and wholesale distribution expansion,select marketing initiatives, new product lines and selective licensing in brandextensions. In the wholesale distribution channel, we target distribution expansion byincreasing the number of our partner stores where we can control the consumerexperience. We will continue to focus on in-store marketing, and we plan to effectivelyutilize our website, social networking sites and other online forms of communication to
- II-227 -
APPENDIX II FINANCIAL INFORMATION OF THE TUMI GROUP
build consumer knowledge of the Tumi brand. We believe increasing brand awarenesswill lead to greater foot traffic in our current locations, enable us to continue expandingour loyal consumer base and ultimately contribute to enhanced growth and profitability.
Š Broaden the appeal of our products through new product introductions. We seek todesign products that are innovative, functional and stylish. We anticipate introducingnew products in lighter weight and durable materials, colors which appeal to womenand men, premium products with a classic or contemporary design, as well as stylishand durable products at more accessible price points for our younger consumer. We alsoplan to continue to introduce new products to our successful brand extension lines,including eyewear, belts, outerwear, electronics and other accessories.
Š Improve our store operations. We continue to focus on improving store efficiency,primarily through our retail performance maximization program (the “RPM program”)which was implemented in 2009. The RPM program emphasizes training and staffdevelopment programs and the effective use of visual merchandising and fixtures. Ourgoal is to continue to increase net sales per store by increasing conversion rates andunits and dollars per transaction, while enhancing the consumer experience.
Š Expand our e-business. Our e-commerce business consists of our websites and certainof our wholesale customers’ e-commerce websites. This online presence is an extensionof our brand and points of distribution, serving both as an informational resource and acomplementary sales channel for our consumers. We expect sales from this channel togrow as consumers become more aware of our e-commerce capabilities and wecontinue to expand our online transactional presence into new markets. We transitionedour North America web store to a more insourced model during the fourth quarter of2014 and our international web stores to a more insourced model during the first quarterof 2015. We believe this will improve our websites’ functionality and efficiency in thefuture.
Key Performance Indicators
Key performance indicators that we use to manage our business and evaluate our financialresults and operating performance are average net sales per square foot and “constant currency”performance measures.
Average net sales per square foot, which relates to company-owned stores only, provides uswith a measure to evaluate our store sales trends and to assess the operational performance of ourstores. Average net sales per square foot is calculated using net sales for the last twelve months for allstores open for the full twelve months. This measure is supplemented by a number of non-financialoperating metrics related to store performance, which provide benchmarks against which to evaluatestore efficiencies but are not considered by management to be reliable financial metrics.
While average net sales per square foot have increased over time, in the current period averagenet sales per square foot decreased by approximately $19, or 2%, to $987 as of March 27, 2016 from$1,006 as of December 31, 2015. This decrease was primarily due to negative North America full-pricecomparable store sales.
We also refer to certain financial metrics on a “constant currency” basis so that the businessresults can be viewed without the impact of translating foreign currencies into U.S. dollars and the
- II-228 -
APPENDIX II FINANCIAL INFORMATION OF THE TUMI GROUP
impact of currency rate changes on foreign currency denominated transactions, thereby facilitatingperiod-to-period comparisons of our business performance. Generally, when the dollar eitherstrengthens or weakens against other currencies, metrics at constant currency rates or adjusting forcurrency will be higher or lower than results reported at actual exchange rates.
“Constant currency” performance measures are not measures presented in accordance with U.S.GAAP. Undue reliance should not be placed on these measures as our only measures of operatingperformance. Constant currency performance measures have limitations as analytical tools. Whenassessing our operating performance, investors should not use constant currency performance measuresin isolation or as substitutes for operating income, net income or net sales.
Reconciliation of Constant Currency Financial Measures(In thousands, except per share data)
Three months ended
March 27, 2016 March 29, 2015 % Change
As ReportedConstantCurrency As Reported As Reported
ConstantCurrency
Net sales . . . . . . . . . . . . . . . . . . . . . . . . . . . . . . . . $118,342 $119,061 $110,461 7.1% 7.8%Operating income . . . . . . . . . . . . . . . . . . . . . . . . $ 7,761 $ 8,129 $ 9,563 (18.8)% (15.0)%Operating income margin . . . . . . . . . . . . . . . . . . 6.6% 6.8% 8.7%Net income . . . . . . . . . . . . . . . . . . . . . . . . . . . . . . $ 7,903 $ 8,123 $ 6,374 24.0% 27.4%Diluted earnings per share . . . . . . . . . . . . . . . . . . $ 0.12 $ 0.12 $ 0.09 24.8% 28.2%
Constant currency amounts exclude both the impact of translating foreign currencies into U.S.dollars and the impact of currency rate changes on foreign currency denominated transactions.
- II-229 -
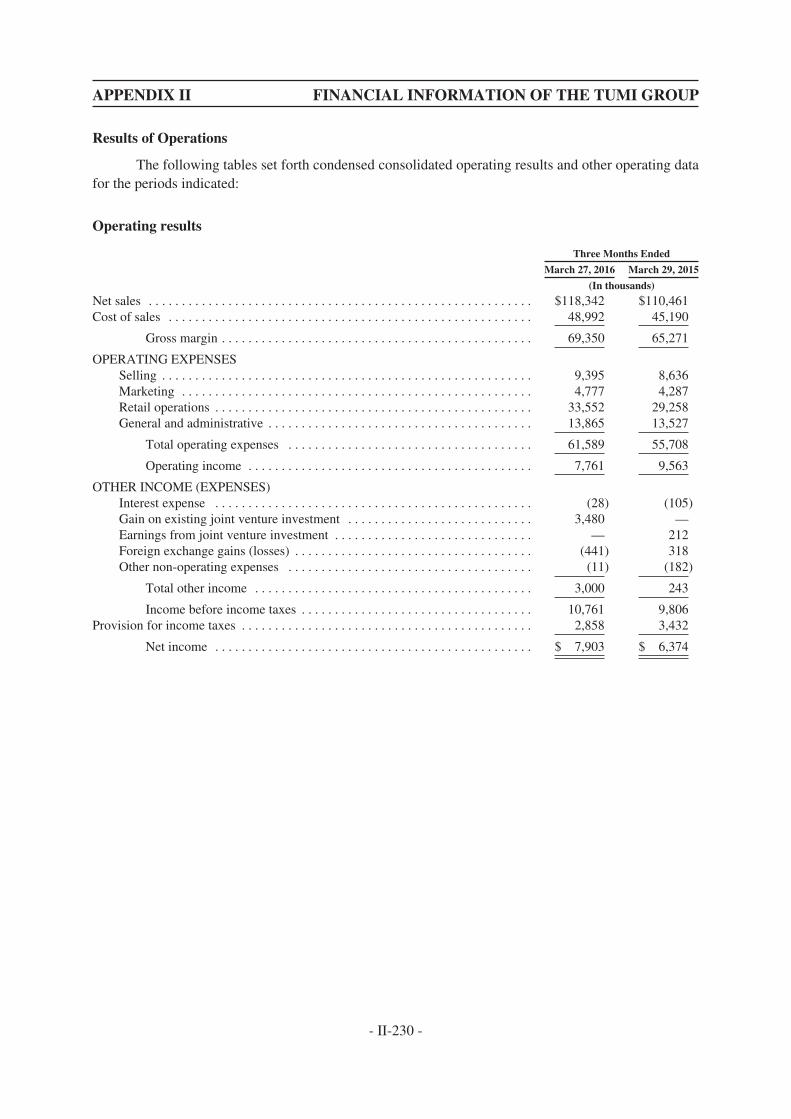
APPENDIX II FINANCIAL INFORMATION OF THE TUMI GROUP
Results of Operations
The following tables set forth condensed consolidated operating results and other operating datafor the periods indicated:
Operating results
Three Months Ended
March 27, 2016 March 29, 2015
(In thousands)
Net sales . . . . . . . . . . . . . . . . . . . . . . . . . . . . . . . . . . . . . . . . . . . . . . . . . . . . . . . . . . $118,342 $110,461Cost of sales . . . . . . . . . . . . . . . . . . . . . . . . . . . . . . . . . . . . . . . . . . . . . . . . . . . . . . . 48,992 45,190
Gross margin . . . . . . . . . . . . . . . . . . . . . . . . . . . . . . . . . . . . . . . . . . . . . . . 69,350 65,271
OPERATING EXPENSESSelling . . . . . . . . . . . . . . . . . . . . . . . . . . . . . . . . . . . . . . . . . . . . . . . . . . . . . . . . 9,395 8,636Marketing . . . . . . . . . . . . . . . . . . . . . . . . . . . . . . . . . . . . . . . . . . . . . . . . . . . . . 4,777 4,287Retail operations . . . . . . . . . . . . . . . . . . . . . . . . . . . . . . . . . . . . . . . . . . . . . . . . 33,552 29,258General and administrative . . . . . . . . . . . . . . . . . . . . . . . . . . . . . . . . . . . . . . . . 13,865 13,527
Total operating expenses . . . . . . . . . . . . . . . . . . . . . . . . . . . . . . . . . . . . . 61,589 55,708
Operating income . . . . . . . . . . . . . . . . . . . . . . . . . . . . . . . . . . . . . . . . . . . 7,761 9,563
OTHER INCOME (EXPENSES)Interest expense . . . . . . . . . . . . . . . . . . . . . . . . . . . . . . . . . . . . . . . . . . . . . . . . (28) (105)Gain on existing joint venture investment . . . . . . . . . . . . . . . . . . . . . . . . . . . . 3,480 —Earnings from joint venture investment . . . . . . . . . . . . . . . . . . . . . . . . . . . . . . — 212Foreign exchange gains (losses) . . . . . . . . . . . . . . . . . . . . . . . . . . . . . . . . . . . . (441) 318Other non-operating expenses . . . . . . . . . . . . . . . . . . . . . . . . . . . . . . . . . . . . . (11) (182)
Total other income . . . . . . . . . . . . . . . . . . . . . . . . . . . . . . . . . . . . . . . . . . 3,000 243
Income before income taxes . . . . . . . . . . . . . . . . . . . . . . . . . . . . . . . . . . . 10,761 9,806Provision for income taxes . . . . . . . . . . . . . . . . . . . . . . . . . . . . . . . . . . . . . . . . . . . . 2,858 3,432
Net income . . . . . . . . . . . . . . . . . . . . . . . . . . . . . . . . . . . . . . . . . . . . . . . . $ 7,903 $ 6,374
- II-230 -
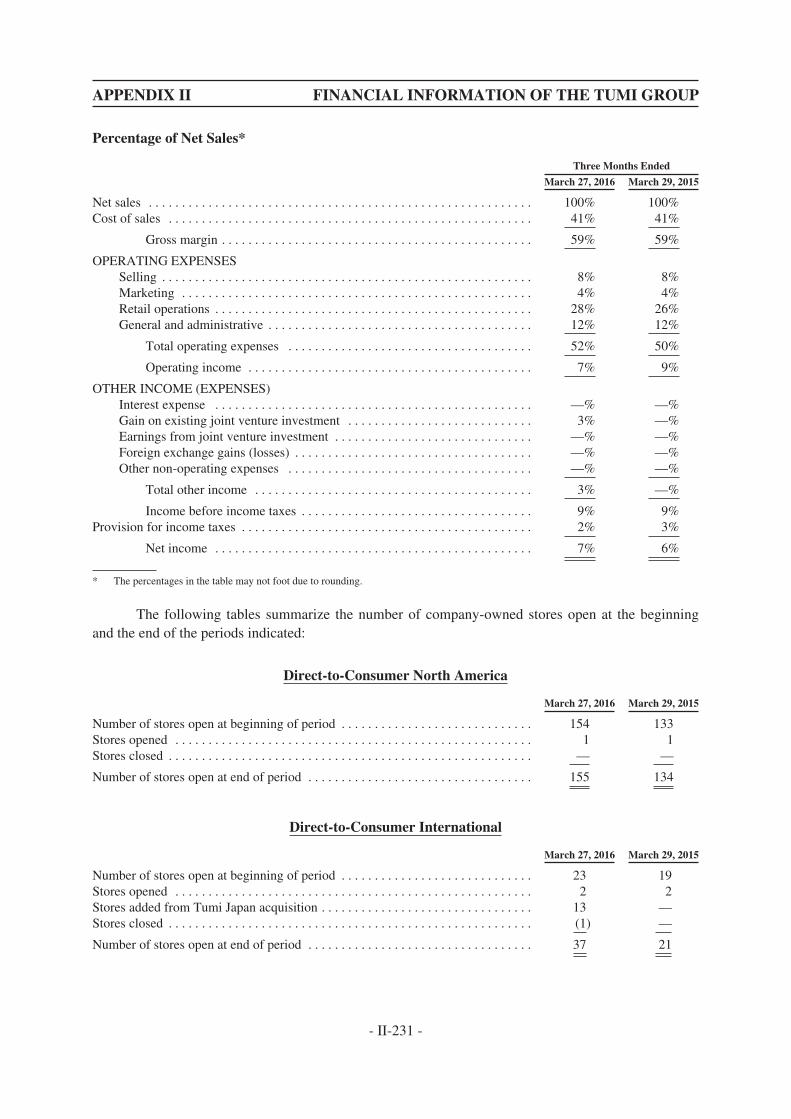
APPENDIX II FINANCIAL INFORMATION OF THE TUMI GROUP
Percentage of Net Sales*
Three Months Ended
March 27, 2016 March 29, 2015
Net sales . . . . . . . . . . . . . . . . . . . . . . . . . . . . . . . . . . . . . . . . . . . . . . . . . . . . . . . . . . 100% 100%Cost of sales . . . . . . . . . . . . . . . . . . . . . . . . . . . . . . . . . . . . . . . . . . . . . . . . . . . . . . . 41% 41%
Gross margin . . . . . . . . . . . . . . . . . . . . . . . . . . . . . . . . . . . . . . . . . . . . . . . 59% 59%
OPERATING EXPENSESSelling . . . . . . . . . . . . . . . . . . . . . . . . . . . . . . . . . . . . . . . . . . . . . . . . . . . . . . . . 8% 8%Marketing . . . . . . . . . . . . . . . . . . . . . . . . . . . . . . . . . . . . . . . . . . . . . . . . . . . . . 4% 4%Retail operations . . . . . . . . . . . . . . . . . . . . . . . . . . . . . . . . . . . . . . . . . . . . . . . . 28% 26%General and administrative . . . . . . . . . . . . . . . . . . . . . . . . . . . . . . . . . . . . . . . . 12% 12%
Total operating expenses . . . . . . . . . . . . . . . . . . . . . . . . . . . . . . . . . . . . . 52% 50%
Operating income . . . . . . . . . . . . . . . . . . . . . . . . . . . . . . . . . . . . . . . . . . . 7% 9%
OTHER INCOME (EXPENSES)Interest expense . . . . . . . . . . . . . . . . . . . . . . . . . . . . . . . . . . . . . . . . . . . . . . . . —% —%Gain on existing joint venture investment . . . . . . . . . . . . . . . . . . . . . . . . . . . . 3% —%Earnings from joint venture investment . . . . . . . . . . . . . . . . . . . . . . . . . . . . . . —% —%Foreign exchange gains (losses) . . . . . . . . . . . . . . . . . . . . . . . . . . . . . . . . . . . . —% —%Other non-operating expenses . . . . . . . . . . . . . . . . . . . . . . . . . . . . . . . . . . . . . —% —%
Total other income . . . . . . . . . . . . . . . . . . . . . . . . . . . . . . . . . . . . . . . . . . 3% —%
Income before income taxes . . . . . . . . . . . . . . . . . . . . . . . . . . . . . . . . . . . 9% 9%Provision for income taxes . . . . . . . . . . . . . . . . . . . . . . . . . . . . . . . . . . . . . . . . . . . . 2% 3%
Net income . . . . . . . . . . . . . . . . . . . . . . . . . . . . . . . . . . . . . . . . . . . . . . . . 7% 6%
* The percentages in the table may not foot due to rounding.
The following tables summarize the number of company-owned stores open at the beginningand the end of the periods indicated:
Direct-to-Consumer North America
March 27, 2016 March 29, 2015
Number of stores open at beginning of period . . . . . . . . . . . . . . . . . . . . . . . . . . . . . 154 133Stores opened . . . . . . . . . . . . . . . . . . . . . . . . . . . . . . . . . . . . . . . . . . . . . . . . . . . . . . 1 1Stores closed . . . . . . . . . . . . . . . . . . . . . . . . . . . . . . . . . . . . . . . . . . . . . . . . . . . . . . . — —
Number of stores open at end of period . . . . . . . . . . . . . . . . . . . . . . . . . . . . . . . . . . 155 134
Direct-to-Consumer International
March 27, 2016 March 29, 2015
Number of stores open at beginning of period . . . . . . . . . . . . . . . . . . . . . . . . . . . . . 23 19Stores opened . . . . . . . . . . . . . . . . . . . . . . . . . . . . . . . . . . . . . . . . . . . . . . . . . . . . . . 2 2Stores added from Tumi Japan acquisition . . . . . . . . . . . . . . . . . . . . . . . . . . . . . . . . 13 —Stores closed . . . . . . . . . . . . . . . . . . . . . . . . . . . . . . . . . . . . . . . . . . . . . . . . . . . . . . . (1) —
Number of stores open at end of period . . . . . . . . . . . . . . . . . . . . . . . . . . . . . . . . . . 37 21
- II-231 -
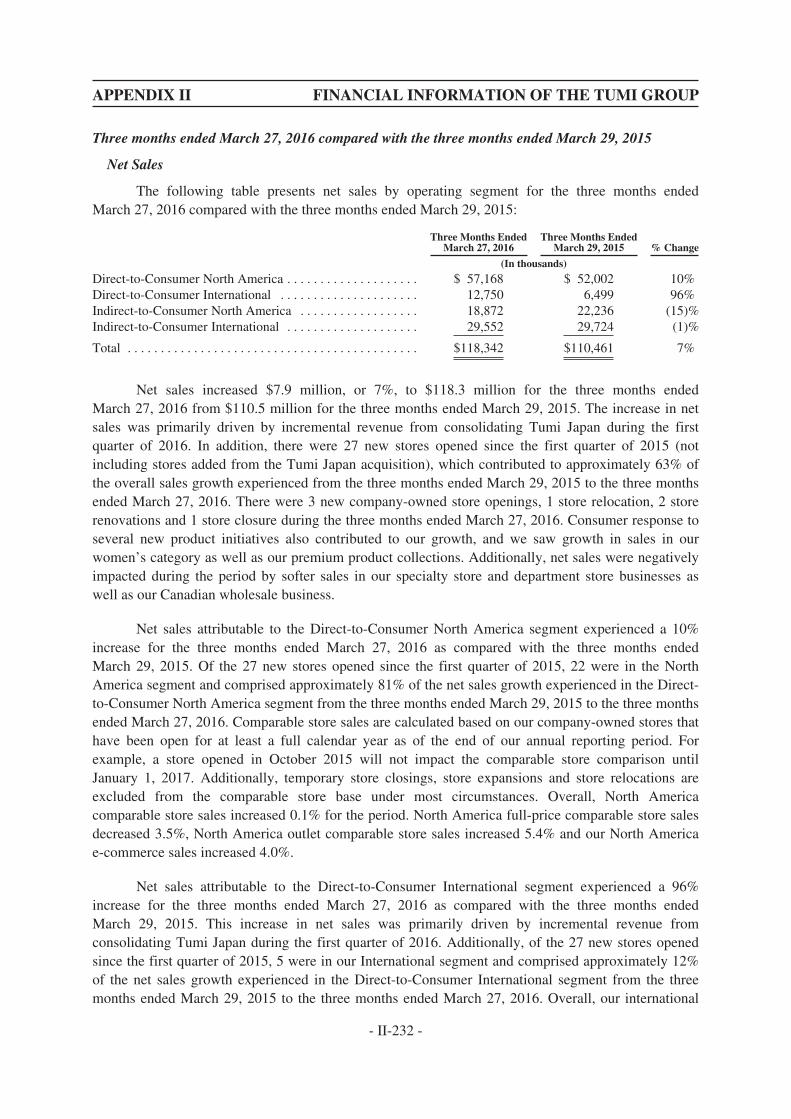
APPENDIX II FINANCIAL INFORMATION OF THE TUMI GROUP
Three months ended March 27, 2016 compared with the three months ended March 29, 2015
Net Sales
The following table presents net sales by operating segment for the three months endedMarch 27, 2016 compared with the three months ended March 29, 2015:
Three Months EndedMarch 27, 2016
Three Months EndedMarch 29, 2015 % Change
(In thousands)
Direct-to-Consumer North America . . . . . . . . . . . . . . . . . . . . $ 57,168 $ 52,002 10%Direct-to-Consumer International . . . . . . . . . . . . . . . . . . . . . 12,750 6,499 96%Indirect-to-Consumer North America . . . . . . . . . . . . . . . . . . 18,872 22,236 (15)%Indirect-to-Consumer International . . . . . . . . . . . . . . . . . . . . 29,552 29,724 (1)%
Total . . . . . . . . . . . . . . . . . . . . . . . . . . . . . . . . . . . . . . . . . . . . $118,342 $110,461 7%
Net sales increased $7.9 million, or 7%, to $118.3 million for the three months endedMarch 27, 2016 from $110.5 million for the three months ended March 29, 2015. The increase in netsales was primarily driven by incremental revenue from consolidating Tumi Japan during the firstquarter of 2016. In addition, there were 27 new stores opened since the first quarter of 2015 (notincluding stores added from the Tumi Japan acquisition), which contributed to approximately 63% ofthe overall sales growth experienced from the three months ended March 29, 2015 to the three monthsended March 27, 2016. There were 3 new company-owned store openings, 1 store relocation, 2 storerenovations and 1 store closure during the three months ended March 27, 2016. Consumer response toseveral new product initiatives also contributed to our growth, and we saw growth in sales in ourwomen’s category as well as our premium product collections. Additionally, net sales were negativelyimpacted during the period by softer sales in our specialty store and department store businesses aswell as our Canadian wholesale business.
Net sales attributable to the Direct-to-Consumer North America segment experienced a 10%increase for the three months ended March 27, 2016 as compared with the three months endedMarch 29, 2015. Of the 27 new stores opened since the first quarter of 2015, 22 were in the NorthAmerica segment and comprised approximately 81% of the net sales growth experienced in the Direct-to-Consumer North America segment from the three months ended March 29, 2015 to the three monthsended March 27, 2016. Comparable store sales are calculated based on our company-owned stores thathave been open for at least a full calendar year as of the end of our annual reporting period. Forexample, a store opened in October 2015 will not impact the comparable store comparison untilJanuary 1, 2017. Additionally, temporary store closings, store expansions and store relocations areexcluded from the comparable store base under most circumstances. Overall, North Americacomparable store sales increased 0.1% for the period. North America full-price comparable store salesdecreased 3.5%, North America outlet comparable store sales increased 5.4% and our North Americae-commerce sales increased 4.0%.
Net sales attributable to the Direct-to-Consumer International segment experienced a 96%increase for the three months ended March 27, 2016 as compared with the three months endedMarch 29, 2015. This increase in net sales was primarily driven by incremental revenue fromconsolidating Tumi Japan during the first quarter of 2016. Additionally, of the 27 new stores openedsince the first quarter of 2015, 5 were in our International segment and comprised approximately 12%of the net sales growth experienced in the Direct-to-Consumer International segment from the threemonths ended March 29, 2015 to the three months ended March 27, 2016. Overall, our international
- II-232 -
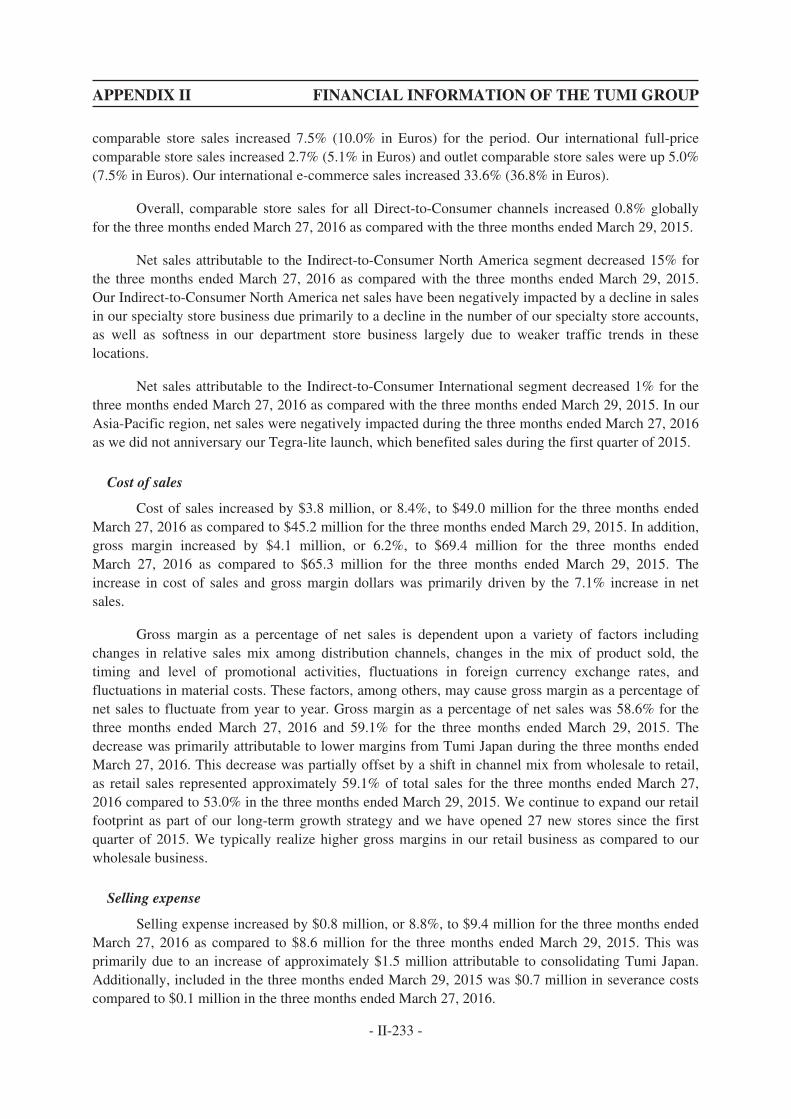
APPENDIX II FINANCIAL INFORMATION OF THE TUMI GROUP
comparable store sales increased 7.5% (10.0% in Euros) for the period. Our international full-pricecomparable store sales increased 2.7% (5.1% in Euros) and outlet comparable store sales were up 5.0%(7.5% in Euros). Our international e-commerce sales increased 33.6% (36.8% in Euros).
Overall, comparable store sales for all Direct-to-Consumer channels increased 0.8% globallyfor the three months ended March 27, 2016 as compared with the three months ended March 29, 2015.
Net sales attributable to the Indirect-to-Consumer North America segment decreased 15% forthe three months ended March 27, 2016 as compared with the three months ended March 29, 2015.Our Indirect-to-Consumer North America net sales have been negatively impacted by a decline in salesin our specialty store business due primarily to a decline in the number of our specialty store accounts,as well as softness in our department store business largely due to weaker traffic trends in theselocations.
Net sales attributable to the Indirect-to-Consumer International segment decreased 1% for thethree months ended March 27, 2016 as compared with the three months ended March 29, 2015. In ourAsia-Pacific region, net sales were negatively impacted during the three months ended March 27, 2016as we did not anniversary our Tegra-lite launch, which benefited sales during the first quarter of 2015.
Cost of sales
Cost of sales increased by $3.8 million, or 8.4%, to $49.0 million for the three months endedMarch 27, 2016 as compared to $45.2 million for the three months ended March 29, 2015. In addition,gross margin increased by $4.1 million, or 6.2%, to $69.4 million for the three months endedMarch 27, 2016 as compared to $65.3 million for the three months ended March 29, 2015. Theincrease in cost of sales and gross margin dollars was primarily driven by the 7.1% increase in netsales.
Gross margin as a percentage of net sales is dependent upon a variety of factors includingchanges in relative sales mix among distribution channels, changes in the mix of product sold, thetiming and level of promotional activities, fluctuations in foreign currency exchange rates, andfluctuations in material costs. These factors, among others, may cause gross margin as a percentage ofnet sales to fluctuate from year to year. Gross margin as a percentage of net sales was 58.6% for thethree months ended March 27, 2016 and 59.1% for the three months ended March 29, 2015. Thedecrease was primarily attributable to lower margins from Tumi Japan during the three months endedMarch 27, 2016. This decrease was partially offset by a shift in channel mix from wholesale to retail,as retail sales represented approximately 59.1% of total sales for the three months ended March 27,2016 compared to 53.0% in the three months ended March 29, 2015. We continue to expand our retailfootprint as part of our long-term growth strategy and we have opened 27 new stores since the firstquarter of 2015. We typically realize higher gross margins in our retail business as compared to ourwholesale business.
Selling expense
Selling expense increased by $0.8 million, or 8.8%, to $9.4 million for the three months endedMarch 27, 2016 as compared to $8.6 million for the three months ended March 29, 2015. This wasprimarily due to an increase of approximately $1.5 million attributable to consolidating Tumi Japan.Additionally, included in the three months ended March 29, 2015 was $0.7 million in severance costscompared to $0.1 million in the three months ended March 27, 2016.
- II-233 -
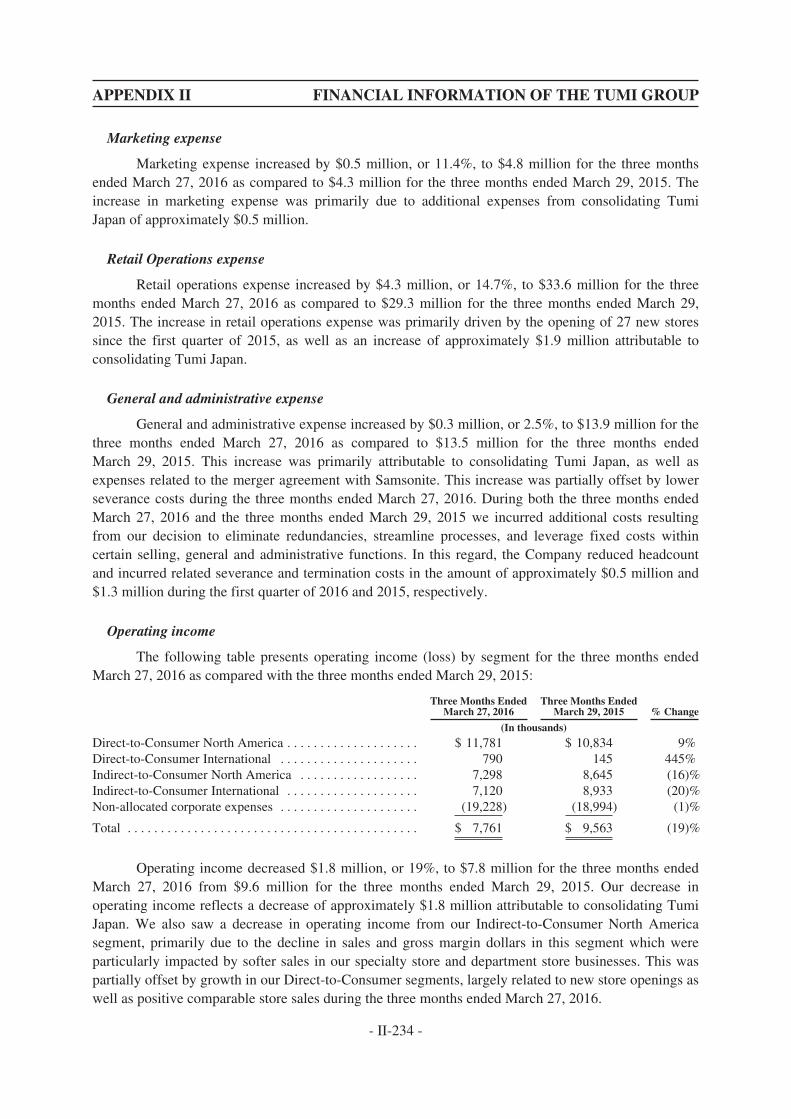
APPENDIX II FINANCIAL INFORMATION OF THE TUMI GROUP
Marketing expense
Marketing expense increased by $0.5 million, or 11.4%, to $4.8 million for the three monthsended March 27, 2016 as compared to $4.3 million for the three months ended March 29, 2015. Theincrease in marketing expense was primarily due to additional expenses from consolidating TumiJapan of approximately $0.5 million.
Retail Operations expense
Retail operations expense increased by $4.3 million, or 14.7%, to $33.6 million for the threemonths ended March 27, 2016 as compared to $29.3 million for the three months ended March 29,2015. The increase in retail operations expense was primarily driven by the opening of 27 new storessince the first quarter of 2015, as well as an increase of approximately $1.9 million attributable toconsolidating Tumi Japan.
General and administrative expense
General and administrative expense increased by $0.3 million, or 2.5%, to $13.9 million for thethree months ended March 27, 2016 as compared to $13.5 million for the three months endedMarch 29, 2015. This increase was primarily attributable to consolidating Tumi Japan, as well asexpenses related to the merger agreement with Samsonite. This increase was partially offset by lowerseverance costs during the three months ended March 27, 2016. During both the three months endedMarch 27, 2016 and the three months ended March 29, 2015 we incurred additional costs resultingfrom our decision to eliminate redundancies, streamline processes, and leverage fixed costs withincertain selling, general and administrative functions. In this regard, the Company reduced headcountand incurred related severance and termination costs in the amount of approximately $0.5 million and$1.3 million during the first quarter of 2016 and 2015, respectively.
Operating income
The following table presents operating income (loss) by segment for the three months endedMarch 27, 2016 as compared with the three months ended March 29, 2015:
Three Months EndedMarch 27, 2016
Three Months EndedMarch 29, 2015 % Change
(In thousands)
Direct-to-Consumer North America . . . . . . . . . . . . . . . . . . . . $ 11,781 $ 10,834 9%Direct-to-Consumer International . . . . . . . . . . . . . . . . . . . . . 790 145 445%Indirect-to-Consumer North America . . . . . . . . . . . . . . . . . . 7,298 8,645 (16)%Indirect-to-Consumer International . . . . . . . . . . . . . . . . . . . . 7,120 8,933 (20)%Non-allocated corporate expenses . . . . . . . . . . . . . . . . . . . . . (19,228) (18,994) (1)%
Total . . . . . . . . . . . . . . . . . . . . . . . . . . . . . . . . . . . . . . . . . . . . $ 7,761 $ 9,563 (19)%
Operating income decreased $1.8 million, or 19%, to $7.8 million for the three months endedMarch 27, 2016 from $9.6 million for the three months ended March 29, 2015. Our decrease inoperating income reflects a decrease of approximately $1.8 million attributable to consolidating TumiJapan. We also saw a decrease in operating income from our Indirect-to-Consumer North Americasegment, primarily due to the decline in sales and gross margin dollars in this segment which wereparticularly impacted by softer sales in our specialty store and department store businesses. This waspartially offset by growth in our Direct-to-Consumer segments, largely related to new store openings aswell as positive comparable store sales during the three months ended March 27, 2016.
- II-234 -
APPENDIX II FINANCIAL INFORMATION OF THE TUMI GROUP
Operating income attributable to the Direct-to-Consumer North America segment experienced a9% increase for the three months ended March 27, 2016 as compared with the three months endedMarch 29, 2015. This was primarily due to growth in our outlet comparable store sales, as well asgrowth from our e-commerce websites.
Operating income attributable to the Direct-to-Consumer International segment increased 445%for the three months ended March 27, 2016 as compared with the three months ended March 29, 2015.This was primarily due to an increase in operating income of approximately $0.5 million attributable toconsolidating Tumi Japan, as well as growth from our international e-commerce websites.
Operating income attributable to the Indirect-to-Consumer North America segment experienceda decrease of 16% for the three months ended March 27, 2016 as compared with the three monthsended March 29, 2015. This was largely due to the decline in sales and gross margin dollars in thissegment which were particularly impacted by softer sales in our specialty store and department storebusinesses, as well as our Canadian wholesale business.
Operating income attributable to the Indirect-to-Consumer International segment experienced a20% decrease for the three months ended March 27, 2016 as compared with the three months endedMarch 29, 2015. This was primarily due to a decrease in operating income of approximately $1.0million attributable to consolidating Tumi Japan, as well as softer sales in our Asia-Pacific region.
Non-allocated corporate expenses represent expenses not attributable to a particular operatingsegment, and consist of core corporate expenses such as corporate marketing, design, general andadministrative expenses, after sales service costs, shipping and warehousing, human resources relatedto corporate overhead, finance, legal and professional fees and other costs. As we expand our business,we believe general and administrative expenses will increase in dollar amount in future periods,although we expect to leverage these expenses against sales as the business grows. Non-allocatedcorporate expenses increased 1% for the three months ended March 27, 2016 as compared with thethree months ended March 29, 2015. This increase was primarily attributable to consolidating TumiJapan, as well as expenses related to the merger agreement with Samsonite, partially offset by theaforementioned lower severance costs during the three months ended March 27, 2016.
Operating margin was 7% for the three months ended March 27, 2016 as compared to 9% forthe three months ended March 29, 2015, as the previously mentioned impact of consolidating TumiJapan, as well as retail operations expense for new stores and the wrap effect (expenses for stores forwhich there were little or no expenses in the comparable prior period) of stores opened since the firstquarter of 2015, offset some of our fixed cost leverage.
Other income and expenses
Other income and expenses, net increased $2.8 million to $3.0 million for the three monthsended March 27, 2016 from $0.2 million for the three months ended March 29, 2015. This increasewas primarily driven by the gain on our existing joint venture investment recorded in connection withthe Tumi Japan acquisition, during the first quarter of 2016.
Income tax expense
Provision for income taxes decreased $0.6 million, or 17%, to $2.9 million in the three monthsended March 27, 2016 from $3.4 million in the three months ended March 29, 2015. This was
- II-235 -
APPENDIX II FINANCIAL INFORMATION OF THE TUMI GROUP
primarily due to the benefit from the pre-tax gain on our existing joint venture investment recorded inconnection with our Tumi Japan acquisition, which is non-taxable. This benefit has been recorded as adiscrete item for the three months ended March 27, 2016.
Net income
Net income increased $1.5 million to $7.9 million for the three months ended March 27, 2016from $6.4 million for the three months ended March 29, 2015. This increase was primarily driven bythe increase in net sales and gross margin dollars realized, partially offset by the aforementionedimpact of consolidating Tumi Japan, as well as retail operations expense for new stores and the wrapeffect of stores opened since the first quarter of 2015.
Basic and diluted weighted average shares outstanding were 67.5 million and 67.9 millionshares for the three months ended March 27, 2016 and March 29, 2015, respectively. Basic and dilutedEPS was $0.12 per common share for the three months ended March 27, 2016 versus $0.09 percommon share for the three months ended March 29, 2015.
Seasonality
Our business is seasonal in nature and, as a result, our net sales and working capitalrequirements fluctuate from quarter to quarter. Our fourth quarter is a significant period for our resultsof operations due to increased Direct-to-Consumer sales during the holiday season in North Americaand Europe. In 2015, fourth quarter net sales represented approximately 31% of our total annual netsales. Operating income in the same period represented 40% of our total annual operating income.During the fourth quarter, the Company expects inventory levels, accounts payable and accruedexpenses to increase commensurate with net sales.
Liquidity and Capital Resources
Historically, our primary source of liquidity has been cash flows from operations. Our long-term credit facility has not historically been used to finance our capital requirements, but instead wasused to refinance acquisition indebtedness originally incurred when Doughty Hanson and certainmembers of management at that time acquired the Company in 2004. We have from time to timedrawn down on our revolving line of credit as short-term liquidity needs arise. We use our cash flowsfrom operations to fund our store development and overall growth activities. In addition, we funded theTumi Japan acquisition through cash on-hand.
Inflationary factors such as increases in the cost of sales, including raw materials costs andtransportation costs, may adversely affect our operating results. Although we do not believe thatinflation has had a material impact on our financial position to date, a high rate of inflation in the futuremay have an adverse effect on our ability to maintain our gross margin levels and our current levels ofselling expenses and general and administrative expenses as a percentage of net sales if the sale pricesof our products do not increase with any increase in cost of sales.
We believe we have sufficient working capital and liquidity to support our operations for atleast the next twelve months.
- II-236 -
APPENDIX II FINANCIAL INFORMATION OF THE TUMI GROUP
Cash and cash equivalents
As of March 27, 2016, we had cash and cash equivalents of $102.0 million. A summary of ourcash flows provided by and used in operating, investing and financing activities is presented below.
Cash flows from operating activities
Cash flows from operating activities consisted primarily of net income adjusted for certain non-cash items, including depreciation and amortization, share-based compensation expense, gain onacquisition of joint venture investment, loss on disposal of fixed assets and other non-cash charges.Our cash flows from operations are largely dependent on sales to consumers and wholesale customers,which are in turn dependent on consumer confidence, store traffic, conversion, business travel andgeneral economic conditions. We believe we have the ability to conserve liquidity when economicconditions become less favorable through any number of strategies including curtailment of storeexpansion plans and cutting discretionary spending.
We generated cash flows from operations of $4.1 million during the three months endedMarch 27, 2016, compared to $12.0 million during the three months ended March 29, 2015. Thedecrease was primarily driven by a decrease in accounts payable and accrued expenses as of March 27,2016, largely related to the timing of vendor payments.
Investing activities
Cash flows used for investing activities consisted of capital expenditures for store expansionplans, store renovations, store openings, store relocations, information technology infrastructure,distribution infrastructure and product tooling costs, as well as the Tumi Japan acquisition.
Cash used for investing activities was $2.7 million and $8.1 million for the three months endedMarch 27, 2016 and March 29, 2015, respectively. Capital expenditures for the year endedDecember 31, 2016 are expected to be in the range of $23.0 million to $28.0 million.
Financing activities
Cash flows provided by financing activities was $5.6 million for the three months endedMarch 27, 2016. Financing activities during the three months ended March 27, 2016 consistedprimarily of borrowings and payments under the Tumi Japan Credit Facilities and notes payable, aswell as proceeds received from options exercised during the first quarter of 2016.
Amended and restated credit facility
The Amended Credit Facility consolidated the term loan facility and the revolving creditfacility previously provided in the Company’s former credit facility into a single $70,000,000 seniorsecured revolving credit facility, with Wells Fargo as the sole lender, and extended the maturity of thefacility until April 4, 2017. The Amended Credit Facility includes a letter of credit sublimit of$5,000,000.
Borrowings under the Amended Credit Facility bear interest at a per annum rate equal to, at theBorrowers’ option, the one, two, three or six month (or such other period as Wells Fargo may agree)LIBOR rate plus a margin of 1.00% or 1.25%, or a base rate (the greater of (i) Wells Fargo’s prime rate
- II-237 -

APPENDIX II FINANCIAL INFORMATION OF THE TUMI GROUP
in effect on such day and (ii) the federal funds rate plus 1/2 of 1.00%) plus a margin of zero or 0.25%.The Borrowers are required to pay an undrawn commitment fee equal to 0.15% or 0.20% of theundrawn portion of the commitments under the Amended Credit Facility, as well as customary letter ofcredit fees. The margin added to LIBOR, or the base rate, as well as the amount of the commitmentfee, depends on Tumi, Inc.’s leverage at the time. Interest is payable monthly, bi-monthly or quarterlyon LIBOR rate loans depending on the interest period for each LIBOR rate loan, or quarterly on baserate loans.
As of March 27, 2016 and December 31, 2015, the Company had no balance outstanding underthe Amended Credit Facility. Letters of credit outstanding at March 27, 2016 and December 31, 2015totaled $384,000 under the Amended Credit Facility and, accordingly, the unused portion of theAmended Credit Facility was $69,616,000. The fee for the unused portion of the Amended CreditFacility was $26,000 for the three months ended March 27, 2016 and March 29, 2015.
All obligations under the Amended Credit Facility are required to be guaranteed by each of theBorrowers’ material domestic subsidiaries, subject to certain exclusions. The obligations under theAmended Credit Facility are secured by substantially all of the Borrowers’ assets and, if applicable,those of the Borrowers’ subsidiary guarantors. Currently, the Borrowers do not have any subsidiaryguarantors.
The Amended Credit Facility contains customary covenants, including, but not limited to,limitations on the ability of the Borrowers and their subsidiaries to incur additional debt and liens,dispose of assets, and make certain investments and restricted payments, including the prepayment ofcertain debt and cash dividends. In addition, the Amended Credit Facility contains financial covenantsrequiring that the Borrowers maintain (a) a minimum ratio of consolidated adjusted EBITDA toconsolidated cash interest expense (as such terms are defined in the Amended Credit Facility) of notless than 4.00 to 1.00 and (b) a maximum ratio of consolidated total debt to consolidated adjustedEBITDA of no greater than 2.25 to 1.00. The Borrowers were in compliance with all such covenants asof March 27, 2016.
The Amended Credit Facility also contains customary events of default, including, but notlimited to, payment defaults, breaches of representations and warranties, covenant defaults, cross-defaults under material debt, certain events of bankruptcy and insolvency, defaults based on certainjudgments, failure of any material provision of any loan document to be in full force and effect, changeof control, and certain ERISA defaults. If an event of default were to occur and continue, amounts dueunder the Amended Credit Facility could be accelerated and the commitments to extend creditthereunder terminated, and the rights and remedies of Wells Fargo under the Amended Credit Facilityavailable under the applicable loan documents could be exercised, including rights with respect to thecollateral securing the obligations under the Amended Credit Facility.
The foregoing summaries of certain provisions of the Amended Credit Facility do not purportto be complete and are qualified in their entirety by reference to the full text of the Amended CreditFacility, which is incorporated by reference as exhibit 10.3b to our Annual Report on Form 10-K forthe year ended December 31, 2015, filed with the SEC on February 25, 2016.
Tumi Japan Credit Facilities
Tumi Japan has uncommitted credit facilities with regional branches of Bank of Tokyo-Misubishi UFJ and Resona Bank, Ltd. (the “Tumi Japan Credit Facilities.”) These credit facilities are
- II-238 -
APPENDIX II FINANCIAL INFORMATION OF THE TUMI GROUP
subject to annual renewal and may be used to fund the general working capital and corporate needs ofTumi Japan. Borrowings under the Tumi Japan Credit Facilities are granted at the sole discretion of theBanks, subject to availability of the Banks’ funds and satisfaction of certain regulatory requirements.The Tumi Japan Credit Facilities do not contain any financial covenants. Details of the Tumi JapanCredit Facilities are as follows:
Š Bank of Tokyo-Mitsubishi UFJ Credit Facility—provides a revolving line of credit ofup to 100,000,000 yen. Borrowings under the Credit Facility bear interest at a perannum rate equal to the Japanese interest rate plus a margin of 0.850%.
Š Resona Bank Ltd. Credit Facility—provides a revolving line of credit of up to500,000,000 yen. Borrowings under the Credit Facility bear interest at a per annum rateequal to the Japanese interest rate plus a margin of 1.00%.
As of March 27, 2016 the Company had $2,654,000 outstanding under the Tumi Japan CreditFacilities.
Notes Payable
Tumi Japan enters into promissory note arrangements with its banks. The notes are non-interestbearing and are generally contractually due three months after the issuance date. There were noguarantees or collateral held against the notes.
Share Repurchase Program
On November 4, 2015, the Company announced that its Board of Directors authorized therepurchase of up to $150 million of the Company’s common stock over the next twelve months. Underthe program, the Company may purchase its shares from time to time in the open market or in privatelynegotiated transactions. The Company expects that purchases will be funded through existing cash onhand, cash from operations, borrowings or a combination of the foregoing. The amount and timing ofthe purchases will depend on a number of factors including the price and availability of the Company’sshares, trading volume and general market conditions. Repurchases may also be made under a Rule10b5-1 plan, which would permit shares to be repurchased when the Company might otherwise beprecluded from doing so under insider trading laws. The share repurchase program may be suspendedor discontinued at any time.
There were no repurchases made during the first quarter of 2016. As of March 27, 2016, theremaining availability under the Company’s share repurchase program was approximately$141,546,000. All repurchased shares of common stock have been accounted for as treasury stock atcost.
As part of the Merger Agreement with Samsonite, the Company agreed that during theexecutory period beginning on March 3, 2016, the date of the Merger Agreement, and ending on theearlier of the termination of the Merger Agreement, per its terms, and the effective time of the merger,it would not repurchase any shares of its capital stock.
Contractual Obligations
There have been no material changes to the contractual obligations table included in our AnnualReport on Form 10-K for the year ended December 31, 2015, filed with the SEC on February 25, 2016.
- II-239 -
APPENDIX II FINANCIAL INFORMATION OF THE TUMI GROUP
Off-Balance Sheet Arrangements
We have not entered into any off-balance sheet arrangements.
Critical Accounting Policies and Estimates
There have been no material changes to the description of our critical accounting policies andestimates included in our Annual Report on Form 10-K for the year ended December 31, 2015 as filedwith the SEC on February 25, 2016.
Recently Issued Accounting Pronouncements
Except as discussed in Note 2—Summary of Significant Accounting Policies to our condensedconsolidated financial statements included in this Quarterly Report on Form 10-Q, we have consideredall new accounting pronouncements and have concluded that there are no new pronouncements that weexpect to have a material impact on our results of operations, financial condition, or cash flows, basedon current information.
QUANTITATIVE AND QUALITATIVE DISCLOSURES ABOUT MARKET RISK
The quantitative and qualitative disclosures about market risk required by this item have notchanged materially from those disclosed in our Annual Report on Form 10-K for the year endedDecember 31, 2015, filed with the SEC on February 25, 2016. For a discussion of our exposure tomarket risk, refer to Part II, Item 7A, “Quantitative and Qualitative Disclosures About Market Risk,”contained in our Annual Report on Form 10-K for the year ended December 31, 2015, filed with theSEC on February 25, 2016.
- II-240 -
A. UNAUDITED PRO FORMA FINANCIAL INFORMATION OF THE ENLARGEDGROUP
The following is an illustrative and unaudited pro forma consolidated statement of assets andliabilities as at December 31, 2015 of the Enlarged Group (the “Unaudited Pro Forma FinancialInformation”), which has been prepared by the Directors in accordance with paragraph 4.29 of theListing Rules and on the basis of the notes set out below, for the purpose of illustrating the effect of theMerger as if it had taken place on December 31, 2015.
The Unaudited Pro Forma Financial Information has been prepared for illustrative purposesonly and is based on a number of assumptions, estimates and uncertainties and currently availableinformation. Because of its hypothetical nature, it may not give a true picture of the financial positionof the Enlarged Group had the Merger been completed as of December 31, 2015 or as of any futuredate.
The Unaudited Pro Forma Financial Information of the Enlarged Group has been preparedbased on (i) the audited consolidated statement of financial position of the Group as at December 31,2015, which has been extracted from the Company’s annual report for the year ended December 31,2015; (ii) Tumi’s Unaudited Adjusted Financial Information under the Company’s Accounting Policiesas at December 31, 2015 as set out in Appendix II of this Circular, and adjusted on a pro forma basis toreflect the effect of the Merger, as described in the accompanying notes. These pro forma adjustmentsare (i) directly attributable to the Merger and not relating to other future events or decisions and(ii) factually supportable. All excess purchase price over the book value of Tumi’s net assets has beenshown as goodwill as the Company has not performed a valuation of the fair value of the identifiableassets acquired and liabilities assumed.
The Unaudited Pro Forma Financial Information should be read in conjunction with thehistorical financial information of the Group as set out in the Company’s annual report for the yearended December 31, 2015, the historical financial information of Tumi as set out in Appendix II to thiscircular and other financial information included elsewhere in this circular.
- III-1 -
APPENDIX III UNAUDITED PRO FORMA FINANCIAL INFORMATIONOF THE ENLARGED GROUP
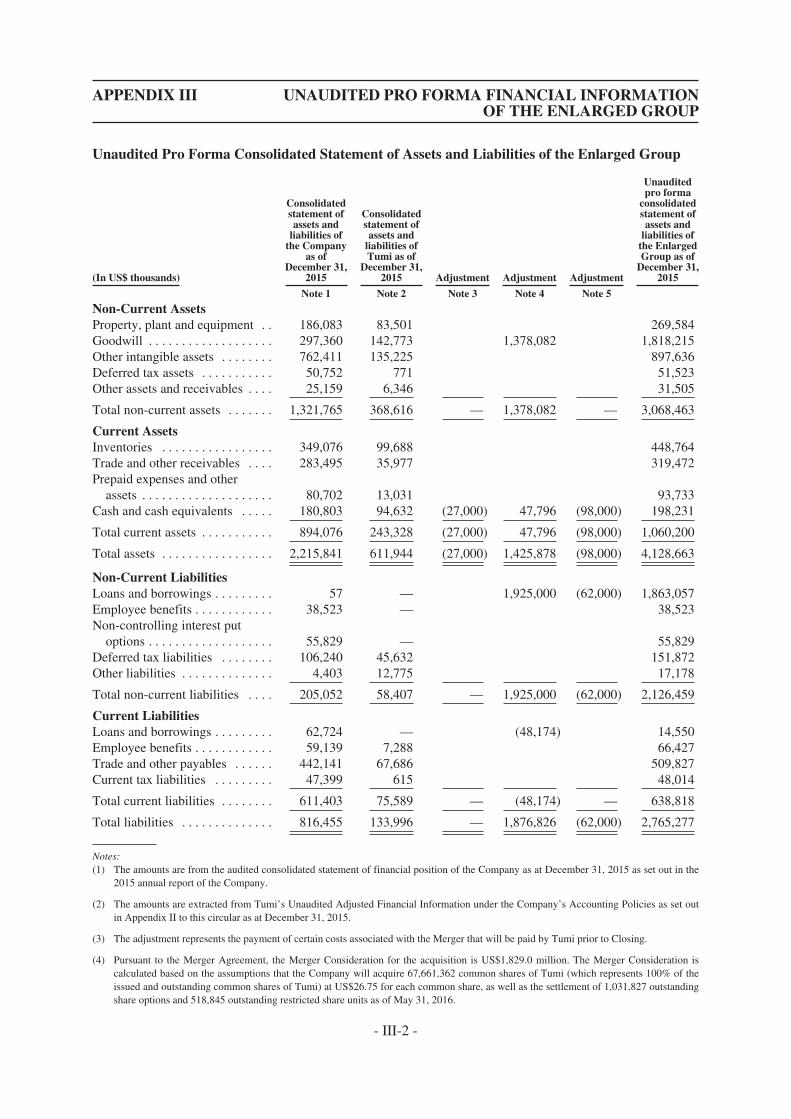
Unaudited Pro Forma Consolidated Statement of Assets and Liabilities of the Enlarged Group
(In US$ thousands)
Consolidatedstatement ofassets and
liabilities ofthe Company
as ofDecember 31,
2015
Consolidatedstatement ofassets and
liabilities ofTumi as of
December 31,2015 Adjustment Adjustment Adjustment
Unauditedpro forma
consolidatedstatement ofassets and
liabilities ofthe EnlargedGroup as of
December 31,2015
Note 1 Note 2 Note 3 Note 4 Note 5
Non-Current AssetsProperty, plant and equipment . . 186,083 83,501 269,584Goodwill . . . . . . . . . . . . . . . . . . . 297,360 142,773 1,378,082 1,818,215Other intangible assets . . . . . . . . 762,411 135,225 897,636Deferred tax assets . . . . . . . . . . . 50,752 771 51,523Other assets and receivables . . . . 25,159 6,346 31,505
Total non-current assets . . . . . . . 1,321,765 368,616 — 1,378,082 — 3,068,463
Current AssetsInventories . . . . . . . . . . . . . . . . . 349,076 99,688 448,764Trade and other receivables . . . . 283,495 35,977 319,472Prepaid expenses and other
assets . . . . . . . . . . . . . . . . . . . . 80,702 13,031 93,733Cash and cash equivalents . . . . . 180,803 94,632 (27,000) 47,796 (98,000) 198,231
Total current assets . . . . . . . . . . . 894,076 243,328 (27,000) 47,796 (98,000) 1,060,200
Total assets . . . . . . . . . . . . . . . . . 2,215,841 611,944 (27,000) 1,425,878 (98,000) 4,128,663
Non-Current LiabilitiesLoans and borrowings . . . . . . . . . 57 — 1,925,000 (62,000) 1,863,057Employee benefits . . . . . . . . . . . . 38,523 — 38,523Non-controlling interest put
options . . . . . . . . . . . . . . . . . . . 55,829 — 55,829Deferred tax liabilities . . . . . . . . 106,240 45,632 151,872Other liabilities . . . . . . . . . . . . . . 4,403 12,775 17,178
Total non-current liabilities . . . . 205,052 58,407 — 1,925,000 (62,000) 2,126,459
Current LiabilitiesLoans and borrowings . . . . . . . . . 62,724 — (48,174) 14,550Employee benefits . . . . . . . . . . . . 59,139 7,288 66,427Trade and other payables . . . . . . 442,141 67,686 509,827Current tax liabilities . . . . . . . . . 47,399 615 48,014
Total current liabilities . . . . . . . . 611,403 75,589 — (48,174) — 638,818
Total liabilities . . . . . . . . . . . . . . 816,455 133,996 — 1,876,826 (62,000) 2,765,277
Notes:(1) The amounts are from the audited consolidated statement of financial position of the Company as at December 31, 2015 as set out in the
2015 annual report of the Company.
(2) The amounts are extracted from Tumi’s Unaudited Adjusted Financial Information under the Company’s Accounting Policies as set outin Appendix II to this circular as at December 31, 2015.
(3) The adjustment represents the payment of certain costs associated with the Merger that will be paid by Tumi prior to Closing.
(4) Pursuant to the Merger Agreement, the Merger Consideration for the acquisition is US$1,829.0 million. The Merger Consideration iscalculated based on the assumptions that the Company will acquire 67,661,362 common shares of Tumi (which represents 100% of theissued and outstanding common shares of Tumi) at US$26.75 for each common share, as well as the settlement of 1,031,827 outstandingshare options and 518,845 outstanding restricted share units as of May 31, 2016.
- III-2 -
APPENDIX III UNAUDITED PRO FORMA FINANCIAL INFORMATIONOF THE ENLARGED GROUP
The adjustment contemplates that the Company will finance the acquisition with term loans in the amount of US$1,925.0 million. Inconjunction with the financing, the Company will be retiring the outstanding balance on its revolving facility of US$48.2 million as ofDecember 31, 2015.
The difference between the Merger Consideration of US$1,829.0 million for the acquisition of the entire equity interest of Tumi and thecarrying amount of the net assets acquired of Tumi at December 31, 2015 of US$477.9 million, adjusted for the payment of US$27.0million for certain acquisition-related costs per note 3 above, results in the recognition of goodwill in the amount of US$1,378.1 millionfor the Enlarged Group.
The adjustments reflect the allocation of the cost of the Merger to the identifiable assets acquired and liabilities assumed by the Group.Upon the completion of the Merger, the identifiable assets and liabilities of Tumi will be accounted for in the consolidated financialstatements of the Enlarged Group at their fair values as required by the acquisition method in accordance with IFRS 3 (Revised)“Business Combinations” (IFRS 3). The amount of goodwill and the fair value of the identifiable assets and liabilities of Tumi that willbe recognized are subject to (i) the completion of a valuation of the fair value of the identifiable assets acquired and liabilities assumed ofTumi and (ii) the financial position of Tumi at Closing. For the purposes of the preparation of the Unaudited Pro Forma FinancialInformation, it is assumed that the fair value of the net identifiable assets acquired is equal to the carrying amount of the net assets ofTumi. Since the fair value of the identifiable assets acquired and liabilities assumed at Closing may be substantially different from theirrespective values used in the Unaudited Pro Forma Financial Information (including intangible assets), the final amount of assets,liabilities and resulting goodwill arising at Closing may be materially different than the amount presented above.
The Directors of the Company have assessed whether there is any impairment on the goodwill arising from the Merger recorded in theUnaudited Pro Forma Financial Information in accordance with the requirements set out in IAS 36 “Impairment of Assets” (IAS 36) andconcluded that there is no impairment in respect of the goodwill. The Directors of the Company confirmed that they will apply consistentaccounting policies and principal assumptions to assess the impairment of the provisional goodwill in subsequent reporting periods inaccordance with the requirements of IAS 36.
(5) The adjustment represents the use of US$98.0 million for acquisition-related costs related to the Merger. The Company has assumed thatapproximately US$36.0 million is charged to the income statement of the Enlarged Group and US$62.0 million represents the originalissue discount and other financing-related costs that will be deferred and offset against loans and borrowings to be amortized over the lifeof the term loans.
(6) No adjustment has been made to reflect any trading results or other transactions of the Enlarged Group entered into subsequent toDecember 31, 2015.
- III-3 -
APPENDIX III UNAUDITED PRO FORMA FINANCIAL INFORMATIONOF THE ENLARGED GROUP
B. REPORT FROM THE REPORTING ACCOUNTANTS ON THE UNAUDITED PROFORMA FINANCIAL INFORMATION OF THE ENLARGED GROUP
The following is the text of a report received from KPMG LLP, Independent Registered PublicAccounting Firm, United States, for inclusion in this circular, in respect of the unaudited pro formafinancial information of the Enlarged Group.
KPMG LLP60 South StreetTwo Financial CenterBoston, MA 02111United States
June 28, 2016
INDEPENDENT REPORTING ACCOUNTANTS’ ASSURANCE REPORT ON THECOMPILATION OF UNAUDITED PRO FORMA FINANCIAL INFORMATION
TO THE DIRECTORS OF SAMSONITE INTERNATIONAL S.A.
We have completed our assurance engagement to report on the compilation of unaudited proforma financial information by the directors (the “Directors”) of Samsonite International S.A. (the“Company”) for illustrative purposes only. The unaudited pro forma financial information consists ofthe unaudited pro forma consolidated statement of assets and liabilities as at December 31, 2015 andrelated notes as set out on pages III-1 to III-3 of the circular dated June 28, 2016 (the “Circular”)issued by the Company. The applicable criteria on the basis of which the Directors have compiled theunaudited pro forma financial information are described on pages III-1 to III-3 to the Circular.
The unaudited pro forma financial information has been compiled by the Directors to illustratethe impact of the proposed acquisition of Tumi Holdings, Inc. (the “Merger”) on the assets andliabilities of the Company and its subsidiaries (collectively the “Group”) as at December 31, 2015 as ifthe Merger had taken place at December 31, 2015. As part of this process, information about theGroup’s financial position as at December 31, 2015 has been extracted by the Directors from theconsolidated financial statements of the Company for the year then ended, on which an audit report hasbeen published.
Directors’ Responsibilities for the Unaudited Pro Forma Financial Information
The Directors are responsible for compiling the unaudited pro forma financial information inaccordance with paragraph 4.29 of the Rules Governing the Listing of Securities on The StockExchange of Hong Kong Limited (the “Listing Rules”) and with reference to Accounting Guideline 7“Preparation of Pro Forma Financial Information for Inclusion in Investment Circulars” (“AG 7”)issued by the Hong Kong Institute of Certified Public Accountants (“HKICPA”).
Our Independence and Quality Control
We have complied with the independence and other ethical requirements of the Code of Ethicsfor Professional Accountants issued by the HKICPA, which is founded on fundamental principles ofintegrity, objectivity, professional competence and due care, confidentiality and professional behavior.
The firm has complied with the Quality Control Standards of the American Institute ofCertified Public Accountants (“AICPA”).
- III-4 -
APPENDIX III UNAUDITED PRO FORMA FINANCIAL INFORMATIONOF THE ENLARGED GROUP
Reporting Accountants’ Responsibilities
Our responsibility is to express an opinion, as required by paragraph 4.29(7) of the ListingRules, on the unaudited pro forma financial information and to report our opinion to you. We do notaccept any responsibility for any reports previously given by us on any financial information used inthe compilation of the unaudited pro forma financial information beyond that owed to those to whomthose reports were addressed by us at the dates of their issue.
We conducted our engagement in accordance with Hong Kong Standard on AssuranceEngagements (“HKSAE”) 3420 “Assurance Engagements to Report on the Compilation of Pro FormaFinancial Information Included in a Prospectus” issued by the HKICPA and Professional Standards ATSection 401—“Reporting on Pro Forma Financial Information” issued by the AICPA. These standardsrequire that the reporting accountants comply with ethical requirements and plan and performprocedures to obtain reasonable assurance about whether the Directors have compiled the unauditedpro forma financial information in accordance with paragraph 4.29 of the Listing Rules, and withreference to AG 7 issued by the HKICPA.
For purpose of this engagement, we are not responsible for updating or reissuing any reports oropinions on any historical financial information used in compiling the unaudited pro forma financialinformation, nor have we, in the course of this engagement, performed an audit or review of thefinancial information used in compiling the unaudited pro forma financial information.
The purpose of unaudited pro forma financial information included in an investment circular issolely to illustrate the impact of a significant event or transaction on the unadjusted financialinformation of the Group as if the event had occurred or the transaction had been undertaken at anearlier date selected for purposes of the illustration. Accordingly, we do not provide any assurance thatthe actual outcome of the events or transactions at December 31, 2015 would have been as presented.
A reasonable assurance engagement to report on whether the unaudited pro forma financialinformation has been properly compiled on the basis of the applicable criteria involves performingprocedures to assess whether the applicable criteria used by the Directors in the compilation of theunaudited pro forma financial information provide a reasonable basis for presenting the significanteffects directly attributable to the event or transaction, and to obtain sufficient appropriate evidenceabout whether:
Š the related pro forma adjustments give appropriate effect to those criteria; and
Š the unaudited pro forma financial information reflects the proper application of thoseadjustments to the unadjusted financial information.
The procedures selected depend on the reporting accountants’ judgement, having regard to thereporting accountants’ understanding of the nature of the Group, the event or transaction in respect ofwhich the unaudited pro forma financial information has been compiled, and other relevantengagement circumstances.
The engagement also involves evaluating the overall presentation of the unaudited pro formafinancial information.
- III-5 -
APPENDIX III UNAUDITED PRO FORMA FINANCIAL INFORMATIONOF THE ENLARGED GROUP
We believe that the evidence we have obtained is sufficient and appropriate to provide a basisfor our opinion.
Opinion
In our opinion:
a) the unaudited pro forma financial information has been properly compiled on the basisstated;
b) such basis is consistent with the accounting policies of the Group; and
c) the adjustments are appropriate for the purposes of the unaudited pro forma financialinformation as disclosed pursuant to paragraph 4.29(1) of the Listing Rules.
KPMG LLP
Boston, MA, USA
- III-6 -
APPENDIX III UNAUDITED PRO FORMA FINANCIAL INFORMATIONOF THE ENLARGED GROUP
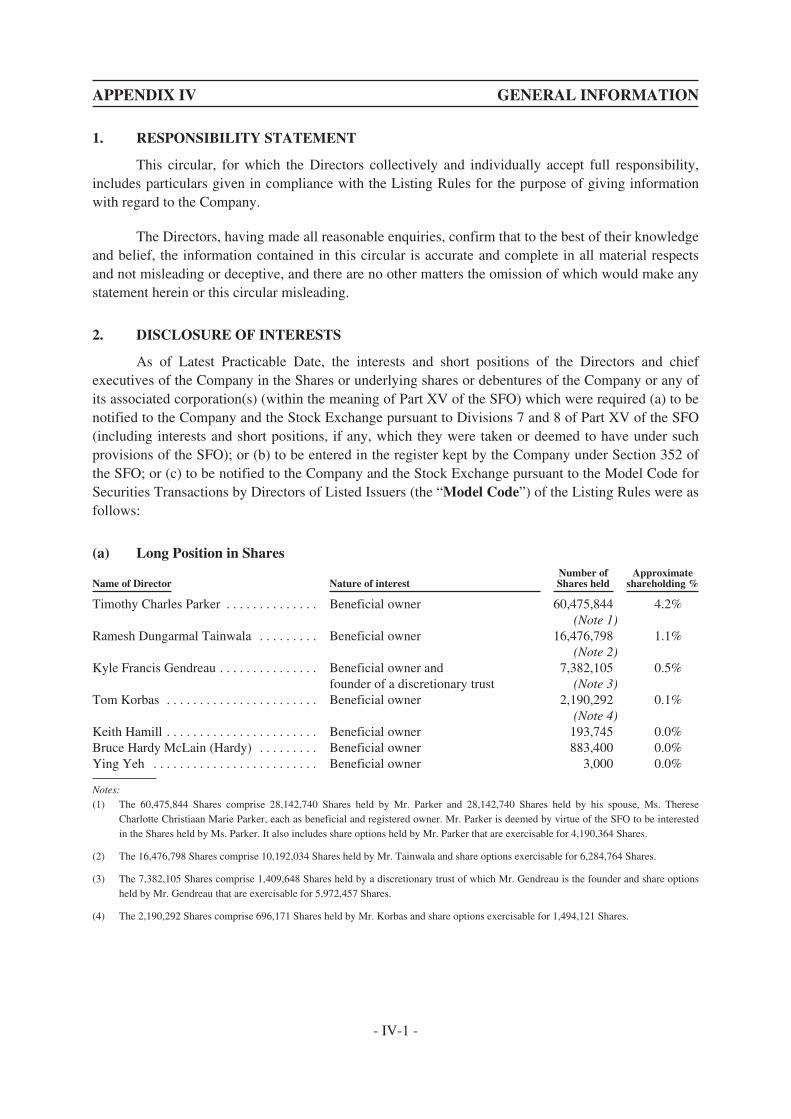
1. RESPONSIBILITY STATEMENT
This circular, for which the Directors collectively and individually accept full responsibility,includes particulars given in compliance with the Listing Rules for the purpose of giving informationwith regard to the Company.
The Directors, having made all reasonable enquiries, confirm that to the best of their knowledgeand belief, the information contained in this circular is accurate and complete in all material respectsand not misleading or deceptive, and there are no other matters the omission of which would make anystatement herein or this circular misleading.
2. DISCLOSURE OF INTERESTS
As of Latest Practicable Date, the interests and short positions of the Directors and chiefexecutives of the Company in the Shares or underlying shares or debentures of the Company or any ofits associated corporation(s) (within the meaning of Part XV of the SFO) which were required (a) to benotified to the Company and the Stock Exchange pursuant to Divisions 7 and 8 of Part XV of the SFO(including interests and short positions, if any, which they were taken or deemed to have under suchprovisions of the SFO); or (b) to be entered in the register kept by the Company under Section 352 ofthe SFO; or (c) to be notified to the Company and the Stock Exchange pursuant to the Model Code forSecurities Transactions by Directors of Listed Issuers (the “Model Code”) of the Listing Rules were asfollows:
(a) Long Position in Shares
Name of Director Nature of interestNumber ofShares held
Approximateshareholding %
Timothy Charles Parker . . . . . . . . . . . . . . Beneficial owner 60,475,844(Note 1)
4.2%
Ramesh Dungarmal Tainwala . . . . . . . . . Beneficial owner 16,476,798(Note 2)
1.1%
Kyle Francis Gendreau . . . . . . . . . . . . . . . Beneficial owner andfounder of a discretionary trust
7,382,105(Note 3)
0.5%
Tom Korbas . . . . . . . . . . . . . . . . . . . . . . . Beneficial owner 2,190,292(Note 4)
0.1%
Keith Hamill . . . . . . . . . . . . . . . . . . . . . . . Beneficial owner 193,745 0.0%Bruce Hardy McLain (Hardy) . . . . . . . . . Beneficial owner 883,400 0.0%Ying Yeh . . . . . . . . . . . . . . . . . . . . . . . . . Beneficial owner 3,000 0.0%
Notes:(1) The 60,475,844 Shares comprise 28,142,740 Shares held by Mr. Parker and 28,142,740 Shares held by his spouse, Ms. Therese
Charlotte Christiaan Marie Parker, each as beneficial and registered owner. Mr. Parker is deemed by virtue of the SFO to be interestedin the Shares held by Ms. Parker. It also includes share options held by Mr. Parker that are exercisable for 4,190,364 Shares.
(2) The 16,476,798 Shares comprise 10,192,034 Shares held by Mr. Tainwala and share options exercisable for 6,284,764 Shares.
(3) The 7,382,105 Shares comprise 1,409,648 Shares held by a discretionary trust of which Mr. Gendreau is the founder and share optionsheld by Mr. Gendreau that are exercisable for 5,972,457 Shares.
(4) The 2,190,292 Shares comprise 696,171 Shares held by Mr. Korbas and share options exercisable for 1,494,121 Shares.
- IV-1 -
APPENDIX IV GENERAL INFORMATION
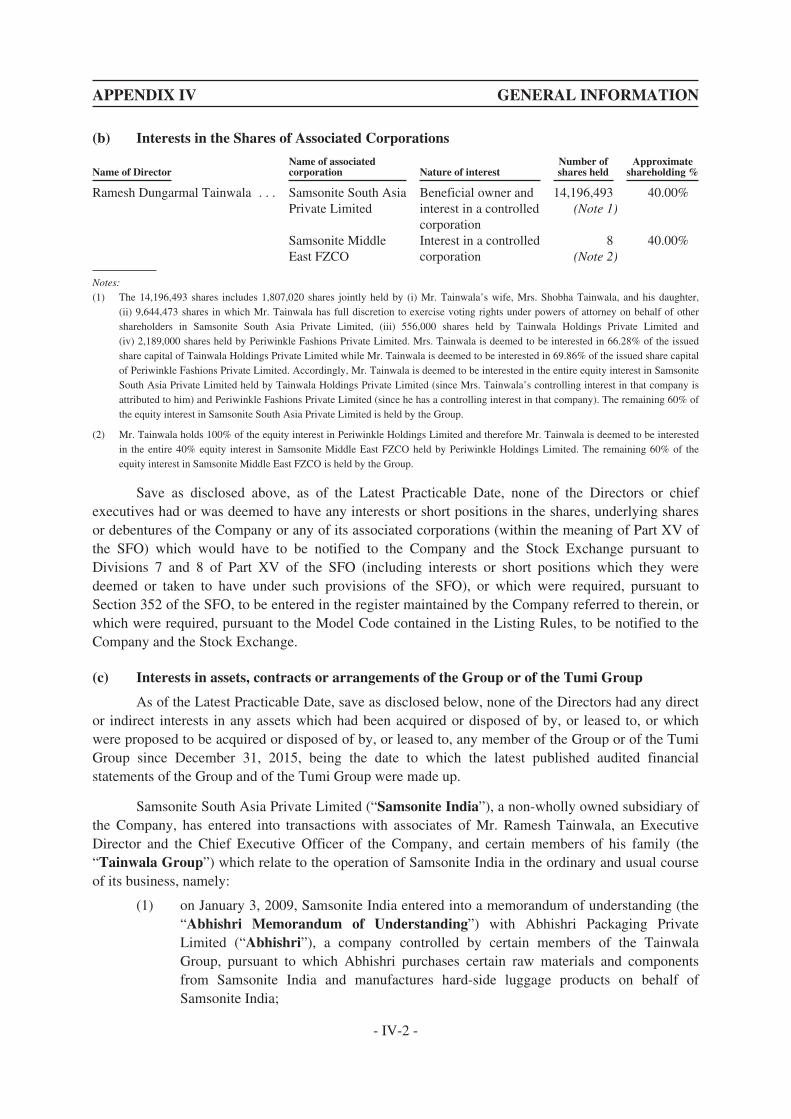
(b) Interests in the Shares of Associated Corporations
Name of DirectorName of associatedcorporation Nature of interest
Number ofshares held
Approximateshareholding %
Ramesh Dungarmal Tainwala . . . Samsonite South AsiaPrivate Limited
Beneficial owner andinterest in a controlledcorporation
14,196,493(Note 1)
40.00%
Samsonite MiddleEast FZCO
Interest in a controlledcorporation
8(Note 2)
40.00%
Notes:(1) The 14,196,493 shares includes 1,807,020 shares jointly held by (i) Mr. Tainwala’s wife, Mrs. Shobha Tainwala, and his daughter,
(ii) 9,644,473 shares in which Mr. Tainwala has full discretion to exercise voting rights under powers of attorney on behalf of othershareholders in Samsonite South Asia Private Limited, (iii) 556,000 shares held by Tainwala Holdings Private Limited and(iv) 2,189,000 shares held by Periwinkle Fashions Private Limited. Mrs. Tainwala is deemed to be interested in 66.28% of the issuedshare capital of Tainwala Holdings Private Limited while Mr. Tainwala is deemed to be interested in 69.86% of the issued share capitalof Periwinkle Fashions Private Limited. Accordingly, Mr. Tainwala is deemed to be interested in the entire equity interest in SamsoniteSouth Asia Private Limited held by Tainwala Holdings Private Limited (since Mrs. Tainwala’s controlling interest in that company isattributed to him) and Periwinkle Fashions Private Limited (since he has a controlling interest in that company). The remaining 60% ofthe equity interest in Samsonite South Asia Private Limited is held by the Group.
(2) Mr. Tainwala holds 100% of the equity interest in Periwinkle Holdings Limited and therefore Mr. Tainwala is deemed to be interestedin the entire 40% equity interest in Samsonite Middle East FZCO held by Periwinkle Holdings Limited. The remaining 60% of theequity interest in Samsonite Middle East FZCO is held by the Group.
Save as disclosed above, as of the Latest Practicable Date, none of the Directors or chiefexecutives had or was deemed to have any interests or short positions in the shares, underlying sharesor debentures of the Company or any of its associated corporations (within the meaning of Part XV ofthe SFO) which would have to be notified to the Company and the Stock Exchange pursuant toDivisions 7 and 8 of Part XV of the SFO (including interests or short positions which they weredeemed or taken to have under such provisions of the SFO), or which were required, pursuant toSection 352 of the SFO, to be entered in the register maintained by the Company referred to therein, orwhich were required, pursuant to the Model Code contained in the Listing Rules, to be notified to theCompany and the Stock Exchange.
(c) Interests in assets, contracts or arrangements of the Group or of the Tumi Group
As of the Latest Practicable Date, save as disclosed below, none of the Directors had any director indirect interests in any assets which had been acquired or disposed of by, or leased to, or whichwere proposed to be acquired or disposed of by, or leased to, any member of the Group or of the TumiGroup since December 31, 2015, being the date to which the latest published audited financialstatements of the Group and of the Tumi Group were made up.
Samsonite South Asia Private Limited (“Samsonite India”), a non-wholly owned subsidiary ofthe Company, has entered into transactions with associates of Mr. Ramesh Tainwala, an ExecutiveDirector and the Chief Executive Officer of the Company, and certain members of his family (the“Tainwala Group”) which relate to the operation of Samsonite India in the ordinary and usual courseof its business, namely:
(1) on January 3, 2009, Samsonite India entered into a memorandum of understanding (the“Abhishri Memorandum of Understanding”) with Abhishri Packaging PrivateLimited (“Abhishri”), a company controlled by certain members of the TainwalaGroup, pursuant to which Abhishri purchases certain raw materials and componentsfrom Samsonite India and manufactures hard-side luggage products on behalf ofSamsonite India;
- IV-2 -
APPENDIX IV GENERAL INFORMATION
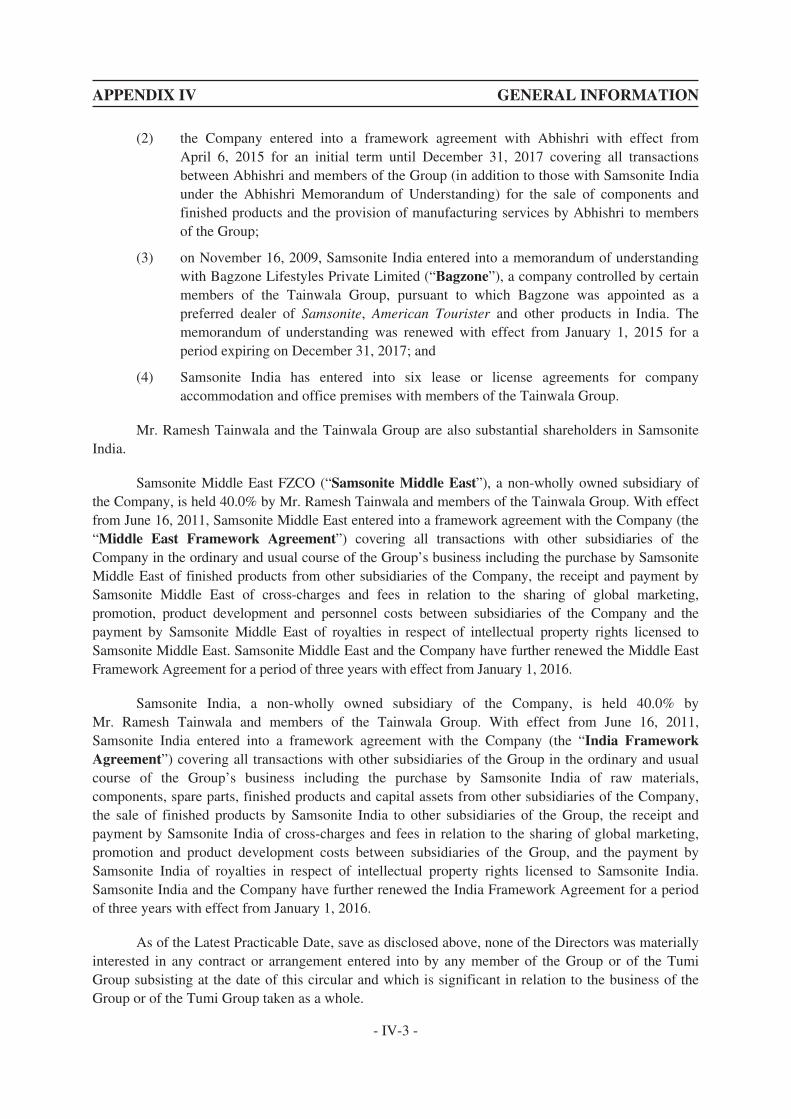
(2) the Company entered into a framework agreement with Abhishri with effect fromApril 6, 2015 for an initial term until December 31, 2017 covering all transactionsbetween Abhishri and members of the Group (in addition to those with Samsonite Indiaunder the Abhishri Memorandum of Understanding) for the sale of components andfinished products and the provision of manufacturing services by Abhishri to membersof the Group;
(3) on November 16, 2009, Samsonite India entered into a memorandum of understandingwith Bagzone Lifestyles Private Limited (“Bagzone”), a company controlled by certainmembers of the Tainwala Group, pursuant to which Bagzone was appointed as apreferred dealer of Samsonite, American Tourister and other products in India. Thememorandum of understanding was renewed with effect from January 1, 2015 for aperiod expiring on December 31, 2017; and
(4) Samsonite India has entered into six lease or license agreements for companyaccommodation and office premises with members of the Tainwala Group.
Mr. Ramesh Tainwala and the Tainwala Group are also substantial shareholders in SamsoniteIndia.
Samsonite Middle East FZCO (“Samsonite Middle East”), a non-wholly owned subsidiary ofthe Company, is held 40.0% by Mr. Ramesh Tainwala and members of the Tainwala Group. With effectfrom June 16, 2011, Samsonite Middle East entered into a framework agreement with the Company (the“Middle East Framework Agreement”) covering all transactions with other subsidiaries of theCompany in the ordinary and usual course of the Group’s business including the purchase by SamsoniteMiddle East of finished products from other subsidiaries of the Company, the receipt and payment bySamsonite Middle East of cross-charges and fees in relation to the sharing of global marketing,promotion, product development and personnel costs between subsidiaries of the Company and thepayment by Samsonite Middle East of royalties in respect of intellectual property rights licensed toSamsonite Middle East. Samsonite Middle East and the Company have further renewed the Middle EastFramework Agreement for a period of three years with effect from January 1, 2016.
Samsonite India, a non-wholly owned subsidiary of the Company, is held 40.0% byMr. Ramesh Tainwala and members of the Tainwala Group. With effect from June 16, 2011,Samsonite India entered into a framework agreement with the Company (the “India FrameworkAgreement”) covering all transactions with other subsidiaries of the Group in the ordinary and usualcourse of the Group’s business including the purchase by Samsonite India of raw materials,components, spare parts, finished products and capital assets from other subsidiaries of the Company,the sale of finished products by Samsonite India to other subsidiaries of the Group, the receipt andpayment by Samsonite India of cross-charges and fees in relation to the sharing of global marketing,promotion and product development costs between subsidiaries of the Group, and the payment bySamsonite India of royalties in respect of intellectual property rights licensed to Samsonite India.Samsonite India and the Company have further renewed the India Framework Agreement for a periodof three years with effect from January 1, 2016.
As of the Latest Practicable Date, save as disclosed above, none of the Directors was materiallyinterested in any contract or arrangement entered into by any member of the Group or of the TumiGroup subsisting at the date of this circular and which is significant in relation to the business of theGroup or of the Tumi Group taken as a whole.
- IV-3 -
APPENDIX IV GENERAL INFORMATION
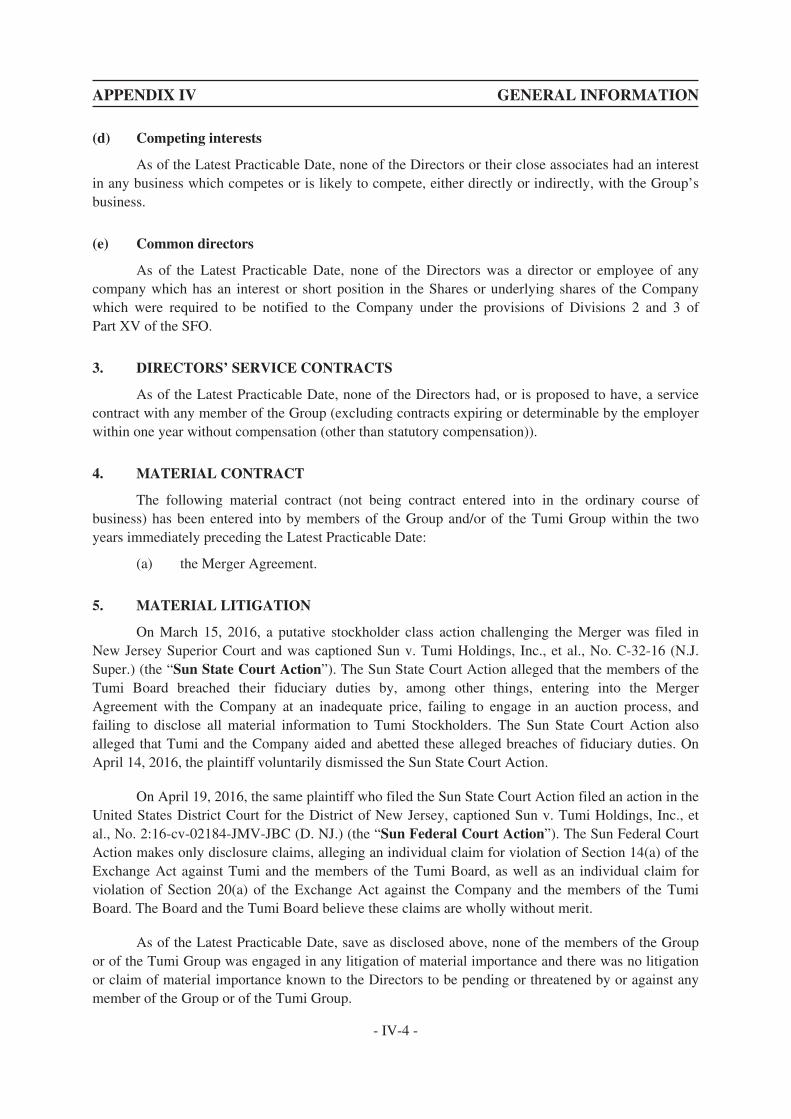
(d) Competing interests
As of the Latest Practicable Date, none of the Directors or their close associates had an interestin any business which competes or is likely to compete, either directly or indirectly, with the Group’sbusiness.
(e) Common directors
As of the Latest Practicable Date, none of the Directors was a director or employee of anycompany which has an interest or short position in the Shares or underlying shares of the Companywhich were required to be notified to the Company under the provisions of Divisions 2 and 3 ofPart XV of the SFO.
3. DIRECTORS’ SERVICE CONTRACTS
As of the Latest Practicable Date, none of the Directors had, or is proposed to have, a servicecontract with any member of the Group (excluding contracts expiring or determinable by the employerwithin one year without compensation (other than statutory compensation)).
4. MATERIAL CONTRACT
The following material contract (not being contract entered into in the ordinary course ofbusiness) has been entered into by members of the Group and/or of the Tumi Group within the twoyears immediately preceding the Latest Practicable Date:
(a) the Merger Agreement.
5. MATERIAL LITIGATION
On March 15, 2016, a putative stockholder class action challenging the Merger was filed inNew Jersey Superior Court and was captioned Sun v. Tumi Holdings, Inc., et al., No. C-32-16 (N.J.Super.) (the “Sun State Court Action”). The Sun State Court Action alleged that the members of theTumi Board breached their fiduciary duties by, among other things, entering into the MergerAgreement with the Company at an inadequate price, failing to engage in an auction process, andfailing to disclose all material information to Tumi Stockholders. The Sun State Court Action alsoalleged that Tumi and the Company aided and abetted these alleged breaches of fiduciary duties. OnApril 14, 2016, the plaintiff voluntarily dismissed the Sun State Court Action.
On April 19, 2016, the same plaintiff who filed the Sun State Court Action filed an action in theUnited States District Court for the District of New Jersey, captioned Sun v. Tumi Holdings, Inc., etal., No. 2:16-cv-02184-JMV-JBC (D. NJ.) (the “Sun Federal Court Action”). The Sun Federal CourtAction makes only disclosure claims, alleging an individual claim for violation of Section 14(a) of theExchange Act against Tumi and the members of the Tumi Board, as well as an individual claim forviolation of Section 20(a) of the Exchange Act against the Company and the members of the TumiBoard. The Board and the Tumi Board believe these claims are wholly without merit.
As of the Latest Practicable Date, save as disclosed above, none of the members of the Groupor of the Tumi Group was engaged in any litigation of material importance and there was no litigationor claim of material importance known to the Directors to be pending or threatened by or against anymember of the Group or of the Tumi Group.
- IV-4 -
APPENDIX IV GENERAL INFORMATION
6. EXPERTS
(a) Qualification of experts
The following are the names and qualification of the experts who have given advice which arecontained in this circular:
Name QualificationKPMG LLP Independent Registered Public Accounting FirmGrant Thornton LLP Independent Registered Public Accounting FirmDeloitte & Touche LLP Independent Registered Public Accounting FirmDeloitte Touche Tohmatsu Certified Public Accountants
(b) Interests of experts
As of the Latest Practicable Date, none of KPMG LLP, Grant Thornton LLP, Deloitte &Touche LLP or Deloitte Touche Tohmatsu was interested in any securities of any member of the Groupor any right (whether legally enforceable or not) to subscribe for or to nominate persons to subscribefor any securities in any member of the Group, and none of KPMG LLP, Grant Thornton LLP,Deloitte & Touche LLP or Deloitte Touche Tohmatsu had any direct or indirect interest in any assetswhich had been, since December 31, 2015 (being the date to which the latest published auditedconsolidated financial statements of the Group and the Tumi Group were made up), acquired ordisposed of by, or leased to, or were proposed to be acquired or disposed of by, or leased to, anymember of the Group or of the Tumi Group.
7. CONSENTS
Each of KPMG LLP, Grant Thornton LLP, Deloitte & Touche LLP and Deloitte ToucheTohmatsu has given and has not withdrawn its written consent to the issue of this circular with itsreport and/or letter and/or references to its name included herein in the form and context in which theyare respectively included in this circular.
8. MISCELLANEOUS
(a) The registered office of the Company is situated at 13-15 Avenue de la Liberté, L-1931Luxembourg and the principal place of business of the Company in Hong Kong is situated at25/F, Tower 2, The Gateway, Harbour City, 25 Canton Road, Tsimshatsui, Kowloon,Hong Kong.
(b) The Company’s branch share registrar in Hong Kong is Computershare Hong Kong InvestorServices Limited, Shops 1712-1716, 17/F, Hopewell Centre, 183 Queen’s Road East, WanChai, Hong Kong.
(c) The Company’s principal share registrar in Luxembourg is Intertrust (Luxembourg) S.à r.l., 6,rue Eugéne Ruppert, L-2453 Luxembourg.
(d) The joint company secretaries of the Company are Mr. John Bayard Livingston and Ms. ChowYuk Yin Ivy. Mr. Livingston is a qualified lawyer in the United States. Ms. Chow Yuk Yin Ivyis a Fellow Member of both the Hong Kong Institute of Chartered Secretaries and the Instituteof Chartered Secretaries and Administrators as well as an Ordinary Member of the Hong KongSecurities and Investment Institute.
- IV-5 -
APPENDIX IV GENERAL INFORMATION
(e) The English text of this circular shall prevail over the Chinese text in the event of anyinconsistency.
9. DOCUMENTS AVAILABLE FOR INSPECTION
Copies of the following documents will be available for inspection at the Company’s registeredoffice at 13–15 Avenue de la Liberté, L-1931 Luxembourg and at the office of Freshfields BruckhausDeringer at 11th Floor, Two Exchange Square, Hong Kong on any weekday, except Saturdays,Sundays and public holidays, during the period of 14 days from the date of this circular:
(a) the Articles of Incorporation;
(b) the letter from the Board, the text of which is set out in “Letter from the Board”;
(c) the annual reports of the Company for each of the financial years ended December 31,2013, 2014 and 2015;
(d) the audited financial information of the Tumi Group for each of the financial yearsended December 31, 2013, 2014 and 2015 and the unaudited financial information ofthe Tumi Group for the three months ended March 27, 2016 prepared under U.S. GAAPas set out in Appendix II to this circular;
(e) the unaudited adjusted consolidated income statements and consolidated statements ofcomprehensive income and the unaudited adjusted consolidated statements of financialposition of Tumi under the Company’s accounting policies as set out in Appendix II tothis circular;
(f) the report from KPMG LLP in relation to the unaudited pro forma financial informationof the Enlarged Group as set out in Appendix III to this circular;
(g) the material contract of the Group referred to in “– Material Contract” above;
(h) the written consents referred to in “– Consents” above; and
(i) this circular.
- IV-6 -
APPENDIX IV GENERAL INFORMATION
NOTICE OF GENERAL MEETING
SAMSONITE INTERNATIONAL S.A.
13–15 Avenue de la Liberté, L-1931 LuxembourgR.C.S. LUXEMBOURG: B 159.469
(Incorporated in Luxembourg with limited liability)(Stock code: 1910)
NOTICE OF GENERAL MEETING
Notice is hereby given that a general meeting of the shareholders (the “General Meeting”) ofSamsonite International S.A. (the “Company”) will be held at 13–15 Avenue de la Liberté, L-1931Luxembourg and by video conference at 5/F, Hutchison House, 10 Harcourt Road, Central, HongKong on Tuesday, July 26, 2016 at 11:00 a.m. (CET)/5:00 p.m. (Hong Kong time) for the purposes ofconsidering and, if thought fit, passing (with or without amendments) the following resolution as anordinary resolution:
ORDINARY RESOLUTION
“THAT
(a) the agreement and plan of merger (the “Merger Agreement”) dated as of March 3, 2016 enteredinto between the Company, PTL Acquisition Inc. (“PTL Acquisition”) and Tumi Holdings, Inc.(“Tumi”) in relation to the merger of PTL Acquisition with and into Tumi, with Tumi survivingthe merger as an indirect wholly-owned subsidiary of the Company, and the transactionscontemplated thereunder including the merger, the debt financing as well as the guarantees andsecurity to be granted in that respect (as further described in the circular dispatched by theCompany on June 28, 2016), be and are hereby approved, ratified and confirmed; and
(b) the directors of the Company, acting collectively and individually, be and are hereby authorized,for and on behalf of the Company, to do all such acts and things and to sign, execute, seal (whererequired) and deliver all such documents and to take all such steps as the directors of theCompany in their discretion may consider necessary, appropriate, desirable or expedient for thepurposes of giving effect to or in connection with the Merger Agreement and the transactionscontemplated thereunder.”
By Order of the BoardSAMSONITE INTERNATIONAL S.A.
Timothy Charles ParkerChairman
Hong Kong, June 28, 2016
- N-1 -
NOTICE OF GENERAL MEETING
Notes:1. The resolution at the General Meeting will be taken by poll pursuant to the Rules Governing the Listing of Securities on The Stock
Exchange of Hong Kong Limited (the “Listing Rules”) and the results of the poll will be published on the websites of Hong KongExchanges and Clearing Limited and the Company in accordance with the Listing Rules.
2. Any shareholder of the Company entitled to attend and vote at the General Meeting is entitled to appoint a proxy to attend and voteinstead of him. A proxy need not be a shareholder of the Company. If more than one proxy is so appointed, the appointment shall specifythe number of Shares in respect of which each such proxy is so appointed.
3. Any shareholder of the Company whose ownership is either recorded through the Central Clearing and Settlement System (“CCASS”) ormaintained with a licensed securities dealer (i.e. not directly recorded in his own name in the register of members of the Company) shallonly be entitled to vote by providing its instructions to vote to HKSCC Nominees Limited either directly as a CCASS Participant orthrough its licensed securities dealer and the relevant financial intermediaries. In order to attend and vote at the General Meeting, anysuch shareholder shall be appointed by HKSCC Nominees Limited as its proxy to attend and vote instead of him.
4. In order to be valid, the form of proxy must be deposited at the Company’s branch share registrar in Hong Kong, ComputershareHong Kong Investor Services Limited, at 17M Floor, Hopewell Centre, 183 Queen’s Road East, Wanchai, Hong Kong or to theCompany’s registered office at 13–15 Avenue de la Liberté, L-1931 Luxembourg not less than 48 hours before the time appointed for theholding of the General Meeting or any adjournment thereof. Delivery of the form of proxy shall not preclude a shareholder of theCompany from attending and voting in person at the meeting and, in such event, the instrument appointing a proxy shall be deemed to berevoked.
5. For determining the entitlement to attend and vote at the General Meeting, the register of members of the Company will be closed fromFriday, July 22, 2016 to Tuesday, July 26, 2016, both dates inclusive, during which period no transfer of shares will be registered. Inorder to be eligible to attend and vote at the General Meeting, all transfer documents accompanied by the relevant share certificates mustbe lodged with the Company’s registered office at 13–15 Avenue de la Liberté, L-1931 Luxembourg or with the Company’s branchshare registrar in Hong Kong, Computershare Hong Kong Investor Services Limited, at Shops 1712–1717 17th Floor, Hopewell Centre,183 Queen’s Road East, Wanchai, Hong Kong for registration not later than 4:30 p.m. on Thursday, July 21, 2016.
6. If a black rainstorm warning or a tropical cyclone warning signal number 8 or above is hoisted at or after 12 noon on July 26, 2016, theabove meeting will not be held in Hong Kong on July 26, 2016 but will continue to be held at the Company’s registered office inLuxembourg at 13–15 Avenue de la Liberté, L-1931 Luxembourg.
- N-2 -