Embed Size (px)
Citation preview
284502 \ (Samsonite_Luxembourg) \ 19/04/2016 \ M38 / Size (210x297)
Samsonite International S.A.13–15 Avenue de la Liberté, L-1931 Luxembourg
R.C.S. Luxembourg: B159.469(Incorporated under the laws of Luxembourg with limited liability)
Consolidated financial statements for the year ended December 31, 2015
284502 \ (Samsonite_Luxembourg) \ 19/04/2016 \ M38 / Size (210x297)
— 1 —
Directors’ Report
Principal Activities
Samsonite International S.A. (the “Company”), together with its consolidated subsidiaries (the “Group”), is the world’s largest travel luggage company, with a heritage dating back more than 100 years. The Group is principally engaged in the design, manufacture, sourcing and distribution of luggage, business and computer bags, outdoor and casual bags, travel accessories and slim protective cases for personal electronic devices throughout the world, primarily under the Samsonite®, American Tourister®, Hartmann®, High Sierra®, Gregory®, Speck® and Lipault® brand names as well as other owned and licensed brand names. The Group’s core brand, Samsonite, is one of the most well-known travel luggage brands in the world.
The Group sells its products through a variety of wholesale distribution channels, through its company-operated retail stores and through e-commerce. Its principal wholesale distribution customers are department and specialty retail stores, mass merchants, catalog showrooms and warehouse clubs. The Group sells its products in Asia, North America, Europe and Latin America. As of December 31, 2015, the Group’s products were sold in over 100 countries.
1. Review of the financial year 2015
Net Sales
The following table sets forth a breakdown of net sales by region for the years ended December 31, 2015 and December 31, 2014, both in absolute terms and as a percentage of total net sales.
Year ended December 31,
2015 2014 2015 vs 2014
US$’000Percentage of
net sales US$’000Percentage of
net sales
Percentage increase
(decrease)
Percentage increase
(decrease) excl. foreign
currency effects(2)
Net sales by region(1): Asia 947,602 39.0% 892,258 38.0% 6.2 % 12.8 % North America 811,304 33.4% 761,310 32.4% 6.6 % 7.4 % Europe 544,740 22.4% 557,934 23.7% (2.4)% 17.7 % Latin America 120,476 5.0% 130,606 5.6% (7.8)% 8.6 %Corporate 8,355 0.2% 8,599 0.3% (2.8)% (2.8)%
Net sales 2,432,477 100.0% 2,350,707 100.0% 3.5% 11.9%
Notes(1) The geographic location of the Group’s net sales reflects the country from which its products were sold and does not necessarily
indicate the country in which its end consumers were actually located.(2) Results stated on a constant currency basis are calculated by applying the average exchange rate of the previous year to current
year local currency results.
Excluding foreign currency effects, net sales increased by US$280.0 million, or 11.9%, for the year ended December 31, 2015 compared to the year ended December 31, 2014. US Dollar reported net sales increased by US$81.8 million, or 3.5%, to US$2,432.5 million for the year ended December 31, 2015, reflecting the impact of foreign currency translation from the strengthening US Dollar during the year.
284502 \ (Samsonite_Luxembourg) \ 19/04/2016 \ M38 / Size (210x297)
— 2 —
Directors’ Report
Brands
The following table sets forth a breakdown of net sales by brand for the years ended December 31, 2015 and December 31, 2014, both in absolute terms and as a percentage of total net sales.
Year ended December 31,
2015 2014 2015 vs 2014
US$’000Percentage of
net sales US$’000Percentage of
net sales
Percentage increase
(decrease)
Percentage increase
(decrease) excl. foreign
currency effects(2)
Net sales by brand: Samsonite 1,490,470 61.3% 1,535,708 65.3% (2.9)% 5.7 % American Tourister 549,269 22.6% 504,222 21.4% 8.9 % 16.7 % Speck 117,719 4.8% 91,565 3.9% nm nm High Sierra 85,300 3.5% 89,239 3.8% (4.4)% (1.5)% Gregory 34,338 1.4% 12,613 0.5% nm nm Hartmann 21,340 0.9% 16,947 0.7% 25.9 % 30.9 % Lipault 13,788 0.6% 5,524 0.2% nm nm Other(1) 120,253 4.9% 94,889 4.2% 26.7 % 45.1 %
Net sales 2,432,477 100.0% 2,350,707 100.0% 3.5 % 11.9 %
Notes(1) Other includes certain other brands owned by the Group, such as Saxoline and Xtrem, as well as third party brands sold through
Rolling Luggage and Chic Accent retail stores.(2) Results stated on a constant currency basis are calculated by applying the average exchange rate of the previous year to current
year local currency results.nm Not meaningful due to acquisitions of Lipault on April 1, 2014, Speck on May 28, 2014 and Gregory on July 23, 2014.
Excluding foreign currency effects, net sales of the Samsonite brand increased by US$88.2 million, or 5.7%, for the year ended December 31, 2015 compared to the previous year. US Dollar reported net sales of the Samsonite brand decreased by US$45.2 million, or 2.9%, due to the strengthening of the US Dollar. Samsonite comprised 61.3% of the net sales of the Group during 2015 compared to 65.3% in 2014 reflecting the strength of American Tourister sales growth and the continued diversification of the Group’s brand portfolio with contributions from acquired brands. Excluding foreign currency effects, net sales of the American Tourister brand increased by US$84.1 million, or 16.7%, for the year ended December 31, 2015 compared to the previous year. US Dollar reported net sales of the American Tourister brand increased by US$45.0 million, or 8.9%. Europe accounted for US$21.9 million, or 48.6%, and Asia accounted for US$12.7 million, or 28.1%, of the US$45.0 million increase in American Tourister brand sales. The increase in American Tourister net sales was attributable to an expanded product offering and further penetration of existing markets, which were supported by the Group’s targeted advertising activities.
284502 \ (Samsonite_Luxembourg) \ 19/04/2016 \ M38 / Size (210x297)
— 3 —
Directors’ Report
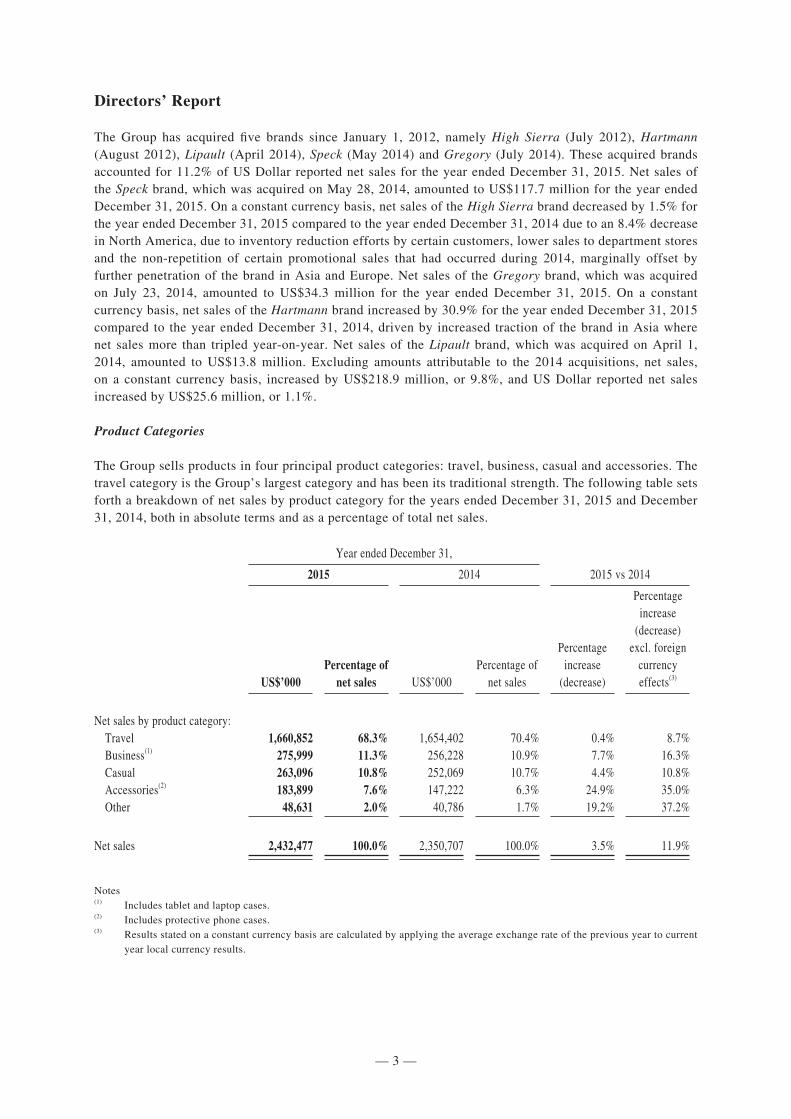
The Group has acquired five brands since January 1, 2012, namely High Sierra (July 2012), Hartmann (August 2012), Lipault (April 2014), Speck (May 2014) and Gregory (July 2014). These acquired brands accounted for 11.2% of US Dollar reported net sales for the year ended December 31, 2015. Net sales of the Speck brand, which was acquired on May 28, 2014, amounted to US$117.7 million for the year ended December 31, 2015. On a constant currency basis, net sales of the High Sierra brand decreased by 1.5% for the year ended December 31, 2015 compared to the year ended December 31, 2014 due to an 8.4% decrease in North America, due to inventory reduction efforts by certain customers, lower sales to department stores and the non-repetition of certain promotional sales that had occurred during 2014, marginally offset by further penetration of the brand in Asia and Europe. Net sales of the Gregory brand, which was acquired on July 23, 2014, amounted to US$34.3 million for the year ended December 31, 2015. On a constant currency basis, net sales of the Hartmann brand increased by 30.9% for the year ended December 31, 2015 compared to the year ended December 31, 2014, driven by increased traction of the brand in Asia where net sales more than tripled year-on-year. Net sales of the Lipault brand, which was acquired on April 1, 2014, amounted to US$13.8 million. Excluding amounts attributable to the 2014 acquisitions, net sales, on a constant currency basis, increased by US$218.9 million, or 9.8%, and US Dollar reported net sales increased by US$25.6 million, or 1.1%.
Product Categories
The Group sells products in four principal product categories: travel, business, casual and accessories. The travel category is the Group’s largest category and has been its traditional strength. The following table sets forth a breakdown of net sales by product category for the years ended December 31, 2015 and December 31, 2014, both in absolute terms and as a percentage of total net sales.
Year ended December 31,
2015 2014 2015 vs 2014
US$’000Percentage of
net sales US$’000Percentage of
net sales
Percentage increase
(decrease)
Percentage increase
(decrease) excl. foreign
currency effects(3)
Net sales by product category: Travel 1,660,852 68.3% 1,654,402 70.4% 0.4% 8.7% Business(1) 275,999 11.3% 256,228 10.9% 7.7% 16.3% Casual 263,096 10.8% 252,069 10.7% 4.4% 10.8% Accessories(2) 183,899 7.6% 147,222 6.3% 24.9% 35.0% Other 48,631 2.0% 40,786 1.7% 19.2% 37.2%
Net sales 2,432,477 100.0% 2,350,707 100.0% 3.5% 11.9%
Notes(1) Includes tablet and laptop cases.(2) Includes protective phone cases.(3) Results stated on a constant currency basis are calculated by applying the average exchange rate of the previous year to current
year local currency results.
284502 \ (Samsonite_Luxembourg) \ 19/04/2016 \ M38 / Size (210x297)
— 4 —
Directors’ Report
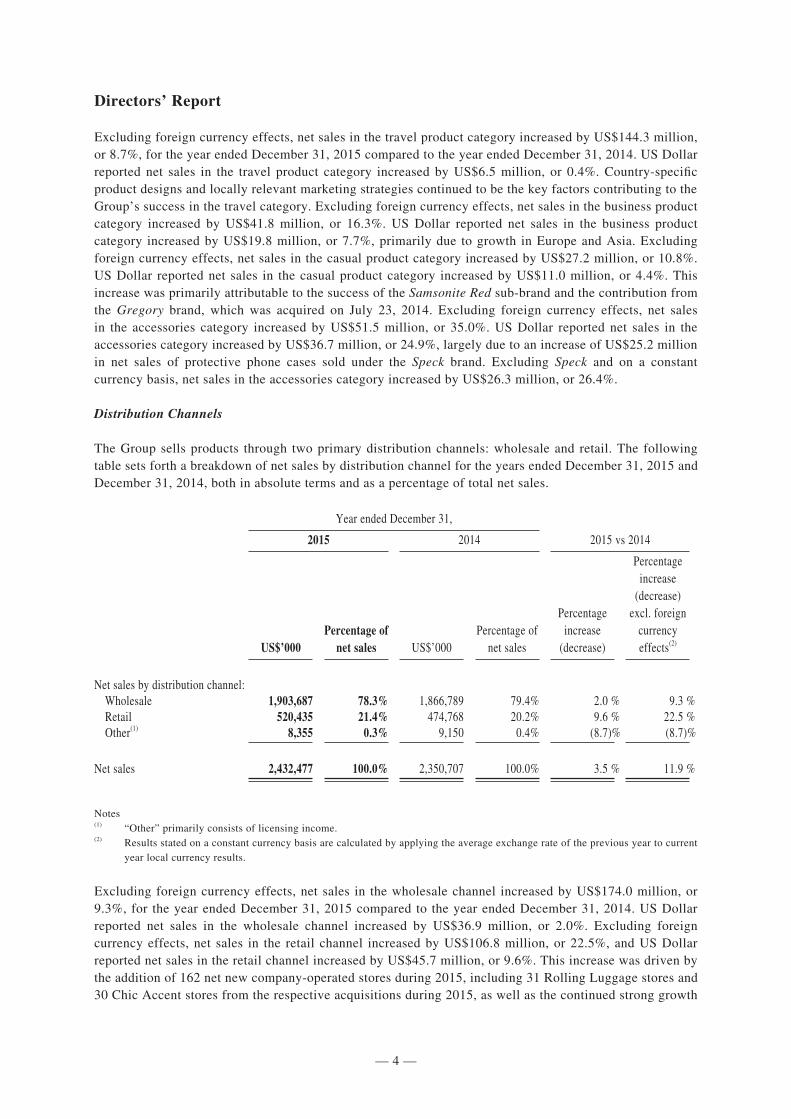
Excluding foreign currency effects, net sales in the travel product category increased by US$144.3 million, or 8.7%, for the year ended December 31, 2015 compared to the year ended December 31, 2014. US Dollar reported net sales in the travel product category increased by US$6.5 million, or 0.4%. Country-specific product designs and locally relevant marketing strategies continued to be the key factors contributing to the Group’s success in the travel category. Excluding foreign currency effects, net sales in the business product category increased by US$41.8 million, or 16.3%. US Dollar reported net sales in the business product category increased by US$19.8 million, or 7.7%, primarily due to growth in Europe and Asia. Excluding foreign currency effects, net sales in the casual product category increased by US$27.2 million, or 10.8%. US Dollar reported net sales in the casual product category increased by US$11.0 million, or 4.4%. This increase was primarily attributable to the success of the Samsonite Red sub-brand and the contribution from the Gregory brand, which was acquired on July 23, 2014. Excluding foreign currency effects, net sales in the accessories category increased by US$51.5 million, or 35.0%. US Dollar reported net sales in the accessories category increased by US$36.7 million, or 24.9%, largely due to an increase of US$25.2 million in net sales of protective phone cases sold under the Speck brand. Excluding Speck and on a constant currency basis, net sales in the accessories category increased by US$26.3 million, or 26.4%.
Distribution Channels
The Group sells products through two primary distribution channels: wholesale and retail. The following table sets forth a breakdown of net sales by distribution channel for the years ended December 31, 2015 and December 31, 2014, both in absolute terms and as a percentage of total net sales.
Year ended December 31,
2015 2014 2015 vs 2014
US$’000Percentage of
net sales US$’000Percentage of
net sales
Percentage increase
(decrease)
Percentage increase
(decrease) excl. foreign
currency effects(2)
Net sales by distribution channel: Wholesale 1,903,687 78.3% 1,866,789 79.4% 2.0 % 9.3 % Retail 520,435 21.4% 474,768 20.2% 9.6 % 22.5 % Other(1) 8,355 0.3% 9,150 0.4% (8.7)% (8.7)%
Net sales 2,432,477 100.0% 2,350,707 100.0% 3.5 % 11.9 %
Notes(1) “Other” primarily consists of licensing income.(2) Results stated on a constant currency basis are calculated by applying the average exchange rate of the previous year to current
year local currency results.
Excluding foreign currency effects, net sales in the wholesale channel increased by US$174.0 million, or 9.3%, for the year ended December 31, 2015 compared to the year ended December 31, 2014. US Dollar reported net sales in the wholesale channel increased by US$36.9 million, or 2.0%. Excluding foreign currency effects, net sales in the retail channel increased by US$106.8 million, or 22.5%, and US Dollar reported net sales in the retail channel increased by US$45.7 million, or 9.6%. This increase was driven by the addition of 162 net new company-operated stores during 2015, including 31 Rolling Luggage stores and 30 Chic Accent stores from the respective acquisitions during 2015, as well as the continued strong growth
284502 \ (Samsonite_Luxembourg) \ 19/04/2016 \ M38 / Size (210x297)
— 5 —
Directors’ Report
of the Group’s direct-to-consumer e-commerce business. On a same store, constant currency basis, net sales in the retail channel decreased by 0.7% year-on-year. This was driven in part by a 6.5% decline in Asia as a result of fewer visitors from Mainland China to Hong Kong (including Macau), the Middle East Respiratory Syndrome (“MERS”) outbreak in South Korea and generally weak consumer sentiment in some other Asian countries. In addition, there was a 6.0% decline in North America primarily due to the impact of the strong US Dollar on foreign travelers to gateway tourist markets. These factors were partially offset by growth of 8.3% and 2.6% in Europe and Latin America, respectively. The Group’s same store analysis includes existing company-operated retail stores which have been open for at least 12 months before the end of the relevant financial period. The 22.5% constant currency net sales growth in the retail channel reflects the Group’s strategy of investing resources, including through acquisitions such as Rolling Luggage and Chic Accent, to support the growth of its retail business.
During the year ended December 31, 2015, approximately US$205.8 million, or 8.5%, of the Group’s US Dollar reported net sales were derived from e-commerce (comprising the Group’s direct-to-consumer e-commerce business, which is included within the retail channel, and net sales to e-retailers, which are included within the wholesale channel). This represents an increase of 32.5% compared to the year ended December 31, 2014, when e-commerce comprised approximately US$155.3 million, or 6.6%, of the Group’s net sales. Excluding foreign currency effects, net sales to e-retailers increased by US$41.4 million, or 48.1%, for the year ended December 31, 2015 compared to the year ended December 31, 2014. US Dollar reported net sales to e-retailers increased by US$34.8 million, or 40.4%. Excluding foreign currency effects, net sales in the Group’s direct-to-consumer e-commerce business increased by US$21.3 million, or30.8%, for the year ended December 31, 2015 compared to the year ended December 31, 2014. US Dollar reported net sales in the direct-to-consumer e-commerce business increased by US$15.7 million, or 22.6%.
Regions
Asia
Excluding foreign currency effects, the Group’s net sales in Asia increased by US$113.9 million, or 12.8%, for the year ended December 31, 2015 compared to the year ended December 31, 2014. US Dollar reported net sales for the region increased by US$55.3 million, or 6.2%. Excluding net sales attributable to the Gregory and Lipault brands in Asia, which were acquired during 2014, net sales increased by US$97.9 million, or 11.1%, on a constant currency basis for the year ended December 31, 2015 compared to the year ended December 31, 2014.
On a constant currency basis, net sales of the Samsonite brand increased by US$46.3 million, or 9.6%, from the previous year, driven by the success of the business-to-business and e-commerce channels in China, as well as the Samsonite Red sub-brand, whose net sales increased by US$13.8 million, or 23.8%, on a constant currency basis. Excluding the Samsonite Red sub-brand, net sales of the Samsonite brand increased by US$32.5 million, or 7.7%, on a constant currency basis. Excluding foreign currency effects, net sales of the American Tourister brand in the Asia region increased by US$34.6 million, or 9.0%, for the year ended December 31, 2015 compared to the year ended December 31, 2014. Net sales of the High Sierra brand amounted to US$13.8 million in Asia during the year ended December 31, 2015, an increase of 28.4% from the previous year on a constant currency basis. The Group introduced the Hartmann brand in Asia during 2014, and this contributed US$5.4 million of the net sales growth during the year ended December 31, 2015. Net sales of the Gregory brand in Asia amounted to US$18.5 million during the year ended December 31, 2015 as the Group developed products designed specifically for the tastes and preferences of consumers within the region. The Group introduced Kamiliant, a value-conscious entry level brand, in Asia during the second half of 2014, which contributed US$2.8 million of net sales during the year ended December 31, 2015.
284502 \ (Samsonite_Luxembourg) \ 19/04/2016 \ M38 / Size (210x297)
— 6 —
Directors’ Report
Excluding foreign currency effects, net sales in the travel product category increased by US$66.5 million, or 10.4%, and US Dollar reported net sales increased by US$24.8 million, or 3.9%, for the year ended December 31, 2015 compared to the previous year. Net sales in the casual product category increased by US$20.1 million, or 18.0%, on a constant currency basis, and US Dollar reported net sales increased by US$13.0 million, or 11.7%, driven largely by the success of the Samsonite Red sub-brand and the acquisition of the Gregory brand in 2014, as well as by growth in sales of the High Sierra brand. Excluding foreign currency effects, net sales in the business product category increased by US$18.2 million, or 16.7%, and US Dollar reported net sales increased by US$10.9 million, or 10.1%, for the year ended December 31, 2015 compared to the previous year. Net sales in the accessories product category increased by US$2.1 million, or 8.4%, on a constant currency basis, and US Dollar reported net sales increased by US$0.6 million, or 2.5%, compared to the previous year.
Excluding foreign currency effects, net sales in the wholesale channel increased by US$89.1 million, or 11.8%, and US Dollar reported net sales increased by US$41.0 million, or 5.4%, for the year ended December 31, 2015 compared to the previous year, bolstered by strong growth in business-to-business sales. Net sales in the retail channel increased by US$24.8 million, or 17.7%, on a constant currency basis year-on-year. US Dollar reported net sales in the retail channel increased by US$14.4 million, or 10.3%, driven by the addition of 39 net new stores opened during 2015 and strong growth in the Group’s direct-to-consumer e-commerce net sales, partially offset by a decrease in same store net sales. Direct-to-consumer e-commerce sales in the region increased year-on-year by 48.5%, on a constant currency basis, as the Group focused on expanding its presence online. On a same store, constant currency basis, net sales in the retail channel decreased by 6.5% due to fewer visitors from Mainland China shopping in Hong Kong (including Macau), the MERS outbreak in South Korea and generally weak retail sentiment in certain other countries within the region.
Along with additional product offerings, the success of the Group’s business in Asia has been bolstered by its continued focus on country-specific products and marketing strategies to drive increased awareness of and demand for the Group’s products. On a constant currency basis, net sales growth in Asia for the year ended December 31, 2015 continued to be driven by the success of the Samsonite and American Tourister brands as well as the acquisition of the Gregory brand in July 2014. On a constant currency basis, net sales increased in all countries in the Asian region for the year ended December 31, 2015 compared to the previous year, except for Malaysia and Indonesia, which decreased by 11.3% and 1.0%, respectively, due to general economic conditions. Japan experienced strong constant currency growth of 37.7% year-on-year driven by increased sales of the Samsonite brand and the acquisition of the Gregory brand in July 2014. Excluding net sales attributable to the Gregory brand, net sales in Japan increased by 26.7% on a constant currency basis. Excluding foreign currency effects, net sales in China increased by 13.0%, driven by sales of the Samsonite brand and the Samsonite Red sub-brand, although growth in China decelerated in the second half due to some temporary pressures related to changes in channel preferences, such as department stores losing share to e-commerce, as well as uncertainties in the country’s short-term economic outlook. Net sales in South Korea continued to grow, with an increase of 4.5% on a constant currency basis, despite the negative impact from the MERS outbreak. On a constant currency basis, net sales in India increased by 12.0% for the year ended December 31, 2015 compared to the previous year, driven by the American Tourister brand. On a constant currency basis, net sales in Hong Kong (including Macau) increased by 3.1% including the contribution from the Gregory brand. Excluding net sales attributable to the Gregory brand, net sales in Hong Kong (including Macau) decreased by 1.5% on a constant currency basis due to lower tourist arrivals from Mainland China. Australia had strong constant currency net sales growth of 39.4%, driven by the Samsonite and American Tourister brands. The Group also entered the retail channel in Australia with the acquisition of Rolling Luggage during 2015. The Group continued to penetrate the emerging markets within the region with notable year-on-year constant currency net sales growth in the Philippines and Thailand of 31.9% and 8.6%, respectively.
284502 \ (Samsonite_Luxembourg) \ 19/04/2016 \ M38 / Size (210x297)
— 7 —
Directors’ Report
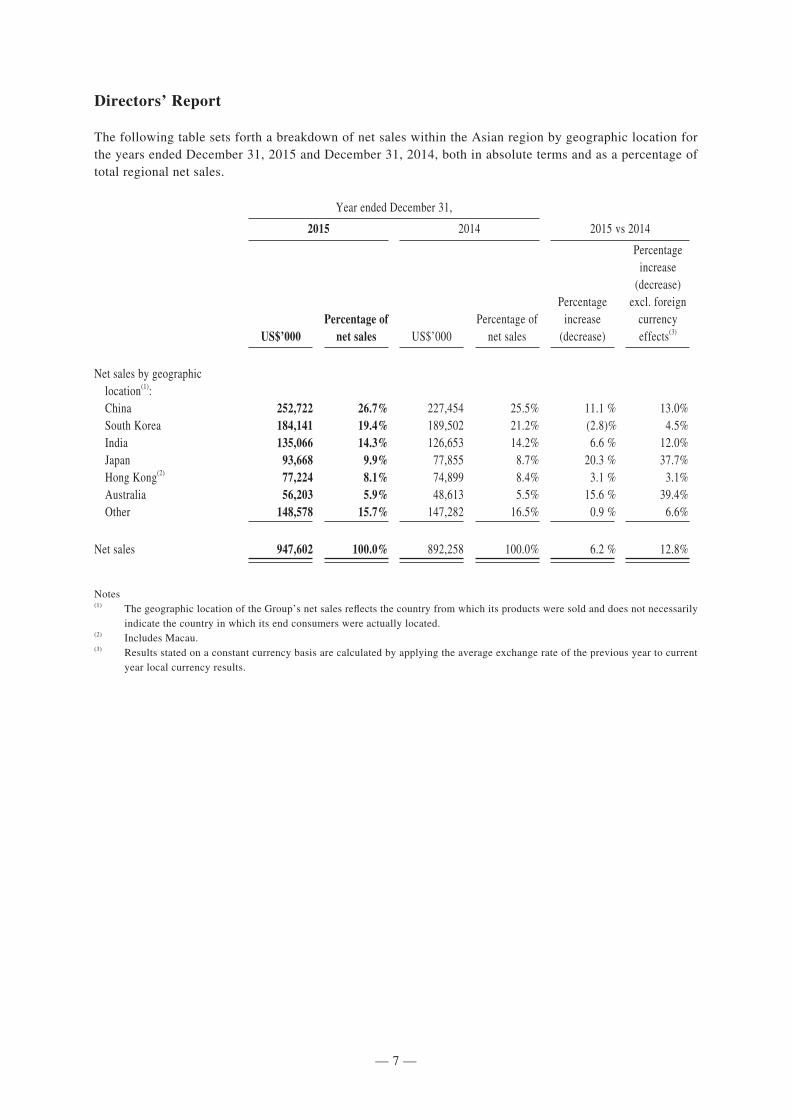
The following table sets forth a breakdown of net sales within the Asian region by geographic location for the years ended December 31, 2015 and December 31, 2014, both in absolute terms and as a percentage of total regional net sales.
Year ended December 31,
2015 2014 2015 vs 2014
US$’000Percentage of
net sales US$’000Percentage of
net sales
Percentage increase
(decrease)
Percentage increase
(decrease) excl. foreign
currency effects(3)
Net sales by geographic location(1): China 252,722 26.7% 227,454 25.5% 11.1 % 13.0% South Korea 184,141 19.4% 189,502 21.2% (2.8)% 4.5% India 135,066 14.3% 126,653 14.2% 6.6 % 12.0% Japan 93,668 9.9% 77,855 8.7% 20.3 % 37.7% Hong Kong(2) 77,224 8.1% 74,899 8.4% 3.1 % 3.1% Australia 56,203 5.9% 48,613 5.5% 15.6 % 39.4% Other 148,578 15.7% 147,282 16.5% 0.9 % 6.6%
Net sales 947,602 100.0% 892,258 100.0% 6.2 % 12.8%
Notes(1) The geographic location of the Group’s net sales reflects the country from which its products were sold and does not necessarily
indicate the country in which its end consumers were actually located.(2) Includes Macau.(3) Results stated on a constant currency basis are calculated by applying the average exchange rate of the previous year to current
year local currency results.

284502 \ (Samsonite_Luxembourg) \ 19/04/2016 \ M38 / Size (210x297)
— 8 —
Directors’ Report
North America
Excluding foreign currency effects, the Group’s net sales in North America increased by US$56.6 million, or 7.4%, for the year ended December 31, 2015 compared to the year ended December 31, 2014. US Dollar reported net sales for the North American region increased by US$50.0 million, or 6.6%. Excluding net sales attributable to the Speck and Gregory brands, which were acquired during 2014, net sales increased by US$22.5 million, or 3.4%, on a constant currency basis and US Dollar reported net sales increased by US$15.9 million, or 2.4%.
Excluding foreign currency effects, net sales of the Samsonite brand increased by US$17.1 million, or 3.4%, and US Dollar reported net sales increased by US$11.4 million, or 2.3%, for the year ended December 31, 2015 compared to the prior year. Net sales of the American Tourister brand increased by US$12.6 million, or 18.3%, on a constant currency basis, while US Dollar reported net sales increased by US$12.0 million, or 17.5%, driven by point-of-sale expansion. Excluding foreign currency effects, net sales of the High Sierra brand decreased by US$6.2 million, or 8.4%, and US Dollar reported net sales decreased by US$6.5 million, or 8.9%, due to inventory reduction efforts by certain customers, lower sales to department stores and the non-repetition of certain promotional sales that had occurred during 2014. US Dollar reported net sales of the Hartmann brand amounted to US$14.4 million, a constant currency decrease of 5.6%, as the Group continued its efforts to redefine the product assortment and increase brand awareness. The Speck and Gregory brands contributed US$117.7 million and US$13.3 million, respectively, in US Dollar reported net sales for the year.
Excluding foreign currency effects, net sales in the travel product category increased by US$26.7 million, or 5.2%, and US Dollar reported net sales increased by US$21.1 million, or 4.1%, for the year ended December 31, 2015 compared to the year ended December 31, 2014. Net sales in the casual product category increased by US$0.4 million, or 0.4%, on a constant currency basis and US Dollar reported net sales were relatively consistent year-on-year. Excluding foreign currency effects, net sales in the business product category increased by US$3.4 million, or 3.9%, and US Dollar reported net sales increased by US$3.0 million, or 3.5%, year-on-year, due to expanded product offerings and an additional US$1.0 million in net sales of Speck protective laptop and tablet cases. Net sales in the accessories category increased by US$25.6 million, or 38.6%, on a constant currency basis and US Dollar reported net sales increased by US$25.3 million, or 38.2%, primarily due to an additional US$25.2 million in net sales of Speck protective phone cases from the previous year.
Excluding foreign currency effects, net sales in the wholesale channel increased by US$53.3 million, or 8.7%, and US Dollar reported net sales increased by US$48.0 million, or 7.9%, for the year ended December 31, 2015 compared to the year ended December 31, 2014. Excluding contributions from the acquisitions completed in 2014 and foreign currency effects, net sales in the wholesale channel increased by 4.1%. Net sales in the retail channel increased by US$3.4 million, or 2.2%, on a constant currency basis and US Dollar reported net sales increased by US$2.0 million, or 1.3%, year-on-year. Net sales growth in the retail channel was driven by sales made through the Group’s e-commerce website, which increased by 18.3% on a constant currency basis year-on-year, as well as by the addition of 16 net new stores opened during 2015. On a same store, constant currency basis, net sales in the retail channel decreased by 6.0% due to the negative impact that the strengthening US Dollar had on foreign tourist arrivals to gateway markets in the United States, as well as the impact of the inclement winter weather during the first quarter of 2015.
The overall increase in net sales in North America was due to the Group’s continued focus on marketing and selling regionally developed products, as well as the acquisitions made during 2014. The focus on regional product development enabled the Group to bring to market products that are designed to appeal to the tastes and preferences of North American consumers, resulting in strong consumer demand. Excluding foreign currency effects, net sales in Canada increased by 19.3% where the Group’s wholesale business continued to thrive with increased sales of the Samsonite brand.
284502 \ (Samsonite_Luxembourg) \ 19/04/2016 \ M38 / Size (210x297)
— 9 —
Directors’ Report
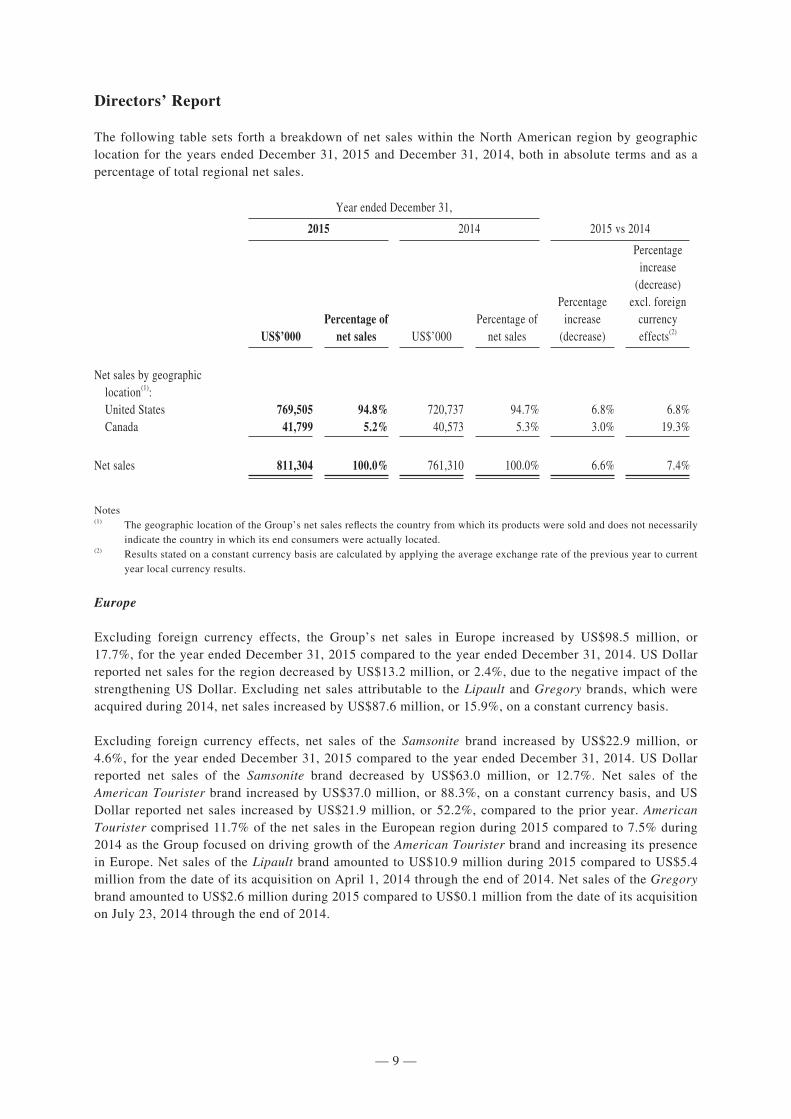
The following table sets forth a breakdown of net sales within the North American region by geographic location for the years ended December 31, 2015 and December 31, 2014, both in absolute terms and as a percentage of total regional net sales.
Year ended December 31,
2015 2014 2015 vs 2014
US$’000Percentage of
net sales US$’000Percentage of
net sales
Percentage increase
(decrease)
Percentage increase
(decrease) excl. foreign
currency effects(2)
Net sales by geographic location(1): United States 769,505 94.8% 720,737 94.7% 6.8% 6.8% Canada 41,799 5.2% 40,573 5.3% 3.0% 19.3%
Net sales 811,304 100.0% 761,310 100.0% 6.6% 7.4%
Notes(1) The geographic location of the Group’s net sales reflects the country from which its products were sold and does not necessarily
indicate the country in which its end consumers were actually located.(2) Results stated on a constant currency basis are calculated by applying the average exchange rate of the previous year to current
year local currency results.
Europe
Excluding foreign currency effects, the Group’s net sales in Europe increased by US$98.5 million, or 17.7%, for the year ended December 31, 2015 compared to the year ended December 31, 2014. US Dollar reported net sales for the region decreased by US$13.2 million, or 2.4%, due to the negative impact of the strengthening US Dollar. Excluding net sales attributable to the Lipault and Gregory brands, which were acquired during 2014, net sales increased by US$87.6 million, or 15.9%, on a constant currency basis.
Excluding foreign currency effects, net sales of the Samsonite brand increased by US$22.9 million, or 4.6%, for the year ended December 31, 2015 compared to the year ended December 31, 2014. US Dollar reported net sales of the Samsonite brand decreased by US$63.0 million, or 12.7%. Net sales of the American Tourister brand increased by US$37.0 million, or 88.3%, on a constant currency basis, and US Dollar reported net sales increased by US$21.9 million, or 52.2%, compared to the prior year. American Tourister comprised 11.7% of the net sales in the European region during 2015 compared to 7.5% during 2014 as the Group focused on driving growth of the American Tourister brand and increasing its presence in Europe. Net sales of the Lipault brand amounted to US$10.9 million during 2015 compared to US$5.4 million from the date of its acquisition on April 1, 2014 through the end of 2014. Net sales of the Gregory brand amounted to US$2.6 million during 2015 compared to US$0.1 million from the date of its acquisition on July 23, 2014 through the end of 2014.
284502 \ (Samsonite_Luxembourg) \ 19/04/2016 \ M38 / Size (210x297)
— 10 —
Directors’ Report
Excluding foreign currency effects, net sales in the travel product category increased by US$47.5 million, or 10.9%, and US Dollar reported net sales decreased by US$32.7 million, or 7.5%, for the year ended December 31, 2015 compared to the year ended December 31, 2014. Excluding foreign currency effects, net sales in the casual product category increased by US$4.2 million, or 26.6%, year-on-year, mainly attributable to the contributions from the Gregory and High Sierra brands. Successful new business product introductions under the Samsonite brand drove net sales in the business product category to increase by US$19.6 million, or 39.0%, on a constant currency basis, while US Dollar reported net sales increased by US$7.1 million, or 14.1%.
Excluding foreign currency effects, net sales in the wholesale channel increased by US$27.6 million, or 6.7%, for the year ended December 31, 2015 compared to the previous year, and US Dollar reported net sales decreased by US$41.6 million, or 10.1%, year-on-year. Net sales in the retail channel increased by US$71.5 million, or 48.9%, on a constant currency basis, and US Dollar reported net sales increased by US$29.0 million, or 19.8%, over the same period. The increase was driven by the addition of 79 net new stores opened during 2015, including 21 Rolling Luggage stores and 30 Chic Accent stores. On a same store, constant currency basis, net sales in the retail channel increased by 8.3%. Direct-to-consumer e-commerce sales in the region increased year-on-year by 24.3% on a constant currency basis.
Germany, the Group’s leading market in Europe representing 14.7% of total US Dollar reported net sales in the region, achieved 17.4% constant currency sales growth during the year ended December 31, 2015 compared to the prior year. The United Kingdom posted strong constant currency net sales growth of 41.5% over the previous year, including the results from the acquisition of Rolling Luggage in February 2015. The Group’s business in Italy continued to improve with constant currency net sales growth of 18.9% over the previous year, including the results from the acquisition of Chic Accent on September 30, 2015. Net sales in France increased by 8.7% on a constant currency basis, including the contribution from the Lipault brand. Excluding net sales attributable to the Lipault brand, net sales in France increased by 4.4% on a constant currency basis. The Group continued to penetrate the emerging markets of Turkey and South Africa with year-on-year constant currency net sales growth of 39.7% and 29.2%, respectively. The Group’s business in Russia was negatively impacted by the economic downturn in the country and the devaluation of the Russian Ruble, but still generated constant currency net sales growth of 9.0% year-on-year. On June 26, 2015, the Group acquired the 40% non-controlling interest in its Russian subsidiary.
284502 \ (Samsonite_Luxembourg) \ 19/04/2016 \ M38 / Size (210x297)
— 11 —
Directors’ Report
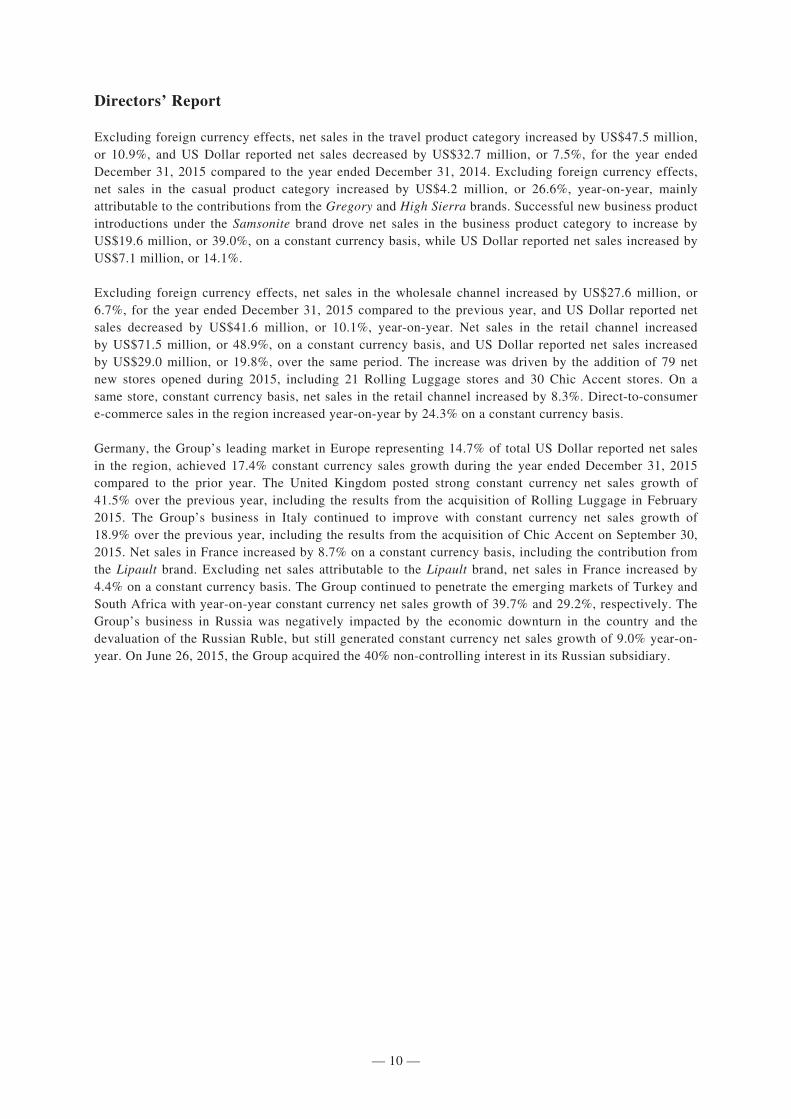
The following table sets forth a breakdown of net sales within the European region by geographic location for the years ended December 31, 2015 and December 31, 2014, both in absolute terms and as a percentage of total regional net sales.
Year ended December 31,
2015 2014 2015 vs 2014
US$’000Percentage of
net sales US$’000Percentage of
net sales
Percentage increase
(decrease)
Percentage increase
(decrease) excl. foreign
currency effects(3)
Net sales by geographic location(1): Germany 80,252 14.7% 81,847 14.7% (1.9)% 17.4% France 68,393 12.6% 75,473 13.5% (9.4)% 8.7% Belgium(2) 64,411 11.8% 65,239 11.7% (1.3)% 18.6% Italy 60,614 11.1% 60,799 10.9% (0.3)% 18.9% United Kingdom 59,774 11.0% 45,684 8.2% 30.8 % 41.5% Spain 41,055 7.5% 44,812 8.0% (8.4)% 9.6% Russia 27,085 5.0% 40,037 7.2% (32.4)% 9.0% Other 143,156 26.3% 144,043 25.8% (0.6)% 18.9%
Net sales 544,740 100.0% 557,934 100.0% (2.4)% 17.7%
Notes(1) The geographic location of the Group’s net sales reflects the country from which its products were sold and does not necessarily
indicate the country in which its end consumers were actually located.(2) Net sales in Belgium were US$18.8 million and US$21.7 million for the years ended December 31, 2015 and December 31,
2014, respectively. Remaining sales consisted of direct shipments to distributors, customers and agents in other countries.(3) Results stated on a constant currency basis are calculated by applying the average exchange rate of the previous year to current
year local currency results.
Latin America
Excluding foreign currency effects, the Group’s net sales in Latin America increased by US$11.3 million, or 8.6%, for the year ended December 31, 2015 compared to the year ended December 31, 2014. US Dollar reported net sales for the region decreased by US$10.1 million, or 7.8%, as the Group was negatively impacted by the strengthening of the US Dollar.
Excluding foreign currency effects, net sales of the Samsonite brand increased by US$1.9 million, or 3.1%, and US Dollar reported net sales decreased by US$8.7 million, or 14.3%, for the year ended December 31, 2015 compared to the year ended December 31, 2014. Net sales of the American Tourister brand were relatively flat on a constant currency basis and US Dollar reported net sales decreased by 17.3% year-on-year. Sales of women’s handbags under the Secret brand name enjoyed continued success, with constant currency growth of 14.4% and US Dollar reported net sales of US$13.4 million in 2015. Excluding foreign currency effects, net sales of the local brands Saxoline and Xtrem increased by 12.9% and 21.1%, respectively.
Excluding foreign currency effects, net sales in the travel product category increased by US$3.6 million, or 6.0%, for the year ended December 31, 2015 compared to the prior year. US Dollar reported net sales decreased by US$6.8 million, or 11.3%. Net sales in the casual product category increased by US$2.6 million, or 7.8%, on a constant currency basis. US Dollar reported net sales decreased by US$2.3 million, or 7.0%. Excluding foreign currency effects, net sales in the business product category increased by 5.8% and US Dollar reported net sales decreased by US$1.3 million, or 10.3%.
284502 \ (Samsonite_Luxembourg) \ 19/04/2016 \ M38 / Size (210x297)
— 12 —
Directors’ Report
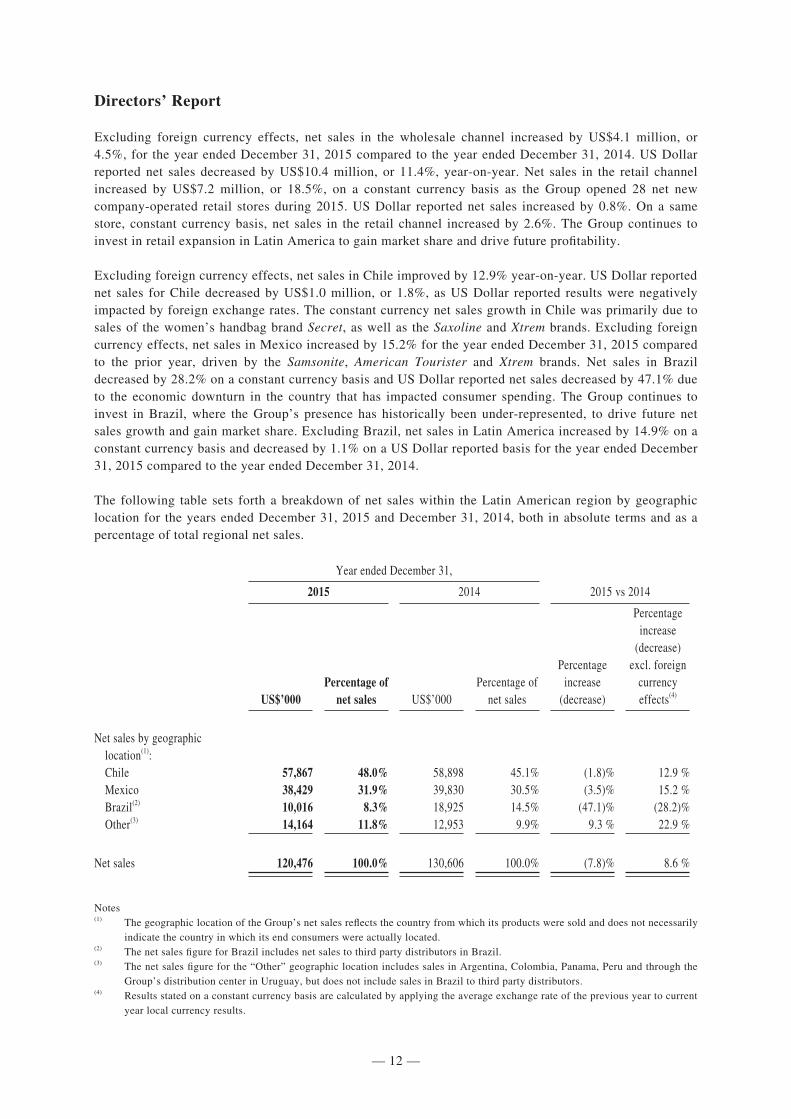
Excluding foreign currency effects, net sales in the wholesale channel increased by US$4.1 million, or 4.5%, for the year ended December 31, 2015 compared to the year ended December 31, 2014. US Dollar reported net sales decreased by US$10.4 million, or 11.4%, year-on-year. Net sales in the retail channel increased by US$7.2 million, or 18.5%, on a constant currency basis as the Group opened 28 net new company-operated retail stores during 2015. US Dollar reported net sales increased by 0.8%. On a same store, constant currency basis, net sales in the retail channel increased by 2.6%. The Group continues to invest in retail expansion in Latin America to gain market share and drive future profitability.
Excluding foreign currency effects, net sales in Chile improved by 12.9% year-on-year. US Dollar reported net sales for Chile decreased by US$1.0 million, or 1.8%, as US Dollar reported results were negatively impacted by foreign exchange rates. The constant currency net sales growth in Chile was primarily due to sales of the women’s handbag brand Secret, as well as the Saxoline and Xtrem brands. Excluding foreign currency effects, net sales in Mexico increased by 15.2% for the year ended December 31, 2015 compared to the prior year, driven by the Samsonite, American Tourister and Xtrem brands. Net sales in Brazil decreased by 28.2% on a constant currency basis and US Dollar reported net sales decreased by 47.1% due to the economic downturn in the country that has impacted consumer spending. The Group continues to invest in Brazil, where the Group’s presence has historically been under-represented, to drive future net sales growth and gain market share. Excluding Brazil, net sales in Latin America increased by 14.9% on a constant currency basis and decreased by 1.1% on a US Dollar reported basis for the year ended December 31, 2015 compared to the year ended December 31, 2014.
The following table sets forth a breakdown of net sales within the Latin American region by geographic location for the years ended December 31, 2015 and December 31, 2014, both in absolute terms and as a percentage of total regional net sales.
Year ended December 31,
2015 2014 2015 vs 2014
US$’000Percentage of
net sales US$’000Percentage of
net sales
Percentage increase
(decrease)
Percentage increase
(decrease) excl. foreign
currency effects(4)
Net sales by geographic location(1): Chile 57,867 48.0% 58,898 45.1% (1.8)% 12.9 % Mexico 38,429 31.9% 39,830 30.5% (3.5)% 15.2 % Brazil(2) 10,016 8.3% 18,925 14.5% (47.1)% (28.2)% Other(3) 14,164 11.8% 12,953 9.9% 9.3 % 22.9 %
Net sales 120,476 100.0% 130,606 100.0% (7.8)% 8.6 %
Notes(1) The geographic location of the Group’s net sales reflects the country from which its products were sold and does not necessarily
indicate the country in which its end consumers were actually located.(2) The net sales figure for Brazil includes net sales to third party distributors in Brazil.(3) The net sales figure for the “Other” geographic location includes sales in Argentina, Colombia, Panama, Peru and through the
Group’s distribution center in Uruguay, but does not include sales in Brazil to third party distributors.(4) Results stated on a constant currency basis are calculated by applying the average exchange rate of the previous year to current
year local currency results.
284502 \ (Samsonite_Luxembourg) \ 19/04/2016 \ M38 / Size (210x297)
— 13 —
Directors’ Report
Cost of Sales and Gross Profit
Cost of sales increased by US$46.6 million, or 4.2%, to US$1,153.5 million (representing 47.4% of net sales) for the year ended December 31, 2015 from US$1,106.9 million (representing 47.1% of net sales) for the year ended December 31, 2014.
Gross profit increased by US$35.1 million, or 2.8%, to US$1,279.0 million for the year ended December 31, 2015 from US$1,243.8 million for the year ended December 31, 2014. Gross profit margin decreased to 52.6% for the year ended December 31, 2015 from 52.9% for the year ended December 31, 2014.
The increase in cost of sales as a percentage of net sales in 2015 was attributable to several factors. The strengthening of the US Dollar has negatively impacted the cost of the Group’s product purchases in US Dollars that were then sold in local currency. In addition, gross profit margins have decreased due to the expansion of the American Tourister brand in Europe and business-to-business sales accounting for a greater proportion of the channel mix in Asia, both of which typically yield lower margins. These factors were marginally offset by reductions in commodity prices during the second half of 2015.
Distribution Expenses
Distribution expenses increased by US$39.5 million, or 6.3%, to US$665.8 million (representing 27.4% of net sales) for the year ended December 31, 2015 from US$626.3 million (representing 26.6% of net sales) for the year ended December 31, 2014. This increase was primarily due to the increase in sales volume in 2015. Distribution expenses as a percentage of net sales increased slightly year-on-year primarily due to increased costs from the Group’s retail expansion strategy, investment in the infrastructure of the Group’s business in Latin America, investment in the geographical expansion of the American Tourister brand and the integration of acquisitions.
Marketing Expenses
The Group spent US$132.1 million (representing 5.4% of net sales) on marketing during the year ended December 31, 2015 compared to US$144.7 million (representing 6.2% of net sales) for the year ended December 31, 2014, a decrease of US$12.7 million, or 8.8%. On a constant currency basis, marketing expenses were relatively in line with the previous year. The Group scaled back marketing spend during 2015 to help mitigate foreign currency pressures. Marketing expenses, as a percentage of net sales, was also impacted by increased sales of acquired brands and strong organic sales growth. The Group continued to employ targeted and focused advertising and promotional campaigns. The Group believes the success of its advertising campaigns is evident in its net sales growth, and remains committed to enhancing brand and product awareness and driving additional net sales growth through focused marketing activities.
General and Administrative Expenses
General and administrative expenses increased by US$3.3 million, or 2.2%, to US$154.5 million (representing 6.4% of net sales) for the year ended December 31, 2015 from US$151.1 million (representing 6.4% of net sales) for the year ended December 31, 2014. Although general and administrative expenses increased slightly in absolute terms, these expenses remained constant as a percentage of net sales as the Group maintained tight control of its fixed cost base and leveraged it against strong sales growth. Share-based compensation expense, a non-cash expense included in general and administrative expenses, amounted to US$15.2 million, an increase of US$4.2 million from the previous year due to the additional share options granted in 2015. Excluding share-based compensation expense, general and administrative expenses, as a percentage of net sales, decreased by 30 basis points compared to the previous year.
284502 \ (Samsonite_Luxembourg) \ 19/04/2016 \ M38 / Size (210x297)
— 14 —
Directors’ Report
Other Expenses
The Group incurred other expenses of US$17.8 million and US$22.4 million for the years ended December 31, 2015 and December 31, 2014, respectively. Other expenses for 2015 included acquisition-related costs of US$8.9 million, which were primarily comprised of costs associated with due diligence and integration activities, severance, and professional and legal fees associated with both the Rolling Luggage and Chic Accent acquisitions that were completed in 2015, as well as other contemplated acquisitions. Other expenses for 2014 included acquisition-related costs of US$13.5 million, which were primarily comprised of costs associated with due diligence and integration activities, severance, and professional and legal fees for the acquisitions of Lipault, Speck Products and Gregory that were completed during 2014.
Operating Profit
On a constant currency basis, the Group’s operating profit increased by US$27.9 million, or 9.3%, for the year ended December 31, 2015 compared to the year ended December 31, 2014. Excluding acquisition-related costs, the Group’s operating profit for the year ended December 31, 2015 increased by US$23.5 million, or 7.5%, on a constant currency basis, year-on-year. Further excluding share-based compensation expense, which increased by US$4.3 million year-on-year, operating profit for the year ended December 31, 2015 increased by US$27.8 million, or 8.6%, on a constant currency basis year-on-year. US Dollar reported operating profit of US$308.9 million for the year ended December 31, 2015 increased by US$9.6 million, or 3.2%, from US$299.3 million for the year ended December 31, 2014 due to the factors noted above.
Net Finance Costs
Net finance costs increased by US$0.9 million, or 5.4%, to US$17.8 million for the year ended December 31, 2015 from US$16.9 million for the year ended December 31, 2014. This increase was primarily attributable to a US$1.5 million increase in the expense recognized for the change in fair value of put options related to agreements with certain holders of non-controlling interests, marginally offset by a US$0.5 million decrease in interest expense due to lower debt levels during 2015. Foreign exchange losses were relatively flat year-on-year.
Profit before Income Tax
On a constant currency basis, profit before income tax increased by US$24.1 million, or 8.5%, to US$306.5 million for the year ended December 31, 2015 from US$282.4 million for the year ended December 31, 2014. US Dollar reported profit before income tax increased by US$8.7 million, or 3.1%, to US$291.1 million for the year ended December 31, 2015 from US$282.4 million for the year ended December 31, 2014 due to the factors noted above.
Income Tax Expense
On a constant currency basis, income tax expense increased by US$3.7 million, or 4.9%, to US$80.8 million for the year ended December 31, 2015 from US$77.0 million for the year ended December 31, 2014. US Dollar reported income tax expense decreased by US$3.0 million, or 3.9%, to US$74.0 million for the year ended December 31, 2015 from US$77.0 million for the year ended December 31, 2014.
284502 \ (Samsonite_Luxembourg) \ 19/04/2016 \ M38 / Size (210x297)
— 15 —
Directors’ Report
The Group’s consolidated effective tax rate for operations was 25.4% and 27.3% for the years ended December 31, 2015 and December 31, 2014, respectively. The effective tax rate is calculated using a weighted average income tax rate from those jurisdictions in which the Group is subject to tax, adjusted for permanent book/tax differences, tax incentives, changes in tax reserves and changes in unrecognized deferred tax assets. The decrease in the Group’s effective tax rate was primarily due to changes in profit mix among high and low tax jurisdictions and changes in certain tax reserves.
Profit for the Year
On a constant currency basis, profit for the year increased by US$20.4 million, or 9.9%, for the year ended December 31, 2015 compared to the year ended December 31, 2014. Excluding acquisition-related costs, the Group’s profit for the year, on a constant currency basis, increased by US$16.0 million, or 7.3%, year-on-year. Further excluding share-based compensation expense, which increased by US$4.3 million, profit for the year increased by US$20.3 million, or 8.8%, on a constant currency basis year-on-year. US Dollar reported profit for the year of US$217.0 million for the year ended December 31, 2015 increased by US$11.7 million, or 5.7%, from US$205.4 million for the previous year. Profit for the year was adversely impacted by the strengthening of the US Dollar, increased costs from the Group’s retail store expansion, slightly lower gross profit margin, the investment in the geographical expansion of the American Tourister brand in Europe and the investment in the Group’s business in Latin America. These adverse impacts were marginally offset by the Group reducing its advertising expenditures.
On a constant currency basis, profit attributable to the equity holders increased by US$19.9 million, or 10.7%, compared to the prior year. Excluding acquisition-related costs, the Group’s profit attributable to equity holders, on a constant currency basis, increased by US$15.5 million, or 7.8%, year-on-year. Further excluding share-based compensation expense, which increased by US$4.3 million on a constant currency basis year-on-year, profit attributable to equity holders increased by US$19.8 million, or 9.4%, on a constant currency basis. US Dollar reported profit attributable to the equity holders was US$197.6 million for the year ended December 31, 2015, an increase of US$11.4 million, or 6.1%, from US$186.3 million for the year ended December 31, 2014.
On a constant currency basis, Adjusted Net Income, a non-IFRS measure, increased by US$19.6 million, or 9.5%, for the year ended December 31, 2015 compared to the year ended December 31, 2014. Further excluding the share-based compensation expense noted above, Adjusted Net Income increased by US$23.9 million, or 11.0%, on a constant currency basis year-on-year. US Dollar reported Adjusted Net Income increased by US$10.7 million, or 5.2%, to US$216.9 million for the year ended December 31, 2015 from US$206.3 million for the year ended December 31, 2014. Adjusted Net Income was impacted by the factors noted above. See the reconciliation of profit for the year to Adjusted Net Income below for a detailed discussion of the Group’s results excluding certain non-recurring costs and charges and other non-cash charges that impacted US Dollar reported profit for the year.
Basic earnings per share (“Basic EPS”) and diluted earnings per share (“Diluted EPS”) increased by 6.1% to US$0.140 for the year ended December 31, 2015 from US$0.132 for the year ended December 31, 2014. The weighted average number of shares utilized in the Basic EPS calculation increased by 1.4 million shares from December 31, 2014 as a result of shares issued upon exercise of share options by certain participants in the Group’s Share Award Scheme. The weighted average number of shares utilized in the Basic EPS calculation increased by 625 thousand shares from December 31, 2013 as a result of shares issued upon exercise of share options by certain participants in the Group’s Share Award Scheme. The weighted average number of shares outstanding utilized in the Diluted EPS calculation increased by 2.8 million shares from December 31, 2014 as certain outstanding share options became dilutive during 2015. The weighted average number of shares outstanding utilized in the Diluted EPS calculation increased by 2.5 million shares from December 31, 2013 as certain outstanding share options became dilutive during 2014.
284502 \ (Samsonite_Luxembourg) \ 19/04/2016 \ M38 / Size (210x297)
— 16 —
Directors’ Report
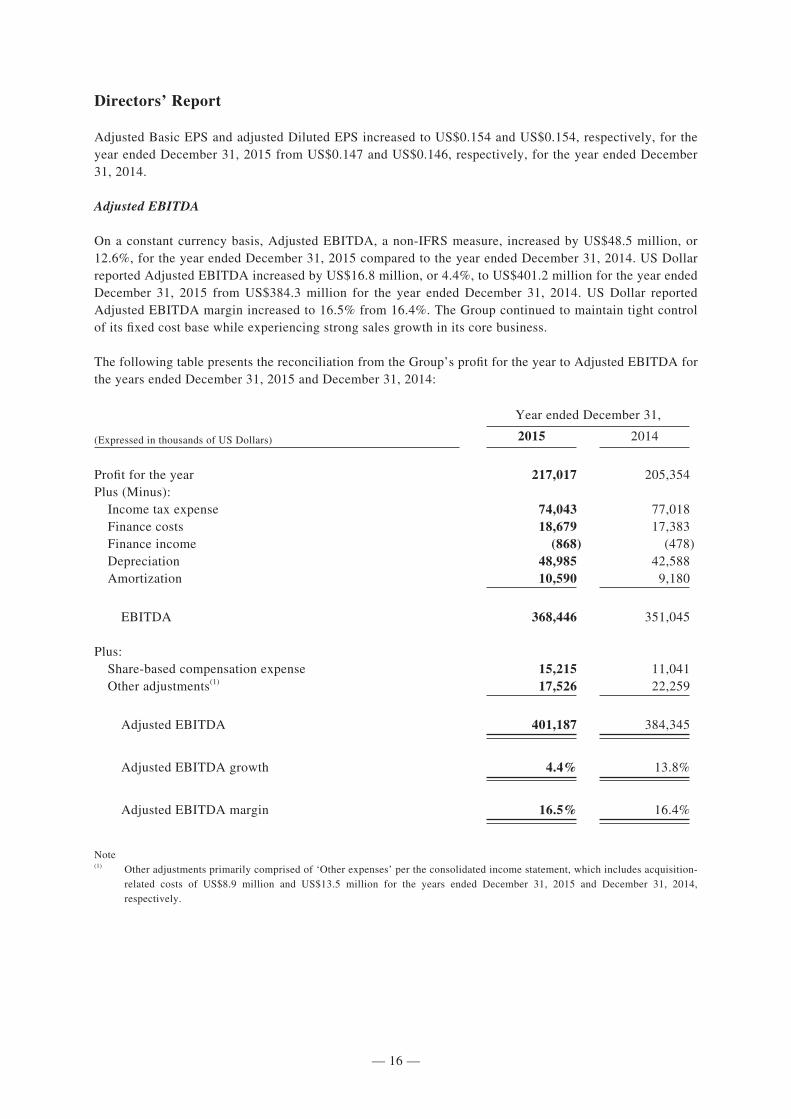
Adjusted Basic EPS and adjusted Diluted EPS increased to US$0.154 and US$0.154, respectively, for the year ended December 31, 2015 from US$0.147 and US$0.146, respectively, for the year ended December 31, 2014.
Adjusted EBITDA
On a constant currency basis, Adjusted EBITDA, a non-IFRS measure, increased by US$48.5 million, or 12.6%, for the year ended December 31, 2015 compared to the year ended December 31, 2014. US Dollar reported Adjusted EBITDA increased by US$16.8 million, or 4.4%, to US$401.2 million for the year ended December 31, 2015 from US$384.3 million for the year ended December 31, 2014. US Dollar reported Adjusted EBITDA margin increased to 16.5% from 16.4%. The Group continued to maintain tight control of its fixed cost base while experiencing strong sales growth in its core business.
The following table presents the reconciliation from the Group’s profit for the year to Adjusted EBITDA for the years ended December 31, 2015 and December 31, 2014:
Year ended December 31,
(Expressed in thousands of US Dollars) 2015 2014
Profit for the year 217,017 205,354Plus (Minus): Income tax expense 74,043 77,018 Finance costs 18,679 17,383 Finance income (868) (478) Depreciation 48,985 42,588 Amortization 10,590 9,180
EBITDA 368,446 351,045
Plus: Share-based compensation expense 15,215 11,041 Other adjustments(1) 17,526 22,259
Adjusted EBITDA 401,187 384,345
Adjusted EBITDA growth 4.4% 13.8%
Adjusted EBITDA margin 16.5% 16.4%
Note(1) Other adjustments primarily comprised of ‘Other expenses’ per the consolidated income statement, which includes acquisition-
related costs of US$8.9 million and US$13.5 million for the years ended December 31, 2015 and December 31, 2014, respectively.
284502 \ (Samsonite_Luxembourg) \ 19/04/2016 \ M38 / Size (210x297)
— 17 —
Directors’ Report
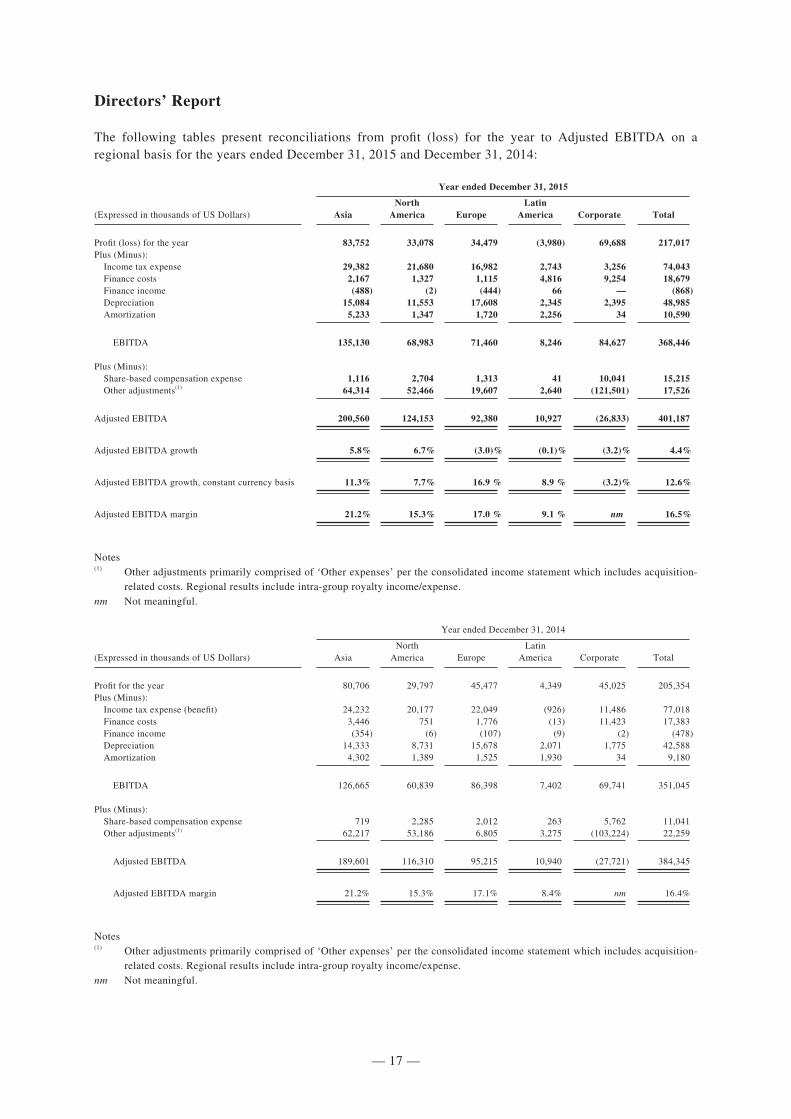
The following tables present reconciliations from profit (loss) for the year to Adjusted EBITDA on a regional basis for the years ended December 31, 2015 and December 31, 2014:
Year ended December 31, 2015
(Expressed in thousands of US Dollars) AsiaNorth
America EuropeLatin
America Corporate Total
Profit (loss) for the year 83,752 33,078 34,479 (3,980) 69,688 217,017Plus (Minus): Income tax expense 29,382 21,680 16,982 2,743 3,256 74,043 Finance costs 2,167 1,327 1,115 4,816 9,254 18,679 Finance income (488) (2) (444) 66 — (868) Depreciation 15,084 11,553 17,608 2,345 2,395 48,985 Amortization 5,233 1,347 1,720 2,256 34 10,590
EBITDA 135,130 68,983 71,460 8,246 84,627 368,446
Plus (Minus): Share-based compensation expense 1,116 2,704 1,313 41 10,041 15,215 Other adjustments(1) 64,314 52,466 19,607 2,640 (121,501) 17,526
Adjusted EBITDA 200,560 124,153 92,380 10,927 (26,833) 401,187
Adjusted EBITDA growth 5.8% 6.7% (3.0)% (0.1)% (3.2)% 4.4%
Adjusted EBITDA growth, constant currency basis 11.3% 7.7% 16.9 % 8.9 % (3.2)% 12.6%
Adjusted EBITDA margin 21.2% 15.3% 17.0 % 9.1 % nm 16.5%
Notes(1) Other adjustments primarily comprised of ‘Other expenses’ per the consolidated income statement which includes acquisition-
related costs. Regional results include intra-group royalty income/expense.nm Not meaningful.
Year ended December 31, 2014
(Expressed in thousands of US Dollars) AsiaNorth
America EuropeLatin
America Corporate Total
Profit for the year 80,706 29,797 45,477 4,349 45,025 205,354Plus (Minus): Income tax expense (benefit) 24,232 20,177 22,049 (926) 11,486 77,018 Finance costs 3,446 751 1,776 (13) 11,423 17,383 Finance income (354) (6) (107) (9) (2) (478) Depreciation 14,333 8,731 15,678 2,071 1,775 42,588 Amortization 4,302 1,389 1,525 1,930 34 9,180
EBITDA 126,665 60,839 86,398 7,402 69,741 351,045
Plus (Minus): Share-based compensation expense 719 2,285 2,012 263 5,762 11,041 Other adjustments(1) 62,217 53,186 6,805 3,275 (103,224) 22,259
Adjusted EBITDA 189,601 116,310 95,215 10,940 (27,721) 384,345
Adjusted EBITDA margin 21.2% 15.3% 17.1% 8.4% nm 16.4%
Notes(1) Other adjustments primarily comprised of ‘Other expenses’ per the consolidated income statement which includes acquisition-
related costs. Regional results include intra-group royalty income/expense.nm Not meaningful.

284502 \ (Samsonite_Luxembourg) \ 19/04/2016 \ M38 / Size (210x297)
— 18 —
Directors’ Report
The Group has presented Adjusted EBITDA because it believes that, when viewed with its results of operations as prepared in accordance with IFRS and with the reconciliation to profit for the year, Adjusted EBITDA provides additional information that is useful in gaining a more complete understanding of its operational performance and of the trends impacting its business. Adjusted EBITDA is an important metric the Group uses to evaluate its operating performance and cash generation.
Adjusted EBITDA is a non-IFRS financial measure and as calculated herein may not be comparable to similarly named measures used by other companies and should not be considered as a measure comparable to profit for the year in the Group’s consolidated income statement. Adjusted EBITDA has limitations as an analytical tool and should not be considered in isolation from, or as a substitute for, an analysis of the Group’s results of operations as reported under IFRS.
Adjusted Net Income
On a constant currency basis, Adjusted Net Income, a non-IFRS measure, increased by US$19.6 million, or 9.5%, for the year ended December 31, 2015 compared to the year ended December 31, 2014. Further excluding share-based compensation expense, Adjusted Net Income increased by US$23.9 million, or 11.0%, on a constant currency basis year-on-year. US Dollar reported Adjusted Net Income increased by US$10.7 million, or 5.2%, to US$216.9 million for the year ended December 31, 2015 from US$206.3 million for the year ended December 31, 2014. The Group experienced strong Adjusted Net Income growth year-on-year, despite the adverse impact from the strengthening of the US Dollar, increased costs from the Group’s retail store expansion, lower gross profit margin, the investment in the geographical expansion of the American Tourister brand in Europe and the investment in the Group’s business in Latin America.
The following table presents the reconciliation from the Group’s profit for the year to Adjusted Net Income for the years ended December 31, 2015 and December 31, 2014:
Year ended December 31,
(Expressed in thousands of US Dollars) 2015 2014
Profit for the year 217,017 205,354Profit attributable to non-controlling interests (19,378) (19,098)
Profit attributable to the equity holders 197,639 186,256
Plus (Minus): Change in fair value of put options 5,772 4,245 Amortization of intangible assets 10,590 9,180 Acquisition-related costs 8,877 13,541 Tax adjustments (5,968) (6,971)
Adjusted Net Income(1) 216,910 206,251
Note(1) Represents Adjusted Net Income attributable to the equity holders of the Company.
284502 \ (Samsonite_Luxembourg) \ 19/04/2016 \ M38 / Size (210x297)
— 19 —
Directors’ Report
The Group has presented Adjusted Net Income because it believes this measure helps to give securities analysts, investors and other interested parties a better understanding of the Group’s underlying financial performance. By presenting Adjusted Net Income, the Group eliminates the effect of a number of non-recurring costs, charges and credits and certain other non-cash charges that impact US Dollar reported profit for the year.
Adjusted Net Income is a non-IFRS financial measure, and as calculated herein may not be comparable to similarly named measures used by other companies and should not be considered as a measure comparable to profit for the year in the Group’s consolidated income statement. Adjusted Net Income has limitations as an analytical tool and should not be considered in isolation from, or as a substitute for, an analysis of the Group’s results of operations as reported under IFRS.
Liquidity and Capital Resources
The primary objective of the Group’s capital management policies is to safeguard its ability to continue as a going concern, to provide returns for the Company’s shareholders, and to fund capital expenditures, normal operating expenses, working capital needs and the payment of obligations. The Group’s primary sources of liquidity are its cash flows from operating activities, invested cash, available lines of credit and, subject to shareholder approval, the Company’s ability to issue additional shares. The Group believes that its existing cash and estimated cash flows, along with current working capital, will be adequate to meet the operating and capital requirements of the Group for at least the next twelve months.
Cash provided by operating activities increased by US$29.1 million, or 12.7%, to US$259.0 million for the year ended December 31, 2015 compared to US$229.9 million for the year ended December 31, 2014. This increase is primarily attributable to increased profits and more efficiently managed working capital, which were partially offset by an increase in taxes paid.
For the year ended December 31, 2015, net cash used in investing activities was US$104.1 million compared to US$267.1 million in the previous year. This decrease was primarily due to the smaller investments required in the purchases of Rolling Luggage in February 2015 and Chic Accent in September 2015 compared to the acquisitions of Speck Products, Lipault and Gregory in 2014.
Net cash flows used in financing activities was US$110.2 million for the year ended December 31, 2015 compared to US$41.7 million for the year ended December 31, 2014. Cash flows used in financing activities are largely attributable to the US$88.0 million distribution to shareholders and the purchase of the non-controlling interest in the Group’s Russian subsidiary.
284502 \ (Samsonite_Luxembourg) \ 19/04/2016 \ M38 / Size (210x297)
— 20 —
Directors’ Report
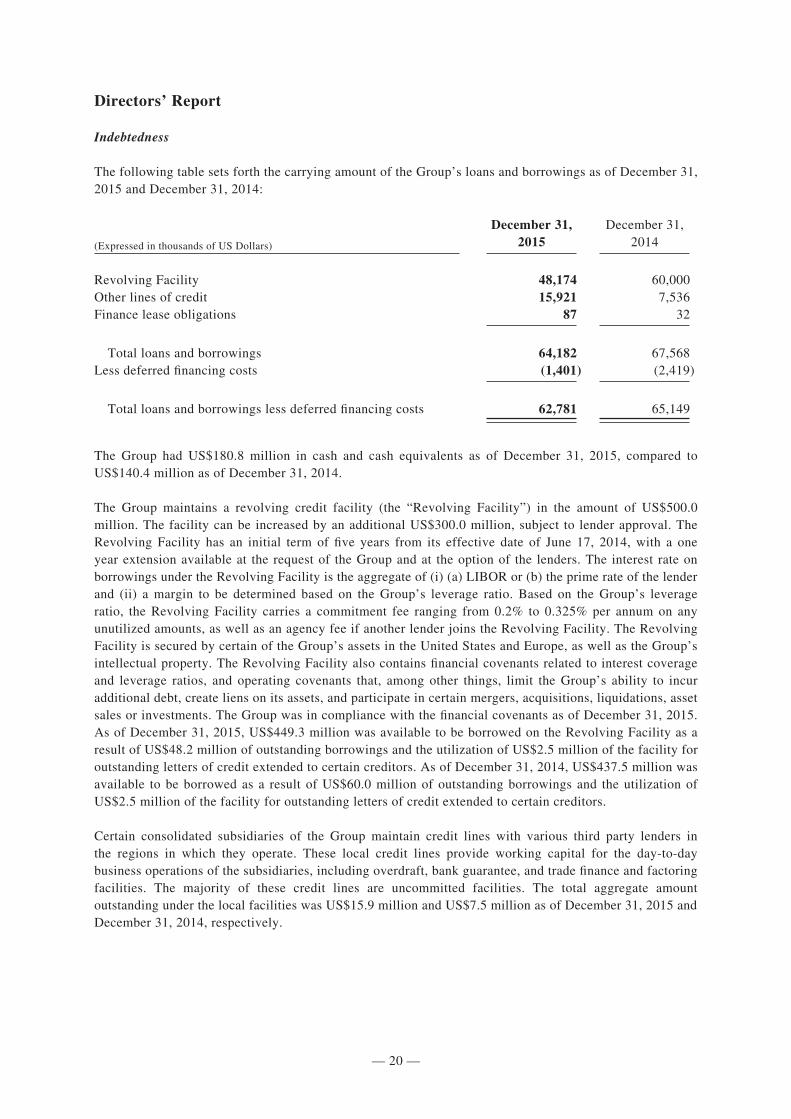
Indebtedness
The following table sets forth the carrying amount of the Group’s loans and borrowings as of December 31, 2015 and December 31, 2014:
December 31, December 31,
(Expressed in thousands of US Dollars) 2015 2014
Revolving Facility 48,174 60,000Other lines of credit 15,921 7,536Finance lease obligations 87 32
Total loans and borrowings 64,182 67,568Less deferred financing costs (1,401) (2,419)
Total loans and borrowings less deferred financing costs 62,781 65,149
The Group had US$180.8 million in cash and cash equivalents as of December 31, 2015, compared to US$140.4 million as of December 31, 2014.
The Group maintains a revolving credit facility (the “Revolving Facility”) in the amount of US$500.0 million. The facility can be increased by an additional US$300.0 million, subject to lender approval. The Revolving Facility has an initial term of five years from its effective date of June 17, 2014, with a one year extension available at the request of the Group and at the option of the lenders. The interest rate on borrowings under the Revolving Facility is the aggregate of (i) (a) LIBOR or (b) the prime rate of the lender and (ii) a margin to be determined based on the Group’s leverage ratio. Based on the Group’s leverage ratio, the Revolving Facility carries a commitment fee ranging from 0.2% to 0.325% per annum on any unutilized amounts, as well as an agency fee if another lender joins the Revolving Facility. The Revolving Facility is secured by certain of the Group’s assets in the United States and Europe, as well as the Group’s intellectual property. The Revolving Facility also contains financial covenants related to interest coverage and leverage ratios, and operating covenants that, among other things, limit the Group’s ability to incur additional debt, create liens on its assets, and participate in certain mergers, acquisitions, liquidations, asset sales or investments. The Group was in compliance with the financial covenants as of December 31, 2015. As of December 31, 2015, US$449.3 million was available to be borrowed on the Revolving Facility as a result of US$48.2 million of outstanding borrowings and the utilization of US$2.5 million of the facility for outstanding letters of credit extended to certain creditors. As of December 31, 2014, US$437.5 million was available to be borrowed as a result of US$60.0 million of outstanding borrowings and the utilization of US$2.5 million of the facility for outstanding letters of credit extended to certain creditors.
Certain consolidated subsidiaries of the Group maintain credit lines with various third party lenders in the regions in which they operate. These local credit lines provide working capital for the day-to-day business operations of the subsidiaries, including overdraft, bank guarantee, and trade finance and factoring facilities. The majority of these credit lines are uncommitted facilities. The total aggregate amount outstanding under the local facilities was US$15.9 million and US$7.5 million as of December 31, 2015 and December 31, 2014, respectively.
284502 \ (Samsonite_Luxembourg) \ 19/04/2016 \ M38 / Size (210x297)
— 21 —
Directors’ Report
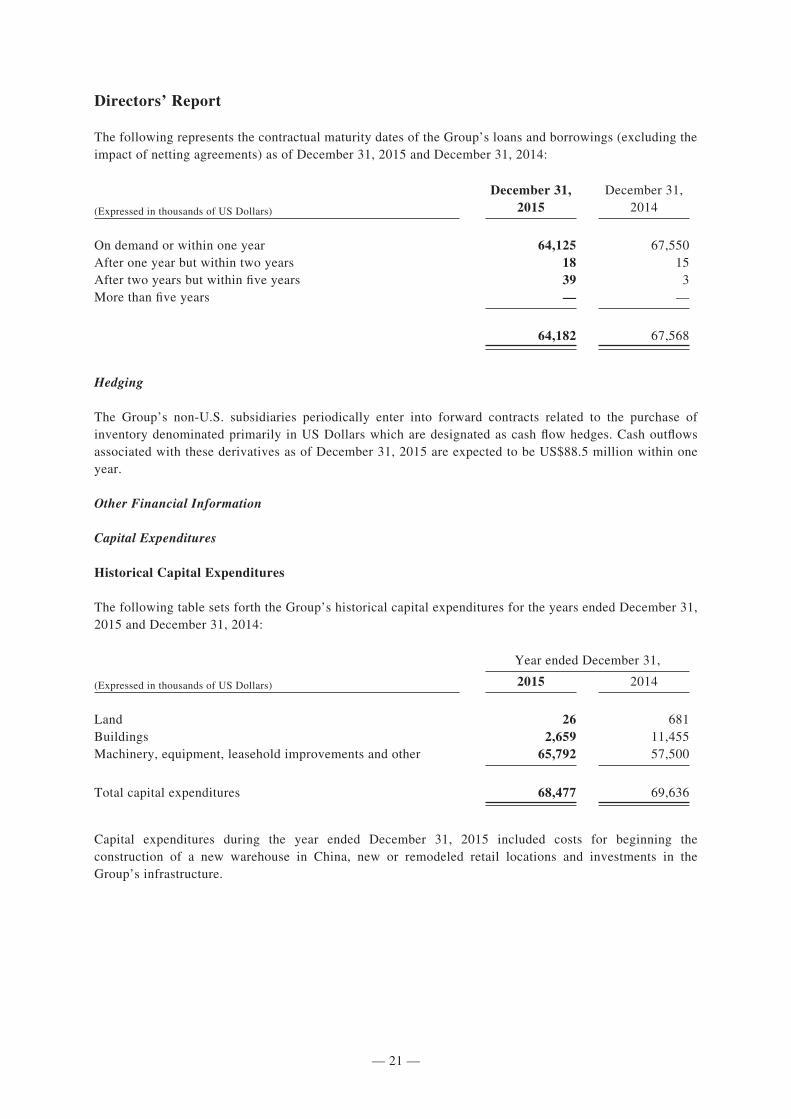
The following represents the contractual maturity dates of the Group’s loans and borrowings (excluding the impact of netting agreements) as of December 31, 2015 and December 31, 2014:
December 31, December 31,
(Expressed in thousands of US Dollars) 2015 2014
On demand or within one year 64,125 67,550After one year but within two years 18 15After two years but within five years 39 3More than five years — —
64,182 67,568
Hedging
The Group’s non-U.S. subsidiaries periodically enter into forward contracts related to the purchase of inventory denominated primarily in US Dollars which are designated as cash flow hedges. Cash outflows associated with these derivatives as of December 31, 2015 are expected to be US$88.5 million within one year.
Other Financial Information
Capital Expenditures
Historical Capital Expenditures
The following table sets forth the Group’s historical capital expenditures for the years ended December 31, 2015 and December 31, 2014:
Year ended December 31,
(Expressed in thousands of US Dollars) 2015 2014
Land 26 681Buildings 2,659 11,455Machinery, equipment, leasehold improvements and other 65,792 57,500
Total capital expenditures 68,477 69,636
Capital expenditures during the year ended December 31, 2015 included costs for beginning the construction of a new warehouse in China, new or remodeled retail locations and investments in the Group’s infrastructure.
284502 \ (Samsonite_Luxembourg) \ 19/04/2016 \ M38 / Size (210x297)
— 22 —
Directors’ Report
Planned Capital Expenditures
The Group’s capital expenditures budget for 2016 is approximately US$84.0 million. The Group plans to complete the warehouse in China, begin a plant expansion in Hungary, refurbish existing retail stores, open new retail stores and invest in machinery and equipment.
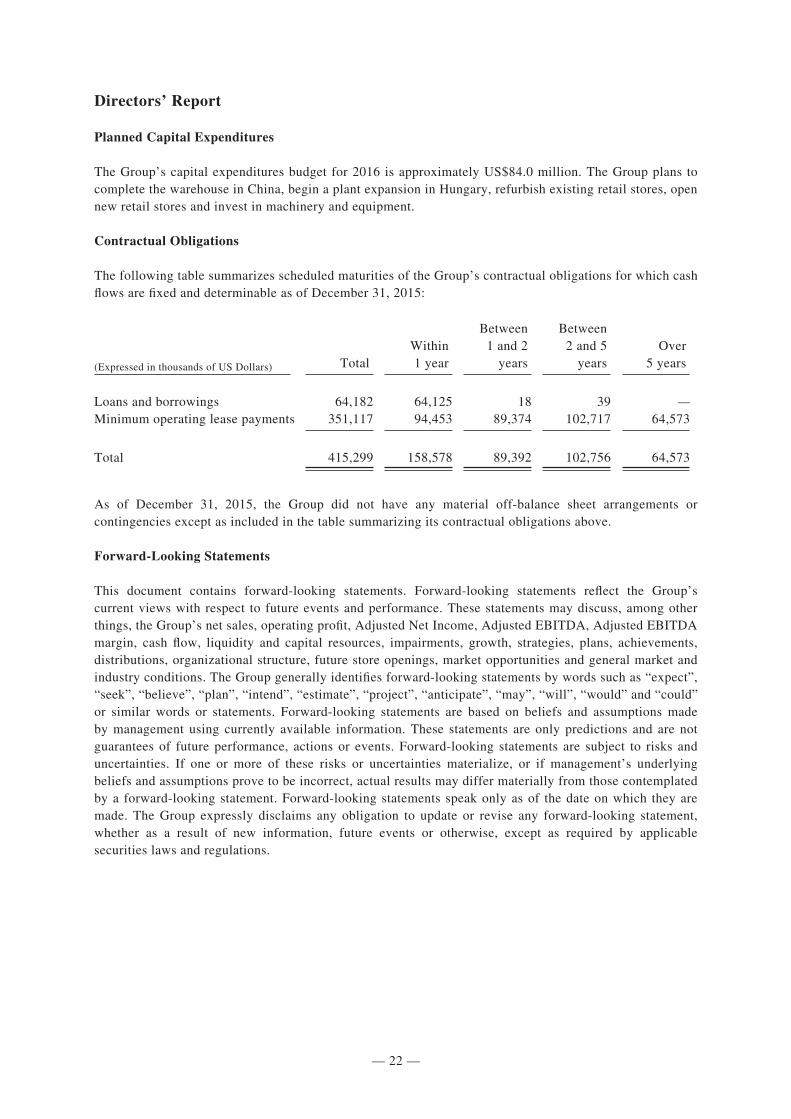
Contractual Obligations
The following table summarizes scheduled maturities of the Group’s contractual obligations for which cash flows are fixed and determinable as of December 31, 2015:
(Expressed in thousands of US Dollars) TotalWithin1 year
Between1 and 2
years
Between2 and 5
yearsOver
5 years
Loans and borrowings 64,182 64,125 18 39 —Minimum operating lease payments 351,117 94,453 89,374 102,717 64,573
Total 415,299 158,578 89,392 102,756 64,573
As of December 31, 2015, the Group did not have any material off-balance sheet arrangements or contingencies except as included in the table summarizing its contractual obligations above.
Forward-Looking Statements
This document contains forward-looking statements. Forward-looking statements reflect the Group’s current views with respect to future events and performance. These statements may discuss, among other things, the Group’s net sales, operating profit, Adjusted Net Income, Adjusted EBITDA, Adjusted EBITDA margin, cash flow, liquidity and capital resources, impairments, growth, strategies, plans, achievements, distributions, organizational structure, future store openings, market opportunities and general market and industry conditions. The Group generally identifies forward-looking statements by words such as “expect”, “seek”, “believe”, “plan”, “intend”, “estimate”, “project”, “anticipate”, “may”, “will”, “would” and “could” or similar words or statements. Forward-looking statements are based on beliefs and assumptions made by management using currently available information. These statements are only predictions and are not guarantees of future performance, actions or events. Forward-looking statements are subject to risks and uncertainties. If one or more of these risks or uncertainties materialize, or if management’s underlying beliefs and assumptions prove to be incorrect, actual results may differ materially from those contemplated by a forward-looking statement. Forward-looking statements speak only as of the date on which they are made. The Group expressly disclaims any obligation to update or revise any forward-looking statement, whether as a result of new information, future events or otherwise, except as required by applicable securities laws and regulations.
284502 \ (Samsonite_Luxembourg) \ 19/04/2016 \ M38 / Size (210x297)
— 23 —
Directors’ Report
2. Principal Risks and Uncertainties
Details of principal risks and uncertainties can be found in note 21 of the consolidated financial statements.
In terms of financial guarantees, the Company’s policy is to provide financial guarantees only on behalf of subsidiaries. No other guarantees have been made to third parties.
3. Internal Controls and Risk Management System
The Board places great importance on internal control and is responsible for ensuring that the Company maintains sound and effective internal controls.
The Company’s internal audit department reviews the adequacy and effectiveness of the internal control system. The internal and external audit plans are discussed and agreed each year with the Audit Committee.
The Board has reviewed the overall effectiveness of the Company’s system of internal control for the year ended December 31, 2015. The Board has delegated to the Audit Committee responsibility for reviewing the Company’s internal controls and reporting the committee’s findings to the Board. In conducting such review, the Audit Committee, on behalf of the Board, has (i) reviewed the Company’s internal audit activities during the year and discussed such activities and the results thereof with the Company’s Vice President of Internal Audit, (ii) reviewed and discussed the scope and results of the annual audit with the Company’s external auditors, and (iii) reviewed with management the results of the Company’s internal management representation process that was performed in connection with the preparation of the annual financial statements. Based on its review, the Board is not aware of any material defects in the effectiveness of internal controls.
4. Financial Risk Management and Hedging
Details of financial risk management can be found in note 21 of the consolidated financial statements.
The Group’s non-U.S. subsidiaries periodically enter into forward contracts related to the purchase of inventory denominated primarily in US Dollars which are designated as cash flow hedges. Cash outflows associated with these derivatives as of December 31, 2015 are expected to be US$88.5 million within one year.
5. Research and Development
The Group devotes significant resources to new product design, development and innovation as it is a core part of its strategy. The Group believes it has a strong track record of innovation, and its global scale allows it to make significant expenditures on research and development. The Group incurred research and development expenses of US$26.2 million during the year ended December 31, 2015. Each of the Group’s regions has a design team that develops products specifically for that region, and who are in communication with each other on a regular basis, sharing ideas and designs. The Group’s design teams are continuously developing new products, based on continual improvement and innovation.
6. Capital Structure and Shareholding
Details on the capital structure of the Company can be found in note 23 of the consolidated financial statements. Since its incorporation, the Company did not proceed to acquire any of its own shares.
284502 \ (Samsonite_Luxembourg) \ 19/04/2016 \ M38 / Size (210x297)
— 24 —
Directors’ Report
7. Other Information
Distributions to Shareholders
On March 16, 2015, the Board recommended that a cash distribution in the amount of US$88.0 million, or approximately US$0.0624 per share, be made to the Company’s shareholders of record on June 17, 2015 from its ad hoc distributable reserve. The shareholders approved this distribution on June 4, 2015 at the Annual General Meeting and the distribution was paid on July 13, 2015.
No other dividends or distributions were declared or paid during the year ended December 31, 2015.
The Board recommends that a cash distribution in the amount of US$93.0 million, or approximately US$0.0659 per share based upon the number of shares outstanding as of the date hereof (the “Distribution”) be made to the Company’s shareholders from its ad hoc distributable reserve. The per share amount of the Distribution is subject to change in the event that any new shares are issued pursuant to the exercise of outstanding share options before the record date for the Distribution. A further announcement will be made on the record date of the Distribution in the event that the final amount per share changes. The payment shall be made in US Dollars, except that payment to shareholders whose names appear on the register of members in Hong Kong shall be paid in Hong Kong Dollars. The relevant exchange rate shall be the opening buying rate of Hong Kong Dollars to US Dollars as announced by the Hong Kong Association of Banks (www.hkab.org.hk) on the day of the approval of the Distribution.
The Distribution will be subject to approval by the shareholders at the forthcoming AGM of the Company. For determining the entitlement to attend and vote at the AGM, the Register of Members of the Company will be closed from May 31, 2016 to June 2, 2016, both days inclusive, during which period no transfer of shares will be registered. The record date to determine which shareholders will be eligible to attend and vote at the forthcoming AGM will be June 2, 2016. In order to be eligible to attend and vote at the AGM, all transfer documents accompanied by the relevant share certificates must be lodged with the Company’s branch Share Registrar in Hong Kong, Computershare Hong Kong Investor Services Limited, Shops 1712–1716, 17th Floor, Hopewell Centre, 183 Queen’s Road East, Wan Chai, Hong Kong for registration no later than 4:30 p.m. on May 30, 2016.
Subject to the shareholders approving the recommended Distribution at the forthcoming AGM, such Distribution will be payable on July 13, 2016 to shareholders whose names appear on the register of members on June 17, 2016. To determine eligibility for the Distribution, the register of members will be closed from June 15, 2016 to June 17, 2016, both days inclusive, during which period no transfer of shares will be registered. In order to be entitled to receive the Distribution, all transfer documents accompanied by the relevant share certificates must be lodged with the Company’s branch Share Registrar in Hong Kong, Computershare Hong Kong Investor Services Limited, Shops 1712–1716, 17th Floor, Hopewell Centre, 183 Queen’s Road East, Wan Chai, Hong Kong, for registration not later than 4:30 p.m. on June 14, 2016.
The Distribution will not be subject to withholding tax under Luxembourg laws.
284502 \ (Samsonite_Luxembourg) \ 19/04/2016 \ M38 / Size (210x297)
— 25 —
Directors’ Report
Human Resources and Remuneration
As of December 31, 2015, the Group had approximately 9,800 employees worldwide, compared to approximately 8,900 employees as of December 31, 2014. The increase in headcount was largely driven by the addition of new retail stores and shop-in-shop expansion in Asia as well as acquisitions. The Group regularly reviews remuneration and benefits of its employees according to the relevant market practice, employee performance and the financial performance of the Group.
8. Strategic Review and Future Prospects
During 2015, the Group continued to implement its strategic plan in the following areas:
Financial Highlights
All key Group metrics showed moderate growth for the year ended December 31, 2015 compared to the year ended December 31, 2014.
• Net sales increased to a record level of US$2,432.5 million, reflecting an 11.9% increase on a constant currency basis from the previous year. US Dollar reported net sales increased by 3.5%. Excluding amounts attributable to the acquisitions made in 2014, net sales, on a constant currency basis, increased by US$218.9 million, or 9.8%, and US Dollar reported net sales increased by US$25.6 million, or 1.1%.
• Operating profit increased by US$27.9 million, or 9.3%, on a constant currency basis year-on-year. US Dollar reported operating profit increased by US$9.6 million, or 3.2%, to US$308.9 million.
• Profit for the year increased by US$20.4 million, or 9.9%, on a constant currency basis year-on-year. US Dollar reported profit for the year increased by US$11.7 million, or 5.7%, to US$217.0 million.
• Profit attributable to the equity holders increased by US$19.9 million, or 10.7%, on a constant currency basis from the previous year. US Dollar reported profit attributable to the equity holders increased by US$11.4 million, or 6.1%, to US$197.6 million.
• Adjusted Net Income increased by US$19.6 million, or 9.5%, on a constant currency basis year-on-year. US Dollar reported Adjusted Net Income increased by US$10.7 million, or 5.2%, to US$216.9 million.
• Adjusted EBITDA increased by US$48.5 million, or 12.6%, on a constant currency basis from the previous year. US Dollar reported Adjusted EBITDA increased by US$16.8 million, or 4.4%, to US$401.2 million.
• Adjusted EBITDA margin increased to 16.5% from 16.4%.
• The Group generated US$259.0 million of cash from operating activities.
Significant investment in advertising and promotion
The Group continued to make significant investments in marketing, which amounted to approximately 5.4% of net sales during 2015, reflecting its commitment to advertise and promote its brands and products to support sales growth worldwide.
284502 \ (Samsonite_Luxembourg) \ 19/04/2016 \ M38 / Size (210x297)
— 26 —
Directors’ Report
Introduction of new and innovative products to the market
The Group continued to focus on innovation and ensuring that its products reflect local consumer tastes in each region. Innovation and a regional focus on product development are key drivers of sales growth and are the means to deliver quality and value to the Group’s customers.
Acquisitions
On February 16, 2015, certain of the Company’s wholly-owned subsidiaries completed the acquisition of the business and substantially all of the assets of Rolling Luggage for a cash consideration of GBP15.8 million, with a subsequent working capital adjustment of GBP(0.3) million and a subsequent purchase price adjustment of GBP(0.5) million for leases that were not successfully transferred, for a total purchase price of GBP15.0 million. The acquisition provides the Group with a significant retail footprint in some of the world’s leading airports, and further expands the Group’s portfolio of retail store locations.
On June 26, 2015, a wholly-owned subsidiary of the Company acquired the 40% non-controlling interest in its Russian subsidiary for US$15.7 million in cash, with a final working capital adjustment of US$0.3 million settled in July 2015, increasing its ownership from 60% to 100%.
On September 30, 2015, a wholly-owned subsidiary of the Company completed the acquisition of substantially all of the assets, and assumed certain liabilities, comprising the business as a going concern of Chic Accent for a cash consideration of EUR8.5 million, with a subsequent working capital adjustment of EUR(2.1) million in cash. The acquisition provides the Group with 31 retail store locations in Italy dedicated to premium accessories, ladies’ handbags, travel luggage and business products, and further expands the Group’s portfolio of retail store locations.
Future Prospects
The Group’s growth strategy will continue as planned for 2016, with a focus on the following:
• Continue to develop the Company into a well-diversified multi-brand, multi-category and multi-channel luggage, bag and accessories business.
• Tactfully deploy multiple brands to operate at wider price points and broader consumer demographics in each category.
• Increase the proportion of sales from the Group’s retail channel by growing e-commerce sales and through targeted expansion of its retail presence.
• Continue to invest in the Group’s core brands with sustained R&D spending to produce exciting and innovative new products as well as new materials, supported by effective marketing spend to drive awareness among consumers.
• Execute on market opportunities for newly acquired brands to further diversify the Group’s product offering into non-travel categories.
The Group aims to deliver top-line growth, maintain gross margins, increase Adjusted EBITDA margins and enhance shareholder value.

284502 \ (Samsonite_Luxembourg) \ 19/04/2016 \ M38 / Size (210x297)
— 27 —
Directors’ Report
9. Subsequent Events
Please refer to note 24 of the consolidated financial statements for further details on subsequent events.
By: Kyle F. GendreauCapacity: Director
— 28 —
284502 \ (Samsonite_Luxembourg) \ 19/04/2016 \ M38 / Size (210x297)
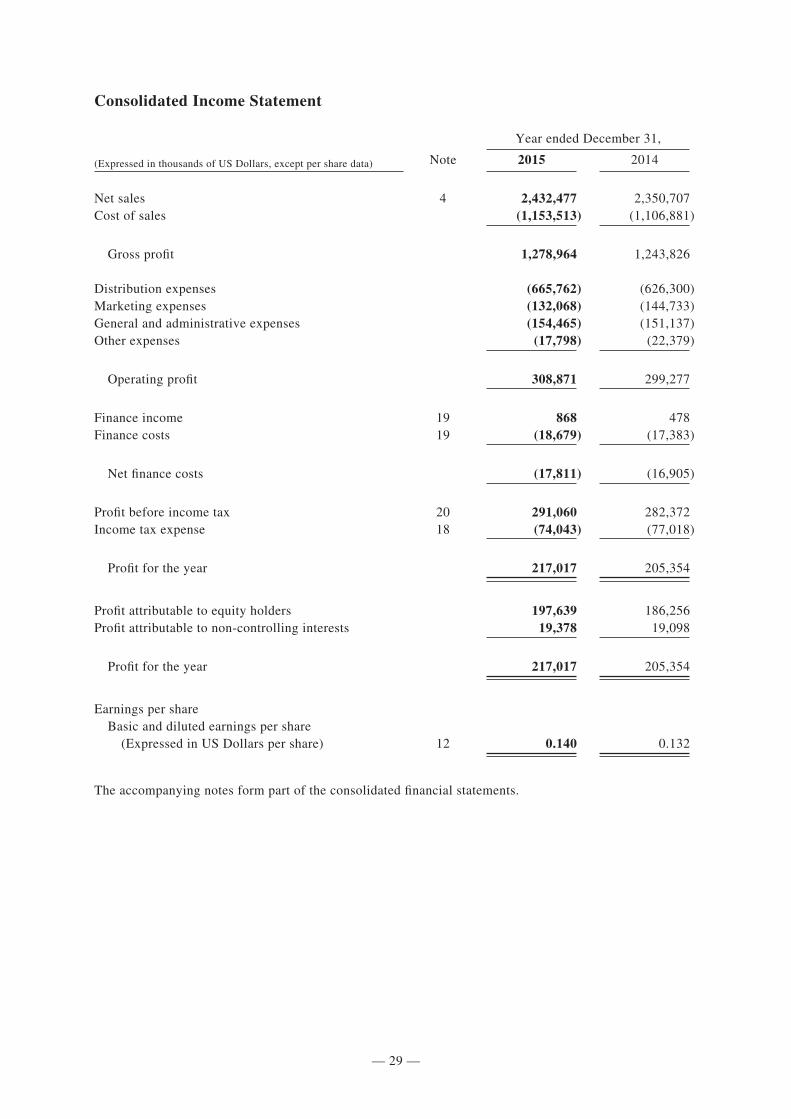
— 29 —
Consolidated Income Statement
284502 \ (Samsonite_Luxembourg) \ 19/04/2016 \ M38 / Size (210x297)
Year ended December 31,
(Expressed in thousands of US Dollars, except per share data) Note 2015 2014
Net sales 4 2,432,477 2,350,707Cost of sales (1,153,513) (1,106,881)
Gross profit 1,278,964 1,243,826
Distribution expenses (665,762) (626,300)Marketing expenses (132,068) (144,733)General and administrative expenses (154,465) (151,137)Other expenses (17,798) (22,379)
Operating profit 308,871 299,277
Finance income 19 868 478Finance costs 19 (18,679) (17,383)
Net finance costs (17,811) (16,905)
Profit before income tax 20 291,060 282,372Income tax expense 18 (74,043) (77,018)
Profit for the year 217,017 205,354
Profit attributable to equity holders 197,639 186,256Profit attributable to non-controlling interests 19,378 19,098
Profit for the year 217,017 205,354
Earnings per share Basic and diluted earnings per share (Expressed in US Dollars per share) 12 0.140 0.132
The accompanying notes form part of the consolidated financial statements.
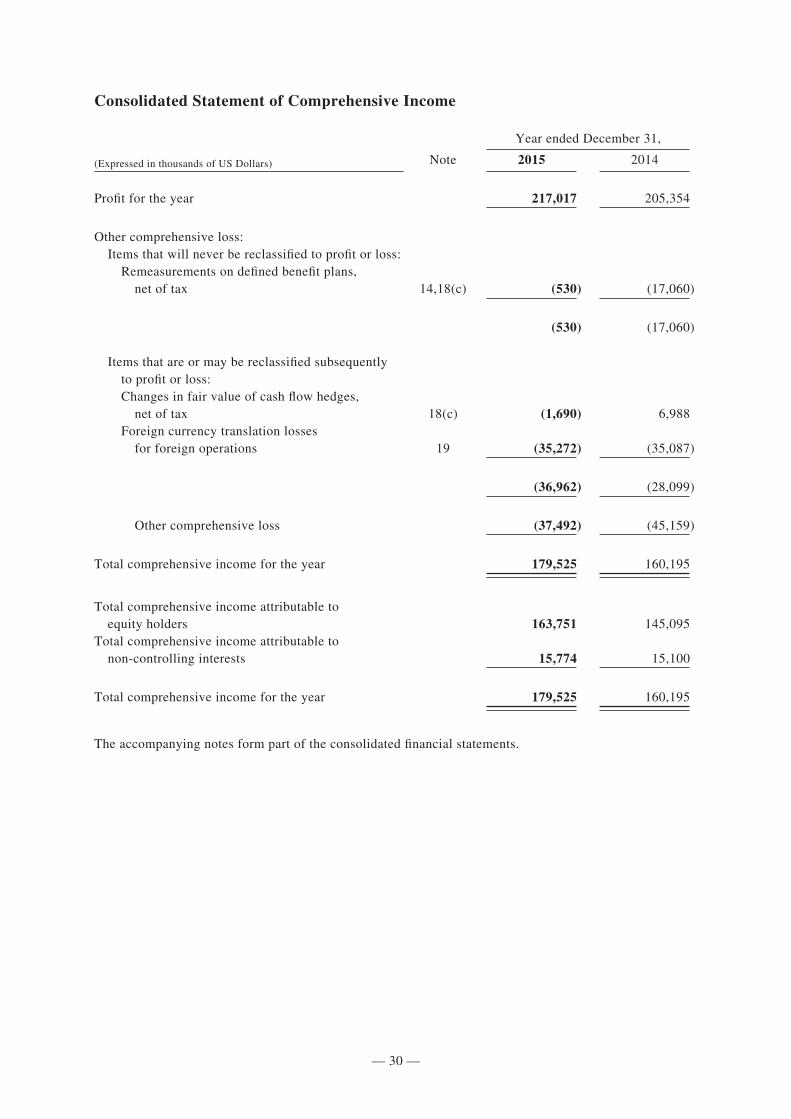
— 30 —
Consolidated Statement of Comprehensive Income
284502 \ (Samsonite_Luxembourg) \ 19/04/2016 \ M38 / Size (210x297)
Year ended December 31,
(Expressed in thousands of US Dollars) Note 2015 2014
Profit for the year 217,017 205,354
Other comprehensive loss: Items that will never be reclassified to profit or loss: Remeasurements on defined benefit plans, net of tax 14,18(c) (530) (17,060)
(530) (17,060)
Items that are or may be reclassified subsequently to profit or loss: Changes in fair value of cash flow hedges, net of tax 18(c) (1,690) 6,988 Foreign currency translation losses for foreign operations 19 (35,272) (35,087)
(36,962) (28,099)
Other comprehensive loss (37,492) (45,159)
Total comprehensive income for the year 179,525 160,195
Total comprehensive income attributable to equity holders 163,751 145,095Total comprehensive income attributable to non-controlling interests 15,774 15,100
Total comprehensive income for the year 179,525 160,195
The accompanying notes form part of the consolidated financial statements.
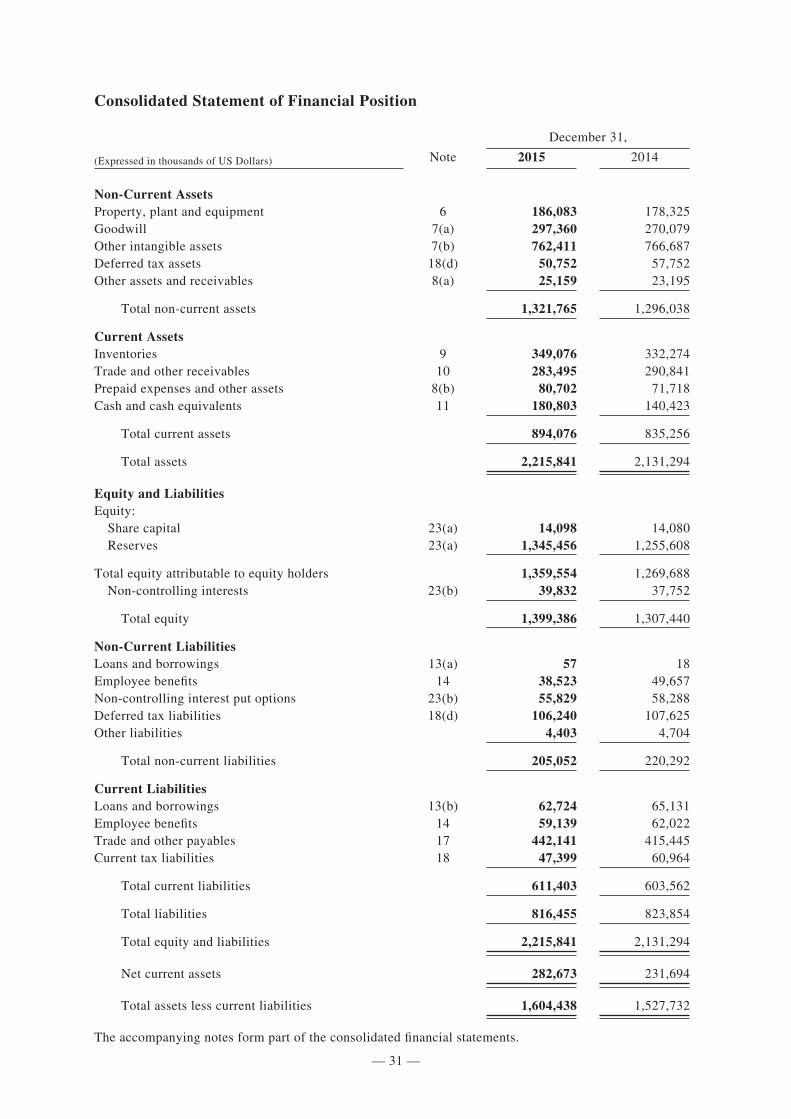
— 31 —
Consolidated Statement of Financial Position
284502 \ (Samsonite_Luxembourg) \ 19/04/2016 \ M38 / Size (210x297)
December 31,
(Expressed in thousands of US Dollars) Note 2015 2014
Non-Current AssetsProperty, plant and equipment 6 186,083 178,325Goodwill 7(a) 297,360 270,079Other intangible assets 7(b) 762,411 766,687Deferred tax assets 18(d) 50,752 57,752Other assets and receivables 8(a) 25,159 23,195
Total non-current assets 1,321,765 1,296,038
Current AssetsInventories 9 349,076 332,274Trade and other receivables 10 283,495 290,841Prepaid expenses and other assets 8(b) 80,702 71,718Cash and cash equivalents 11 180,803 140,423
Total current assets 894,076 835,256
Total assets 2,215,841 2,131,294
Equity and LiabilitiesEquity: Share capital 23(a) 14,098 14,080 Reserves 23(a) 1,345,456 1,255,608
Total equity attributable to equity holders 1,359,554 1,269,688 Non-controlling interests 23(b) 39,832 37,752
Total equity 1,399,386 1,307,440
Non-Current LiabilitiesLoans and borrowings 13(a) 57 18Employee benefits 14 38,523 49,657Non-controlling interest put options 23(b) 55,829 58,288Deferred tax liabilities 18(d) 106,240 107,625Other liabilities 4,403 4,704
Total non-current liabilities 205,052 220,292
Current LiabilitiesLoans and borrowings 13(b) 62,724 65,131Employee benefits 14 59,139 62,022Trade and other payables 17 442,141 415,445Current tax liabilities 18 47,399 60,964
Total current liabilities 611,403 603,562
Total liabilities 816,455 823,854
Total equity and liabilities 2,215,841 2,131,294
Net current assets 282,673 231,694
Total assets less current liabilities 1,604,438 1,527,732
The accompanying notes form part of the consolidated financial statements.
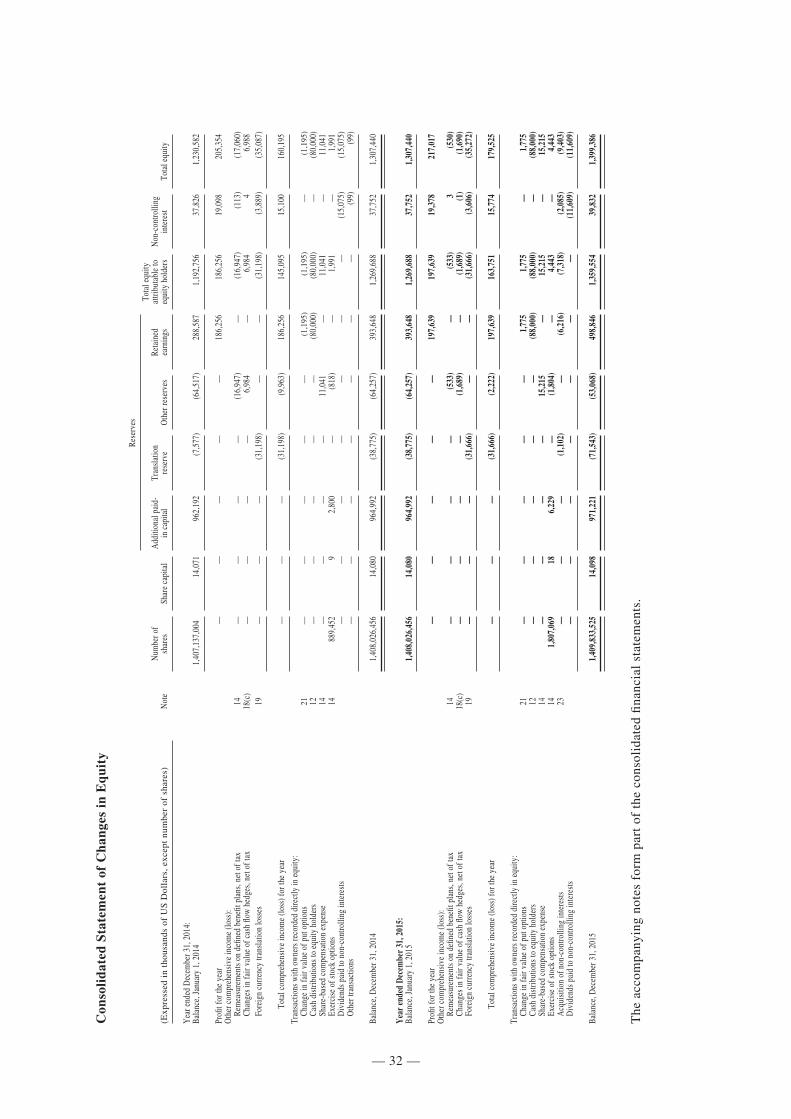
— 32 —
284502 \ (Samsonite_Luxembourg) \ 19/04/2016 \ M38 / Size (210x297)
Con
soli
dat
ed S
tate
men
t of
Ch
ange
s in
Eq
uit
y
Rese
rves
(Exp
ress
ed i
n th
ousa
nds
of U
S D
olla
rs, e
xcep
t nu
mbe
r of
sha
res)
Not
eN
umbe
r of
shar
esSh
are
capi
tal
Add
ition
al p
aid-
in c
apita
lTr
ansl
atio
n re
serv
eO
ther
rese
rves
Reta
ined
ea
rnin
gs
Tota
l equ
ity
attri
buta
ble
to
equi
ty h
olde
rsN
on-c
ontro
lling
in
tere
stTo
tal e
quity
Yea
r end
ed D
ecem
ber 3
1, 2
014:
Bala
nce,
Jan
uary
1, 2
014
1,40
7,13
7,00
414
,071
962,
192
(7,5
77)
(64,
517)
288,
587
1,19
2,75
637
,826
1,23
0,58
2
Profi
t for
the
year
——
——
—18
6,25
618
6,25
619
,098
205,
354
Oth
er c
ompr
ehen
sive
inco
me
(loss
):
Rem
easu
rem
ents
on
defin
ed b
enefi
t pla
ns, n
et o
f tax
14—
——
—(1
6,94
7)—
(16,
947)
(113
)(1
7,06
0)
Chan
ges i
n fa
ir va
lue
of c
ash
flow
hed
ges,
net o
f tax
18(c
)—
——
—6,
984
—6,
984
46,
988
Fo
reig
n cu
rren
cy tr
ansl
atio
n lo
sses
19—
——
(31,
198)
——
(31,
198)
(3,8
89)
(35,
087)
Tota
l com
preh
ensi
ve in
com
e (lo
ss) f
or th
e ye
ar—
——
(31,
198)
(9,9
63)
186,
256
145,
095
15,1
0016
0,19
5
Tran
sact
ions
with
ow
ners
reco
rded
dire
ctly
in e
quity
:
Chan
ge in
fair
valu
e of
put
opt
ions
21—
——
——
(1,1
95)
(1,1
95)
—(1
,195
)
Cash
dis
tribu
tions
to e
quity
hol
ders
12—
——
——
(80,
000)
(80,
000)
—(8
0,00
0)
Shar
e-ba
sed
com
pens
atio
n ex
pens
e14
——
——
11,0
41—
11,0
41—
11,0
41
Exer
cise
of s
tock
opt
ions
1488
9,45
29
2,80
0—
(818
)—
1,99
1—
1,99
1
Div
iden
ds p
aid
to n
on-c
ontro
lling
inte
rest
s—
——
——
——
(15,
075)
(15,
075)
O
ther
tran
sact
ions
——
——
——
—(9
9)(9
9)
Bala
nce,
Dec
embe
r 31,
201
41,
408,
026,
456
14,0
8096
4,99
2(3
8,77
5)(6
4,25
7)39
3,64
81,
269,
688
37,7
521,
307,
440
Yea
r en
ded
Dec
embe
r 31
, 201
5:Ba
lanc
e, J
anua
ry 1
, 201
51,
408,
026,
456
14,0
8096
4,99
2(3
8,77
5)(6
4,25
7)39
3,64
81,
269,
688
37,7
521,
307,
440
Profi
t for
the
year
——
——
—19
7,63
919
7,63
919
,378
217,
017
Oth
er c
ompr
ehen
sive
inco
me
(loss
):
Rem
easu
rem
ents
on
defin
ed b
enefi
t pla
ns, n
et o
f tax
14—
——
—(5
33)
—(5
33)
3(5
30)
Ch
ange
s in
fair
valu
e of
cas
h flo
w h
edge
s, ne
t of t
ax18
(c)
——
——
(1,6
89)
—(1
,689
)(1
)(1
,690
)
Fore
ign
curr
ency
tran
slat
ion
loss
es19
——
—(3
1,66
6)—
—(3
1,66
6)(3
,606
)(3
5,27
2)
Tota
l com
preh
ensi
ve in
com
e (lo
ss) f
or th
e ye
ar—
——
(31,
666)
(2,2
22)
197,
639
163,
751
15,7
7417
9,52
5
Tran
sact
ions
with
ow
ners
reco
rded
dire
ctly
in e
quity
:
Chan
ge in
fair
valu
e of
put
opt
ions
21—
——
——
1,77
51,
775
—1,
775
Ca
sh d
istri
butio
ns to
equ
ity h
olde
rs12
——
——
—(8
8,00
0)(8
8,00
0)—
(88,
000)
Sh
are-
base
d co
mpe
nsat
ion
expe
nse
14—
——
—15
,215
—15
,215
—15
,215
Ex
erci
se o
f sto
ck o
ptio
ns14
1,80
7,06
918
6,22
9—
(1,8
04)
—4,
443
—4,
443
A
cqui
sitio
n of
non
-con
trolli
ng in
tere
sts
23—
——
(1,1
02)
—(6
,216
)(7
,318
)(2
,085
)(9
,403
)
Div
iden
ds p
aid
to n
on-c
ontro
lling
inte
rest
s—
——
——
——
(11,
609)
(11,
609)
Bala
nce,
Dec
embe
r 31,
201
51,
409,
833,
525
14,0
9897
1,22
1(7
1,54
3)(5
3,06
8)49
8,84
61,
359,
554
39,8
321,
399,
386
The
acc
ompa
nyin
g no
tes
form
par
t of
the
con
soli
date
d fi
nanc
ial
stat
emen
ts.
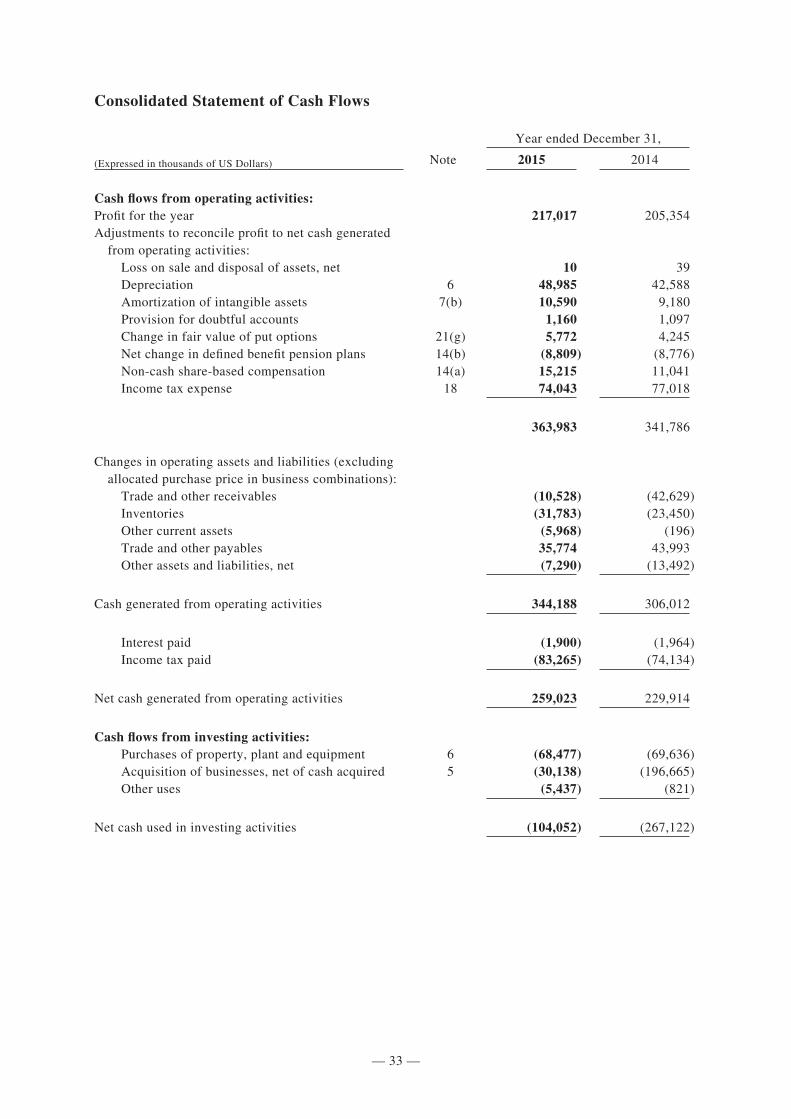
— 33 —
Consolidated Statement of Cash Flows
284502 \ (Samsonite_Luxembourg) \ 19/04/2016 \ M38 / Size (210x297)
Year ended December 31,
(Expressed in thousands of US Dollars) Note 2015 2014
Cash flows from operating activities:Profit for the year 217,017 205,354Adjustments to reconcile profit to net cash generated from operating activities: Loss on sale and disposal of assets, net 10 39 Depreciation 6 48,985 42,588 Amortization of intangible assets 7(b) 10,590 9,180 Provision for doubtful accounts 1,160 1,097 Change in fair value of put options 21(g) 5,772 4,245 Net change in defined benefit pension plans 14(b) (8,809) (8,776) Non-cash share-based compensation 14(a) 15,215 11,041 Income tax expense 18 74,043 77,018
363,983 341,786
Changes in operating assets and liabilities (excluding allocated purchase price in business combinations): Trade and other receivables (10,528) (42,629) Inventories (31,783) (23,450) Other current assets (5,968) (196) Trade and other payables 35,774 43,993 Other assets and liabilities, net (7,290) (13,492)
Cash generated from operating activities 344,188 306,012
Interest paid (1,900) (1,964) Income tax paid (83,265) (74,134)
Net cash generated from operating activities 259,023 229,914
Cash flows from investing activities: Purchases of property, plant and equipment 6 (68,477) (69,636) Acquisition of businesses, net of cash acquired 5 (30,138) (196,665) Other uses (5,437) (821)
Net cash used in investing activities (104,052) (267,122)
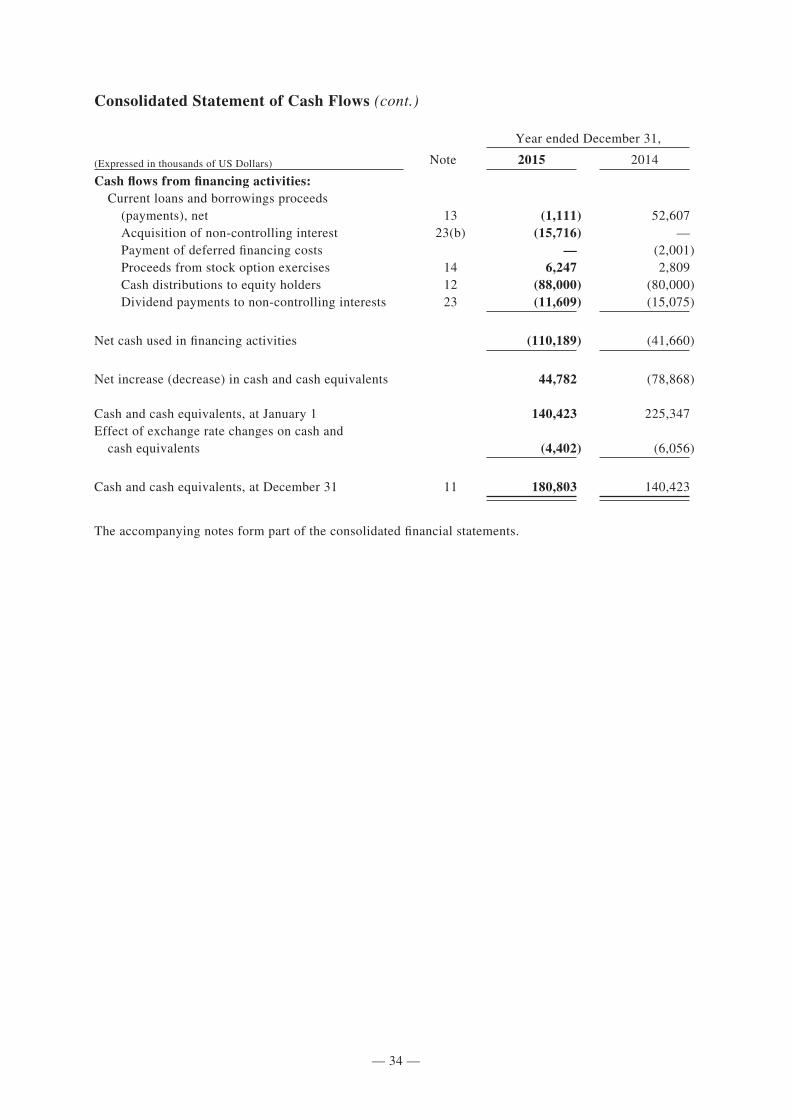
— 34 —
Consolidated Statement of Cash Flows (cont.)
284502 \ (Samsonite_Luxembourg) \ 19/04/2016 \ M38 / Size (210x297)
Year ended December 31,
(Expressed in thousands of US Dollars) Note 2015 2014
Cash flows from financing activities: Current loans and borrowings proceeds (payments), net 13 (1,111) 52,607 Acquisition of non-controlling interest 23(b) (15,716) — Payment of deferred financing costs — (2,001) Proceeds from stock option exercises 14 6,247 2,809 Cash distributions to equity holders 12 (88,000) (80,000) Dividend payments to non-controlling interests 23 (11,609) (15,075)
Net cash used in financing activities (110,189) (41,660)
Net increase (decrease) in cash and cash equivalents 44,782 (78,868)
Cash and cash equivalents, at January 1 140,423 225,347Effect of exchange rate changes on cash and cash equivalents (4,402) (6,056)
Cash and cash equivalents, at December 31 11 180,803 140,423
The accompanying notes form part of the consolidated financial statements.
— 35 —
Notes to the Consolidated Financial Statements
284502 \ (Samsonite_Luxembourg) \ 19/04/2016 \ M38 / Size (210x297)
1. BackgroundSamsonite International S.A. (the “Company”), together with its consolidated subsidiaries (the “Group”), is principally engaged in the design, manufacture, sourcing and distribution of luggage, business and computer bags, outdoor and casual bags, travel accessories and slim protective cases for personal electronic devices throughout the world, primarily under the Samsonite®, American Tourister®, Hartmann®, High Sierra®, Gregory®, Speck® and Lipault® brand names as well as other owned and licensed brand names. The Group sells its products through a variety of wholesale distribution channels, through its company-operated retail stores and through e-commerce. The principal wholesale distribution customers of the Group are department and specialty retail stores, mass merchants, catalog showrooms and warehouse clubs. The Group sells its products in Asia, North America, Europe and Latin America.
The Company’s ordinary shares are listed on the Main Board of The Stock Exchange of Hong Kong Limited (the “Stock Exchange”). The Company was incorporated in Luxembourg on March 8, 2011 as a public limited liability company (a société anonyme), whose registered office is 13–15 Avenue de la Liberté, L-1931 Luxembourg.
Details of the principal subsidiaries of the Group are set out in note 23.
2. Basis of Preparation
(a) Statement of Compliance
The consolidated financial statements have been prepared in accordance with International Financial Reporting Standards (“IFRS”), which collective term includes all International Accounting Standards (“IAS”) and related interpretations, as issued by the International Accounting Standards Board (the “IASB”).
Until December 31, 2012, the Company was preparing consolidated financial statements in accordance with IFRS as adopted by the European Union (“EU”). On October 30, 2013, the Company obtained from the Luxembourg Ministry of Justice, a 3-year authorization to prepare consolidated accounts under IFRS as adopted by the IASB instead of IFRS as adopted by the EU provided that a reconciliation of the equity and result for the year as reported to the equity and result for the year that would have been reported under Luxembourg legal and regulatory requirements or under IFRS as adopted by the EU is disclosed in the consolidated financial statements of the Company. In December 2015, the Company received an extension of such authorization through the period ending December 31, 2018.
A reconciliation of the equity and result for the year as reported to the equity and result for the year that would have been reported under IFRS as adopted by the EU is disclosed below.
The IASB has issued a number of new and revised IFRSs. For the purpose of preparing the consolidated financial statements, the Group has adopted all these new and revised IFRSs for all periods presented, except for any new standards or interpretations that are not yet mandatorily effective for the accounting period ended December 31, 2015. The revised and new accounting standards and interpretations issued but not yet effective for the accounting period ended December 31, 2015 are set out in note 3(v).
The accounting policies below, where material, have been applied consistently to all periods presented in the consolidated financial statements.
The consolidated financial statements were authorized for issue by the Board of Directors (the “Board”) on March 16, 2016.
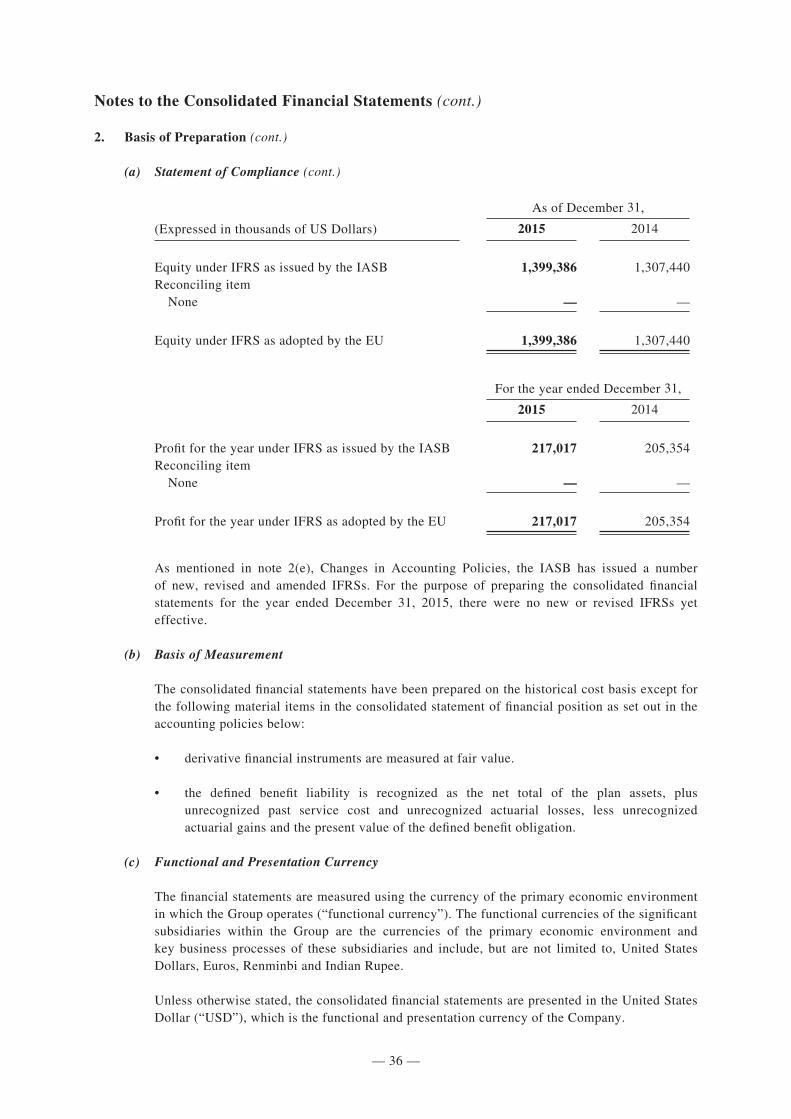
— 36 —
284502 \ (Samsonite_Luxembourg) \ 19/04/2016 \ M38 / Size (210x297)
Notes to the Consolidated Financial Statements (cont.)
2. Basis of Preparation (cont.)
(a) Statement of Compliance (cont.)
As of December 31,
(Expressed in thousands of US Dollars) 2015 2014
Equity under IFRS as issued by the IASB 1,399,386 1,307,440Reconciling item None — —
Equity under IFRS as adopted by the EU 1,399,386 1,307,440
For the year ended December 31,
2015 2014
Profit for the year under IFRS as issued by the IASB 217,017 205,354Reconciling item None — —
Profit for the year under IFRS as adopted by the EU 217,017 205,354
As mentioned in note 2(e), Changes in Accounting Policies, the IASB has issued a number of new, revised and amended IFRSs. For the purpose of preparing the consolidated financial statements for the year ended December 31, 2015, there were no new or revised IFRSs yet effective.
(b) Basis of Measurement
The consolidated financial statements have been prepared on the historical cost basis except for the following material items in the consolidated statement of financial position as set out in the accounting policies below:
• derivative financial instruments are measured at fair value.
• the defined benefit liability is recognized as the net total of the plan assets, plus unrecognized past service cost and unrecognized actuarial losses, less unrecognized actuarial gains and the present value of the defined benefit obligation.
(c) Functional and Presentation Currency
The financial statements are measured using the currency of the primary economic environment in which the Group operates (“functional currency”). The functional currencies of the significant subsidiaries within the Group are the currencies of the primary economic environment and key business processes of these subsidiaries and include, but are not limited to, United States Dollars, Euros, Renminbi and Indian Rupee.
Unless otherwise stated, the consolidated financial statements are presented in the United States Dollar (“USD”), which is the functional and presentation currency of the Company.
— 37 —
284502 \ (Samsonite_Luxembourg) \ 19/04/2016 \ M38 / Size (210x297)
Notes to the Consolidated Financial Statements (cont.)
2. Basis of Preparation (cont.)
(d) Use of Judgments, Estimates and Assumptions
The preparation of the consolidated financial statements in conformity with IFRS requires the use of certain critical accounting estimates. It also requires management to exercise its judgment in the process of applying the Group’s accounting policies and to make estimates and assumptions that affect the reported amounts of assets and liabilities, disclosure of contingent assets and liabilities at the date of the consolidated financial statements and the reported amounts of revenues and expenses during the reporting period. The estimates and associated assumptions are based on historical experience and various other factors that are believed to be reasonable under the circumstances, the results of which form the basis of making the judgments about carrying values of assets and liabilities that are not readily apparent from other sources. Actual results may differ from these estimates under different assumptions and conditions.
The estimates and underlying assumptions are reviewed on an ongoing basis. Revisions to accounting estimates are recognized in the period in which the estimate is revised if the revision affects only that period, or in the period of the revision and future periods if the revision affects both current and future periods. No significant changes occurred during the current reporting period of estimates reported in prior periods.
Information about critical judgments in applying accounting policies that have the most significant effect on the amounts recognized in the consolidated financial statements is included in the following notes:
• Note 3(o) — Revenue recognition
• Note 5 — Business combinations
• Note 6 — Property, plant and equipment
• Note 7 — Goodwill and other intangible assets
• Note 9 — Inventories
• Note 10 — Trade and other receivables
• Note 14(a) — Share-based payments
• Note 14(b) — Pension plans and defined benefit schemes
• Note 18 — Income taxes
• Note 21(g) — Fair value of financial instruments
• Note 23(b) — Non-controlling interests
— 38 —
284502 \ (Samsonite_Luxembourg) \ 19/04/2016 \ M38 / Size (210x297)
Notes to the Consolidated Financial Statements (cont.)
2. Basis of Preparation (cont.)
(d) Use of Judgments, Estimates and Assumptions (cont.)
Information about assumptions and estimation uncertainties that may have an effect on the consolidated financial statements resulting in a material adjustment within the next financial year is included in the following notes:
• Note 14(b) — Pension plans and defined benefit schemes
• Note 16 — Contingent liabilities
• Note 18 — Income taxes (utilization of tax losses)
• Note 21 — Financial risk management and financial instruments
(e) Changes in Accounting Policies
The IASB has issued a number of new, revised and amended IFRSs. For the purpose of preparing the consolidated financial statements for the year ended December 31, 2015, there were no new or revised IFRSs yet effective.
3. Summary of Significant Accounting Policies
The accounting policies set out below have been applied consistently by the Group to all periods presented, where material, in these consolidated financial statements.
(a) Principles of Consolidation
(i) Subsidiaries
Subsidiaries are entities controlled by the Group. The Group controls an entity when it is exposed to, or has rights to, variable returns from its involvement with the entity and has the ability to affect those returns through its power over the entity.
The financial information of subsidiaries is included in the consolidated financial statements from the date on which control commences until the date on which control ceases. All significant intercompany balances and transactions have been eliminated in consolidation.
(ii) Non-controlling Interests
Non-controlling interests are presented in the consolidated statement of financial position within equity, separately from total equity attributable to equity holders of the Company. Non-controlling interests in the results of the Group are presented in the consolidated income statement and consolidated statement of comprehensive income as an allocation of the total profit for the year and total comprehensive income for the year between non-controlling interests and equity holders of the Company.
Changes in the Group’s interests in a subsidiary that do not result in a loss of control are accounted for as equity transactions, whereby adjustments are made to the amounts of controlling and non-controlling interests within consolidated equity to reflect the change in relative interests, but no adjustments are made to goodwill and no gain or loss is recognized.
— 39 —
284502 \ (Samsonite_Luxembourg) \ 19/04/2016 \ M38 / Size (210x297)
Notes to the Consolidated Financial Statements (cont.)
3. Summary of Significant Accounting Policies (cont.)
(a) Principles of Consolidation (cont.)
(ii) Non-controlling Interests (cont.)
When the Group loses control of a subsidiary, it is accounted for as a disposal of the entire interest in that subsidiary, with the resulting gain or loss being recognized in profit or loss. Any interest retained in that former subsidiary at the date when control is lost is recognized at fair value and this amount is regarded as the fair value on initial recognition of a financial asset or an associate.
(iii) Business Combinations
Business combinations are accounted for using the acquisition method at the acquisition date, which is the date on which control is obtained by the Group. In assessing control, the Group takes into consideration substantive potential voting rights.
The Group measures goodwill at the acquisition date as the excess of the aggregate of the fair value of the consideration transferred, the amount of any non-controlling interests in the acquiree and the fair value of the Group’s previously held equity interest in the acquiree, over the Group’s interest in the net fair value of the acquiree’s identifiable assets and liabilities measured at the acquisition date. If the net fair value is greater than the consideration transferred, then this excess is recognized immediately in profit or loss as a gain on a bargain purchase.
The consideration transferred does not include amounts related to the settlement of pre-existing relationships. Such amounts generally are recognized in profit or loss.
Transaction costs, other than those associated with the issue of debt or equity securities, that the Group incurs in connection with a business combination are expensed as incurred.
Any contingent consideration payable is measured at fair value at the acquisition date. If the contingent consideration is classified as equity, then it is not remeasured and settlement is accounted for within equity. Otherwise, subsequent changes in the fair value of the contingent consideration are recognized in profit or loss.
When share-based payment awards (“replacement awards”) are required to be exchanged for awards held by the acquiree’s employees (“acquiree’s awards”) and relate to past services, then all or a portion of the amount of the acquirer’s replacement awards is included in measuring consideration transferred in the business combination. This determination is based on the market-based value of the replacement awards compared with the market-based value of the acquiree’s awards and the extent to which the replacement awards relate to past and/or future service.
— 40 —
284502 \ (Samsonite_Luxembourg) \ 19/04/2016 \ M38 / Size (210x297)
Notes to the Consolidated Financial Statements (cont.)
3. Summary of Significant Accounting Policies (cont.)
(b) Foreign Currency Translation and Exchange Risk
(i) Foreign Currency Transactions
Foreign currency transactions are translated using foreign exchange rates prevailing at the dates of the transactions. Monetary assets and liabilities denominated in foreign currencies at the reporting date are retranslated to the functional currency at the exchange rate at that date. Foreign currency differences arising on retranslation are recognized in profit or loss, except for differences arising on the retranslation of qualifying cash flow hedges, which are recognized in other comprehensive income. The foreign currency gain or loss on monetary items is the difference between amortized cost in the functional currency at the beginning of the period, adjusted for effective interest and payments during the period, and the amortized cost in foreign currency translated at the exchange rate at the end of the reporting period. Non-monetary assets and liabilities denominated in foreign currencies that are measured at fair value are retranslated to the functional currency at the exchange rate at the date that the fair value was determined. Non-monetary items that are measured in terms of historical cost in a foreign currency are translated using the exchange rate at the date of the transaction.
(ii) Foreign Operations
The assets and liabilities of the Group’s foreign subsidiaries are translated into USD at period end exchange rates. Equity accounts denominated in foreign currencies are translated into USD at historical exchange rates. Income and expense accounts are translated at average monthly exchange rates. All foreign currency differences arising from the translation of the financial statements of foreign operations are recorded in the foreign currency translation reserve in the consolidated statement of position. The net exchange gains or losses resulting from translating at varied exchange rates are recorded as a component of other comprehensive income and accumulated in equity and attributed to non-controlling interests, as appropriate.
(c) Segment Reporting
An operating segment is a component of the Group that engages in business activities from which it may earn revenues and incur expenses, including revenues and expenses that relate to transactions with any of the Group’s other components. All operating segments’ operating results are reviewed regularly by the Group’s management to make decisions about resources to be allocated to the segment and assess its performance, and for which discrete financial information is available.
The Group’s segment reporting is based on geographical areas, representative of how the Group’s business is managed and its operating results are evaluated. The Group’s operations are organized as follows; (i) “Asia”; (ii) “North America”; (iii) “Europe”; (iv) “Latin America”, and (v) “Corporate”, which are set out in note 4.
Segment results that are reported to management include items directly attributable to a segment as well as those that can be allocated on a reasonable basis. Unallocated items comprise mainly corporate assets, head office expenses, income tax assets and liabilities, and licensing activities from the license of brand names owned by the Group.
— 41 —
284502 \ (Samsonite_Luxembourg) \ 19/04/2016 \ M38 / Size (210x297)
Notes to the Consolidated Financial Statements (cont.)
3. Summary of Significant Accounting Policies (cont.)
(c) Segment Reporting (cont.)
Segment capital expenditure is the total cost incurred during the period to acquire property, plant and equipment.
(d) Property, Plant and Equipment
Items of property, plant and equipment are measured at cost less accumulated depreciation and accumulated impairment losses. Cost includes expenditures that are directly attributable to the acquisition of the asset. Assets under finance leases are stated at the present value of the future minimum lease payments. Improvements which extend the life of an asset are capitalized. Maintenance and repair costs are expensed as incurred.
When parts of an item of property, plant and equipment have different useful lives, they are accounted for as separate items (major components).
Gains and losses arising from the retirement or disposal of an item of property, plant and equipment are determined by comparing the proceeds from disposal with the carrying amount of property, plant and equipment, and are recognized in profit or loss on the date of retirement or disposal.
Depreciation and amortization are provided on the straight-line method over the estimated useful life of the asset or the lease term, if applicable, as follows:
• Buildings 20 to 30 years
• Machinery, equipment and other 3 to 10 years
• Leasehold improvements Lesser of useful life or the lease term
Depreciation methods, useful lives and residual values are reviewed annually and adjusted if appropriate. Land owned by the Group with freehold interest is not depreciated.
The Group capitalizes the costs of purchased software and costs to configure, install and test software and includes these costs within machinery, equipment and other in the consolidated statement of financial position. Software assessment and evaluation, process reengineering, data conversion, training, maintenance and ongoing software support costs are expensed as incurred.
(e) Goodwill and Other Intangible Assets
(i) Goodwill
Goodwill that arises upon the acquisition of a business is included in intangible assets. For measurement of goodwill at initial recognition, see note 3(a)(iii). Subsequent to initial recognition, goodwill is stated at cost less accumulated impairment losses. Goodwill arising on a business combination is allocated to each cash-generating unit (“CGU”), or groups of CGUs, which are expected to benefit from the synergies of the combination and are tested annually for impairment (see note 7).
— 42 —
284502 \ (Samsonite_Luxembourg) \ 19/04/2016 \ M38 / Size (210x297)
Notes to the Consolidated Financial Statements (cont.)
3. Summary of Significant Accounting Policies (cont.)
(e) Goodwill and Other Intangible Assets (cont.)
(ii) Intangible Assets (other than Goodwill)
Intangible assets primarily consist of tradenames, customer relationships, patents and key money. No recognized intangible assets have been generated internally.
Intangible assets which are considered to have an indefinite life, such as tradenames, are measured at cost less accumulated impairment losses and are not amortized but are tested for impairment at least annually or more frequently if events or circumstances indicate that the asset may be impaired. Samsonite®, American Tourister®, Hartmann®, High Sierra®, Gregory®, Speck® and Lipault® are the significant tradenames of the Group. It is anticipated that the economic benefits associated with these tradenames will continue for an indefinite period. The conclusion that the tradenames are an indefinite lived asset is reviewed annually to determine whether events and circumstances continue to support the indefinite useful life assessment for that asset. If they do not, the change in the useful life assessment from indefinite to finite is accounted for prospectively from the date of change and in accordance with the policy for amortization of intangible assets with finite lives as set out below.
Intangible assets which have a finite life are amortized and measured at cost less accumulated amortization and accumulated impairment losses. Amortization expense is recognized in profit or loss on a straight-line basis over the estimated useful lives from the date that they are available for use, as this most closely reflects the expected pattern of consumption of the future economic benefits embodied in the assets. The estimated useful lives are as follows:
• Customer relationships 10 to 20 years• Key money 3 to 10 years• Patents 1 to 10 years
Intangible assets having a finite life are reviewed for impairment whenever events or changes in circumstances indicate that the carrying amount of an asset may not be recoverable. Estimated useful lives of intangible assets are reviewed annually and adjusted if applicable.
(f) Impairment
(i) Financial Assets (Including Trade and Other Receivables)
A financial asset not carried at fair value through profit or loss is assessed at each reporting date to determine whether there is objective evidence that it is impaired. A financial asset is impaired if objective evidence indicates that a loss event has occurred after the initial recognition of the asset, and that the loss event had a negative effect on the estimated future cash flows of that asset that can be estimated reliably.
Objective evidence that financial assets are impaired can include default or delinquency by a debtor, restructuring of an amount due to the Group on terms that the Group would not consider otherwise, or indications that a debtor or issuer will enter bankruptcy.
— 43 —
284502 \ (Samsonite_Luxembourg) \ 19/04/2016 \ M38 / Size (210x297)
Notes to the Consolidated Financial Statements (cont.)
3. Summary of Significant Accounting Policies (cont.)
(f) Impairment (cont.)
(i) Financial Assets (Including Trade and Other Receivables) (cont.)
The Group considers evidence of impairment for receivables at both a specific asset and collective level. All individually significant receivables are assessed for specific impairment. All individually significant receivables found not to be specifically impaired are then collectively assessed for any impairment that has been incurred but not yet identified.
In assessing collective impairment, the Group uses historical trends, adjusted for management’s judgment as to whether current economic and credit conditions are such that the actual losses are likely to be greater or less than suggested by historical trends. Impairment losses that have been recognized in prior periods are assessed at each reporting date for any indications that the loss has decreased or no longer exists. An impairment loss is reversed if there has been a change in the estimates used to determine the recoverable amount.
(ii) Non-financial Assets
The carrying amounts of the Group’s non-financial assets, other than inventories and deferred tax assets are reviewed at each reporting date to determine whether there is any indication of impairment. If any such indication exists, then the asset’s recoverable amount is estimated. For those CGUs or group of CGUs to which goodwill has been allocated and intangible assets that have indefinite useful lives, the recoverable amount is estimated each year at the same time.
The recoverable amount of an asset or CGU is the greater of its value in use and its fair value less costs to sell. In assessing value in use, the estimated future cash flows are discounted to their present value using an appropriate discount rate that reflects current market assessments of the time value of money and the risks specific to the asset. For the purpose of impairment testing, assets that cannot be tested individually are grouped together into the smallest group of assets that generate cash inflows from continuing use that are largely independent of the cash inflows of other assets or groups of assets (the “CGU”). For the purposes of goodwill impairment testing, goodwill acquired in a business combination is allocated to the group of CGUs that is expected to benefit from the synergies of the combination. This allocation is subject to an operating segment before aggregation ceiling test and reflects the lowest level at which that goodwill is monitored for internal reporting purposes to the asset or CGU.
The Group’s corporate assets do not generate separate cash inflows. If there is an indication that a corporate asset may be impaired, then the recoverable amount is determined for the CGU to which the corporate asset may be allocated.
An impairment loss is recognized if the carrying amount of an asset or its CGU exceeds its estimated recoverable amount. Impairment losses are recognized in profit or loss. Impairment losses recognized in respect of CGUs are allocated first to reduce the carrying amount of any goodwill allocated to the group of units, and then to reduce the carrying amounts of the other assets in the unit (group of units) on a pro rata basis.
— 44 —
284502 \ (Samsonite_Luxembourg) \ 19/04/2016 \ M38 / Size (210x297)
Notes to the Consolidated Financial Statements (cont.)
3. Summary of Significant Accounting Policies (cont.)
(f) Impairment (cont.)
(ii) Non-financial Assets (cont.)
An impairment loss that has been recognized on goodwill is not reversed in subsequent periods if estimates used to determine the recoverable amount change. For other assets, impairment losses that have been recognized in prior periods are assessed at each reporting date for any indications that the loss has decreased or no longer exists. An impairment loss is reversed if there has been a change in the estimates used to determine the recoverable amount. An impairment loss is reversed only to the extent that the asset’s carrying amount does not exceed the carrying amount that would have been determined, net of depreciation or amortization, if no impairment loss had been recognized.
(g) Inventories
Inventories are carried at the lower of cost or net realizable value. Cost is calculated using the weighted average method. The cost of inventory includes expenditures incurred in acquiring the inventories, production costs and other costs incurred in bringing them to their existing location and condition. In the case of manufactured inventories and work in progress, cost includes an appropriate share of production overheads based on normal operating capacity. Cost also may include transfers from other comprehensive income of any gain or loss on qualifying cash flow hedges of foreign currency purchases of inventories. Net realizable value is the estimated selling price in the ordinary course of business, less the estimated costs of completion and selling expenses.
When inventories are sold, the carrying amount of those inventories is recognized as an expense in the period in which the related revenue is recognized. The amount of any write-down of inventories to net realizable value and all losses of inventories are recognized as expenses in the period the write-down or loss occurs. The amount of any reversal of any write-down of inventories is recognized as a reduction in the amount of inventories recognized as an expense in the period in which the reversal occurs.
(h) Trade and Other Receivables
The fair value of trade and other receivables is estimated as the present value of future cash flows, discounted at the market rate of interest at the reporting date. This fair value is determined for disclosure purposes and generally approximates carrying value.
(i) Cash and Cash Equivalents
Cash and cash equivalents includes cash held at banks, deposits held at call with banks, and other short-term highly liquid investments that are readily convertible into known amounts of cash and which are subject to an insignificant risk of changes in value, having been within three months of maturity at acquisition.
(j) Trade and Other Payables
Trade and other payables are initially recognized at fair value. Trade and other payables are subsequently measured at amortized cost using the effective interest method.
— 45 —
284502 \ (Samsonite_Luxembourg) \ 19/04/2016 \ M38 / Size (210x297)
Notes to the Consolidated Financial Statements (cont.)
3. Summary of Significant Accounting Policies (cont.)
(k) Interest-bearing Borrowings
Interest-bearing borrowings are recognized initially at fair value less attributable transaction costs. Subsequent to initial recognition, interest-bearing borrowings are stated at amortized cost with any difference between the amount initially recognized and redemption value being recognized in profit or loss over the period of the borrowings, together with any interest and fees payable, using the effective interest method.
(l) Financial Instruments
(i) Non-derivative Financial Assets and Liabilities
The Group initially recognizes receivables and deposits on the date that they are originated.
The Group derecognizes a financial asset when the contractual rights to the cash flows from the asset expire, or it transfers the rights to receive the contractual cash flows on the financial asset in a transaction in which substantially all the risks and rewards of ownership of the financial asset are transferred. Any interest in transferred financial assets that is created or retained by the Group is recognized as a separate asset or liability.
Financial assets and liabilities are offset and the net amount is presented in the consolidated statement of financial position when the Group has a legal right to offset the amounts and intends either to settle on a net basis or to realize the asset and settle the liability simultaneously.
Receivables are non-derivative financial assets with fixed or determinable payments that are not quoted in an active market. Subsequent to initial recognition, receivables are measured at cost, less any impairment losses. Receivables are comprised of trade and other receivables.
The Group initially recognizes debt instruments issued on the date that they are originated. The Group derecognizes a financial liability when its contractual obligations are discharged, canceled or expire.
The Group has the following non-derivative financial liabilities: loans and borrowings and trade and other payables. Both loans and borrowings and trade and other payables are recognized initially at fair value plus any directly attributable transaction costs. Subsequent to their initial recognition, loans and borrowings are accounted for at amortized cost using the effective interest method.
— 46 —
284502 \ (Samsonite_Luxembourg) \ 19/04/2016 \ M38 / Size (210x297)
Notes to the Consolidated Financial Statements (cont.)
3. Summary of Significant Accounting Policies (cont.)
(l) Financial Instruments (cont.)
(ii) Derivative Financial Instruments
The Group holds derivative financial instruments to hedge certain of its foreign currency risk exposures. Embedded derivatives are separated from the host contract and accounted for separately if the economic characteristics and risks of the host contract and the embedded derivative are not closely related, a separate instrument with the same terms as the embedded derivative would meet the definition of a derivative, and the combined instrument is not measured at fair value through profit or loss. For derivatives designated in hedging relationships, changes in the fair value are either offset through profit or loss against the change in fair value of the hedged item attributable to the risk being hedged or recognized in hedging reserves that are reported directly in equity (deficit) until the hedged item is recognized in profit or loss and, at that time, the related hedging gain or loss is removed from equity (deficit) and is used to offset the change in value of the hedged item.
Other than agreements with holders of non-controlling interests, there were no derivatives embedded in host contracts during the periods presented. The Group has certain put option agreements that are classified as financial liabilities in accordance with IAS 32, Financial Instruments: Presentation (“IAS 32”), in the consolidated statement of financial position, as the Group has a potential obligation to settle the option in cash in the future. The amount recognized initially is the fair value of the redeemable non-controlling interests and subsequently remeasured at each reporting date based on a price to earnings multiple discounted to the reporting date. For agreements entered into prior to the adoption of IFRS 3, Business Combinations (“IFRS 3”), on January 1, 2008, subsequent changes in liabilities are recognized in profit or loss. For agreements entered into after January 1, 2008, subsequent changes in liabilities are recognized through equity.
Derivatives are recognized initially at fair value and any attributable transaction costs are recognized in profit or loss as incurred. Subsequent to initial recognition, derivatives are measured at fair value, and changes therein are accounted for as described below.
The Group periodically enters into derivative contracts that it designates as a hedge of a forecasted transaction or the variability of cash flows to be received or paid related to a recognized asset or liability (cash flow hedge). For all hedging relationships, the Group formally documents the hedging relationship and its risk management objective and strategy for undertaking the hedge, the hedging instrument, the hedged item, the nature of the risk being hedged, how the hedging instrument’s effectiveness in offsetting the hedged risk will be assessed prospectively and retrospectively, and a description of the method of measuring ineffectiveness. The Group also formally assesses, both at the hedge’s inception and on an ongoing basis, whether the derivatives that are used in hedging transactions are highly effective in offsetting cash flows of hedged items by determining whether the actual results of each hedge are within a range of 80% to 125%. For derivative instruments that are designated and qualify as a cash flow hedge, the effective portion of the gain or loss on the derivative is reported as a component of other comprehensive income and reclassified into profit or loss in the same period or periods during which the hedged transaction affects profit or loss. Gains and losses on the derivative representing hedge ineffectiveness are excluded from the assessment of effectiveness and are recognized in current profit or loss.
— 47 —
284502 \ (Samsonite_Luxembourg) \ 19/04/2016 \ M38 / Size (210x297)
Notes to the Consolidated Financial Statements (cont.)
3. Summary of Significant Accounting Policies (cont.)
(l) Financial Instruments (cont.)
(ii) Derivative Financial Instruments (cont.)
The Group discontinues hedge accounting prospectively when it determines that the derivative is no longer effective in offsetting cash flows of the hedged item, the derivative expires or is sold, terminated, or exercised, the derivative is de-designated as a hedging instrument because it is unlikely that a forecasted transaction will occur, or management determines that designation of the derivative as a hedging instrument is no longer appropriate.
When a derivative financial instrument is not held for trading, and is not designated in a qualified hedging relationship, all changes in fair value are recognized immediately through profit or loss.
(iii) Share Capital
Ordinary shares are classified as equity. Incremental costs directly attributable to the issue of ordinary shares are recognized as a deduction from equity, net of any tax effects.
(m) Employee Benefits
(i) Defined Contribution Plans
A defined contribution plan is a post-employment benefit plan under which an entity pays fixed contributions into a separate entity and will have no legal or constructive obligation to pay further amounts. Obligations for contributions to defined contribution pension plans are recognized as an employee benefit expense in profit or loss in the periods during which services are rendered by employees.
(ii) Defined Benefit Plans
A defined benefit plan is a post-employment benefit plan other than a defined contribution plan. The Group’s net obligation in respect of defined benefit pension plans is calculated separately for each plan by estimating the amount of future benefit that employees have earned in return for their service in the current and prior periods; that benefit is discounted to determine its present value. Any unrecognized past service costs and the fair value of any plan assets are deducted. The discount rate is based on a high grade bond yield curve under which the benefits were projected and discounted at spot rates along the curve. The discount rate was then determined as a single rate yielding the same present value. IAS 19, Employee Benefits (“IAS19”) limits the measurement of the defined benefit asset to the lower of the surplus in the defined benefit plan and the asset ceiling, which is defined as the present value of any economic benefits available in the form of refunds from the plan or redirections in future contributions to the plan. In order to calculate the present value of economic benefits, consideration is given to any minimum funding requirements that apply to any plan in the Group. An economic benefit is available to the Group if it is realizable during the life of the plan, or on settlement of the plan liabilities.
— 48 —
284502 \ (Samsonite_Luxembourg) \ 19/04/2016 \ M38 / Size (210x297)
Notes to the Consolidated Financial Statements (cont.)
3. Summary of Significant Accounting Policies (cont.)
(m) Employee Benefits (cont.)
(ii) Defined Benefit Plans (cont.)
Certain subsidiaries of the Group have pension plans and post-retirement health benefit plans which provide retirement benefits for eligible employees, generally measured by length of service, compensation and other factors. The Group follows the recognition, measurement, presentation and disclosure provisions of IAS 19. Under IAS 19, remeasurements, which comprise actuarial gains and losses, the return on plan assets (excluding interest) and the effect of the asset ceiling (if any, excluding interest) are recognized immediately in other comprehensive income and are not subsequently reclassified into profit or loss. The measurement date for all pension and other employee benefit plans is the Group’s fiscal year end.
Under IAS 19, the Group determines the net interest expense (income) for the period on the net defined benefit liability (asset) by applying the discount rate used to measure the defined benefit obligation at the beginning of the annual period to the net defined benefit liability (asset) at the beginning of the annual period. Consequently, the net interest cost on the net defined benefit liability (asset) now comprises:
• Interest cost on the defined benefit obligation;
• Interest income on plan assets; and
• Interest on the effect of asset ceiling.
(iii) Other Long-Term Employee Benefits
The Group’s net obligation in respect of long-term employee benefits other than pension plans is the amount of future benefit that employees have earned in return for their service in the current and prior periods; that benefit is discounted to determine its present value, and the fair value of any related assets is deducted. The discount rate is based on a high grade bond yield curve under which the benefits are projected and discounted at spot rates along the curve. The discount rate is then determined as a single rate yielding the same present value. Any actuarial gains and losses are recognized in other comprehensive income in the period in which they arise. Actuarial valuations are obtained annually at the end of the fiscal year.
(iv) Termination Benefits
Termination benefits are employee benefits provided in exchange for the termination of an employee’s employment as a result of either an entity’s decision to terminate an employee’s employment before the normal retirement date or an employee’s decision to accept an offer of benefits in exchange for the termination of employment.
— 49 —
284502 \ (Samsonite_Luxembourg) \ 19/04/2016 \ M38 / Size (210x297)
Notes to the Consolidated Financial Statements (cont.)
3. Summary of Significant Accounting Policies (cont.)
(m) Employee Benefits (cont.)
(v) Short-Term Employee Benefits
Short-term employee benefit obligations are measured on an undiscounted basis and are expensed as the related service is provided. A liability is recognized for the amount expected to be paid under short-term cash bonus plans if the Group has a present legal or constructive obligation to pay this amount as a result of past service provided by the employee, and the obligation can be estimated reliably.
(vi) Share-based Compensation
The grant-date fair value of equity-settled share-based payment awards granted to employees is recognized as an employee expense, with a corresponding increase in equity, over the period that the employees unconditionally become entitled to the awards. The amount recognized as an expense is adjusted to reflect the number of awards for which the related service and non-market performance conditions are expected to be met, such that the amount ultimately recognized as an expense is based on the number of awards that meet the related service and non-market performance conditions at the vesting date. For equity-settled share-based payment awards with market performance conditions or non-vesting conditions, the grant-date fair value of the share-based payment is measured to reflect such conditions and there is no true-up for differences between expected and actual outcomes.
(n) Income Taxes
Income tax expense comprises current and deferred tax. Current tax and deferred tax are recognized in profit or loss except to the extent that it relates to a business combination, items recognized directly in equity or in other comprehensive income.
Current tax is the expected tax payable or receivable on the taxable income or loss for the year, using tax rates enacted or substantively enacted by the reporting date, and any adjustment to tax payable in respect of previous years.
Deferred tax is recognized in respect of temporary differences between the carrying amounts of assets and liabilities for financial reporting purposes and the amounts used for taxation purposes. Deferred tax is not recognized for the following temporary differences: the initial recognition of assets or liabilities in a transaction that is not a business combination and that affects neither accounting nor taxable profit or loss, and differences relating to investments in subsidiaries to the extent that it is probable that they will not reverse in the foreseeable future. In addition, deferred tax is not recognized for taxable temporary differences arising on the initial recognition of goodwill. Deferred tax is measured at the tax rates that are expected to be applied to temporary differences when they reverse, based on the laws that have been enacted or substantively enacted by the reporting date. Deferred tax assets and liabilities are offset if there is a legally enforceable right to offset current tax liabilities and assets, and they relate to income taxes levied by the same tax authority on the same taxable entity, or on different tax entities, if they intend to settle current tax liabilities and assets on a net basis or their tax assets and liabilities will be realized simultaneously.
— 50 —
284502 \ (Samsonite_Luxembourg) \ 19/04/2016 \ M38 / Size (210x297)
Notes to the Consolidated Financial Statements (cont.)
3. Summary of Significant Accounting Policies (cont.)
(n) Income Taxes (cont.)
A deferred tax asset is recognized for unused tax losses, tax credits and deductible temporary differences, to the extent that it is probable that future taxable profits will be available against which they can be utilized. Deferred tax assets are reviewed at each reporting date and are reduced to the extent that it is no longer probable that the related tax benefit will be realized.
(o) Revenue Recognition
Revenues from wholesale product sales are recognized when (i) evidence of a sales arrangement at a fixed or determinable price exists (usually in the form of a sales order), (ii) collectability is reasonably assured, and (iii) title transfers to the customer. Provisions are made for estimates of markdown allowances, warranties, returns and discounts at the time product sales are recognized. Shipping terms are predominately FOB shipping point (title transfers to the customer at the Group’s shipping location) except in certain Asian countries where title transfers upon delivery to the customer. In all cases, sales are recognized upon transfer of title to customers. Revenues from retail sales are recognized at the point of sale to consumers. Revenue excludes collected sales taxes.
Revenue is measured at the fair value of the consideration received or receivable. Provided that it is probable that the economic benefits will flow to the Group and the revenue and costs, if applicable, can be measured reliably, revenue is recognized in profit or loss.
The Group licenses its brand names to certain third parties. Net sales in the accompanying consolidated income statement include royalties earned on licensing agreements with third parties, for which revenue is earned and recognized when the third party makes a sale of a branded product of the Group.
(p) Cost of Sales, Distribution, Marketing and General and Administrative Expenses
The Group includes the following types of costs in cost of sales: direct product purchase and manufacturing costs, duties, freight, receiving, inspection, internal transfer costs, depreciation and procurement and manufacturing overhead. The impairment of inventories and the reversals of such impairments are included in cost of sales during the period in which they occur.
Distribution expenses are primarily comprised of rent, employee benefits, customer freight, depreciation, amortization, warehousing costs and other selling expenses.
Marketing expenses consist of advertising and promotional activities. Costs for producing media advertising are deferred until the related advertising first appears in print or television media, at which time such costs are expensed. All other advertising costs are expensed as incurred. Cooperative advertising costs associated with customer support programs giving the Group an identifiable advertising benefit equal to at least the amount of the advertising allowance are accrued and charged to marketing expenses when the related revenues are recognized. From time to time, the Group offers various types of incentive arrangements such as cash or payment discounts, rebates or free products. All such incentive arrangements are accrued and reduce reported revenues when incurred.
General and administrative expenses consist of management salaries and benefits, information technology costs, and other costs related to administrative functions and are expensed as incurred.
— 51 —
284502 \ (Samsonite_Luxembourg) \ 19/04/2016 \ M38 / Size (210x297)
Notes to the Consolidated Financial Statements (cont.)
3. Summary of Significant Accounting Policies (cont.)
(q) Finance Income and Costs
Finance income comprises interest income on funds invested and gains on hedging instruments that are recognized in profit or loss. Interest income is recognized as it accrues in profit or loss, using the effective interest method.
Finance costs comprise interest expense on borrowings, unwinding of the discount on provisions, changes in the fair value of put options associated with the Group’s majority-owned subsidiaries, and net gains (losses) on hedging instruments that are recognized in profit or loss. Foreign currency gains and losses are reported on a net basis.
Costs incurred in connection with the issuance of debt instruments are included in the initial measurement of the related financial liabilities in the consolidated statement of financial position. Such costs are amortized as finance costs using the effective interest method over the term of the related debt obligation.
(r) Earnings Per Share
The Group presents basic and diluted earnings per share (“EPS”) data for its ordinary shares. Basic EPS is calculated by dividing the profit or loss attributable to ordinary equity shareholders of the Company by the weighted average number of ordinary shares outstanding for the period, adjusted for any shares held by the Group. Diluted EPS is determined by adjusting the profit or loss attributable to ordinary equity shareholders and the weighted average number of ordinary shares outstanding, adjusted for any shares held by the Group, for the effects of all potentially dilutive ordinary shares, which comprise share options granted to employees, as applicable.
(s) Leases
An arrangement, comprising a transaction or a series of transactions, is or contains a lease if the Group determines that the arrangement conveys a right to use a specific asset or assets for an agreed period of time in return for a payment or a series of payments. Such a determination is made based on an evaluation of the substance of the arrangement and is regardless of whether the arrangement takes the legal form of a lease.
Leases in which the Group assumes substantially all the risks and rewards of ownership are classified as finance leases. Upon initial recognition, the leased asset is measured at an amount equal to the lower of its fair value and the present value of the minimum lease payments. Subsequent to initial recognition, the asset is accounted for in accordance with the accounting policy applicable to that asset. Other leases are operating leases and the leased assets are not recognized in the Group’s consolidated statement of financial position.
The Group leases retail stores, distribution centers and office facilities. Initial terms of the leases range from one to twenty years. Most leases provide for monthly fixed minimum rentals or contingent rentals based upon sales in excess of stated amounts and normally require the Group to pay real estate taxes, insurance, common area maintenance costs and other occupancy costs. The Group recognizes rent expense for leases that include scheduled and specified escalations of the minimum rent on a straight-line basis over the base term of the lease. Any difference between the straight-line rent amount and the amount payable under the lease is included in other liabilities in the consolidated statement of financial position. Contingent rental payments are expensed as incurred.
— 52 —
284502 \ (Samsonite_Luxembourg) \ 19/04/2016 \ M38 / Size (210x297)
Notes to the Consolidated Financial Statements (cont.)
3. Summary of Significant Accounting Policies (cont.)
(s) Leases (cont.)
Minimum lease payments made under finance leases are apportioned between the finance expense and the reduction of the outstanding liability. The finance expense is allocated to each period during the lease term so as to produce a constant periodic rate of interest on the remaining balance of the liability.
(t) Provisions and Contingent Liabilities
Provisions are recognized for other liabilities of uncertain timing or amount when the Group has a legal or constructive obligation arising as a result of a past event, it is probable that an outflow of economic benefits will be required to settle the obligation and a reliable estimate can be made. Where the time value of money is material, provisions are stated at the present value of the expenditure expected to settle the obligation.
Where it is not probable that an outflow of economic benefits will be required, or the amount cannot be estimated reliably, the obligation is disclosed as a contingent liability, unless the probability of outflow of economic benefits is remote. Possible obligations, whose existence will only be confirmed by the occurrence or non-occurrence of one or more future events, are also disclosed as contingent liabilities unless the probability of outflow of economic benefits is remote.
(u) Related Parties
(i) A person, or a close member of that person’s family, is related to the Group if that person:
(1) has control or joint control over the Group;
(2) has significant influence over the Group; or
(3) is a member of the key management personnel of the Group.
(ii) An entity is related to the Group if any of the following conditions apply:
(1) the entity and the Group are members of the same group (which means that each parent, the subsidiary and fellow subsidiary is related to the others);
(2) one entity is an associate or joint venture of the other entity (or an associate or joint venture of a member of a group of which the other entity is a member);
(3) both entities are joint ventures of the same third party;
(4) one entity is a joint venture of a third entity and the other entity is an associate of the third entity;
(5) the entity is a post-employment benefit plan for the benefit of employees of either the Group or an entity related to the Group;
(6) the entity is controlled or jointly controlled by a person identified in (i);

— 53 —
284502 \ (Samsonite_Luxembourg) \ 19/04/2016 \ M38 / Size (210x297)
Notes to the Consolidated Financial Statements (cont.)
3. Summary of Significant Accounting Policies (cont.)
(u) Related Parties (cont.)
(ii) An entity is related to the Group if any of the following conditions apply: (cont.)
(7) a person identified in (i)(1) has significant influence over the entity or is a member of the key management personnel of the entity (or of a parent of the entity); or
(8) the entity, or any member of a group of which it is part, provides key management services to the Group or to the Group’s parent.
Close members of the family of a person are those family members who may be expected to influence, or be influenced by, that person in their dealings with the entity.
(v) New Standards and Interpretations
Certain new standards, amendments to standards and interpretations are not yet effective for the year ended December 31, 2015, and have not been applied in preparing these consolidated financial statements.
In July 2014, the IASB issued the final element of its comprehensive response to the financial crisis by issuing IFRS 9, Financial Instruments (“IFRS 9”). The improvements introduced by IFRS 9 include a logical model for classification and measurement, a single forward-looking expected loss impairment model and a substantially reformed approach to hedge accounting. IFRS 9 will come into effect on January 1, 2018 with early application permitted. The Group has not determined the extent of the impact on its consolidated financial statements.
In May 2014, the IASB issued IFRS 15, Revenue from Contracts with Customers (“IFRS 15”). IFRS 15 sets out requirements for recognizing revenue that applies to all contracts with customers. IFRS 15 is effective as of January 1, 2018 with earlier application permitted. The Group has not determined the extent of the impact on its consolidated financial statements.
In January 2016, the IASB issued IFRS 16, Leases (“IFRS 16”) which, once adopted, replaces the existing standard IAS 17, Leases. IFRS 16 will provide much-needed transparency on companies’ lease assets and liabilities, meaning that off balance sheet lease financing generally is no longer possible and therefore also will improve comparability between companies that lease and those that borrow to buy. IFRS 16 is effective January 1, 2019. Early application is permitted for companies that also adopt IFRS 15, Revenue from Contracts with Customers. The Group has not yet determined the extent of the impact on its consolidated financial statements.
— 54 —
284502 \ (Samsonite_Luxembourg) \ 19/04/2016 \ M38 / Size (210x297)
Notes to the Consolidated Financial Statements (cont.)
4. Segment Reporting
(a) Operating Segments
Management of the business and evaluation of operating results is organized primarily along geographic lines dividing responsibility for the Group’s operations, besides the Corporate segment, as follows:
• Asia — includes operations in South Asia (India and Middle East), China, Singapore, South Korea, Taiwan, Malaysia, Japan, Hong Kong, Thailand, Indonesia, Philippines and Australia;
• North America — includes operations in the United States of America and Canada;
• Europe — includes operations in European countries as well as South Africa;
• Latin America — includes operations in Chile, Mexico, Argentina, Brazil, Colombia, Panama, Peru and Uruguay; and
• Corporate — primarily includes certain licensing activities from brand names owned by the Group and Corporate headquarters overhead.
Information regarding the results of each reportable segment is included below. Performance is measured based on segment operating profit or loss, as included in the internal management reports that are reviewed by the Chief Operating Decision Maker. Segment operating profit or loss is used to measure performance as management believes that such information is the most relevant in evaluating the results of the Group’s segments.
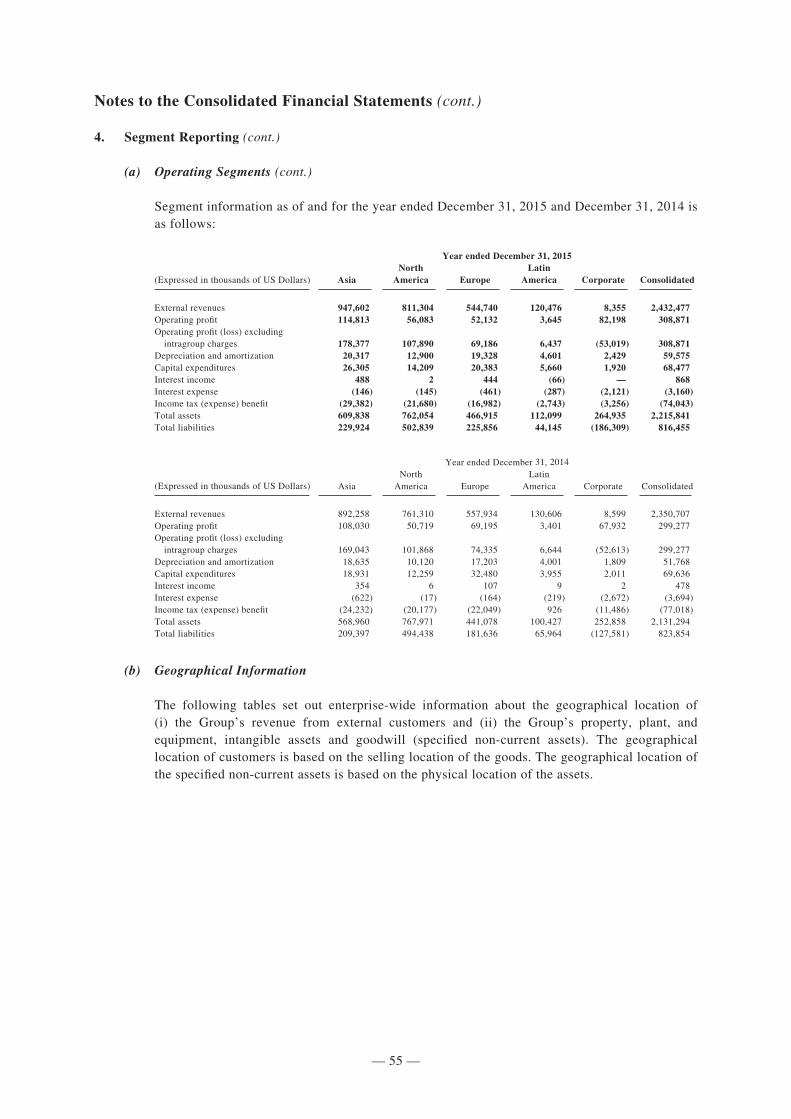
— 55 —
284502 \ (Samsonite_Luxembourg) \ 19/04/2016 \ M38 / Size (210x297)
Notes to the Consolidated Financial Statements (cont.)
4. Segment Reporting (cont.)
(a) Operating Segments (cont.)
Segment information as of and for the year ended December 31, 2015 and December 31, 2014 is as follows:
Year ended December 31, 2015
(Expressed in thousands of US Dollars) AsiaNorth
America EuropeLatin
America Corporate Consolidated
External revenues 947,602 811,304 544,740 120,476 8,355 2,432,477Operating profit 114,813 56,083 52,132 3,645 82,198 308,871Operating profit (loss) excluding intragroup charges 178,377 107,890 69,186 6,437 (53,019) 308,871Depreciation and amortization 20,317 12,900 19,328 4,601 2,429 59,575Capital expenditures 26,305 14,209 20,383 5,660 1,920 68,477Interest income 488 2 444 (66) — 868Interest expense (146) (145) (461) (287) (2,121) (3,160)Income tax (expense) benefit (29,382) (21,680) (16,982) (2,743) (3,256) (74,043)Total assets 609,838 762,054 466,915 112,099 264,935 2,215,841Total liabilities 229,924 502,839 225,856 44,145 (186,309) 816,455
Year ended December 31, 2014
(Expressed in thousands of US Dollars) AsiaNorth
America EuropeLatin
America Corporate Consolidated
External revenues 892,258 761,310 557,934 130,606 8,599 2,350,707Operating profit 108,030 50,719 69,195 3,401 67,932 299,277Operating profit (loss) excluding intragroup charges 169,043 101,868 74,335 6,644 (52,613) 299,277Depreciation and amortization 18,635 10,120 17,203 4,001 1,809 51,768Capital expenditures 18,931 12,259 32,480 3,955 2,011 69,636Interest income 354 6 107 9 2 478Interest expense (622) (17) (164) (219) (2,672) (3,694)Income tax (expense) benefit (24,232) (20,177) (22,049) 926 (11,486) (77,018)Total assets 568,960 767,971 441,078 100,427 252,858 2,131,294Total liabilities 209,397 494,438 181,636 65,964 (127,581) 823,854
(b) Geographical Information
The following tables set out enterprise-wide information about the geographical location of (i) the Group’s revenue from external customers and (ii) the Group’s property, plant, and equipment, intangible assets and goodwill (specified non-current assets). The geographical location of customers is based on the selling location of the goods. The geographical location of the specified non-current assets is based on the physical location of the assets.
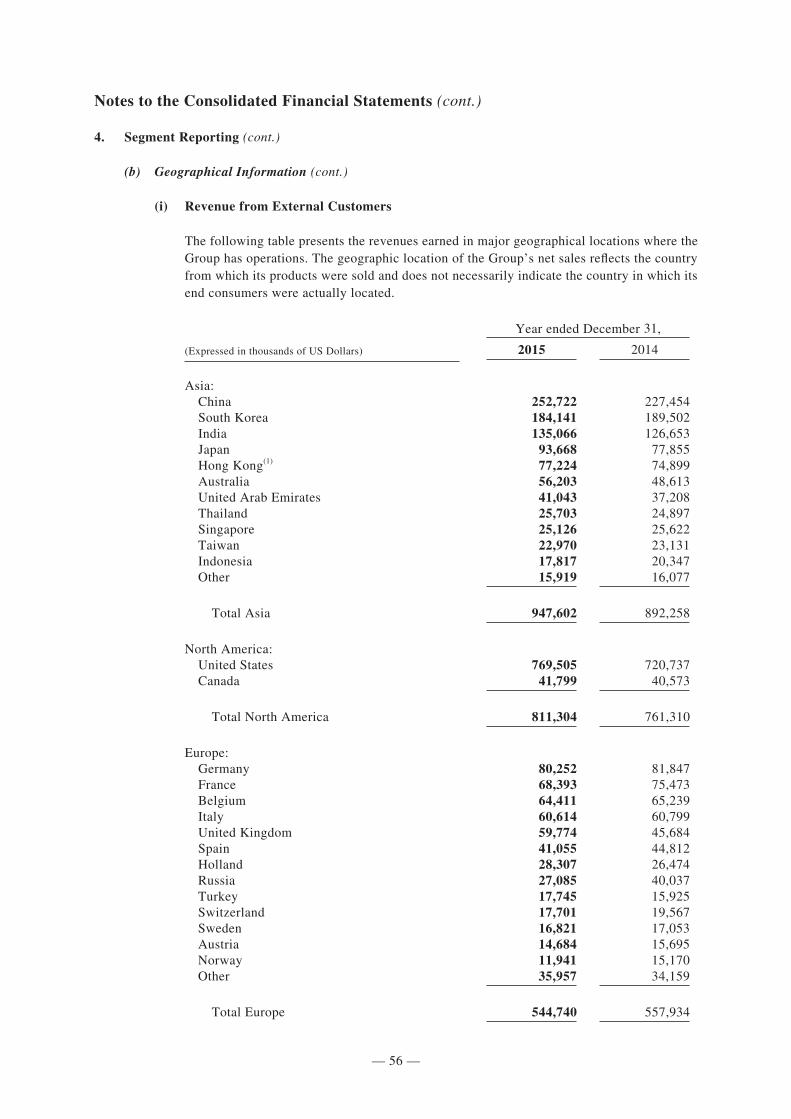
— 56 —
284502 \ (Samsonite_Luxembourg) \ 19/04/2016 \ M38 / Size (210x297)
Notes to the Consolidated Financial Statements (cont.)
4. Segment Reporting (cont.)
(b) Geographical Information (cont.)
(i) Revenue from External Customers
The following table presents the revenues earned in major geographical locations where the Group has operations. The geographic location of the Group’s net sales reflects the country from which its products were sold and does not necessarily indicate the country in which its end consumers were actually located.
Year ended December 31,
(Expressed in thousands of US Dollars) 2015 2014
Asia: China 252,722 227,454 South Korea 184,141 189,502 India 135,066 126,653 Japan 93,668 77,855 Hong Kong(1) 77,224 74,899 Australia 56,203 48,613 United Arab Emirates 41,043 37,208 Thailand 25,703 24,897 Singapore 25,126 25,622 Taiwan 22,970 23,131 Indonesia 17,817 20,347 Other 15,919 16,077
Total Asia 947,602 892,258
North America: United States 769,505 720,737 Canada 41,799 40,573
Total North America 811,304 761,310
Europe: Germany 80,252 81,847 France 68,393 75,473 Belgium 64,411 65,239 Italy 60,614 60,799 United Kingdom 59,774 45,684 Spain 41,055 44,812 Holland 28,307 26,474 Russia 27,085 40,037 Turkey 17,745 15,925 Switzerland 17,701 19,567 Sweden 16,821 17,053 Austria 14,684 15,695 Norway 11,941 15,170 Other 35,957 34,159
Total Europe 544,740 557,934
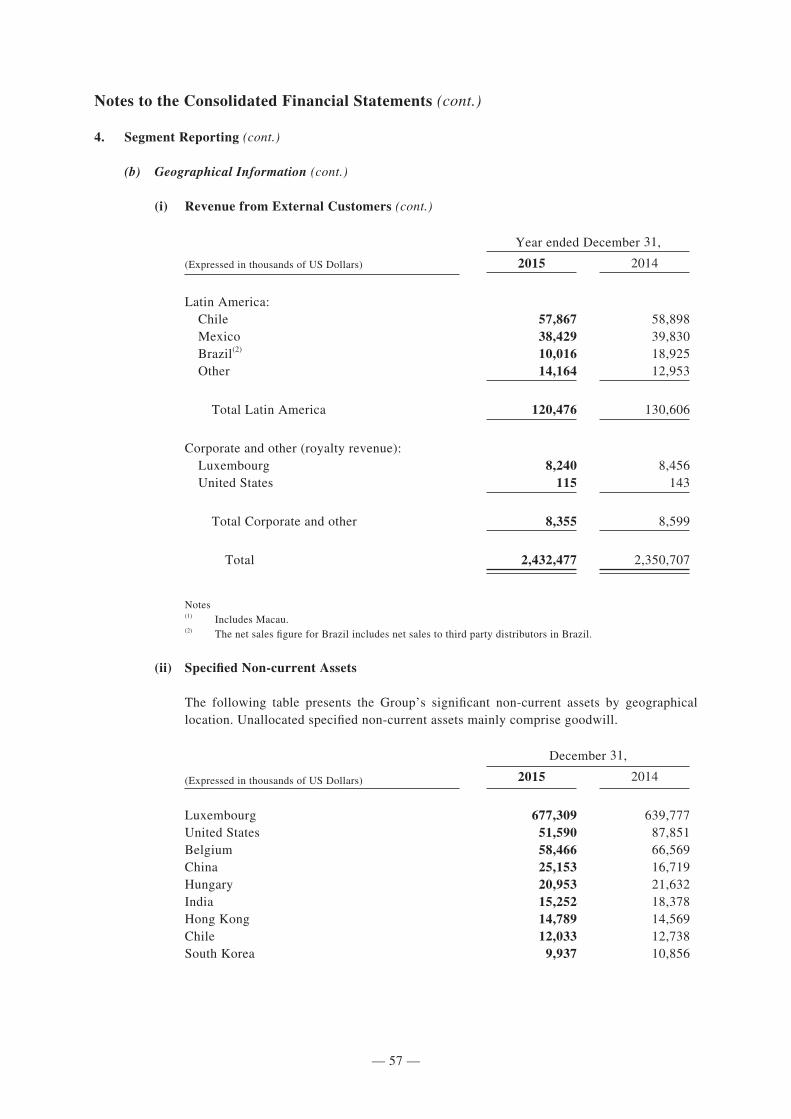
— 57 —
284502 \ (Samsonite_Luxembourg) \ 19/04/2016 \ M38 / Size (210x297)
Notes to the Consolidated Financial Statements (cont.)
4. Segment Reporting (cont.)
(b) Geographical Information (cont.)
(i) Revenue from External Customers (cont.)
Year ended December 31,
(Expressed in thousands of US Dollars) 2015 2014
Latin America: Chile 57,867 58,898 Mexico 38,429 39,830 Brazil(2) 10,016 18,925 Other 14,164 12,953
Total Latin America 120,476 130,606
Corporate and other (royalty revenue): Luxembourg 8,240 8,456 United States 115 143
Total Corporate and other 8,355 8,599
Total 2,432,477 2,350,707
Notes(1) Includes Macau.(2) The net sales figure for Brazil includes net sales to third party distributors in Brazil.
(ii) Specified Non-current Assets
The following table presents the Group’s significant non-current assets by geographical location. Unallocated specified non-current assets mainly comprise goodwill.
December 31,
(Expressed in thousands of US Dollars) 2015 2014
Luxembourg 677,309 639,777United States 51,590 87,851Belgium 58,466 66,569China 25,153 16,719Hungary 20,953 21,632India 15,252 18,378Hong Kong 14,789 14,569Chile 12,033 12,738South Korea 9,937 10,856
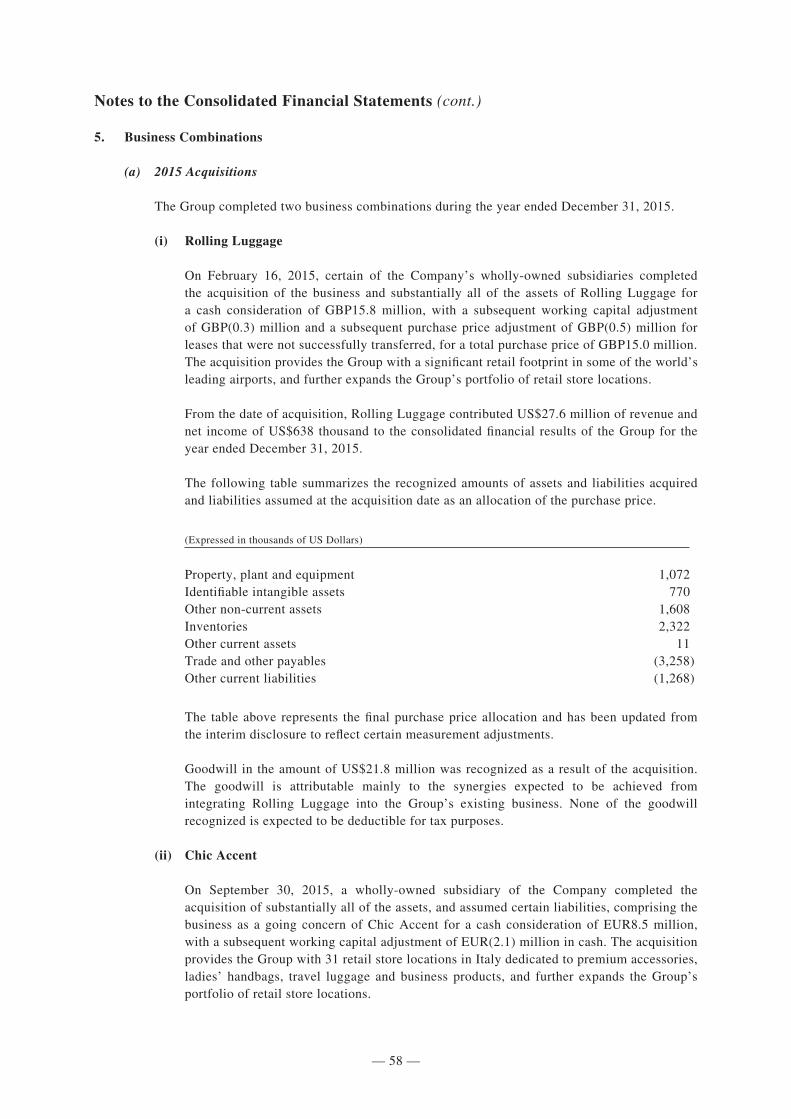
— 58 —
284502 \ (Samsonite_Luxembourg) \ 19/04/2016 \ M38 / Size (210x297)
Notes to the Consolidated Financial Statements (cont.)
5. Business Combinations
(a) 2015 Acquisitions
The Group completed two business combinations during the year ended December 31, 2015.
(i) Rolling Luggage
On February 16, 2015, certain of the Company’s wholly-owned subsidiaries completed the acquisition of the business and substantially all of the assets of Rolling Luggage for a cash consideration of GBP15.8 million, with a subsequent working capital adjustment of GBP(0.3) million and a subsequent purchase price adjustment of GBP(0.5) million for leases that were not successfully transferred, for a total purchase price of GBP15.0 million. The acquisition provides the Group with a significant retail footprint in some of the world’s leading airports, and further expands the Group’s portfolio of retail store locations.
From the date of acquisition, Rolling Luggage contributed US$27.6 million of revenue and net income of US$638 thousand to the consolidated financial results of the Group for the year ended December 31, 2015.
The following table summarizes the recognized amounts of assets and liabilities acquired and liabilities assumed at the acquisition date as an allocation of the purchase price.
(Expressed in thousands of US Dollars)
Property, plant and equipment 1,072Identifiable intangible assets 770Other non-current assets 1,608Inventories 2,322Other current assets 11Trade and other payables (3,258)Other current liabilities (1,268)
The table above represents the final purchase price allocation and has been updated from the interim disclosure to reflect certain measurement adjustments.
Goodwill in the amount of US$21.8 million was recognized as a result of the acquisition. The goodwill is attributable mainly to the synergies expected to be achieved from integrating Rolling Luggage into the Group’s existing business. None of the goodwill recognized is expected to be deductible for tax purposes.
(ii) Chic Accent
On September 30, 2015, a wholly-owned subsidiary of the Company completed the acquisition of substantially all of the assets, and assumed certain liabilities, comprising the business as a going concern of Chic Accent for a cash consideration of EUR8.5 million, with a subsequent working capital adjustment of EUR(2.1) million in cash. The acquisition provides the Group with 31 retail store locations in Italy dedicated to premium accessories, ladies’ handbags, travel luggage and business products, and further expands the Group’s portfolio of retail store locations.
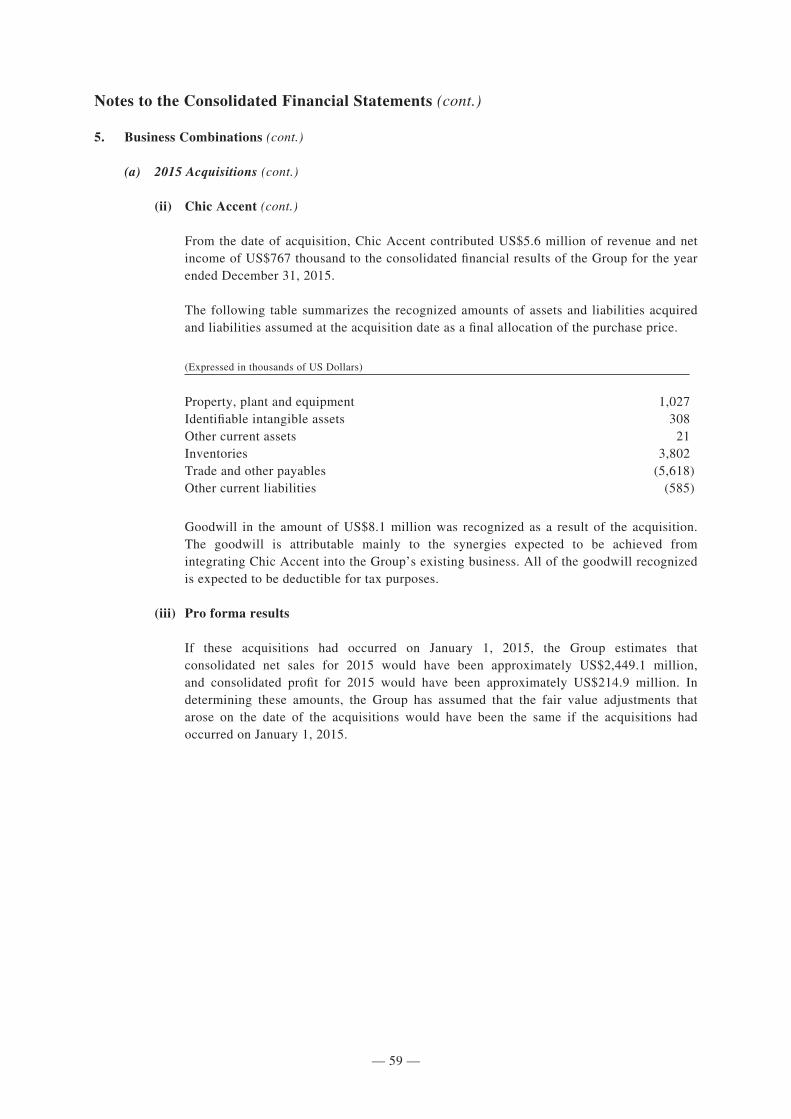
— 59 —
284502 \ (Samsonite_Luxembourg) \ 19/04/2016 \ M38 / Size (210x297)
Notes to the Consolidated Financial Statements (cont.)
5. Business Combinations (cont.)
(a) 2015 Acquisitions (cont.)
(ii) Chic Accent (cont.)
From the date of acquisition, Chic Accent contributed US$5.6 million of revenue and net income of US$767 thousand to the consolidated financial results of the Group for the year ended December 31, 2015.
The following table summarizes the recognized amounts of assets and liabilities acquired and liabilities assumed at the acquisition date as a final allocation of the purchase price.
(Expressed in thousands of US Dollars)
Property, plant and equipment 1,027Identifiable intangible assets 308Other current assets 21Inventories 3,802Trade and other payables (5,618)Other current liabilities (585)
Goodwill in the amount of US$8.1 million was recognized as a result of the acquisition. The goodwill is attributable mainly to the synergies expected to be achieved from integrating Chic Accent into the Group’s existing business. All of the goodwill recognized is expected to be deductible for tax purposes.
(iii) Pro forma results
If these acquisitions had occurred on January 1, 2015, the Group estimates that consolidated net sales for 2015 would have been approximately US$2,449.1 million, and consolidated profit for 2015 would have been approximately US$214.9 million. In determining these amounts, the Group has assumed that the fair value adjustments that arose on the date of the acquisitions would have been the same if the acquisitions had occurred on January 1, 2015.
— 60 —
284502 \ (Samsonite_Luxembourg) \ 19/04/2016 \ M38 / Size (210x297)
Notes to the Consolidated Financial Statements (cont.)
5. Business Combinations (cont.)
(b) 2014 Acquisitions
The Group completed three business combinations during the year ended December 31, 2014.
(i) Lipault
On April 1, 2014, a wholly-owned subsidiary within the Group completed the acquisition of (i) Distri Bagages, a société à responsabilité limitée incorporated and organized under the Laws of France, and (ii) Licences et Développements, a société à responsabilité limitée incorporated and organized under the Laws of France (collectively, the “Lipault Entities”). Lipault is a luggage brand founded in France in 2005, whose products are designed to meet the needs of today’s savvy travelers, featuring ultra-lightweight, smart designs and bright fashion colors and constructed using luxurious but durable nylon twill fabric and that will help the Group engage with the fashionable, female consumers through its signature Parisian style and vibrant colors. The purchase price included a cash consideration of EUR20.0 million, with a subsequent working capital adjustment of EUR0.1 million, for a total purchase price of EUR20.1 million. The allocation of the purchase price was completed in 2014 resulting in goodwill of US$15.8 million, none of which is expected to be deductible for tax purposes. No subsequent adjustments have been made to the amounts recognized for the assets acquired and liabilities assumed that were disclosed in the 2014 Annual Report.
(ii) Speculative Product Design, LLC (“Speck Products”)
On May 28, 2014, a wholly-owned subsidiary within the Group completed the acquisition of Speculative Product Design, LLC (“Speck Products”). Founded in Silicon Valley, California in 2001, Speck Products is a leading designer and distributor of slim protective cases for personal electronic devices that are marketed under the Speck brand. Speck Products offers a diverse product range that is sleek, stylish and functionally innovative, and provides superior, military-grade protection for smartphones, tablets and laptops from a range of manufacturers. The Speck brand is particularly well-known for its “slim protection” designs such as the iconic Candy Shell smartphone case, which is constructed using a “hard-soft” technology that Speck Products pioneered. The purchase price included a cash consideration of US$85.0 million, with a subsequent working capital adjustment of US$0.04 million, for a total purchase price of US$85.0 million. The allocation of the purchase price was completed in 2014 resulting in goodwill of US$22.9 million, of which approximately half is expected to be deductible for tax purposes. No subsequent adjustments have been made to the amounts recognized for the assets acquired and liabilities assumed that were disclosed in the 2014 Annual Report.
(iii) Gregory Mountain Products, LLC (“Gregory”)
On July 23, 2014, certain of the Group’s wholly-owned subsidiaries (the “Samsonite Purchasers”) purchased substantially all of the assets of Gregory Mountain Products, LLC (“Gregory”). The Gregory brand is a leader and pioneer in its industry, responsible for many innovations in backpack design. It is well-respected by active outdoor and adventure enthusiasts as a leading brand in the premium technical backpack segment. In addition to technical backpacks, Gregory branded lifestyle backpacks are popular in Japan and other Asian countries. The purchase price included a cash consideration of US$84.1 million. The allocation of the purchase price was completed in 2014 resulting in goodwill of US$19.0 million, of which approximately half is expected to be deductible for tax purposes. No subsequent adjustments have been made to the amounts recognized for the assets acquired and liabilities assumed that were disclosed in the 2014 Annual Report.
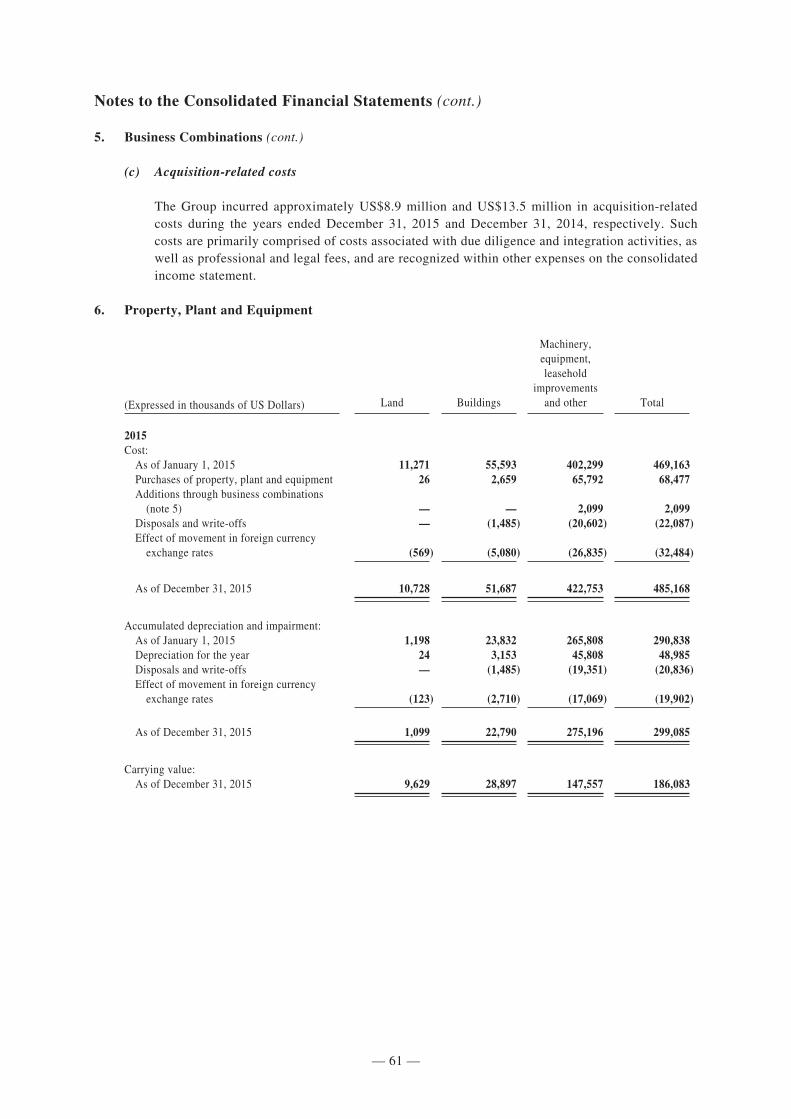
— 61 —
284502 \ (Samsonite_Luxembourg) \ 19/04/2016 \ M38 / Size (210x297)
Notes to the Consolidated Financial Statements (cont.)
5. Business Combinations (cont.)
(c) Acquisition-related costs
The Group incurred approximately US$8.9 million and US$13.5 million in acquisition-related costs during the years ended December 31, 2015 and December 31, 2014, respectively. Such costs are primarily comprised of costs associated with due diligence and integration activities, as well as professional and legal fees, and are recognized within other expenses on the consolidated income statement.
6. Property, Plant and Equipment
(Expressed in thousands of US Dollars) Land Buildings
Machinery, equipment, leasehold
improvements and other Total
2015Cost: As of January 1, 2015 11,271 55,593 402,299 469,163 Purchases of property, plant and equipment 26 2,659 65,792 68,477 Additions through business combinations (note 5) — — 2,099 2,099 Disposals and write-offs — (1,485) (20,602) (22,087) Effect of movement in foreign currency exchange rates (569) (5,080) (26,835) (32,484)
As of December 31, 2015 10,728 51,687 422,753 485,168
Accumulated depreciation and impairment: As of January 1, 2015 1,198 23,832 265,808 290,838 Depreciation for the year 24 3,153 45,808 48,985 Disposals and write-offs — (1,485) (19,351) (20,836) Effect of movement in foreign currency exchange rates (123) (2,710) (17,069) (19,902)
As of December 31, 2015 1,099 22,790 275,196 299,085
Carrying value: As of December 31, 2015 9,629 28,897 147,557 186,083
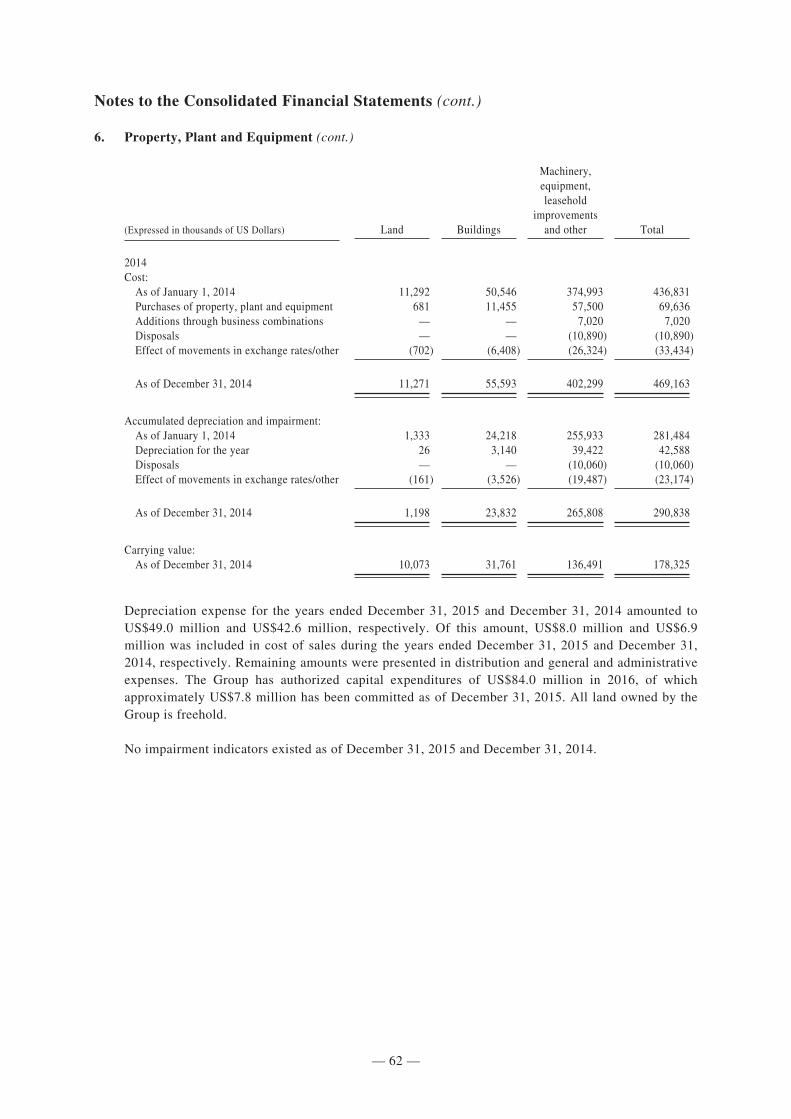
— 62 —
284502 \ (Samsonite_Luxembourg) \ 19/04/2016 \ M38 / Size (210x297)
Notes to the Consolidated Financial Statements (cont.)
6. Property, Plant and Equipment (cont.)
(Expressed in thousands of US Dollars) Land Buildings
Machinery, equipment, leasehold
improvements and other Total
2014Cost: As of January 1, 2014 11,292 50,546 374,993 436,831 Purchases of property, plant and equipment 681 11,455 57,500 69,636 Additions through business combinations — — 7,020 7,020 Disposals — — (10,890) (10,890) Effect of movements in exchange rates/other (702) (6,408) (26,324) (33,434)
As of December 31, 2014 11,271 55,593 402,299 469,163
Accumulated depreciation and impairment: As of January 1, 2014 1,333 24,218 255,933 281,484 Depreciation for the year 26 3,140 39,422 42,588 Disposals — — (10,060) (10,060) Effect of movements in exchange rates/other (161) (3,526) (19,487) (23,174)
As of December 31, 2014 1,198 23,832 265,808 290,838
Carrying value: As of December 31, 2014 10,073 31,761 136,491 178,325
Depreciation expense for the years ended December 31, 2015 and December 31, 2014 amounted to US$49.0 million and US$42.6 million, respectively. Of this amount, US$8.0 million and US$6.9 million was included in cost of sales during the years ended December 31, 2015 and December 31, 2014, respectively. Remaining amounts were presented in distribution and general and administrative expenses. The Group has authorized capital expenditures of US$84.0 million in 2016, of which approximately US$7.8 million has been committed as of December 31, 2015. All land owned by the Group is freehold.
No impairment indicators existed as of December 31, 2015 and December 31, 2014.
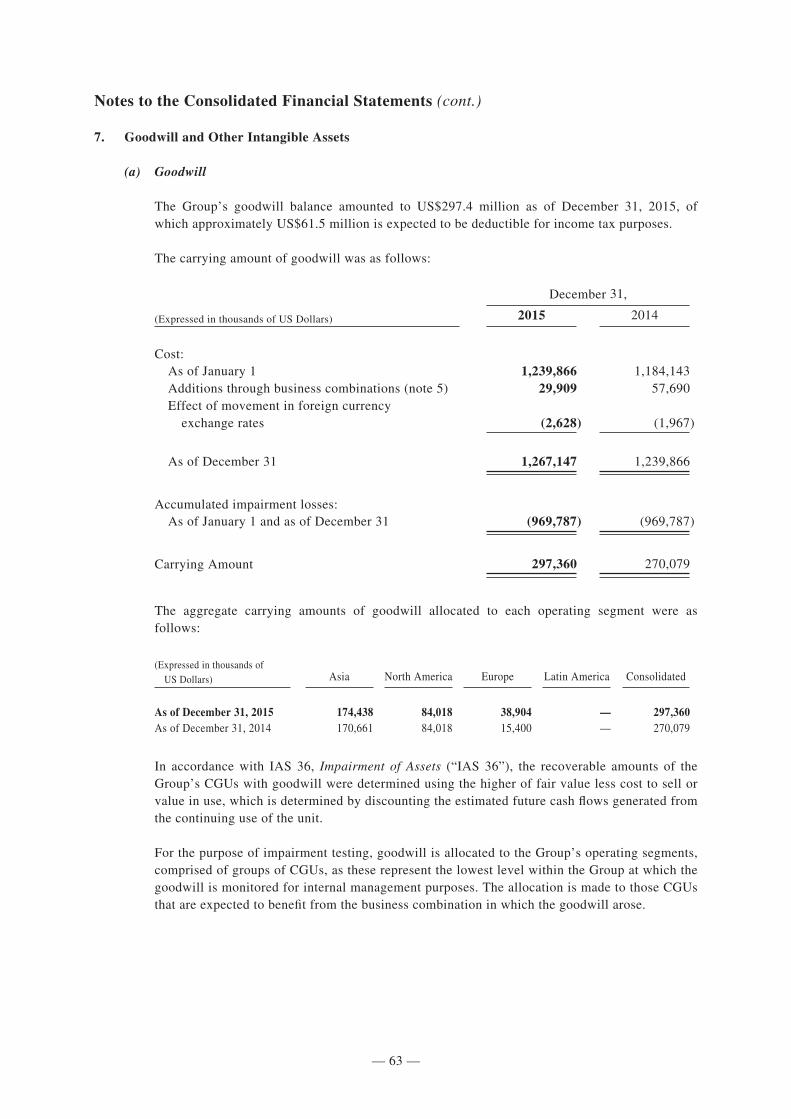
— 63 —
284502 \ (Samsonite_Luxembourg) \ 19/04/2016 \ M38 / Size (210x297)
Notes to the Consolidated Financial Statements (cont.)
7. Goodwill and Other Intangible Assets
(a) Goodwill
The Group’s goodwill balance amounted to US$297.4 million as of December 31, 2015, of which approximately US$61.5 million is expected to be deductible for income tax purposes.
The carrying amount of goodwill was as follows:
December 31,
(Expressed in thousands of US Dollars) 2015 2014
Cost: As of January 1 1,239,866 1,184,143 Additions through business combinations (note 5) 29,909 57,690 Effect of movement in foreign currency exchange rates (2,628) (1,967)
As of December 31 1,267,147 1,239,866
Accumulated impairment losses: As of January 1 and as of December 31 (969,787) (969,787)
Carrying Amount 297,360 270,079
The aggregate carrying amounts of goodwill allocated to each operating segment were as follows:
(Expressed in thousands of US Dollars) Asia North America Europe Latin America Consolidated
As of December 31, 2015 174,438 84,018 38,904 — 297,360As of December 31, 2014 170,661 84,018 15,400 — 270,079
In accordance with IAS 36, Impairment of Assets (“IAS 36”), the recoverable amounts of the Group’s CGUs with goodwill were determined using the higher of fair value less cost to sell or value in use, which is determined by discounting the estimated future cash flows generated from the continuing use of the unit.
For the purpose of impairment testing, goodwill is allocated to the Group’s operating segments, comprised of groups of CGUs, as these represent the lowest level within the Group at which the goodwill is monitored for internal management purposes. The allocation is made to those CGUs that are expected to benefit from the business combination in which the goodwill arose.
— 64 —
284502 \ (Samsonite_Luxembourg) \ 19/04/2016 \ M38 / Size (210x297)
Notes to the Consolidated Financial Statements (cont.)
7. Goodwill and Other Intangible Assets (cont.)
(a) Goodwill (cont.)
Separate calculations are prepared for each of the groups of CGUs that make up the consolidated entity. These calculations use discounted cash flow projections based on financial estimates reviewed by management covering a five-year period. Cash flows beyond the five-year period are extrapolated using estimated growth rates appropriate for the market in which the unit operates. The values assigned to the key assumptions represent management’s assessment of future trends and are based on both external sources and internal sources (historical data) and are summarized below.
• Pre-tax discount rates of 10–12% were used in discounting the projected cash flows. The pre-tax discount rates were calculated for each CGU.
• Segment cash flows were projected based on the historical operating results and the five-year forecasts.
• The terminal values were extrapolated using constant long-term growth rates of 3–4% for each CGU, which is consistent with the average growth rate for the industry.
• The sales prices were assumed to be a constant margin above cost.
Judgment is required to determine key assumptions adopted in the cash flow projections and the changes to key assumptions can significantly affect these cash flow projections. Management has considered the above assumptions and valuation and has also taken into account the business plans going forward. Management believes that any reasonably foreseeable change in any of the above key assumptions would not cause the carrying amount of goodwill to exceed the recoverable amount.
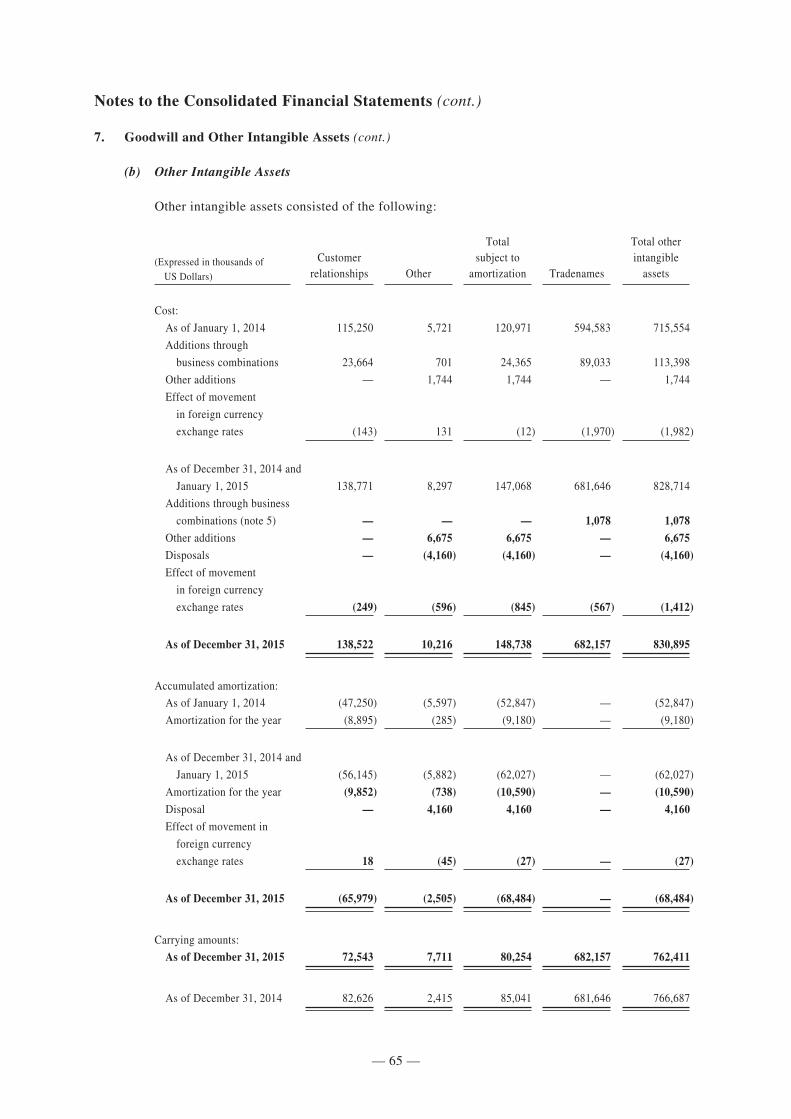
— 65 —
284502 \ (Samsonite_Luxembourg) \ 19/04/2016 \ M38 / Size (210x297)
Notes to the Consolidated Financial Statements (cont.)
7. Goodwill and Other Intangible Assets (cont.)
(b) Other Intangible Assets
Other intangible assets consisted of the following:
(Expressed in thousands of US Dollars)
Customer relationships Other
Total subject to
amortization Tradenames
Total other intangible
assets
Cost:
As of January 1, 2014 115,250 5,721 120,971 594,583 715,554
Additions through
business combinations 23,664 701 24,365 89,033 113,398
Other additions — 1,744 1,744 — 1,744
Effect of movement
in foreign currency
exchange rates (143) 131 (12) (1,970) (1,982)
As of December 31, 2014 and
January 1, 2015 138,771 8,297 147,068 681,646 828,714
Additions through business
combinations (note 5) — — — 1,078 1,078 Other additions — 6,675 6,675 — 6,675 Disposals — (4,160) (4,160) — (4,160) Effect of movement
in foreign currency
exchange rates (249) (596) (845) (567) (1,412)
As of December 31, 2015 138,522 10,216 148,738 682,157 830,895
Accumulated amortization:
As of January 1, 2014 (47,250) (5,597) (52,847) — (52,847)
Amortization for the year (8,895) (285) (9,180) — (9,180)
As of December 31, 2014 and
January 1, 2015 (56,145) (5,882) (62,027) — (62,027)
Amortization for the year (9,852) (738) (10,590) — (10,590) Disposal — 4,160 4,160 — 4,160 Effect of movement in
foreign currency
exchange rates 18 (45) (27) — (27)
As of December 31, 2015 (65,979) (2,505) (68,484) — (68,484)
Carrying amounts:
As of December 31, 2015 72,543 7,711 80,254 682,157 762,411
As of December 31, 2014 82,626 2,415 85,041 681,646 766,687
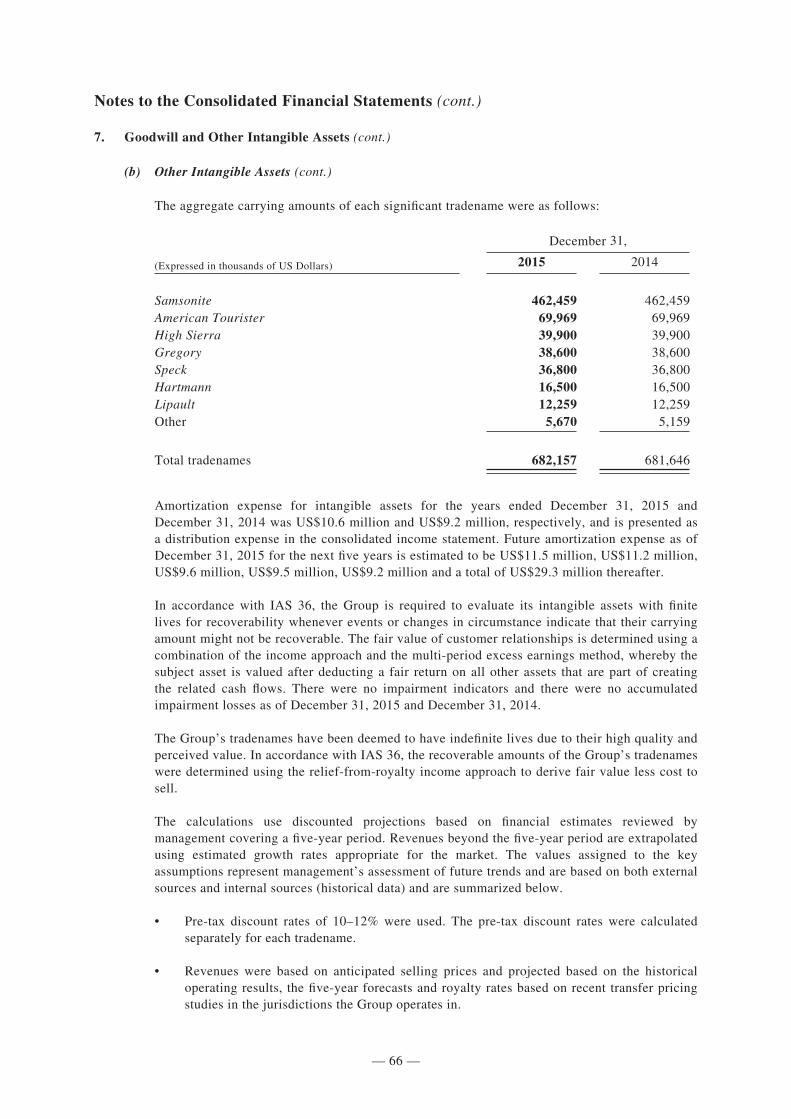
— 66 —
284502 \ (Samsonite_Luxembourg) \ 19/04/2016 \ M38 / Size (210x297)
Notes to the Consolidated Financial Statements (cont.)
7. Goodwill and Other Intangible Assets (cont.)
(b) Other Intangible Assets (cont.)
The aggregate carrying amounts of each significant tradename were as follows:
December 31,
(Expressed in thousands of US Dollars) 2015 2014
Samsonite 462,459 462,459American Tourister 69,969 69,969High Sierra 39,900 39,900Gregory 38,600 38,600Speck 36,800 36,800Hartmann 16,500 16,500Lipault 12,259 12,259Other 5,670 5,159
Total tradenames 682,157 681,646
Amortization expense for intangible assets for the years ended December 31, 2015 and December 31, 2014 was US$10.6 million and US$9.2 million, respectively, and is presented as a distribution expense in the consolidated income statement. Future amortization expense as of December 31, 2015 for the next five years is estimated to be US$11.5 million, US$11.2 million, US$9.6 million, US$9.5 million, US$9.2 million and a total of US$29.3 million thereafter.
In accordance with IAS 36, the Group is required to evaluate its intangible assets with finite lives for recoverability whenever events or changes in circumstance indicate that their carrying amount might not be recoverable. The fair value of customer relationships is determined using a combination of the income approach and the multi-period excess earnings method, whereby the subject asset is valued after deducting a fair return on all other assets that are part of creating the related cash flows. There were no impairment indicators and there were no accumulated impairment losses as of December 31, 2015 and December 31, 2014.
The Group’s tradenames have been deemed to have indefinite lives due to their high quality and perceived value. In accordance with IAS 36, the recoverable amounts of the Group’s tradenames were determined using the relief-from-royalty income approach to derive fair value less cost to sell.
The calculations use discounted projections based on financial estimates reviewed by management covering a five-year period. Revenues beyond the five-year period are extrapolated using estimated growth rates appropriate for the market. The values assigned to the key assumptions represent management’s assessment of future trends and are based on both external sources and internal sources (historical data) and are summarized below.
• Pre-tax discount rates of 10–12% were used. The pre-tax discount rates were calculated separately for each tradename.
• Revenues were based on anticipated selling prices and projected based on the historical operating results, the five-year forecasts and royalty rates based on recent transfer pricing studies in the jurisdictions the Group operates in.
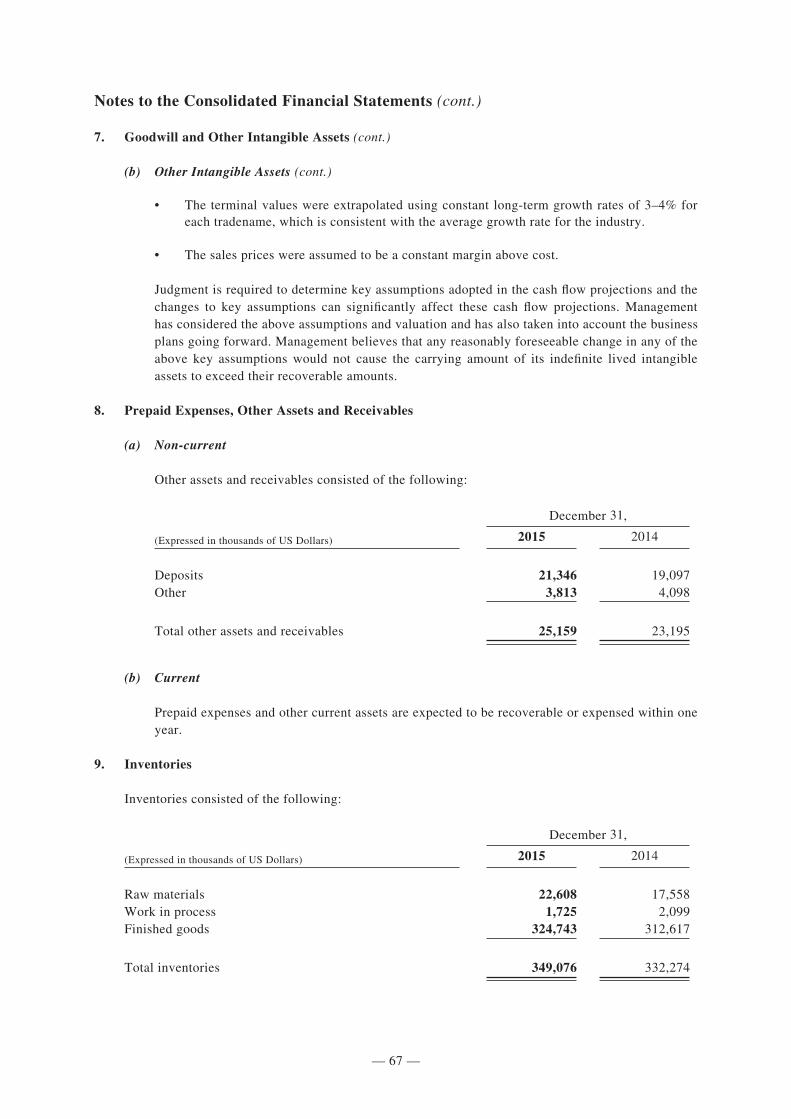
— 67 —
284502 \ (Samsonite_Luxembourg) \ 19/04/2016 \ M38 / Size (210x297)
Notes to the Consolidated Financial Statements (cont.)
7. Goodwill and Other Intangible Assets (cont.)
(b) Other Intangible Assets (cont.)
• The terminal values were extrapolated using constant long-term growth rates of 3–4% for each tradename, which is consistent with the average growth rate for the industry.
• The sales prices were assumed to be a constant margin above cost.
Judgment is required to determine key assumptions adopted in the cash flow projections and the changes to key assumptions can significantly affect these cash flow projections. Management has considered the above assumptions and valuation and has also taken into account the business plans going forward. Management believes that any reasonably foreseeable change in any of the above key assumptions would not cause the carrying amount of its indefinite lived intangible assets to exceed their recoverable amounts.
8. Prepaid Expenses, Other Assets and Receivables
(a) Non-current
Other assets and receivables consisted of the following:
December 31,
(Expressed in thousands of US Dollars) 2015 2014
Deposits 21,346 19,097Other 3,813 4,098
Total other assets and receivables 25,159 23,195
(b) Current
Prepaid expenses and other current assets are expected to be recoverable or expensed within one year.
9. Inventories
Inventories consisted of the following:
December 31,
(Expressed in thousands of US Dollars) 2015 2014
Raw materials 22,608 17,558Work in process 1,725 2,099Finished goods 324,743 312,617
Total inventories 349,076 332,274
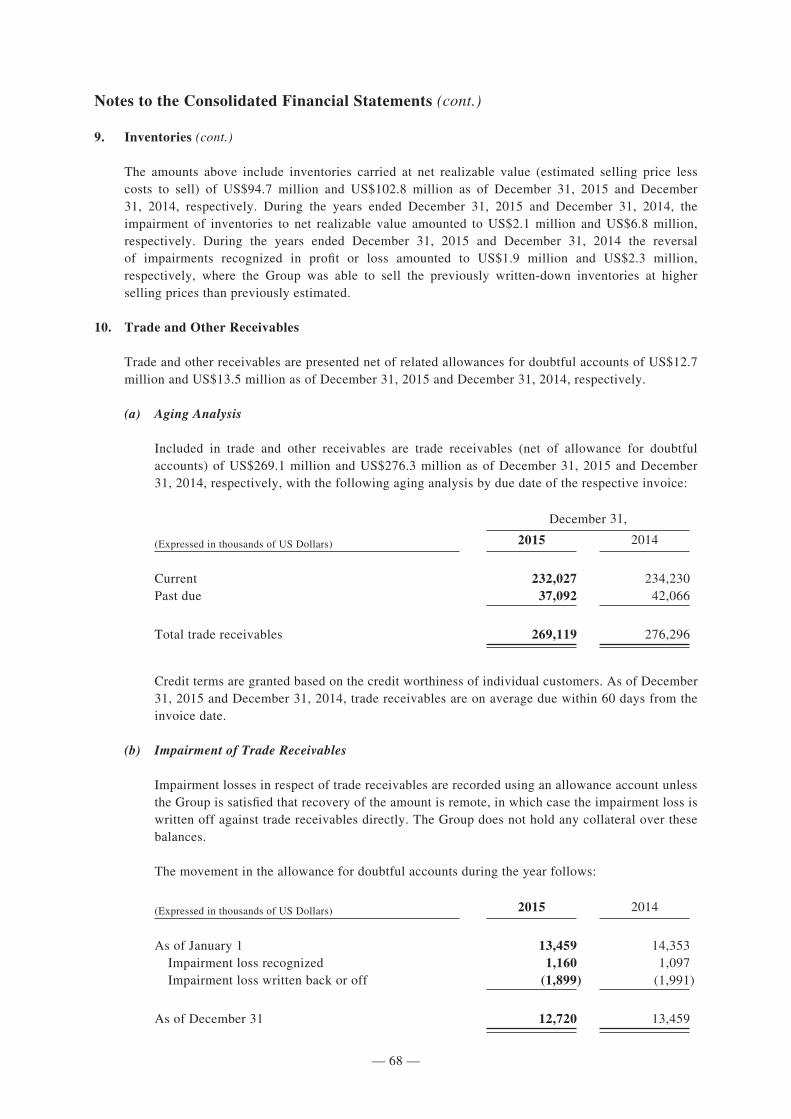
— 68 —
284502 \ (Samsonite_Luxembourg) \ 19/04/2016 \ M38 / Size (210x297)
Notes to the Consolidated Financial Statements (cont.)
9. Inventories (cont.)
The amounts above include inventories carried at net realizable value (estimated selling price less costs to sell) of US$94.7 million and US$102.8 million as of December 31, 2015 and December 31, 2014, respectively. During the years ended December 31, 2015 and December 31, 2014, the impairment of inventories to net realizable value amounted to US$2.1 million and US$6.8 million, respectively. During the years ended December 31, 2015 and December 31, 2014 the reversal of impairments recognized in profit or loss amounted to US$1.9 million and US$2.3 million, respectively, where the Group was able to sell the previously written-down inventories at higher selling prices than previously estimated.
10. Trade and Other Receivables
Trade and other receivables are presented net of related allowances for doubtful accounts of US$12.7 million and US$13.5 million as of December 31, 2015 and December 31, 2014, respectively.
(a) Aging Analysis
Included in trade and other receivables are trade receivables (net of allowance for doubtful accounts) of US$269.1 million and US$276.3 million as of December 31, 2015 and December 31, 2014, respectively, with the following aging analysis by due date of the respective invoice:
December 31,
(Expressed in thousands of US Dollars) 2015 2014
Current 232,027 234,230Past due 37,092 42,066
Total trade receivables 269,119 276,296
Credit terms are granted based on the credit worthiness of individual customers. As of December 31, 2015 and December 31, 2014, trade receivables are on average due within 60 days from the invoice date.
(b) Impairment of Trade Receivables
Impairment losses in respect of trade receivables are recorded using an allowance account unless the Group is satisfied that recovery of the amount is remote, in which case the impairment loss is written off against trade receivables directly. The Group does not hold any collateral over these balances.
The movement in the allowance for doubtful accounts during the year follows:
(Expressed in thousands of US Dollars) 2015 2014
As of January 1 13,459 14,353 Impairment loss recognized 1,160 1,097 Impairment loss written back or off (1,899) (1,991)
As of December 31 12,720 13,459
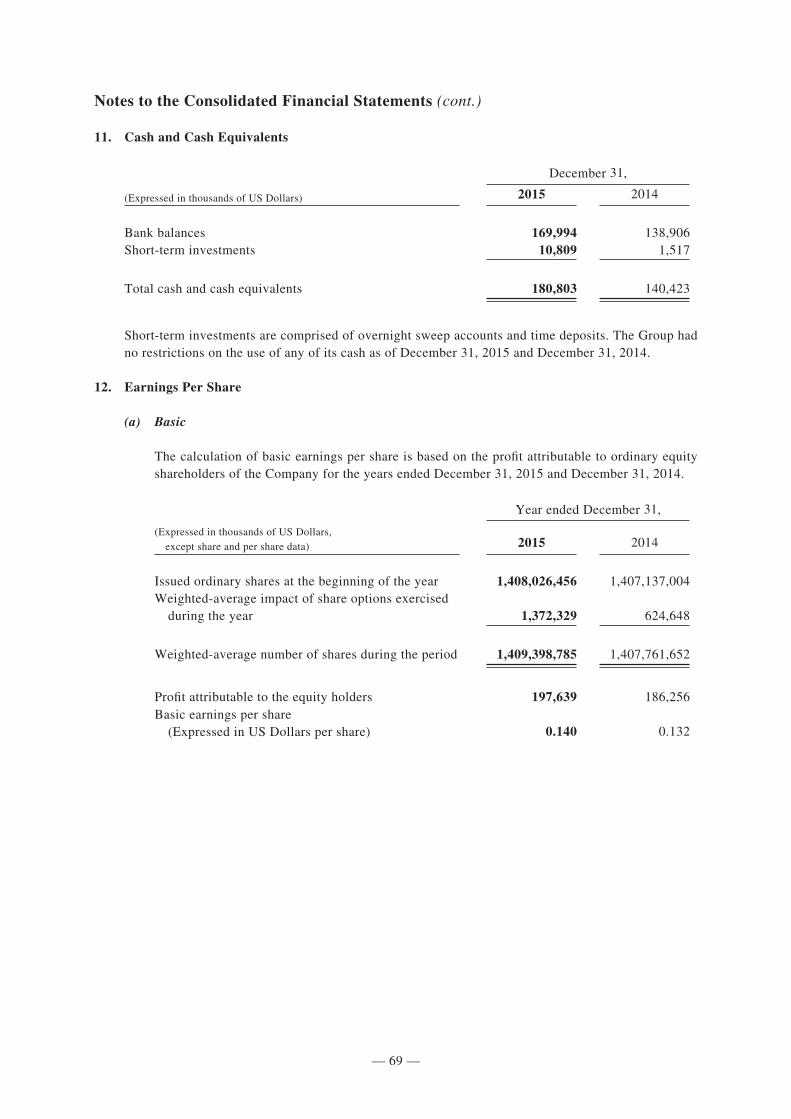
— 69 —
284502 \ (Samsonite_Luxembourg) \ 19/04/2016 \ M38 / Size (210x297)
Notes to the Consolidated Financial Statements (cont.)
11. Cash and Cash Equivalents
December 31,
(Expressed in thousands of US Dollars) 2015 2014
Bank balances 169,994 138,906Short-term investments 10,809 1,517
Total cash and cash equivalents 180,803 140,423
Short-term investments are comprised of overnight sweep accounts and time deposits. The Group had no restrictions on the use of any of its cash as of December 31, 2015 and December 31, 2014.
12. Earnings Per Share
(a) Basic
The calculation of basic earnings per share is based on the profit attributable to ordinary equity shareholders of the Company for the years ended December 31, 2015 and December 31, 2014.
Year ended December 31,
(Expressed in thousands of US Dollars, except share and per share data) 2015 2014
Issued ordinary shares at the beginning of the year 1,408,026,456 1,407,137,004Weighted-average impact of share options exercised during the year 1,372,329 624,648
Weighted-average number of shares during the period 1,409,398,785 1,407,761,652
Profit attributable to the equity holders 197,639 186,256Basic earnings per share (Expressed in US Dollars per share) 0.140 0.132
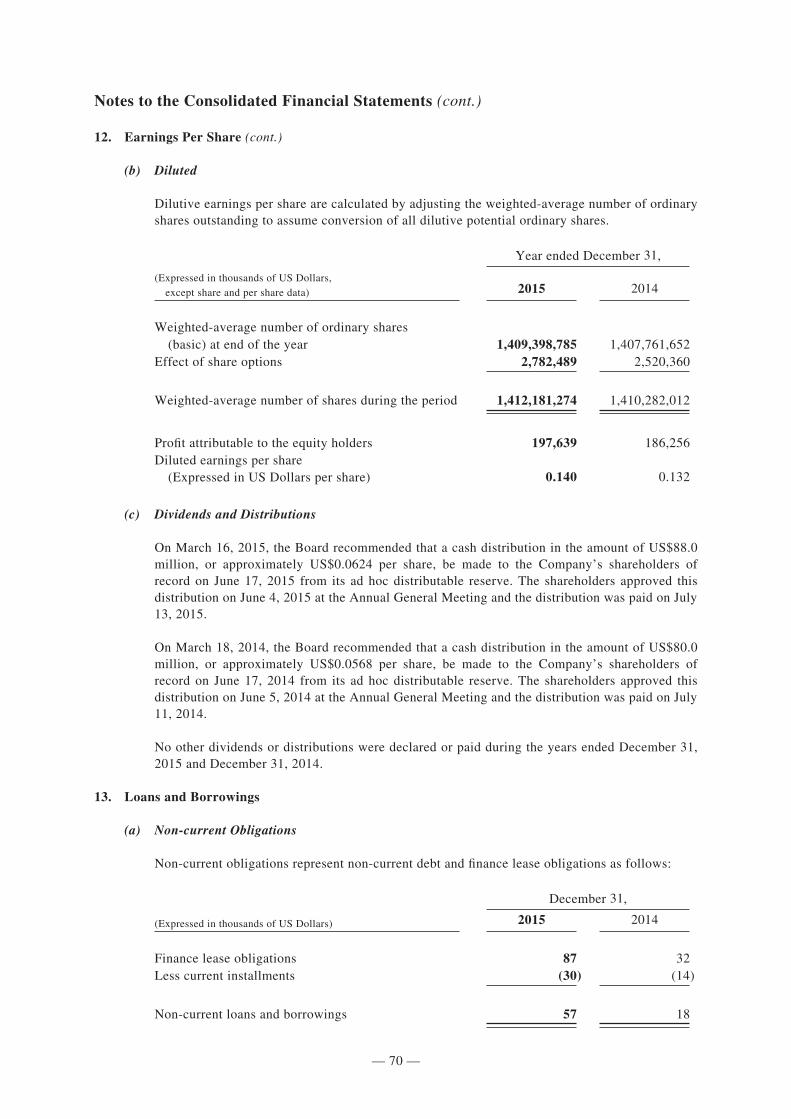
— 70 —
284502 \ (Samsonite_Luxembourg) \ 19/04/2016 \ M38 / Size (210x297)
Notes to the Consolidated Financial Statements (cont.)
12. Earnings Per Share (cont.)
(b) Diluted
Dilutive earnings per share are calculated by adjusting the weighted-average number of ordinary shares outstanding to assume conversion of all dilutive potential ordinary shares.
Year ended December 31,
(Expressed in thousands of US Dollars, except share and per share data) 2015 2014
Weighted-average number of ordinary shares (basic) at end of the year 1,409,398,785 1,407,761,652Effect of share options 2,782,489 2,520,360
Weighted-average number of shares during the period 1,412,181,274 1,410,282,012
Profit attributable to the equity holders 197,639 186,256Diluted earnings per share (Expressed in US Dollars per share) 0.140 0.132
(c) Dividends and Distributions
On March 16, 2015, the Board recommended that a cash distribution in the amount of US$88.0 million, or approximately US$0.0624 per share, be made to the Company’s shareholders of record on June 17, 2015 from its ad hoc distributable reserve. The shareholders approved this distribution on June 4, 2015 at the Annual General Meeting and the distribution was paid on July 13, 2015.
On March 18, 2014, the Board recommended that a cash distribution in the amount of US$80.0 million, or approximately US$0.0568 per share, be made to the Company’s shareholders of record on June 17, 2014 from its ad hoc distributable reserve. The shareholders approved this distribution on June 5, 2014 at the Annual General Meeting and the distribution was paid on July 11, 2014.
No other dividends or distributions were declared or paid during the years ended December 31, 2015 and December 31, 2014.
13. Loans and Borrowings
(a) Non-current Obligations
Non-current obligations represent non-current debt and finance lease obligations as follows:
December 31,
(Expressed in thousands of US Dollars) 2015 2014
Finance lease obligations 87 32Less current installments (30) (14)
Non-current loans and borrowings 57 18
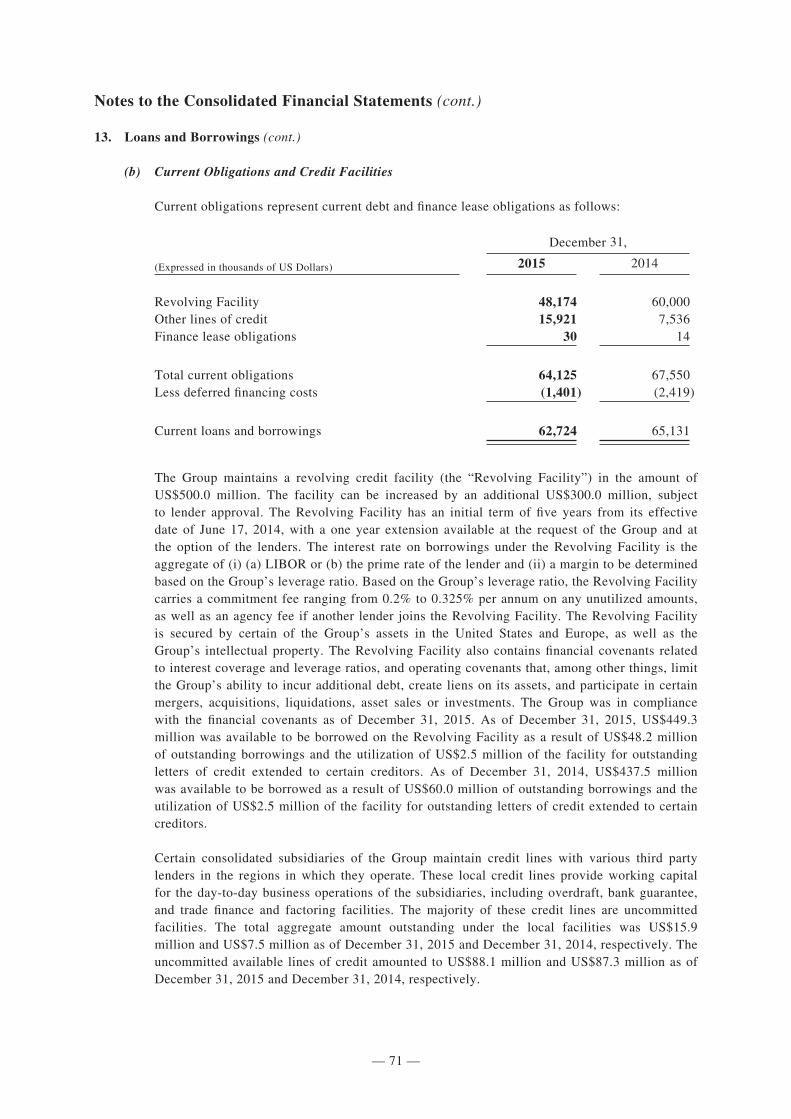
— 71 —
284502 \ (Samsonite_Luxembourg) \ 19/04/2016 \ M38 / Size (210x297)
Notes to the Consolidated Financial Statements (cont.)
13. Loans and Borrowings (cont.)
(b) Current Obligations and Credit Facilities
Current obligations represent current debt and finance lease obligations as follows:
December 31,
(Expressed in thousands of US Dollars) 2015 2014
Revolving Facility 48,174 60,000Other lines of credit 15,921 7,536Finance lease obligations 30 14
Total current obligations 64,125 67,550Less deferred financing costs (1,401) (2,419)
Current loans and borrowings 62,724 65,131
The Group maintains a revolving credit facility (the “Revolving Facility”) in the amount of US$500.0 million. The facility can be increased by an additional US$300.0 million, subject to lender approval. The Revolving Facility has an initial term of five years from its effective date of June 17, 2014, with a one year extension available at the request of the Group and at the option of the lenders. The interest rate on borrowings under the Revolving Facility is the aggregate of (i) (a) LIBOR or (b) the prime rate of the lender and (ii) a margin to be determined based on the Group’s leverage ratio. Based on the Group’s leverage ratio, the Revolving Facility carries a commitment fee ranging from 0.2% to 0.325% per annum on any unutilized amounts, as well as an agency fee if another lender joins the Revolving Facility. The Revolving Facility is secured by certain of the Group’s assets in the United States and Europe, as well as the Group’s intellectual property. The Revolving Facility also contains financial covenants related to interest coverage and leverage ratios, and operating covenants that, among other things, limit the Group’s ability to incur additional debt, create liens on its assets, and participate in certain mergers, acquisitions, liquidations, asset sales or investments. The Group was in compliance with the financial covenants as of December 31, 2015. As of December 31, 2015, US$449.3 million was available to be borrowed on the Revolving Facility as a result of US$48.2 million of outstanding borrowings and the utilization of US$2.5 million of the facility for outstanding letters of credit extended to certain creditors. As of December 31, 2014, US$437.5 million was available to be borrowed as a result of US$60.0 million of outstanding borrowings and the utilization of US$2.5 million of the facility for outstanding letters of credit extended to certain creditors.
Certain consolidated subsidiaries of the Group maintain credit lines with various third party lenders in the regions in which they operate. These local credit lines provide working capital for the day-to-day business operations of the subsidiaries, including overdraft, bank guarantee, and trade finance and factoring facilities. The majority of these credit lines are uncommitted facilities. The total aggregate amount outstanding under the local facilities was US$15.9 million and US$7.5 million as of December 31, 2015 and December 31, 2014, respectively. The uncommitted available lines of credit amounted to US$88.1 million and US$87.3 million as of December 31, 2015 and December 31, 2014, respectively.
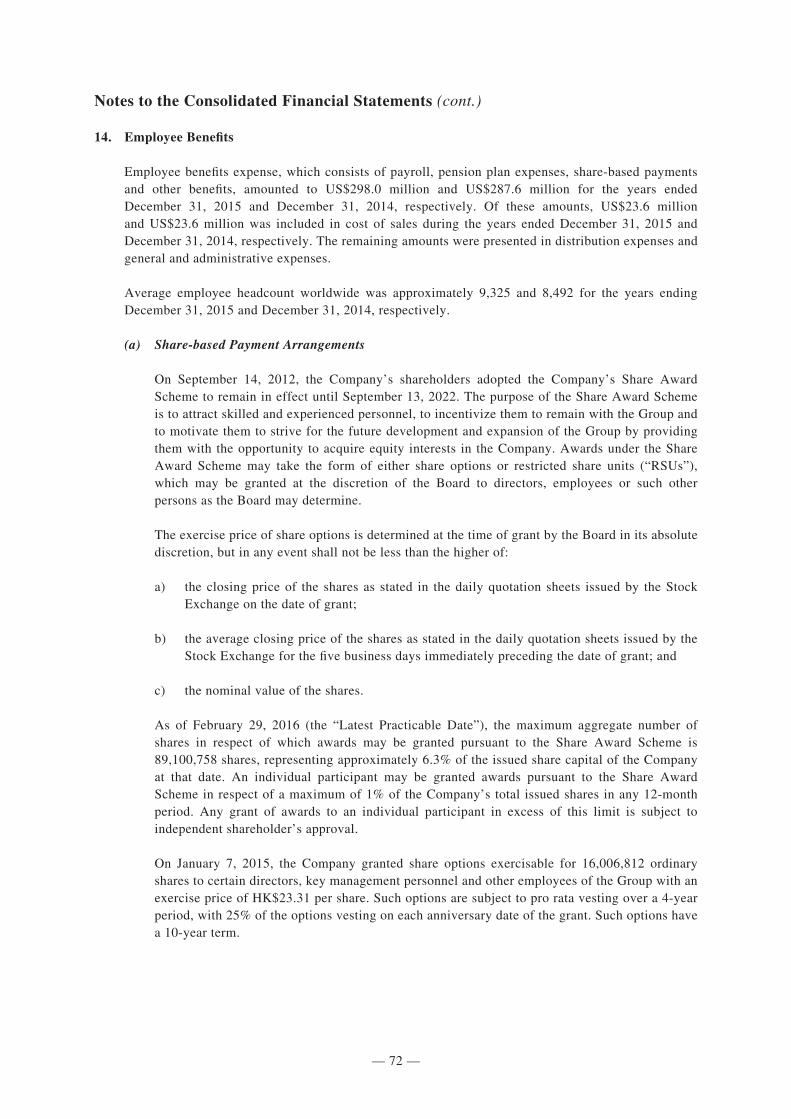
— 72 —
284502 \ (Samsonite_Luxembourg) \ 19/04/2016 \ M38 / Size (210x297)
Notes to the Consolidated Financial Statements (cont.)
14. Employee Benefits
Employee benefits expense, which consists of payroll, pension plan expenses, share-based payments and other benefits, amounted to US$298.0 million and US$287.6 million for the years ended December 31, 2015 and December 31, 2014, respectively. Of these amounts, US$23.6 million and US$23.6 million was included in cost of sales during the years ended December 31, 2015 and December 31, 2014, respectively. The remaining amounts were presented in distribution expenses and general and administrative expenses.
Average employee headcount worldwide was approximately 9,325 and 8,492 for the years ending December 31, 2015 and December 31, 2014, respectively.
(a) Share-based Payment Arrangements
On September 14, 2012, the Company’s shareholders adopted the Company’s Share Award Scheme to remain in effect until September 13, 2022. The purpose of the Share Award Scheme is to attract skilled and experienced personnel, to incentivize them to remain with the Group and to motivate them to strive for the future development and expansion of the Group by providing them with the opportunity to acquire equity interests in the Company. Awards under the Share Award Scheme may take the form of either share options or restricted share units (“RSUs”), which may be granted at the discretion of the Board to directors, employees or such other persons as the Board may determine.
The exercise price of share options is determined at the time of grant by the Board in its absolute discretion, but in any event shall not be less than the higher of:
a) the closing price of the shares as stated in the daily quotation sheets issued by the Stock Exchange on the date of grant;
b) the average closing price of the shares as stated in the daily quotation sheets issued by the Stock Exchange for the five business days immediately preceding the date of grant; and
c) the nominal value of the shares.
As of February 29, 2016 (the “Latest Practicable Date”), the maximum aggregate number of shares in respect of which awards may be granted pursuant to the Share Award Scheme is 89,100,758 shares, representing approximately 6.3% of the issued share capital of the Company at that date. An individual participant may be granted awards pursuant to the Share Award Scheme in respect of a maximum of 1% of the Company’s total issued shares in any 12-month period. Any grant of awards to an individual participant in excess of this limit is subject to independent shareholder’s approval.
On January 7, 2015, the Company granted share options exercisable for 16,006,812 ordinary shares to certain directors, key management personnel and other employees of the Group with an exercise price of HK$23.31 per share. Such options are subject to pro rata vesting over a 4-year period, with 25% of the options vesting on each anniversary date of the grant. Such options have a 10-year term.
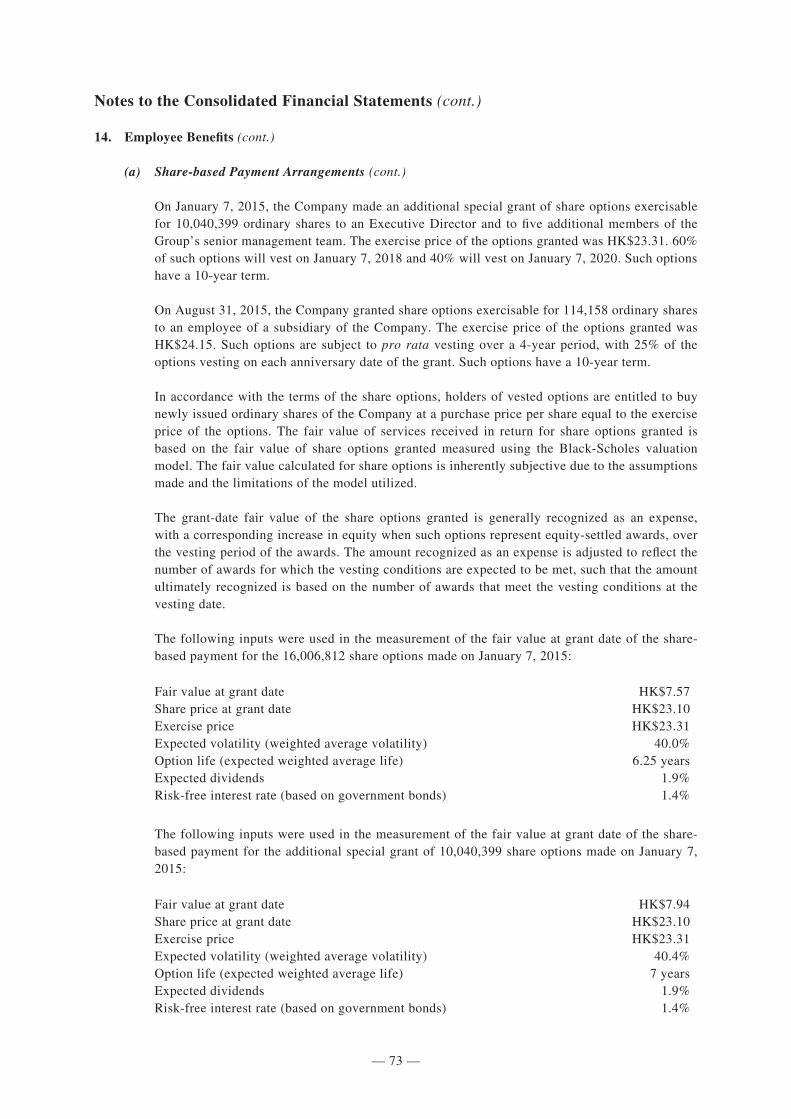
— 73 —
284502 \ (Samsonite_Luxembourg) \ 19/04/2016 \ M38 / Size (210x297)
Notes to the Consolidated Financial Statements (cont.)
14. Employee Benefits (cont.)
(a) Share-based Payment Arrangements (cont.)
On January 7, 2015, the Company made an additional special grant of share options exercisable for 10,040,399 ordinary shares to an Executive Director and to five additional members of the Group’s senior management team. The exercise price of the options granted was HK$23.31. 60% of such options will vest on January 7, 2018 and 40% will vest on January 7, 2020. Such options have a 10-year term.
On August 31, 2015, the Company granted share options exercisable for 114,158 ordinary shares to an employee of a subsidiary of the Company. The exercise price of the options granted was HK$24.15. Such options are subject to pro rata vesting over a 4-year period, with 25% of the options vesting on each anniversary date of the grant. Such options have a 10-year term.
In accordance with the terms of the share options, holders of vested options are entitled to buy newly issued ordinary shares of the Company at a purchase price per share equal to the exercise price of the options. The fair value of services received in return for share options granted is based on the fair value of share options granted measured using the Black-Scholes valuation model. The fair value calculated for share options is inherently subjective due to the assumptions made and the limitations of the model utilized.
The grant-date fair value of the share options granted is generally recognized as an expense, with a corresponding increase in equity when such options represent equity-settled awards, over the vesting period of the awards. The amount recognized as an expense is adjusted to reflect the number of awards for which the vesting conditions are expected to be met, such that the amount ultimately recognized is based on the number of awards that meet the vesting conditions at the vesting date.
The following inputs were used in the measurement of the fair value at grant date of the share-based payment for the 16,006,812 share options made on January 7, 2015:
Fair value at grant date HK$7.57Share price at grant date HK$23.10Exercise price HK$23.31Expected volatility (weighted average volatility) 40.0%Option life (expected weighted average life) 6.25 yearsExpected dividends 1.9%Risk-free interest rate (based on government bonds) 1.4%
The following inputs were used in the measurement of the fair value at grant date of the share-based payment for the additional special grant of 10,040,399 share options made on January 7, 2015:
Fair value at grant date HK$7.94Share price at grant date HK$23.10Exercise price HK$23.31Expected volatility (weighted average volatility) 40.4%Option life (expected weighted average life) 7 yearsExpected dividends 1.9%Risk-free interest rate (based on government bonds) 1.4%
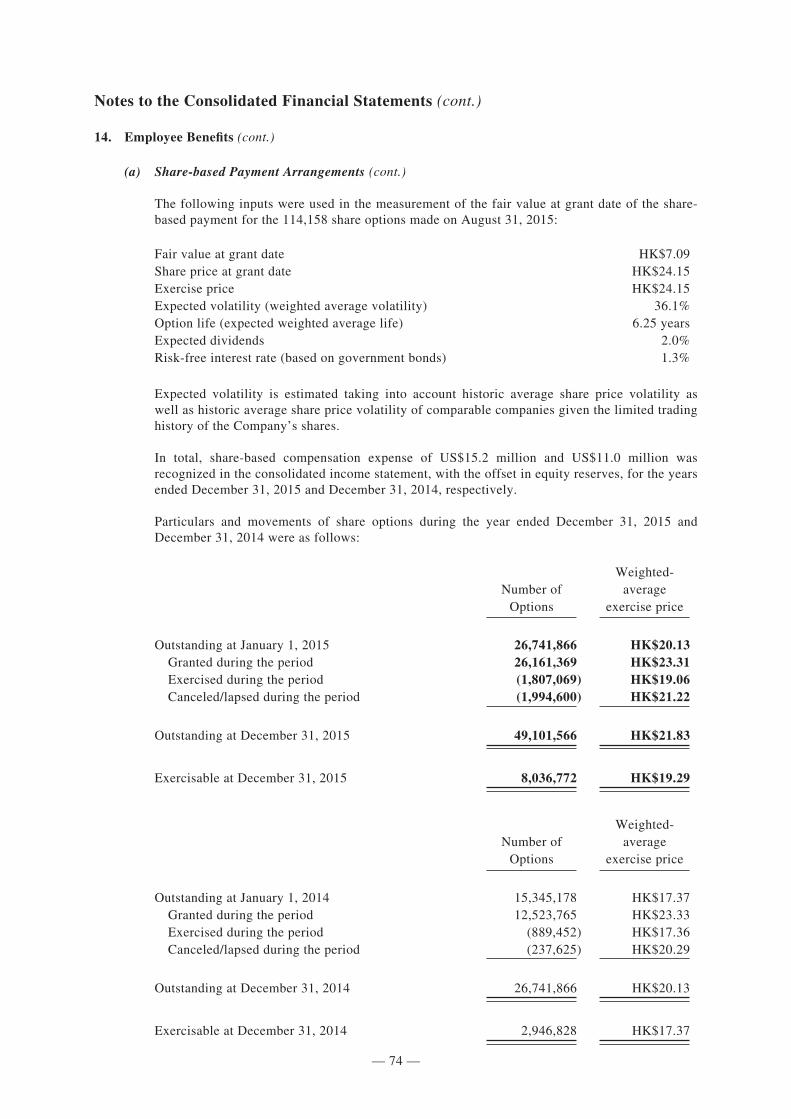
— 74 —
284502 \ (Samsonite_Luxembourg) \ 19/04/2016 \ M38 / Size (210x297)
Notes to the Consolidated Financial Statements (cont.)
14. Employee Benefits (cont.)
(a) Share-based Payment Arrangements (cont.)
The following inputs were used in the measurement of the fair value at grant date of the share-based payment for the 114,158 share options made on August 31, 2015:
Fair value at grant date HK$7.09Share price at grant date HK$24.15Exercise price HK$24.15Expected volatility (weighted average volatility) 36.1%Option life (expected weighted average life) 6.25 yearsExpected dividends 2.0%Risk-free interest rate (based on government bonds) 1.3%
Expected volatility is estimated taking into account historic average share price volatility as well as historic average share price volatility of comparable companies given the limited trading history of the Company’s shares.
In total, share-based compensation expense of US$15.2 million and US$11.0 million was recognized in the consolidated income statement, with the offset in equity reserves, for the years ended December 31, 2015 and December 31, 2014, respectively.
Particulars and movements of share options during the year ended December 31, 2015 and December 31, 2014 were as follows:
Number of Options
Weighted-average
exercise price
Outstanding at January 1, 2015 26,741,866 HK$20.13 Granted during the period 26,161,369 HK$23.31 Exercised during the period (1,807,069) HK$19.06 Canceled/lapsed during the period (1,994,600) HK$21.22
Outstanding at December 31, 2015 49,101,566 HK$21.83
Exercisable at December 31, 2015 8,036,772 HK$19.29
Number of Options
Weighted-average
exercise price
Outstanding at January 1, 2014 15,345,178 HK$17.37 Granted during the period 12,523,765 HK$23.33 Exercised during the period (889,452) HK$17.36 Canceled/lapsed during the period (237,625) HK$20.29
Outstanding at December 31, 2014 26,741,866 HK$20.13
Exercisable at December 31, 2014 2,946,828 HK$17.37
— 75 —
284502 \ (Samsonite_Luxembourg) \ 19/04/2016 \ M38 / Size (210x297)
Notes to the Consolidated Financial Statements (cont.)
14. Employee Benefits (cont.)
(a) Share-based Payment Arrangements (cont.)
At December 31, 2015, the range of exercise prices for outstanding share options was HK$17.36 to HK$24.77 with a weighted average contractual life of 8.3 years. At December 31, 2014, the range of exercise prices for outstanding share options was HK$17.36 to HK$24.77 with a weighted average contractual life of 8.5 years.
No RSUs had been issued under the Share Award Scheme as of December 31, 2015.
(b) Pension Plans and Defined Benefit Schemes
(i) Plan Descriptions
Details of the significant plans sponsored by the Group are presented below.
A U.S. subsidiary of the Group sponsors a defined benefit retirement plan, the Samsonite Employee Retirement Income Plan, which covers certain employee groups. Retirement benefits are based on a final average pay formula. This plan was closed to new entrants effective January 1, 2010. Effective December 31, 2010, the plan was frozen to future accruals. This plan was terminated effective December 31, 2014. The administration of the plan will be moved to a third party insurance company. For those participants who will receive a benefit in the form of an annuity, the Group intends to purchase an annuity contract for such participants’ benefits from an insurer to be selected at a later date. The Group anticipates the administration of the plan will be moved within the next year, pending regulatory approval.
The Group also maintains a supplemental retirement plan for certain management employees. This plan was closed to new entrants effective January 1, 2010. Effective December 31, 2010, the plan was frozen to future accruals.
A U.S. subsidiary of the Group also provides health care and life insurance benefits to certain retired employees who meet certain age and years of service eligibility requirements. The plan was closed to new entrants with regards to life insurance benefits effective January 1, 2009 and was closed to new entrants with regards to medical benefits effective December 31, 2009. Eligible retirees are required to contribute to the costs of post-retirement benefits. The Group’s other post-retirement benefits are not vested and the Group has the right to modify any benefit provision, including contribution requirements, with respect to any current or former employee, dependent or beneficiary. As of December 31, 2015 and December 31, 2014, the percentage of health insurance cost that the retiree must contribute was 100%.
A Belgium subsidiary of the Group sponsors a pre-pension defined benefit retirement plan to certain employees who meet certain age and years of service eligibility requirements. Benefits are calculated based on a final pay formula and are contributed until the employee reaches the legal retirement age.
— 76 —
284502 \ (Samsonite_Luxembourg) \ 19/04/2016 \ M38 / Size (210x297)
Notes to the Consolidated Financial Statements (cont.)
14. Employee Benefits (cont.)
(b) Pension Plans and Defined Benefit Schemes (cont.)
(i) Plan Descriptions (cont.)
The U.S. plans are administered by trustees, which are independent of the Group, with their assets held separately from those of the Group. These plans are funded by contributions from the Group in accordance with an independent actuary’s recommendation based on annual actuarial valuations. The latest independent actuarial valuations of the plans were as of December 31, 2015 and were prepared by independent qualified actuaries, who are members of the Society of Actuaries of the United States of America, using the projected unit credit method. The actuarial valuations indicate that the Group’s obligations under these defined benefit retirement plans were US$227.4 million and US$244.2 million as of December 31, 2015 and December 31, 2014, respectively, which are 90.7% and 87.7% funded by the plan assets held by the trustees as of December 31, 2015 and December 31, 2014, respectively.
(ii) Amounts recognized in the consolidated statements of financial position for the Group’s significant plans
December 31,
(Expressed in thousands of US Dollars) 2015 2014
Present value of unfunded obligations (14,104) (15,853)Present value of partly funded obligations (224,840) (241,534)Fair value of plan assets 206,378 213,991
Net pension liability (32,566) (43,396)
Experience adjustments arising on plan liabilities 270 1,878
The net pension liability is recorded in employee benefits in the consolidated statement of financial position. The Group does not have net unrecognized actuarial losses as the Group recognizes all actuarial gains and losses in other comprehensive income.
A portion of the above liability is expected to be settled after more than one year. However, it is not practicable to segregate the amount from the amounts payable in the next twelve months, as future contributions will also relate to future changes in actuarial assumptions and market conditions. The Group estimates that the benefit payments for the pension and post-retirement benefits will be approximately US$17.5 million during 2016 and between US$16.4 million and US$17.2 million each year from 2017 through 2020.
— 77 —
284502 \ (Samsonite_Luxembourg) \ 19/04/2016 \ M38 / Size (210x297)
Notes to the Consolidated Financial Statements (cont.)
14. Employee Benefits (cont.)
(b) Pension Plans and Defined Benefit Schemes (cont.)
(ii) Amounts recognized in the consolidated statements of financial position for the Group’s significant plans (cont.)
The net pension liability is shown below:
December 31, 2015
(Expressed in thousands of US Dollars)
U.S. pension benefits
U.S. post- retirement
benefits
Belgium retirement
benefits Total
Present value of the defined benefit obligation (227,426) (1,681) (9,837) (238,944)Fair value of plan assets 206,378 — — 206,378
Net liability (21,048) (1,681) (9,837) (32,566)
December 31, 2014
(Expressed in thousands of US Dollars)
U.S. pension benefits
U.S. post-retirement
benefits
Belgium retirement
benefits Total
Present value of the defined benefit obligation (244,229) (1,826) (11,332) (257,387)Fair value of plan assets 213,991 — — 213,991
Net liability (30,238) (1,826) (11,332) (43,396)
— 78 —
284502 \ (Samsonite_Luxembourg) \ 19/04/2016 \ M38 / Size (210x297)
Notes to the Consolidated Financial Statements (cont.)
14. Employee Benefits (cont.)
(b) Pension Plans and Defined Benefit Schemes (cont.)
(iii) Movements in the present value of the defined benefit obligations for the Group’s significant plans
Year ended December 31, 2015
(Expressed in thousands of US Dollars)
U.S. pension benefits
U.S. post-retirement
benefits
Belgium retirement
benefits Total
Change in benefit obligation: Benefit obligation at January 1 244,229 1,826 11,332 257,387 Service cost — — 578 578 Interest cost 8,674 64 153 8,891 Plan participants’ contributions — 168 — 168 Remeasurements (8,524) (199) (785) (9,508) Benefits paid (16,953) (178) (289) (17,420) Foreign exchange adjustments — — (1,152) (1,152)
Benefit obligation at December 31 227,426 1,681 9,837 238,944
Year ended December 31, 2014
(Expressed in thousands of US Dollars)
U.S. pension benefits
U.S. post- retirement
benefits
Belgium retirement
benefits Total
Change in benefit obligation: Benefit obligation at January 1 213,419 1,938 12,780 228,137 Service cost — — 626 626 Interest cost 9,054 80 328 9,462 Plan participants’ contributions — 211 — 211 Remeasurements 38,974 (180) (445) 38,349 Benefits paid (17,218) (223) (419) (17,860) Foreign exchange adjustments — — (1,538) (1,538)
Benefit obligation at December 31 244,229 1,826 11,332 257,387
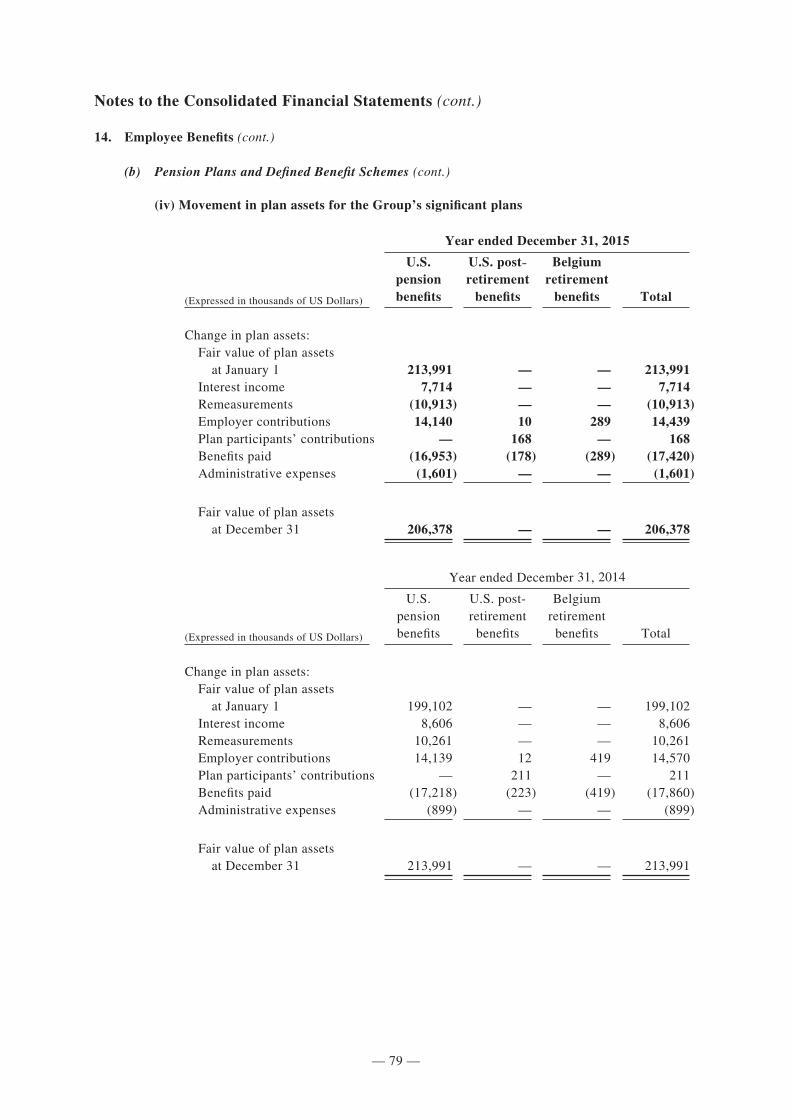
— 79 —
284502 \ (Samsonite_Luxembourg) \ 19/04/2016 \ M38 / Size (210x297)
Notes to the Consolidated Financial Statements (cont.)
14. Employee Benefits (cont.)
(b) Pension Plans and Defined Benefit Schemes (cont.)
(iv) Movement in plan assets for the Group’s significant plans
Year ended December 31, 2015
(Expressed in thousands of US Dollars)
U.S. pension benefits
U.S. post- retirement
benefits
Belgium retirement
benefits Total
Change in plan assets: Fair value of plan assets at January 1 213,991 — — 213,991 Interest income 7,714 — — 7,714 Remeasurements (10,913) — — (10,913) Employer contributions 14,140 10 289 14,439 Plan participants’ contributions — 168 — 168 Benefits paid (16,953) (178) (289) (17,420) Administrative expenses (1,601) — — (1,601)
Fair value of plan assets at December 31 206,378 — — 206,378
Year ended December 31, 2014
(Expressed in thousands of US Dollars)
U.S. pension benefits
U.S. post-retirement
benefits
Belgium retirement
benefits Total
Change in plan assets: Fair value of plan assets at January 1 199,102 — — 199,102 Interest income 8,606 — — 8,606 Remeasurements 10,261 — — 10,261 Employer contributions 14,139 12 419 14,570 Plan participants’ contributions — 211 — 211 Benefits paid (17,218) (223) (419) (17,860) Administrative expenses (899) — — (899)
Fair value of plan assets at December 31 213,991 — — 213,991
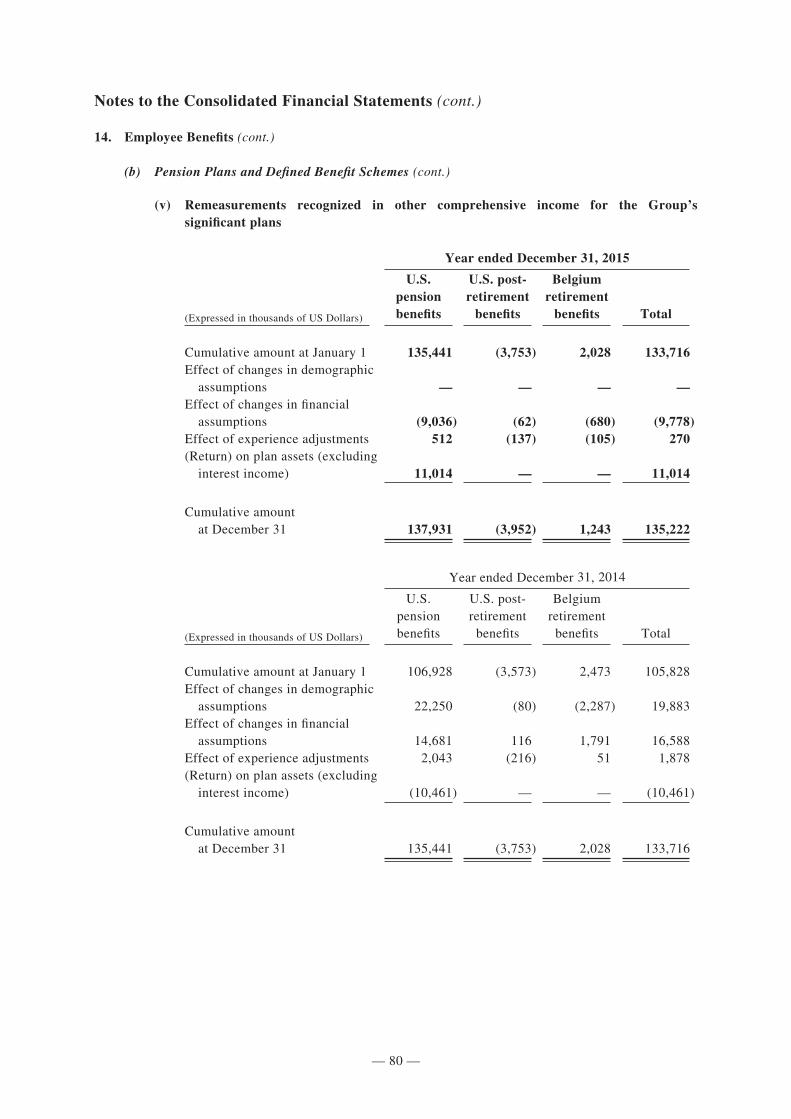
— 80 —
284502 \ (Samsonite_Luxembourg) \ 19/04/2016 \ M38 / Size (210x297)
Notes to the Consolidated Financial Statements (cont.)
14. Employee Benefits (cont.)
(b) Pension Plans and Defined Benefit Schemes (cont.)
(v) Remeasurements recognized in other comprehensive income for the Group’s significant plans
Year ended December 31, 2015
(Expressed in thousands of US Dollars)
U.S. pension benefits
U.S. post- retirement
benefits
Belgium retirement
benefits Total
Cumulative amount at January 1 135,441 (3,753) 2,028 133,716Effect of changes in demographic assumptions — — — —Effect of changes in financial assumptions (9,036) (62) (680) (9,778)Effect of experience adjustments 512 (137) (105) 270(Return) on plan assets (excluding interest income) 11,014 — — 11,014
Cumulative amount at December 31 137,931 (3,952) 1,243 135,222
Year ended December 31, 2014
(Expressed in thousands of US Dollars)
U.S. pension benefits
U.S. post- retirement
benefits
Belgium retirement
benefits Total
Cumulative amount at January 1 106,928 (3,573) 2,473 105,828Effect of changes in demographic assumptions 22,250 (80) (2,287) 19,883Effect of changes in financial assumptions 14,681 116 1,791 16,588Effect of experience adjustments 2,043 (216) 51 1,878(Return) on plan assets (excluding interest income) (10,461) — — (10,461)
Cumulative amount at December 31 135,441 (3,753) 2,028 133,716

— 81 —
284502 \ (Samsonite_Luxembourg) \ 19/04/2016 \ M38 / Size (210x297)
Notes to the Consolidated Financial Statements (cont.)
14. Employee Benefits (cont.)
(b) Pension Plans and Defined Benefit Schemes (cont.)
(vi) Costs recognized in the consolidated income statement for the Group’s significant plans
Year ended December 31, 2015
(Expressed in thousands of US Dollars)
U.S. pension benefits
U.S. post- retirement
benefits
Belgium retirement
benefits Total
Service cost — — 578 578Interest expense on defined benefit obligation 8,674 64 153 8,891Interest (income) on plan assets (7,715) — — (7,715)Administrative expenses 1,500 — — 1,500
Total net periodic benefit cost 2,459 64 731 3,254
Year ended December 31, 2014
(Expressed in thousands of US Dollars)
U.S. pension benefits
U.S. post- retirement
benefits
Belgium retirement
benefits Total
Service cost — — 626 626Interest expense on defined benefit obligation 9,054 80 328 9,462Interest (income) on plan assets (8,606) — — (8,606)Administrative expenses 1,100 — — 1,100
Total net periodic benefit cost 1,548 80 954 2,582
The expense is recognized in the following line items in the consolidated income statement:
Year ended December 31,
(Expressed in thousands of US Dollars) 2015 2014
General and administrative expenses 1,343 1,412Other expenses 1,911 1,170
3,254 2,582
Pension expense included in other income and expense relates to the actuarial determined pension expense associated with the pension plans of two companies unrelated to the Group’s current operations whose pension obligations were assumed by the Group as a result of a 1993 agreement with the Pension Benefit Guaranty Corporation (the “PBGC”). The plans were part of a controlled company of corporations of which the Group was a part of, prior to 1993.
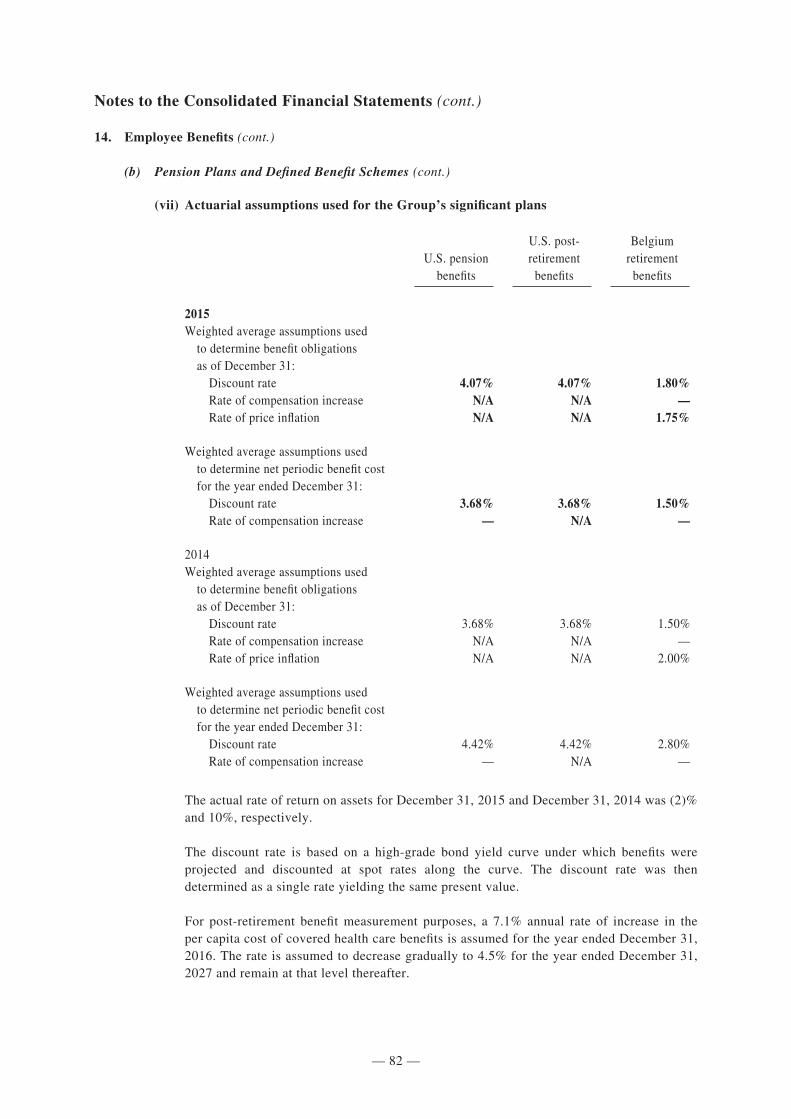
— 82 —
284502 \ (Samsonite_Luxembourg) \ 19/04/2016 \ M38 / Size (210x297)
Notes to the Consolidated Financial Statements (cont.)
14. Employee Benefits (cont.)
(b) Pension Plans and Defined Benefit Schemes (cont.)
(vii) Actuarial assumptions used for the Group’s significant plans
U.S. pension benefits
U.S. post- retirement
benefits
Belgium retirement
benefits
2015Weighted average assumptions used to determine benefit obligations as of December 31: Discount rate 4.07% 4.07% 1.80% Rate of compensation increase N/A N/A — Rate of price inflation N/A N/A 1.75%
Weighted average assumptions used to determine net periodic benefit cost for the year ended December 31: Discount rate 3.68% 3.68% 1.50% Rate of compensation increase — N/A —
2014Weighted average assumptions used to determine benefit obligations as of December 31: Discount rate 3.68% 3.68% 1.50% Rate of compensation increase N/A N/A — Rate of price inflation N/A N/A 2.00%
Weighted average assumptions used to determine net periodic benefit cost for the year ended December 31: Discount rate 4.42% 4.42% 2.80% Rate of compensation increase — N/A —
The actual rate of return on assets for December 31, 2015 and December 31, 2014 was (2)% and 10%, respectively.
The discount rate is based on a high-grade bond yield curve under which benefits were projected and discounted at spot rates along the curve. The discount rate was then determined as a single rate yielding the same present value.
For post-retirement benefit measurement purposes, a 7.1% annual rate of increase in the per capita cost of covered health care benefits is assumed for the year ended December 31, 2016. The rate is assumed to decrease gradually to 4.5% for the year ended December 31, 2027 and remain at that level thereafter.
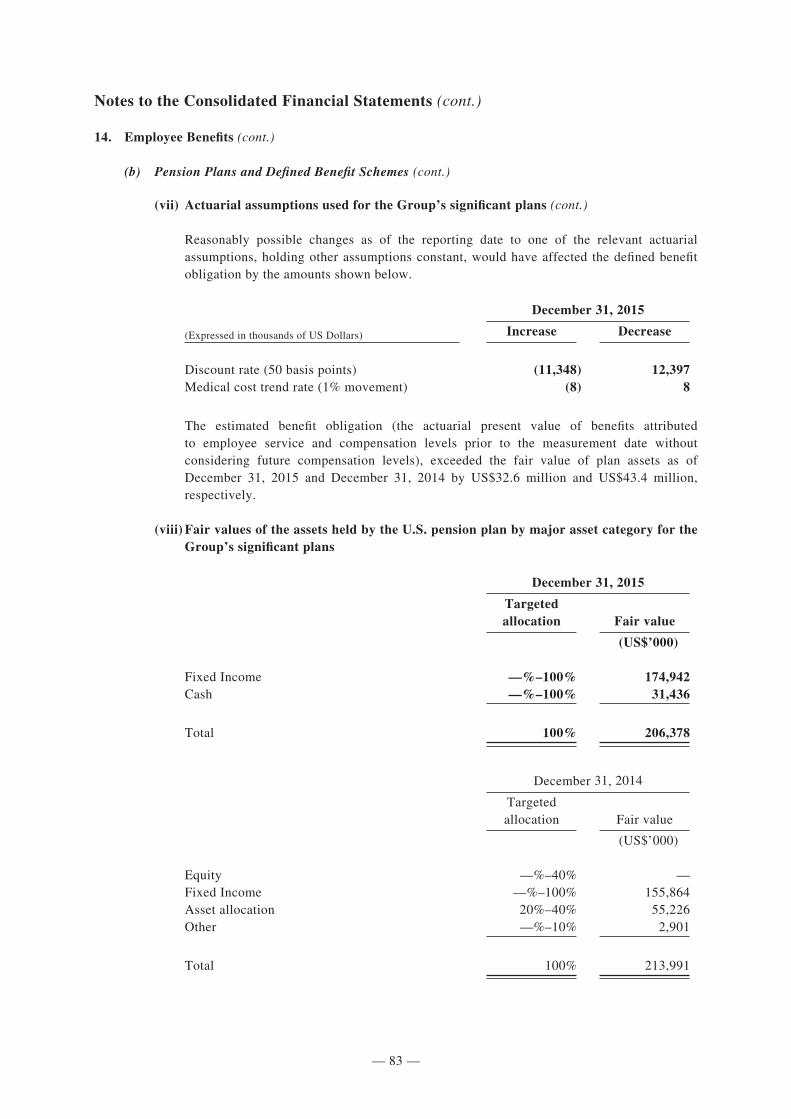
— 83 —
284502 \ (Samsonite_Luxembourg) \ 19/04/2016 \ M38 / Size (210x297)
Notes to the Consolidated Financial Statements (cont.)
14. Employee Benefits (cont.)
(b) Pension Plans and Defined Benefit Schemes (cont.)
(vii) Actuarial assumptions used for the Group’s significant plans (cont.)
Reasonably possible changes as of the reporting date to one of the relevant actuarial assumptions, holding other assumptions constant, would have affected the defined benefit obligation by the amounts shown below.
December 31, 2015
(Expressed in thousands of US Dollars) Increase Decrease
Discount rate (50 basis points) (11,348) 12,397Medical cost trend rate (1% movement) (8) 8
The estimated benefit obligation (the actuarial present value of benefits attributed to employee service and compensation levels prior to the measurement date without considering future compensation levels), exceeded the fair value of plan assets as of December 31, 2015 and December 31, 2014 by US$32.6 million and US$43.4 million, respectively.
(viii) Fair values of the assets held by the U.S. pension plan by major asset category for the Group’s significant plans
December 31, 2015
Targeted allocation Fair value
(US$’000)
Fixed Income —%–100% 174,942Cash —%–100% 31,436
Total 100% 206,378
December 31, 2014
Targeted allocation Fair value
(US$’000)
Equity —%–40% —Fixed Income —%–100% 155,864Asset allocation 20%–40% 55,226Other —%–10% 2,901
Total 100% 213,991
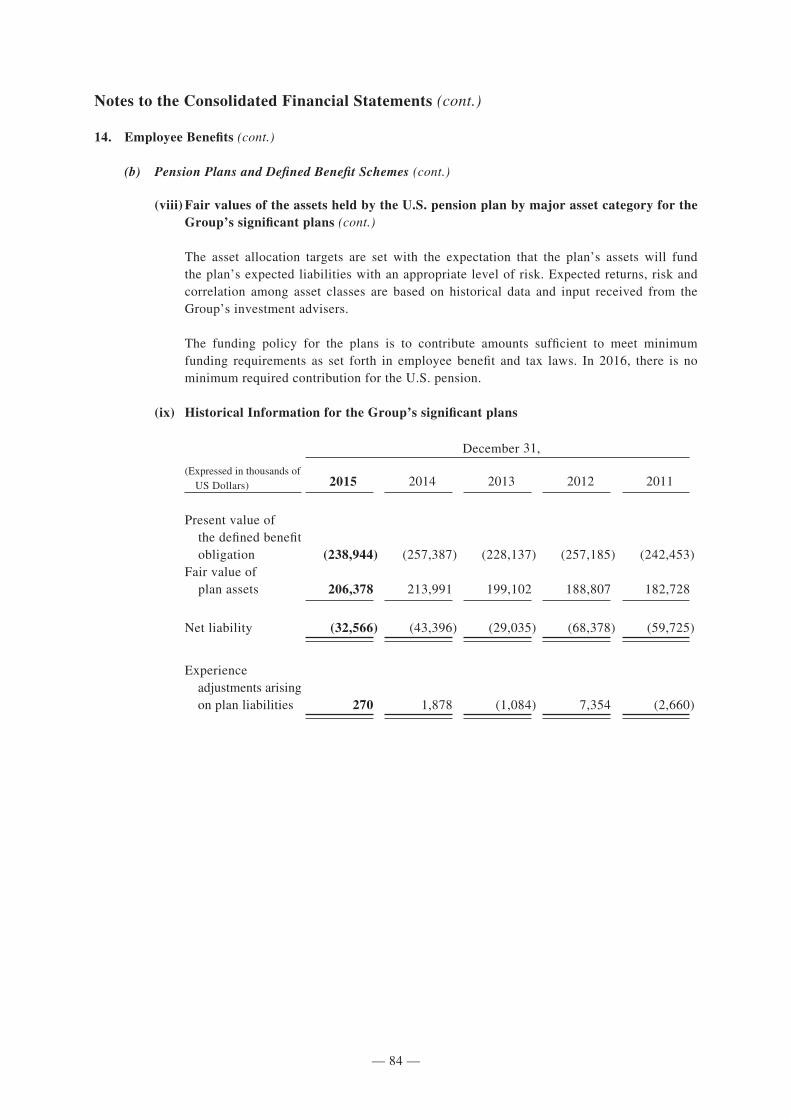
— 84 —
284502 \ (Samsonite_Luxembourg) \ 19/04/2016 \ M38 / Size (210x297)
Notes to the Consolidated Financial Statements (cont.)
14. Employee Benefits (cont.)
(b) Pension Plans and Defined Benefit Schemes (cont.)
(viii) Fair values of the assets held by the U.S. pension plan by major asset category for the Group’s significant plans (cont.)
The asset allocation targets are set with the expectation that the plan’s assets will fund the plan’s expected liabilities with an appropriate level of risk. Expected returns, risk and correlation among asset classes are based on historical data and input received from the Group’s investment advisers.
The funding policy for the plans is to contribute amounts sufficient to meet minimum funding requirements as set forth in employee benefit and tax laws. In 2016, there is no minimum required contribution for the U.S. pension.
(ix) Historical Information for the Group’s significant plans
December 31,
(Expressed in thousands of US Dollars) 2015 2014 2013 2012 2011
Present value of the defined benefit obligation (238,944) (257,387) (228,137) (257,185) (242,453)Fair value of plan assets 206,378 213,991 199,102 188,807 182,728
Net liability (32,566) (43,396) (29,035) (68,378) (59,725)
Experience adjustments arising on plan liabilities 270 1,878 (1,084) 7,354 (2,660)
— 85 —
284502 \ (Samsonite_Luxembourg) \ 19/04/2016 \ M38 / Size (210x297)
Notes to the Consolidated Financial Statements (cont.)
14. Employee Benefits (cont.)
(c) Defined Contribution Plan
A U.S. subsidiary of the Group provides a defined contribution 401(k) retirement plan. The plan covers substantially all non-union employees of the subsidiary for the sole purpose of encouraging participants to save for retirement. Plan participants may contribute up to 75% of their compensation to the plan, a percentage of which is matched by the Group. The Group may also make non-elective contributions to participants’ accounts. Participant contributions and the earnings thereon are fully vested upon contribution. Participants become vested in the matching and non-elective contributions upon completion of two and three years of service, respectively. Forfeited contributions made by the Group are used to reduce future matching contributions and/or administrative expenses.
In connection with this plan, the Group recognized an expense of US$3.1 million and US$2.5 million for the years ended December 31, 2015 and December 31, 2014, respectively. Forfeited contributions were inconsequential for the periods presented.
(d) Samsonite LLC’s U.S. Pension Plan Settlement Agreement
Samsonite LLC (a U.S. subsidiary of the Group) and the PBGC are party to a Settlement Agreement under which PBGC was granted an equal and ratable lien on certain domestic assets of Samsonite LLC and certain of its U.S. subsidiaries (excluding any equity interests in subsidiaries and any inventory or accounts receivable of Samsonite LLC or its U.S. subsidiaries), together with Samsonite’s intellectual property rights in the U.S. and Samsonite’s rights under licenses of such intellectual property to affiliates or third parties. The PBGC’s lien, which is in the amount of US$35.8 million, is equal and ratable with the lien granted over such assets to Samsonite’s senior secured lenders. Other provisions of the agreement restrict the transfer of U.S. assets outside of the ordinary course of business. The Group is in compliance with these requirements as of December 31, 2015.
The agreement will expire upon (a) the Group obtaining investment grade status on its senior unsecured debt, (b) the date the plan has no unfunded benefit liabilities for two consecutive plan years, (c) the date on which the Group becomes part of a controlled company whose unsecured debt has investment grade status, or (d) the date the plan is successfully terminated.
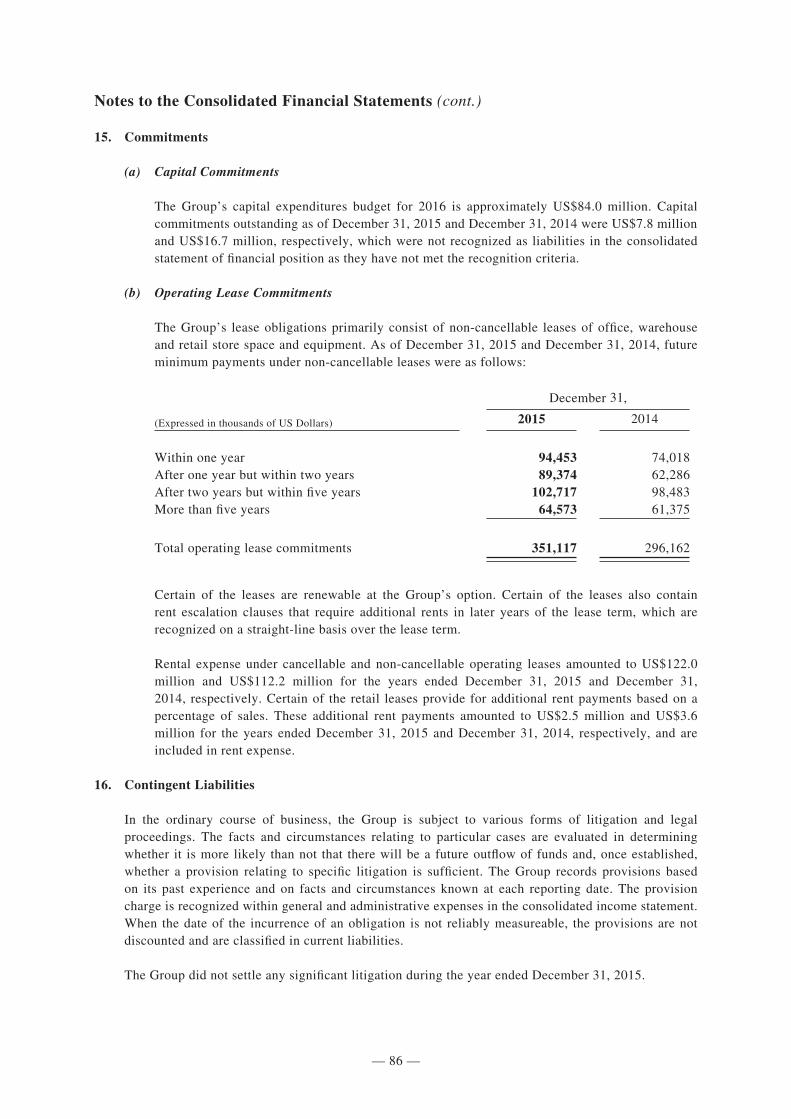
— 86 —
284502 \ (Samsonite_Luxembourg) \ 19/04/2016 \ M38 / Size (210x297)
Notes to the Consolidated Financial Statements (cont.)
15. Commitments
(a) Capital Commitments
The Group’s capital expenditures budget for 2016 is approximately US$84.0 million. Capital commitments outstanding as of December 31, 2015 and December 31, 2014 were US$7.8 million and US$16.7 million, respectively, which were not recognized as liabilities in the consolidated statement of financial position as they have not met the recognition criteria.
(b) Operating Lease Commitments
The Group’s lease obligations primarily consist of non-cancellable leases of office, warehouse and retail store space and equipment. As of December 31, 2015 and December 31, 2014, future minimum payments under non-cancellable leases were as follows:
December 31,
(Expressed in thousands of US Dollars) 2015 2014
Within one year 94,453 74,018After one year but within two years 89,374 62,286After two years but within five years 102,717 98,483More than five years 64,573 61,375
Total operating lease commitments 351,117 296,162
Certain of the leases are renewable at the Group’s option. Certain of the leases also contain rent escalation clauses that require additional rents in later years of the lease term, which are recognized on a straight-line basis over the lease term.
Rental expense under cancellable and non-cancellable operating leases amounted to US$122.0 million and US$112.2 million for the years ended December 31, 2015 and December 31, 2014, respectively. Certain of the retail leases provide for additional rent payments based on a percentage of sales. These additional rent payments amounted to US$2.5 million and US$3.6 million for the years ended December 31, 2015 and December 31, 2014, respectively, and are included in rent expense.
16. Contingent Liabilities
In the ordinary course of business, the Group is subject to various forms of litigation and legal proceedings. The facts and circumstances relating to particular cases are evaluated in determining whether it is more likely than not that there will be a future outflow of funds and, once established, whether a provision relating to specific litigation is sufficient. The Group records provisions based on its past experience and on facts and circumstances known at each reporting date. The provision charge is recognized within general and administrative expenses in the consolidated income statement. When the date of the incurrence of an obligation is not reliably measureable, the provisions are not discounted and are classified in current liabilities.
The Group did not settle any significant litigation during the year ended December 31, 2015.
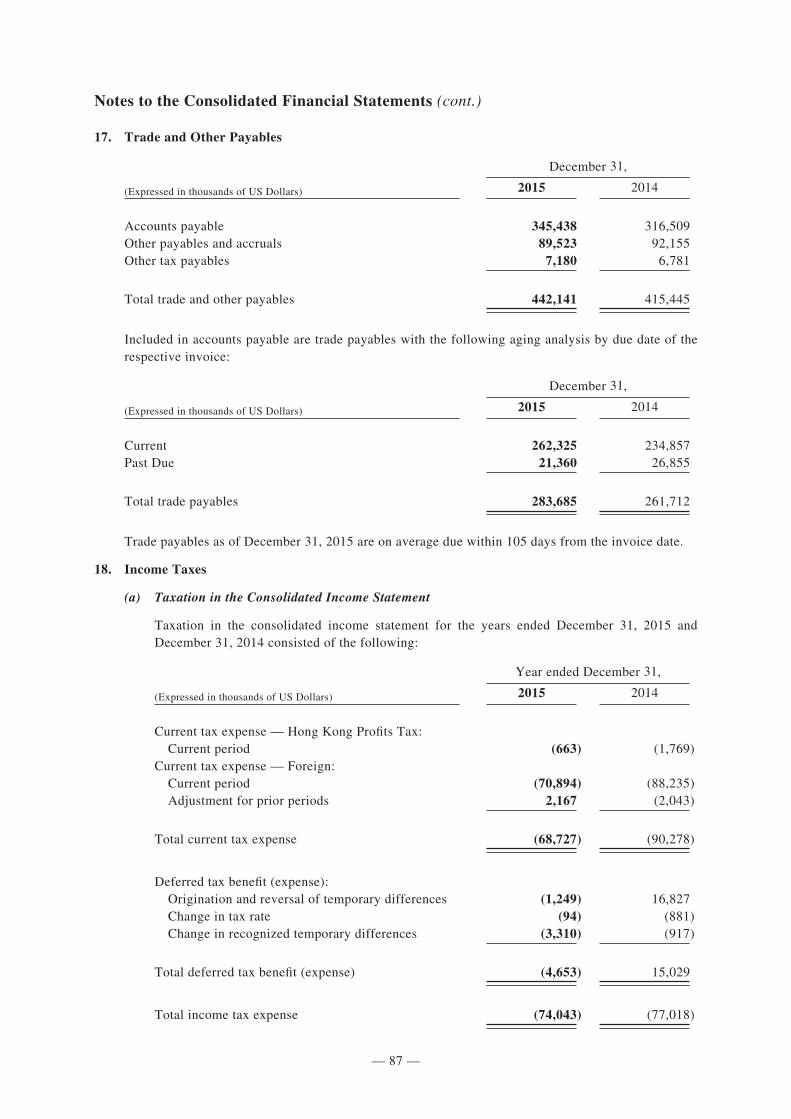
— 87 —
284502 \ (Samsonite_Luxembourg) \ 19/04/2016 \ M38 / Size (210x297)
Notes to the Consolidated Financial Statements (cont.)
17. Trade and Other Payables
December 31,
(Expressed in thousands of US Dollars) 2015 2014
Accounts payable 345,438 316,509Other payables and accruals 89,523 92,155Other tax payables 7,180 6,781
Total trade and other payables 442,141 415,445
Included in accounts payable are trade payables with the following aging analysis by due date of the respective invoice:
December 31,
(Expressed in thousands of US Dollars) 2015 2014
Current 262,325 234,857Past Due 21,360 26,855
Total trade payables 283,685 261,712
Trade payables as of December 31, 2015 are on average due within 105 days from the invoice date.
18. Income Taxes
(a) Taxation in the Consolidated Income Statement
Taxation in the consolidated income statement for the years ended December 31, 2015 and December 31, 2014 consisted of the following:
Year ended December 31,
(Expressed in thousands of US Dollars) 2015 2014
Current tax expense — Hong Kong Profits Tax: Current period (663) (1,769)Current tax expense — Foreign: Current period (70,894) (88,235) Adjustment for prior periods 2,167 (2,043)
Total current tax expense (68,727) (90,278)
Deferred tax benefit (expense): Origination and reversal of temporary differences (1,249) 16,827 Change in tax rate (94) (881) Change in recognized temporary differences (3,310) (917)
Total deferred tax benefit (expense) (4,653) 15,029
Total income tax expense (74,043) (77,018)
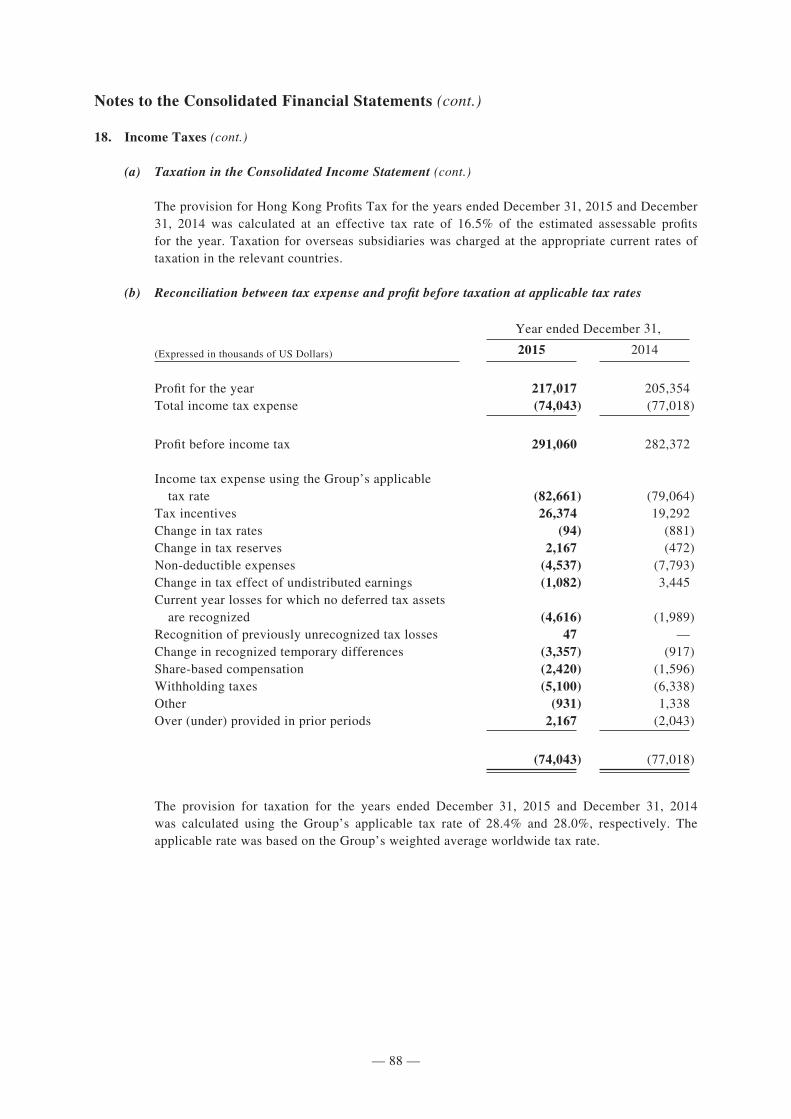
— 88 —
284502 \ (Samsonite_Luxembourg) \ 19/04/2016 \ M38 / Size (210x297)
Notes to the Consolidated Financial Statements (cont.)
18. Income Taxes (cont.)
(a) Taxation in the Consolidated Income Statement (cont.)
The provision for Hong Kong Profits Tax for the years ended December 31, 2015 and December 31, 2014 was calculated at an effective tax rate of 16.5% of the estimated assessable profits for the year. Taxation for overseas subsidiaries was charged at the appropriate current rates of taxation in the relevant countries.
(b) Reconciliation between tax expense and profit before taxation at applicable tax rates
Year ended December 31,
(Expressed in thousands of US Dollars) 2015 2014
Profit for the year 217,017 205,354Total income tax expense (74,043) (77,018)
Profit before income tax 291,060 282,372
Income tax expense using the Group’s applicable tax rate (82,661) (79,064)Tax incentives 26,374 19,292Change in tax rates (94) (881)Change in tax reserves 2,167 (472)Non-deductible expenses (4,537) (7,793)Change in tax effect of undistributed earnings (1,082) 3,445Current year losses for which no deferred tax assets are recognized (4,616) (1,989)Recognition of previously unrecognized tax losses 47 —Change in recognized temporary differences (3,357) (917)Share-based compensation (2,420) (1,596)Withholding taxes (5,100) (6,338)Other (931) 1,338Over (under) provided in prior periods 2,167 (2,043)
(74,043) (77,018)
The provision for taxation for the years ended December 31, 2015 and December 31, 2014 was calculated using the Group’s applicable tax rate of 28.4% and 28.0%, respectively. The applicable rate was based on the Group’s weighted average worldwide tax rate.
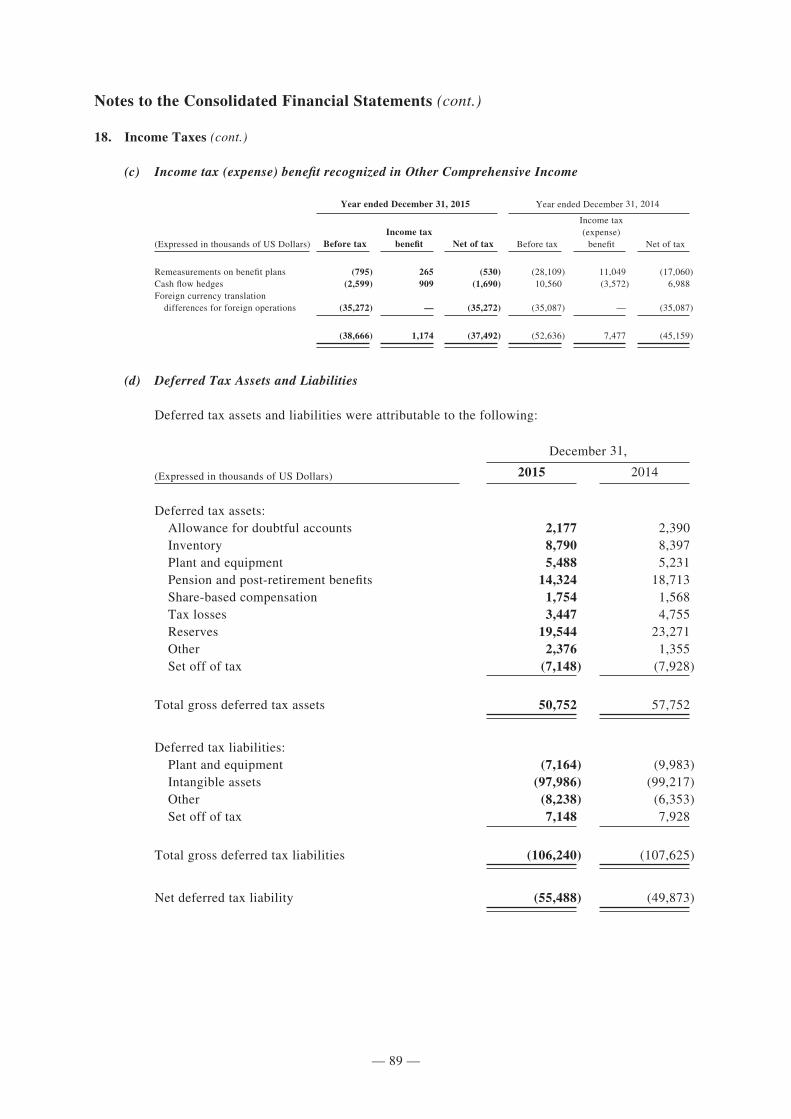
— 89 —
284502 \ (Samsonite_Luxembourg) \ 19/04/2016 \ M38 / Size (210x297)
Notes to the Consolidated Financial Statements (cont.)
18. Income Taxes (cont.)
(c) Income tax (expense) benefit recognized in Other Comprehensive Income
Year ended December 31, 2015 Year ended December 31, 2014
(Expressed in thousands of US Dollars) Before taxIncome tax
benefit Net of tax Before tax
Income tax (expense)
benefit Net of tax
Remeasurements on benefit plans (795) 265 (530) (28,109) 11,049 (17,060)Cash flow hedges (2,599) 909 (1,690) 10,560 (3,572) 6,988Foreign currency translation differences for foreign operations (35,272) — (35,272) (35,087) — (35,087)
(38,666) 1,174 (37,492) (52,636) 7,477 (45,159)
(d) Deferred Tax Assets and Liabilities
Deferred tax assets and liabilities were attributable to the following:
December 31,
(Expressed in thousands of US Dollars) 2015 2014
Deferred tax assets: Allowance for doubtful accounts 2,177 2,390 Inventory 8,790 8,397 Plant and equipment 5,488 5,231 Pension and post-retirement benefits 14,324 18,713 Share-based compensation 1,754 1,568 Tax losses 3,447 4,755 Reserves 19,544 23,271 Other 2,376 1,355 Set off of tax (7,148) (7,928)
Total gross deferred tax assets 50,752 57,752
Deferred tax liabilities: Plant and equipment (7,164) (9,983) Intangible assets (97,986) (99,217) Other (8,238) (6,353) Set off of tax 7,148 7,928
Total gross deferred tax liabilities (106,240) (107,625)
Net deferred tax liability (55,488) (49,873)
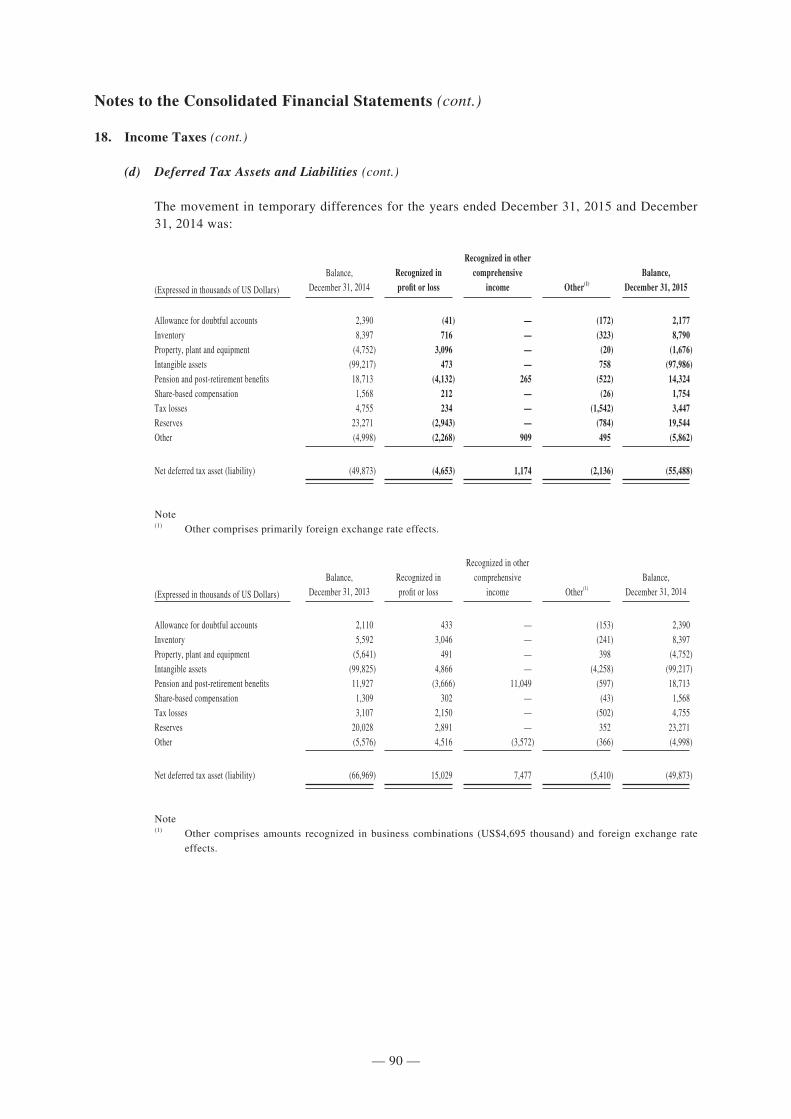
— 90 —
284502 \ (Samsonite_Luxembourg) \ 19/04/2016 \ M38 / Size (210x297)
Notes to the Consolidated Financial Statements (cont.)
18. Income Taxes (cont.)
(d) Deferred Tax Assets and Liabilities (cont.)
The movement in temporary differences for the years ended December 31, 2015 and December 31, 2014 was:
(Expressed in thousands of US Dollars)
Balance,December 31, 2014
Recognized inprofit or loss
Recognized in other comprehensive
income Other(1)
Balance,December 31, 2015
Allowance for doubtful accounts 2,390 (41) — (172) 2,177Inventory 8,397 716 — (323) 8,790Property, plant and equipment (4,752) 3,096 — (20) (1,676)Intangible assets (99,217) 473 — 758 (97,986)Pension and post-retirement benefits 18,713 (4,132) 265 (522) 14,324Share-based compensation 1,568 212 — (26) 1,754Tax losses 4,755 234 — (1,542) 3,447Reserves 23,271 (2,943) — (784) 19,544Other (4,998) (2,268) 909 495 (5,862)
Net deferred tax asset (liability) (49,873) (4,653) 1,174 (2,136) (55,488)
Note(1) Other comprises primarily foreign exchange rate effects.
(Expressed in thousands of US Dollars)
Balance,December 31, 2013
Recognized inprofit or loss
Recognized in other comprehensive
income Other(1)
Balance,December 31, 2014
Allowance for doubtful accounts 2,110 433 — (153) 2,390Inventory 5,592 3,046 — (241) 8,397Property, plant and equipment (5,641) 491 — 398 (4,752)Intangible assets (99,825) 4,866 — (4,258) (99,217)Pension and post-retirement benefits 11,927 (3,666) 11,049 (597) 18,713Share-based compensation 1,309 302 — (43) 1,568Tax losses 3,107 2,150 — (502) 4,755Reserves 20,028 2,891 — 352 23,271Other (5,576) 4,516 (3,572) (366) (4,998)
Net deferred tax asset (liability) (66,969) 15,029 7,477 (5,410) (49,873)
Note(1) Other comprises amounts recognized in business combinations (US$4,695 thousand) and foreign exchange rate
effects.
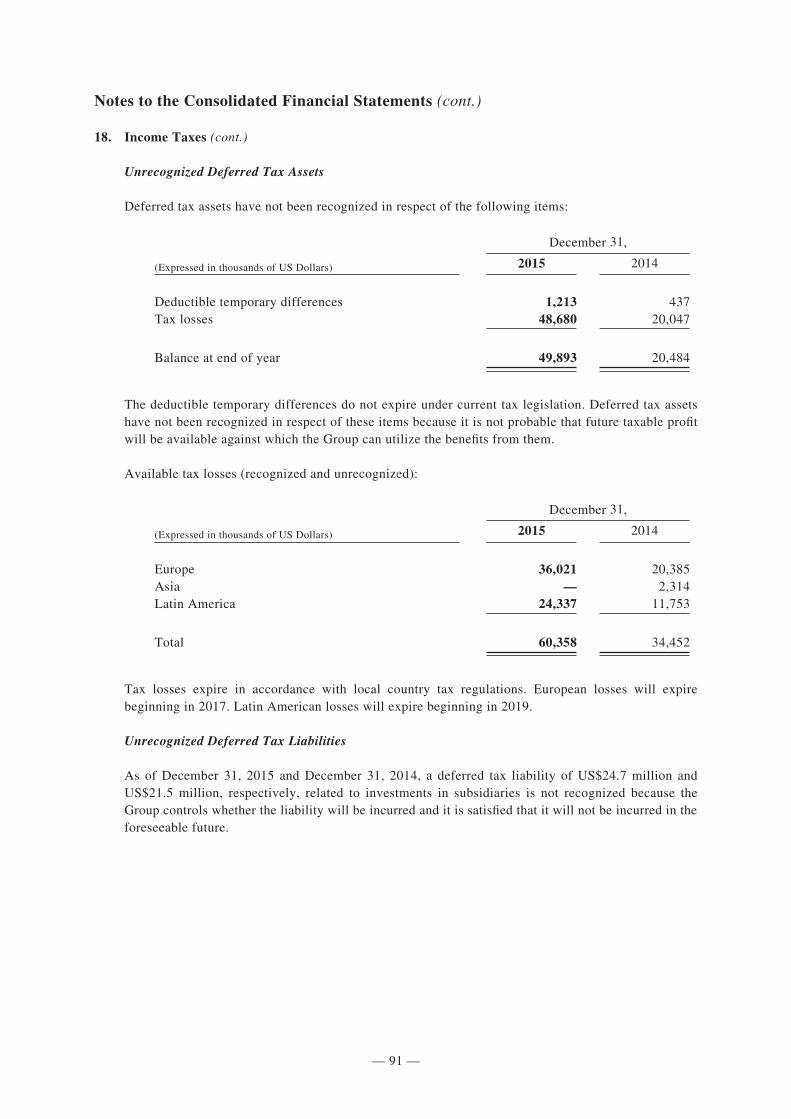
— 91 —
284502 \ (Samsonite_Luxembourg) \ 19/04/2016 \ M38 / Size (210x297)
Notes to the Consolidated Financial Statements (cont.)
18. Income Taxes (cont.)
Unrecognized Deferred Tax Assets
Deferred tax assets have not been recognized in respect of the following items:
December 31,
(Expressed in thousands of US Dollars) 2015 2014
Deductible temporary differences 1,213 437Tax losses 48,680 20,047
Balance at end of year 49,893 20,484
The deductible temporary differences do not expire under current tax legislation. Deferred tax assets have not been recognized in respect of these items because it is not probable that future taxable profit will be available against which the Group can utilize the benefits from them.
Available tax losses (recognized and unrecognized):
December 31,
(Expressed in thousands of US Dollars) 2015 2014
Europe 36,021 20,385Asia — 2,314Latin America 24,337 11,753
Total 60,358 34,452
Tax losses expire in accordance with local country tax regulations. European losses will expire beginning in 2017. Latin American losses will expire beginning in 2019.
Unrecognized Deferred Tax Liabilities
As of December 31, 2015 and December 31, 2014, a deferred tax liability of US$24.7 million and US$21.5 million, respectively, related to investments in subsidiaries is not recognized because the Group controls whether the liability will be incurred and it is satisfied that it will not be incurred in the foreseeable future.
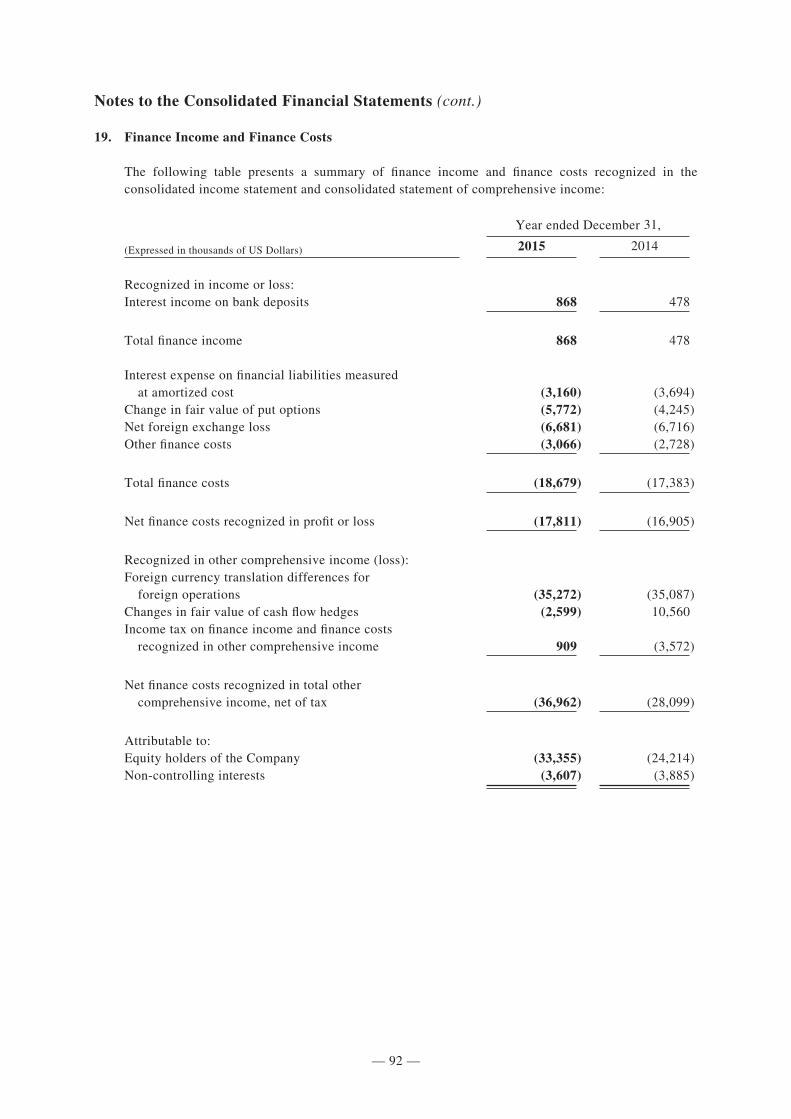
— 92 —
284502 \ (Samsonite_Luxembourg) \ 19/04/2016 \ M38 / Size (210x297)
Notes to the Consolidated Financial Statements (cont.)
19. Finance Income and Finance Costs
The following table presents a summary of finance income and finance costs recognized in the consolidated income statement and consolidated statement of comprehensive income:
Year ended December 31,
(Expressed in thousands of US Dollars) 2015 2014
Recognized in income or loss:Interest income on bank deposits 868 478
Total finance income 868 478
Interest expense on financial liabilities measured at amortized cost (3,160) (3,694)Change in fair value of put options (5,772) (4,245)Net foreign exchange loss (6,681) (6,716)Other finance costs (3,066) (2,728)
Total finance costs (18,679) (17,383)
Net finance costs recognized in profit or loss (17,811) (16,905)
Recognized in other comprehensive income (loss):Foreign currency translation differences for foreign operations (35,272) (35,087)Changes in fair value of cash flow hedges (2,599) 10,560Income tax on finance income and finance costs recognized in other comprehensive income 909 (3,572)
Net finance costs recognized in total other comprehensive income, net of tax (36,962) (28,099)
Attributable to:Equity holders of the Company (33,355) (24,214)Non-controlling interests (3,607) (3,885)
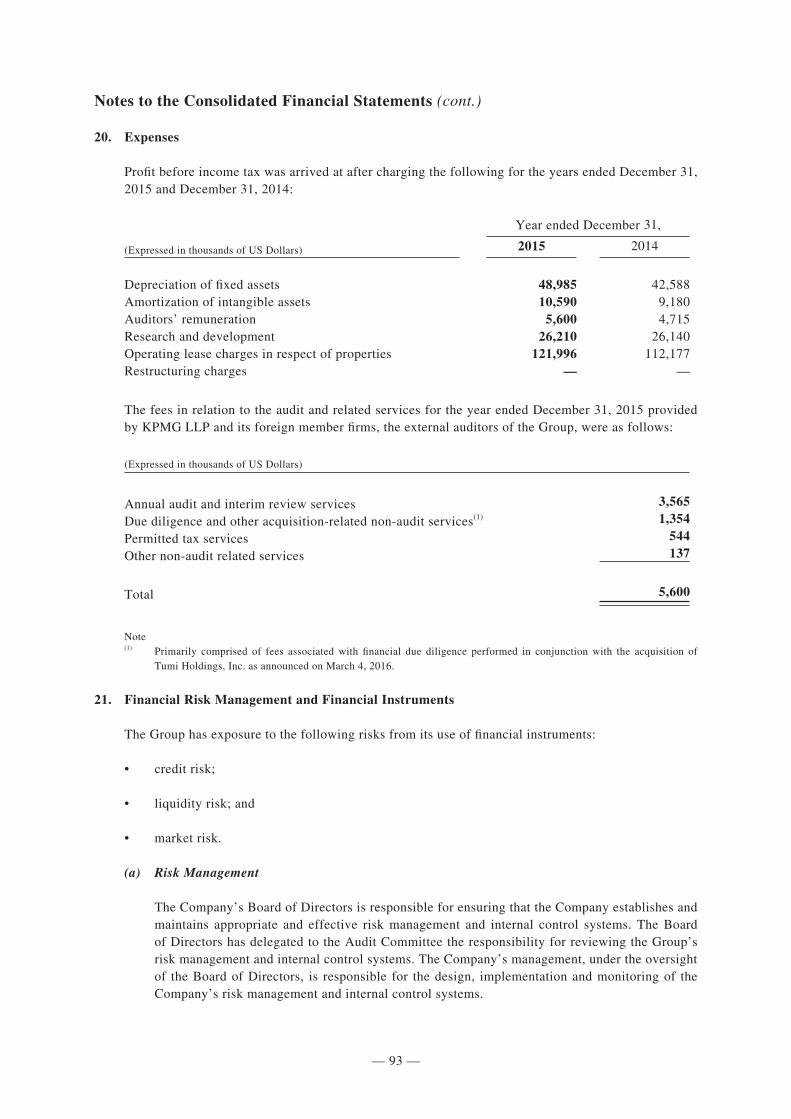
— 93 —
284502 \ (Samsonite_Luxembourg) \ 19/04/2016 \ M38 / Size (210x297)
Notes to the Consolidated Financial Statements (cont.)
20. Expenses
Profit before income tax was arrived at after charging the following for the years ended December 31, 2015 and December 31, 2014:
Year ended December 31,
(Expressed in thousands of US Dollars) 2015 2014
Depreciation of fixed assets 48,985 42,588Amortization of intangible assets 10,590 9,180Auditors’ remuneration 5,600 4,715Research and development 26,210 26,140Operating lease charges in respect of properties 121,996 112,177Restructuring charges — —
The fees in relation to the audit and related services for the year ended December 31, 2015 provided by KPMG LLP and its foreign member firms, the external auditors of the Group, were as follows:
(Expressed in thousands of US Dollars)
Annual audit and interim review services 3,565
Due diligence and other acquisition-related non-audit services(1) 1,354
Permitted tax services 544
Other non-audit related services 137
Total 5,600
Note(1) Primarily comprised of fees associated with financial due diligence performed in conjunction with the acquisition of
Tumi Holdings, Inc. as announced on March 4, 2016.
21. Financial Risk Management and Financial Instruments
The Group has exposure to the following risks from its use of financial instruments:
• credit risk;
• liquidity risk; and
• market risk.
(a) Risk Management
The Company’s Board of Directors is responsible for ensuring that the Company establishes and maintains appropriate and effective risk management and internal control systems. The Board of Directors has delegated to the Audit Committee the responsibility for reviewing the Group’s risk management and internal control systems. The Company’s management, under the oversight of the Board of Directors, is responsible for the design, implementation and monitoring of the Company’s risk management and internal control systems.
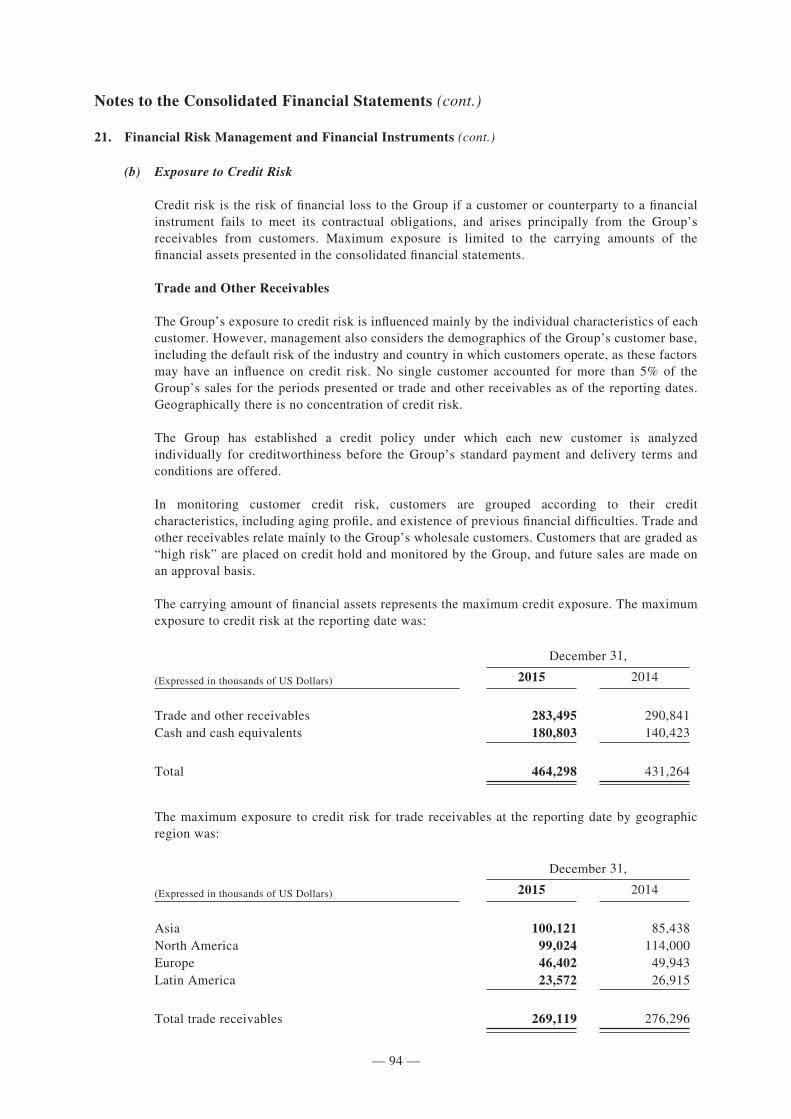
— 94 —
284502 \ (Samsonite_Luxembourg) \ 19/04/2016 \ M38 / Size (210x297)
Notes to the Consolidated Financial Statements (cont.)
21. Financial Risk Management and Financial Instruments (cont.)
(b) Exposure to Credit Risk
Credit risk is the risk of financial loss to the Group if a customer or counterparty to a financial instrument fails to meet its contractual obligations, and arises principally from the Group’s receivables from customers. Maximum exposure is limited to the carrying amounts of the financial assets presented in the consolidated financial statements.
Trade and Other Receivables
The Group’s exposure to credit risk is influenced mainly by the individual characteristics of each customer. However, management also considers the demographics of the Group’s customer base, including the default risk of the industry and country in which customers operate, as these factors may have an influence on credit risk. No single customer accounted for more than 5% of the Group’s sales for the periods presented or trade and other receivables as of the reporting dates. Geographically there is no concentration of credit risk.
The Group has established a credit policy under which each new customer is analyzed individually for creditworthiness before the Group’s standard payment and delivery terms and conditions are offered.
In monitoring customer credit risk, customers are grouped according to their credit characteristics, including aging profile, and existence of previous financial difficulties. Trade and other receivables relate mainly to the Group’s wholesale customers. Customers that are graded as “high risk” are placed on credit hold and monitored by the Group, and future sales are made on an approval basis.
The carrying amount of financial assets represents the maximum credit exposure. The maximum exposure to credit risk at the reporting date was:
December 31,
(Expressed in thousands of US Dollars) 2015 2014
Trade and other receivables 283,495 290,841Cash and cash equivalents 180,803 140,423
Total 464,298 431,264
The maximum exposure to credit risk for trade receivables at the reporting date by geographic region was:
December 31,
(Expressed in thousands of US Dollars) 2015 2014
Asia 100,121 85,438North America 99,024 114,000Europe 46,402 49,943Latin America 23,572 26,915
Total trade receivables 269,119 276,296
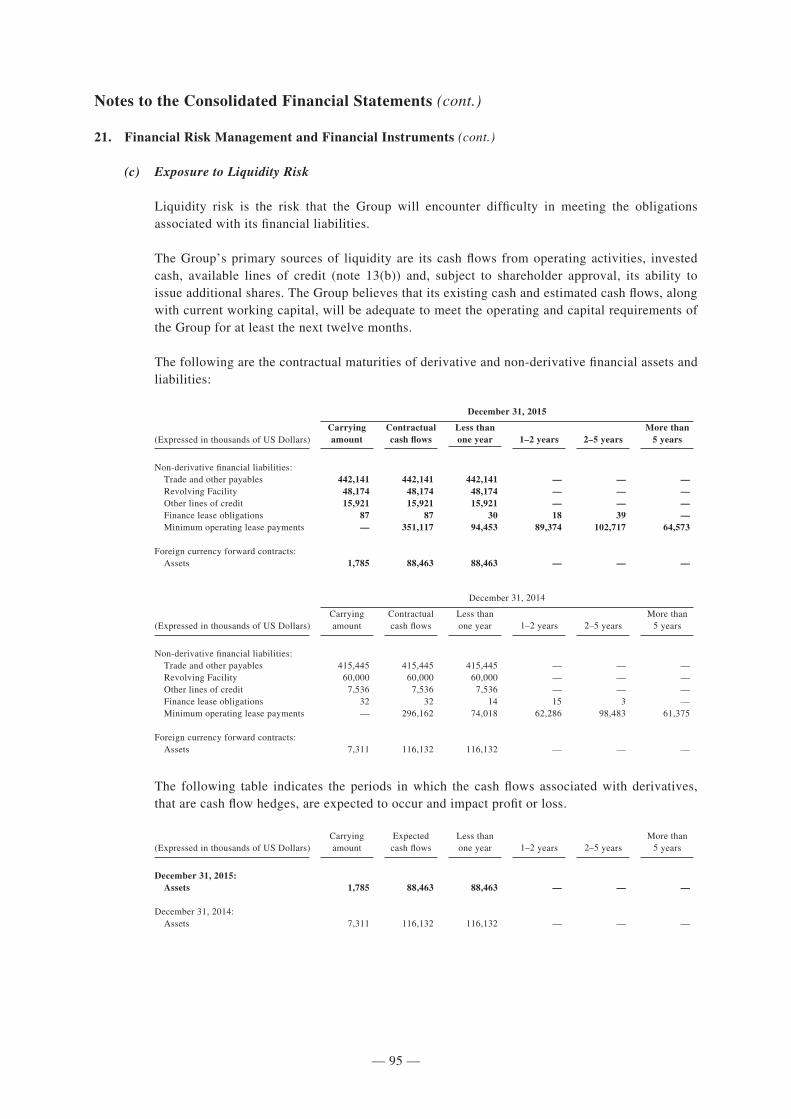
— 95 —
284502 \ (Samsonite_Luxembourg) \ 19/04/2016 \ M38 / Size (210x297)
Notes to the Consolidated Financial Statements (cont.)
21. Financial Risk Management and Financial Instruments (cont.)
(c) Exposure to Liquidity Risk
Liquidity risk is the risk that the Group will encounter difficulty in meeting the obligations associated with its financial liabilities.
The Group’s primary sources of liquidity are its cash flows from operating activities, invested cash, available lines of credit (note 13(b)) and, subject to shareholder approval, its ability to issue additional shares. The Group believes that its existing cash and estimated cash flows, along with current working capital, will be adequate to meet the operating and capital requirements of the Group for at least the next twelve months.
The following are the contractual maturities of derivative and non-derivative financial assets and liabilities:
December 31, 2015
(Expressed in thousands of US Dollars)Carrying amount
Contractual cash flows
Less thanone year 1–2 years 2–5 years
More than5 years
Non-derivative financial liabilities: Trade and other payables 442,141 442,141 442,141 — — — Revolving Facility 48,174 48,174 48,174 — — — Other lines of credit 15,921 15,921 15,921 — — — Finance lease obligations 87 87 30 18 39 — Minimum operating lease payments — 351,117 94,453 89,374 102,717 64,573
Foreign currency forward contracts: Assets 1,785 88,463 88,463 — — —
December 31, 2014
(Expressed in thousands of US Dollars)Carrying amount
Contractual cash flows
Less thanone year 1–2 years 2–5 years
More than5 years
Non-derivative financial liabilities: Trade and other payables 415,445 415,445 415,445 — — — Revolving Facility 60,000 60,000 60,000 — — — Other lines of credit 7,536 7,536 7,536 — — — Finance lease obligations 32 32 14 15 3 — Minimum operating lease payments — 296,162 74,018 62,286 98,483 61,375
Foreign currency forward contracts: Assets 7,311 116,132 116,132 — — —
The following table indicates the periods in which the cash flows associated with derivatives, that are cash flow hedges, are expected to occur and impact profit or loss.
(Expressed in thousands of US Dollars)Carrying amount
Expectedcash flows
Less thanone year 1–2 years 2–5 years
More than5 years
December 31, 2015: Assets 1,785 88,463 88,463 — — —
December 31, 2014: Assets 7,311 116,132 116,132 — — —
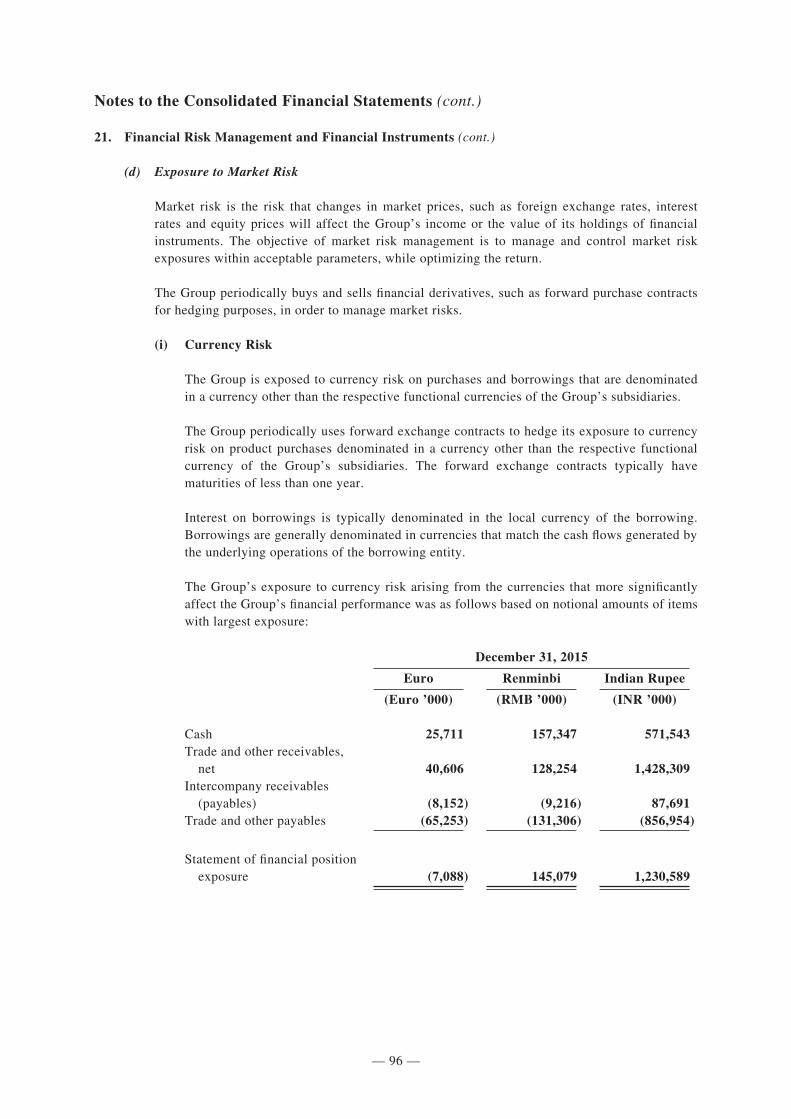
— 96 —
284502 \ (Samsonite_Luxembourg) \ 19/04/2016 \ M38 / Size (210x297)
Notes to the Consolidated Financial Statements (cont.)
21. Financial Risk Management and Financial Instruments (cont.)
(d) Exposure to Market Risk
Market risk is the risk that changes in market prices, such as foreign exchange rates, interest rates and equity prices will affect the Group’s income or the value of its holdings of financial instruments. The objective of market risk management is to manage and control market risk exposures within acceptable parameters, while optimizing the return.
The Group periodically buys and sells financial derivatives, such as forward purchase contracts for hedging purposes, in order to manage market risks.
(i) Currency Risk
The Group is exposed to currency risk on purchases and borrowings that are denominated in a currency other than the respective functional currencies of the Group’s subsidiaries.
The Group periodically uses forward exchange contracts to hedge its exposure to currency risk on product purchases denominated in a currency other than the respective functional currency of the Group’s subsidiaries. The forward exchange contracts typically have maturities of less than one year.
Interest on borrowings is typically denominated in the local currency of the borrowing. Borrowings are generally denominated in currencies that match the cash flows generated by the underlying operations of the borrowing entity.
The Group’s exposure to currency risk arising from the currencies that more significantly affect the Group’s financial performance was as follows based on notional amounts of items with largest exposure:
December 31, 2015
Euro Renminbi Indian Rupee
(Euro ’000) (RMB ’000) (INR ’000)
Cash 25,711 157,347 571,543Trade and other receivables, net 40,606 128,254 1,428,309Intercompany receivables (payables) (8,152) (9,216) 87,691Trade and other payables (65,253) (131,306) (856,954)
Statement of financial position exposure (7,088) 145,079 1,230,589
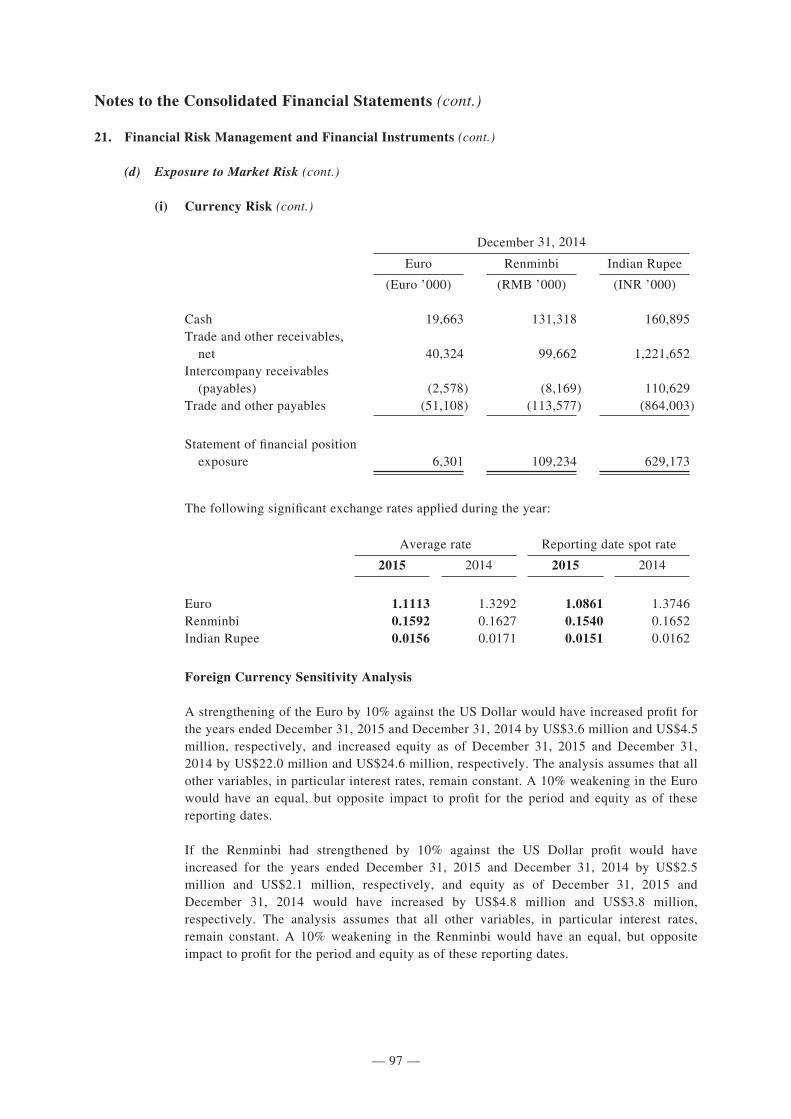
— 97 —
284502 \ (Samsonite_Luxembourg) \ 19/04/2016 \ M38 / Size (210x297)
Notes to the Consolidated Financial Statements (cont.)
21. Financial Risk Management and Financial Instruments (cont.)
(d) Exposure to Market Risk (cont.)
(i) Currency Risk (cont.)
December 31, 2014
Euro Renminbi Indian Rupee
(Euro ’000) (RMB ’000) (INR ’000)
Cash 19,663 131,318 160,895Trade and other receivables, net 40,324 99,662 1,221,652Intercompany receivables (payables) (2,578) (8,169) 110,629Trade and other payables (51,108) (113,577) (864,003)
Statement of financial position exposure 6,301 109,234 629,173
The following significant exchange rates applied during the year:
Average rate Reporting date spot rate
2015 2014 2015 2014
Euro 1.1113 1.3292 1.0861 1.3746Renminbi 0.1592 0.1627 0.1540 0.1652Indian Rupee 0.0156 0.0171 0.0151 0.0162
Foreign Currency Sensitivity Analysis
A strengthening of the Euro by 10% against the US Dollar would have increased profit for the years ended December 31, 2015 and December 31, 2014 by US$3.6 million and US$4.5 million, respectively, and increased equity as of December 31, 2015 and December 31, 2014 by US$22.0 million and US$24.6 million, respectively. The analysis assumes that all other variables, in particular interest rates, remain constant. A 10% weakening in the Euro would have an equal, but opposite impact to profit for the period and equity as of these reporting dates.
If the Renminbi had strengthened by 10% against the US Dollar profit would have increased for the years ended December 31, 2015 and December 31, 2014 by US$2.5 million and US$2.1 million, respectively, and equity as of December 31, 2015 and December 31, 2014 would have increased by US$4.8 million and US$3.8 million, respectively. The analysis assumes that all other variables, in particular interest rates, remain constant. A 10% weakening in the Renminbi would have an equal, but opposite impact to profit for the period and equity as of these reporting dates.
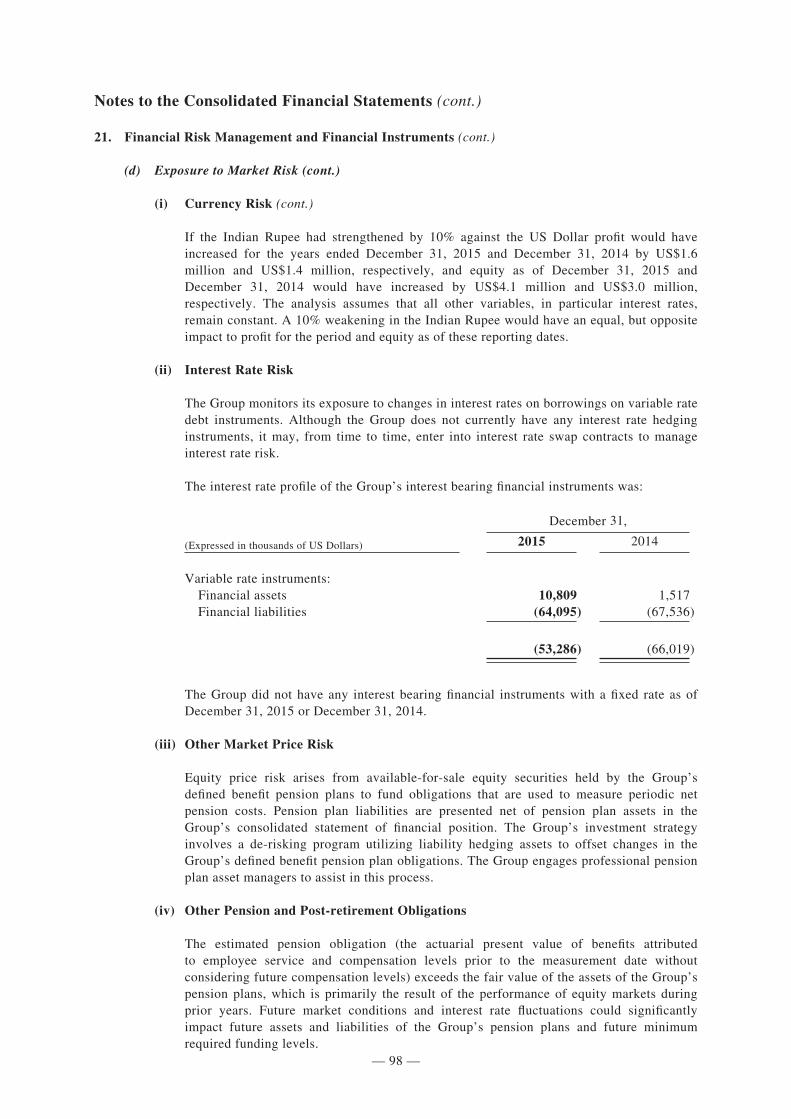
— 98 —
284502 \ (Samsonite_Luxembourg) \ 19/04/2016 \ M38 / Size (210x297)
Notes to the Consolidated Financial Statements (cont.)
21. Financial Risk Management and Financial Instruments (cont.)
(d) Exposure to Market Risk (cont.)
(i) Currency Risk (cont.)
If the Indian Rupee had strengthened by 10% against the US Dollar profit would have increased for the years ended December 31, 2015 and December 31, 2014 by US$1.6 million and US$1.4 million, respectively, and equity as of December 31, 2015 and December 31, 2014 would have increased by US$4.1 million and US$3.0 million, respectively. The analysis assumes that all other variables, in particular interest rates, remain constant. A 10% weakening in the Indian Rupee would have an equal, but opposite impact to profit for the period and equity as of these reporting dates.
(ii) Interest Rate Risk
The Group monitors its exposure to changes in interest rates on borrowings on variable rate debt instruments. Although the Group does not currently have any interest rate hedging instruments, it may, from time to time, enter into interest rate swap contracts to manage interest rate risk.
The interest rate profile of the Group’s interest bearing financial instruments was:
December 31,
(Expressed in thousands of US Dollars) 2015 2014
Variable rate instruments: Financial assets 10,809 1,517 Financial liabilities (64,095) (67,536)
(53,286) (66,019)
The Group did not have any interest bearing financial instruments with a fixed rate as of December 31, 2015 or December 31, 2014.
(iii) Other Market Price Risk
Equity price risk arises from available-for-sale equity securities held by the Group’s defined benefit pension plans to fund obligations that are used to measure periodic net pension costs. Pension plan liabilities are presented net of pension plan assets in the Group’s consolidated statement of financial position. The Group’s investment strategy involves a de-risking program utilizing liability hedging assets to offset changes in the Group’s defined benefit pension plan obligations. The Group engages professional pension plan asset managers to assist in this process.
(iv) Other Pension and Post-retirement Obligations
The estimated pension obligation (the actuarial present value of benefits attributed to employee service and compensation levels prior to the measurement date without considering future compensation levels) exceeds the fair value of the assets of the Group’s pension plans, which is primarily the result of the performance of equity markets during prior years. Future market conditions and interest rate fluctuations could significantly impact future assets and liabilities of the Group’s pension plans and future minimum required funding levels.

— 99 —
284502 \ (Samsonite_Luxembourg) \ 19/04/2016 \ M38 / Size (210x297)
Notes to the Consolidated Financial Statements (cont.)
21. Financial Risk Management and Financial Instruments (cont.)
(e) Capital Management
The primary objective of the Group’s capital management policies is to safeguard its ability to continue as a going concern, to provide returns for shareholders, to fund capital expenditures, normal operating expenses and working capital needs, and to pay obligations. The primary source of cash is revenue from sales of the Group’s products. The Group anticipates generating sufficient cash flow from operations in the majority of countries where it operates and will have sufficient available cash and ability to draw on credit facilities for funding to satisfy the working capital and financing needs.
The Group’s capital needs are primarily managed through cash and cash equivalents (note 11), trade and other receivables (note 10), inventories (note 9), property plant and equipment (note 6), trade and other payables (note 17) and loans and borrowings (note 13).
(f) Fair Value Versus Carrying Amounts
All financial assets and liabilities have fair values that approximate carrying amounts.
(g) Fair Value of Financial Instruments
Fair value is the price that would be received to sell an asset or paid to transfer a liability in an orderly transaction between market participants at the measurement date. IFRS establishes a fair value hierarchy that prioritizes the inputs to valuation techniques used to measure fair value. The hierarchy gives the highest priority to unadjusted quoted prices in active markets for identical assets or liabilities (Level 1 measurements) and the lowest priority to measurements involving significant unobservable inputs (Level 3 measurements). The three levels of the fair value hierarchy are as follows:
• Level 1 inputs are quoted prices (unadjusted) in active markets for identical assets or liabilities that the Group has the ability to access at the measurement date.
• Level 2 inputs are inputs other than quoted prices included within Level 1 that are observable for the asset or liability, either directly or indirectly.
• Level 3 inputs are unobservable inputs for the asset or liability.
The level in the fair value hierarchy within which a fair measurement in its entirety falls is based on the lowest level input that is significant to the fair value measurement in its entirety.
The carrying amount of cash and cash equivalents, trade receivables, accounts payable, short-term debt, and accrued expenses approximates fair value because of the short maturity or duration of these instruments.
The fair value of foreign currency forward contracts is estimated by reference to market quotations received from banks.
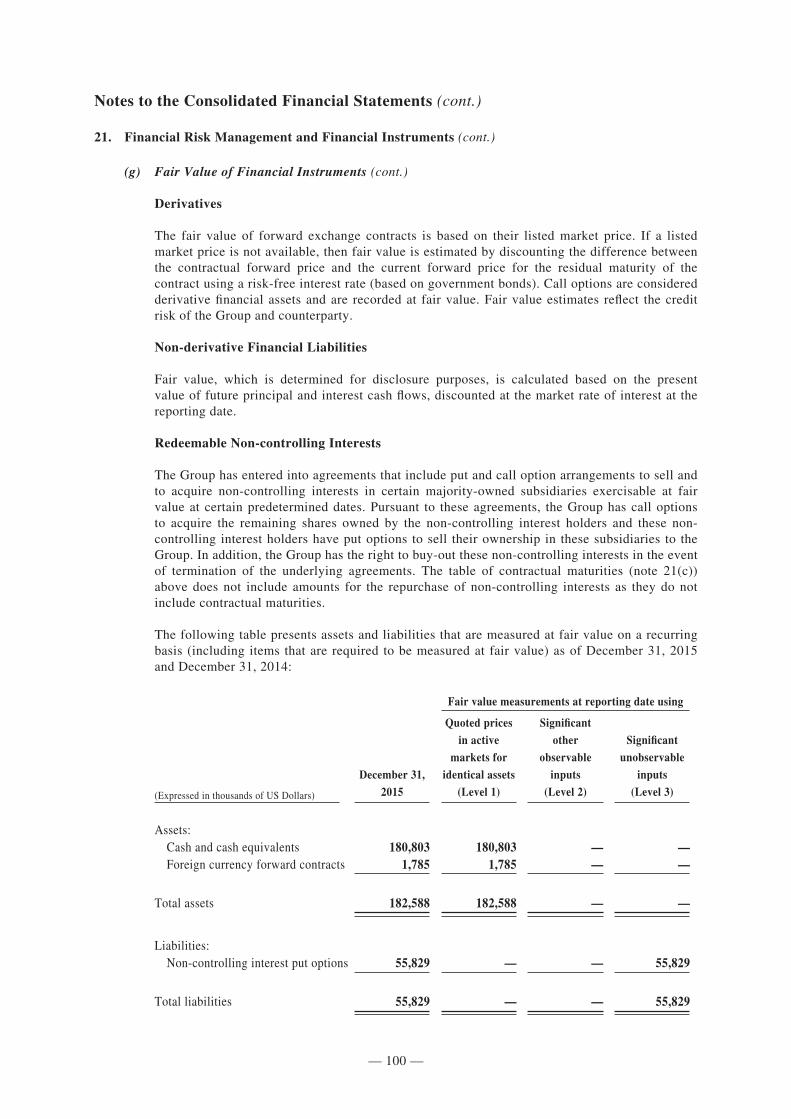
— 100 —
284502 \ (Samsonite_Luxembourg) \ 19/04/2016 \ M38 / Size (210x297)
Notes to the Consolidated Financial Statements (cont.)
21. Financial Risk Management and Financial Instruments (cont.)
(g) Fair Value of Financial Instruments (cont.)
Derivatives
The fair value of forward exchange contracts is based on their listed market price. If a listed market price is not available, then fair value is estimated by discounting the difference between the contractual forward price and the current forward price for the residual maturity of the contract using a risk-free interest rate (based on government bonds). Call options are considered derivative financial assets and are recorded at fair value. Fair value estimates reflect the credit risk of the Group and counterparty.
Non-derivative Financial Liabilities
Fair value, which is determined for disclosure purposes, is calculated based on the present value of future principal and interest cash flows, discounted at the market rate of interest at the reporting date.
Redeemable Non-controlling Interests
The Group has entered into agreements that include put and call option arrangements to sell and to acquire non-controlling interests in certain majority-owned subsidiaries exercisable at fair value at certain predetermined dates. Pursuant to these agreements, the Group has call options to acquire the remaining shares owned by the non-controlling interest holders and these non-controlling interest holders have put options to sell their ownership in these subsidiaries to the Group. In addition, the Group has the right to buy-out these non-controlling interests in the event of termination of the underlying agreements. The table of contractual maturities (note 21(c)) above does not include amounts for the repurchase of non-controlling interests as they do not include contractual maturities.
The following table presents assets and liabilities that are measured at fair value on a recurring basis (including items that are required to be measured at fair value) as of December 31, 2015 and December 31, 2014:
Fair value measurements at reporting date using
(Expressed in thousands of US Dollars)
December 31,
2015
Quoted prices
in active
markets for
identical assets
(Level 1)
Significant
other
observable
inputs
(Level 2)
Significant
unobservable
inputs
(Level 3)
Assets: Cash and cash equivalents 180,803 180,803 — — Foreign currency forward contracts 1,785 1,785 — —
Total assets 182,588 182,588 — —
Liabilities: Non-controlling interest put options 55,829 — — 55,829
Total liabilities 55,829 — — 55,829
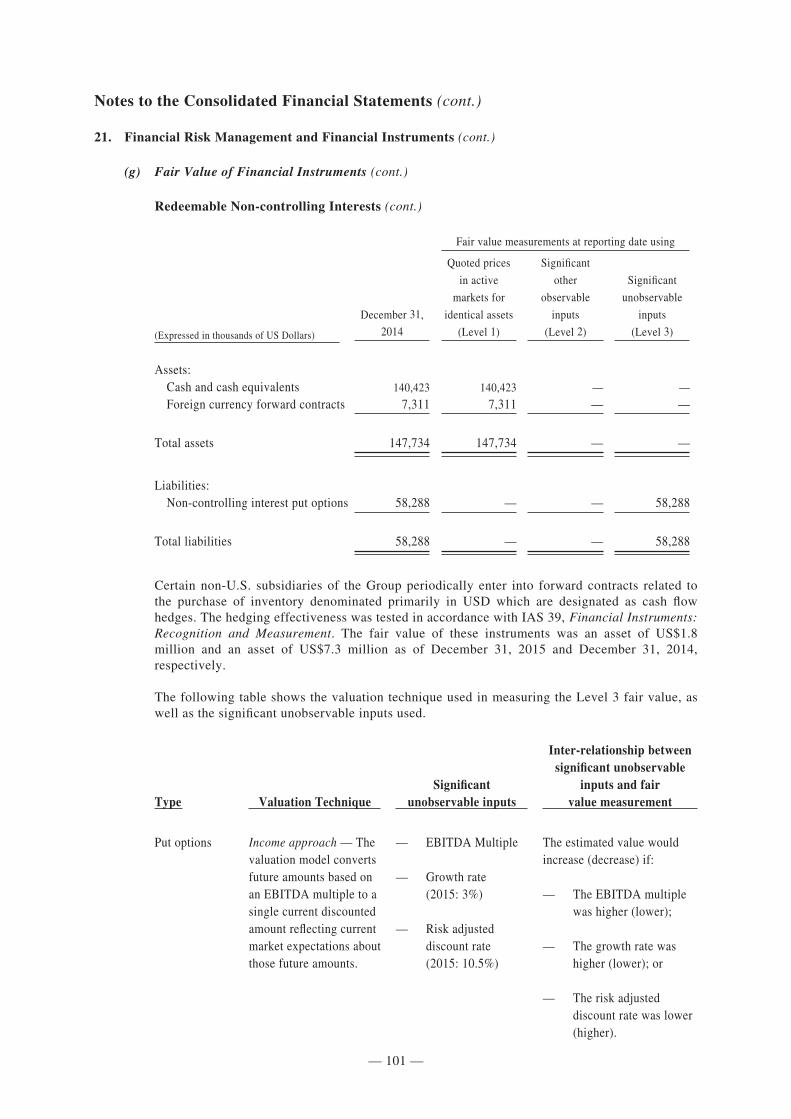
— 101 —
284502 \ (Samsonite_Luxembourg) \ 19/04/2016 \ M38 / Size (210x297)
Notes to the Consolidated Financial Statements (cont.)
21. Financial Risk Management and Financial Instruments (cont.)
(g) Fair Value of Financial Instruments (cont.)
Redeemable Non-controlling Interests (cont.)
Fair value measurements at reporting date using
(Expressed in thousands of US Dollars)
December 31,
2014
Quoted prices
in active
markets for
identical assets
(Level 1)
Significant
other
observable
inputs
(Level 2)
Significant
unobservable
inputs
(Level 3)
Assets: Cash and cash equivalents 140,423 140,423 — —
Foreign currency forward contracts 7,311 7,311 — —
Total assets 147,734 147,734 — —
Liabilities: Non-controlling interest put options 58,288 — — 58,288
Total liabilities 58,288 — — 58,288
Certain non-U.S. subsidiaries of the Group periodically enter into forward contracts related to the purchase of inventory denominated primarily in USD which are designated as cash flow hedges. The hedging effectiveness was tested in accordance with IAS 39, Financial Instruments: Recognition and Measurement. The fair value of these instruments was an asset of US$1.8 million and an asset of US$7.3 million as of December 31, 2015 and December 31, 2014, respectively.
The following table shows the valuation technique used in measuring the Level 3 fair value, as well as the significant unobservable inputs used.
Type Valuation TechniqueSignificant
unobservable inputs
Inter-relationship between significant unobservable
inputs and fairvalue measurement
Put options Income approach — The valuation model converts future amounts based on an EBITDA multiple to a single current discounted amount reflecting current market expectations about those future amounts.
— EBITDA Multiple
— Growth rate (2015: 3%)
— Risk adjusted discount rate (2015: 10.5%)
The estimated value would increase (decrease) if:
— The EBITDA multiple was higher (lower);
— The growth rate was higher (lower); or
— The risk adjusted discount rate was lower (higher).
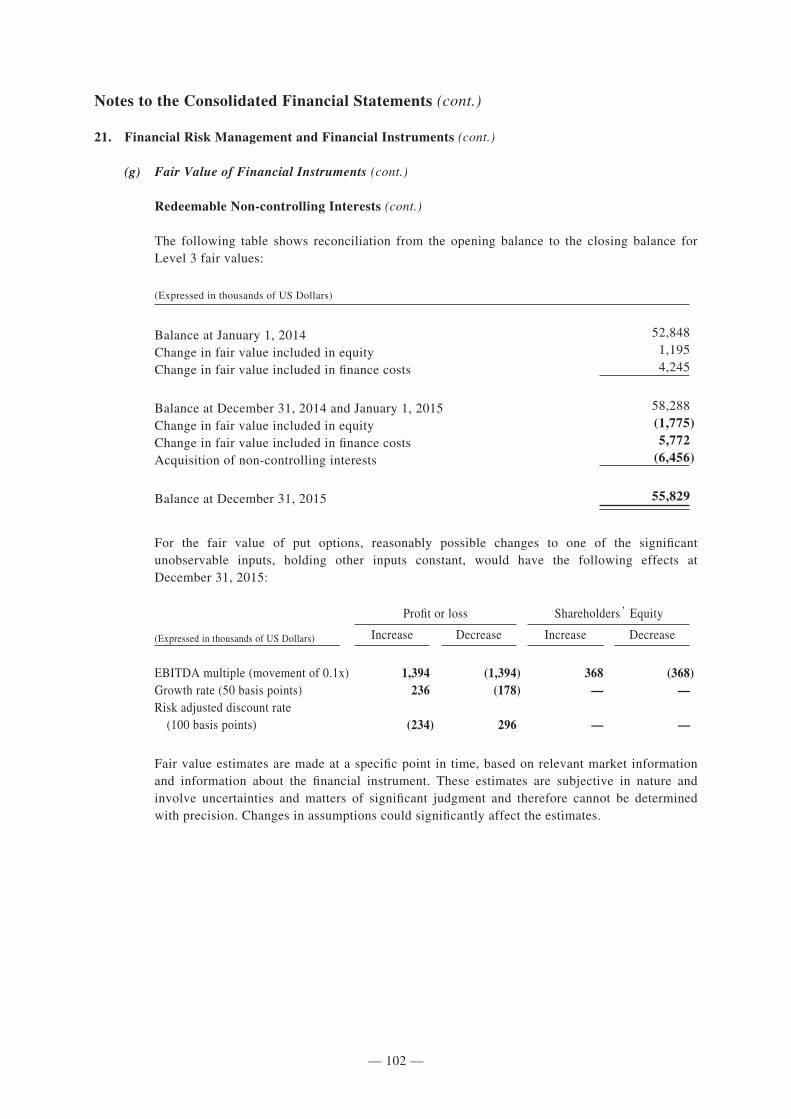
— 102 —
284502 \ (Samsonite_Luxembourg) \ 19/04/2016 \ M38 / Size (210x297)
Notes to the Consolidated Financial Statements (cont.)
21. Financial Risk Management and Financial Instruments (cont.)
(g) Fair Value of Financial Instruments (cont.)
Redeemable Non-controlling Interests (cont.)
The following table shows reconciliation from the opening balance to the closing balance for Level 3 fair values:
(Expressed in thousands of US Dollars)
Balance at January 1, 2014 52,848
Change in fair value included in equity 1,195
Change in fair value included in finance costs 4,245
Balance at December 31, 2014 and January 1, 2015 58,288
Change in fair value included in equity (1,775)
Change in fair value included in finance costs 5,772
Acquisition of non-controlling interests (6,456)
Balance at December 31, 2015 55,829
For the fair value of put options, reasonably possible changes to one of the significant unobservable inputs, holding other inputs constant, would have the following effects at December 31, 2015:
Profit or loss Shareholders’ Equity
(Expressed in thousands of US Dollars) Increase Decrease Increase Decrease
EBITDA multiple (movement of 0.1x) 1,394 (1,394) 368 (368)Growth rate (50 basis points) 236 (178) — —Risk adjusted discount rate (100 basis points) (234) 296 — —
Fair value estimates are made at a specific point in time, based on relevant market information and information about the financial instrument. These estimates are subjective in nature and involve uncertainties and matters of significant judgment and therefore cannot be determined with precision. Changes in assumptions could significantly affect the estimates.
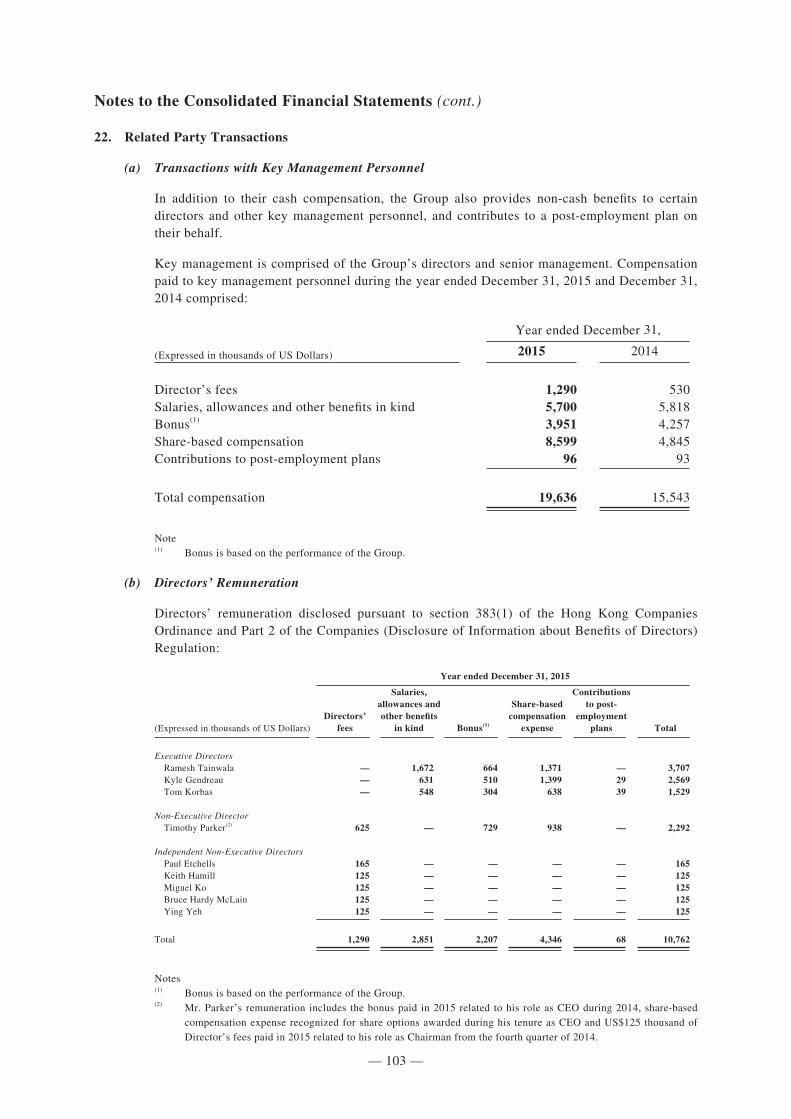
— 103 —
284502 \ (Samsonite_Luxembourg) \ 19/04/2016 \ M38 / Size (210x297)
Notes to the Consolidated Financial Statements (cont.)
22. Related Party Transactions
(a) Transactions with Key Management Personnel
In addition to their cash compensation, the Group also provides non-cash benefits to certain directors and other key management personnel, and contributes to a post-employment plan on their behalf.
Key management is comprised of the Group’s directors and senior management. Compensation paid to key management personnel during the year ended December 31, 2015 and December 31, 2014 comprised:
Year ended December 31,
(Expressed in thousands of US Dollars) 2015 2014
Director’s fees 1,290 530Salaries, allowances and other benefits in kind 5,700 5,818Bonus(1) 3,951 4,257Share-based compensation 8,599 4,845Contributions to post-employment plans 96 93
Total compensation 19,636 15,543
Note(1) Bonus is based on the performance of the Group.
(b) Directors’ Remuneration
Directors’ remuneration disclosed pursuant to section 383(1) of the Hong Kong Companies Ordinance and Part 2 of the Companies (Disclosure of Information about Benefits of Directors) Regulation:
Year ended December 31, 2015
(Expressed in thousands of US Dollars)Directors’
fees
Salaries, allowances and other benefits
in kind Bonus(1)
Share-based compensation
expense
Contributions to post-
employment plans Total
Executive Directors Ramesh Tainwala — 1,672 664 1,371 — 3,707 Kyle Gendreau — 631 510 1,399 29 2,569 Tom Korbas — 548 304 638 39 1,529
Non-Executive Director Timothy Parker(2) 625 — 729 938 — 2,292
Independent Non-Executive Directors Paul Etchells 165 — — — — 165 Keith Hamill 125 — — — — 125 Miguel Ko 125 — — — — 125 Bruce Hardy McLain 125 — — — — 125 Ying Yeh 125 — — — — 125
Total 1,290 2,851 2,207 4,346 68 10,762
Notes(1) Bonus is based on the performance of the Group.(2) Mr. Parker’s remuneration includes the bonus paid in 2015 related to his role as CEO during 2014, share-based
compensation expense recognized for share options awarded during his tenure as CEO and US$125 thousand of Director’s fees paid in 2015 related to his role as Chairman from the fourth quarter of 2014.
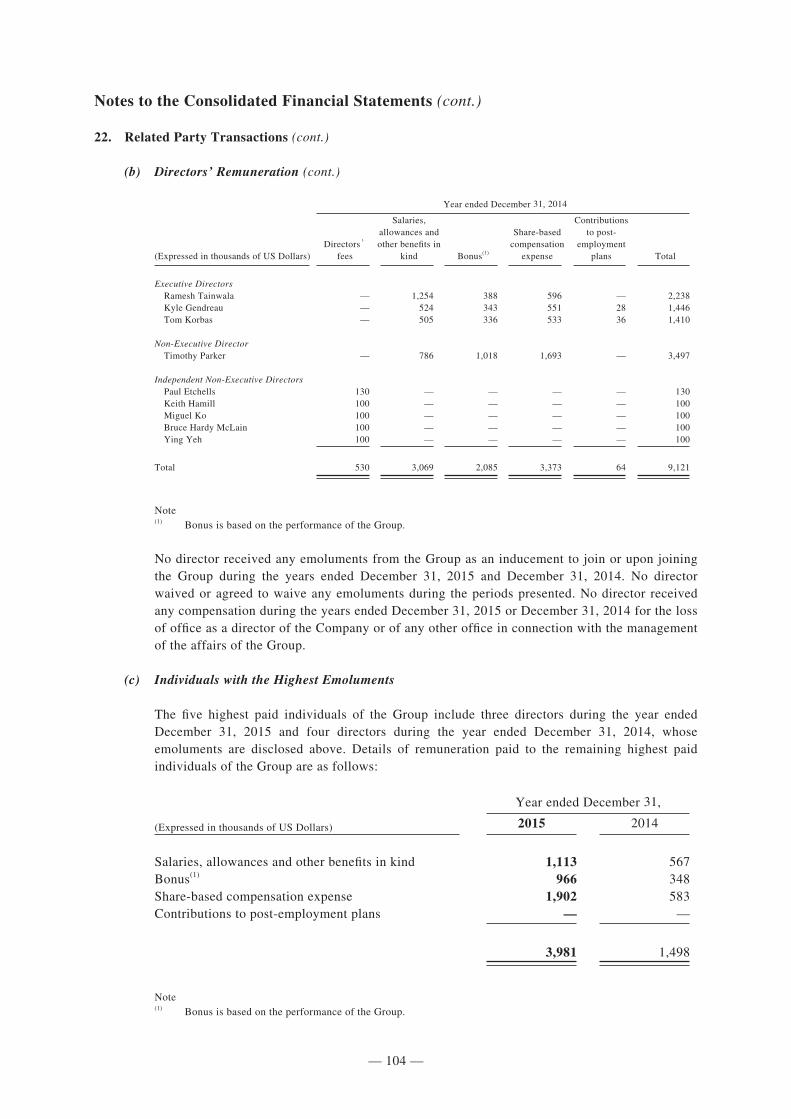
— 104 —
284502 \ (Samsonite_Luxembourg) \ 19/04/2016 \ M38 / Size (210x297)
Notes to the Consolidated Financial Statements (cont.)
22. Related Party Transactions (cont.)
(b) Directors’ Remuneration (cont.)
Year ended December 31, 2014
(Expressed in thousands of US Dollars)Directors’
fees
Salaries, allowances and other benefits in
kind Bonus(1)
Share-based compensation
expense
Contributions to post-
employment plans Total
Executive Directors Ramesh Tainwala — 1,254 388 596 — 2,238 Kyle Gendreau — 524 343 551 28 1,446 Tom Korbas — 505 336 533 36 1,410
Non-Executive Director Timothy Parker — 786 1,018 1,693 — 3,497
Independent Non-Executive Directors Paul Etchells 130 — — — — 130 Keith Hamill 100 — — — — 100 Miguel Ko 100 — — — — 100 Bruce Hardy McLain 100 — — — — 100 Ying Yeh 100 — — — — 100
Total 530 3,069 2,085 3,373 64 9,121
Note(1) Bonus is based on the performance of the Group.
No director received any emoluments from the Group as an inducement to join or upon joining the Group during the years ended December 31, 2015 and December 31, 2014. No director waived or agreed to waive any emoluments during the periods presented. No director received any compensation during the years ended December 31, 2015 or December 31, 2014 for the loss of office as a director of the Company or of any other office in connection with the management of the affairs of the Group.
(c) Individuals with the Highest Emoluments
The five highest paid individuals of the Group include three directors during the year ended December 31, 2015 and four directors during the year ended December 31, 2014, whose emoluments are disclosed above. Details of remuneration paid to the remaining highest paid individuals of the Group are as follows:
Year ended December 31,
(Expressed in thousands of US Dollars) 2015 2014
Salaries, allowances and other benefits in kind 1,113 567Bonus(1) 966 348Share-based compensation expense 1,902 583Contributions to post-employment plans — —
3,981 1,498
Note(1) Bonus is based on the performance of the Group.
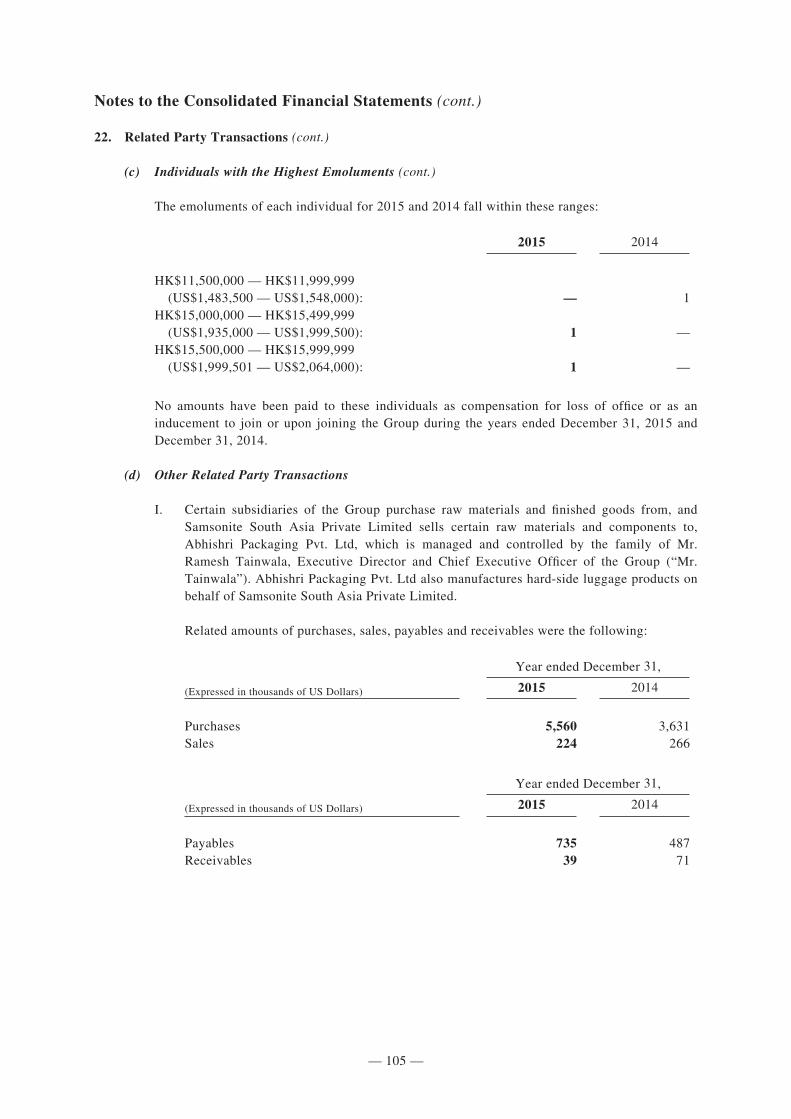
— 105 —
284502 \ (Samsonite_Luxembourg) \ 19/04/2016 \ M38 / Size (210x297)
Notes to the Consolidated Financial Statements (cont.)
22. Related Party Transactions (cont.)
(c) Individuals with the Highest Emoluments (cont.)
The emoluments of each individual for 2015 and 2014 fall within these ranges:
2015 2014
HK$11,500,000 — HK$11,999,999 (US$1,483,500 — US$1,548,000): — 1HK$15,000,000 — HK$15,499,999 (US$1,935,000 — US$1,999,500): 1 —HK$15,500,000 — HK$15,999,999 (US$1,999,501 — US$2,064,000): 1 —
No amounts have been paid to these individuals as compensation for loss of office or as an inducement to join or upon joining the Group during the years ended December 31, 2015 and December 31, 2014.
(d) Other Related Party Transactions
I. Certain subsidiaries of the Group purchase raw materials and finished goods from, and Samsonite South Asia Private Limited sells certain raw materials and components to, Abhishri Packaging Pvt. Ltd, which is managed and controlled by the family of Mr. Ramesh Tainwala, Executive Director and Chief Executive Officer of the Group (“Mr. Tainwala”). Abhishri Packaging Pvt. Ltd also manufactures hard-side luggage products on behalf of Samsonite South Asia Private Limited.
Related amounts of purchases, sales, payables and receivables were the following:
Year ended December 31,
(Expressed in thousands of US Dollars) 2015 2014
Purchases 5,560 3,631Sales 224 266
Year ended December 31,
(Expressed in thousands of US Dollars) 2015 2014
Payables 735 487Receivables 39 71
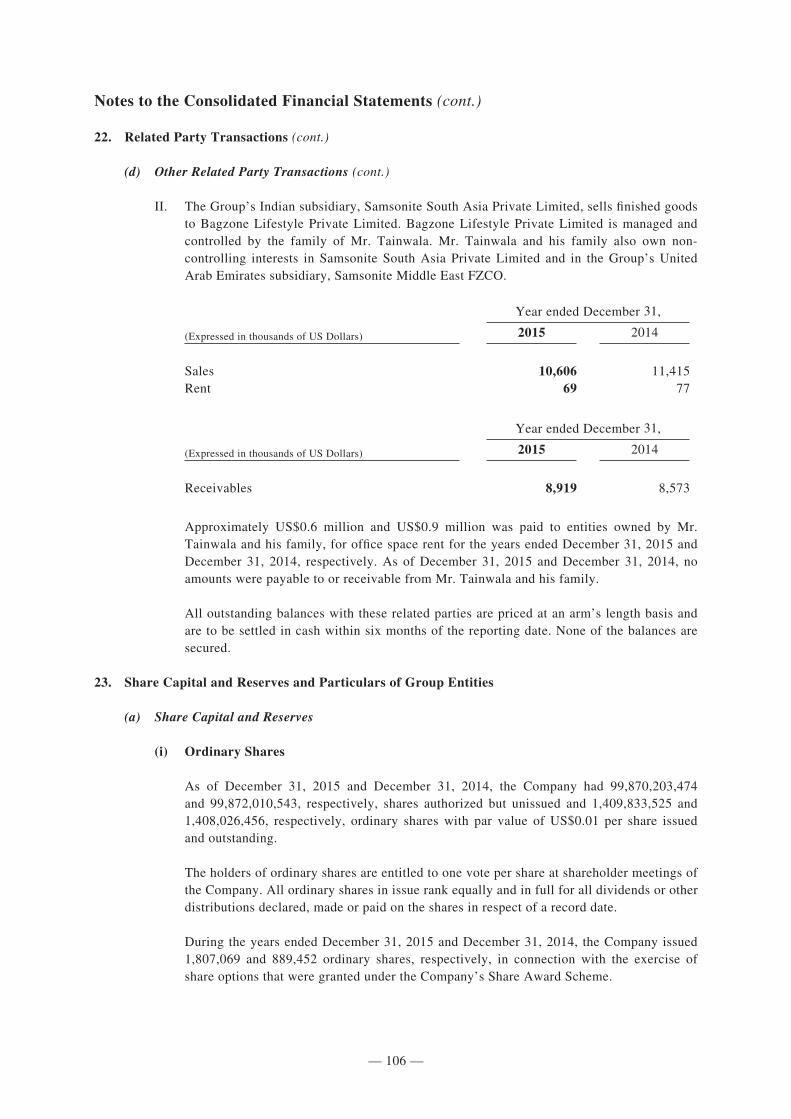
— 106 —
284502 \ (Samsonite_Luxembourg) \ 19/04/2016 \ M38 / Size (210x297)
Notes to the Consolidated Financial Statements (cont.)
22. Related Party Transactions (cont.)
(d) Other Related Party Transactions (cont.)
II. The Group’s Indian subsidiary, Samsonite South Asia Private Limited, sells finished goods to Bagzone Lifestyle Private Limited. Bagzone Lifestyle Private Limited is managed and controlled by the family of Mr. Tainwala. Mr. Tainwala and his family also own non-controlling interests in Samsonite South Asia Private Limited and in the Group’s United Arab Emirates subsidiary, Samsonite Middle East FZCO.
Year ended December 31,
(Expressed in thousands of US Dollars) 2015 2014
Sales 10,606 11,415Rent 69 77
Year ended December 31,
(Expressed in thousands of US Dollars) 2015 2014
Receivables 8,919 8,573
Approximately US$0.6 million and US$0.9 million was paid to entities owned by Mr. Tainwala and his family, for office space rent for the years ended December 31, 2015 and December 31, 2014, respectively. As of December 31, 2015 and December 31, 2014, no amounts were payable to or receivable from Mr. Tainwala and his family.
All outstanding balances with these related parties are priced at an arm’s length basis and are to be settled in cash within six months of the reporting date. None of the balances are secured.
23. Share Capital and Reserves and Particulars of Group Entities
(a) Share Capital and Reserves
(i) Ordinary Shares
As of December 31, 2015 and December 31, 2014, the Company had 99,870,203,474 and 99,872,010,543, respectively, shares authorized but unissued and 1,409,833,525 and 1,408,026,456, respectively, ordinary shares with par value of US$0.01 per share issued and outstanding.
The holders of ordinary shares are entitled to one vote per share at shareholder meetings of the Company. All ordinary shares in issue rank equally and in full for all dividends or other distributions declared, made or paid on the shares in respect of a record date.
During the years ended December 31, 2015 and December 31, 2014, the Company issued 1,807,069 and 889,452 ordinary shares, respectively, in connection with the exercise of share options that were granted under the Company’s Share Award Scheme.
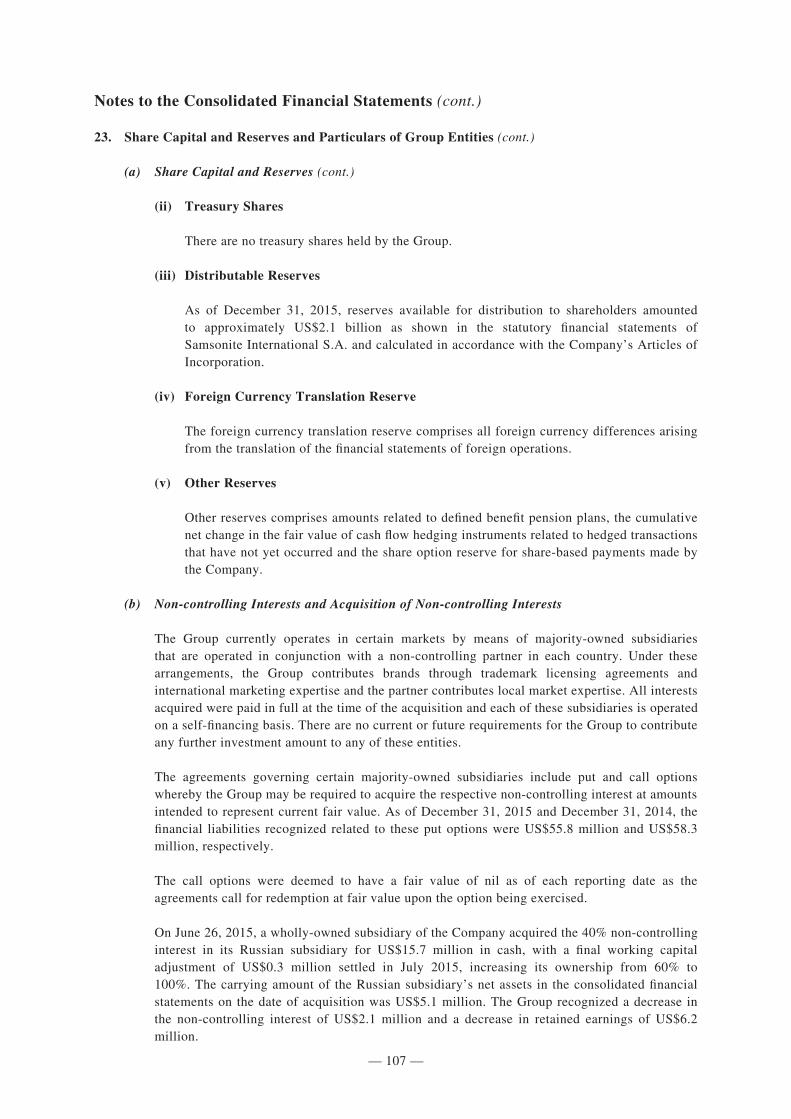
— 107 —
284502 \ (Samsonite_Luxembourg) \ 19/04/2016 \ M38 / Size (210x297)
Notes to the Consolidated Financial Statements (cont.)
23. Share Capital and Reserves and Particulars of Group Entities (cont.)
(a) Share Capital and Reserves (cont.)
(ii) Treasury Shares
There are no treasury shares held by the Group.
(iii) Distributable Reserves
As of December 31, 2015, reserves available for distribution to shareholders amounted to approximately US$2.1 billion as shown in the statutory financial statements of Samsonite International S.A. and calculated in accordance with the Company’s Articles of Incorporation.
(iv) Foreign Currency Translation Reserve
The foreign currency translation reserve comprises all foreign currency differences arising from the translation of the financial statements of foreign operations.
(v) Other Reserves
Other reserves comprises amounts related to defined benefit pension plans, the cumulative net change in the fair value of cash flow hedging instruments related to hedged transactions that have not yet occurred and the share option reserve for share-based payments made by the Company.
(b) Non-controlling Interests and Acquisition of Non-controlling Interests
The Group currently operates in certain markets by means of majority-owned subsidiaries that are operated in conjunction with a non-controlling partner in each country. Under these arrangements, the Group contributes brands through trademark licensing agreements and international marketing expertise and the partner contributes local market expertise. All interests acquired were paid in full at the time of the acquisition and each of these subsidiaries is operated on a self-financing basis. There are no current or future requirements for the Group to contribute any further investment amount to any of these entities.
The agreements governing certain majority-owned subsidiaries include put and call options whereby the Group may be required to acquire the respective non-controlling interest at amounts intended to represent current fair value. As of December 31, 2015 and December 31, 2014, the financial liabilities recognized related to these put options were US$55.8 million and US$58.3 million, respectively.
The call options were deemed to have a fair value of nil as of each reporting date as the agreements call for redemption at fair value upon the option being exercised.
On June 26, 2015, a wholly-owned subsidiary of the Company acquired the 40% non-controlling interest in its Russian subsidiary for US$15.7 million in cash, with a final working capital adjustment of US$0.3 million settled in July 2015, increasing its ownership from 60% to 100%. The carrying amount of the Russian subsidiary’s net assets in the consolidated financial statements on the date of acquisition was US$5.1 million. The Group recognized a decrease in the non-controlling interest of US$2.1 million and a decrease in retained earnings of US$6.2 million.
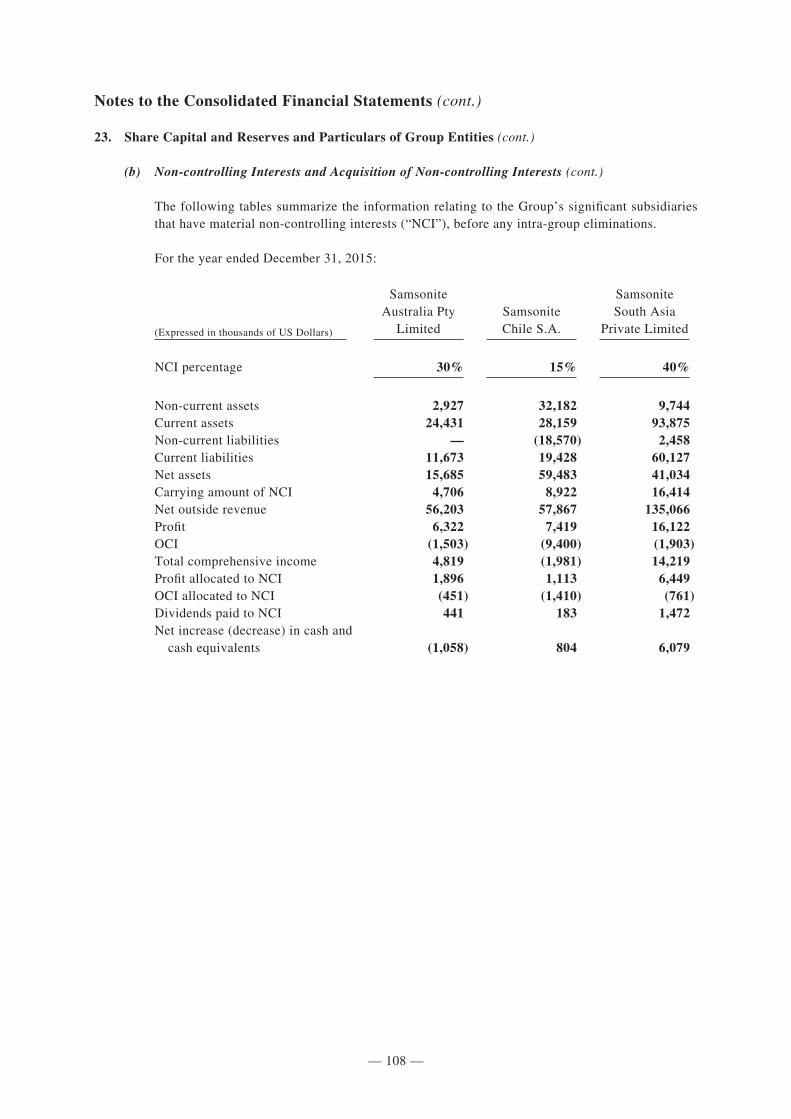
— 108 —
284502 \ (Samsonite_Luxembourg) \ 19/04/2016 \ M38 / Size (210x297)
Notes to the Consolidated Financial Statements (cont.)
23. Share Capital and Reserves and Particulars of Group Entities (cont.)
(b) Non-controlling Interests and Acquisition of Non-controlling Interests (cont.)
The following tables summarize the information relating to the Group’s significant subsidiaries that have material non-controlling interests (“NCI”), before any intra-group eliminations.
For the year ended December 31, 2015:
(Expressed in thousands of US Dollars)
Samsonite Australia Pty
LimitedSamsonite Chile S.A.
Samsonite South Asia
Private Limited
NCI percentage 30% 15% 40%
Non-current assets 2,927 32,182 9,744Current assets 24,431 28,159 93,875Non-current liabilities — (18,570) 2,458Current liabilities 11,673 19,428 60,127Net assets 15,685 59,483 41,034Carrying amount of NCI 4,706 8,922 16,414Net outside revenue 56,203 57,867 135,066Profit 6,322 7,419 16,122OCI (1,503) (9,400) (1,903)Total comprehensive income 4,819 (1,981) 14,219Profit allocated to NCI 1,896 1,113 6,449OCI allocated to NCI (451) (1,410) (761)Dividends paid to NCI 441 183 1,472Net increase (decrease) in cash and cash equivalents (1,058) 804 6,079
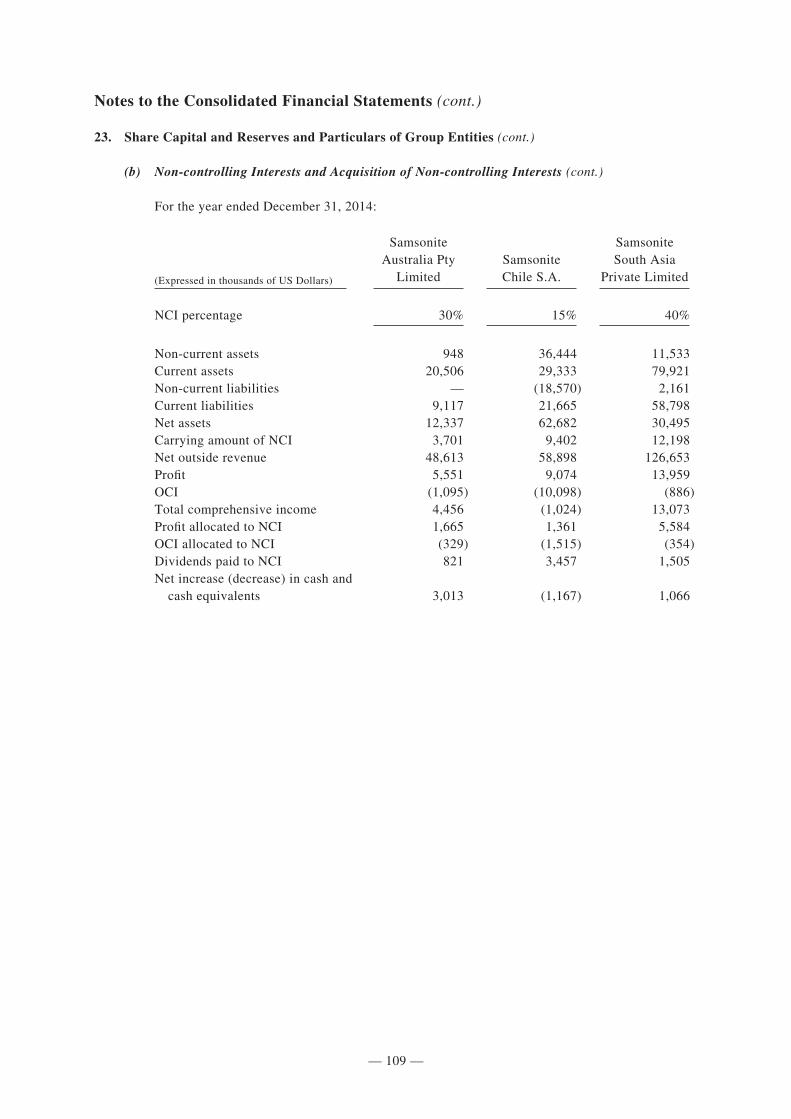
— 109 —
284502 \ (Samsonite_Luxembourg) \ 19/04/2016 \ M38 / Size (210x297)
Notes to the Consolidated Financial Statements (cont.)
23. Share Capital and Reserves and Particulars of Group Entities (cont.)
(b) Non-controlling Interests and Acquisition of Non-controlling Interests (cont.)
For the year ended December 31, 2014:
(Expressed in thousands of US Dollars)
Samsonite Australia Pty
LimitedSamsonite Chile S.A.
Samsonite South Asia
Private Limited
NCI percentage 30% 15% 40%
Non-current assets 948 36,444 11,533Current assets 20,506 29,333 79,921Non-current liabilities — (18,570) 2,161Current liabilities 9,117 21,665 58,798Net assets 12,337 62,682 30,495Carrying amount of NCI 3,701 9,402 12,198Net outside revenue 48,613 58,898 126,653Profit 5,551 9,074 13,959OCI (1,095) (10,098) (886)Total comprehensive income 4,456 (1,024) 13,073Profit allocated to NCI 1,665 1,361 5,584OCI allocated to NCI (329) (1,515) (354)Dividends paid to NCI 821 3,457 1,505Net increase (decrease) in cash and cash equivalents 3,013 (1,167) 1,066
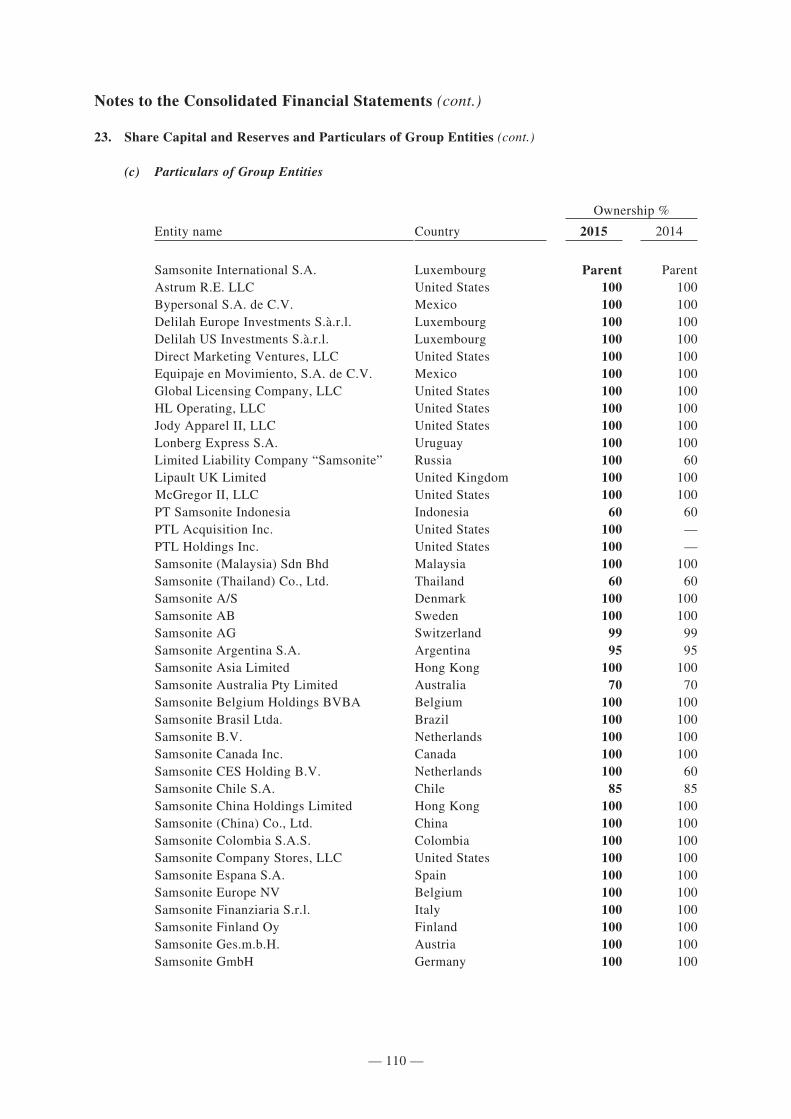
— 110 —
284502 \ (Samsonite_Luxembourg) \ 19/04/2016 \ M38 / Size (210x297)
Notes to the Consolidated Financial Statements (cont.)
23. Share Capital and Reserves and Particulars of Group Entities (cont.)
(c) Particulars of Group Entities
Ownership %
Entity name Country 2015 2014
Samsonite International S.A. Luxembourg Parent ParentAstrum R.E. LLC United States 100 100Bypersonal S.A. de C.V. Mexico 100 100Delilah Europe Investments S.à.r.l. Luxembourg 100 100Delilah US Investments S.à.r.l. Luxembourg 100 100Direct Marketing Ventures, LLC United States 100 100Equipaje en Movimiento, S.A. de C.V. Mexico 100 100Global Licensing Company, LLC United States 100 100HL Operating, LLC United States 100 100Jody Apparel II, LLC United States 100 100Lonberg Express S.A. Uruguay 100 100Limited Liability Company “Samsonite” Russia 100 60Lipault UK Limited United Kingdom 100 100McGregor II, LLC United States 100 100PT Samsonite Indonesia Indonesia 60 60PTL Acquisition Inc. United States 100 —PTL Holdings Inc. United States 100 —Samsonite (Malaysia) Sdn Bhd Malaysia 100 100Samsonite (Thailand) Co., Ltd. Thailand 60 60Samsonite A/S Denmark 100 100Samsonite AB Sweden 100 100Samsonite AG Switzerland 99 99Samsonite Argentina S.A. Argentina 95 95Samsonite Asia Limited Hong Kong 100 100Samsonite Australia Pty Limited Australia 70 70Samsonite Belgium Holdings BVBA Belgium 100 100Samsonite Brasil Ltda. Brazil 100 100Samsonite B.V. Netherlands 100 100Samsonite Canada Inc. Canada 100 100Samsonite CES Holding B.V. Netherlands 100 60Samsonite Chile S.A. Chile 85 85Samsonite China Holdings Limited Hong Kong 100 100Samsonite (China) Co., Ltd. China 100 100Samsonite Colombia S.A.S. Colombia 100 100Samsonite Company Stores, LLC United States 100 100Samsonite Espana S.A. Spain 100 100Samsonite Europe NV Belgium 100 100Samsonite Finanziaria S.r.l. Italy 100 100Samsonite Finland Oy Finland 100 100Samsonite Ges.m.b.H. Austria 100 100Samsonite GmbH Germany 100 100
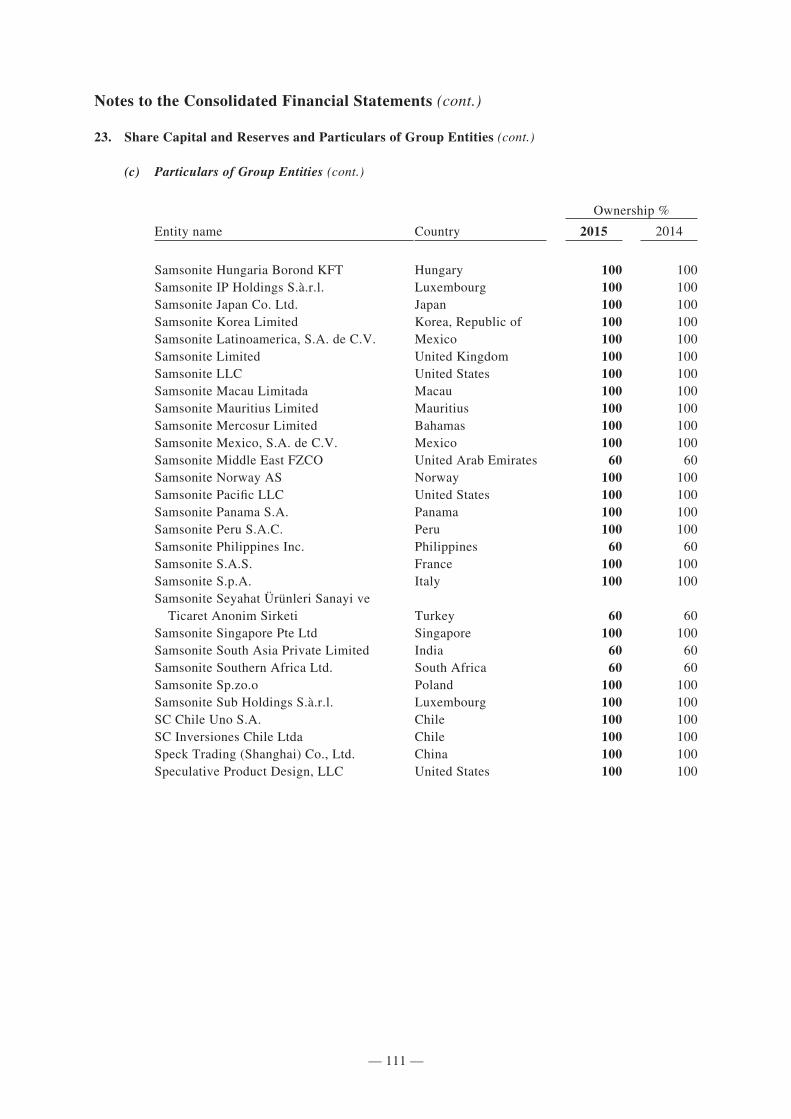
— 111 —
284502 \ (Samsonite_Luxembourg) \ 19/04/2016 \ M38 / Size (210x297)
Notes to the Consolidated Financial Statements (cont.)
23. Share Capital and Reserves and Particulars of Group Entities (cont.)
(c) Particulars of Group Entities (cont.)
Ownership %
Entity name Country 2015 2014
Samsonite Hungaria Borond KFT Hungary 100 100Samsonite IP Holdings S.à.r.l. Luxembourg 100 100Samsonite Japan Co. Ltd. Japan 100 100Samsonite Korea Limited Korea, Republic of 100 100Samsonite Latinoamerica, S.A. de C.V. Mexico 100 100Samsonite Limited United Kingdom 100 100Samsonite LLC United States 100 100Samsonite Macau Limitada Macau 100 100Samsonite Mauritius Limited Mauritius 100 100Samsonite Mercosur Limited Bahamas 100 100Samsonite Mexico, S.A. de C.V. Mexico 100 100Samsonite Middle East FZCO United Arab Emirates 60 60Samsonite Norway AS Norway 100 100Samsonite Pacific LLC United States 100 100Samsonite Panama S.A. Panama 100 100Samsonite Peru S.A.C. Peru 100 100Samsonite Philippines Inc. Philippines 60 60Samsonite S.A.S. France 100 100Samsonite S.p.A. Italy 100 100Samsonite Seyahat Ürünleri Sanayi ve Ticaret Anonim Sirketi Turkey 60 60Samsonite Singapore Pte Ltd Singapore 100 100Samsonite South Asia Private Limited India 60 60Samsonite Southern Africa Ltd. South Africa 60 60Samsonite Sp.zo.o Poland 100 100Samsonite Sub Holdings S.à.r.l. Luxembourg 100 100SC Chile Uno S.A. Chile 100 100SC Inversiones Chile Ltda Chile 100 100Speck Trading (Shanghai) Co., Ltd. China 100 100Speculative Product Design, LLC United States 100 100
— 112 —
284502 \ (Samsonite_Luxembourg) \ 19/04/2016 \ M38 / Size (210x297)
Notes to the Consolidated Financial Statements (cont.)
24. Subsequent Events
The Group has evaluated events occurring subsequent to December 31, 2015, the reporting date, through March 16, 2016, the date this financial information was authorized for issue by the Board.
From December 31, 2015 to February 29, 2016, the Company issued 10,028 ordinary shares in connection with the exercise of share options that were granted under the Company’s Share Award Scheme. There were no purchases or redemptions of the Company’s listed securities by the Company or any of its subsidiaries since December 31, 2015.
On March 3, 2016, the Company’s shareholders approved the resolution proposed to (i) reduce the Company’s authorized share capital from US$1,012,800,369.99, representing 101,280,036,999 shares (including the subscribed share capital) to US$35,000,000, representing 3,500,000,000 shares (including the subscribed share capital) with a par value of US$0.01 each and (ii) renew, for a period of five years from the date of the publication of the amendment of the authorized share capital, the authorization of the Board to issue shares, to grant options to subscribe for shares and to issue any other securities or instruments convertible into shares, subject to the restrictions set out in the Company’s Articles of Incorporation, the Luxembourg companies law and the Rules Governing the Listing of Securities on The Stock Exchange of Hong Kong Limited.
On March 3, 2016, the Company and PTL Acquisition Inc. (“Merger Sub”) (an indirect wholly-owned subsidiary of the Company) entered into an Agreement and Plan of Merger (the “Merger Agreement”) with Tumi Holdings, Inc. (“Tumi”), pursuant to which the Company agreed to acquire Tumi for cash consideration of US$26.75 per share, subject to the terms and conditions set out in the Merger Agreement. The acquisition is proposed to be effected by way of a merger of Merger Sub with and into Tumi, with Tumi surviving the merger as an indirect wholly-owned subsidiary of the Company.
Tumi is a leading global premium lifestyle brand offering a comprehensive line of business bags, travel luggage and accessories. The Tumi brand is sold in approximately 2,000 points of distribution in over 75 countries.
Closing of the merger is conditional on the satisfaction (or, to the extent not prohibited by applicable law, waiver) of certain conditions, which include, among other things, the adoption of the Merger Agreement by the stockholders of Tumi, approval of the merger by the shareholders of the Company and the receipt of certain regulatory approvals. The Merger Agreement may be terminated in certain circumstances, including if the requisite approval by the stockholders of Tumi or the shareholders of the Company has not been obtained or if there has been a material breach of the covenants or agreements set out in the Merger Agreement by the Company or by Tumi. The Merger Agreement provides that, upon termination of the Merger Agreement upon certain specified conditions, the Company or Tumi will be required to pay the other party a termination fee as set forth and described in the Merger Agreement. Subject to certain exceptions and limitations, either party may terminate the Merger Agreement if the merger is not consummated by 5:00 p.m. (New York City time) on December 31, 2016, subject to extension until March 3, 2017 for the purpose of obtaining regulatory clearances.
The aggregate cash consideration payable by the Company under the terms of the Merger Agreement is expected to be approximately US$1,824 million. The total consideration will be funded by a new committed debt financing that will comprise US$500 million in a revolving facility and up to US$1,925 million in new term loan facilities, as well as the Group’s own cash resources.
Subject to the satisfaction or waiver of the conditions of the merger, it is currently expected that closing will occur in the second half of 2016.