Embed Size (px)
Citation preview

OCEANOLOGICA ACTA 1985- VOL. 8- W 4 ~ -----~-
Sandwaves, internai waves and sediment mobility
Sandwaves Internai waves
Celtic Sea Dunes
Ondes internes Mer Celtique at the shelf-edge in the Celtic Sea
ABSTRACT
RÉSUMÉ
INTRODUCTION
A.D. HEATHERSHAW*, J.M. CODD Institute of Oceanographie Sciences, Crossway, Taunton, Somerset TA 1 2DW, UK. * Present address: Ocean Science Division, Admiralty Research Establishment, Portland, Dorset DT5 2JS, UK.
Received 7/1/85, in revised form 1/5/85, accepted 17/5/85.
Considerations of sediment mobility and unusual wavelength pattern changes in large sandwaves lying deep in the Celtic Sea, suggest that these features are probably formed as a result of internai wave perturbations on a tidally driven stream of sediment transport. In particular it is shown that while currents due to the surface tides alone are capable of transporting the sediments, it is necessary to invoke an internai wave mechanism to give the observed pattern of wavelength change across the sandwave field. Cartwright's (1959) internallee-wave model is found to give qualitative agreement with the observed decrease in sandwave wavelength with increasing distance from the shelf-break.
Oceanol. Acta, 1985, 8, 4, 391-402.
Dunes, ondes internes et mouvements du sédiment au bord du plateau de la Mer Celtique.
L'étude des mouvements du sédiment et des variations inhabituelles de longueur d'onde des grandes dunes du fond de la Mer Celtique suggère que ces formations résultent probablement de perturbations dues à une onde interne sur le transport de sédiment par le courant de marée. Alors que les courants de marée superficiels sont capables de déplacer ces sédiments, il faut faire intervenir un mécanisme d'onde interne pour obtenir la variation de longueur d'onde observée dans le champ de dunes. Le modèle d'onde interne de Cartwright (1959) confirme qualitativement la diminution observée de la longueur d'onde des dunes à mesure que l'on s'éloigne du rebord du plateau continental.
Oceanol. Acta, 1985, 8, 4, 391-402.
Sorne of the largest sandwaves on the NW European continental shelf are found at the shelf-edge west of France, on La Chapelle Bank (Fig. 1). These features have aroused considerable interest since first discovered (Cartwright, Stride, 1958), because of their possible generation by, or coupling with, internai waves (Cartwright, 1959). Evidence for this was provided by Stride and Tucker (1960), who, using a narrow bearn 36 kHz echosounder, were able to detect internai waves having the same wavelength as the sandwaves.
transport processes at the shelf-break. However, numerical model studies (Pingree et al., 1982) also show that La Chapelle Bank is close to a region of maximum tidal streaming on the shelf-edge. Can tidal current variations alone therefore explain the presence of large sandwaves at this location? In what way are the La Chapelle Bank sandwaves different from those which occur elsewhere in other tidal marine environments?
In this paper we describe detailed observations of the sandwaves on La Chapelle Bank and examine the competence of the tidal currents to transport sediment and generate bedforms. Across-shelf variations in tidal current speed are examined in relation to variations in sandwave height and wavelength. The geometrical properties of the sandwaves are examined and compared with those from sandwaves in other tidal environments.
However, the existing work leaves unanswered the question, to what extent are the sandwaves at the shelfedge the result of tidal current action and to what extent are they controlled by internai waves? Recent work (Heathershaw, 1985) has established the important role which internai tides may play in sediment
0399-1784/85/04 391 12/S 3.20/ <C Gauthier-Villars 391

AD. HEATHERSHAW. J. M. CODD
7° 25'W re 1s· ~· 5'
10
Figure 1 Location map showing the positions of current meter moorings LCB1, 2, 3 and 4, and thermistor chain moorings TC1 and 2, on La Chapelle Bank during September 1982. Also shown are the echosounding transects (1-9) used in examining across-she/f changes in sandwave height and wavelength. Sediment samp/ing positions (• are also indicated and depths are given in metres.
METHODS
To examine in more detail the relationship between internai waves and sandwaves, an interdisciplinary programme of geophysical and oceanographie measurements was carried out on La Chapelle Bank in September 1982 from the RRS Frederick Russell. Further details of these measurements are given below.
Table 1
Current and temperature measurements
Recording current meter and thermistor chain measurements were made across the shelf-break at the locations shown in Figure 1. A total of 21 Aanderaa RCM4 recording current meters were deployed on 4 moorings spanning a 20 km section across the shelf-edge, with 2 thermistor chains deployed approximately 5 km to the west. Water depths at these locations varied between 160 and 500 m. Current speed and direction values were recorded every 5 minutes giving record lengths of between 6 and 7 days and covering a spring to neap period. Current me ter mooring LCB 1 in 500 rn of water and thermistor chain TC1 were subsequently lost, but the remaining instruments ali provided reliable data. Ali the current meter moorings had current meters at heights of 2, 5 and 10 rn above the seabed. On moorings LCB2 and LCB4 additional current meters were placed at heights of 102 and 122 rn, and 115 and 120 rn respectively, to straddle the thermocline. On mooring LCB3 greater detail of the vertical current structure was also provided by current meters at heights of 30, 75, 111 and 121 rn above the seabed. On TC2 an Aanderaa thermistor chain was moored across the thermocline and extended from 90 to 140 rn above the seabed. In addition to these data, temperature records were also available from the current meters. Further details of the moorings are given in Table 1.
Bathymetry and sandwaves
The general bathymetry of the La Chapelle Bank area was mapped out using a 10 kHz precision echosounder (PES) and a combination of Satellite and Decca main chain navigation. Echo-sounding tines were run across and parallel to the shelf-break with a minimum separation of approximately 3 km. The generalised bathyme-
Summary of tidal and residual current data from moorings LCBl, 3 and 4 on La Chapelle Bank (Fig. 1).
Meter Depth height lu-I IU+I a b Il> IO.I 9
Location (m) (m) cm s- 1) (cm s- 1) (cm s- 1) (cm s- 1) ("T) (cm s- 1) ("T)
LCB2 160 122 40.12 7.93 48.05 -32.19 17 8.01 336 102 37.69 10.34 48.03 -27.35 30 8.24 330 10 31.63 8.95 40.58 -22.69 32 5.98 152 5 27.93 8.79 36.72 -19.13 28 6.09 149 2 23.99 7.92 31.91 -16.08 30 4.66 150
LCB3 167 121 44.34 7.55 51.89 -36.80 38 7.95 341 111 44.37 9.82 54.19 -34.54 32 5.09 336 75 44.43 9.69 54.05 -34.76 24 1.37 225 30 36.52 6.66 43.17 -29.91 39 0.48 322 10 31.27 5.87 37.12 -25.44 33 0.50 216 5 28.31 5.53 33.84 -22.82 31 1.02 181 2 24.65 4.95 29.55 -19.73 31 0.46 176
LCB4 167 120 42.38 7.82 50.20 -34.56 26 1.20 41 115 40.98 7.63 48.61 -33.36 27 2.32 43 10 28.15 6.96 35.11 -21.19 30 1.54 62 5 24.47 6.29 30.76 -18.18 29 1.14 73 2 21.57 5.69 27.26 -15.88 27 0.99 85
Notes: 1) 1 U_l and LU+ 1 are the clockwise and anti-clockwise components of the tidal current vector; 2) a and b are now the semi-major and semi-minor axes of t e principal semidiumal (M2 plus S2) tidal current; 3) Il> is the orientation of the semi-major axis relative to true north; 4) 1 0.1 is the residual current vector and 9 its orientation relative to true north.
392

SANDWAVES. INTERNAL WAVES. SEDIMENT MOBILITY (CEL TIC SEA)
Figure 2 The distribution of sandwaves on La Chapelle Bank. Short thin /ines ... represent crest positions determined from echosounding records white short heavy /ines represent actual crest orientations determined from sidescan sonar records. Short arrows give the directions of sandwave asymmetry. Long arrows with open heads indicate residual current directions white the long arrows with solid heads give the predicted directions of net sediment movement from current meler records ( see Tab. 5 for further details). The broken /ines delineate zones of onshelf and off-shelf sandwave asymmetry.
_-j ~~ -+ J J J j:: l ·1 1
!---2km-j 300
!al
t [-·q l t t 1= 300 (b)
-1 j i J 1 i j~ !cl l----2km-l
... 4-r 50'N
200
47• 40'
0 1
km
i 1 1 1. 1 ~ l:'m1 ~Figure3 · ----d-----1-lOO Echosounding profiles across the shelf-break in the vicinity of La
: _ _ ~ . : Chadwrpelle Batnkh. T.h'hlelfse jllus[(tra)te dth(eb)tJrendhfrom long symmetr~ca1t ~ . ~ ~ ~ ~ 200 san aves a 1 e s e -euge a an to s orter more asymmetrzca sandwaves [(c) and (d))further on-she/f. Note the presence of smaller
'--------'------'------'----__J'-----'----'-300 sandwaves in the troughs of the long sandwaves in (a). Profiles (a) (d)
try is shown, without tidal reduction (of order 3 m), in Figure 1. Our survey is similar to that of Auffret et al. (1975) which shows the Bank extending as a ridge in an approximately NE-SW direction with a topographie high (depths < 160 m) occurring close to the shelf-edge between 7°15' and 7°20'W and 47°38' and 47°39'N. Unfortunately Bouysse et al.'s (1976; 1979) detailed bathymetry of the shelf west of France, does not include the La Chapelle Bank area. However, comparison with their observations from the adjoining area suggests that the NE-SW axis of the ridge may be an extension of Castor Bank. Sandwave height, wavelength, orientation and assymmetry were examined using the PES equipment and an EG & G 254 102 kHz sidescan sonar. Figure 2 shows the observed distribution of sandwaves over the area as a whole, white Figure 3 illustrates the variations in sandwave height and wavelength on individual transects across the shelf-break.
Sediment sampling
Sediment sampling, using a Shipek grab, was carried out at those locations shown in Figure 1. Detailed analysis of the sediment samples (Heathershaw, Codd, 1985), has shown that there is a close correlation between CaC03 content and mean grain size. White
393
and (c) are continuous. Depths are in metres.
the grain size of the quartz sand fraction of the sediments was found to be independent of depth, the coarsest carbonate material was found on the shallowest parts of the bank at depths < 160 m. The highest concentrations of CaC03 material, up to 80% by weight, were also found at these locations. This result, and the variation is size of the carbonate material with depth, is believed to be due to the winnowing effects of tidal and possibly wave induced currents on the shallowest part of the bank. Thus, the overall mean grain size for the La Chapelle bank sediments (quartz sand plus CaC03) was found to be 506± 109 J.liD white the quartz sand and CaC03
material separately, were found to have overall mean grain sizes of 329 ±50 Jlm and 650 ± 158 Jlm respectively.
RESULTS
Sandwave heights and wavelengths
Examination of the echosounding records has shown that in general the highest and the longest sandwaves occur within about 5-10 km of the shelf-break (taken as the 200 m contour) and that with increasing distance on-shelf there is a general trend of decreasing wave-
170
10 1

A. D. HEATHERSHAW, J. M. CODD
Figure 4 1500 1500
1000 1000
500 500
(al
The variation of sandwave wavelength with distance on-shelf from the 200 m contour. (a) and (b}, sections 6 and 7 respective/y in Figure 1, show a general trend from a single wavelength maxima at 5-10 km from the shelf-break, to shorter wavelengthsfurther on-shelf. (c) and (d}, sections 3 and 5 respective/y, show secondary maxima at distances of 15 and 20 km from the shelf-break.
y:~---·
o',r----~--~r----.----~---. ~ o~-r----~--~r----r----~------~ 0 5 10 15 20 25 .c 0 "" &
c:: .. .. ~ 1500 ~
1000
500
--·
(b)
& j .. ~ 1500 3: ---~-
1000
500
5 10 --15
.-----20 25
(d)
0~---,r----r---,----,----, o~-r----.----,-----.----.---~ 0 5 10 15 20 25 0 5 10 15 20 25
Distance on-shel1 (km) Distance on·shel1 (km)
1500
:§ 1000
.c o. c: .9! ., > ~ 500
0
10
:§ E 5
"' ëii :z:
0
~ . ., 30
E 8
" ., ., C>
"' 25
Figure 5
0
0
0
(a)
10 15 20
5 10 15 20
/' 1
1
5 10 15 20 Distance on·shel1 (km)
The variation of the wavelength (a) and the height (b) ofsandwaves, averaged along the shelf from sections 1 to 9, as a function of distance from the 200 m depth contour. The so/id curves represent best fit profiles white the broken curves re present a ± 200 m deviation from this in the case of (a) and ±2 m deviation in the case of (b). The error bars represent a spread of ± 1 standard deviation in individual mean values. (c) shows the variation in tidal current amplitude (M 2 + S2), at a height of 2 m above the seabed, as a function of distance from the 200 m depth contour. The fall-off (broken curve) close to the shelfedge is expected on the grounds of increased water depth and continuity.
394
length. This is particularly weil illustrated in Figure 3 which shows relatively large symmetrical sandwaves at the shelf-break, giving way to smaller and possibly asymmetrical features further on-shelf. Sandwave wavelength has been taken as the distance between the crests of the sandwaves in weil defined trains. The trend of wavelength decreasing with increasing distance from the shelf-break is further illustrated in Figure 4 a which shows that maximum wavelengths of up to 1 500 rn may occur within about 5-10 km from the 200 rn isobath and that within 15-20 km, this has decreased to 300 m. However, this trend was not apparent in ali sections, sorne of which (Fig. 4 c and 4 d) showed a second maxima at 15 to 20 km behind the shelf-break. Figure 5 summarises the results from 9 sections across the shelf-break and shows the along shelf averages of sandwave wavelength and height as a function of distance on-shelf. This illustrates that while on average, sandwave wavelengths decrease from a single wavelength maxima of about 1 000 rn at 7 km from the shelf-break, to about 500 rn at 15-20 km, the heights of the sandwaves change only very slightly from about 9 rn to 7 rn across 20 km of shelf. Figure 6
30
N•1B5
20
g ,.. u Long wavelength c: .,
shell-edge sandwaves :J .,.
t ~ IL
10
?
0 400 BOO 1200 1600
Wavelength (ml Figure 6 The frequency distribution of the wavelength of sandwaves from the La Chapelle Bank area (Fig. 1 ). N = 185 is -the total number of sandwaves which were examined.
---

Figure 7 ·a) Scatter plot showing the variation ofsandwave height , (H) and wavelength (L) from the La Chapelle Bank / sandwaves (e). These measurements are compared with
those from other marine environments (0: Dalrymple et al., 1978; +: Flemming, 1980; 1:::,.: Allen, 1982). b) The variation in vertical form index (L/H) and the symmetry index (afb) for the La Chapelle Bank sandwaves. Measurements from other marine environments are :ë: also shown (/:::,.: Allen, 1982). lt should be noted that -Allen's (1982) summary of the geometrical properties J:
of tidal sandwaves inc/udes Cartwright and Stride's (1958) observations from La Chapelle Bank. However, the latter were not as extensive as those which are described in this paper. The broken /ines are the global limits given by Amos and J(jng (1984).
SANDWAVES, INTERNAL WAVES. SEDIMENT MOBILITY (CEL TIC SEA)
1024-------~--------~------~------~
Send••~••
1 ..• // • ~.+. "~"-
/ •• ...:C'J: .. .!'.t. ·~ .... .t•~-,.lli.~;..z: •••
1 ~i!r.;.i.·~ .. ; ..
S + +.bi:: ... :.··/~- . :.+ ./"t&. / •
+"ta 0• 0 • • / Sand ridge•
.. ·~. / Â
'0 .,\ / '0 @ \
/C 0 MOI/:;,~pl ..
103 r-
J: . . ::J ' . ~-..• ··
102-~.: -• ... ........ , ·~~a •• .. , ·-: .... ~·. ~.
101 • 1 4 10° 101
(al
shows that within the survey area approxima tel y 66% of ali sandwaves lie within the range 200-800 rn in wavelength and that this includes the mean wavelength of 630 rn predicted by Cartwright's (1959) lee wavemodel. There is also sorne evidence in Figure 6 of a second peak in the wavelength distribution at about 1200-1400 rn although this is accounted for by only 8% of the observations and is clearly dependent on the actual area surveyed. These longer sandwaves correspond to the large symmetrical sandwaves described earlier. Height (H) and wavelength (L) measurements from the La Chapelle Bank sandwaves have shown the expected high degree of scatter. This is illustrated in Figure 7 · a where our own observations are compared with Allen's (1982) summary of measurements from other tidal sandwaves and which includes Cartwright and Stride's (1958) early measurements from La Chapelle Bank. Within the limited range of our own measurements (3 < H < 17m;200< L<2000m)thereisnoclearlydefined trend. Figure 7 a suggests that white the La Chapelle Bank sandwaves are large in terms of their height (H) they are not unusual in this respect. Even in non-tidal marine environments large sandwaves may occur and Flemming (1980) has reported sandwaves up to 18 rn in height beneath the Agulhas Current on the South African continental shelf. These measurements are also shown in Figure 7 a. However, the La Chapelle Bank sandwaves may be distinguished from those in many other tidal environments by their great wavelength, up to 1800 rn in sorne cases. For example our measurements may be compared (Fig. 7 a) with the 10-100 rn wavelength sandwaves of the same height, reported by Dalrymple et al. (1978), from an intertidal location in the Bay of Fundy where the tidal currents were considerably stronger than those described here {see later). Despite their great wavelength, the La Chapelle Bank sandwaves still fall within the global sandwave limits given by Amos and King (1984) and cannot be confused with ridges. Vertical form (L/H) and symmetry index (afb) values for the La Chapelle Bank sandwaves are given in Figure 7 b where they are compared with measurements from other tidal marine sandwaves (Allen, 1982). Here afb is the ratio of the horizontal distances between the crest
395
a/b (b)
and the adjacent troughs of the sandwave such that afb ~ 1. Figure 7 b again illustrates that white the La Chapelle Bank sandwaves are similar to those from other areas in terms of their symmetry index values (afb), the vertical form index values (L/H) are much greater due to the generally longer wavelengths.
' . 1
}:~~ 10
Otf·sllelf esymm•"Y N •185
8 ..... e... . . "'
. . CD 6 . . .. 011•shelf c. esymmetry 0 .. .. "iii : .. .("
/4 :•. . . Qi . . . . . . .t::.
·:·. -! . "' . . . . ~ •• ·1: •• .. . .. '· 0 , .. ... ··. .· . . . .
2 . / . ..... . . -~").• ;. . ·-. ... ): ..... ' ... . : ... 0
.. 0 2 4 6 8
On-shelf slopes (•)
10 0 10 20 30
Frequency (%)
Figure 8 Slope angle variation in N = 185 sandwaves from the La Chapelle Bank area. S lope angles are shown for both sides of a sandwave. Thus the on-shelf slope is the angle of the face in that direction.
Slope angles for the La Chapelle Bank sandwaves are illustrated in Figure 8. This shows that the majority of sandwaves are symmetrical (afb=1 in Fig. 7 b) with low slope angles in the range 1-3°. Steepest lee slope angles were found to be of the order 8-9° which is considerably less than the range of angles, 30-35°, reported by Langhome (1978) for marine sandwaves in shallow water. In this latter case the steepest angles were close to the angle of repose (Allen, 1970). Howe- • ver, it should be noted that our measurements represent overall slope angles and that locally in the vicinity of sandwave crests, larger angles may have occurred.
A. D. HEATHERSHAW, J. M. CODD
Tidal currents
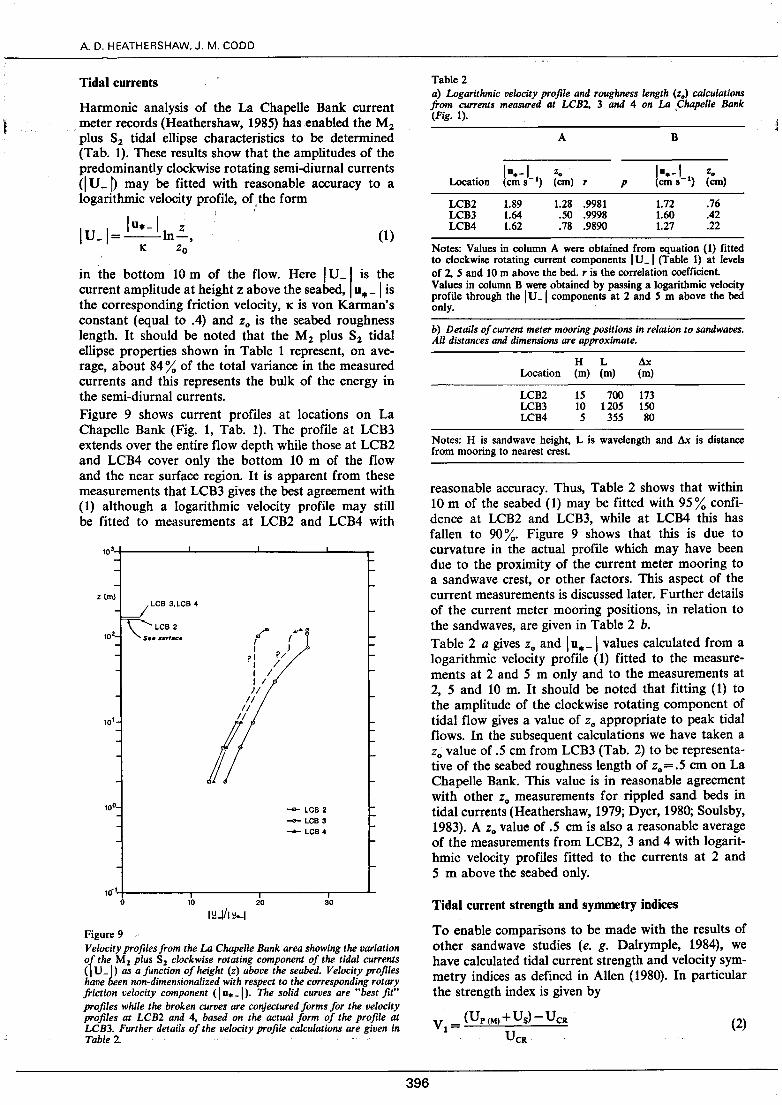
Harmonie analysis of the La Chapelle Bank current . meter records (Heathershaw, 1985) bas enabled the Ml plus sl tidal ellipse characteristics to be determined (Tab. 1). These results show that the amplitudes of the predominantly clockwise rotating semi-diurnal currents <1 U_l) may be fitted with reasonable accuracy to a logarithmic velocity profile, of
1 the form
1°•-1 z 1 U_l =--ln-, (1) 1C Zo
in 'the bottom 10 rn of the flow. Here 1 U _, is the current amplitude at height z above the seabed, u. -1 is the corresponding friction velocity, 1C is von Karman's constant ( equal to .4) and Z0 is the seabed roughness length. It should be noted that the Ml plus Sl tidal ellipse properties shown in Table 1 represent, on average, about 84% of the total variance in the measured currents and this represents the bulk of the energy in the semi-diurnal currents. Figure 9 shows current profiles at locations on La Chapelle Bank (Fig. 1, Tab. 1). The profile at LCB3 extends over the entire flow depth white those at LCB2 and LCB4 cover only the bottom 10 rn of the flow and the near surface region. It is apparent from these measurements that LCB3 gives the best agreement with (1) although a logarithmic velocity profile may still be fitted to measurements at LCB2 and LCB4 with
103+----.L...------L----....L..--"T""
z (m) LCB 3,LCB 4
101
ff"a .,•. 1 ( .
?: ?) '1 /
1 1 1 1 )/
Il Il
/; -<>- LCB 2
-<>- LCB 3
-- LCB4
1ô 1'~----r----~----~--L 0 30
Figure 9 Velocity profiles from the La Chapelle Bank area showing the variation of the M 2 plus S2 clockwise rotating component of the tidal cu"ents ( 1 U_l> as a function of height (z) above the seabed. Velocity profiles have been non-dimensionalized with respect to the corresponding rotary friction velocity component ( 1 u. -1>· The solid curves are "best fit" profiles while the broken curves are conjectured forms for the velocity profiles at LCB2 and 4, based on the actual form of the profile at LCB3. Further details of the velocity profile calculations are given in Table 2.
396
Table 2 a) Logarithmic velocity profile and roughness length (z.) calculations from cu"ents measured at LCB2, 3 and 4 on La Chapelle Bank (Fig. 1). .
A B
lu•-1 z. lu•-1 z. Location cm s-•) (cm) r p cm s- 1) (cm)
LCB2 1.89 1.28 .9981 1.72 .76 LCB3 1.64 .50 .9998 1.60 .42 LCB4 1.62 .78 .9890 1.27 .22
Notes: Values in column A were obtained from equation (1) fitted to clockwise rotating current components IU-1 (Table 1) at levels of 2, 5 and 10 m above the bed. r is the correlation coefficient. Values in column B were obtained by passing a logarithmic velocity profile through the 1 U -1 components at 2 and 5 rn above the bed only. ·
b) Details of cu"ent meter mooring positions in relation to sandwaves. Ail distances and dimensions are approximate.
H L Ax: Location (rn) (rn) (rn)
LCB2 15 700 173 LCB3 10 1205 150 LCB4 5 355 80
Notes: H is sandwave height, L is wavelength and Ax: is distance from mooring to nearest crest.
reasonable accuracy. Thus, Table 2 shows that within 10 rn of the seabed (1) may be fitted with 95% confidence at LCB2 and LCB3, white at LCB4 this bas fallen to 90%. Figure 9 shows that this is due to curvature in the actual profile which may have been due to the proximity of the current meter mooring to a sandwave crest, or other factors. This aspect of the current measurements is discussed later. Further details of the current meter mooring positions, in relation to the sandwaves, are given in Table 2 b. Table 2 a gives Z0 and 1 u. -1 values calculated from a logarithmic velocity profile (1) fitted to the measurements at 2 and 5 rn only and to the measurements at 2, 5 and 10 m. lt should be noted that fitting (1) to the amplitude of the clockwise rotating component of tidal flow gives a value of Z0 appropriate to peak tidal flows. In the subsequent calculations we have taken a Z
0 value of .5 cm from LCB3 (Tab. 2) to be representa
tive of the seabed roughness length of Z0 =.5 cm on La Chapelle Bank. This value is in reasonable agreement with other Z
0 measurements for rippled sand beds in
tidal currents (Heathershaw, 1979; Dyer, 1980; Soulsby, 1983). A Z
0 value of .5 cm is also a reasonable average
of the measurements from LCB2, 3 and 4 with logarithmic velocity profiles fitted to the currents at 2 and 5 rn above the seabed only.
Tidal current strengtb and symmetry indices
To enable comparisons to be made with the results of other sandwave studies (e. g. Dalrymple, 1984}, we have calculated tidal current strength and velocity symmetry indices as defined in Allen (1980). In particular the strength index is given by
vl = (UP(M)+ Us)-UcR
UeR (2)

SANDWAVES. INTERNAL WAVES. SEDIMENT MOBILITY (CEL TIC SEA)
and the velocity symmetry index by
Us V2=--.
UP(M) (3)
Here UP<M> is the maximum value of the periodic oscillatory tidal current, Us is the superimposed steady flow and UeR the critical velocity for the particular grain size which is being considered. ln this study, to enable comparisons to be made between different current meters at different heights and locations, the maximum oscillatory flow bas been taken as the semi-major axis of the M 2 plus S2 tidal current ellipse (Tab. 1) resolv:ed into a direction 030"T, approximately parallel to the NE-SW trending ridge of La Chapelle Bank and, in general, normal to the sandwave crests. It should be noted that due to internai wave effects and other factors, these will not be the largest currents which occur. Similarly the steady current Us has been taken as the component of residual tidal flow Üs (see Tab. 1) resolved into a direction 030"T. Results are shown in Table 3 for V 1 and V 2 calculated from current measurements at heights of 2, 5 and 10 m above the seabed. The UCR value corresponding to each of these heights was calculated from an assumed logarithmic velocity profile (1) with a seabed roughness length of Z0 =.5 cm and a critical friction velocity U*Cil obtained from Yalin's (1977) modified Shields' (1936) curve. Values of V 1 are given in Table 3 for grain sizes of 329, 506 and 800 ~m. corresponding respectively to the overall mean grain size of the quartz sand on La Chapelle Bank, the overall mean grain size of the quartz sand plus carbonate material, and the representative size of the carbonate material atone on the crest of the bank at a depth of160 m. Values of V 1 and V 2 are also shown in Figure 10 for the overall mean grain size of the sediments on La
Table 3
Chapelle Bank (d=506 ~). Table 3 and Figure 10 both illustrate that the tidal currents atone (M 2 plus S2) have low sediment transporting potential (V 1 < 1) when compared with other tidal environments, e. g. Bay of Fundy (Dabrymple, 1984) and that the velocity symmetry index is low (V2.1) suggesting that highly asymmetric bedforms are unlikely. Figure 10 also suggests that the internai structure of the La Chapelle Bank sandwaves should correspond to Allen's (1980) cross-bedded class VI or V sandwaves, with low slope angles(~) in the range 3.0-4.2°. Although this is similar to the range of slope angles shown in Figure 8, we have no independent confirmation of the internai structure of the sandwaves on La Chapelle Bank.
Figure 10
ll) "'0 0 0 0 ...- N o..? o..r Il 1 Il 1
>NfA. >Na:a..
> >
,._. ll)~ ·N o~
Il • >"' .....
..1 '...1 ! ..1 } 1 1 41-~,-~~~----~+-~----~~
- 1 1 1 + ..
3- 1 1 + 1 +_.t +
- + 1 l+t 1 +4-+ flt. . v1 2- 1+ f
- ++: ~t ~ 1- 1 1
+ 1 + 1 - LCB J 11fics 2
30 1LCB 41 0 ~
.01 .02 .05 .1 .2
Reversing currents
1-
l
I
f
I
l
I-
.5 1.0 2.0 5.0 10.0
Unidirectional currents
Velocity strength (V 1) and symmetry indices (V 2) for the cu"ents on La Chapelle Bank (0) compared with Dalrymple's (1984) observations from intertidal sandwaves in the Bay of Fundy ( + ). Roman numerals refer to Allen's (1980) structure classes with lees/ope angles given by p.
Velocity strength {V1) and symmetry (V2) indices from cu"ent measurements at LCB2, 3 and 4 on La Chapelle Bank (Fig. 1).
Met er height
Location (rn)
LCB2 10 5 2
Averages
LCB3 10 5 2
Averages
LCB4 10 5 2
Averages
!Usl cm s- 1) UP(M) (cm s- 1)
3.13 40.56 2.97 36.70 2.32 31.91
0.50 37.08 0.89 33.83 0.38 29.55
1.31 0.84 0.57
35.11 30.75 27.23
38.76 35.23 30.56
38.76 35.23 30.56
38.76 35.23 30.56
UCR (cm s- 1)
2
30.78 27.98 24.27
30.78 27.98 24.27
30.78 27.98 24.27
3
27.17 24.70 21.42
27.17 24.70 21.42
27.17 24.70 21.42
0.13 0.13 0.12
0.13
Strength Symmetry VI V2
2 3
0.42 0.61 0.08 0.42 0.61 0.08 0.37 0.60 0.07
0.40 0.61 0.08
0.22 0.38 0.01 0.24 0.41 0.03 0.23 0.40 0.01
0.23 0.40 0.02
0.18 0.34 0.04 0.13 0.28 0.03 0.15 0.31 0.02
0.15 0.31 0.03
Notes: 1, 2 and 3 denote UCR values for grain sizes of 800, 506 and 329 ~rn respectively; V1 and V2 calculated.from equations (2) and (3) after Allen (1980); 1 Us 1 is modulus of component of Us in direction 030"T (Table l); UP!MJ is component of semi-major axis (a) of tidal current ellipse in direction 030"T (Table 1).
397

( U)
( h )
( c)
A. D. HEATH ERSHAW. J . M . CODD
Figure Il
A sequence of photographs which illustrates a transition from plane (a) through rippled (b) and back to plane (c) bed conditions across the crest of a sandwave on La Chapelle Bank .
Table 3 shows that the potential for sediment transport of the M 2 plus S2 currents fall s off steadily within a distance of 20 km across the shelf break. Thus, for d=506 J.iffi , vl has fallen from .37 to .15, while for d=800 J.Lm , V 1 =0 at LCB3 and LCB4, i. e. {UP(M)+ Us)< UeR, indicating that the coarsest material is only
398
moved at locations close to the shelf-break (e. g. LCB2) when considered in terms of the current in direction 030°T. It should be emphasised that this analysis has been done in terms of the M 2 and S2 tidal current components in the current meter records. We show Iater that other factors contribute to the total current field near the seabed.
Sediment mobility
In the presence of bedforms the total drag exerted on the seabed by currents will be made up of skin friction and the form drag of the bedforms themselves. Only the skin friction part of the total bed shear stress is capable of moving sediment and Smith ( 1977) has shown that for non-separating flow over sandwaves this may be as little as 1/4 of the total drag.
The adjustment from total drag to skin friction takes place within an internai boundary layer the height of which may extend up to 2-3 times the height of the bedform (Krugermeyer, Grunwald, 1978). For steady unidirectional flow over a hierarchy of bedforms, Smith and McLean ( 1977) have shown that this adjustment may be continuous through a number of internai boundary layers in each of which the velocity structure is given by a logarithmic velocity profile ( 1) . Th us the current speed u. at height z. in the nth layer above the bottom is given by
u. z U = - " ln --"-
" ' 1( zo. (4)
where u •• and z0 • are the appropriate friction velocity
and seabed roughness length scales respectively, and K
is von Karman's constant. In the boundary layer adjacent to the seabed, ( n = 1) the roughness Iength should be given by the Nikuradse grain roughness z01 :::::-.d/30 where d is the grain diameter, and the skin friction will be given by pu.: where p is the fluid density. Smith
and McLean have shown that throughout the region of internai boundary layer adjustment the velocity profile (on a semi-logarithmic plot) is characteristically curved downwards.
In this study the velocity profile measurements (Fig. 9) were above the zone of adjustment from grain roughness to ripple roughness but extended through a zone in which the roughness adjusted from that of the ripples and megaripples to that of the sandwaves. Indeed sorne of the curvature which is shown in the LCB3 profile above 10 rn (Fig. 9) may be due to this effect although, equally weil, it may have been due to the effects of density stratification. This latter aspect of the velocity profiles is to be investigated elsewhere.
In this study we are interested in the potential mobility of the sediments and bence the skin friction part of the total shear stress above the ripples. Smith and McLean (1977) have shown that if the force per unit width {F0 )
acting on a two dimensional bedform is given by
1 2 F 0 = - pC0 URH, 2
(5)
where C 0 is the bedform drag coefficient, H the height
SANDWAVES. INTERNAL WAVES. SEDIMENT MOBILITY (CEL TIC SEA)
of the bedform and UR the current at the matching height between the inner (sand grain) and outer (ripple) boundary layers, (4) and (5) may be used to estimate the ratio of total drag to skin friction. Thus the ratio
"of outer to inner layer friction velocities is, in general, given by
"*n+ 1 = (t + Coz. H,+ 1 [ln al ( L,+ 1 )4/5]2)1/2, (6) u., 2K L,+l zo,
which for n = 1 gives the ratio at the matching height between the sand grain and ripple roughness boundary layers. In (6), with n=1, H,+ 1 and L,+ 1 are the ripple height and wavelength respectively, z0• will be the grain roughness (z01 '::!!.d/30) and a1 takes values in the range .3 to .5.
We have evaluated (6) for ripples with H=l.O cm and L= 10.0 cm (Fig. 11), with C0 values corresponding to separating and non-separating flow and with grain sizes of 329, 506 and 800 J.lm respectively (see earlier). These results are shown in Table 4 and show that the ratio of total drag to skin friction, (u. 2/u. 1)
2, varies on
average from about 3:1 in separating flow to about 10 : 1 in non-separating flow. As expected the ratio is larger for smaller grain sizes because the skin friction component is less.
Table 4 Ratio of total drag to skin friction for different grain sizes and for · separating and non-separating flow over ripples (after Smith, McLean, 1977). Values are calculated for a ripple height (H) of 1 cm and a ripple wavelength (L) of 10 cm.
Grain size (IJ.m)
d=329 d=506 d=800
Averages
Non-separating (C0 =.8) Separating (C0 =.2) (u*•+ l/u.,)2 (u*•+ .lu•)2
a1 =.3 a1 =.5 a1 =.3 a1 =.5
10.30 11.90 3.31 3.72 9.24 10.76 3.06 3.46 8.24 9.67 2.82 3.17
9.26 10.78 3.06 3.45
While underwater photography has provided sorne evidence of ripple patches in the vicinity of sandwave crests (Fig. 11 a and 11 b), other photographs (e. g. Fig. 11 c) show that away from sandwave crests the bed may be plane. On the other band, roughness length estimates from current profile measurements at LCB2, 3 and 4 are more typical of a rippled seabed. In Figures 11 a and 11 b it should be noted that the ripples are not symmetrical, suggesting that these bedforms are generated by tidal currents and not surface gravity waves.
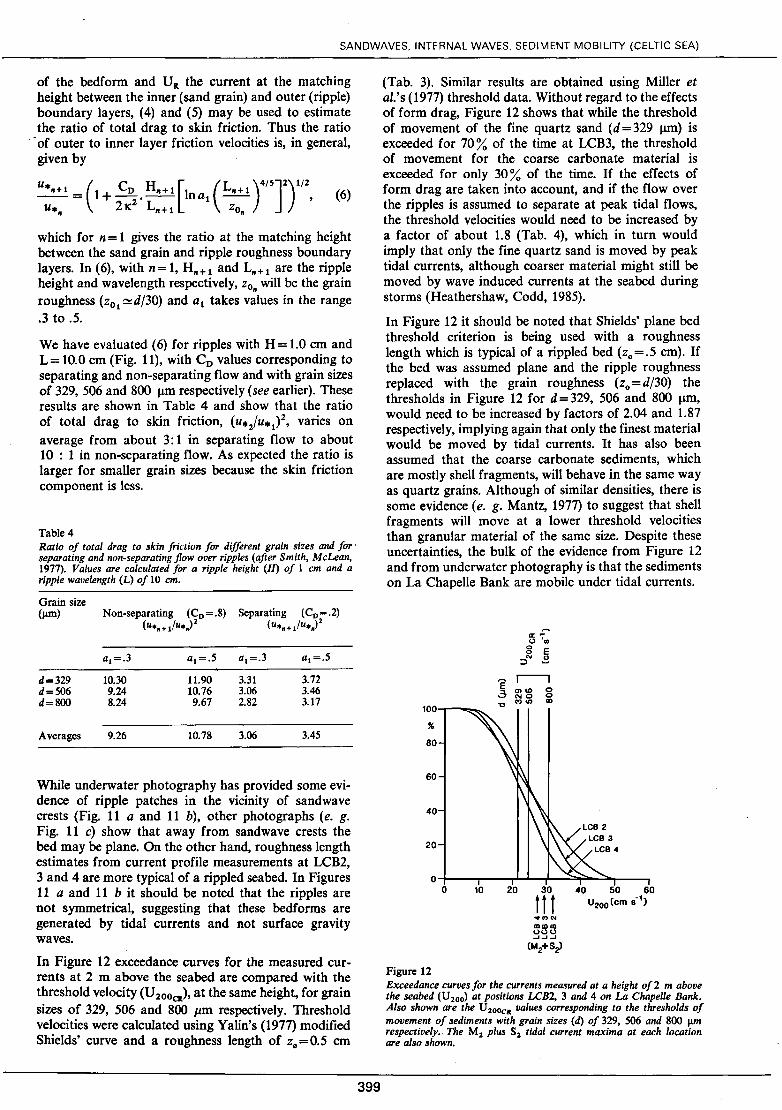
In Figure 12 exceedance curves for the measured currents at 2 m above the seabed are compared with the threshold velocity (U zooa), at the same height, for grain sizes of 329, 506 and 800 p.m respectively. Threshold velocities were calculated using Yalin's (1977) modified Shields' curve and a roughness length of z0 =0.5 cm
399
(Tab. 3). Similar results are obtained using Miller et al.'s (1977) threshold data. Without regard to the effects of form drag, Figure 12 shows that while the threshold of movement of the fine quartz sand (d=329 J.lm) is exceeded for 70% of the time at LCB3, the threshold of movement for the coarse carbonate material is exceeded for only 30% of the time. If the effects of form drag are taken into account, and if the flow over the ripples is assumed to separate at peak tidal flows, the threshold velocities would need to be increased by a factor of about 1.8 (Tab. 4), which in turn would imply that only the fine quartz sand is moved by peak tidal currents, although coarser material might still be moved by wave induced currents at the seabed during storms (Heathershaw, Codd, 1985).
In Figure 12 it should be noted that Shields' plane bed threshold criterion is being used with a roughness length which is typical of a rippled bed (z0 = .5 cm). If the bed was assumed plane and the ripple roughness replaced with the grain roughness (z0 = d/30) the thresholds in Figure 12 for d=329, 506 and 800 J.lm, would need to be increased by factors of 2.04 and 1.87 respective! y, implying again that only the finest material would be moved by tidal currents. It bas also been assumed that the coarse carbonate sediments, which are mostly shell fragments, will behave in the same way as quartz grains. Although of similar densities, there is sorne evidence (e. g. Mantz, 1977) to suggest that shell fragments will move at a lower threshold velocities than granular material of the same size. Despite these uncertainties, the bulk of the evidence from Figure 12 and from underwater photography is that the sediments on La Chapelle Bank are mobile under tidal currents.
60
40
20
...... a:-0 • .,
g E "' <> :;) ~
0~--~----~~~~~~~~--~ 0 10
Figure 12
20 30 40 50 60 t ll u200 (cm s"1)
... .,"' mmm 000 ............
CM2+S~
Exceedance curves for the cu"ents measured at a height of 2 m above the seabed (U 200) at positions LCB2, 3 and 4 on La Chapelle Bank. Also shown are the U 2oocR values co"esponding to the thresholds of movement of sediments with grain sizes (d) of 329, 506 and 800 IJ.m respective/y. The M2 plus S2 tidal cu"ent maxima at each location are also shown.

A. D. HEATHERSHAW. J. M. CODD
Figure 12 also illustrates how the peak nearbed currents decrease with increasing distance from the shelf-break. Thus while a current of about 41 cm s- 1 is exceeded for 10% of the time at LCB2, nearest the shelf-break, this has fallen to 37 cm s- 1 at LCB3 and 33 cm s- 1
at LCB4. This trend is also illustrated in Figure 5 c in relation to averaged sandwave heights and wavelengths and shows how the semi-major axis of the tidal current ellipse (Tab. 1) at 2 m above the seabed, decreases progressive! y from ....., 32 cm s -t at LCB2, to ....., 30 cm s- 1 at LCB3 and ....., 27 cm s- 1 at LCB4. The orientation of the semi-major axis of the tidal current ellipse was found to vary by only 4° over this distance.
Sediment transport rates and directions
To investigate the changes in sandwave asymmetry shown in Figure 2, we have calculated the net or tidally averaged sediment transport rate (ii..h) from nearbed current measurements at LCB2, 3 and 4. Similarly to Heathershaw and Codd (1985), we have used Hardisty's (1983) modified excess stress formulation of Bagnold's (1966) sediment transport equation, in which the quantity of sediment transported as bedload ( q.b) is given by
q.b=kt (UÎoo- UioocR) UtOo(gmcm-• S-1). (7)
Here k 1 is a dimensional coefficient which depends on grain size, U 100 is the current at 100 cm (1 m) above the seabed, and U 100CR is the corresponding threshold velocity. There is sorne uncertainty in the exact form of k1 but a re-evaluation of the data in Hardisty's Figure 1 and Table 1 gives k 1 =.1773 d-·6916 x 10- 5 gm cm-4 s2 where d is the grain size in mm.
Th us, U 100 values were obtained from the currents measured at 200 cm (2 m) above the bed, U 200, using an assumed logarithmic velocity profile and a roughness length of z0 =.5 cm. Tidally averaged values of q.b were calculated for an overall mean grain size of 506 ).lm and for an integral number of M 2 (12.42 hrs.) tidal cycles at each of the locations LCB2, 3 and 4. The residual tidal current O. was also calculated over the same period. These results are summarised in Table 5 and it should be noted that values of o. given here will differ slightly from those given in Table 1 where it was possible to use a numerical filter with known tidal suppression characteristics (Doodson, 1928). In Table 5, for consistency with the sediment transport calculations, O. is a simple vector mean over the averaging period.
Table 5 Calculations of the tidally averaged sediment transport rates (ii.,b) and the residual currents {Us) at locations LCB2, 3 and 4 on La Chapelle Bank. Sediment transport rates have been calculated for an overall mean grain size of 506 11111 and with a roughness length Z0 of .5 cm. y and 9 give the orientations of the sediment transport and residual cu"ent vectors respective/y.
1 ii.,b 1 y IDsl e Location (gm cm- 1 s~ 1) ("T) (cm s- 1) ("T)
LCB2 7.75 x 10- 3 106 4.68 150 LCB3 2.88 x 10- 3 175 .76 153 LCB4 1.19 x 10- 3 49 .98 99
400
The sediment transport rates and directions are indicatedin Figure 2 together with the residual currents. These results show that over the limited period of the current measurements (6-7 days), the residual water movements were in general from NW to SE along the shelf with off-shelf components at LCB2 and 3 and with an on-shelf component of flow at LCB4. The predicted directions of net sediment movement were also alongshelf from NW to SE, with sorne convergence in the on-shelfjoff-shelf components between LCB2 and LCB3 and with a stronger on-shelf component at LCB4.
The fact that the net sediment movements at LCB2 and 3 are principally alongshelf may suggest why the sandwaves at these locations, and in general at the shelf-edge, are more symmetrical than those further onshelf, for example at LCB4, where the net sediment movements appear to be more nearly on-shelf.
DISCUSSION
Recent interest in shelf-edge sandwaves (e. g. Karl, Carlson, 1982) has centred on the possible role played in their formation by internai waves. Thus Karl et al. (in prep.) have described sandwaves in the head of Navarinsky Canyon in the Bering Sea, which might have been formed by internai waves at a time when sea leve! stood 130 m lower than at present. It is weil known that energy focussing of internai tides and waves may occur in the heads of submarine canyons (e. g. Hotchkiss, Wunsch, 1982) and, further more, it has been demonstrated in laboratory experiments (Southard, Cacchione, 1972), that breaking internai waves may generate bedforms. Thus, are the sandwaves on La Chapelle Bank generated by internai waves, either lee-waves as proposed by Cartwright (1959) or by lower frequency internai tidal motions as identified by Pingree et al. (1983) and Heathershaw (1985), or cao the barotropic currents due to surface tides alone explain the presence of the sandwaves?
The evidence from this study is that the M 2 plus S2 currents due to the surface tide alone will in general be capable of transporting the bulk of the sediments on La Chapelle Bank. The results shown in Table 3 for the current strength index (V 1), show that this is the case with ali but the coarsest sediments being transported at sorne time. This is also confirmed in Figure 12 where the measured currents are compared with the thresholds of movement of sediments in the range 300-800 !!ID. Even if the seabed is rippled and part of the total drag on the seabed is comprised of form drag, the remaining skin friction part will still be sufficient to move sorne sediments, provided that the flow over the ripples has separated. Finally, the overwhelming evidence from underwater photography (Fig. 11) is that the seabed is rippled, possibly locally in the vicinity of sandwave crests, implying that the sediments at these locations are mobile, probably under the action of tidal currents alone.

SANDWAVES, INTERNAL WAVES, SEDIMENT MOBILITY (CELTIC SEA)
However, the observed decrease in sandwave wavelengths with increasing distance on-shelf (Fig. 5 a) can not be explained by tidal current variations atone. This is despite any decrease in sediment mobility which occurs as a result of the decrease in tidal current strength across-shelf (Fig. 5 c). An alternative explanation may be found in Cartwright's (1959) internallee-wave model. This prediets preferred sandwave-building internai wave wavenumbers, k0 , given by
(8)
Here h2 and h1 are upper and lower layer thicknesses in a two layer model of stratified flow at the shelfedge, y 0 = (2gJ.L/U 1
2- k~)1'2 where g is the acceleration
due to gravity, J.l is the density gradient and U 1 is the current at 1 rn above the seabed. The variation of k0 with 2gJ.L/U 1
2 is given by Cartwright (Fig. 7, p. 231) for h1 =100 rn and h2 =60 m. This result shows quite clearly that with constant J.l, decreases in U 1 give larger wavenumbers (k 0 ) and correspondingly smaller wavelengths for the internai waves. However, our calculations show that equation (8) is particularly sensitive to the actual combination of J.l and U 1 values which is used. In particular a range of U 1 values is possible although the observed semi-diurnal tidal current amplitudes at LCB2 and LCB4, and typical density gradients, give unrealistically small wavelengths. While these do not match the observed sandwave wavelengths exactly, there is broad agreement between Cartwright's model and the observed pattern of wavelength change across the sandwave field.
CONCLUSIONS
In summary therefore our conclusions are: 1) Detailed comparisons of sediment thresholds with measured nearbed currents have shown that the move-
401
ments of sediment on La Chapelle Bank can most probably be accounted for in terms of the currents due to the barotropic surface tide alone. 2) In terms of their geometrical properties, i. e. height, wavelength, lee slope angles, etc., the La Chapelle Bank sandwaves are similar to those found elsewhere in other tidal environments. 3) However, to explain the unusual and systematic pattern of wavelength change across the sandwave field, it is necessary to invoke an internai wave mechanism. Thus, it has been found that Cartwright's (1959) leewave model correctly predicts a decrease in sandwave wavelength as the nearbed currents decrease with increasing distance from the shelf-break.
4) Despite the fact that the sandwaves on La Chapelle Bank lie parallel to the shelf -edge, the predicted directions of net sediment movement appear to be along the shelf to the SE.
5) Finally, we conclude that, although only present during seasonally stratified flow conditions, internai waves may play an important role in determining the overall patterns of tidally driven sediment movement at the shelf-edge. In particular they will produce spatial variations in sand transport rates and thus provide a potent sandwave building mechanism.
Acknowledgements
We are grateful to our colleagues at lOS Taunton and R VS Barry who have assisted in the collection and interpretation of these data. Particular thanks go to Bill Miller, Robin Powell and Phil Taylor at R VS and to Adrian Read and Nick Dillon at lOS. We also thank the Master and crew of the NERC research vessel RRS Frederick Russell. Paul Komar and Adrian New contributed valuable discussion to an earlier draft of this paper.

. A O. HEATHERSHAW. J. M. CODD
REFERENCES
Allen J.R.L., 1970. Physica/ processes of sedimentation. Allen and Unwin, London. Allen J.R.L., 1980. Sandwaves: a model of origin and internai structure, Sediment. Geo/., 26, 281-328. Allen J.R.L., 1982. Sedimentary structures: their character and physica/ basis, Vol. I, Elsevier, 593 p. Amos C.L., King E.L., 1984. Bedforms of the Canadian eastern seaboard: a comparison with global occurrences, Mar. Geo/., 57, 167-208. Auffret G.A., Berthois L., Douville J.L., 1975. Observations sur les courants sous-marins du plateau continental, La Houille Blanche, 718, 467-478. Bagnold R.A., 1966. An approach to the sediment transport problem from general physics, US Geol. Surv. Prof. Pap .• 422, 1, 37 p. Bouysse P., Hom R., Lapierre F., Le Lann F., 1976. Étude des grands bancs de sable du Sud-Est de la Mer Celtique, Mar. Geol .• 20,251-275. Bouysse P., Le Lann F., Sco1ari G., 1979. Les sédiments superficiels des approches occidentales de la Manche, Mar. Geol., 29, 107-135. Cartwright D.E., 1959. On submarine sandwaves and tidallee-waves, Proc. R. Soc., Ser. A., 253, 218-241. Cartwright D.E., Stride A.M., 1958. Large sandwaves near the edge of the continental shelf, Nature, 181,41. Dalrymple R. W., 1984. Morphology and internai structure of sandwaves in the Bay of Fundy, Sedimento/ogy, 31, 365-382. Dalrymple R.W., Knight R.J., Lambione J.J., 1978. Bedforms and their hydraulic stability relationships in a tidal environment, Bay of Fundy, Canada, Nature, 275, 100-104. Doodson A.T., 1928. The analysis oftidal observations, Philos. Trans. R. Soc. London, A 227, 223-279. Dyer K.R., 1980. Velocity profiles over a rippled bed and the threshold ofmovement of sand, Estuarine Coasta/ Mar. Sei., 10, 181-199. Flemming B.W., 1980. Sand transport and bedform patterns on the continental shelf between Durban and Port Elizabeth (South-East African continental margin), Sediment. Geo/., 26, 179-205. Hardisty J., 1983. An assessment and calibration of formulations for Bagnold's bedload equation, J. Sediment. Petrol., 53, 1007-1010. Heathershaw A.D., 1979. The turbulent structure of the bottom boundary layer in a tidal current, Geophys. J.R. Astron. Soc., 58, 395-430. Heathershaw A.D., 1985. Sorne observations of internai wave current fluctuations at the shelf-edge and their implications for sediment transport, Cont. Shelf Res. (in press). Heatershaw A.D., Codd J.M., 1985. Depth controlled changes in grain size and carbonate content on a shelf-edge sand bank, Geo/. Mar. Lett. (in press). •
Hotchkiss F.S., Wunsch C., 1982. Internai waves in Hudson Canyon with possible geological implications, Deep-Sea Res., 29,415-442.
Karl H.A., Carlson P.R., 1982. Large sandwaves in Navarinsky Canyon head, Bering Sea, Geo/. Mar. Lett., 2, 157-162.
Karl H.A., Cacchione D.A., Carlson P.R., 1985. Internal-wave and turbidity currents as mechanisms to account for large sandwaves in Navarinsky Canyon head, Bering Sea (in prep.).
Krugermeyer L., Grunwald M., 1978. The influence of sea wavt:s on the wind profile, Bound.-Layer Meteorol., 10,403-414.
Langhome D.N., 1978. Offshore engineering and navigational problems - The relevance of sandwave research, Society of Underwater Technology Technica/ Note, 21 p.
Mantz P.A., 1977. Incipient transport of fine grains and flakes by fluids - Extended Shields' diagram, ASOE J. Hydraul. Div., 103, 601-615.
Pingree R.D., MardeU G.T., Holligan P.M., Grlffiths D.K., Smithers J., 1982. Celtic Sea and Armorican current structure and the vertical distributions of temperature and chlorophyll, Cont. She/f Res., 1, 99-116.
Pingree R.D., Griffiths D.K., MardeU G.T., 1983. The structure of the internai tide at the Celtic Sea shelfbreak, J. Mar. Biol. Assoc. UK, 64, 99-113.
Shields A., 1936. Application of similarity principles and turbulence research to bedload movement, translated from Anwendung der Achnlichkeits Geschiebebewegung, in: Mitt. Preuss. Vers Anst. Wasserb. Shiftb, edited by W.D. Ott and J.C. von Vcheten, Pub/. Ca/if. Inst. Technol. Hydrodyn. Lab., No. 167, 36 p.
Smith J.D., 1977. Modelling of sediment transport on continental shelves, in: The Sea, 6, edited by E.D. Goldberg, I.N. McCave, J.J. O'Brien and J.H. Steele, Wiley Interscience, 539-577.
Smith J.O., McLean S.R., 1977. Spatially averaged flow over a wavy surface, J. Geophys. Res., 82, 1735-1746.
Soulsby R.L., 1983. The bottom boundary layer of shelf seas in: Physical oceanography of coasta/ and she/f seas, edited by B. Johns, Elsevier, 470 p.
Southard J.B., Cacchione D.A., 1972. Experiments on bottom sediment movement by breaking internai waves, in: Shelf sediment transport: process and pattern, edited by D.J.P. Swift, D. Duane and O. Pilkey, Dowden, Hutchinson and Ross, 83-97.
Stride A.M., Tucker M.J., 1960. Internai waves and waves of sand, Nature, 188, 933.
402
Yalin M.S., 1977. Mechanics of sediment transport (2nd edition), Pergamon Press, 290 p.