Embed Size (px)
Citation preview
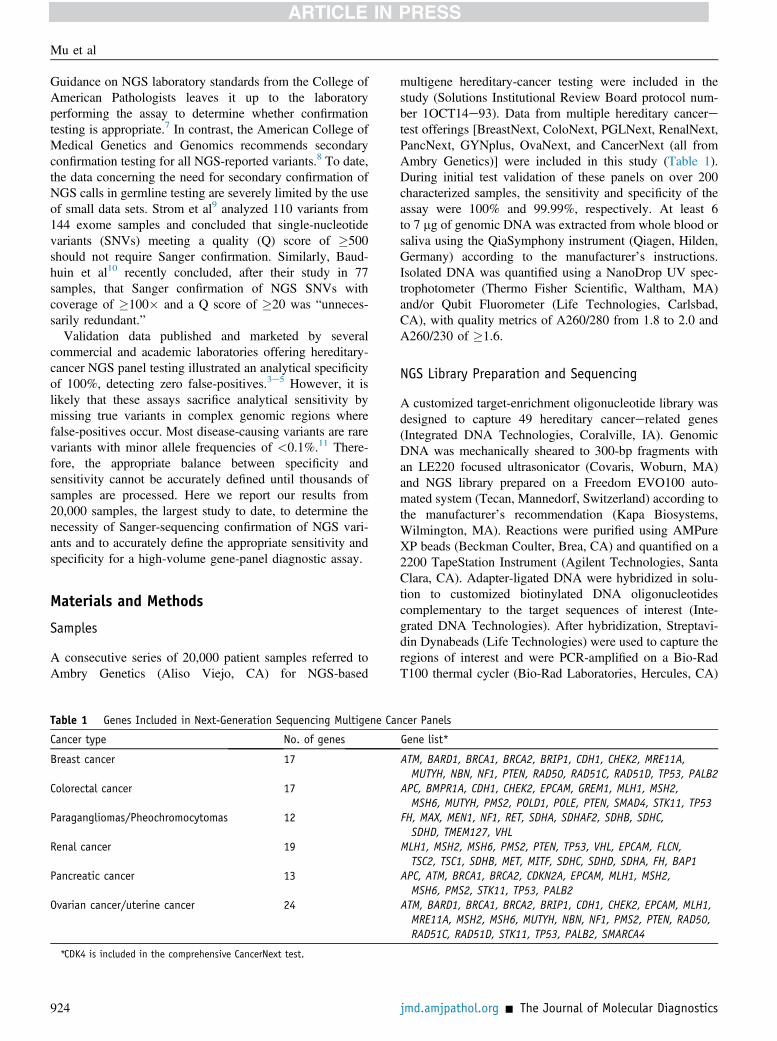
The Journal of Molecular Diagnostics, Vol. 18, No. 6, November 2016
jmd.amjpathol.org
Sanger Confirmation Is Required to AchieveOptimal Sensitivity and Specificity in
Next-Generation Sequencing Panel TestingWenbo Mu, Hsiao-Mei Lu, Jefferey Chen, Shuwei Li, and Aaron M. ElliottFrom Ambry Genetics, Aliso Viejo, California
Accepted for publication
C
T
h
July 19, 2016.
Address correspondence toAaron M. Elliott, Ph.D., AmbryGenetics, Research and Devel-opment, 15 Argonaut, AlisoViejo, CA 92656. E-mail:[email protected].
opyright ª 2016 American Society for Inve
his is an open access article under the CC B
ttp://dx.doi.org/10.1016/j.jmoldx.2016.07.006
Next-generation sequencing (NGS) has rapidly replaced Sanger sequencing as the method of choice fordiagnostic gene-panel testing. For hereditary-cancer testing, the technical sensitivity and specificity ofthe assay are paramount as clinicians use results to make important clinical management and treatmentdecisions. There is significant debate within the diagnostics community regarding the necessity ofconfirming NGS variant calls by Sanger sequencing, considering that numerous laboratories reporthaving 100% specificity from the NGS data alone. Here we report our results from 20,000 hereditary-cancer NGS panels spanning 47 genes, in which all 7845 nonpolymorphic variants were Sanger-sequenced. Of these, 98.7% were concordant between NGS and Sanger sequencing and 1.3% wereidentified as NGS false-positives, located mainly in complex genomic regions (A/T-rich regions, G/C-richregions, homopolymer stretches, and pseudogene regions). Simulating a false-positive rate of zero byadjusting the variant-calling quality-score thresholds decreased the sensitivity of the assay from 100%to 97.8%, resulting in the missed detection of 176 Sanger-confirmed variants, the majority in complexgenomic regions (n Z 114) and mosaic mutations (n Z 7). The data illustrate the importance ofsetting quality thresholds for panel testing only after thousands of samples have been processed andthe necessity of Sanger confirmation of NGS variants to maintain the highest possible sensitivity.(J Mol Diagn 2016, 18: 923e932; http://dx.doi.org/10.1016/j.jmoldx.2016.07.006)
Supported by Ambry Genetics.W.M. and H.-M.L. contributed equally to this work.Disclosure: All authors are employees of Ambry Genetics. A.M.E. and
H.-M.L. are shareholders of Ambry Genetics. A.M.E. is an officer ofAmbry Genetics.
Rapid technical advances in target enrichment andnext-generation sequencing (NGS) technologies have revo-lutionized clinical diagnostic testing. The ability to simul-taneously analyze all genes involved in a disease phenotypeat a reduced cost has enabled NGS to surpass conventionalcapillary Sanger sequencing as the method of choice in mosthigh-throughput diagnostics laboratories.1 Targeted NGSpanel tests have become frontline assays for a wide varietyof inherited disorders. In accordance with the accessibilityof NGS, a multitude of diagnostics laboratories haverecently launched a broad range of inherited cancer-susceptibility gene panels that test a wide variety of char-acterized genes associated with hereditary cancers.2e6 Theaccuracy of these tests can vary based on a number ofvariables including the target enrichment platform,sequencing technology, bioinformatics pipeline used, andvariant classification experience. The technical sensitivityand specificity of a hereditary-cancer test are paramount as
stigative Pathology and the Association for M
Y-NC-ND license (http://creativecommons.org
physicians use the results to make important clinical man-agement decisions such as costly specialized surveillanceand preventive surgery.
There is significant debate within the diagnostic gene-sequencing space regarding the necessity of confirmingNGS-determined variant calls using a secondary technologysuch as Sanger sequencing to avoid the possibility ofreporting out a false-positive result. Many laboratories areresistant to Sanger-sequencing confirmation as it requiresadditional primer design, validation, clinical workflow, andlicensed personnel for chromatogram analysis, whichincrease both the cost and turnaround time of testing.
olecular Pathology. Published by Elsevier Inc.
/licenses/by-nc-nd/4.0).
Mu et al
Guidance on NGS laboratory standards from the College ofAmerican Pathologists leaves it up to the laboratoryperforming the assay to determine whether confirmationtesting is appropriate.7 In contrast, the American College ofMedical Genetics and Genomics recommends secondaryconfirmation testing for all NGS-reported variants.8 To date,the data concerning the need for secondary confirmation ofNGS calls in germline testing are severely limited by the useof small data sets. Strom et al9 analyzed 110 variants from144 exome samples and concluded that single-nucleotidevariants (SNVs) meeting a quality (Q) score of �500should not require Sanger confirmation. Similarly, Baud-huin et al10 recently concluded, after their study in 77samples, that Sanger confirmation of NGS SNVs withcoverage of �100� and a Q score of �20 was “unneces-sarily redundant.”
Validation data published and marketed by severalcommercial and academic laboratories offering hereditary-cancer NGS panel testing illustrated an analytical specificityof 100%, detecting zero false-positives.3e5 However, it islikely that these assays sacrifice analytical sensitivity bymissing true variants in complex genomic regions wherefalse-positives occur. Most disease-causing variants are rarevariants with minor allele frequencies of <0.1%.11 There-fore, the appropriate balance between specificity andsensitivity cannot be accurately defined until thousands ofsamples are processed. Here we report our results from20,000 samples, the largest study to date, to determine thenecessity of Sanger-sequencing confirmation of NGS vari-ants and to accurately define the appropriate sensitivity andspecificity for a high-volume gene-panel diagnostic assay.
Materials and Methods
Samples
A consecutive series of 20,000 patient samples referred toAmbry Genetics (Aliso Viejo, CA) for NGS-based
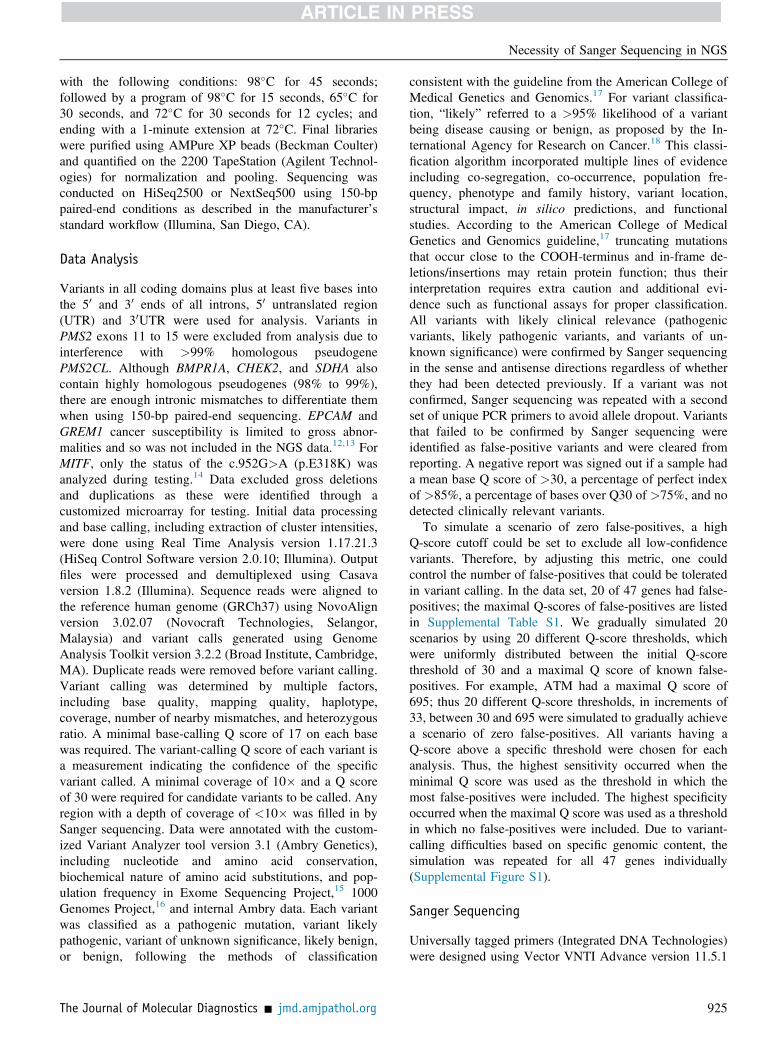
Table 1 Genes Included in Next-Generation Sequencing Multigene Ca
Cancer type No. of genes
Breast cancer 17
Colorectal cancer 17
Paragangliomas/Pheochromocytomas 12
Renal cancer 19
Pancreatic cancer 13
Ovarian cancer/uterine cancer 24
*CDK4 is included in the comprehensive CancerNext test.
924
multigene hereditary-cancer testing were included in thestudy (Solutions Institutional Review Board protocol num-ber 1OCT14e93). Data from multiple hereditary canceretest offerings [BreastNext, ColoNext, PGLNext, RenalNext,PancNext, GYNplus, OvaNext, and CancerNext (all fromAmbry Genetics)] were included in this study (Table 1).During initial test validation of these panels on over 200characterized samples, the sensitivity and specificity of theassay were 100% and 99.99%, respectively. At least 6to 7 mg of genomic DNA was extracted from whole blood orsaliva using the QiaSymphony instrument (Qiagen, Hilden,Germany) according to the manufacturer’s instructions.Isolated DNA was quantified using a NanoDrop UV spec-trophotometer (Thermo Fisher Scientific, Waltham, MA)and/or Qubit Fluorometer (Life Technologies, Carlsbad,CA), with quality metrics of A260/280 from 1.8 to 2.0 andA260/230 of �1.6.
NGS Library Preparation and Sequencing
A customized target-enrichment oligonucleotide library wasdesigned to capture 49 hereditary cancererelated genes(Integrated DNA Technologies, Coralville, IA). GenomicDNA was mechanically sheared to 300-bp fragments withan LE220 focused ultrasonicator (Covaris, Woburn, MA)and NGS library prepared on a Freedom EVO100 auto-mated system (Tecan, Mannedorf, Switzerland) according tothe manufacturer’s recommendation (Kapa Biosystems,Wilmington, MA). Reactions were purified using AMPureXP beads (Beckman Coulter, Brea, CA) and quantified on a2200 TapeStation Instrument (Agilent Technologies, SantaClara, CA). Adapter-ligated DNA were hybridized in solu-tion to customized biotinylated DNA oligonucleotidescomplementary to the target sequences of interest (Inte-grated DNA Technologies). After hybridization, Streptavi-din Dynabeads (Life Technologies) were used to capture theregions of interest and were PCR-amplified on a Bio-RadT100 thermal cycler (Bio-Rad Laboratories, Hercules, CA)
ncer Panels
Gene list*
ATM, BARD1, BRCA1, BRCA2, BRIP1, CDH1, CHEK2, MRE11A,MUTYH, NBN, NF1, PTEN, RAD50, RAD51C, RAD51D, TP53, PALB2
APC, BMPR1A, CDH1, CHEK2, EPCAM, GREM1, MLH1, MSH2,MSH6, MUTYH, PMS2, POLD1, POLE, PTEN, SMAD4, STK11, TP53
FH, MAX, MEN1, NF1, RET, SDHA, SDHAF2, SDHB, SDHC,SDHD, TMEM127, VHL
MLH1, MSH2, MSH6, PMS2, PTEN, TP53, VHL, EPCAM, FLCN,TSC2, TSC1, SDHB, MET, MITF, SDHC, SDHD, SDHA, FH, BAP1
APC, ATM, BRCA1, BRCA2, CDKN2A, EPCAM, MLH1, MSH2,MSH6, PMS2, STK11, TP53, PALB2
ATM, BARD1, BRCA1, BRCA2, BRIP1, CDH1, CHEK2, EPCAM, MLH1,MRE11A, MSH2, MSH6, MUTYH, NBN, NF1, PMS2, PTEN, RAD50,RAD51C, RAD51D, STK11, TP53, PALB2, SMARCA4
jmd.amjpathol.org - The Journal of Molecular Diagnostics
Necessity of Sanger Sequencing in NGS
with the following conditions: 98�C for 45 seconds;followed by a program of 98�C for 15 seconds, 65�C for30 seconds, and 72�C for 30 seconds for 12 cycles; andending with a 1-minute extension at 72�C. Final librarieswere purified using AMPure XP beads (Beckman Coulter)and quantified on the 2200 TapeStation (Agilent Technol-ogies) for normalization and pooling. Sequencing wasconducted on HiSeq2500 or NextSeq500 using 150-bppaired-end conditions as described in the manufacturer’sstandard workflow (Illumina, San Diego, CA).
Data Analysis
Variants in all coding domains plus at least five bases intothe 50 and 30 ends of all introns, 50 untranslated region(UTR) and 30UTR were used for analysis. Variants inPMS2 exons 11 to 15 were excluded from analysis due tointerference with >99% homologous pseudogenePMS2CL. Although BMPR1A, CHEK2, and SDHA alsocontain highly homologous pseudogenes (98% to 99%),there are enough intronic mismatches to differentiate themwhen using 150-bp paired-end sequencing. EPCAM andGREM1 cancer susceptibility is limited to gross abnor-malities and so was not included in the NGS data.12,13 ForMITF, only the status of the c.952G>A (p.E318K) wasanalyzed during testing.14 Data excluded gross deletionsand duplications as these were identified through acustomized microarray for testing. Initial data processingand base calling, including extraction of cluster intensities,were done using Real Time Analysis version 1.17.21.3(HiSeq Control Software version 2.0.10; Illumina). Outputfiles were processed and demultiplexed using Casavaversion 1.8.2 (Illumina). Sequence reads were aligned tothe reference human genome (GRCh37) using NovoAlignversion 3.02.07 (Novocraft Technologies, Selangor,Malaysia) and variant calls generated using GenomeAnalysis Toolkit version 3.2.2 (Broad Institute, Cambridge,MA). Duplicate reads were removed before variant calling.Variant calling was determined by multiple factors,including base quality, mapping quality, haplotype,coverage, number of nearby mismatches, and heterozygousratio. A minimal base-calling Q score of 17 on each basewas required. The variant-calling Q score of each variant isa measurement indicating the confidence of the specificvariant called. A minimal coverage of 10� and a Q scoreof 30 were required for candidate variants to be called. Anyregion with a depth of coverage of <10� was filled in bySanger sequencing. Data were annotated with the custom-ized Variant Analyzer tool version 3.1 (Ambry Genetics),including nucleotide and amino acid conservation,biochemical nature of amino acid substitutions, and pop-ulation frequency in Exome Sequencing Project,15 1000Genomes Project,16 and internal Ambry data. Each variantwas classified as a pathogenic mutation, variant likelypathogenic, variant of unknown significance, likely benign,or benign, following the methods of classification
The Journal of Molecular Diagnostics - jmd.amjpathol.org
consistent with the guideline from the American College ofMedical Genetics and Genomics.17 For variant classifica-tion, “likely” referred to a >95% likelihood of a variantbeing disease causing or benign, as proposed by the In-ternational Agency for Research on Cancer.18 This classi-fication algorithm incorporated multiple lines of evidenceincluding co-segregation, co-occurrence, population fre-quency, phenotype and family history, variant location,structural impact, in silico predictions, and functionalstudies. According to the American College of MedicalGenetics and Genomics guideline,17 truncating mutationsthat occur close to the COOH-terminus and in-frame de-letions/insertions may retain protein function; thus theirinterpretation requires extra caution and additional evi-dence such as functional assays for proper classification.All variants with likely clinical relevance (pathogenicvariants, likely pathogenic variants, and variants of un-known significance) were confirmed by Sanger sequencingin the sense and antisense directions regardless of whetherthey had been detected previously. If a variant was notconfirmed, Sanger sequencing was repeated with a secondset of unique PCR primers to avoid allele dropout. Variantsthat failed to be confirmed by Sanger sequencing wereidentified as false-positive variants and were cleared fromreporting. A negative report was signed out if a sample hada mean base Q score of >30, a percentage of perfect indexof >85%, a percentage of bases over Q30 of >75%, and nodetected clinically relevant variants.
To simulate a scenario of zero false-positives, a highQ-score cutoff could be set to exclude all low-confidencevariants. Therefore, by adjusting this metric, one couldcontrol the number of false-positives that could be toleratedin variant calling. In the data set, 20 of 47 genes had false-positives; the maximal Q-scores of false-positives are listedin Supplemental Table S1. We gradually simulated 20scenarios by using 20 different Q-score thresholds, whichwere uniformly distributed between the initial Q-scorethreshold of 30 and a maximal Q score of known false-positives. For example, ATM had a maximal Q score of695; thus 20 different Q-score thresholds, in increments of33, between 30 and 695 were simulated to gradually achievea scenario of zero false-positives. All variants having aQ-score above a specific threshold were chosen for eachanalysis. Thus, the highest sensitivity occurred when theminimal Q score was used as the threshold in which themost false-positives were included. The highest specificityoccurred when the maximal Q score was used as a thresholdin which no false-positives were included. Due to variant-calling difficulties based on specific genomic content, thesimulation was repeated for all 47 genes individually(Supplemental Figure S1).
Sanger Sequencing
Universally tagged primers (Integrated DNA Technologies)were designed using Vector VNTI Advance version 11.5.1
925
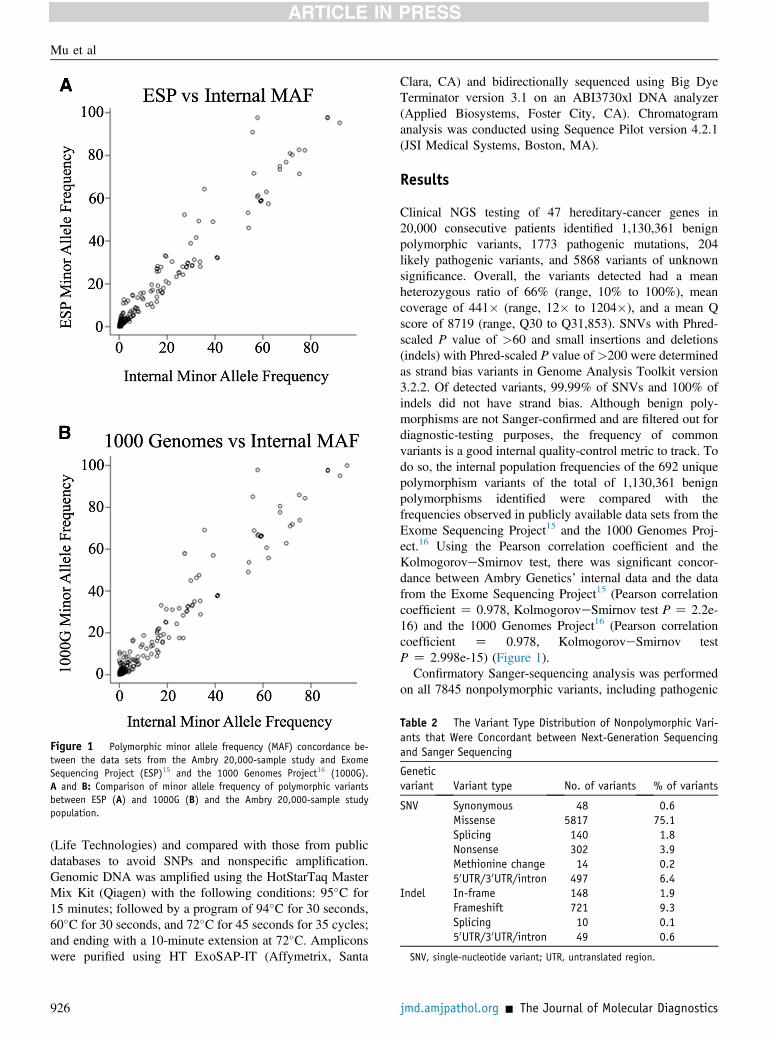
Figure 1 Polymorphic minor allele frequency (MAF) concordance be-tween the data sets from the Ambry 20,000-sample study and ExomeSequencing Project (ESP)15 and the 1000 Genomes Project16 (1000G).A and B: Comparison of minor allele frequency of polymorphic variantsbetween ESP (A) and 1000G (B) and the Ambry 20,000-sample studypopulation.
Table 2 The Variant Type Distribution of Nonpolymorphic Vari-ants that Were Concordant between Next-Generation Sequencingand Sanger Sequencing
Geneticvariant Variant type No. of variants % of variants
SNV Synonymous 48 0.6Missense 5817 75.1Splicing 140 1.8Nonsense 302 3.9Methionine change 14 0.250UTR/30UTR/intron 497 6.4
Indel In-frame 148 1.9Frameshift 721 9.3Splicing 10 0.150UTR/30UTR/intron 49 0.6
SNV, single-nucleotide variant; UTR, untranslated region.
Mu et al
(Life Technologies) and compared with those from publicdatabases to avoid SNPs and nonspecific amplification.Genomic DNA was amplified using the HotStarTaq MasterMix Kit (Qiagen) with the following conditions: 95�C for15 minutes; followed by a program of 94�C for 30 seconds,60�C for 30 seconds, and 72�C for 45 seconds for 35 cycles;and ending with a 10-minute extension at 72�C. Ampliconswere purified using HT ExoSAP-IT (Affymetrix, Santa
926
Clara, CA) and bidirectionally sequenced using Big DyeTerminator version 3.1 on an ABI3730xl DNA analyzer(Applied Biosystems, Foster City, CA). Chromatogramanalysis was conducted using Sequence Pilot version 4.2.1(JSI Medical Systems, Boston, MA).
Results
Clinical NGS testing of 47 hereditary-cancer genes in20,000 consecutive patients identified 1,130,361 benignpolymorphic variants, 1773 pathogenic mutations, 204likely pathogenic variants, and 5868 variants of unknownsignificance. Overall, the variants detected had a meanheterozygous ratio of 66% (range, 10% to 100%), meancoverage of 441� (range, 12� to 1204�), and a mean Qscore of 8719 (range, Q30 to Q31,853). SNVs with Phred-scaled P value of >60 and small insertions and deletions(indels) with Phred-scaled P value of >200 were determinedas strand bias variants in Genome Analysis Toolkit version3.2.2. Of detected variants, 99.99% of SNVs and 100% ofindels did not have strand bias. Although benign poly-morphisms are not Sanger-confirmed and are filtered out fordiagnostic-testing purposes, the frequency of commonvariants is a good internal quality-control metric to track. Todo so, the internal population frequencies of the 692 uniquepolymorphism variants of the total of 1,130,361 benignpolymorphisms identified were compared with thefrequencies observed in publicly available data sets from theExome Sequencing Project15 and the 1000 Genomes Proj-ect.16 Using the Pearson correlation coefficient and theKolmogoroveSmirnov test, there was significant concor-dance between Ambry Genetics’ internal data and the datafrom the Exome Sequencing Project15 (Pearson correlationcoefficient Z 0.978, KolmogoroveSmirnov test P Z 2.2e-16) and the 1000 Genomes Project16 (Pearson correlationcoefficient Z 0.978, KolmogoroveSmirnov testP Z 2.998e-15) (Figure 1).Confirmatory Sanger-sequencing analysis was performed
on all 7845 nonpolymorphic variants, including pathogenic
jmd.amjpathol.org - The Journal of Molecular Diagnostics
Necessity of Sanger Sequencing in NGS
variants, likely pathogenic variants, and variants ofunknown significance, which consisted of 6912 (3481unique) SNVs and 933 (432 unique) indels. Of these,98.7% (n Z 7746) were concordant between NGS andSanger sequencing, with 3876 of them being unique. Thevariant types and distribution of concordant variants arelisted in Table 2. The Sanger-confirmed true-positives had amean heterozygous ratio of 46% (range, 10% to 100%),mean coverage of 415� (range, 11� to 1204�), and amean Q score of 2247 (range, Q38 to Q22,458). Theremaining 1.3% of variants (94 SNVs, 5 indels) werecleared by Sanger sequencing and identified as NGS false-positives, with 46 of them unique variants (Figure 2A,Table 3, and Supplemental Table S2). The false-positivesdetected had a mean heterozygous ratio of 16% (range,10% to 40%) and mean coverage of 223� (range, 10� to689�).
The Journal of Molecular Diagnostics - jmd.amjpathol.org
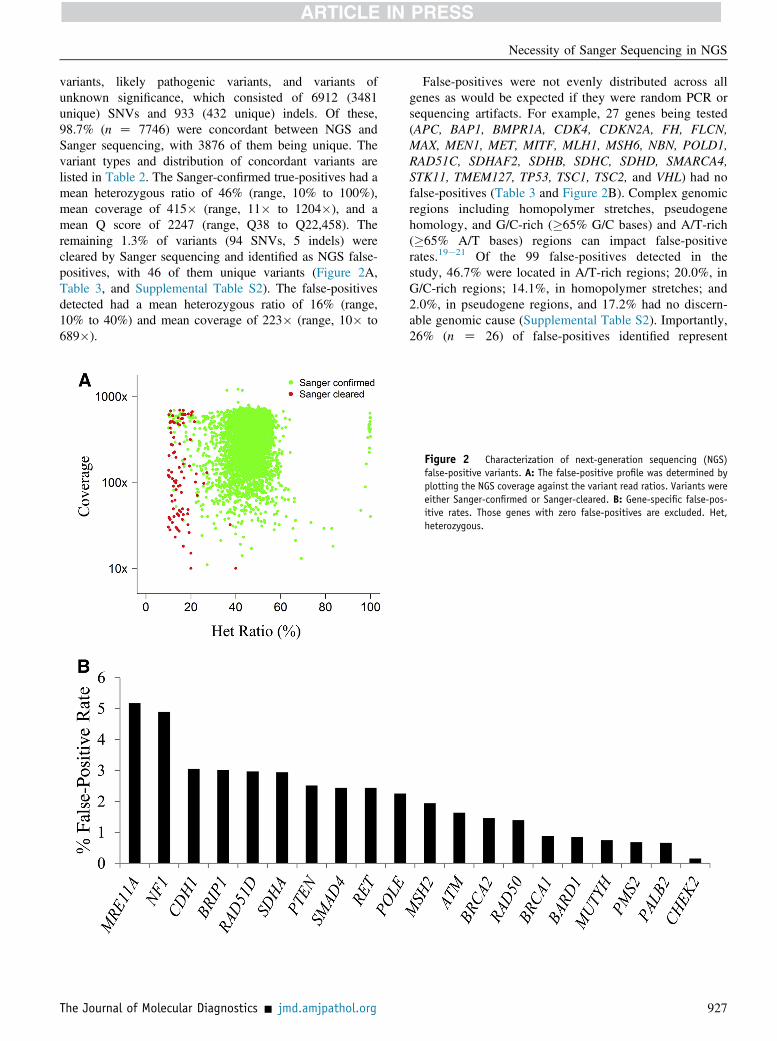
False-positives were not evenly distributed across allgenes as would be expected if they were random PCR orsequencing artifacts. For example, 27 genes being tested(APC, BAP1, BMPR1A, CDK4, CDKN2A, FH, FLCN,MAX, MEN1, MET, MITF, MLH1, MSH6, NBN, POLD1,RAD51C, SDHAF2, SDHB, SDHC, SDHD, SMARCA4,STK11, TMEM127, TP53, TSC1, TSC2, and VHL) had nofalse-positives (Table 3 and Figure 2B). Complex genomicregions including homopolymer stretches, pseudogenehomology, and G/C-rich (�65% G/C bases) and A/T-rich(�65% A/T bases) regions can impact false-positiverates.19e21 Of the 99 false-positives detected in thestudy, 46.7% were located in A/T-rich regions; 20.0%, inG/C-rich regions; 14.1%, in homopolymer stretches; and2.0%, in pseudogene regions, and 17.2% had no discern-able genomic cause (Supplemental Table S2). Importantly,26% (n Z 26) of false-positives identified represent
Figure 2 Characterization of next-generation sequencing (NGS)false-positive variants. A: The false-positive profile was determined byplotting the NGS coverage against the variant read ratios. Variants wereeither Sanger-confirmed or Sanger-cleared. B: Gene-specific false-pos-itive rates. Those genes with zero false-positives are excluded. Het,heterozygous.
927
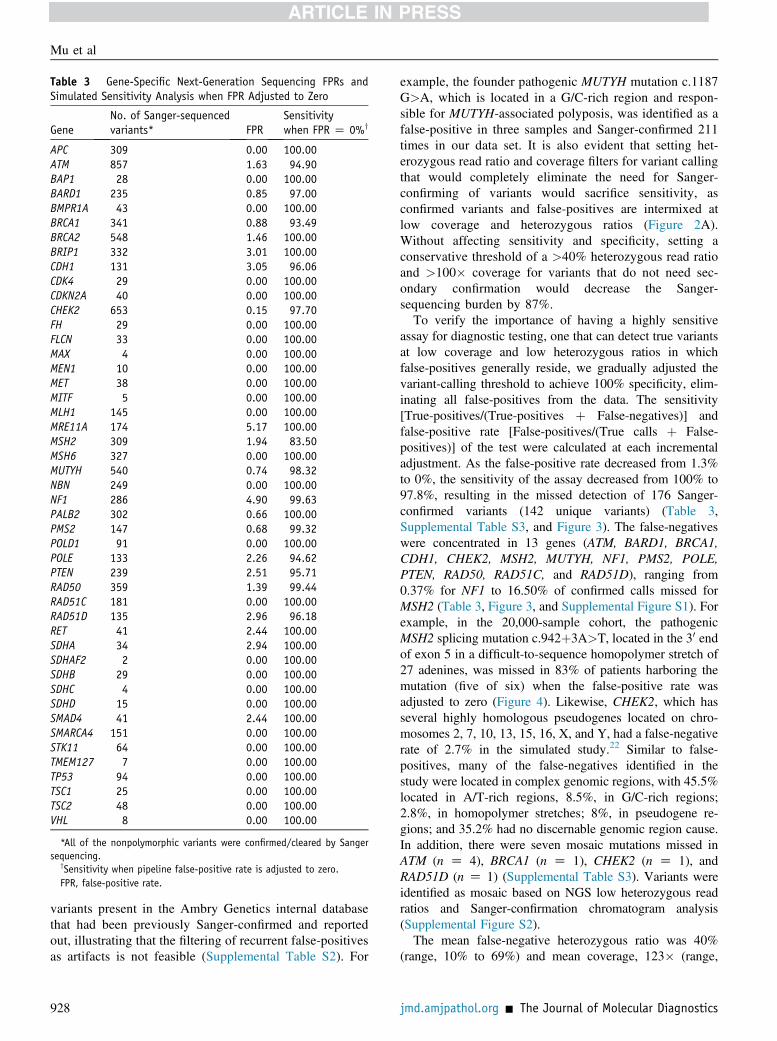
Table 3 Gene-Specific Next-Generation Sequencing FPRs andSimulated Sensitivity Analysis when FPR Adjusted to Zero
GeneNo. of Sanger-sequencedvariants* FPR
Sensitivitywhen FPR Z 0%y
APC 309 0.00 100.00ATM 857 1.63 94.90BAP1 28 0.00 100.00BARD1 235 0.85 97.00BMPR1A 43 0.00 100.00BRCA1 341 0.88 93.49BRCA2 548 1.46 100.00BRIP1 332 3.01 100.00CDH1 131 3.05 96.06CDK4 29 0.00 100.00CDKN2A 40 0.00 100.00CHEK2 653 0.15 97.70FH 29 0.00 100.00FLCN 33 0.00 100.00MAX 4 0.00 100.00MEN1 10 0.00 100.00MET 38 0.00 100.00MITF 5 0.00 100.00MLH1 145 0.00 100.00MRE11A 174 5.17 100.00MSH2 309 1.94 83.50MSH6 327 0.00 100.00MUTYH 540 0.74 98.32NBN 249 0.00 100.00NF1 286 4.90 99.63PALB2 302 0.66 100.00PMS2 147 0.68 99.32POLD1 91 0.00 100.00POLE 133 2.26 94.62PTEN 239 2.51 95.71RAD50 359 1.39 99.44RAD51C 181 0.00 100.00RAD51D 135 2.96 96.18RET 41 2.44 100.00SDHA 34 2.94 100.00SDHAF2 2 0.00 100.00SDHB 29 0.00 100.00SDHC 4 0.00 100.00SDHD 15 0.00 100.00SMAD4 41 2.44 100.00SMARCA4 151 0.00 100.00STK11 64 0.00 100.00TMEM127 7 0.00 100.00TP53 94 0.00 100.00TSC1 25 0.00 100.00TSC2 48 0.00 100.00VHL 8 0.00 100.00
*All of the nonpolymorphic variants were confirmed/cleared by Sangersequencing.
ySensitivity when pipeline false-positive rate is adjusted to zero.FPR, false-positive rate.
Mu et al
variants present in the Ambry Genetics internal databasethat had been previously Sanger-confirmed and reportedout, illustrating that the filtering of recurrent false-positivesas artifacts is not feasible (Supplemental Table S2). For
928
example, the founder pathogenic MUTYH mutation c.1187G>A, which is located in a G/C-rich region and respon-sible for MUTYH-associated polyposis, was identified as afalse-positive in three samples and Sanger-confirmed 211times in our data set. It is also evident that setting het-erozygous read ratio and coverage filters for variant callingthat would completely eliminate the need for Sanger-confirming of variants would sacrifice sensitivity, asconfirmed variants and false-positives are intermixed atlow coverage and heterozygous ratios (Figure 2A).Without affecting sensitivity and specificity, setting aconservative threshold of a >40% heterozygous read ratioand >100� coverage for variants that do not need sec-ondary confirmation would decrease the Sanger-sequencing burden by 87%.To verify the importance of having a highly sensitive
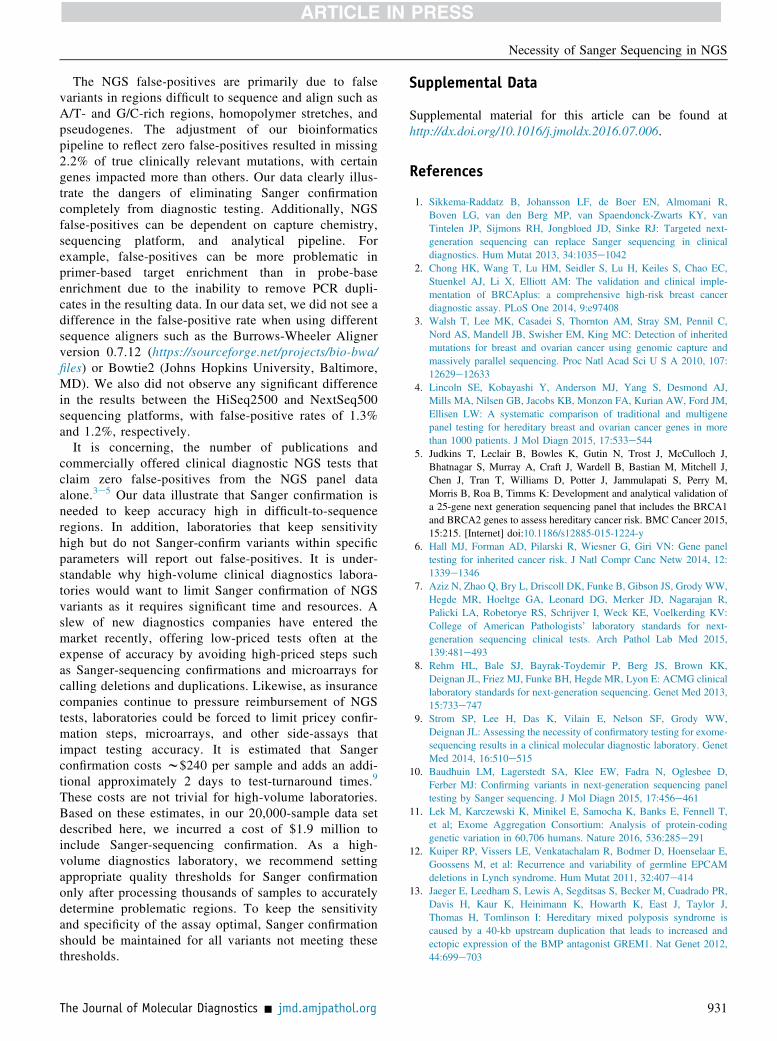
assay for diagnostic testing, one that can detect true variantsat low coverage and low heterozygous ratios in whichfalse-positives generally reside, we gradually adjusted thevariant-calling threshold to achieve 100% specificity, elim-inating all false-positives from the data. The sensitivity[True-positives/(True-positives þ False-negatives)] andfalse-positive rate [False-positives/(True calls þ False-positives)] of the test were calculated at each incrementaladjustment. As the false-positive rate decreased from 1.3%to 0%, the sensitivity of the assay decreased from 100% to97.8%, resulting in the missed detection of 176 Sanger-confirmed variants (142 unique variants) (Table 3,Supplemental Table S3, and Figure 3). The false-negativeswere concentrated in 13 genes (ATM, BARD1, BRCA1,CDH1, CHEK2, MSH2, MUTYH, NF1, PMS2, POLE,PTEN, RAD50, RAD51C, and RAD51D), ranging from0.37% for NF1 to 16.50% of confirmed calls missed forMSH2 (Table 3, Figure 3, and Supplemental Figure S1). Forexample, in the 20,000-sample cohort, the pathogenicMSH2 splicing mutation c.942þ3A>T, located in the 30 endof exon 5 in a difficult-to-sequence homopolymer stretch of27 adenines, was missed in 83% of patients harboring themutation (five of six) when the false-positive rate wasadjusted to zero (Figure 4). Likewise, CHEK2, which hasseveral highly homologous pseudogenes located on chro-mosomes 2, 7, 10, 13, 15, 16, X, and Y, had a false-negativerate of 2.7% in the simulated study.22 Similar to false-positives, many of the false-negatives identified in thestudy were located in complex genomic regions, with 45.5%located in A/T-rich regions, 8.5%, in G/C-rich regions;2.8%, in homopolymer stretches; 8%, in pseudogene re-gions; and 35.2% had no discernable genomic region cause.In addition, there were seven mosaic mutations missed inATM (n Z 4), BRCA1 (n Z 1), CHEK2 (n Z 1), andRAD51D (n Z 1) (Supplemental Table S3). Variants wereidentified as mosaic based on NGS low heterozygous readratios and Sanger-confirmation chromatogram analysis(Supplemental Figure S2).The mean false-negative heterozygous ratio was 40%
(range, 10% to 69%) and mean coverage, 123� (range,
jmd.amjpathol.org - The Journal of Molecular Diagnostics
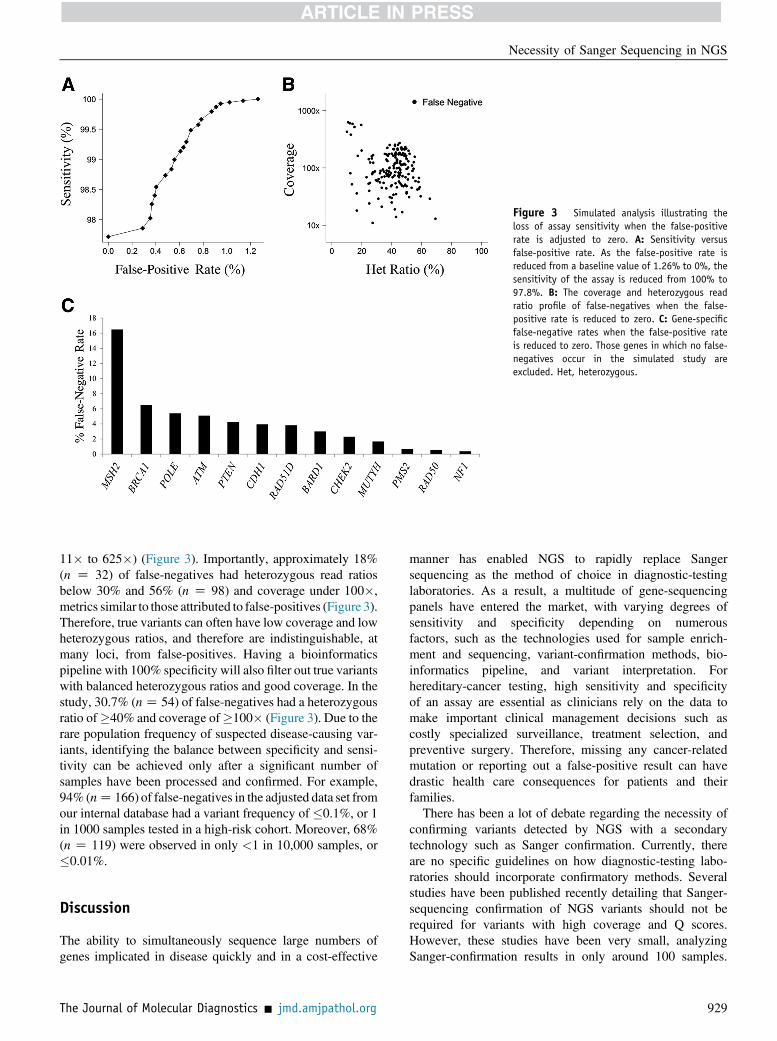
Figure 3 Simulated analysis illustrating theloss of assay sensitivity when the false-positiverate is adjusted to zero. A: Sensitivity versusfalse-positive rate. As the false-positive rate isreduced from a baseline value of 1.26% to 0%, thesensitivity of the assay is reduced from 100% to97.8%. B: The coverage and heterozygous readratio profile of false-negatives when the false-positive rate is reduced to zero. C: Gene-specificfalse-negative rates when the false-positive rateis reduced to zero. Those genes in which no false-negatives occur in the simulated study areexcluded. Het, heterozygous.
Necessity of Sanger Sequencing in NGS
11� to 625�) (Figure 3). Importantly, approximately 18%(n Z 32) of false-negatives had heterozygous read ratiosbelow 30% and 56% (n Z 98) and coverage under 100�,metrics similar to those attributed to false-positives (Figure 3).Therefore, true variants can often have low coverage and lowheterozygous ratios, and therefore are indistinguishable, atmany loci, from false-positives. Having a bioinformaticspipeline with 100% specificity will also filter out true variantswith balanced heterozygous ratios and good coverage. In thestudy, 30.7% (nZ 54) of false-negatives had a heterozygousratio of�40% and coverage of�100� (Figure 3). Due to therare population frequency of suspected disease-causing var-iants, identifying the balance between specificity and sensi-tivity can be achieved only after a significant number ofsamples have been processed and confirmed. For example,94% (nZ 166) of false-negatives in the adjusted data set fromour internal database had a variant frequency of �0.1%, or 1in 1000 samples tested in a high-risk cohort. Moreover, 68%(n Z 119) were observed in only <1 in 10,000 samples, or�0.01%.
Discussion
The ability to simultaneously sequence large numbers ofgenes implicated in disease quickly and in a cost-effective
The Journal of Molecular Diagnostics - jmd.amjpathol.org
manner has enabled NGS to rapidly replace Sangersequencing as the method of choice in diagnostic-testinglaboratories. As a result, a multitude of gene-sequencingpanels have entered the market, with varying degrees ofsensitivity and specificity depending on numerousfactors, such as the technologies used for sample enrich-ment and sequencing, variant-confirmation methods, bio-informatics pipeline, and variant interpretation. Forhereditary-cancer testing, high sensitivity and specificityof an assay are essential as clinicians rely on the data tomake important clinical management decisions such ascostly specialized surveillance, treatment selection, andpreventive surgery. Therefore, missing any cancer-relatedmutation or reporting out a false-positive result can havedrastic health care consequences for patients and theirfamilies.
There has been a lot of debate regarding the necessity ofconfirming variants detected by NGS with a secondarytechnology such as Sanger confirmation. Currently, thereare no specific guidelines on how diagnostic-testing labo-ratories should incorporate confirmatory methods. Severalstudies have been published recently detailing that Sanger-sequencing confirmation of NGS variants should not berequired for variants with high coverage and Q scores.However, these studies have been very small, analyzingSanger-confirmation results in only around 100 samples.
929
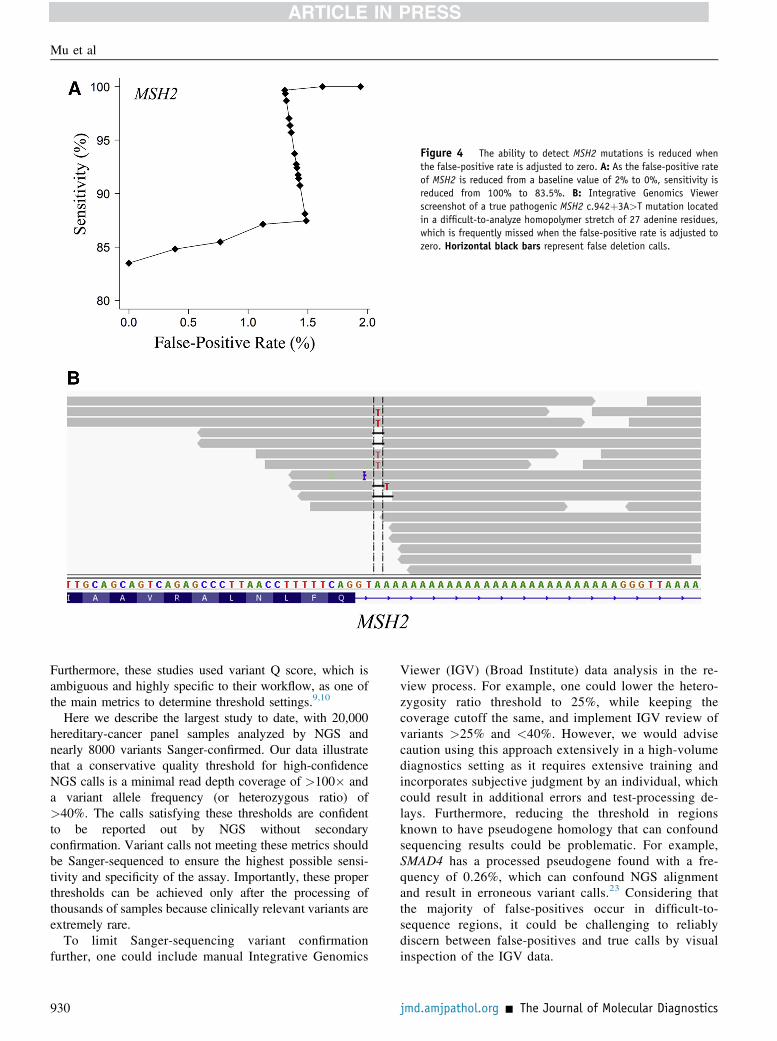
Figure 4 The ability to detect MSH2 mutations is reduced whenthe false-positive rate is adjusted to zero. A: As the false-positive rateof MSH2 is reduced from a baseline value of 2% to 0%, sensitivity isreduced from 100% to 83.5%. B: Integrative Genomics Viewerscreenshot of a true pathogenic MSH2 c.942þ3A>T mutation locatedin a difficult-to-analyze homopolymer stretch of 27 adenine residues,which is frequently missed when the false-positive rate is adjusted tozero. Horizontal black bars represent false deletion calls.
Mu et al
Furthermore, these studies used variant Q score, which isambiguous and highly specific to their workflow, as one ofthe main metrics to determine threshold settings.9,10
Here we describe the largest study to date, with 20,000hereditary-cancer panel samples analyzed by NGS andnearly 8000 variants Sanger-confirmed. Our data illustratethat a conservative quality threshold for high-confidenceNGS calls is a minimal read depth coverage of >100� anda variant allele frequency (or heterozygous ratio) of>40%. The calls satisfying these thresholds are confidentto be reported out by NGS without secondaryconfirmation. Variant calls not meeting these metrics shouldbe Sanger-sequenced to ensure the highest possible sensi-tivity and specificity of the assay. Importantly, these properthresholds can be achieved only after the processing ofthousands of samples because clinically relevant variants areextremely rare.
To limit Sanger-sequencing variant confirmationfurther, one could include manual Integrative Genomics
930
Viewer (IGV) (Broad Institute) data analysis in the re-view process. For example, one could lower the hetero-zygosity ratio threshold to 25%, while keeping thecoverage cutoff the same, and implement IGV review ofvariants >25% and <40%. However, we would advisecaution using this approach extensively in a high-volumediagnostics setting as it requires extensive training andincorporates subjective judgment by an individual, whichcould result in additional errors and test-processing de-lays. Furthermore, reducing the threshold in regionsknown to have pseudogene homology that can confoundsequencing results could be problematic. For example,SMAD4 has a processed pseudogene found with a fre-quency of 0.26%, which can confound NGS alignmentand result in erroneous variant calls.23 Considering thatthe majority of false-positives occur in difficult-to-sequence regions, it could be challenging to reliablydiscern between false-positives and true calls by visualinspection of the IGV data.
jmd.amjpathol.org - The Journal of Molecular Diagnostics
Necessity of Sanger Sequencing in NGS
The NGS false-positives are primarily due to falsevariants in regions difficult to sequence and align such asA/T- and G/C-rich regions, homopolymer stretches, andpseudogenes. The adjustment of our bioinformaticspipeline to reflect zero false-positives resulted in missing2.2% of true clinically relevant mutations, with certaingenes impacted more than others. Our data clearly illus-trate the dangers of eliminating Sanger confirmationcompletely from diagnostic testing. Additionally, NGSfalse-positives can be dependent on capture chemistry,sequencing platform, and analytical pipeline. Forexample, false-positives can be more problematic inprimer-based target enrichment than in probe-baseenrichment due to the inability to remove PCR dupli-cates in the resulting data. In our data set, we did not see adifference in the false-positive rate when using differentsequence aligners such as the Burrows-Wheeler Alignerversion 0.7.12 (https://sourceforge.net/projects/bio-bwa/files) or Bowtie2 (Johns Hopkins University, Baltimore,MD). We also did not observe any significant differencein the results between the HiSeq2500 and NextSeq500sequencing platforms, with false-positive rates of 1.3%and 1.2%, respectively.
It is concerning, the number of publications andcommercially offered clinical diagnostic NGS tests thatclaim zero false-positives from the NGS panel dataalone.3e5 Our data illustrate that Sanger confirmation isneeded to keep accuracy high in difficult-to-sequenceregions. In addition, laboratories that keep sensitivityhigh but do not Sanger-confirm variants within specificparameters will report out false-positives. It is under-standable why high-volume clinical diagnostics labora-tories would want to limit Sanger confirmation of NGSvariants as it requires significant time and resources. Aslew of new diagnostics companies have entered themarket recently, offering low-priced tests often at theexpense of accuracy by avoiding high-priced steps suchas Sanger-sequencing confirmations and microarrays forcalling deletions and duplications. Likewise, as insurancecompanies continue to pressure reimbursement of NGStests, laboratories could be forced to limit pricey confir-mation steps, microarrays, and other side-assays thatimpact testing accuracy. It is estimated that Sangerconfirmation costs w$240 per sample and adds an addi-tional approximately 2 days to test-turnaround times.9
These costs are not trivial for high-volume laboratories.Based on these estimates, in our 20,000-sample data setdescribed here, we incurred a cost of $1.9 million toinclude Sanger-sequencing confirmation. As a high-volume diagnostics laboratory, we recommend settingappropriate quality thresholds for Sanger confirmationonly after processing thousands of samples to accuratelydetermine problematic regions. To keep the sensitivityand specificity of the assay optimal, Sanger confirmationshould be maintained for all variants not meeting thesethresholds.
The Journal of Molecular Diagnostics - jmd.amjpathol.org
Supplemental Data
Supplemental material for this article can be found athttp://dx.doi.org/10.1016/j.jmoldx.2016.07.006.
References
1. Sikkema-Raddatz B, Johansson LF, de Boer EN, Almomani R,Boven LG, van den Berg MP, van Spaendonck-Zwarts KY, vanTintelen JP, Sijmons RH, Jongbloed JD, Sinke RJ: Targeted next-generation sequencing can replace Sanger sequencing in clinicaldiagnostics. Hum Mutat 2013, 34:1035e1042
2. Chong HK, Wang T, Lu HM, Seidler S, Lu H, Keiles S, Chao EC,Stuenkel AJ, Li X, Elliott AM: The validation and clinical imple-mentation of BRCAplus: a comprehensive high-risk breast cancerdiagnostic assay. PLoS One 2014, 9:e97408
3. Walsh T, Lee MK, Casadei S, Thornton AM, Stray SM, Pennil C,Nord AS, Mandell JB, Swisher EM, King MC: Detection of inheritedmutations for breast and ovarian cancer using genomic capture andmassively parallel sequencing. Proc Natl Acad Sci U S A 2010, 107:12629e12633
4. Lincoln SE, Kobayashi Y, Anderson MJ, Yang S, Desmond AJ,Mills MA, Nilsen GB, Jacobs KB, Monzon FA, Kurian AW, Ford JM,Ellisen LW: A systematic comparison of traditional and multigenepanel testing for hereditary breast and ovarian cancer genes in morethan 1000 patients. J Mol Diagn 2015, 17:533e544
5. Judkins T, Leclair B, Bowles K, Gutin N, Trost J, McCulloch J,Bhatnagar S, Murray A, Craft J, Wardell B, Bastian M, Mitchell J,Chen J, Tran T, Williams D, Potter J, Jammulapati S, Perry M,Morris B, Roa B, Timms K: Development and analytical validation ofa 25-gene next generation sequencing panel that includes the BRCA1and BRCA2 genes to assess hereditary cancer risk. BMC Cancer 2015,15:215. [Internet] doi:10.1186/s12885-015-1224-y
6. Hall MJ, Forman AD, Pilarski R, Wiesner G, Giri VN: Gene paneltesting for inherited cancer risk. J Natl Compr Canc Netw 2014, 12:1339e1346
7. Aziz N, Zhao Q, Bry L, Driscoll DK, Funke B, Gibson JS, Grody WW,Hegde MR, Hoeltge GA, Leonard DG, Merker JD, Nagarajan R,Palicki LA, Robetorye RS, Schrijver I, Weck KE, Voelkerding KV:College of American Pathologists’ laboratory standards for next-generation sequencing clinical tests. Arch Pathol Lab Med 2015,139:481e493
8. Rehm HL, Bale SJ, Bayrak-Toydemir P, Berg JS, Brown KK,Deignan JL, Friez MJ, Funke BH, Hegde MR, Lyon E: ACMG clinicallaboratory standards for next-generation sequencing. Genet Med 2013,15:733e747
9. Strom SP, Lee H, Das K, Vilain E, Nelson SF, Grody WW,Deignan JL: Assessing the necessity of confirmatory testing for exome-sequencing results in a clinical molecular diagnostic laboratory. GenetMed 2014, 16:510e515
10. Baudhuin LM, Lagerstedt SA, Klee EW, Fadra N, Oglesbee D,Ferber MJ: Confirming variants in next-generation sequencing paneltesting by Sanger sequencing. J Mol Diagn 2015, 17:456e461
11. Lek M, Karczewski K, Minikel E, Samocha K, Banks E, Fennell T,et al; Exome Aggregation Consortium: Analysis of protein-codinggenetic variation in 60,706 humans. Nature 2016, 536:285e291
12. Kuiper RP, Vissers LE, Venkatachalam R, Bodmer D, Hoenselaar E,Goossens M, et al: Recurrence and variability of germline EPCAMdeletions in Lynch syndrome. Hum Mutat 2011, 32:407e414
13. Jaeger E, Leedham S, Lewis A, Segditsas S, Becker M, Cuadrado PR,Davis H, Kaur K, Heinimann K, Howarth K, East J, Taylor J,Thomas H, Tomlinson I: Hereditary mixed polyposis syndrome iscaused by a 40-kb upstream duplication that leads to increased andectopic expression of the BMP antagonist GREM1. Nat Genet 2012,44:699e703
931
Mu et al
14. Bertolotto C, Lesueur F, Giuliano S, Strub T, de Lichy M, Bille K,et al: A SUMOylation-defective MITF germline mutation predisposesto melanoma and renal carcinoma [Erratum appeared in Nature 2016,531:126]. Nature 2011, 480:94e98
15. Fu W, O’Connor TD, Jun G, Kang HM, Abecasis G, Leal SM,Gabriel S, Rieder MJ, Altshuler D, Shendure J, Nickerson DA,Bamshad MJ; NHLBI Exome Sequencing Project, Akey JM: Analysisof 6,515 exomes reveals the recent origin of most human protein-coding variants. Nature 2013, 493:216e220
16. 1000 Genomes Project Consortium, Abecasis GR, Auton A,Brooks LD, DePristo MA, Durbin RM, Handsaker RE,Kang HM, Marth GT, McVean GA: An integrated map of ge-netic variation from 1,092 human genomes. Nature 2012, 491:56e65
17. Richards S, Aziz N, Bale S, Bick D, Das S, Gastier-Foster J,Grody WW, Hegde M, Lyon E, Spector E, Voelkerding K, Rehm HL:Standards and guidelines for the interpretation of sequence variants: ajoint consensus recommendation of the American College of MedicalGenetics and Genomics and the Association for Molecular Pathology.Genet Med 2015, 17:405e424
932
18. Tavtigian SV, Greenblatt MS, Goldgar DE, Boffetta P: IARC Un-classified Genetic Variants Working Group: Assessing pathogenicity:overview of results from the IARC Unclassified Genetic VariantsWorking Group. Hum Mutat 2008, 29:1261e1264
19. Benjamini Y, Speed TP: Summarizing and correcting the GC contentbias in high-throughput screening. Nucleic Acids Res 2012, 40:e72
20. Ratan A, Miller W, Guillory J, Stinson J, Seshagiri S, Schuster SC:Comparison of sequencing platforms for single nucleotide variant callsin a human sample. PLoS One 2013, 8:e55089
21. Quail MA, Smith M, Coupland P, Otto TD, Harris SR, Connor TR,Bertoni A, Swerdlow HP, Gu Y: A tale of three next generationsequencing platforms: comparison of Ion Torrent, Pacific Biosciencesand Illumina MiSeq sequencers. BMC Genomics 2012, 13:341.[Internet] doi:10.1186/1471-2164-13-341
22. Sodha N, Williams R, Mangion J, Bullock SL, Yuille MR, Eeles RA:Screening hCHK2 for mutations. Science 2000, 289:359
23. Millson A, Lewis T, Pesaran T, Salvador D, Gillespie K, Gau CL,Pont-Kingdon G, Lyon E, Bayrak-Toydemir P: Processed pseudogeneconfounding deletion/duplication assays for SMAD4. J Mol Diagn2015, 17:576e582
jmd.amjpathol.org - The Journal of Molecular Diagnostics