Embed Size (px)
Citation preview
Sanitation, Disease, and Anemia:
Evidence From Nepal∗
Diane Coffey† Michael Geruso‡
July 13, 2015
Abstract
Anemia is a health problem with significant economic consequences. In children, it impairs
physical and cognitive development and reduces human capital accumulation. In adults, it re-
duces productivity. Globally, more than 40% of all children under five have hemoglobin levels be-
low the threshold for anemia. Previous literature has focused on the role of poor nutritional intake
in causing anemia. This paper is the first to propose the hypothesis that poor sanitation, a pub-
lic good with other well-documented health externalities, significantly contributes to hemoglobin
deficiency via its role in creating a poor disease environment. We investigate a causal relationship
between sanitation and hemoglobin by exploiting rapid differential improvement in sanitation
across regions of Nepal between 2006 and 2011. We show that within regions over time, cohorts
of children exposed to worse community sanitation developed lower hemoglobin levels and dis-
played higher anemia incidence. The results contribute to the basic science of anemia’s causes and
suggest the possibility of new policy tools for reducing anemia in the developing world.
∗We appreciate comments and suggestions from Harold Alderman, Anjali Chikersal, Oliver Cummings, Angus Deaton,Jeffrey Hammer, H.P.S Sachdev, Dean Spears, and Belén Torondel. We thank participants of the Sanitation and StuntingConference, held August, 2013 at the Delhi School of Economics, and at the National Food Security Act conference, heldMarch, 2014 at Allahabad University, for helpful feedback. Research reported in this publication was supported by theEunice Kennedy Shriver National Institute Of Child Health & Human Development of the National Institutes of Healthunder Award Number R03HD081209. The content is solely the responsibility of the authors and does not necessarilyrepresent the official views of the National Institutes of Health.
†Woodrow Wilson School, Princeton University; Indian Statistical Institute, Delhi; r.i.c.e.. Email: [email protected]‡University of Texas at Austin and NBER. Email: [email protected]
1 Introduction
Anemia is a widespread problem with serious health and economic consequences. Defined by low
counts of red blood cells or low levels of hemoglobin in the bloodstream, anemia implies a reduced
capacity for the blood to carry oxygen. In adults, it reduces productivity (Thomas et al., 2004) and is
associated with higher maternal mortality (Rush, 2000). In children, it impairs physical and cognitive
development directly (Grantham-McGregor and Ani, 2001; Ozier, 2015) and affects human capital
accumulation via impacts on behaviors like school attendance (Bobonis, Miguel and Puri-Sharma,
2006). Globally, more than 40% of children have hemoglobin levels below the threshold for anemia.1
The problem is particularly severe in the developing world, as anemia is closely associated with
inadequate nutrition.
Because of its damaging effects on human capital formation and productivity, anemia has at-
tracted significant research and policy attention. Economic research in the area of preventing or
reducing anemia has generally focused on (i) poor nutrition, and in particular iron deficiency (e.g.,
Bhattacharya, Currie and Haider, 2004; Thomas et al., 2004), and (ii) malaria (Sachs and Malaney,
2002), which is a parasitic infection that attacks the red blood cells.2 Nonetheless, there are reasons
to believe that poor nutrition and malarial disease are not the only important causes of anemia. For
one, international variation in anemia rates is not well explained by international variation in income
(Alderman and Linnemayr, 2009). To the extent that income is a reasonable proxy for basic nutri-
tion, this poses somewhat of a puzzle. Second, although it is well known that in sub-Saharan Africa
malaria is a major cause of anemia, anemia rates are highest in South Asia, where malaria is far less
prevalent.
In this paper, we propose a third broad cause of anemia that operates in addition to nutritional
intake and malaria, and which has important (and different) implications for policy. We propose that
poor local sanitation—and specifically, open defecation—causes lower hemoglobin and higher rates
of anemia in children. Open defecation means defecation outside on the open ground, without the
use of a toilet or latrine. Whereas nutritional intake is a behavior with purely private benefits, poor
sanitation primarily constitutes an external harm: open defecation spreads intestinal worms and
other fecal pathogens across individuals, since these are transmitted by skin contact with the fecal
1See (Stevens et al., 2013) for worldwide anemia rates.2Malaria has attracted attention in economics for its human capital effects believed to operate through anemia (see, e.g.,
Cohen and Dupas, 2010).
1
matter that is left in the open. As we discuss below, there is significant epidemiological evidence sug-
gesting that sanitation could play an important role in determining anemia. Intestinal parasites and
other infections are spread by open defecation; these diseases can affect the intestinal wall in ways
that lead to decreased absorption of nutrients, including iron, vitamin B12 and folic acid (Rosenberg
and Bowman, 1982; Nath, 2005), which are critical for the production of hemoglobin. If open defeca-
tion did indeed affect anemia rates, its potential role in the worldwide, aggregate patterns of anemia
would be staggering: more than a billion people (about 14% of the world’s population) defecate in
the open.
Ours is the first paper to investigate a link between open defecation and anemia. Nevertheless,
the possibility of such a link is suggested by a small body of prior work. With respect to the connec-
tion between open defecation and intestinal parasites, a randomized control trial in Indonesia that
included a toilet construction and anti-open defection behavior change interventions, found that re-
duced rates of open defecation were associated with reduced parasitic infections (Cameron, Olivia
and Shah, 2013). With respect to the connection between parasitic infections and anemia, a random-
ized control trial among Kenyan children found that a single dose of deworming medicine was as
effective in improving hemoglobin levels as a daily supplement of 13 micronutrients including iron
taken for eight months (Friis et al., 2003). In another randomized control trial in India, Bobonis,
Miguel and Puri-Sharma (2006) found that a combination of nutrient supplementation (iron and vi-
tamin A) and deworming medications had a positive—though statistically insignificant—effect on
hemoglobin levels.3 Taken together, these studies suggest pathways through which poor sanitation
could affect anemia, since contact with human fecal matter is a primary vector for many intestinal
worm infections.4 Despite this suggestive evidence, no prior study has shown a link between open
defecation and anemia, which is the aim of this paper.
We examine the impact of sanitation on children’s hemoglobin levels in the context of Nepal.
Nepal is an ideal empirical setting for two reasons. First, Nepal has very little malaria, which in other
3Bobonis, Miguel and Puri-Sharma (2006) was not designed to separately identify the effects of iron supplementationand deworming medicine.
4Bleakley (2007) provides evidence more directly connected to sanitation, but without a direct connection to anemiaor hemoglobin. He studies efforts to eradicate hookworm infections in the US South at the turn of the twentieth century.Hookworms are spread by contact with human feces. The eradication efforts featured a deworming campaign, and later,technical assistance in constructing sanitary latrines to arrest the cycle of reinfection. The study showed that the inter-ventions had large effects on school attendance and literacy, as well as later-life earnings. A hypothesized channel for thehuman capital effects in Bleakley (2007) was that hookworms caused anemia, though the historical data used in that studydid not allow for any direct evidence on hemoglobin levels.
2
developing country contexts would be an important confounder when examining anemia. Second,
Nepal has had relatively high rates of open defecation historically, but also rapid improvement in
sanitation in the recent past. In 2006, about 50% of Nepalese households defecated in the open—that
is, they reported using a bush, field, or no facility. By this measure, Nepalese households have faced
among the worst sanitation environments in the world. The rates of open defecation in Nepal were
worse, for example, than most countries in sub-Saharan Africa at the time. However, beginning in
2004/2005, the government of Nepal launched new national initiatives aimed at reducing open defe-
cation. Since that time there has been a rapid improvement in latrine and toilet use. By 2011, the
fraction of households defecating in the open had decreased to a national mean of 35%, with signif-
icant variation in improvements across regions. Consistent with the notion that national efforts to
reduce open defecation would have different scope for improvement according to the baseline level
of open defecation, we show that the primary determinant of reduction across regions after 2006 was
the regional level of open defecation in 2006. For example, regions that were already open defeca-
tion free by 2006 could experience no further improvements, while regions with the highest open
defecation rates (as high as 70%) experienced the largest level changes (in excess of 30 percentage
points).
We exploit the geographically heterogeneous sanitation improvements from 2006 to 2011 to iden-
tify impacts of poor sanitation on hemoglobin in difference-in-differences regressions. We find that,
controlling for own defecation practice, a 10 percentage point decrease in the fraction of neighbors
who defecate in the open is associated with a 0.20 g/dL increase in hemoglobin levels, or about 14%
of a standard deviation. To put this effect size in context, interventions in the experimental nutri-
tion literature, such as micronutrient supplementation (Friis et al., 2003), iron supplementation (Lind
et al., 2003), and iron fortification in foods (Van Stuijvenberg et al., 1999), have effect sizes that range
from 0.20 g/dL to 0.41 g/dL. The effect sizes we estimate are consistent with the experimental evi-
dence on the efficacy of deworming interventions by Friis et al. (2003), which increased hemoglobin
by 0.21 gm/dL. As we describe in greater detail below, the spread of intestinal worms via contact
with fecal matter comprises one of the two channels by which the effects we find may operate.
The identifying assumption underlying our difference-in-differences analysis is that improve-
ments in sanitation were not correlated with other changes within regions that independently af-
fected hemoglobin levels. In a series of placebo tests, we show that improvements in physical infras-
3
tructure other than toilet/latrine use, such as household electricity and use of safer water sources, did
not predict changes in children’s hemoglobin. Thus our findings are not merely reflecting effects of a
general pattern of local development. We also show that health behaviors that would independently
affect anemia but would not be expected to be influenced by changing rates of open defecation, such
as diet and the consumption of iron supplements, do not respond to the variation in open defecation
that identifies our estimates.
The main contribution of our study is to develop and test a novel hypothesis about the causes of
anemia. In this way, our work complements a large existing body of research on anemia that has fo-
cused on the role nutritional supplements in combatting anemia in developing countries. Our study
is distinct from the prior work in that past studies have focused on private behaviors or individually-
administered health inputs. For example, past experimental studies of interventions targeting ane-
mia have randomized whether a child received an iron supplement, fortified food, or deworming
medicine. In contrast, our study focuses on a cause of anemia that is external to the child’s behaviors
and to the health inputs chosen by the child’s parents.
One implication of the external nature of open defecation is that investigating impacts on anemia
requires variation that arises at the local geographic level (as it does in our empirical analysis), rather
than at the person-level. This suggests that the kind of cluster-randomized trials that have recently
been fielded to examine other aspects of local sanitation (see, e.g. Guiteras, Levinsohn and Mobarak,
2015 and Clasen et al., 2015) are also the right approach for future experimental work that builds on
our findings about anemia.
Beyond advancing the basic science of the causes of anemia, our study informs the potential
policy responses. Reducing anemia in children can in part be accomplished by changing the health
behaviors of community members who are neither children nor parents. With open defecation, it is the
behavior of neighbors that matters, and this suggests new avenues for anemia prevention. Sanitation
improvement raises its own set of difficulties exactly because sanitation is a public good and therefore
subject to inadequate private investment (Guiteras et al., 2014), suggesting a welfare-improving role
for government.
Finally, this paper contributes to a growing literature concerned with the adverse health and hu-
man capital consequence of open defecation. Sanitation has attracted significant policy attention and
NGO investment in recent years for reasons unrelated to anemia. Our findings on anemia strengthen
4
the rationale for such investments, and may play a role in explaining some of the recent findings in
the literature. Lawson and Spears (2014) show that exposure to open defecation is associated with
lower later-life productivity, and Spears and Lamba (2013) show negative impacts on child cognitive
function. Both are outcomes known to be affected by anemia.5
The remainder of the paper is organized as follows. Section 2 discusses the known causes of
anemia and reviews the existing epidemiological evidence of a channel from poor sanitation to lower
hemoglobin. Section 3 presents some new stylized facts from international comparisons that are
intended to motivate our main analysis. Section 4 describes our data, identifying variation, and
empirical strategy. Section 5 reports results, and section 6 traces out the significance and policy
relevance of our findings. Section 7 concludes.
2 Background on Anemia and Sanitation
Hemoglobin is a protein which resides in red blood cells, and which binds to iron in order to attract
oxygen and carry it throughout the body. Iron deficiency anemia is defined by hemoglobin below a
threshold level. There are several known causes of low hemoglobin. These involve either too little
production or too much destruction of hemoglobin.
Poor diets, particularly among young children, are an often-cited cause of anemia in developing
countries (Yip and Ramakrishnan, 2002; Tolentino and Friedman, 2007). Although a major cause of
low hemoglobin production is iron deficiency in the diet, low hemoglobin can can also be caused
by lack of vitamin B12 and folic acid, two nutrients necessary for the production of red blood cells.
The late introduction of solid foods in infants, and diets containing inadequate amounts of these
essential nutrients are both important contributors to low hemoglobin in South Asia, the region of
the developing world we study here (Menon, 2012).6
Malaria is another important cause of anemia, particularly in sub-Saharan Africa. The disease
is transmitted by a mosquito bite, during which a parasitic protozoa carried by the mosquito enters
the person’s bloodstream. (The protozoan malaria parasite is significantly different in form, life cy-
cle, and symptomatic effects from the intestinal worms we discuss below, which are transmitted by
5More broadly, our study connects to a wide literature on the role of water, sanitation, and disease environment indriving health and human capital accumulation in the developing world and the historical US. See, for example, Cutlerand Miller (2005); Watson (2006); Bleakley (2007); Spears (2012); Alsan and Goldin (2015)).
6A strict vegetarian diet, containing no animal proteins, would be lacking in vitamin B12.
5
contact with human excreta.) The malaria parasite attacks red blood cells, which are in turn attacked
by the host’s immune system. This destruction of red blood cells leads to anemia.
How could poor sanitation affect anemia? There are two plausible channels. The first is related to
intestinal parasites and the second is a condition known as environmental enteropathy.7 Our study
does not attempt to distinguish between these two epidemiological pathways, as both are consistent
with an impact of poor sanitation, and both are likely to be operating simultaneously.
In the epidemiological literature, intestinal parasites are known to cause anemia by causing blood
loss in the stool, lack of appetite, increased motility of food through the intestine, and competition for
nutrients. Intestinal parasites also cause damage to the intestinal wall that leads to decreased absorp-
tion of nutrients, including iron, vitamin B12 and folic acid (Rosenberg and Bowman, 1982). It has
long been known that open defecation spreads intestinal parasites; Cairncross (2003) cites research
from the 1930s that describes how variation in community latrine use in the southern United States
predicted parasite infections in children living in different places.8
The second pathway from open defecation to hemoglobin is environmental enteropathy, known
as tropical sprue in an older medical literature. It is a disease which alters the lining of the intes-
tine and inhibits absorption of calories and nutrients. It is believed to be caused by the ingestion
of large quantities of fecal pathogens (Walker, 2003; Humphrey, 2009; Lin et al., 2013; Kosek et al.,
2013). It has been documented that enteropathy affects the absorption of vitamin B12 and folic acid,
two essential nutrients for the production of hemoglobin (Nath, 2005). Although the link between
open defecation and enteropathy less well understood than the link between open defecation and
intestinal worms, it is hypothesized that open defecation exposes people to the kinds of bacteria that,
when ingested in large quantities, lead to decreased absorption of micronutrients necessary for the
production of hemoglobin (see Walker, 2003, Nath, 2005 and Humphrey, 2009). Medical researchers
have hypothesized a link between enteropathy and anemia as long ago as the 1920s (Baumgartner
and Smith, 1927).
7It is also possible that intestinal diseases spread by open defecation could affect pregnant women, and lead them topass low iron stores on to their babies. See Allen (1997).
8Children infected with parasites pass them through their bowel movements to the soil; many parasite eggs can live inthe soil until they come into contact with new hosts, such as other children who come to the same places to defecate in theopen.
6
3 Stylized Facts from International Comparisons
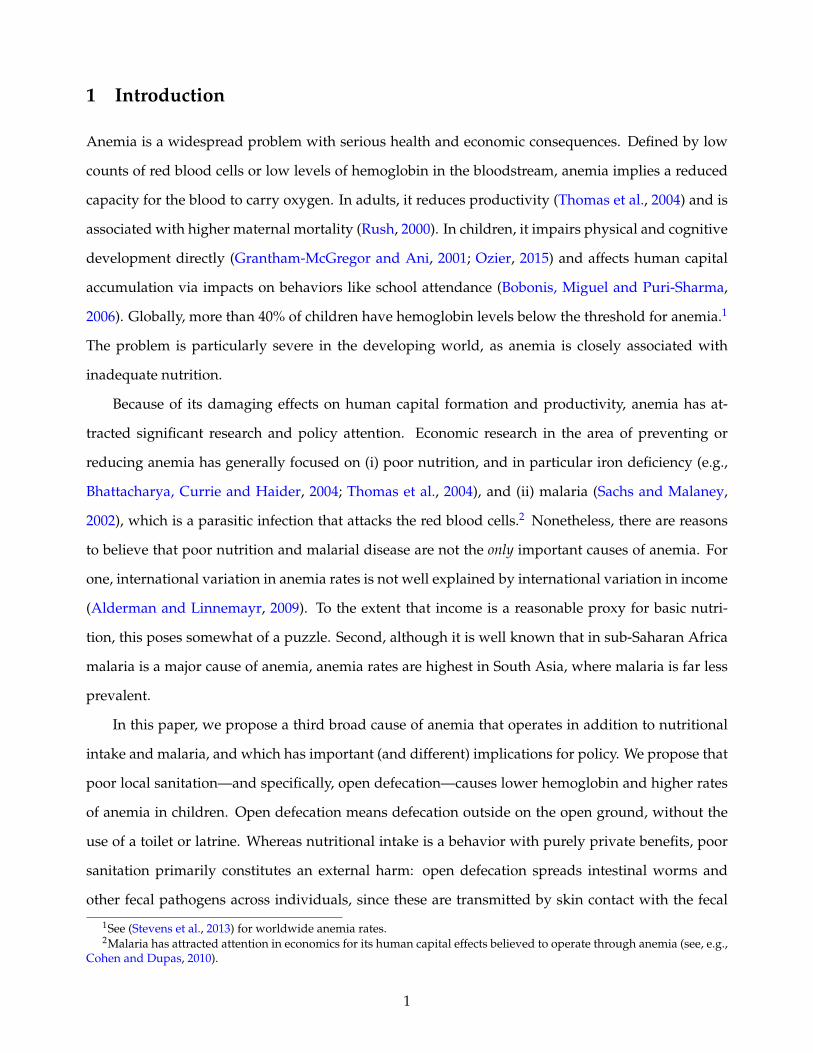
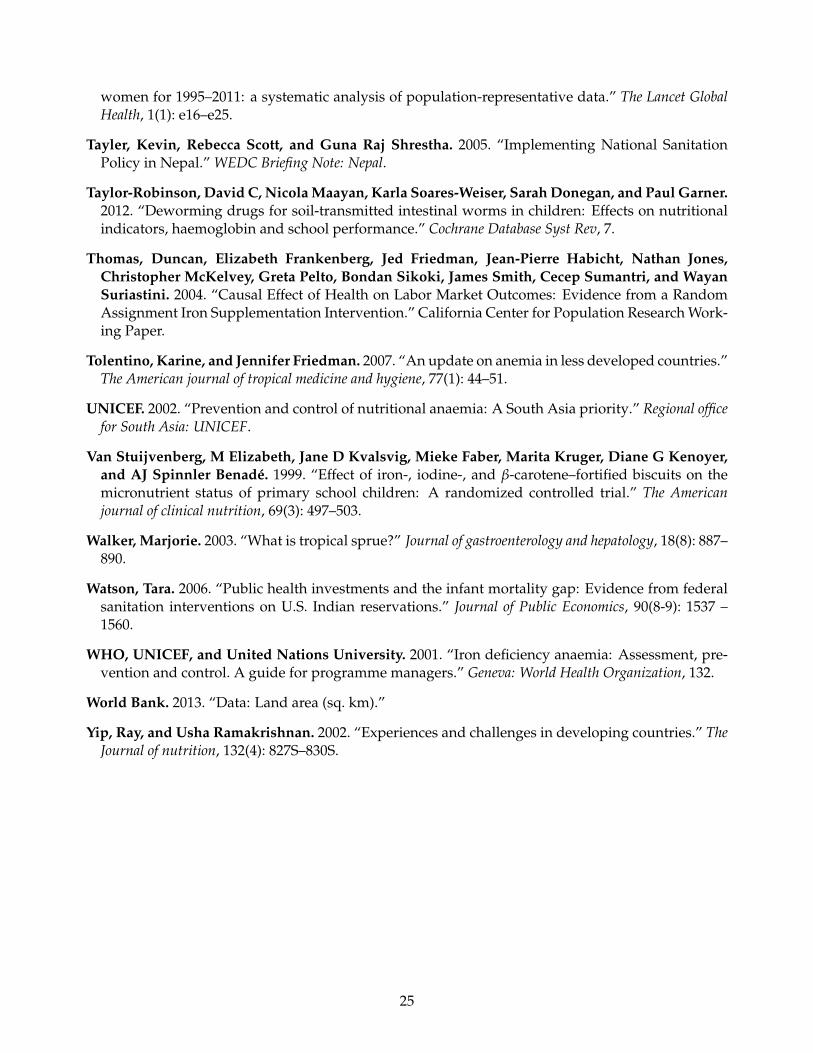
To motivate the our econometric analysis below, we begin in Figure 1 by documenting some cross-
country summary statistics relating sanitation to anemia. To our knowledge, ours is the first study to
document these patterns, even cross-sectionally.
Data on anemia and open defecation data used in the figure come from 81 nationally representa-
tive Demographic and Health Surveys, covering 45 countries. Observations are means from surveys
(countries × years) and we include every survey for which data on children’s hemoglobin was col-
lected.9 The size of markers is proportional to country population, and many countries appear twice
in the scatterplot for different survey years. The data, which include countries from sub-Saharan
Africa, Latin America, Europe, and Asia are described in more detail in Appendix A.1 and the coun-
try × years that make up individual observations are listed in Table A1.
Following the recent literature (e.g., Guiteras, Levinsohn and Mobarak, 2015; Geruso and Spears,
2015; Hammer and Spears, 2013), we capture the sanitation environment to which a child is exposed
by calculating the fraction of households that defecate in the open. The greater the fraction of house-
holds which do not use a toilet or latrine, the greater the frequency with which a child comes into
contact with germs or parasites transmitted by feces.
In Panel A of Figure 1, we plot the unconditional relationship between the average hemoglobin
level of children and the mean open defecation rate in the country. We restrict attention to children
aged 6 to 35 months, as this was the common age range for which hemoglobin data was recorded
across the 81 DHS surveys represented in the figure. The figure also plots a regression line cor-
responding to the population-weighted OLS coefficient of open defecation on hemoglobin. The
plot shows a clear association in which more open defecation (i.e., worse sanitation) predicts lower
hemoglobin levels of children.
In Panel B, we modify the horizontal axis so that it measures the log of open defecation per square
kilometer, following a recent literature showing that the risk of transmitting pathogens via open
defecation is increasing in population density (Spears, 2013; Hathi et al., 2014). Data on total land area
and population, which are used to construct the measure of open defecation per square kilometer,
come from the Penn World Tables.10 The clear negative relationship continues to hold. While the
9We describe the DHS survey methodology, sample, and questionnaire in more detail below. The DHS survey for Nepalin 2006 and 2011 comprises our main analysis dataset.
10Population density at the country level is intended as a proxy for population density measured at a more disaggregated,
7
slopes are not directly comparable between Panels A and B since the horizontal axes are different, the
overall decline in hemoglobin levels between observations with the best sanitation (leftmost points)
and worst sanitation (rightmost points) are similar across the two panels.
A natural question in this context is whether the places with worse sanitation are merely worse
in other ways that would independently predict anemia. In particular, malaria incidence, which im-
pacts anemia, may be worse in countries where the sanitation environment is worse. And nutritional
intake, which is the leading known cause of anemia, would be expected to improve with higher
incomes. Since sanitation may be expected to likewise improve with higher incomes, this suggests
another important potential confounder. In panels C and D Figure 1, we control for malaria incidence
using national malaria rates constructed by Korenromp (2005), and we control for GDP per capita us-
ing data from the Penn World Tables. The details of the data construction are described in Appendix
A.1. To display scatter plots with these controls, we first separately regress hemoglobin on malaria
rates and GDP per capita and open defecation on malaria rates and GDP per capita. We then plot the
residuals from those regressions against each other.
The relationship between sanitation and anemia is, in fact, stronger after the inclusion of controls
for malaria and GDP per capita, with observations more tightly clustered around the regression line.
Figure 1 is intended only to provide motivation for the econometric analysis below, the patterns it
reveals are consistent with a previous finding in the literature that international variation in anemia
rates is not well explained by international variation in income (Alderman and Linnemayr, 2009).
The patterns are also consistent with the fact that many sub-Saharan African countries have relatively
high rates of malaria but high rates of anemia (low average hemoglobin): those same sub-Saharan
African countries also experience low rates of open defecation, relative to South Asian countries.
In summary, the cross-country comparison reveal an interesting and previously undocumented
pattern. Poor sanitation strongly predicts low hemoglobin, both unconditionally, and controlling
for income (a proxy for nutrition) and malaria incidence. The remainder of the paper investigates
a causal relationship, using variation in open defecation that is plausibly exogenous to hemoglobin
levels.
sub-national level. Subnational measures of population density covering this country sample cannot be constructed withany available data.
8
4 Data and Empirical Framework
We investigate the hypothesized link between sanitation and anemia using data from Nepal. Nepal
ranks among the worst sanitation environments in the world. As recently as 2006, half of Nepalese
households disposed of excreta in the open, without the use of a toilet or latrine. But sanitation in
Nepal has improved rapidly in recent years; there was a 13 percentage point decline in open defe-
cation at the national level between 2006 and 2011. Nepal’s poor baseline sanitation, rapid improve-
ment, and low rates of malaria (a potential confounder), make it an ideal empirical setting for our
study.
4.1 Data
The data used in our main analysis come from the 2006 and 2011 Demographic and Health Surveys
(DHS) of Nepal. These nationally representative surveys collect information on health behaviors and
outcomes of household members, including data on water sources and toilet use. Mothers also report
on the types and amounts of foods consumed by their young children.
The DHS measures hemoglobin using the HemoCue R© method, in which a surveyor introduces
a drop of blood from the respondent’s finger into a portable device which reports the respondent’s
hemoglobin level in the field.11 Typically, anemia is defined by hemoglobin levels below some thresh-
old value. The World Health Organization (WHO) sets the hemoglobin concentration threshold at 11
g/dL and 7 g/dL for anemia and severe anemia, respectively, though various researchers and med-
ical bodies set alternative cutoffs.12 In order to maximize power and avoid sensitivity to the choice
of threshold, we use the entire continuous range of hemoglobin concentration in our main results,
rather than indicators for ranges of anemia severity.
In our data, if a respondent household reports using a “bush, field, or no facility,” the household
is coded as defecating in the open. We generate variables capturing the mean open defecation at
the level of a region or neighborhood, depending on the analysis. Neighborhoods are defined in the
data by primary sampling units (PSUs), which are composed of survey sampling frames of 100 to
200 households. In rural areas these frames may be whole villages. In urban areas, the frames are
11See Measure DHS (2013) for more information about collection of hemoglobin data in the field. Kapoor et al. (2002)compares the HemoCue R©method to other methods of testing hemoglobin in India. This paper uses the hemoglobin mea-surement that is unadjusted for altitude.
12This WHO standard applies to children 6 to 60 months of age.
9
based on blocks of households. Thus, neighborhood-level open defecation is operationalized here as
the fraction of households in the PSU that report open defecation.
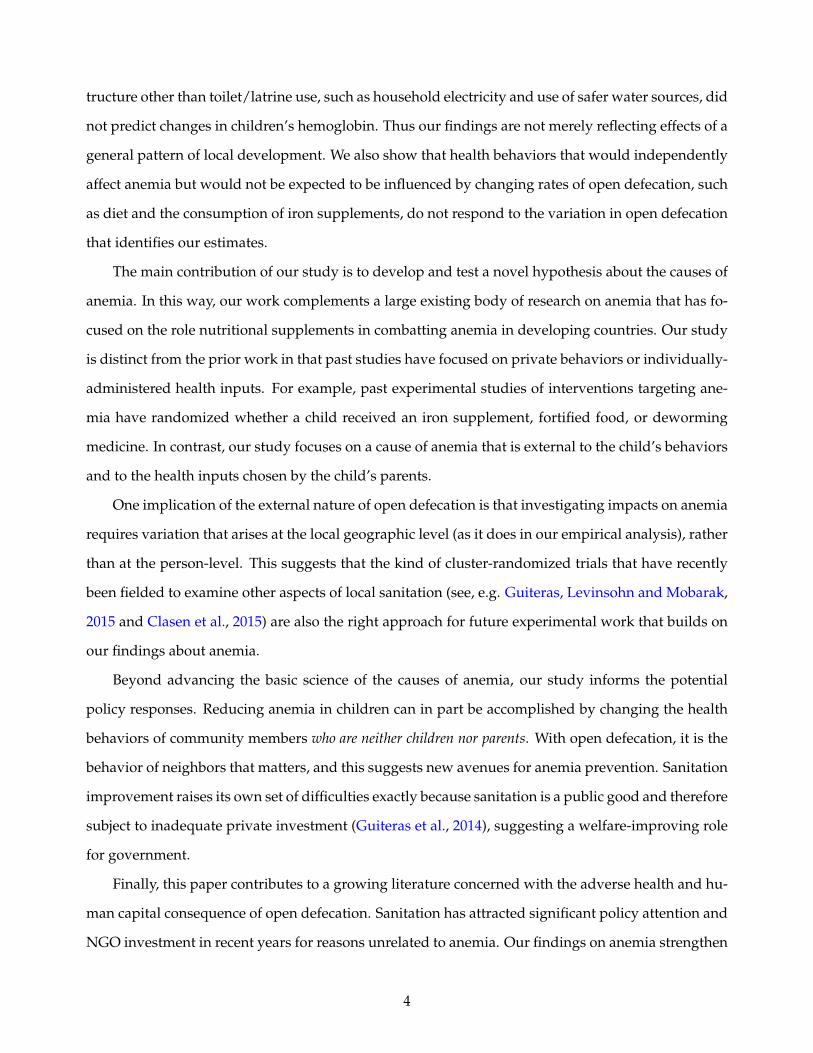
In Table 1 we provide summary statistics for the sample used in our main analysis, stratified
by survey year. Observations in the table are children, corresponding to the level of analysis in the
regressions below. Because hemoglobin data were collected for all children 6 to 59 months old in the
2006 survey, but only for a random subsample of 50% of children in this age range in the 2011 survey,
the sample size in 2011 is smaller.
Table 1 shows that the use of iron supplements and anti-parasite medicine was fairly stable over
the 2006 to 2011 period. Over the same period there was a large decline in open defecation. Toilet and
latrine use (one minus open defecation) climbed by an average of 13 percentage points nationally. In
contrast, the reported consumption of foods rich in iron and other nutrients critical to hemoglobin
production declined significantly. This worsening of nutrition, trending opposite to the improved
sanitation, may account for the essentially unchanged average level of hemoglobin between the 2006
and 2011 survey rounds. In terms of general economic and infrastructure development, electrification
and access to improved water sources also significantly increased over this period, suggesting an
opportunity for several placebo tests in support of the identification, described below.
4.2 Identifying Variation
Beginning in 2004, Nepal’s Department of Water Supply and Sewerage launched several initiatives
aimed at improving sanitation. New National Guidelines for Hygiene and Sanitation Promotion
were introduced in 2005. At the time, Nepal’s government had made a commitment to decentralizing
the administration of government functions. In accordance with that broader policy committment,
the sanitation guidelines emphasized decentralized approaches. Responsibility for determining the
details of implementation rested with individual Village Development Committees and District De-
velopment Committees, with funding originating at the national level.13 As a result, while the overall
goal of reducing open defecation was a national priority, initiatives undertaken by these local author-
ities varied significantly in an attempt to tailor approaches to local needs and local behavioral norms.
Activities included various subsidy programs for toilet construction as well as marketing campaigns
13See Tayler, Scott and Shrestha (2005) for more details.
10
aimed at increasing demand for toilets and latrines.14 In practice, the total effect of these diverse local
programs, in combination with broader changes in the demand for latrines, was a large reduction in
open defecation between the 2006 and 2011 rounds of the Nepal DHS surveys.
This improvement varied significantly across areas of Nepal. Regional changes in the fraction of
households practicing open defecation (ODr) ranged from as little as zero to more than a 30 percent-
age point reduction. To put size of this decline in context: India, which has similarly poor sanitation
and has experienced fast economic growth over the last two decades, reduced open defecation by
only about 1 percentage point per year between 2001 and 2011.
We focus attention on the smallest geographic regions for which it is possible to construct a
panel in our data, and identify our estimates off of the geographical heterogeneity in changes in open
defecation over time within these regions. We do not attempt to evaluate which of the hundreds of
variants on local sanitation policy had the largest impacts on sanitation coverage. Indeed, doing so
would be impossible given the lack of documentation and details of how these programs operated
in different localities. Instead, we exploit the heterogenous improvements in sanitation over time as
it arose from all sources to gain insights into the role that sanitation plays in determining children’s
hemoglobin. Given this constraint and focus, it is important to examine the pattern of geographic
heterogeneity in sanitation improvement and evaluate empirically whether this was correlated with
other changes in investment or health behaviors that could independently affect hemoglobin.
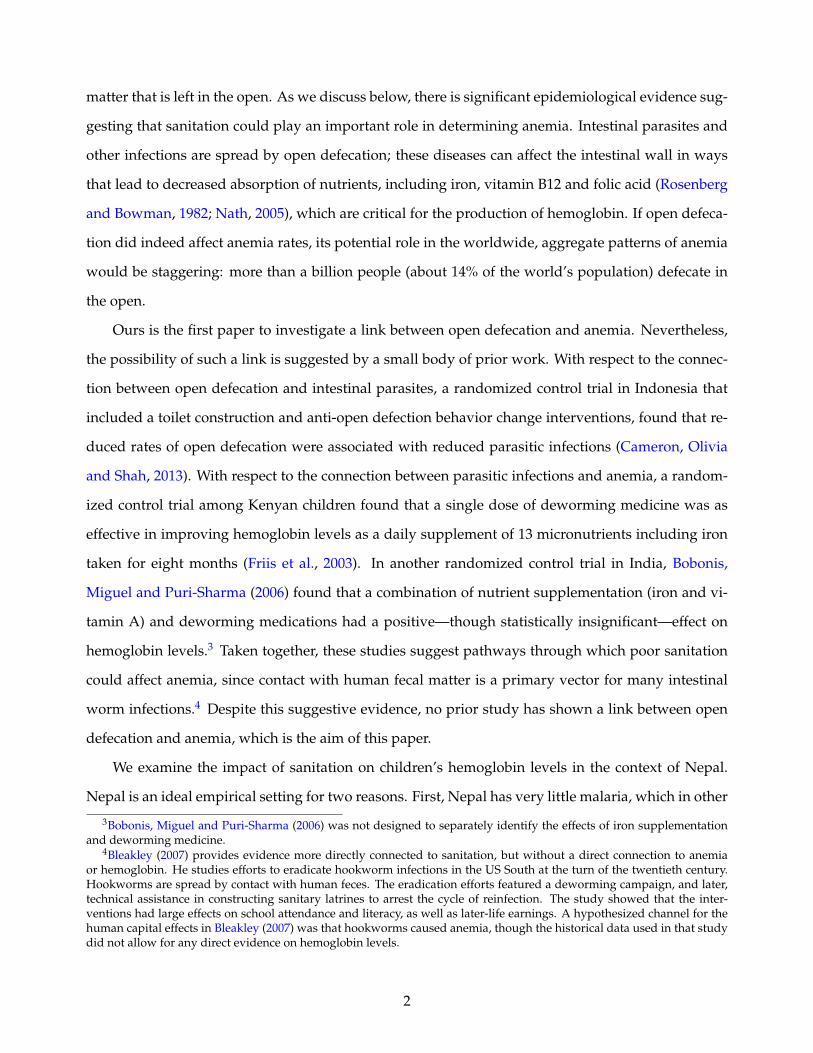
To illustrate the geographic variation we exploit, in Figure 2 we plot changes in open defecation
within each of the 13 geographic regions identified in the DHS data. Within each of the 13 regions,
primary sampling units are identified as urban or rural. We interact the urban indicator with indica-
tors for each region to create 25 subregions. (The western mountain region contains no urban areas.)
Panel A of Figure 2 plots the improvement ODr,2011 −ODr,2006 for rural areas. Panel B repeats the
same plot for urban areas within the regions. Colors in both panels correspond to the reduction in
ODrt, with darker red indicating less improvement, and darker green indicating more improvement.
Figure 2 shows that improvements were not limited low-lying regions (on the southern, Indian
border) or mountainous regions (on the northern, Chinese border). Nor were improvements con-
centrated in contiguous areas of the country. Interestingly, there also appears to be no positive asso-
14For example, in some places local campaigns consisted of encouraging children to use whistles to call out people asthey practiced open defecation. In other localities, access to certain government services was restricted until householdmembers produced verification of latrine/toilet ownership. Additional anecdotal evidence is reported in Knight (2014).
11
ciation between improvements in the rural and urban areas of the same regions: The color pattern
of improvement in rural PSUs (Panel A) are not paralleled in the urban PSUs (Panel B) of the same
geographic areas.
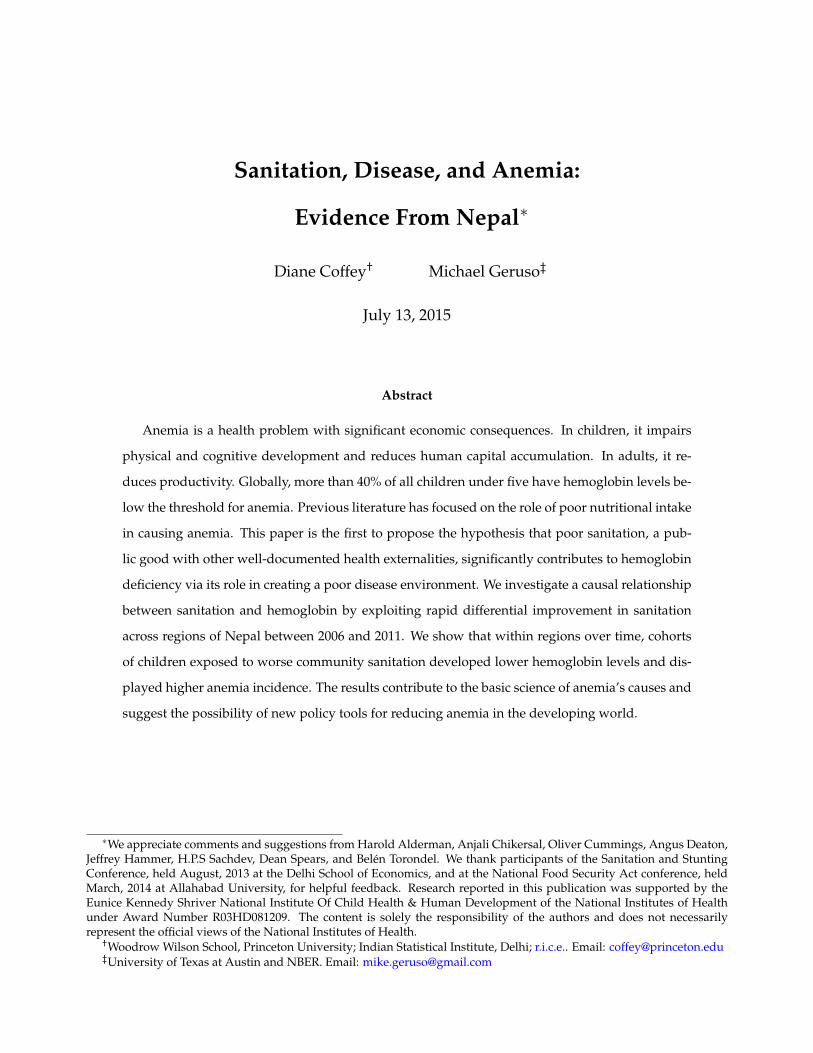
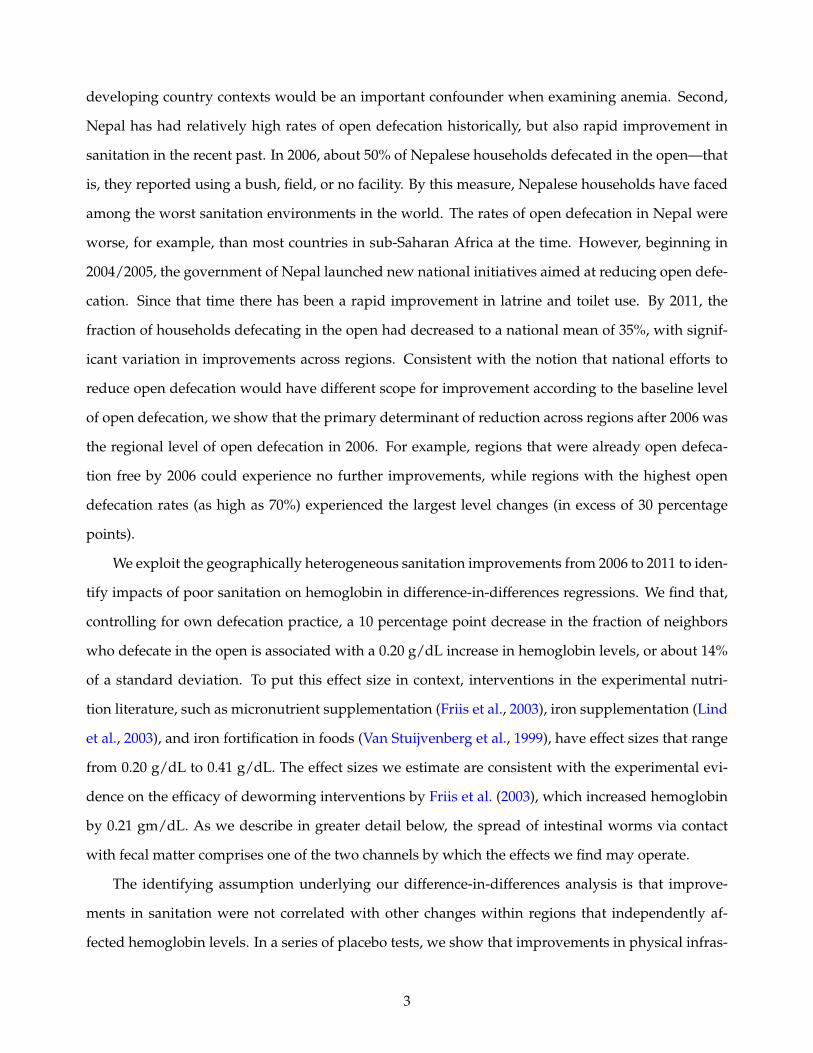
Instead, the primary predictor of improvements in sanitation after 2006 was the baseline level
of sanitation in 2006. Figure 3 plots with the change in regional open defecation from 2006 to 2011
on the vertical axes against the 2006 level along the horizontal axes. Rural regions are plotted as
scatter points in Panel A and urban regions in Panel B. Both panels show that regions with higher
levels of open defecation in 2006 made larger reductions in open defecation by 2011. It is plausible
that national resources devoted toward curbing open defecation were marginally more effective in
places where the problem was more severe. In the extreme this was certainly true: in the case of
zero open defecation at baseline (true for one urban region), there is was no room to improve further
and there was, consequently, no change in open defecation over the 2006 to 2011 period. In contrast,
regions with the worst sanitation in (ODr,2006 > 70%), open defecation levels declined by around
30 percentage points. Because it is the level open defecation that is likely to matter for children’s
hemoglobin, we are able to exploit these level changes for identification.
It is important to note that the pattern in which the largest improvement in sanitation occurred
in the regions with the poorest sanitation in 2006 is not simply a mean reversion pattern. Mean re-
version would require that places with the worst sanitation at baseline improved while places with
the best sanitation at baseline worsened. Instead, almost all localities improved, but localities with
the best baseline sanitation improved by less on average. The identifying assumption underpinning
our analysis is that these within-region improvements in sanitation levels were not systematically re-
lated to changes in other variables that independently affect hemoglobin concentration. For example,
because poor nutrition is the leading known cause of anemia, it would be problematic if nutrition si-
multaneously improved in the same geographic pattern as sanitation. Below, we turn to the data and
perform a series of falsification and placebo tests to check for evidence of such correlated improve-
ments in other important variables.
4.3 Empirical Framework
We organize our analysis at the level of the child, restricting attention to children aged six months to
five years. We regress hemoglobin concentration (Hb) on the mean open defecation at the regional
12
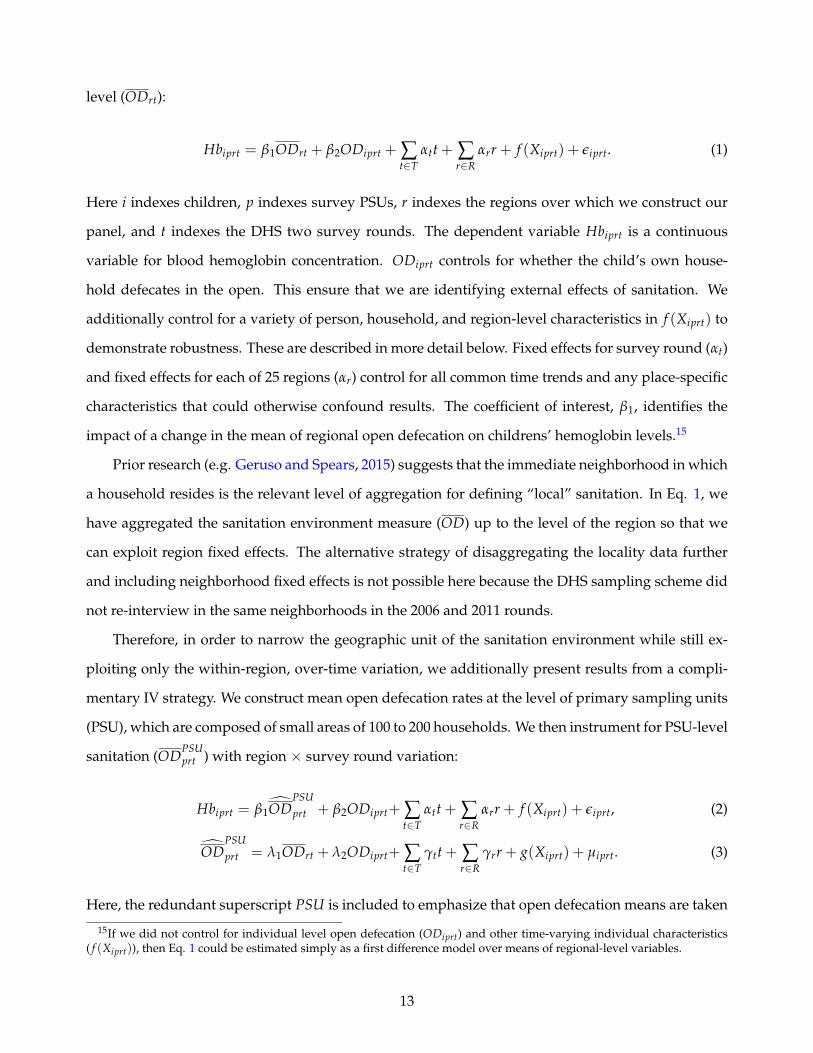
level (ODrt):
Hbiprt = β1ODrt + β2ODiprt + ∑t∈T
αtt + ∑r∈R
αrr + f (Xiprt) + εiprt. (1)
Here i indexes children, p indexes survey PSUs, r indexes the regions over which we construct our
panel, and t indexes the DHS two survey rounds. The dependent variable Hbiprt is a continuous
variable for blood hemoglobin concentration. ODiprt controls for whether the child’s own house-
hold defecates in the open. This ensure that we are identifying external effects of sanitation. We
additionally control for a variety of person, household, and region-level characteristics in f (Xiprt) to
demonstrate robustness. These are described in more detail below. Fixed effects for survey round (αt)
and fixed effects for each of 25 regions (αr) control for all common time trends and any place-specific
characteristics that could otherwise confound results. The coefficient of interest, β1, identifies the
impact of a change in the mean of regional open defecation on childrens’ hemoglobin levels.15
Prior research (e.g. Geruso and Spears, 2015) suggests that the immediate neighborhood in which
a household resides is the relevant level of aggregation for defining “local” sanitation. In Eq. 1, we
have aggregated the sanitation environment measure (OD) up to the level of the region so that we
can exploit region fixed effects. The alternative strategy of disaggregating the locality data further
and including neighborhood fixed effects is not possible here because the DHS sampling scheme did
not re-interview in the same neighborhoods in the 2006 and 2011 rounds.
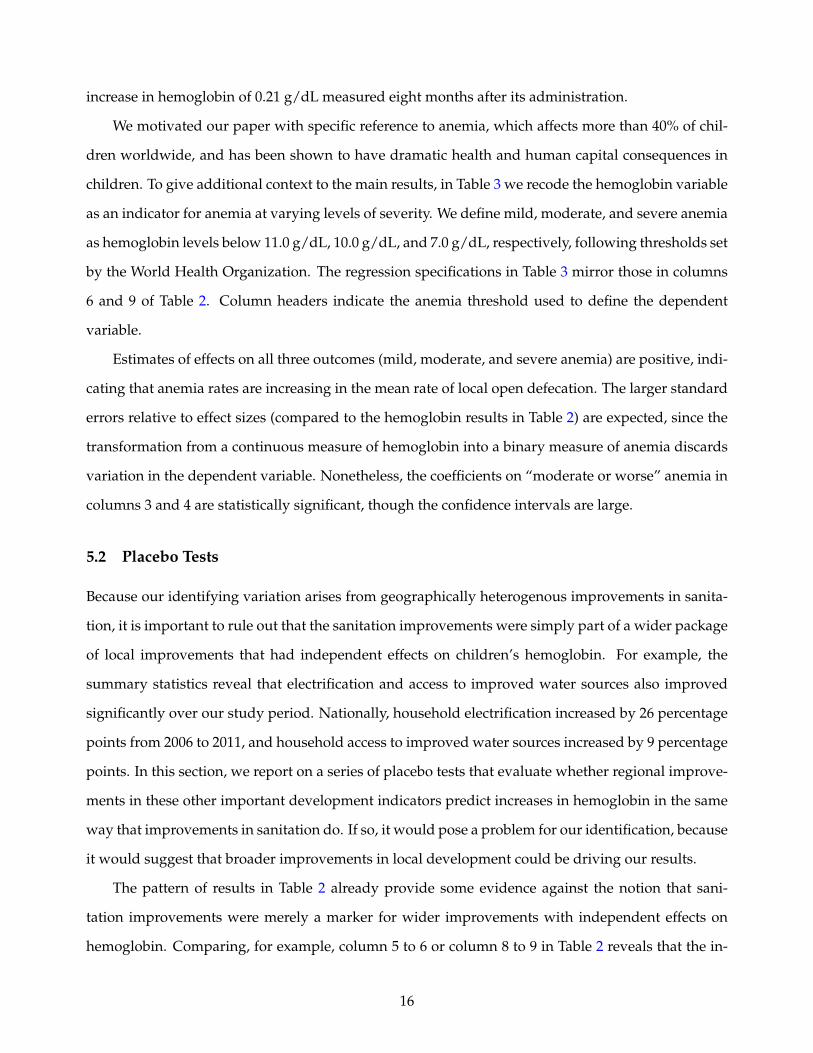
Therefore, in order to narrow the geographic unit of the sanitation environment while still ex-
ploiting only the within-region, over-time variation, we additionally present results from a compli-
mentary IV strategy. We construct mean open defecation rates at the level of primary sampling units
(PSU), which are composed of small areas of 100 to 200 households. We then instrument for PSU-level
sanitation (ODPSUprt ) with region × survey round variation:
Hbiprt = β1ODPSU
prt + β2ODiprt+ ∑t∈T
αtt + ∑r∈R
αrr + f (Xiprt) + εiprt, (2)
ODPSU
prt = λ1ODrt + λ2ODiprt+ ∑t∈T
γtt + ∑r∈R
γrr + g(Xiprt) + µiprt. (3)
Here, the redundant superscript PSU is included to emphasize that open defecation means are taken
15If we did not control for individual level open defecation (ODiprt) and other time-varying individual characteristics( f (Xiprt)), then Eq. 1 could be estimated simply as a first difference model over means of regional-level variables.
13
at the PSU level. Projecting PSU-level sanitation, ODPSUprt , onto region-level sanitation, ODrt, avoids
identifying estimates partially off of cross-sectional differences across PSUs within a region × year,
and uses only the across-time variation shown in Figure 2 for identification. Intuitively, while the IV
projection in Eq. 3 controls for any PSU-level variation within a region-year, it still allows the OD
variable to be defined at the theoretically relevant level of the neighborhood. This instrumentation
strategy also addresses potential measurement error problems that could otherwise attenuate our
estimates.
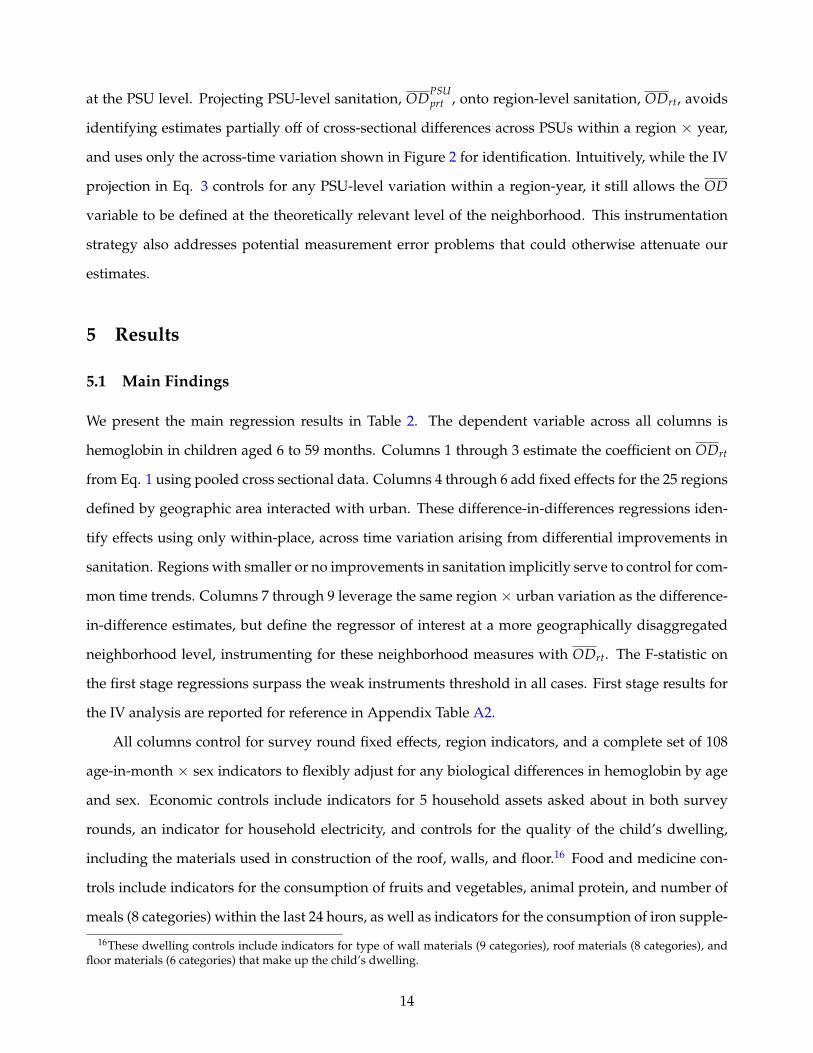
5 Results
5.1 Main Findings
We present the main regression results in Table 2. The dependent variable across all columns is
hemoglobin in children aged 6 to 59 months. Columns 1 through 3 estimate the coefficient on ODrt
from Eq. 1 using pooled cross sectional data. Columns 4 through 6 add fixed effects for the 25 regions
defined by geographic area interacted with urban. These difference-in-differences regressions iden-
tify effects using only within-place, across time variation arising from differential improvements in
sanitation. Regions with smaller or no improvements in sanitation implicitly serve to control for com-
mon time trends. Columns 7 through 9 leverage the same region × urban variation as the difference-
in-difference estimates, but define the regressor of interest at a more geographically disaggregated
neighborhood level, instrumenting for these neighborhood measures with ODrt. The F-statistic on
the first stage regressions surpass the weak instruments threshold in all cases. First stage results for
the IV analysis are reported for reference in Appendix Table A2.
All columns control for survey round fixed effects, region indicators, and a complete set of 108
age-in-month × sex indicators to flexibly adjust for any biological differences in hemoglobin by age
and sex. Economic controls include indicators for 5 household assets asked about in both survey
rounds, an indicator for household electricity, and controls for the quality of the child’s dwelling,
including the materials used in construction of the roof, walls, and floor.16 Food and medicine con-
trols include indicators for the consumption of fruits and vegetables, animal protein, and number of
meals (8 categories) within the last 24 hours, as well as indicators for the consumption of iron supple-
16These dwelling controls include indicators for type of wall materials (9 categories), roof materials (8 categories), andfloor materials (6 categories) that make up the child’s dwelling.
14
ments and parasite medicine in the last six months. Mother’s education controls include an indicator
for literacy and indicators for levels of educational attainment (4 categories). Regional controls add
means of household electrification and household access to protected/improved water sources at the
regional level.17
Standard errors in parentheses are clustered at the PSU-level across all columns. Because the
difference-in-differences analysis in columns 4 through 6 uses variation in mean open defecation at
the level of the region-by-year, we also report alternative clustering at the region-by-year level. The
exercise, which requires a special asymptotic refinement due to the small number of clusters problem
(see, e.g., Cameron, Gelbach and Miller, 2008 and Cameron and Miller, 2015) is described in Ap-
pendix Section A.2. Results from several alternative clustering schemes are tabulated in Appendix
Table A3, which shows that the statistical significance of the results is robust to even the most aggre-
gated level of clustering (25 regions).
The negative coefficient estimates in Table 2 show that improvements in sanitation—i.e. lower
rates of open defecation—are associated with higher concentrations of hemoglobin in children. Point
estimates are larger in the difference-in-differences and IV specifications than in the cross-sectional
OLS regressions, though not statistically different. The inclusion of economic controls, mother char-
acteristics, and child food and medicine controls has only minor effects on point estimates, indicating
that our regressors of interest are not strongly correlated with these variables.
The mean reduction in open defecation nationally was on the order of a 10 percentage point
decline. A coefficient of 1.97 on neighborhood level OD (col 9) indicates that a 10 percentage point
reduction in the fraction of neighbors defecating in the open yields an improvement in hemoglobin of
0.197 g/dL, or about 14% of a standard deviation. To put this effect size in context, interventions such
as micronutrient supplementation (Friis et al., 2003), iron supplementation (Lind et al., 2003), forti-
fication (Van Stuijvenberg et al., 1999), and treating for parasites (Friis et al., 2003; Taylor-Robinson
et al., 2012) have effect sizes that range from 0.20 gm/dL to 0.40 gm/dL.
Thus, the sanitation-hemoglobin effect is large, though not implausibly so. Recall that one of
the two channels by which we hypothesize poor sanitation may impact hemoglobin is via intestinal
worms which are spread by skin contact with human fecal matter. In a double-blind randomized
control trial in Kenya, Friis et al. (2003) find that a single dose of deworming medicine generated an
17Improved water sources include piped water, protected wells, and protected springs.
15
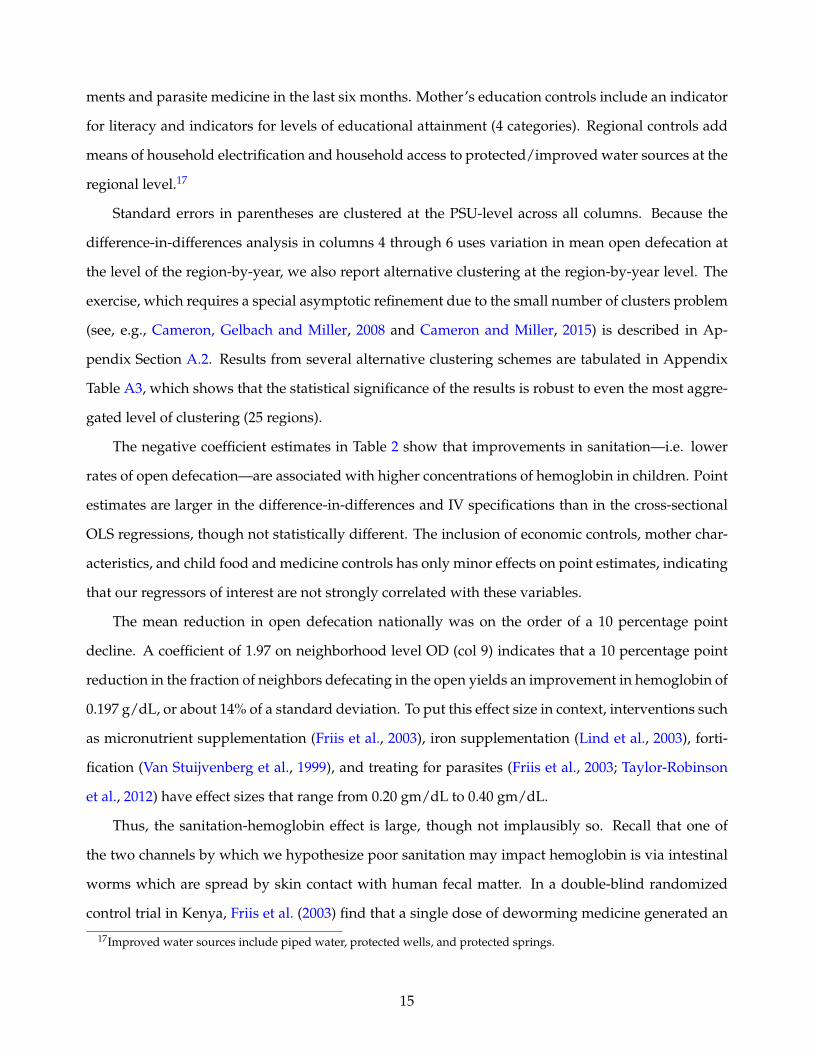
increase in hemoglobin of 0.21 g/dL measured eight months after its administration.
We motivated our paper with specific reference to anemia, which affects more than 40% of chil-
dren worldwide, and has been shown to have dramatic health and human capital consequences in
children. To give additional context to the main results, in Table 3 we recode the hemoglobin variable
as an indicator for anemia at varying levels of severity. We define mild, moderate, and severe anemia
as hemoglobin levels below 11.0 g/dL, 10.0 g/dL, and 7.0 g/dL, respectively, following thresholds set
by the World Health Organization. The regression specifications in Table 3 mirror those in columns
6 and 9 of Table 2. Column headers indicate the anemia threshold used to define the dependent
variable.
Estimates of effects on all three outcomes (mild, moderate, and severe anemia) are positive, indi-
cating that anemia rates are increasing in the mean rate of local open defecation. The larger standard
errors relative to effect sizes (compared to the hemoglobin results in Table 2) are expected, since the
transformation from a continuous measure of hemoglobin into a binary measure of anemia discards
variation in the dependent variable. Nonetheless, the coefficients on “moderate or worse” anemia in
columns 3 and 4 are statistically significant, though the confidence intervals are large.
5.2 Placebo Tests
Because our identifying variation arises from geographically heterogenous improvements in sanita-
tion, it is important to rule out that the sanitation improvements were simply part of a wider package
of local improvements that had independent effects on children’s hemoglobin. For example, the
summary statistics reveal that electrification and access to improved water sources also improved
significantly over our study period. Nationally, household electrification increased by 26 percentage
points from 2006 to 2011, and household access to improved water sources increased by 9 percentage
points. In this section, we report on a series of placebo tests that evaluate whether regional improve-
ments in these other important development indicators predict increases in hemoglobin in the same
way that improvements in sanitation do. If so, it would pose a problem for our identification, because
it would suggest that broader improvements in local development could be driving our results.
The pattern of results in Table 2 already provide some evidence against the notion that sani-
tation improvements were merely a marker for wider improvements with independent effects on
hemoglobin. Comparing, for example, column 5 to 6 or column 8 to 9 in Table 2 reveals that the in-
16
clusion of controls for time varying regional measures of electrification and access to improved water
sources had essentially no effect on the estimated effects of ODrt and ODprt.18
In Table 4, we more formally evaluate the possibility of confounding trends by replicating the ex-
act analysis in Table 2, but substituting analogous measures of region- and PSU-level electrification
and water infrastructure in place of regional- and PSU-level open defecation. Specifications in Table 4
mirror those in columns 6 and 9 of Table 2.19 The table shows that with respect to electrification, piped
water to homes, and access to improved water sources, there is no correlation between changes in
these variables and hemoglobin outcomes.20,21 These tests support the identifying assumption that
sanitation improvements were not correlated with other improvements having independent con-
founding effects on our outcome of interest.
5.3 Falsification Tests
As an alternative approach to supporting our identifying assumption, in this section we evaluate
whether the sanitation improvements we exploit were correlated with changes in children’s health
inputs that sanitation could not plausibly affect. The most well-established cause of anemia in chil-
dren is poor diet and in particular a lack of dietary iron. If sanitation improvements were correlated
with improvements in diet and iron intake, it would provide evidence against our identification strat-
egy. The DHS data allow us to examine both inputs directly.
In Table 5, we repeat the regression analysis in Table 2, but substitute alternative dependent
variables in place of hemoglobin. These include three nutritional variables in columns 1 through 6:
whether the child ate fruits and vegetables in the last 24 hours; whether the child ate animal protein
(meat and eggs) in the last 24 hours; and the variety of diet in the last 24 hours, operationalized as a
count of food types (starches, plant protein, fruits and vegetables, animal protein, and dairy).
Columns 7 through 12 repeat the falsification test for three alternative factors that could plausibly
influence hemoglobin, but on which sanitation would not be expected to have a direct effect. These
are iron supplementation, deworming medicine for the child, and iron supplementation during preg-
18These variables are included in the time-varying region controls.19The only difference is the inclusion of “region controls” as unreported coefficients in Table 2. These variables are the
regressors of interest in Table 4 and reported there.20The definition of improved water sources follows the definition in the UNICEF/WHO Joint Monitoring Programme
for Water Supply and Sanitation and includes piped water, protected wells, and protected springs.21Note that there is no significant first stage in column 4. We report the placebo result nonetheless in order to replicate
the exact specification of the regression in column 9 of Table 2.
17
nancy for the mother. Interpreting these outcomes is more nuanced than interpreting the nutritional
outcomes in columns 1 through 6. In principle, if parents observed less lethargy and weakness in
their children due to improvements in sanitation and its effects on hemoglobin, they may have en-
dogenously responded to lower rates of open defecation by scaling back iron supplementation and
parasite medicine. This could lead to positive coefficient estimates in columns 7 through 12. In
that scenario declining open defecation would lead to decreases in supplements and deworming
medicine. For that reason, positive effects of sanitation on medicine taking could be consistent with
a behavioral response to the biological mechanism we identify. In contrast, a significant negative co-
efficient estimate in these regressions would cause us to question our maintained hypothesis because
it would mean that reductions in open defecation were correlated with increases in iron supplemen-
tation and deworming medicine that could have independently affected hemoglobin concentrations.
Specifications in Table 5 are similar to those in Table 2, though they drop the food and medicine
controls since these are now the dependent variables. For each of the five dependent variables,
hemoglobin would be expected to be increasing in the variable’s levels based on the prior litera-
ture. The table shows no evidence that improving sanitation was correlated with improvements in
diet or increases in iron supplementation or deworming. Across the columns, the signs of effects vary
and in no case are the correlations with sanitation improvements statistically significant at even the
10 percent level.
Point estimates on mother’s iron supplementation and children’s deworming are positive, though
not statistically strong enough to take as evidence that parents responded to the reduction in open
defecation by scaling back these compensating investments in children’s health. Overall, the pat-
terns are consistent with the national averages in Table 1, which show that iron supplementation and
deworming treatments in children were unchanged over this period of rapid improvement in sani-
tation, while mother’s use of iron supplements during pregnancy increased. If instead these health
inputs had been endogenously scaled back, it could imply that the effects we estimate in Table 2 were
underestimates, because in that case, some of the hemoglobin gains of improved sanitation would be
counteracted by reductions in iron supplementation and deworming treatments.
In summary, the results from the falsification analyses above suggest that the relationship be-
tween open defecation and children’s hemoglobin is not due to associations with known determi-
nants of hemoglobin levels such as food intake or iron supplementation. It is important to keep in
18
mind that diet, micronutrient supplementation, malaria, and deworming treatments are the only fac-
tors shown to affect of anemia in the prior medical, epidemiological, or economic literature. Since
malarial incidence is low in our country context, the results in Table 5 directly confront this short list
of known causal factors, and therefore provide evidence that we have identified a new contributing
factor to anemia.
6 Discussion & Policy Implications
Today, about 14% of the world’s population practices open defecation. Given the scope of this prac-
tice, our estimates imply that poor sanitation could play an important role in explaining variation in
anemia rates worldwide. Indeed, our IV estimates—identified within localities over-time—are of the
same order of magnitude as the cross-country correlations displayed in Figure 1.22
Of course, marginal effects depend on context. For instance, open defecation is likely to be more
detrimental to hemoglobin where population density is high, just as deworming medicines may work
better where reinfection is less likely, and iron supplementation may be more useful where diets
include adequate amounts of other micronutrients needed for hemoglobin production. Our context
is one where open defecation declined from relatively high levels. Marginal improvements where
baseline sanitation is better may result in different, potentially smaller, effects on hemoglobin.
The hypothesis that sanitation has economically important impacts on hemoglobin and anemia
is new, but it fits together with several pieces of recent evidence from the economics literature (in ad-
dition to the evidence from the epidemiological and medical literature presented in Section 2). Two
randomized trials, one from India and one from Indonesia, have found an effect of sanitation pro-
grams on child height (Spears and Hammer, 2012; Cameron, Olivia and Shah, 2013). The biological
mechanisms linking open defecation and height are similar to the proposed link between open defe-
cation and hemoglobin status, supporting the plausibility of our findings. Nonetheless, there have
been no randomized controlled trials of the effect of latrine or toilet provision on hemoglobin status,
making our empirical findings important.23 Our findings on anemia may also help to explain some of
the recent empirical results in the non-experimental economics literature, which find that exposure to
22The coefficient estimates implied by Figure 1 range from about 0.10 g/dL per 10 percentage point reduction in opendefecation (Panel A) to about 0.20 g/dL (Panel B). In comparison, the within-region econometric results reported in column9 of Table 2 imply an effect of 0.14 g/dL per 10 percentage point reduction in open defection.
23The SHINE trial, currently underway in Zimbabwe, aims to demonstrate the link between the sanitation environment,environmental enteropathy, and anemia. See Humphrey (2014).
19
open defecation is associated with lower later-life productivity (Lawson and Spears, 2014) and lower
child cognitive function (Spears and Lamba, 2013). Such effects would be consistent on the wider
literature of anemia’s human capital impacts.
With respect to the wider research and policy interest in anemia, our findings suggest that any
randomized trial or policy that implements an intervention targeting anemia at the individual level
will necessarily miss an important phenomenon. This is because the phenomenon we study here
is related to the behavior of neighbors: Neighbors’ open defecation introduces fecal pathogens into
the child’s body. Therefore, even treatments aimed at deworming individual children or otherwise
arresting the process by which fecal pathogens disrupt the absorption of critical nutrients are likely
to yield very different impacts on hemoglobin compared to interventions that address the under-
lying sanitation externality at the neighborhood level. This point about the public goods nature of
sanitation has been made in the context of deworming interventions by Miguel and Kremer (2004),
Bundy et al. (2009), and others. In the context of anemia, it implies that future randomized control
trials aimed at investigating the link between sanitation and anemia should vary the open defeca-
tion treatment at the community level (not the person level), just as our natural experiment does.
Because open defecation primarily constitutes an externality (Geruso and Spears, 2015), individual
randomization cannot uncover it.
On the other hand, the public goods nature of sanitation also suggests a new set of policy tools
available to address anemia that are fundamentally different from the status quo, which generally
involves administering an iron supplement, fortified food, or a deworming pill to an individual child.
This implies that action can be taken at a community level, and that the reduction of anemia in
children may even require action on the part of non-children and non-parents. This substantially
expands the set of policy responses available for targeting anemia.
These findings are important because researchers and policy makers tend to consider anemia
and other nutritional diseases to be problems of inadequate food intake, and to overlook the im-
portant role of disease in determining “nutritional” outcomes. Recommendations and interventions
aimed at anemia by leading development organizations almost always focus on food intake based
interventions, either in the forms of iron, vitamin B12 and folate supplementation or fortification, or
through efforts to encourage people to diversify their diets. However, since exposure to poor sani-
tation can lead to nutritional loss to intestinal parasites and to the malabsorption of critical nutrients
20
(via enteropathy), sanitation plays a critical role in determining net nutrition.
We do not mean to imply that our findings offer a pathway for a simple solution to the global
problem of anemia. Changing behavior with respect to open defecation has proven very difficult in
many settings. Coffey et al. (2014), Guiteras et al. (2014) and Geruso and Spears (2015) all demonstrate
that preferences for open defecation can be deeply rooted and not merely a matter of the affordability
of toilets. The low private demand for latrines and toilets may be owing to inaccurate beliefs with
respect to the private benefits, as well as coordination problems and the classic problem of under-
investment in goods with external benefits. Nonetheless, our results offer new evidence of such
benefits, and in this way strengthen the basic economic rationale for policy intervention.
7 Conclusion
Our study is the first to propose and investigate the hypothesis that poor sanitation is an important
contributor to low hemoglobin and anemia in children. The finding that open defecation significantly
impacts these outcomes adds to a rapidly expanding literature on the importance of open defecation
in shaping human capital outcomes. More broadly, our findings connect to a wide literature on the
role of water, sanitation, and disease environment in driving health and human capital accumulation
in the developing world and the historical US.24
The results here suggest new policy avenues for addressing anemia around the developing world.
Although development organizations such as the WHO and UNICEF have included poor hygiene
and sanitation among the contributing factors to anemia in young children,25 the elimination of open
defecation is rarely among priority policy recommendations or the focus of programs implemented
to fight anemia.
24See, for example, Cutler and Miller (2005); Watson (2006); Bleakley (2007); Spears (2012); Alsan and Goldin (2015).25See WHO, UNICEF and United Nations University (2001) and UNICEF (2002).
21
References
Alderman, Harold, and Sebastian Linnemayr. 2009. “Anemia in low-income countries is unlikely tobe addressed by economic development without additional programs.” Food & Nutrition Bulletin,30(3): 265–269.
Allen, Lindsay. 1997. “Pregnancy and iron deficiency: unresolved issues.” Nutrition reviews, 55(4): 91–101.
Alsan, Marcella, and Claudia Goldin. 2015. “Watersheds in Infant Mortality: The Role of EffectiveWater and Sewerage Infrastructure, 1880 to 1915.” working paper.
Baumgartner, E.A., and Glenn Smith. 1927. “Pernicious anemia and tropical sprue.” Archives of In-ternal Medicine, 40(2): 203–215.
Bertrand, Marianne, Esther Duflo, Sendhil Mullainathan, et al. 2004. “How Much Should We TrustDifferences-in-Differences Estimates?” The Quarterly Journal of Economics, 119(1): 249–275.
Bhattacharya, Jayanta, Janet Currie, and Steven Haider. 2004. “Poverty, food insecurity, and nu-tritional outcomes in children and adults.” Journal of Health Economics, 23(4): 839 – 862. Containscontributions from the Grossman Symposium.
Bleakley, Hoyt. 2007. “Disease and development: evidence from hookworm eradication in the Amer-ican South.” The Quarterly Journal of Economics, 122(1): 73–117.
Bobonis, Gustavo J., Edward Miguel, and Charu Puri-Sharma. 2006. “Anemia and School Partici-pation.” Journal of Human Resources, XLI(4): 692–721.
Bundy, Donald AP, Michael Kremer, Hoyt Bleakley, Matthew CH Jukes, Edward Miguel, et al.2009. “Deworming and development: Asking the right questions, asking the questions right.” PLoSNeglected Tropical Diseases, 3(1): e362.
Cairncross, Sandy. 2003. “Sanitation in the developing world: current status and future solutions.”International Journal of Environmental Health Research, 13(S1): S123–S131.
Cameron, A Colin, and Douglas L Miller. 2015. “A practitioner?s guide to cluster-robust inference.”Journal of Human Resources, 50(2): 317–372.
Cameron, A Colin, Jonah B Gelbach, and Douglas L Miller. 2008. “Bootstrap-based improvementsfor inference with clustered errors.” The Review of Economics and Statistics, 90(3): 414–427.
Cameron, Lisa, Susan Olivia, and Manisha Shah. 2013. Impact evaluation of a large-scale rural sanita-tion project in Indonesia. World Bank.
Clasen, Thomas, Sophie Boisson, Parimita Routray, Belen Torondel, Melissa Bell, Oliver Cum-ming, Jeroen Ensink, Matthew Freeman, Marion Jenkins, Mitsunori Odagiri, Subhajyoti Ray,Antara Sinha, Mrutyunjay Suar, and Wolf-Peter Schmidt. 2015. “Effectiveness of a rural san-itation programme on diarrhoea, soil-transmitted helminth infection, and child malnutrition inOdisha, India: a cluster-randomised trial.” The Lancet Global Health, 2(11): e645–e653.
Coffey, Diane, Aashish Gupta, Payal Hathi, Nidhi Khurana, Dean Spears, Nikhil Srivastav, andSangita Vyas. 2014. “Revealed preference for open defecation.” Economic and Political Weekly,49(38): 43.
22
Cohen, Jessica, and Pascaline Dupas. 2010. “Free Distribution or Cost-Sharing? Evidence from aRandomized Malaria Prevention Experiment.” The Quarterly Journal of Economics, 125(1): 1–45.
Cutler, David, and Grant Miller. 2005. “The role of public health improvements in health advances:The twentieth-century United States.” Demography, 42(1): 1–22.
Friis, H, D Mwaniki, B Omondi, E Muniu, F Thiong’o, J Ouma, P Magnussen, PW Geissler, andK Fleischer Michaelsen. 2003. “Effects on haemoglobin of multi-micronutrient supplementationand multi-helminth chemotherapy: a randomized, controlled trial in Kenyan school children.”European journal of clinical nutrition, 57(4): 573–579.
Geruso, Michael, and Dean Spears. 2015. “Neighborhood Sanitation and Infant Mortality.” NationalBureau of Economic Research.
Grantham-McGregor, Sally, and Cornelius Ani. 2001. “Review of Studies on the Effect of Iron Defi-ciency on Cognitive Development in Children.” The Journal of Nutrition, 131: 649SU668S.
Guiteras, Raymond, James Levinsohn, and Ahmed Mushfiq Mobarak. 2015. “Encouraging sanita-tion investment in the developing world: A cluster-randomized trial.” Science.
Guiteras, Raymond P, David I Levine, Stephen P Luby, Thomas H Polley, Kaniz Khatun-e Jannat,and Leanne Unicomb. 2014. “Disgust and Shame: Motivating Contributions to Public Goods.”mimeo.
Hammer, Jeffrey S, and Dean Spears. 2013. “Village sanitation and children’s human capital: Evi-dence from a randomized experiment by the Maharashtra government.” World Bank Policy ResearchWorking Paper, , (6580).
Hathi, Payal, Sabrina Haque, Lovey Pant, Diane Coffey, and Dean Spears. 2014. “Place and childhealth: the interaction of population density and sanitation in developing countries.” World BankPolicy Research Working Paper, , (7124).
Heston, Alan, Robert Summers, and Bettina Aten. 2012. “Penn World Table Version 7.1.”
Humphrey, Jean. 2009. “Child undernutrition, tropical enteropathy, toilets, and handwashing.”Lancet, 374: 1032U1035.
Humphrey, Jean. 2014. “Sanitation, Hygiene, Infant Nutrition Efficacy Project.”
Kapoor, SK, Umesh Kapil, Sada Nand Dwivedi, K Anand, Priyali Pathak, and Preeti Singh.2002. “Comparison of HemoCue method with cyanmethemoglobin method for estimation ofhemoglobin.” Indian pediatrics, 39(8): 743–746.
Knight, Kyle. 2014. “Nepal’s ‘Mr Toilet’ on a clean-up mission.” Al Jazeera, April 1, 2014. Avail-able: http://www.aljazeera.com/indepth/features/2014/03/nepal-mr-toilet-clean-up-mission-201433195751321643.html [Last accessed: 30 June 2015].
Korenromp, Eline. 2005. “Malaria incidence estimates at country level for the year 2004. Proposedestimates and draft report.” World Health Organization, Roll Back Malaria. Geneva: WHO.
Kosek, Margaret, Rashidul Haque, Aldo Lima, Sudhir Babji, Sanjaya Shrestha, Shahida Qureshi,Samie Amidou, Estomih Mduma, Gwenyth Lee, Pablo Peñataro Yori, et al. 2013. “Fecal Markersof Intestinal Inflammation and Permeability Associated with the Subsequent Acquisition of LinearGrowth Deficits in Infants.” The American journal of tropical medicine and hygiene, 88(2): 390.
23
Lawson, Nicholas, and Dean Spears. 2014. “What doesn’t kill you makes you poorer: adult wagesand the early-life disease environment in India.” World Bank Policy Research Working Paper, , (7121).
Lin, Audrie, Benjamin Arnold, Sadia Afreen, Rie Goto, Tarique Mohammad Nurul Huda,Rashidul Haque, Rubhana Raqib, Leanne Unicomb, Tahmeed Ahmed, John Colford, andStephen Luby. 2013. “Household Environmental Conditions Are Associated with Enteropathy andImpaired Growth in Rural Bangladesh.” The American Journal of Tropical Medicine and Hygiene, 12.
Lind, Torbjörn, Bo Lönnerdal, Hans Stenlund, Djauhar Ismail, Rosadi Seswandhana, Eva-Charlotte Ekström, and Lars-Åke Persson. 2003. “A community-based randomized controlled trialof iron and zinc supplementation in Indonesian infants: Interactions between iron and zinc.” TheAmerican journal of clinical nutrition, 77(4): 883–890.
Measure DHS. 2013. “Malaria Indicator Survey: Anemia and Malaria Field TestingManual.” Mea-sure DHS, Calverton, MD. Available: www. malariasurveys. org/toolkit.
Menon, Purnima. 2012. “The crisis of poor complementary feeding in South Asia: Where next?”Maternal & Child Nutrition, 8(s1): 1–4.
Miguel, Edward, and Michael Kremer. 2004. “Worms: Identifying Impacts on Education and Healthin the Presence of Treatment Externalities.” Econometrica, 72(1): 159–217.
Nath, Samir. 2005. “Tropical Sprue.” Current Gastroenterology Reports, 7: 343–349.
Ozier, Owen. 2015. “Exploiting Externalities to Estimate the Long-Term Effects of Early ChildhoodDeworming.” Development Research Group, The World Bank.
Rosenberg, Irwin, and Barbara Bowman. 1982. “Intestinal Physiology and Parasitic Diseases.” Re-views of Infectious Diseases, 4(4): 763–767.
Rush, David. 2000. “Nutrition and maternal mortality in the developing world.” American Journal ofClinical Nutrition, 72(suppl): 212S–240S.
Sachs, Jeffrey, and Pia Malaney. 2002. “The economic and social burden of malaria.” Nature,415(6872): 680–685.
Spears, Dean. 2012. “Effects of Rural Sanitation on Infant Mortality and Human Capital: Evidencefrom a Local Governance Incentive in India.” Princeton working paper.
Spears, Dean. 2013. “Sanitation and open defecation explain international variation in childrenŠsheight: Evidence from 140 nationally representative household surveys.” RICE working paper.Available: www. riceinstitute. org.
Spears, Dean, and J Hammer. 2012. “Village sanitation externalities and children’s human capital:Evidence from a randomized experiment by the Maharashtra government.” RICE working paper.Available: www. riceinstitute. org.
Spears, Dean, and Sneha Lamba. 2013. “Effects of early-life exposure to sanitation on childhood cog-nitive skills: evidence from India’s total sanitation campaign.” World Bank Policy Research WorkingPaper, , (6659).
Stevens, Gretchen A, Mariel M Finucane, Luz Maria De-Regil, Christopher J Paciorek, Seth R Flax-man, Francesco Branca, Juan Pablo Peña-Rosas, Zulfiqar A Bhutta, Majid Ezzati, Nutrition Im-pact Model Study Group, et al. 2013. “Global, regional, and national trends in haemoglobin con-centration and prevalence of total and severe anaemia in children and pregnant and non-pregnant
24
women for 1995–2011: a systematic analysis of population-representative data.” The Lancet GlobalHealth, 1(1): e16–e25.
Tayler, Kevin, Rebecca Scott, and Guna Raj Shrestha. 2005. “Implementing National SanitationPolicy in Nepal.” WEDC Briefing Note: Nepal.
Taylor-Robinson, David C, Nicola Maayan, Karla Soares-Weiser, Sarah Donegan, and Paul Garner.2012. “Deworming drugs for soil-transmitted intestinal worms in children: Effects on nutritionalindicators, haemoglobin and school performance.” Cochrane Database Syst Rev, 7.
Thomas, Duncan, Elizabeth Frankenberg, Jed Friedman, Jean-Pierre Habicht, Nathan Jones,Christopher McKelvey, Greta Pelto, Bondan Sikoki, James Smith, Cecep Sumantri, and WayanSuriastini. 2004. “Causal Effect of Health on Labor Market Outcomes: Evidence from a RandomAssignment Iron Supplementation Intervention.” California Center for Population Research Work-ing Paper.
Tolentino, Karine, and Jennifer Friedman. 2007. “An update on anemia in less developed countries.”The American journal of tropical medicine and hygiene, 77(1): 44–51.
UNICEF. 2002. “Prevention and control of nutritional anaemia: A South Asia priority.” Regional officefor South Asia: UNICEF.
Van Stuijvenberg, M Elizabeth, Jane D Kvalsvig, Mieke Faber, Marita Kruger, Diane G Kenoyer,and AJ Spinnler Benadé. 1999. “Effect of iron-, iodine-, and β-carotene–fortified biscuits on themicronutrient status of primary school children: A randomized controlled trial.” The Americanjournal of clinical nutrition, 69(3): 497–503.
Walker, Marjorie. 2003. “What is tropical sprue?” Journal of gastroenterology and hepatology, 18(8): 887–890.
Watson, Tara. 2006. “Public health investments and the infant mortality gap: Evidence from federalsanitation interventions on U.S. Indian reservations.” Journal of Public Economics, 90(8-9): 1537 –1560.
WHO, UNICEF, and United Nations University. 2001. “Iron deficiency anaemia: Assessment, pre-vention and control. A guide for programme managers.” Geneva: World Health Organization, 132.
World Bank. 2013. “Data: Land area (sq. km).”
Yip, Ray, and Usha Ramakrishnan. 2002. “Experiences and challenges in developing countries.” TheJournal of nutrition, 132(4): 827S–830S.
25
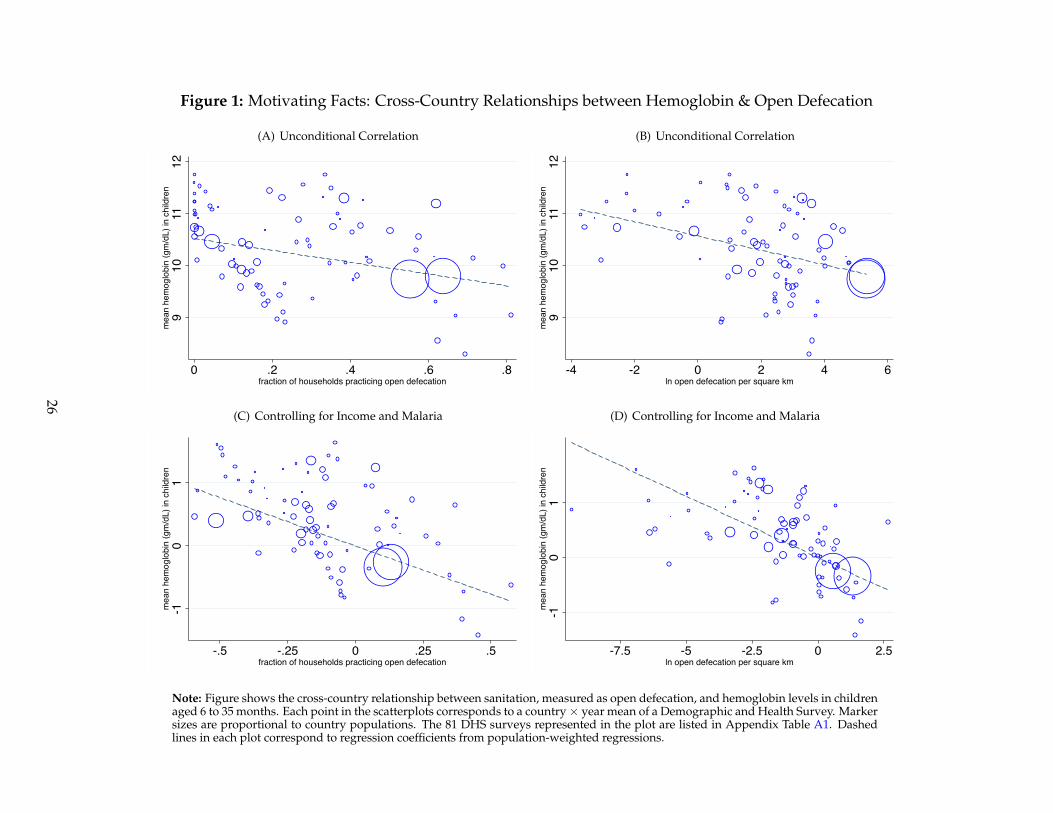
Figure 1: Motivating Facts: Cross-Country Relationships between Hemoglobin & Open Defecation
(A) Unconditional Correlation
910
1112
mea
n he
mog
lobi
n (g
m/d
L) in
chi
ldre
n
0 .2 .4 .6 .8fraction of households practicing open defecation
(B) Unconditional Correlation
910
1112
mea
n he
mog
lobi
n (g
m/d
L) in
chi
ldre
n
-4 -2 0 2 4 6ln open defecation per square km
(C) Controlling for Income and Malaria
-10
1m
ean
hem
oglo
bin
(gm
/dL)
in c
hild
ren
-.5 -.25 0 .25 .5fraction of households practicing open defecation
(D) Controlling for Income and Malaria
-10
1m
ean
hem
oglo
bin
(gm
/dL)
in c
hild
ren
-7.5 -5 -2.5 0 2.5ln open defecation per square km
Note: Figure shows the cross-country relationship between sanitation, measured as open defecation, and hemoglobin levels in childrenaged 6 to 35 months. Each point in the scatterplots corresponds to a country× year mean of a Demographic and Health Survey. Markersizes are proportional to country populations. The 81 DHS surveys represented in the plot are listed in Appendix Table A1. Dashedlines in each plot correspond to regression coefficients from population-weighted regressions.
26
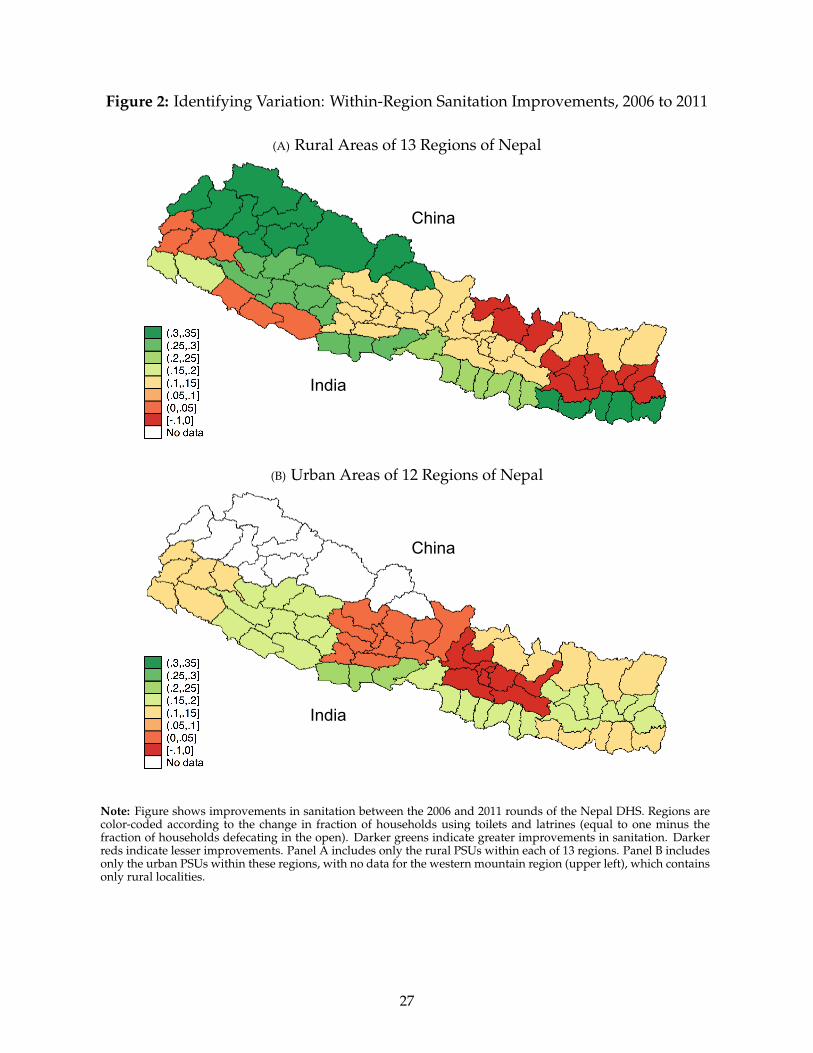
Figure 2: Identifying Variation: Within-Region Sanitation Improvements, 2006 to 2011
(A) Rural Areas of 13 Regions of Nepal
China India
China India
(B) Urban Areas of 12 Regions of Nepal
China India
China India
Note: Figure shows improvements in sanitation between the 2006 and 2011 rounds of the Nepal DHS. Regions arecolor-coded according to the change in fraction of households using toilets and latrines (equal to one minus thefraction of households defecating in the open). Darker greens indicate greater improvements in sanitation. Darkerreds indicate lesser improvements. Panel A includes only the rural PSUs within each of 13 regions. Panel B includesonly the urban PSUs within these regions, with no data for the western mountain region (upper left), which containsonly rural localities.
27
Figure 3: Baseline Sanitation in 2006 Predicts Subsequent Improvement
(A) Rural Areas of 13 Regions
-.3-.2
-.10
.1Ch
ange
in O
D, 2
006
to 2
011
0 .2 .4 .6 .8Level OD in 2006
(B) Urban Areas of 13 Regions
-.3-.2
-.10
.1Ch
ange
in O
D, 2
006
to 2
011
0 .2 .4 .6 .8Level OD in 2006
Note: Figure plots the relationship between the baseline level of open defecation (OD) in 2006 and the subsequentchange between 2006 and 2011. Panel A includes only rural households within each of 13 regions. Panel B includesonly the urban households within these regions.
28
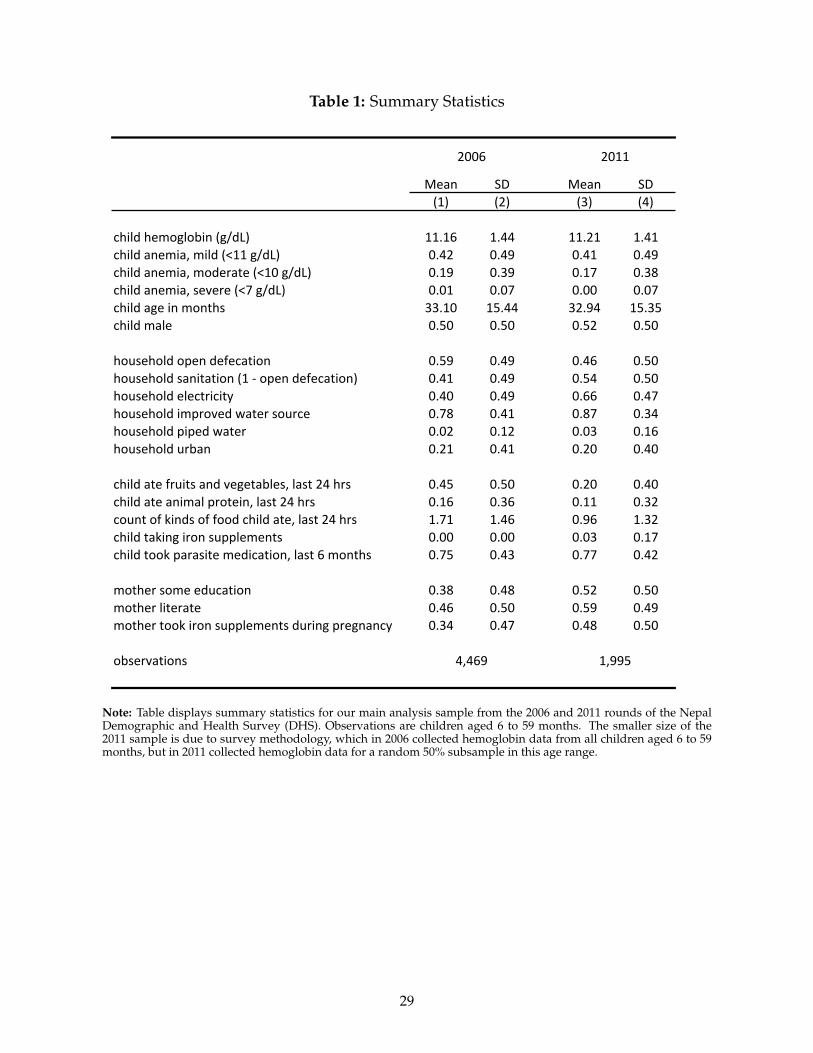
Table 1: Summary Statistics
Mean SD Mean SD(1) (2) (3) (4)
child hemoglobin (g/dL) 11.16 1.44 11.21 1.41child anemia, mild (<11 g/dL) 0.42 0.49 0.41 0.49child anemia, moderate (<10 g/dL) 0.19 0.39 0.17 0.38child anemia, severe (<7 g/dL) 0.01 0.07 0.00 0.07child age in months 33.10 15.44 32.94 15.35child male 0.50 0.50 0.52 0.50
household open defecation 0.59 0.49 0.46 0.50household sanitation (1 -‐ open defecation) 0.41 0.49 0.54 0.50household electricity 0.40 0.49 0.66 0.47household improved water source 0.78 0.41 0.87 0.34household piped water 0.02 0.12 0.03 0.16household urban 0.21 0.41 0.20 0.40
child ate fruits and vegetables, last 24 hrs 0.45 0.50 0.20 0.40child ate animal protein, last 24 hrs 0.16 0.36 0.11 0.32count of kinds of food child ate, last 24 hrs 1.71 1.46 0.96 1.32child taking iron supplements 0.00 0.00 0.03 0.17child took parasite medication, last 6 months 0.75 0.43 0.77 0.42
mother some education 0.38 0.48 0.52 0.50mother literate 0.46 0.50 0.59 0.49mother took iron supplements during pregnancy 0.34 0.47 0.48 0.50
observations
2006 2011
1,9954,469
Note: Table displays summary statistics for our main analysis sample from the 2006 and 2011 rounds of the NepalDemographic and Health Survey (DHS). Observations are children aged 6 to 59 months. The smaller size of the2011 sample is due to survey methodology, which in 2006 collected hemoglobin data from all children aged 6 to 59months, but in 2011 collected hemoglobin data for a random 50% subsample in this age range.
29
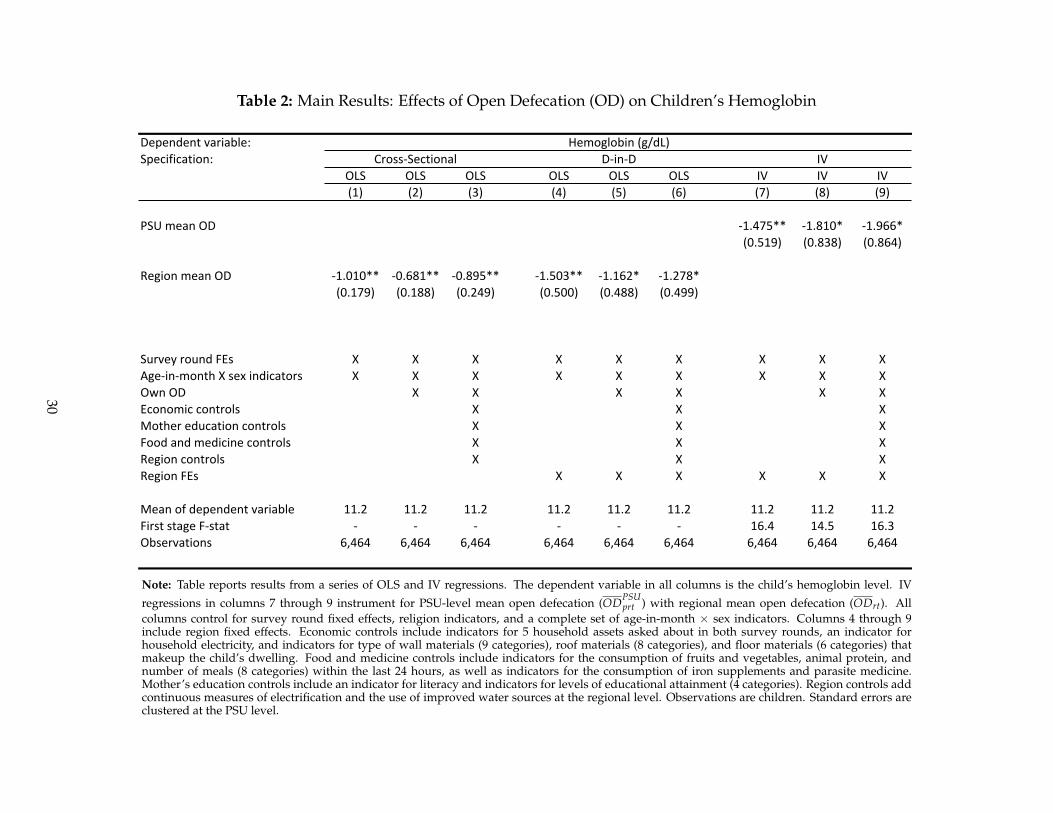
Table 2: Main Results: Effects of Open Defecation (OD) on Children’s Hemoglobin
Dependent variable:Specification:
OLS OLS OLS OLS OLS OLS IV IV IV(1) (2) (3) (4) (5) (6) (7) (8) (9)
PSU mean OD -‐1.475** -‐1.810* -‐1.966*(0.519) (0.838) (0.864)
Region mean OD -‐1.010** -‐0.681** -‐0.895** -‐1.503** -‐1.162* -‐1.278*(0.179) (0.188) (0.249) (0.500) (0.488) (0.499)
Survey round FEs X X X X X X X X XAge-‐in-‐month X sex indicators X X X X X X X X XOwn OD X X X X X XEconomic controls X X XMother education controls X X XFood and medicine controls X X XRegion controls X X XRegion FEs X X X X X X
Mean of dependent variable 11.2 11.2 11.2 11.2 11.2 11.2 11.2 11.2 11.2First stage F-‐stat -‐ -‐ -‐ -‐ -‐ -‐ 16.4 14.5 16.3Observations 6,464 6,464 6,464 6,464 6,464 6,464 6,464 6,464 6,464
Hemoglobin (g/dL)Cross-‐Sectional D-‐in-‐D IV
Note: Table reports results from a series of OLS and IV regressions. The dependent variable in all columns is the child’s hemoglobin level. IV
regressions in columns 7 through 9 instrument for PSU-level mean open defecation (ODPSUprt ) with regional mean open defecation (ODrt). All
columns control for survey round fixed effects, religion indicators, and a complete set of age-in-month × sex indicators. Columns 4 through 9include region fixed effects. Economic controls include indicators for 5 household assets asked about in both survey rounds, an indicator forhousehold electricity, and indicators for type of wall materials (9 categories), roof materials (8 categories), and floor materials (6 categories) thatmakeup the child’s dwelling. Food and medicine controls include indicators for the consumption of fruits and vegetables, animal protein, andnumber of meals (8 categories) within the last 24 hours, as well as indicators for the consumption of iron supplements and parasite medicine.Mother’s education controls include an indicator for literacy and indicators for levels of educational attainment (4 categories). Region controls addcontinuous measures of electrification and the use of improved water sources at the regional level. Observations are children. Standard errors areclustered at the PSU level.
30
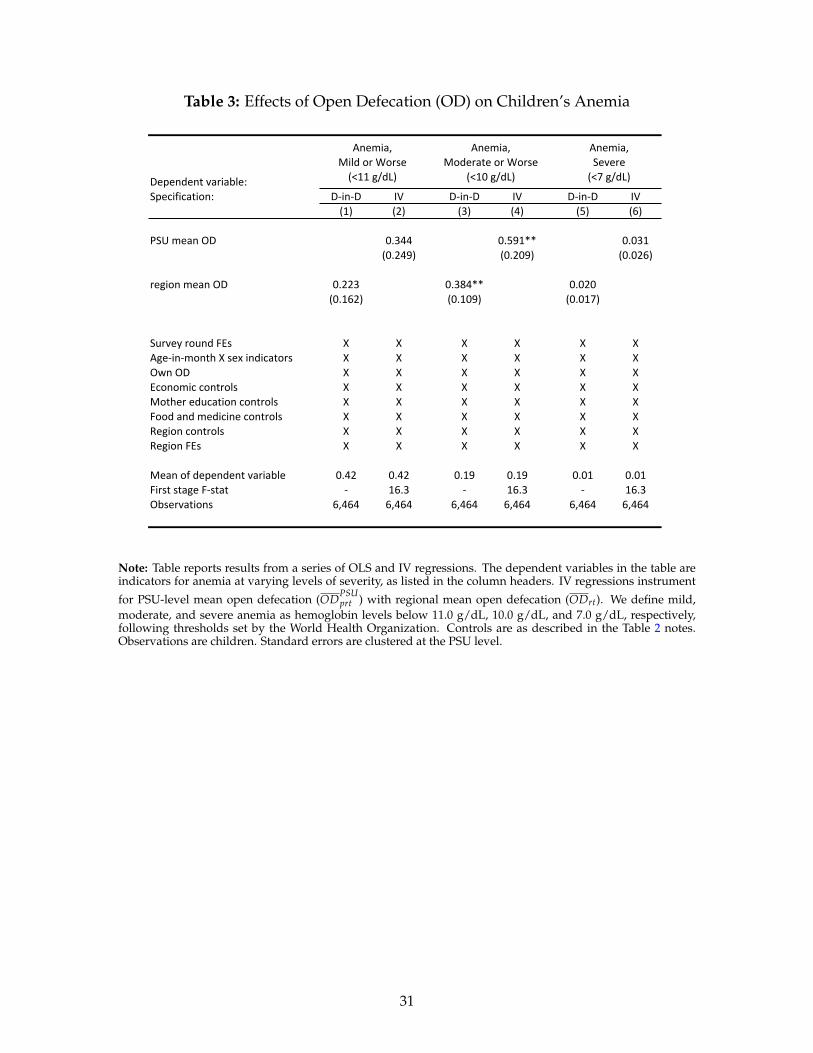
Table 3: Effects of Open Defecation (OD) on Children’s Anemia
Dependent variable:Specification: D-‐in-‐D IV D-‐in-‐D IV D-‐in-‐D IV
(1) (2) (3) (4) (5) (6)
PSU mean OD 0.344 0.591** 0.031(0.249) (0.209) (0.026)
region mean OD 0.223 0.384** 0.020(0.162) (0.109) (0.017)
Survey round FEs X X X X X XAge-‐in-‐month X sex indicators X X X X X XOwn OD X X X X X XEconomic controls X X X X X XMother education controls X X X X X XFood and medicine controls X X X X X XRegion controls X X X X X XRegion FEs X X X X X X
Mean of dependent variable 0.42 0.42 0.19 0.19 0.01 0.01First stage F-‐stat -‐ 16.3 -‐ 16.3 -‐ 16.3Observations 6,464 6,464 6,464 6,464 6,464 6,464
Anemia, Mild or Worse (<11 g/dL)
Anemia, Moderate or Worse
(<10 g/dL)
Anemia, Severe (<7 g/dL)
Note: Table reports results from a series of OLS and IV regressions. The dependent variables in the table areindicators for anemia at varying levels of severity, as listed in the column headers. IV regressions instrument
for PSU-level mean open defecation (ODPSUprt ) with regional mean open defecation (ODrt). We define mild,
moderate, and severe anemia as hemoglobin levels below 11.0 g/dL, 10.0 g/dL, and 7.0 g/dL, respectively,following thresholds set by the World Health Organization. Controls are as described in the Table 2 notes.Observations are children. Standard errors are clustered at the PSU level.
31
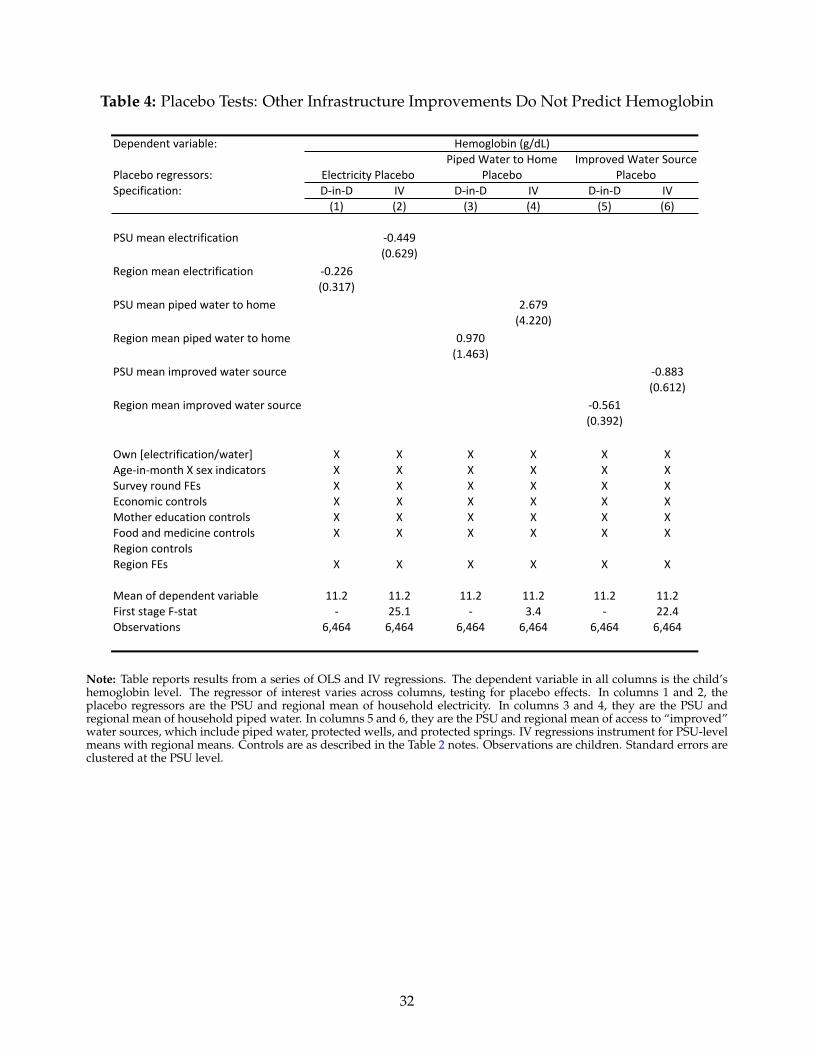
Table 4: Placebo Tests: Other Infrastructure Improvements Do Not Predict Hemoglobin
Dependent variable:
Specification: D-‐in-‐D IV D-‐in-‐D IV D-‐in-‐D IV(1) (2) (3) (4) (5) (6)
PSU mean electrification -‐0.449(0.629)
Region mean electrification -‐0.226(0.317)
PSU mean piped water to home 2.679(4.220)
Region mean piped water to home 0.970(1.463)
PSU mean improved water source -‐0.883(0.612)
Region mean improved water source -‐0.561(0.392)
Own [electrification/water] X X X X X XAge-‐in-‐month X sex indicators X X X X X XSurvey round FEs X X X X X XEconomic controls X X X X X XMother education controls X X X X X XFood and medicine controls X X X X X XRegion controlsRegion FEs X X X X X X
Mean of dependent variable 11.2 11.2 11.2 11.2 11.2 11.2First stage F-‐stat -‐ 25.1 -‐ 3.4 -‐ 22.4Observations 6,464 6,464 6,464 6,464 6,464 6,464
Hemoglobin (g/dL)
Placebo regressors: Electricity PlaceboPiped Water to Home
PlaceboImproved Water Source
Placebo
Note: Table reports results from a series of OLS and IV regressions. The dependent variable in all columns is the child’shemoglobin level. The regressor of interest varies across columns, testing for placebo effects. In columns 1 and 2, theplacebo regressors are the PSU and regional mean of household electricity. In columns 3 and 4, they are the PSU andregional mean of household piped water. In columns 5 and 6, they are the PSU and regional mean of access to “improved”water sources, which include piped water, protected wells, and protected springs. IV regressions instrument for PSU-levelmeans with regional means. Controls are as described in the Table 2 notes. Observations are children. Standard errors areclustered at the PSU level.
32
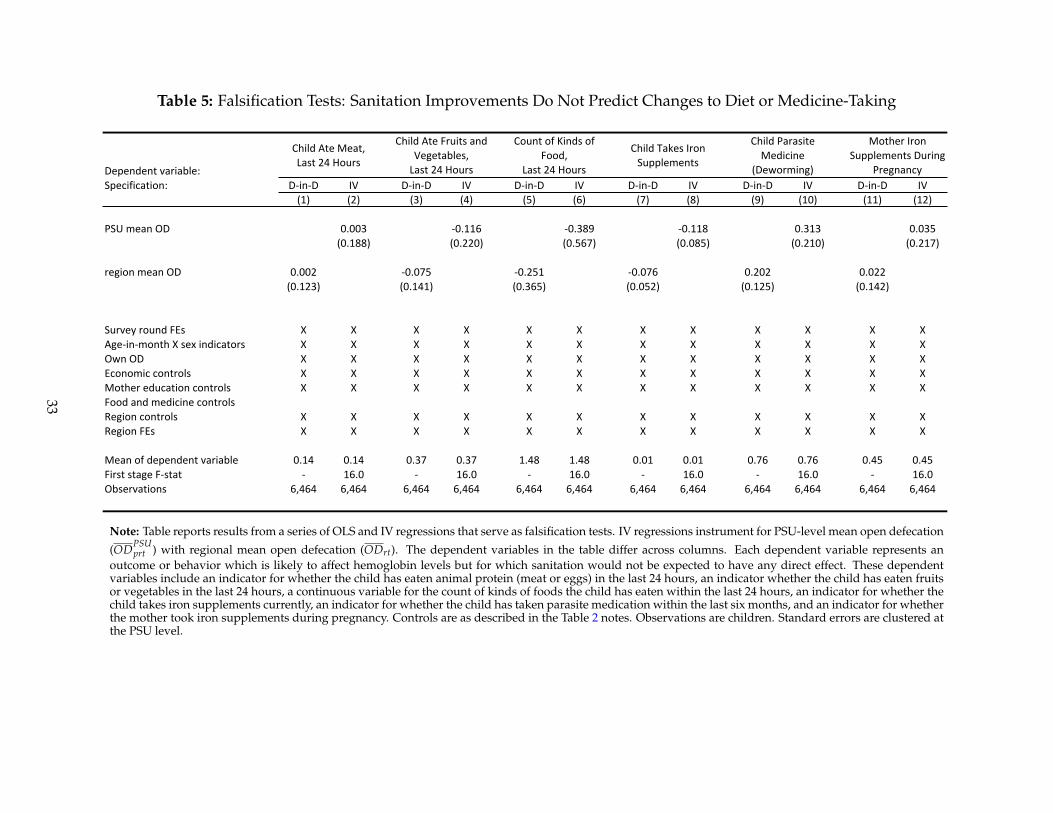
Table 5: Falsification Tests: Sanitation Improvements Do Not Predict Changes to Diet or Medicine-Taking
Dependent variable:Specification: D-‐in-‐D IV D-‐in-‐D IV D-‐in-‐D IV D-‐in-‐D IV D-‐in-‐D IV D-‐in-‐D IV
(1) (2) (3) (4) (5) (6) (7) (8) (9) (10) (11) (12)
PSU mean OD 0.003 -‐0.116 -‐0.389 -‐0.118 0.313 0.035(0.188) (0.220) (0.567) (0.085) (0.210) (0.217)
region mean OD 0.002 -‐0.075 -‐0.251 -‐0.076 0.202 0.022(0.123) (0.141) (0.365) (0.052) (0.125) (0.142)
Survey round FEs X X X X X X X X X X X XAge-‐in-‐month X sex indicators X X X X X X X X X X X XOwn OD X X X X X X X X X X X XEconomic controls X X X X X X X X X X X XMother education controls X X X X X X X X X X X XFood and medicine controlsRegion controls X X X X X X X X X X X XRegion FEs X X X X X X X X X X X X
Mean of dependent variable 0.14 0.14 0.37 0.37 1.48 1.48 0.01 0.01 0.76 0.76 0.45 0.45First stage F-‐stat -‐ 16.0 -‐ 16.0 -‐ 16.0 -‐ 16.0 -‐ 16.0 -‐ 16.0Observations 6,464 6,464 6,464 6,464 6,464 6,464 6,464 6,464 6,464 6,464 6,464 6,464
Mother Iron Supplements During
Pregnancy
Child Ate Meat, Last 24 Hours
Child Ate Fruits and Vegetables, Last 24 Hours
Child Takes Iron Supplements
Count of Kinds of Food,
Last 24 Hours
Child Parasite Medicine
(Deworming)
Note: Table reports results from a series of OLS and IV regressions that serve as falsification tests. IV regressions instrument for PSU-level mean open defecation
(ODPSUprt ) with regional mean open defecation (ODrt). The dependent variables in the table differ across columns. Each dependent variable represents an
outcome or behavior which is likely to affect hemoglobin levels but for which sanitation would not be expected to have any direct effect. These dependentvariables include an indicator for whether the child has eaten animal protein (meat or eggs) in the last 24 hours, an indicator whether the child has eaten fruitsor vegetables in the last 24 hours, a continuous variable for the count of kinds of foods the child has eaten within the last 24 hours, an indicator for whether thechild takes iron supplements currently, an indicator for whether the child has taken parasite medication within the last six months, and an indicator for whetherthe mother took iron supplements during pregnancy. Controls are as described in the Table 2 notes. Observations are children. Standard errors are clustered atthe PSU level.
33
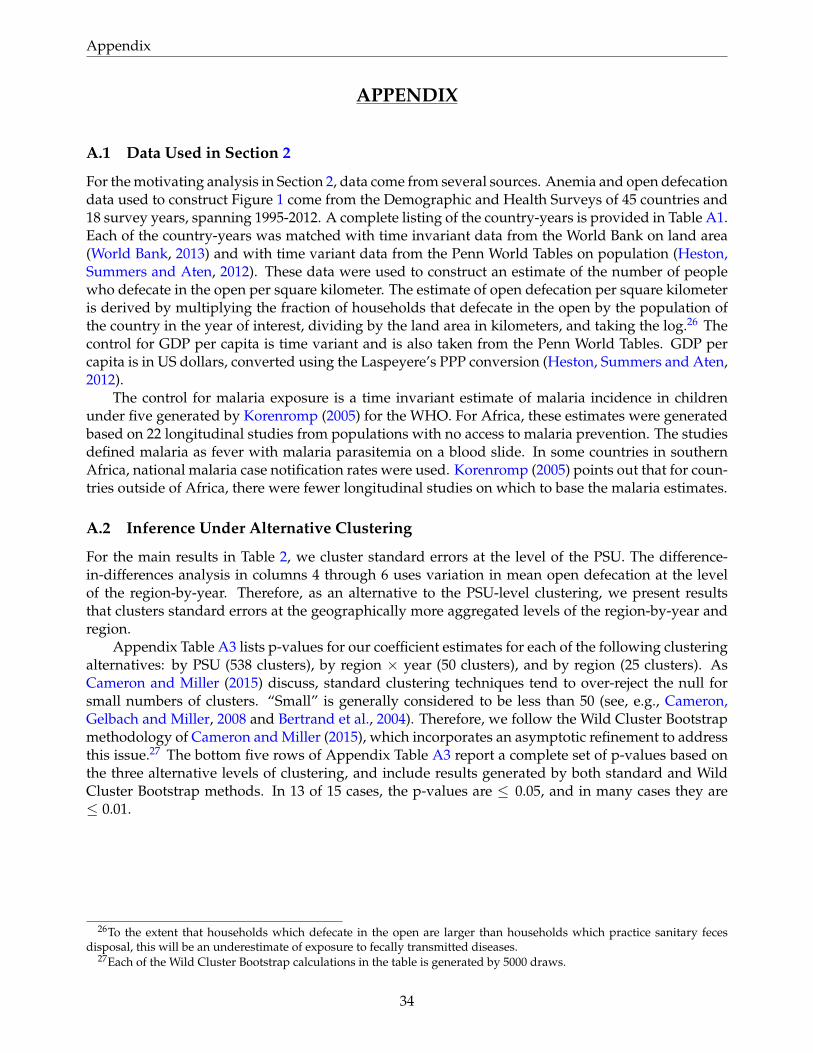
Appendix
APPENDIX
A.1 Data Used in Section 2
For the motivating analysis in Section 2, data come from several sources. Anemia and open defecationdata used to construct Figure 1 come from the Demographic and Health Surveys of 45 countries and18 survey years, spanning 1995-2012. A complete listing of the country-years is provided in Table A1.Each of the country-years was matched with time invariant data from the World Bank on land area(World Bank, 2013) and with time variant data from the Penn World Tables on population (Heston,Summers and Aten, 2012). These data were used to construct an estimate of the number of peoplewho defecate in the open per square kilometer. The estimate of open defecation per square kilometeris derived by multiplying the fraction of households that defecate in the open by the population ofthe country in the year of interest, dividing by the land area in kilometers, and taking the log.26 Thecontrol for GDP per capita is time variant and is also taken from the Penn World Tables. GDP percapita is in US dollars, converted using the Laspeyere’s PPP conversion (Heston, Summers and Aten,2012).
The control for malaria exposure is a time invariant estimate of malaria incidence in childrenunder five generated by Korenromp (2005) for the WHO. For Africa, these estimates were generatedbased on 22 longitudinal studies from populations with no access to malaria prevention. The studiesdefined malaria as fever with malaria parasitemia on a blood slide. In some countries in southernAfrica, national malaria case notification rates were used. Korenromp (2005) points out that for coun-tries outside of Africa, there were fewer longitudinal studies on which to base the malaria estimates.
A.2 Inference Under Alternative Clustering
For the main results in Table 2, we cluster standard errors at the level of the PSU. The difference-in-differences analysis in columns 4 through 6 uses variation in mean open defecation at the levelof the region-by-year. Therefore, as an alternative to the PSU-level clustering, we present resultsthat clusters standard errors at the geographically more aggregated levels of the region-by-year andregion.
Appendix Table A3 lists p-values for our coefficient estimates for each of the following clusteringalternatives: by PSU (538 clusters), by region × year (50 clusters), and by region (25 clusters). AsCameron and Miller (2015) discuss, standard clustering techniques tend to over-reject the null forsmall numbers of clusters. “Small” is generally considered to be less than 50 (see, e.g., Cameron,Gelbach and Miller, 2008 and Bertrand et al., 2004). Therefore, we follow the Wild Cluster Bootstrapmethodology of Cameron and Miller (2015), which incorporates an asymptotic refinement to addressthis issue.27 The bottom five rows of Appendix Table A3 report a complete set of p-values based onthe three alternative levels of clustering, and include results generated by both standard and WildCluster Bootstrap methods. In 13 of 15 cases, the p-values are ≤ 0.05, and in many cases they are≤ 0.01.
26To the extent that households which defecate in the open are larger than households which practice sanitary fecesdisposal, this will be an underestimate of exposure to fecally transmitted diseases.
27Each of the Wild Cluster Bootstrap calculations in the table is generated by 5000 draws.
34
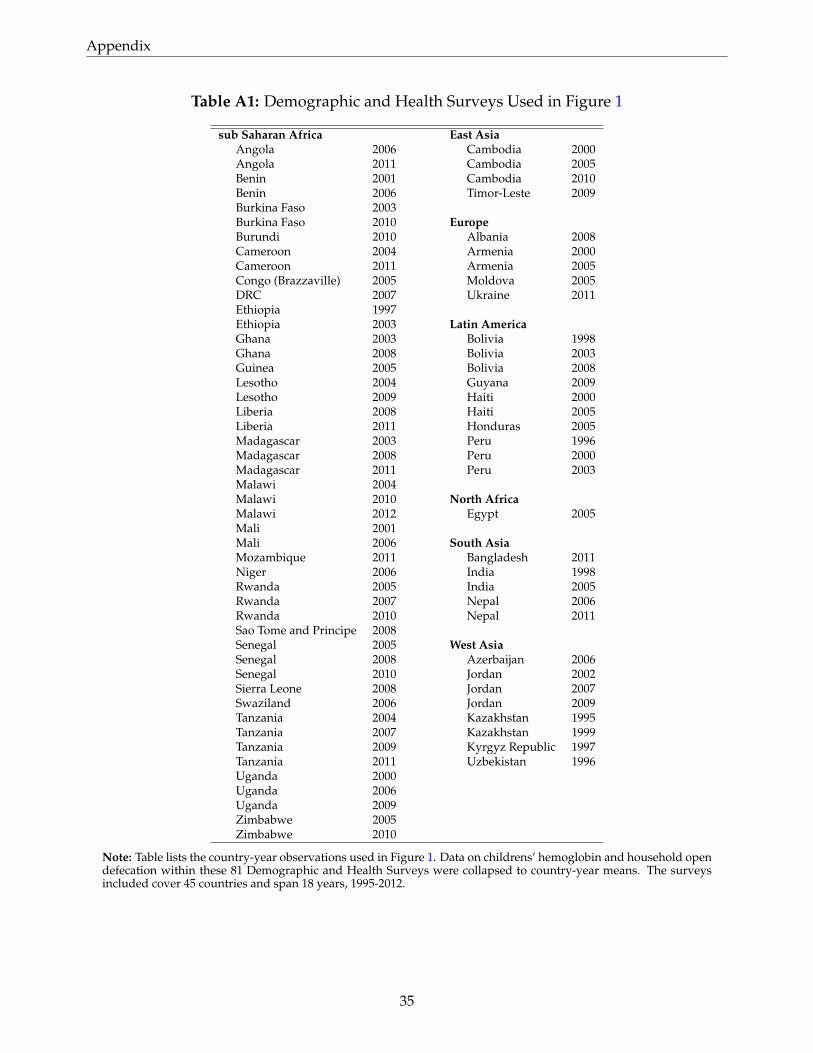
Appendix
Table A1: Demographic and Health Surveys Used in Figure 1
sub Saharan Africa East AsiaAngola 2006 Cambodia 2000Angola 2011 Cambodia 2005Benin 2001 Cambodia 2010Benin 2006 Timor-Leste 2009Burkina Faso 2003Burkina Faso 2010 EuropeBurundi 2010 Albania 2008Cameroon 2004 Armenia 2000Cameroon 2011 Armenia 2005Congo (Brazzaville) 2005 Moldova 2005DRC 2007 Ukraine 2011Ethiopia 1997Ethiopia 2003 Latin AmericaGhana 2003 Bolivia 1998Ghana 2008 Bolivia 2003Guinea 2005 Bolivia 2008Lesotho 2004 Guyana 2009Lesotho 2009 Haiti 2000Liberia 2008 Haiti 2005Liberia 2011 Honduras 2005Madagascar 2003 Peru 1996Madagascar 2008 Peru 2000Madagascar 2011 Peru 2003Malawi 2004Malawi 2010 North AfricaMalawi 2012 Egypt 2005Mali 2001Mali 2006 South AsiaMozambique 2011 Bangladesh 2011Niger 2006 India 1998Rwanda 2005 India 2005Rwanda 2007 Nepal 2006Rwanda 2010 Nepal 2011Sao Tome and Principe 2008Senegal 2005 West AsiaSenegal 2008 Azerbaijan 2006Senegal 2010 Jordan 2002Sierra Leone 2008 Jordan 2007Swaziland 2006 Jordan 2009Tanzania 2004 Kazakhstan 1995Tanzania 2007 Kazakhstan 1999Tanzania 2009 Kyrgyz Republic 1997Tanzania 2011 Uzbekistan 1996Uganda 2000Uganda 2006Uganda 2009Zimbabwe 2005Zimbabwe 2010
Note: Table lists the country-year observations used in Figure 1. Data on childrens’ hemoglobin and household opendefecation within these 81 Demographic and Health Surveys were collapsed to country-year means. The surveysincluded cover 45 countries and span 18 years, 1995-2012.
35
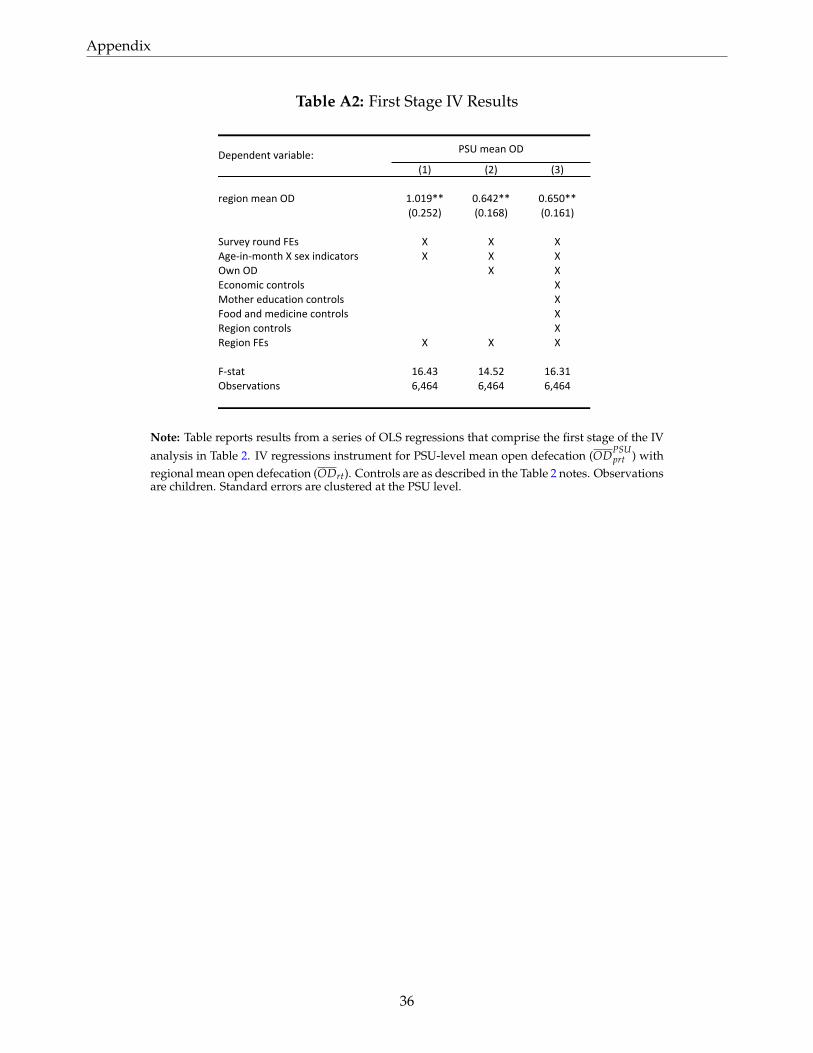
Appendix
Table A2: First Stage IV Results
Dependent variable:(1) (2) (3)
region mean OD 1.019** 0.642** 0.650**(0.252) (0.168) (0.161)
Survey round FEs X X XAge-‐in-‐month X sex indicators X X XOwn OD X XEconomic controls XMother education controls XFood and medicine controls XRegion controls XRegion FEs X X X
F-‐stat 16.43 14.52 16.31Observations 6,464 6,464 6,464
PSU mean OD
Note: Table reports results from a series of OLS regressions that comprise the first stage of the IV
analysis in Table 2. IV regressions instrument for PSU-level mean open defecation (ODPSUprt ) with
regional mean open defecation (ODrt). Controls are as described in the Table 2 notes. Observationsare children. Standard errors are clustered at the PSU level.
36
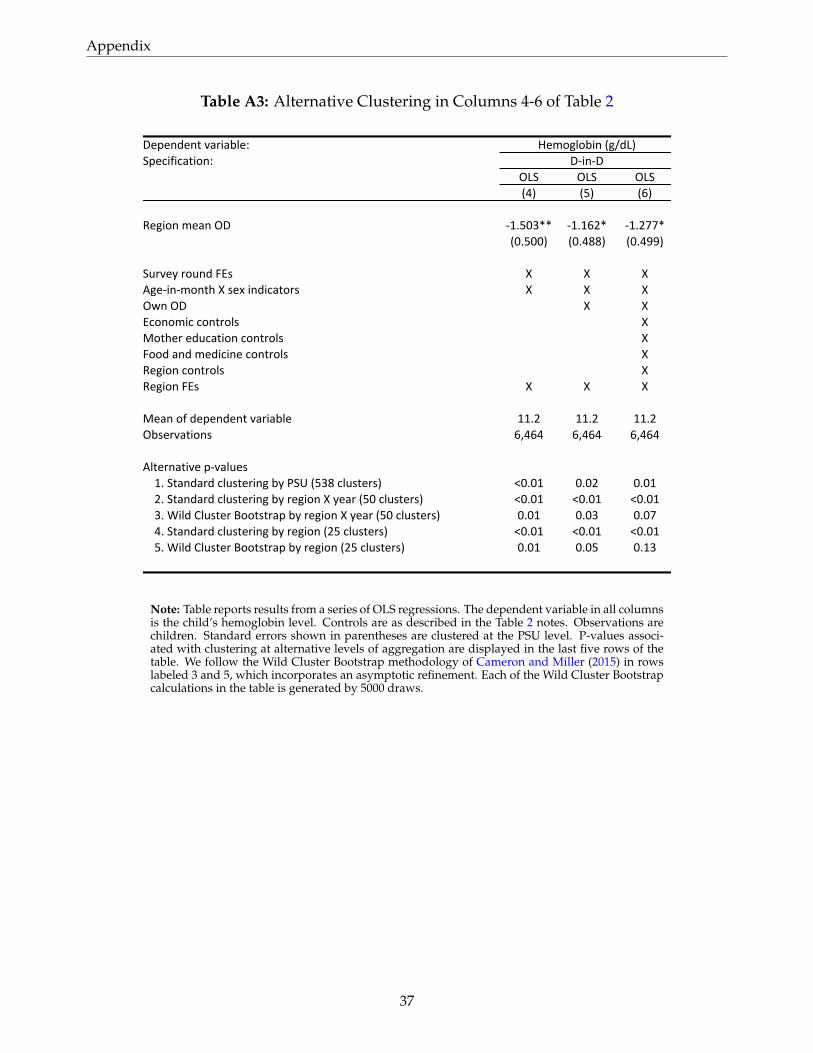
Appendix
Table A3: Alternative Clustering in Columns 4-6 of Table 2
Dependent variable:Specification:
OLS OLS OLS(4) (5) (6)
Region mean OD -‐1.503** -‐1.162* -‐1.277*(0.500) (0.488) (0.499)
Survey round FEs X X XAge-‐in-‐month X sex indicators X X XOwn OD X XEconomic controls XMother education controls XFood and medicine controls XRegion controls XRegion FEs X X X
Mean of dependent variable 11.2 11.2 11.2Observations 6,464 6,464 6,464
Alternative p-‐values1. Standard clustering by PSU (538 clusters) <0.01 0.02 0.012. Standard clustering by region X year (50 clusters) <0.01 <0.01 <0.013. Wild Cluster Bootstrap by region X year (50 clusters) 0.01 0.03 0.074. Standard clustering by region (25 clusters) <0.01 <0.01 <0.015. Wild Cluster Bootstrap by region (25 clusters) 0.01 0.05 0.13
Hemoglobin (g/dL)D-‐in-‐D
Note: Table reports results from a series of OLS regressions. The dependent variable in all columnsis the child’s hemoglobin level. Controls are as described in the Table 2 notes. Observations arechildren. Standard errors shown in parentheses are clustered at the PSU level. P-values associ-ated with clustering at alternative levels of aggregation are displayed in the last five rows of thetable. We follow the Wild Cluster Bootstrap methodology of Cameron and Miller (2015) in rowslabeled 3 and 5, which incorporates an asymptotic refinement. Each of the Wild Cluster Bootstrapcalculations in the table is generated by 5000 draws.
37