Embed Size (px)
Citation preview
35583 NCSD Conference Paper
7/24/01 10:10 AM
Computational Physics and Engineering Division (10)
SAS2D – A Two-Dimensional Depletion Sequence for Characterization of Spent Nuclear Fuel
Mark D. DeHart
Oak Ridge National Laboratory,*
P.O. Box 2008, Oak Ridge, TN 37831-6370
(865) 576-3468
Submitted to the 2001 ANS Embedded Topical Meeting on
Practical Implementation of Nuclear Criticality Safety, November 11–15, 2001,
Reno, Nevada, USA
Organized and Sponsored by the Nuclear Criticality Safety Division of the American Nuclear Society
__________ *Managed bof Energy.
The submitted manuscript has been authored by a contractor of the U.S. government under contract No. DE-AC05-00OR22725. Accordingly, the U.S. Government retains a nonexclusive,royalty-free license to publish or reproduce the published form of this contribution, or allow others to do so, for U.S. Government purposes._______
y UT-Battelle, LLC, under contract DE-AC05-00OR22725 for the U.S. Department
1
SAS2D – A Two-Dimensional Depletion Sequence for Characterization of Spent Nuclear Fuel
Mark D. DeHart
Oak Ridge National Laboratory
P.O. Box 2008 Oak Ridge, TN 37831-6370
(865) 576-3468
Executive Summary
Burnup credit methods require accurate estimation of the isotopic contents of spent nuclear fuel for which some measure of reactivity credit is taken. Many burnup credit analyses performed for storage, transportation and disposal in the U.S. have relied heavily on the SAS2H sequence of SCALE. SAS2H uses an iterative procedure combining XSDRNPM for a one-dimensional (1-D) transport solution and ORIGEN-S for point depletion/decay, and using other SCALE modules for burnup-dependent cross-section processing. The 1-D transport approach and the assumption of a single, uniformly loaded fuel during depletion works remarkably well for homogenous pressurized-water-reactor (PWR) fuel assemblies, based on the results of validation against radiochemical assay measurements. However, for the more complicated assembly designs in boiling-water reactors and the increasingly more complex PWR fuel assemblies, a more rigorous modeling approach is needed, if for no other reason than to validate the simplifications of SAS2H. A new SCALE module, SAS2D, has been developed to provide such capabilities. SAS2D performs a two-dimensional transport solution using NEWT, and allows for the independent depletion of multiple fuel regions. This paper describes the theory and design of SAS2D, shows the results of some benchmark calculations completed to date, and discusses plans for further development and public release of the sequence.
1. Introduction
The objective of burnup credit is simply to take credit for the reduced reactivity of spent nuclear fuel (SNF) in application design. The application can vary – disposal, transportation, and wet or dry storage of irradiated fuel. Although the concept is simple, implementation can be quite challenging. The complexity of many fuel assembly designs makes accurate depletion calculations difficult. Depletion methods used to estimate SNF isotopic inventories, to date, have primarily fallen into two categories: reactor depletion codes, which are not designed for long-term cooling and typically do not track some fission products that become important only with significant cooling time; and one-dimensional (1-D) codes such as the SAS2H sequence in SCALE [1]. Remarkably, the 1-D approach of SAS2H has been shown to produce good results relative to
2
radiochemical assay measurements of pressurized-water-reactor (PWR) fuel samples [2, 3]. This results from the nature of PWR assembly designs, which have historically tended to be relatively uniform and amenable to simple 1-D approximations. Boiling-water-reactor (BWR) assemblies have long been a challenge for 1-D modeling because of burnable poisons, variable pin enrichments, and control blade insertion during operation. With the move toward higher initial enrichments in PWR fuels, the complexity of PWR fuel assembly designs has also increased. Burnable poisons are commonly used in modern PWR designs. Localized poisoning combined with increased average enrichments, result in rapidly changing spectral effects and strongly anisotropic transport; hence, the suitability of 1-D methods for modeling fuel depletion in such designs is increasingly challenged. The Oak Ridge National Laboratory (ORNL) has recently completed the initial development phase of a two-dimensional (2-D) depletion sequence, SAS2D. This sequence uses the 2-D arbitrary geometry, Sn theory code NEWT [4] to provide 2-D fluxes for a user-specified configuration. Depletion calculations are then performed for as many different materials as desired within the assembly configuration using ORIGEN-S [5]. This approach offers several advantages over the 1-D approach: assembly heterogeneities can be explicitly modeled, multiple materials can be depleted simultaneously, and cell-weighting approximations are not necessary. The approach used in the SAS2D sequence is described in the following section, and compared to that of the existing SAS2H sequence.
2. Theory
SAS2D, like its predecessor SAS2H, is a control module within the SCALE code system. SCALE control modules are by nature data management codes, used to invoke various functional models in one or more specific sequences. SCALE functional modules are the computational workhorses of SCALE, each module developed to perform a specific task. The SAS2H control module uses SCALE functional modules BONAMI and NITAWL for cross-section processing and creation of a problem-specific library; XSDRNPM for cell-weighting and cross-section collapse; COUPLE for combining XSDRNPM-updated cross-sections with the default ORIGEN-S cross-section libraries; and ORIGEN-S for depletion calculations. SAS2D implements a similar approach where NEWT is used to provide a transport solution and cross-section collapse in place of XSDRNPM. Since an explicit assembly model is possible in NEWT, no cell weighting procedure is necessary. Limitations in SAS2H result from the use of a 1-D (cylindrical) transport model. Experience has shown that average fluxes across a PWR fuel assembly are well estimated by first calculating a cell-weighted mixture based on a single pin cell, then representing the fuel lattice volume of the assembly with the cell-weighted mixture. This takes two passes in SAS2H: one for creating a pin-cell mixture, a second for using the cell-weighted mixture in an assembly model. The 1-D assembly model can be used to represent assembly heterogeneities, such as water holes and inter-assembly gaps, and to some extent control rods and burnable poisons. However, because this approach relies on
3
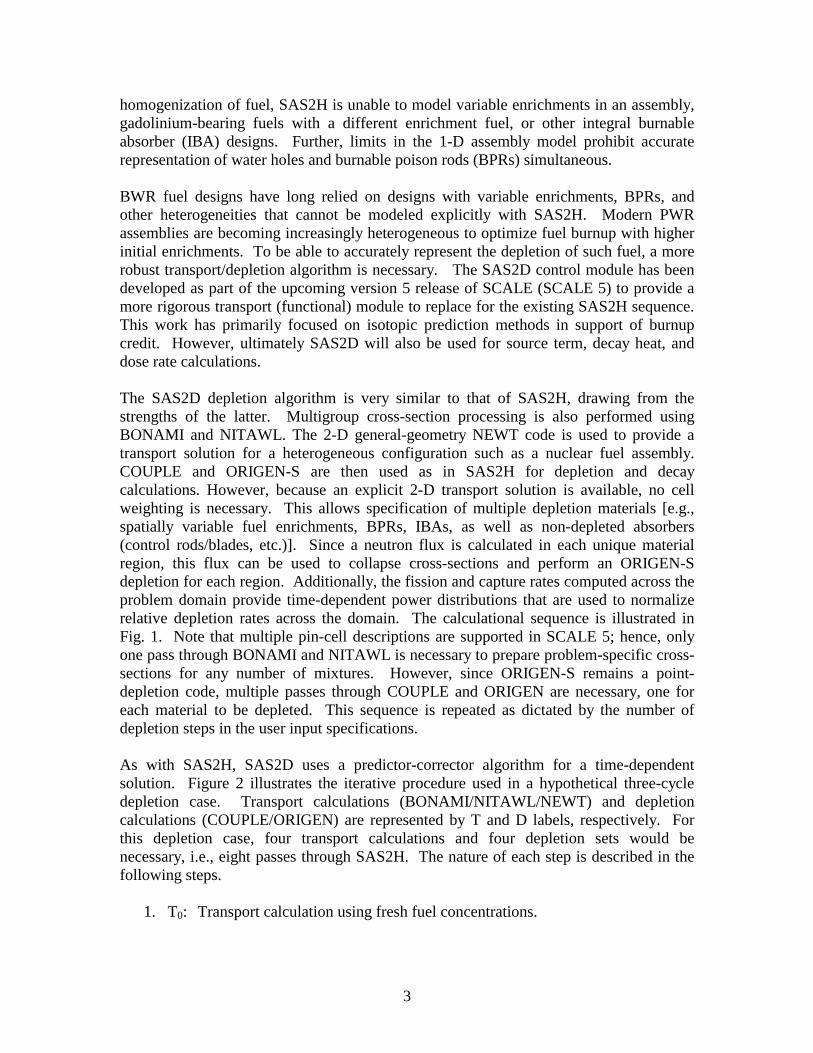
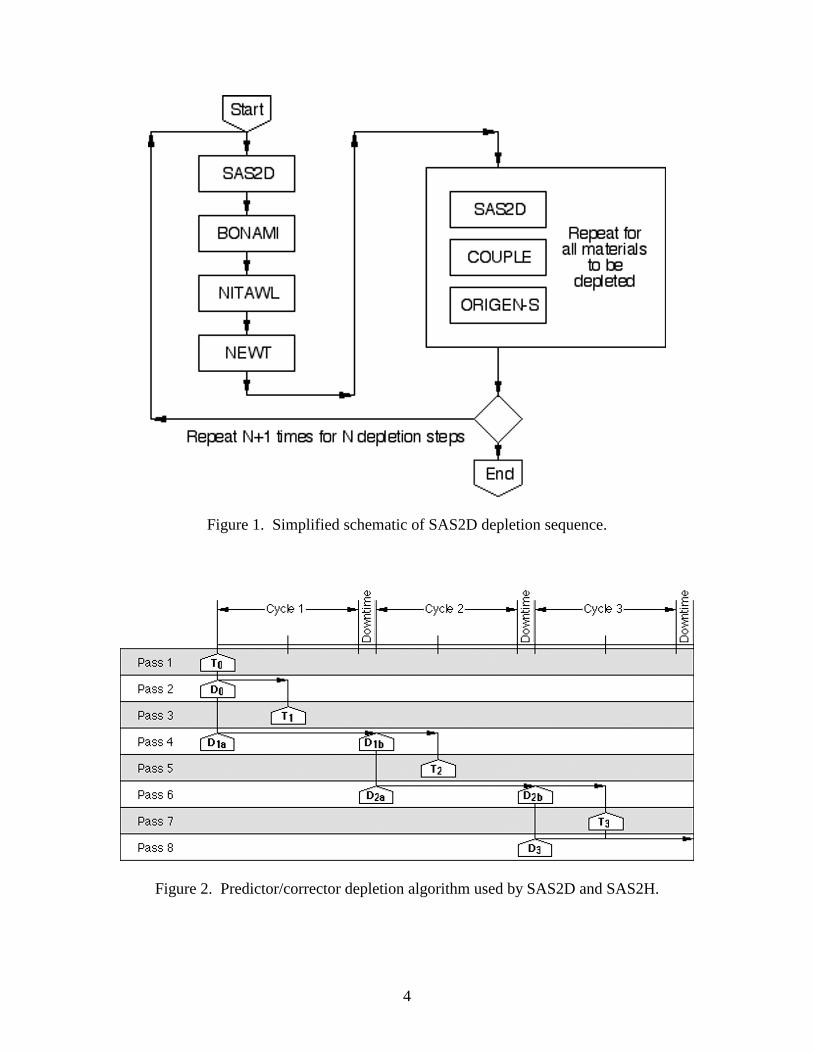
homogenization of fuel, SAS2H is unable to model variable enrichments in an assembly, gadolinium-bearing fuels with a different enrichment fuel, or other integral burnable absorber (IBA) designs. Further, limits in the 1-D assembly model prohibit accurate representation of water holes and burnable poison rods (BPRs) simultaneous. BWR fuel designs have long relied on designs with variable enrichments, BPRs, and other heterogeneities that cannot be modeled explicitly with SAS2H. Modern PWR assemblies are becoming increasingly heterogeneous to optimize fuel burnup with higher initial enrichments. To be able to accurately represent the depletion of such fuel, a more robust transport/depletion algorithm is necessary. The SAS2D control module has been developed as part of the upcoming version 5 release of SCALE (SCALE 5) to provide a more rigorous transport (functional) module to replace for the existing SAS2H sequence. This work has primarily focused on isotopic prediction methods in support of burnup credit. However, ultimately SAS2D will also be used for source term, decay heat, and dose rate calculations. The SAS2D depletion algorithm is very similar to that of SAS2H, drawing from the strengths of the latter. Multigroup cross-section processing is also performed using BONAMI and NITAWL. The 2-D general-geometry NEWT code is used to provide a transport solution for a heterogeneous configuration such as a nuclear fuel assembly. COUPLE and ORIGEN-S are then used as in SAS2H for depletion and decay calculations. However, because an explicit 2-D transport solution is available, no cell weighting is necessary. This allows specification of multiple depletion materials [e.g., spatially variable fuel enrichments, BPRs, IBAs, as well as non-depleted absorbers (control rods/blades, etc.)]. Since a neutron flux is calculated in each unique material region, this flux can be used to collapse cross-sections and perform an ORIGEN-S depletion for each region. Additionally, the fission and capture rates computed across the problem domain provide time-dependent power distributions that are used to normalize relative depletion rates across the domain. The calculational sequence is illustrated in Fig. 1. Note that multiple pin-cell descriptions are supported in SCALE 5; hence, only one pass through BONAMI and NITAWL is necessary to prepare problem-specific cross-sections for any number of mixtures. However, since ORIGEN-S remains a point-depletion code, multiple passes through COUPLE and ORIGEN are necessary, one for each material to be depleted. This sequence is repeated as dictated by the number of depletion steps in the user input specifications. As with SAS2H, SAS2D uses a predictor-corrector algorithm for a time-dependent solution. Figure 2 illustrates the iterative procedure used in a hypothetical three-cycle depletion case. Transport calculations (BONAMI/NITAWL/NEWT) and depletion calculations (COUPLE/ORIGEN) are represented by T and D labels, respectively. For this depletion case, four transport calculations and four depletion sets would be necessary, i.e., eight passes through SAS2H. The nature of each step is described in the following steps.
1. T0: Transport calculation using fresh fuel concentrations.
4
Figure 1. Simplified schematic of SAS2D depletion sequence.
Figure 2. Predictor/corrector depletion algorithm used by SAS2D and SAS2H.
5
2. D0: Depletion calculation, from time zero (initial fuel specification) to mid-point of cycle 1. ORIGEN-S cross sections include those updated based on T0 fluxes.
3. T1: Transport calculation, using concentrations from midpoint of cycle 1 (end of
D0 calculation). 4. D1: Depletion calculation –
a. D1a: Cycle 1 plus subsequent downtime, using cross sections updated based on T1 fluxes,
b. D1b: End of cycle 1 to midpoint of cycle 2, using T1 cross-sections.
5. T2: Transport calculation, using concentrations from midpoint of cycle 2 (end of D1b calculation).
6. D2: Depletion calculation –
a. D2a: Cycle 2 plus subsequent downtime, using cross sections updated based on T2 fluxes.
b. D2b: End of cycle 2 to midpoint of cycle 3, using T2 cross-sections.
7. T3: Transport calculation, using concentrations from midpoint of cycle 3 (end of
D2b calculation). 8. D3: Depletion calculation, cycle 3 plus subsequent downtime, using cross
sections updated based on T3 fluxes. The T0/D0 step is a predictor or bootstrap calculation to estimate cross-sections for using in the subsequent step. Hence, the D1 depletion cycle restarts at time zero, but performs a depletion calculation using updated cross-sections provided by the T1 transport solution. Both D1 and D2 depletion steps are performed in two steps: the first step does the current cycle (1 and 2, respectively) depletion and decay calculations, and provides the isotopics for the beginning of the next cycle; the second step is a predictor step to obtain isotopics for a the successive transport solution. Transport solutions are performed in predictor steps only – the change in cross sections as a function of change in isotopic concentrations is a second order effect, and is sufficient provided that the size of the step is not too large. Historically, SAS2H calculations have demonstrated that a single depletion step per reactor cycle is sufficient for good prediction of PWR isotopics [2, 3], although more recent studies have indicated that perhaps two steps per cycle are warranted. For designs in which concentrations can change rapidly with time (e.g., assemblies with BPRs or IBAs), more timesteps are needed per cycle to capture such effects. SAS2H allowed the user to change the number of libraries per cycle (globally), indicating more frequent
6
cross-section updates steps. SAS2D functions in almost the same way, but allows specification of a variable number of libraries on a cycle-by-cycle basis. This allows one to specify, for example, a finer depletion timestep structure for the first cycle during which BPRs are depleted, but a larger timestep in later cycles, where cross sections change less rapidly with time. The concept of a cycle is consistent with that of SAS2H: in SAS2D a cycle is considered a period of continuous operation at constant power, with an ensuing downtime. When using more than one cross-section update (i.e., library) per cycle, fluxes are recomputed with changing inventories to maintain this constant power. However, in SAS2H all material temperatures and the densities of non-depleted materials remain constant within a cycle, the exception being soluble boron concentration, which is assumed to have a fixed linear letdown form over each cycle. In SAS2D, a timetable input block allows time dependent variation of temperatures and concentration multipliers to be defined for any given set of nuclides or for a whole material. This gives the user the ability to explicitly define boron letdown for each cycle, or to remove or add concentrations to the model, as in the removal of a BPR and replacement with water. Currently, both SAS2D and NEWT exist within the SCALE 5 system now under development at ORNL and will not be publicly available until the release of SCALE 5 in 2002. The sequence is undergoing testing and validation, a portion of which will be described in the following section.
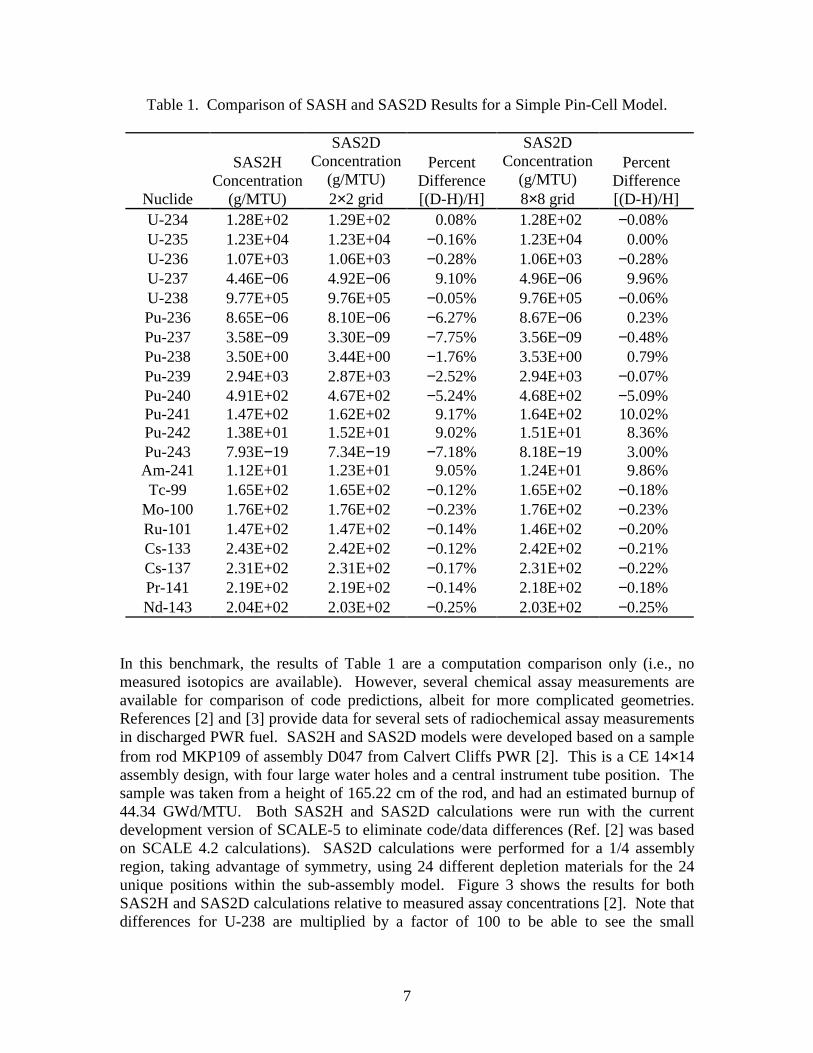
3. Testing Although SAS2D is still evolving, the depletion algorithm has been finalized, and benchmarking calculations are in progress. Studies completed to date have demonstrated good agreement between SAS2H and SAS2D. The first case studied was the depletion of fuel in a simple pin-cell, infinite lattice model for a two-step depletion case with cooling time. Although this is a code-to-code computational benchmark, it requires no geometric approximations in SAS2H, and allows a direct comparison between SAS2H and SAS2D. Table 1 compares nuclide concentrations between SAS2H and SAS2D for this study. The second column gives the results for a NEWT pin-cell model inlaid on a very coarse 2×2 grid, with S4 quadrature, and is followed by the difference in calculated isotopics relative to SAS2H results. The final two columns illustrate the results of calculations repeated with the same pin-cell inlaid on a much more refined 8×8 grid with S8 quadrature. Agreement is significantly improved in the refined model indicating that the combination of a course-grid approximation and low-order quadrature may not be sufficient for depletion modeling. The refined solution still indicates a spectral difference, as indicated by discrepancies in Pu-240, Pu-241, and Am-241 concentrations. The source of the disagreement (SAS2H or SAS2D) is not known and will require more study. Additional sensitivity studies are ongoing to determine transport-modeling requirements for acceptably accurate depletion.
7
Table 1. Comparison of SASH and SAS2D Results for a Simple Pin-Cell Model.
Nuclide
SAS2H Concentration
(g/MTU)
SAS2D Concentration
(g/MTU) 2×2 grid
Percent Difference [(D-H)/H]
SAS2D Concentration
(g/MTU) 8×8 grid
Percent Difference [(D-H)/H]
U-234 1.28E+02 1.29E+02 0.08% 1.28E+02 −0.08% U-235 1.23E+04 1.23E+04 −0.16% 1.23E+04 0.00% U-236 1.07E+03 1.06E+03 −0.28% 1.06E+03 −0.28% U-237 4.46E−06 4.92E−06 9.10% 4.96E−06 9.96% U-238 9.77E+05 9.76E+05 −0.05% 9.76E+05 −0.06% Pu-236 8.65E−06 8.10E−06 −6.27% 8.67E−06 0.23% Pu-237 3.58E−09 3.30E−09 −7.75% 3.56E−09 −0.48% Pu-238 3.50E+00 3.44E+00 −1.76% 3.53E+00 0.79% Pu-239 2.94E+03 2.87E+03 −2.52% 2.94E+03 −0.07% Pu-240 4.91E+02 4.67E+02 −5.24% 4.68E+02 −5.09% Pu-241 1.47E+02 1.62E+02 9.17% 1.64E+02 10.02% Pu-242 1.38E+01 1.52E+01 9.02% 1.51E+01 8.36% Pu-243 7.93E−19 7.34E−19 −7.18% 8.18E−19 3.00% Am-241 1.12E+01 1.23E+01 9.05% 1.24E+01 9.86% Tc-99 1.65E+02 1.65E+02 −0.12% 1.65E+02 −0.18%
Mo-100 1.76E+02 1.76E+02 −0.23% 1.76E+02 −0.23% Ru-101 1.47E+02 1.47E+02 −0.14% 1.46E+02 −0.20% Cs-133 2.43E+02 2.42E+02 −0.12% 2.42E+02 −0.21% Cs-137 2.31E+02 2.31E+02 −0.17% 2.31E+02 −0.22% Pr-141 2.19E+02 2.19E+02 −0.14% 2.18E+02 −0.18% Nd-143 2.04E+02 2.03E+02 −0.25% 2.03E+02 −0.25%
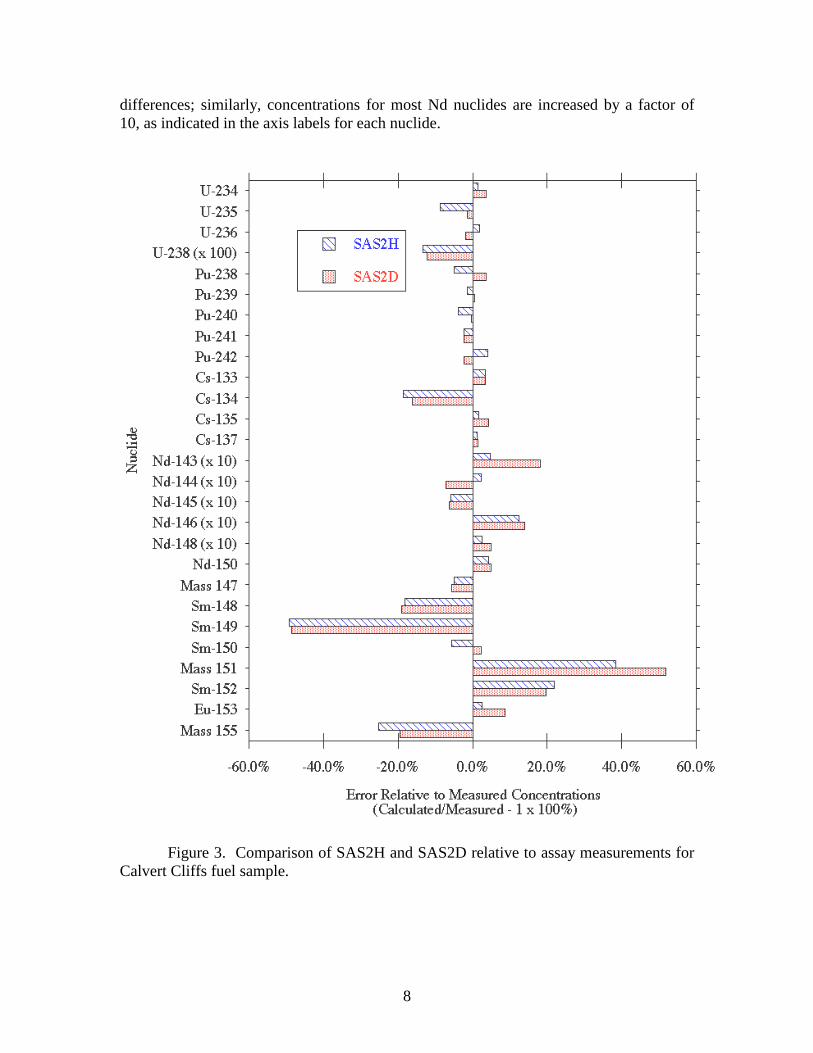
In this benchmark, the results of Table 1 are a computation comparison only (i.e., no measured isotopics are available). However, several chemical assay measurements are available for comparison of code predictions, albeit for more complicated geometries. References [2] and [3] provide data for several sets of radiochemical assay measurements in discharged PWR fuel. SAS2H and SAS2D models were developed based on a sample from rod MKP109 of assembly D047 from Calvert Cliffs PWR [2]. This is a CE 14×14 assembly design, with four large water holes and a central instrument tube position. The sample was taken from a height of 165.22 cm of the rod, and had an estimated burnup of 44.34 GWd/MTU. Both SAS2H and SAS2D calculations were run with the current development version of SCALE-5 to eliminate code/data differences (Ref. [2] was based on SCALE 4.2 calculations). SAS2D calculations were performed for a 1/4 assembly region, taking advantage of symmetry, using 24 different depletion materials for the 24 unique positions within the sub-assembly model. Figure 3 shows the results for both SAS2H and SAS2D calculations relative to measured assay concentrations [2]. Note that differences for U-238 are multiplied by a factor of 100 to be able to see the small
8
differences; similarly, concentrations for most Nd nuclides are increased by a factor of 10, as indicated in the axis labels for each nuclide.
Figure 3. Comparison of SAS2H and SAS2D relative to assay measurements for Calvert Cliffs fuel sample.
9
These results show that SAS2D is in slightly better agreement with measurements than SAS2H for actinides. This is most notable for U-235, which is known to be sensitive to the 1-D approximation of SAS2H. For fission products, the differences are comparable, with neither code showing a distinct predictive advantage over the other. Large errors are seen for certain nuclides with both codes, indicating that these errors are more likely to be the result of measurement or cross-section data errors rather than spectral errors introduced by SAS2H approximations. The most significant aspect of these results is the demonstration of the validity of the simplified SAS2H approach relative to a more detailed depletion of the explicit rod position in the SAS2D model.
4. Conclusion
By its very nature, a 2-D depletion solution requires more computational effort than a 1-D calculation. While studies in progress have indicated that a relatively coarse computational grid is adequate for depletion modeling, additional work is planned to better quantify the sensitivity of depletion calculations to various transport modeling approximations, and work continues to help accelerate convergence in NEWT’s solution algorithm. However, results shown here indicate that for some assembly designs, such as the relatively homogeneous CE 14×14 design, the SAS2H approach provides a rapid and accurate estimate of spent fuel isotopics. Future work will involve the use of SAS2D and SAS2H comparisons to determine those assembly features that can be adequately represented in a 1-D approach. It is possible that SAS2H will be found to be inadequate for increasingly complex modern assembly designs, and that SAS2D will provide an alternative solution for spent fuel characterization. SAS2D has been developed in a modular fashion, for the most part, such that it will be possible to replace the NEWT transport solution with other transport alternatives. Possibilities include KENO V.a for three-dimensional depletion, or even a SAS2H-type depletion sequence option based on XSDRNPM to correct some of the shortcomings of the existing sequence and to allow the older SAS2H module to be retired. The depletion of large numbers of depletion materials, for a number of depletion steps, results in voluminous amounts of output. Various alternatives are being studied to reduce or tailor the amount of information provided in output listings. The OPUS/PlotOPUS [6] post-processing utilities developed for SCALE provide a means for reading ORIGEN-S output files and creating tailored output for specified nuclides in any desired units, and simple plotting of depletion results. SAS2D already produces binary output files in the needed format such that results for individual and combined materials can be easily extracted for other applications. A longer-term project is underway to provide capabilities to perform branch-point calculations, and to create a database of cross-sections that can be read and used by other codes (e.g., diffusion codes for core analysis). Branch-point calculations, combined with depletion calculations will allow creation of burnup-dependent libraries with other branch parameters (i.e., as a function of moderator density, fuel temperature, etc.). Such a capability is desired for modern assembly designs, and for candidate mixed-oxide fuel assemblies, where a more rigorous transport solution may be necessary to accurately characterize low-energy spectral effects.
10
A recent addition to SCALE is the CENTRM code [7], for continuous-energy cross-section weighting in the resolved-resonance energy region. This code will be an alternative to NITAWL in the SCALE cross-section processing scheme. Unlike NITAWL, CENTRM also provides spatial resolution within pin-cells, so that cross-section processing in spatially varying media such as strong burnable absorber rods can be treated rigorously. This capability will be imperative for accurate depletion modeling of assemblies containing such BPRs, and will be included as an option in the SAS2D sequence in the near future. With the release of SAS2D and NEWT in SCALE 5, additional features will be implemented and shortcomings identified as the codes are exercised. Validation work is being performed to ensure that the codes calculate correctly, but user feedback will be necessary to adjust the packages to the needs of the user community.
References
1. O. W. HERMANN and C. V. PARKS, “SAS2H: A Coupled One-Dimensional Depletion and Shielding Analysis Code,” Vol. I, Sect. S2 of SCALE: A Modular Code System for Performing Standardized Computer Analyses for Licensing Evaluation, NUREG/CR-0200, Rev. 6 (ORNL/NUREG/CSD-2/R6), Vols. I, II, and III, May 2000. Available from Radiation Safety Information Computational Center at Oak Ridge National Laboratory as CCC-545.
2. O. W. HERMANN, S. M. BOWMAN, M. C. BRADY, and C. V. PARKs, Validation
of the SCALE System for PWR Spent Fuel Isotopic Composition Analyses, ORNL/TM-12667, Martin Marietta Energy Systems, Inc., Oak Ridge Natl. Lab., March 1995.
3. M. D. DeHART and O. W. HERMANN, An Extension of the Validation of SCALE
(SAS2H) Isotopic Predictions for PWR Spent Fuel, ORNL/TM-13317, Lockheed Martin Energy Research Corp., Oak Ridge Natl. Lab., September 1996.
4. M. D. DeHART, “An Advanced Deterministic Method for Spent-Fuel Criticality
Safety Analysis,” Trans. Am. Nucl. Soc., 78, 170–172 (June 1998). 5. O. W. HERMANN and R. M. WESTFALL, “ORIGEN-S: SCALE System Module
to Calculate Fuel Depletion, Actinide Transmutation, Fission Product Buildup and Decay, and Associated Radiation Source Terms,” Vol. II, Sect. F7 of SCALE: A Modular Code System for Performing Standardized Computer Analyses for Licensing Evaluation, NUREG/CR-0200, Rev. 6 (ORNL/NUREG/CSD-2/R6), Vols. I, II, and III, May 2000. Available from Radiation Safety Information Computational Center at Oak Ridge National Laboratory as CCC-545.

11
6. I. C. GAULD, D. L. BARNETT, O. W. HERMANN, and S. M. BOWMAN, OPUS/PlotOPUS: An ORIGEN-S Post-Processing Utility and Plotting Program for SCALE, NUREG/CR-6718 (ORNL/TM-2001/26), U. S. Nuclear Regulatory Commission, Oak Ridge Natl. Lab., April 2001.
7. M. WILLIAMS and M. ASGARI, “Computation of Continuous-Energy Neutron
Spectra with Discrete Ordinates Transport Theory,” Nucl. Sci. Eng. 121, 173–201 (1995).