Embed Size (px)
Citation preview
SASKATCHEWAN’S OIL AND GAS INDUSTRY
LABOUR DEMAND OUTLOOK 2016 TO 2020
Overview of Saskatchewan’s Oil and Gas Industry 1
Executive Summary 3
Introduction 6
Scope, Methodology and Assumptions 8
Saskatchewan’s Labour Demand to 2020 11
Age-related Attrition and its Impact on Saskatchewan’s Hiring Requirements 12
Labour Demand Projections to 2020 by Sector 14
Oil and Gas Services 15
Conventional E&P 17
Pipelines 19
Industry’s Spending Drives Indirect and Induced Employment 20
Preparing for Sustained Low Oil Prices 21
Mitigating Labour Supply Risks When Activity Resumes 22
Conclusion 23
Appendix 1: PetroLMI’s Labour Market Modelling System Detailed Methodology 24
Appendix 2: Saskatchewan’s Oil and Gas Industry Net Hiring Requirements
to 2020 by Occupation 26
Appendix 3: Glossary 31
Acknowledgments 32
Front cover photo credits Left: Cenovus Energy Right: Enform
This project is funded by the Government of Canada’s Sectoral Initiatives Program and the Government of Saskatchewan through the Ministry of Economy.
OVERVIEW OF SASKATCHEWAN’S OIL AND GAS INDUSTRY
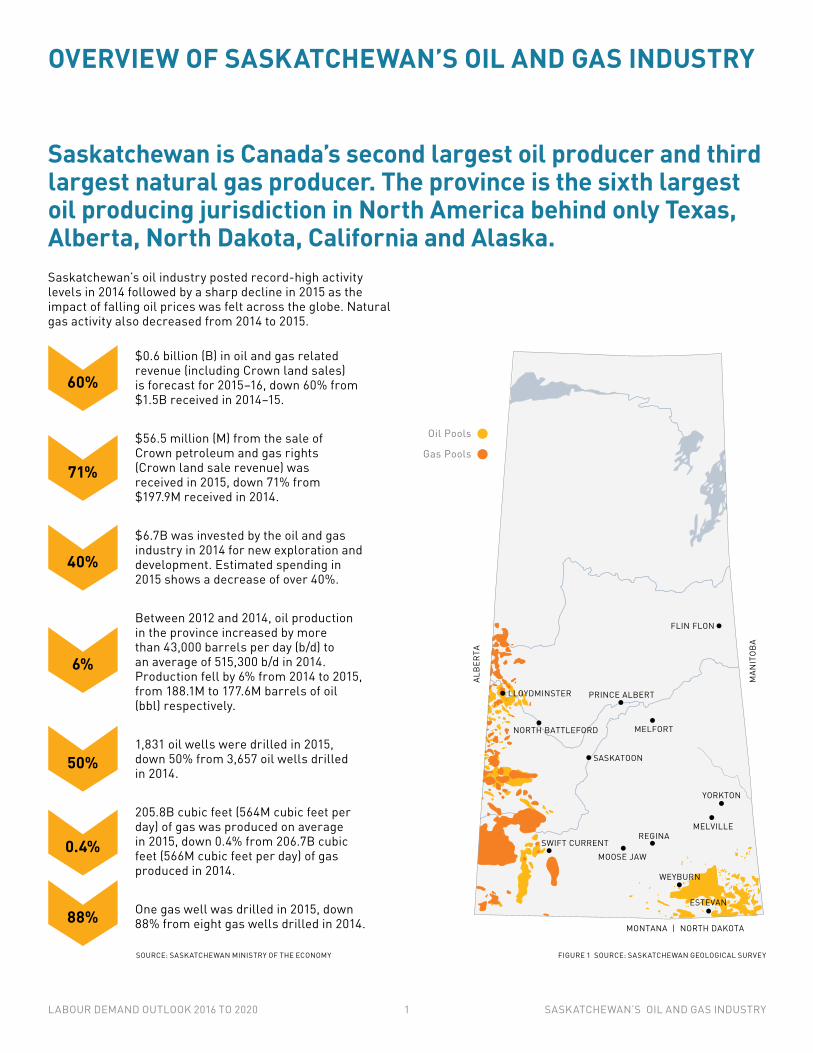
Saskatchewan is Canada’s second largest oil producer and third largest natural gas producer. The province is the sixth largest oil producing jurisdiction in North America behind only Texas, Alberta, North Dakota, California and Alaska.
$0.6 billion (B) in oil and gas related revenue (including Crown land sales) is forecast for 2015–16, down 60% from $1.5B received in 2014–15.
$56.5 million (M) from the sale of Crown petroleum and gas rights (Crown land sale revenue) was received in 2015, down 71% from $197.9M received in 2014.
$6.7B was invested by the oil and gas industry in 2014 for new exploration and development. Estimated spending in 2015 shows a decrease of over 40%.
Between 2012 and 2014, oil production in the province increased by more than 43,000 barrels per day (b/d) to an average of 515,300 b/d in 2014. Production fell by 6% from 2014 to 2015, from 188.1M to 177.6M barrels of oil (bbl) respectively.
1,831 oil wells were drilled in 2015, down 50% from 3,657 oil wells drilled in 2014.
205.8B cubic feet (564M cubic feet per day) of gas was produced on average in 2015, down 0.4% from 206.7B cubic feet (566M cubic feet per day) of gas produced in 2014.
One gas well was drilled in 2015, down 88% from eight gas wells drilled in 2014.
SOURCE: SASKATCHEWAN MINISTRY OF THE ECONOMY
ALB
ERTA
MAN
ITOB
A
MONTANA | NORTH DAKOTA
LLOYDMINSTER
NORTH BATTLEFORD
PRINCE ALBERT
FLIN FLON
MELFORT
SASKATOON
YORKTON
MELVILLEREGINA
MOOSE JAWSWIFT CURRENT
WEYBURN
ESTEVAN
Oil Pools
Gas Pools
6%
50%
0.4%
88%
Saskatchewan’s oil industry posted record-high activity levels in 2014 followed by a sharp decline in 2015 as the impact of falling oil prices was felt across the globe. Natural gas activity also decreased from 2014 to 2015.
FIGURE 1 SOURCE: SASKATCHEWAN GEOLOGICAL SURVEY
60%
71%
40%
LABOUR DEMAND OUTLOOK 2016 TO 2020 1 SASKATCHEWAN’S OIL AND GAS INDUSTRY
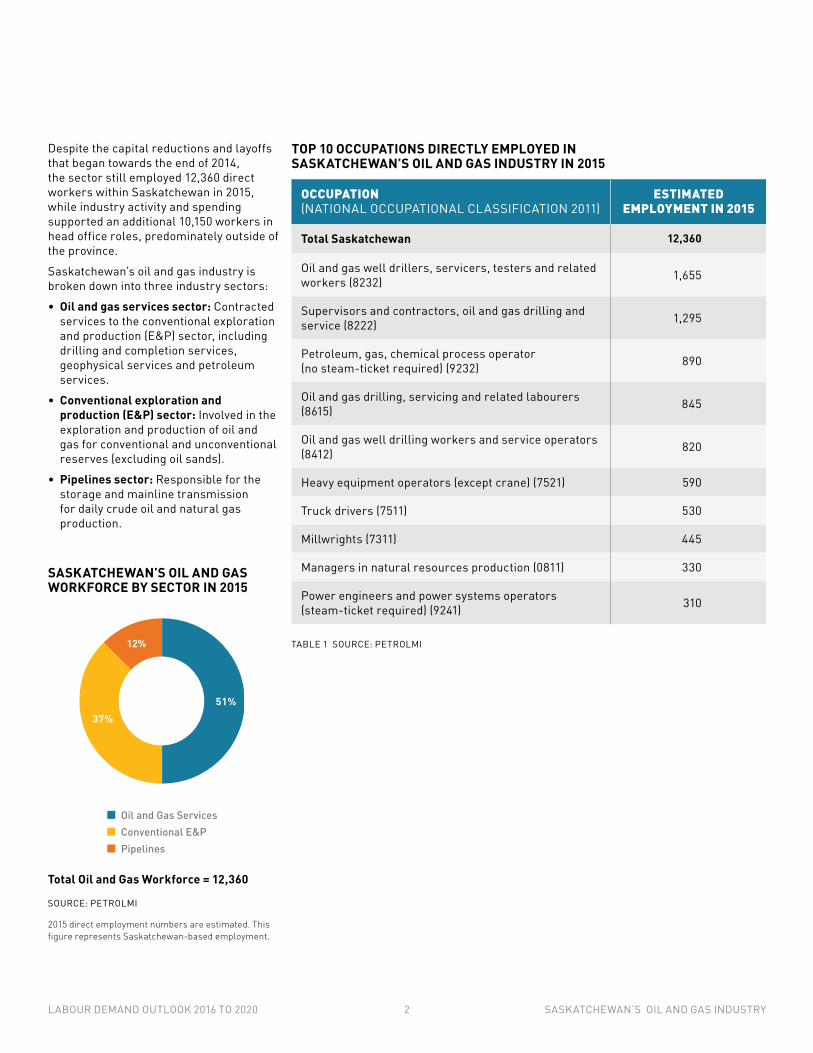
Despite the capital reductions and layoffs that began towards the end of 2014, the sector still employed 12,360 direct workers within Saskatchewan in 2015, while industry activity and spending supported an additional 10,150 workers in head office roles, predominately outside of the province.
Saskatchewan’s oil and gas industry is broken down into three industry sectors:
• Oil and gas services sector: Contracted services to the conventional exploration and production (E&P) sector, including drilling and completion services, geophysical services and petroleum services.
• Conventional exploration and production (E&P) sector: Involved in the exploration and production of oil and gas for conventional and unconventional reserves (excluding oil sands).
• Pipelines sector: Responsible for the storage and mainline transmission for daily crude oil and natural gas production.
OCCUPATION (NATIONAL OCCUPATIONAL CLASSIFICATION 2011)
ESTIMATED EMPLOYMENT IN 2015
Total Saskatchewan 12,360
Oil and gas well drillers, servicers, testers and related workers (8232) 1,655
Supervisors and contractors, oil and gas drilling and service (8222) 1,295
Petroleum, gas, chemical process operator (no steam-ticket required) (9232) 890
Oil and gas drilling, servicing and related labourers (8615) 845
Oil and gas well drilling workers and service operators (8412) 820
Heavy equipment operators (except crane) (7521) 590
Truck drivers (7511) 530
Millwrights (7311) 445
Managers in natural resources production (0811) 330
Power engineers and power systems operators (steam-ticket required) (9241) 310
TOP 10 OCCUPATIONS DIRECTLY EMPLOYED IN SASKATCHEWAN’S OIL AND GAS INDUSTRY IN 2015
TABLE 1 SOURCE: PETROLMI
SASKATCHEWAN’S OIL AND GAS WORKFORCE BY SECTOR IN 2015
Total Oil and Gas Workforce = 12,360
Oil and Gas ServicesConventional E&PPipelines
51%37%
12%
SOURCE: PETROLMI
2015 direct employment numbers are estimated. This figure represents Saskatchewan-based employment.
LABOUR DEMAND OUTLOOK 2016 TO 2020 2 SASKATCHEWAN’S OIL AND GAS INDUSTRY
EXECUTIVE SUMMARY
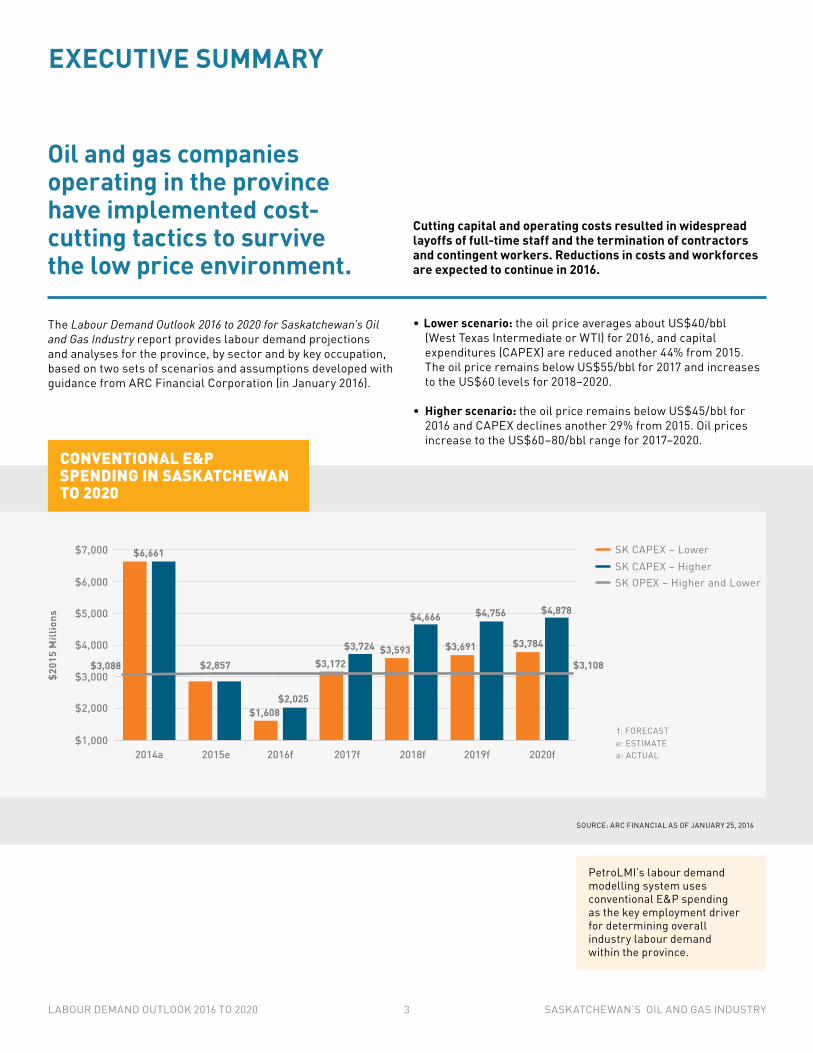
Oil and gas companies operating in the province have implemented cost- cutting tactics to survive the low price environment.
Cutting capital and operating costs resulted in widespread layoffs of full-time staff and the termination of contractors and contingent workers. Reductions in costs and workforces are expected to continue in 2016.
$1,000
$2,000
$5,000
$4,000
$3,000
$6,000
$7,000
$201
5 M
illio
ns
2014a 2015e 2016f 2017f 2018f 2019f 2020f
f: FORECASTe: ESTIMATEa: ACTUAL
SK CAPEX – HigherSK CAPEX – Lower
SK OPEX – Higher and Lower
$3,108
$4,878
$3,784
$4,756
$3,691
$4,666
$3,593$3,724$3,172
$2,025$1,608
$2,857$3,088
$6,661
CONVENTIONAL E&P SPENDING IN SASKATCHEWAN TO 2020
SOURCE: ARC FINANCIAL AS OF JANUARY 25, 2016
The Labour Demand Outlook 2016 to 2020 for Saskatchewan’s Oil and Gas Industry report provides labour demand projections and analyses for the province, by sector and by key occupation, based on two sets of scenarios and assumptions developed with guidance from ARC Financial Corporation (in January 2016).
• Lower scenario: the oil price averages about US$40/bbl (West Texas Intermediate or WTI) for 2016, and capital expenditures (CAPEX) are reduced another 44% from 2015. The oil price remains below US$55/bbl for 2017 and increases to the US$60 levels for 2018–2020.
• Higher scenario: the oil price remains below US$45/bbl for 2016 and CAPEX declines another 29% from 2015. Oil prices increase to the US$60–80/bbl range for 2017–2020.
PetroLMI’s labour demand modelling system uses conventional E&P spending as the key employment driver for determining overall industry labour demand within the province.
LABOUR DEMAND OUTLOOK 2016 TO 2020 3 SASKATCHEWAN’S OIL AND GAS INDUSTRY
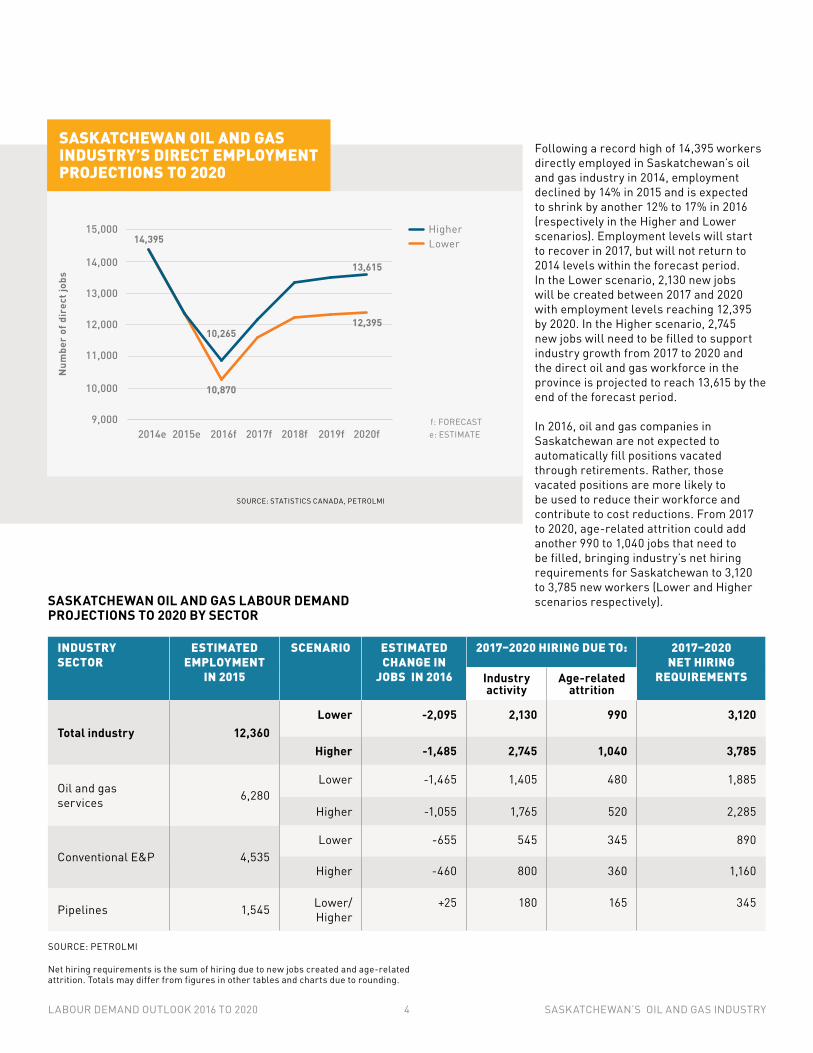
Following a record high of 14,395 workers directly employed in Saskatchewan’s oil and gas industry in 2014, employment declined by 14% in 2015 and is expected to shrink by another 12% to 17% in 2016 (respectively in the Higher and Lower scenarios). Employment levels will start to recover in 2017, but will not return to 2014 levels within the forecast period. In the Lower scenario, 2,130 new jobs will be created between 2017 and 2020 with employment levels reaching 12,395 by 2020. In the Higher scenario, 2,745 new jobs will need to be filled to support industry growth from 2017 to 2020 and the direct oil and gas workforce in the province is projected to reach 13,615 by the end of the forecast period.
In 2016, oil and gas companies in Saskatchewan are not expected to automatically fill positions vacated through retirements. Rather, those vacated positions are more likely to be used to reduce their workforce and contribute to cost reductions. From 2017 to 2020, age-related attrition could add another 990 to 1,040 jobs that need to be filled, bringing industry’s net hiring requirements for Saskatchewan to 3,120 to 3,785 new workers (Lower and Higher scenarios respectively).
9,000
15,000
14,000
13,000
12,000
11,000
10,000
Num
ber
of d
irec
t job
s
2020f2019f2018f2017f2016f2014e 2015e
Higher
f: FORECASTe: ESTIMATE
Lower14,395
10,265
10,870
13,615
12,395
SASKATCHEWAN OIL AND GAS INDUSTRY’S DIRECT EMPLOYMENT PROJECTIONS TO 2020
SOURCE: STATISTICS CANADA, PETROLMI
SASKATCHEWAN OIL AND GAS LABOUR DEMAND PROJECTIONS TO 2020 BY SECTOR
SOURCE: PETROLMI
Net hiring requirements is the sum of hiring due to new jobs created and age-related attrition. Totals may differ from figures in other tables and charts due to rounding.
INDUSTRY SECTOR
ESTIMATED EMPLOYMENT
IN 2015
SCENARIO ESTIMATED CHANGE IN
JOBS IN 2016
2017–2020 HIRING DUE TO: 2017–2020 NET HIRING
REQUIREMENTSIndustry activity
Age-related attrition
Total industry 12,360Lower -2,095 2,130 990 3,120
Higher -1,485 2,745 1,040 3,785
Oil and gas services 6,280
Lower -1,465 1,405 480 1,885
Higher -1,055 1,765 520 2,285
Conventional E&P 4,535Lower -655 545 345 890
Higher -460 800 360 1,160
Pipelines 1,545 Lower/Higher
+25 180 165 345
LABOUR DEMAND OUTLOOK 2016 TO 2020 4 SASKATCHEWAN’S OIL AND GAS INDUSTRY

The oil and gas services sector will continue to be the industry’s largest employer in the province. The majority of the sector’s net hiring requirements to 2020 (1,885 to 2,285, Lower and Higher scenarios respectively) will be for new jobs created to support industry growth. However, oil and gas service companies may be challenged to attract back the workers lost during the current downturn, as well as hire and retain new entrants to the industry.
The conventional E&P sector is the industry’s second largest employer. As industry activity starts to recover in 2017 through to 2020, the sector will need to fill 890 to 1,160 job openings (respectively in the Lower and Higher scenarios) to support both industry expansion, as well as to replace retiring workers. With age-related attrition accounting for almost 40% of net hiring requirements, conventional E&P companies will be challenged to retain, develop and attract skilled and experienced workers to meet workforce needs.
Like the conventional E&P sector, demographics are a potential risk for Saskatchewan’s pipeline sector as almost half of projected net hiring between 2017 and 2020 will be due to age-related attrition (165 out of 345 jobs). Pipeline operators, operations supervisors and engineering managers, in particular, may be more challenging to recruit as these occupations are often located in smaller, rural communities.
“ Government is community friendly and committed to creating a standard of living that stimulates investments, jobs and lifestyles. It’s a great place to do business.”Neil SmithChief Operating OfficerCrescent Point Energy Industry consultations, January 2016
Three themes emerged from industry consultations:
• The industry continues to view Saskatchewan as an attractive and stable business environment with competitive royalties and corporate taxes, quality oil reserves and year-round access to oil leases.
• Technology is playing a critical role in development and productivity gains.
• Saskatchewan’s workforce is an important skilled and locally available source of labour for future growth.
While oil and gas services occupations, such as drillers, servicers and operators, are expected to add the most jobs due to increased activity levels beginning in 2017, many managerial, trades and key operational roles, such as power engineers and process operators, are projected to see high rates of retirements. Loss of technical experience in the industry, therefore, may be a risk at a time when operational expertise is needed to drive cost-saving operational efficiencies.
Overall, the oil and gas industry is likely to need fewer workers to do the same amount of work due to a renewed focus on productivity improvements. Nevertheless, Saskatchewan’s oil and gas industry will need to reinvigorate its focus on increasing labour force participation once activity increases by:
• Increasing participation of under-represented groups, such as Aboriginal people
• Developing the labour force so that skills and qualifications match those required by industry
• Attracting and retaining workers from outside of the province
To that end, the industry will want to identify and promote a value proposition for workers that goes beyond compensation; it will benefit from emphasizing a creative work environment in which employees derive career satisfaction from engaging in the success of the company and solving technical, environment and social issues through implementation of innovative processes and technology solutions.
LABOUR DEMAND OUTLOOK 2016 TO 2020 5 SASKATCHEWAN’S OIL AND GAS INDUSTRY
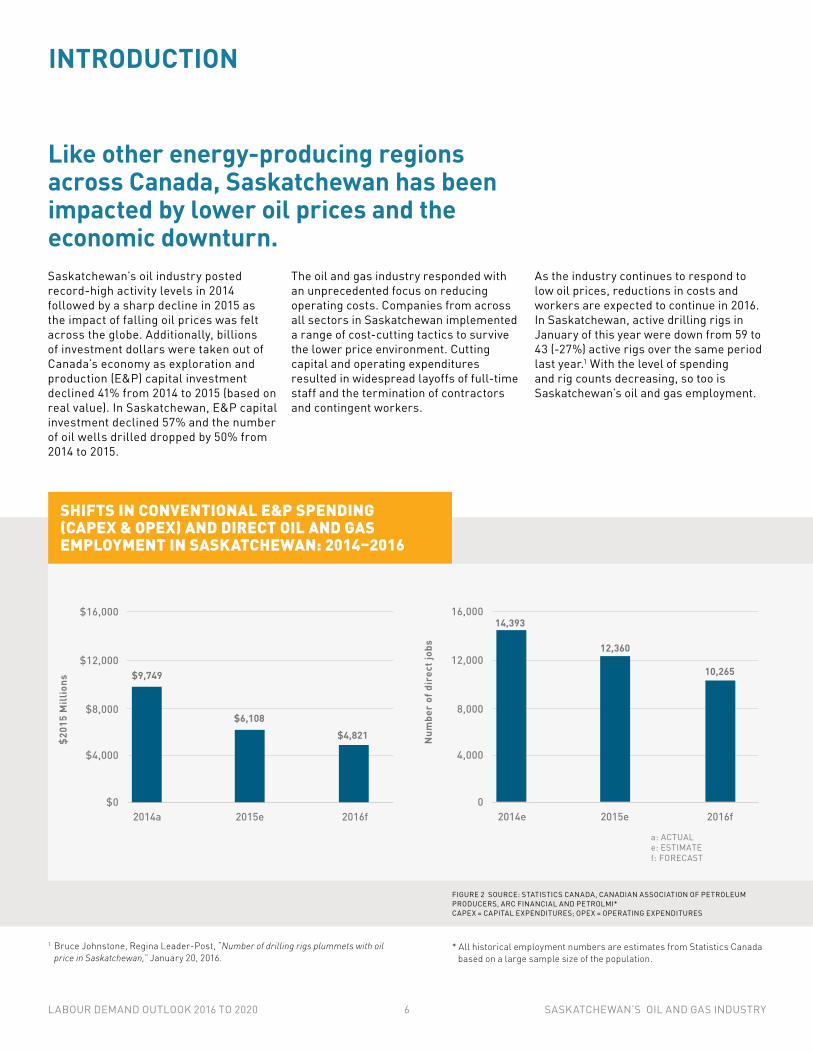
Like other energy-producing regions across Canada, Saskatchewan has been impacted by lower oil prices and the economic downturn.
INTRODUCTION
Saskatchewan’s oil industry posted record-high activity levels in 2014 followed by a sharp decline in 2015 as the impact of falling oil prices was felt across the globe. Additionally, billions of investment dollars were taken out of Canada’s economy as exploration and production (E&P) capital investment declined 41% from 2014 to 2015 (based on real value). In Saskatchewan, E&P capital investment declined 57% and the number of oil wells drilled dropped by 50% from 2014 to 2015.
1 Bruce Johnstone, Regina Leader-Post, “Number of drilling rigs plummets with oil price in Saskatchewan,” January 20, 2016.
* All historical employment numbers are estimates from Statistics Canada based on a large sample size of the population.
SHIFTS IN CONVENTIONAL E&P SPENDING (CAPEX & OPEX) AND DIRECT OIL AND GAS EMPLOYMENT IN SASKATCHEWAN: 2014–2016
$0
$4,000
$16,000
$12,000
$8,000
$201
5 M
illio
ns
2016f2015e2014a
$9,749
$6,108$4,821 N
umbe
r of
dir
ect j
obs
14,393
12,360
10,265
a: ACTUAL e: ESTIMATEf: FORECAST
0
4,000
16,000
12,000
8,000
2016f2015e2014e
FIGURE 2 SOURCE: STATISTICS CANADA, CANADIAN ASSOCIATION OF PETROLEUM PRODUCERS, ARC FINANCIAL AND PETROLMI* CAPEX = CAPITAL EXPENDITURES; OPEX = OPERATING EXPENDITURES
The oil and gas industry responded with an unprecedented focus on reducing operating costs. Companies from across all sectors in Saskatchewan implemented a range of cost-cutting tactics to survive the lower price environment. Cutting capital and operating expenditures resulted in widespread layoffs of full-time staff and the termination of contractors and contingent workers.
As the industry continues to respond to low oil prices, reductions in costs and workers are expected to continue in 2016. In Saskatchewan, active drilling rigs in January of this year were down from 59 to 43 (-27%) active rigs over the same period last year.1 With the level of spending and rig counts decreasing, so too is Saskatchewan’s oil and gas employment.
LABOUR DEMAND OUTLOOK 2016 TO 2020 6 SASKATCHEWAN’S OIL AND GAS INDUSTRY

FOCUS ON PRODUCTIVITYCompanies in all sectors of the industry have focused on productivity improvements to return to profitability. Conventional E&P companies are partnering with services companies to achieve technology and work process improvements.
Drilling firms are working to right-size their fleets by retiring older equipment and adding more technologically advanced rigs that could reduce drilling time and provide a competitive advantage.
Companies are striving for organizational efficiency by restructuring work processes such as scheduling and work arrangements, and reducing other employee-related costs. The intention is to strike a balance between doing more with fewer workers and retaining skilled workers. These efforts have included:
• Introducing wage freezes and cuts
• Implementing shorter work weeks to preserve more jobs
• Reducting of benefits, bonuses and other perks
• Increasing the use of job sharing and unpaid leaves
• Limiting travel and use of rotational workers
In spite of the low oil price environment, three positive themes have emerged from industry consultations:
• The oil and gas industry continues to view Saskatchewan as an attractive and stable business environment2 with competitive royalties and corporate taxes, quality oil reserves and year-round access to oil leases.
• Technology is playing a critical role in development and productivity gains and will be key to producing oil more efficiently while reducing the industry’s carbon footprint.3
• Saskatchewan’s workforce has a long history of working in the oil industry and is an important skilled and locally available source of labour for future growth.
PetroLMI’s labour market outlooks are intended to provide industry, governments, education and training institutions quantitative and qualitative analyses to assist with workforce planning, and program and policy development. This Labour Demand Outlook 2016 to 2020 for Saskatchewan’s Oil and Gas Industry report provides labour demand projections for the province, by sector and by key occupation, and also examines the impact of shifting oil prices and industry spending on activity and workforce levels in Saskatchewan. Consultations with industry representatives contributed to the insights and analysis offered in this report.
Research found that oil and gas companies of all sizes continue to test innovative approaches to enhance oil production and operational efficiencies and seek growth opportunities in Saskatchewan. Companies are partnering with the Saskatchewan government to explore new technologies in order to produce oil more efficiently while at the same time reduce the impact on the environment. Enhanced oil recovery, as one example, is a method to extract more heavy oil out of older fields. In Saskatchewan, enhanced oil recovery techniques include pumping carbon dioxide (CO2) and/or water into existing wells to flush the residual oil from rock formations.
At the same time, Saskatchewan is viewed as a low-risk environment for the oil industry in Canada. E&P companies are committed to long-term working arrangements with service contractors in the province. These oil and gas companies are also able to draw on a larger local workforce than other energy-producing regions of Canada due to the proximity of their operations to farming communities. The combination of attractive salaries and proximity to home has created a workforce with a strong work ethic that is aligned with industry’s expectations.
“Saskatchewan’s royalty framework continues to be attractive in supporting investment compared to other provinces.”Gary Leach,Executive Director,Explorers and Producers Association of CanadaIndustry consultations, January 2016
Saskatchewan is home to one of the first research projects on CO2 sequestration, which is managed by the Petroleum Technology Research Centre (PTRC) in Regina.
Canada’s largest CO2 enhanced recovery operation and the world’s largest geological greenhouse gas sequestration project is located in Weyburn, Saskatchewan.4
CO2 recovery has largely been made possible by the availability of pure CO2 delivered by pipeline to oil fields in Saskatchewan from the United States. In addition, Saskatchewan has recently become a supplier of CO2 through the Estevan Boundary Dam Power Station owned by SaskPower.
2 A recent employer survey found that 66% of respondents felt the provincial government was creating a competitive and attractive environment for business. Saskatchewan Chamber of Commerce, “2016 Economic Outlook Survey,” January 2016.
3 Cenovus Energy, “Technology at Cenovus,” http://www.cenovus.com/technology/index.html, (Accessed February 18, 2016).
4 Cenovus Energy: Weyburn Project Overview, “Increasing oil production and reducing greenhouse gas emissions,” http://www.cenovus.com/operations/docs/Weyburn-Facility-Profile.pdf (Accessed February 11, 2016).
LABOUR DEMAND OUTLOOK 2016 TO 2020 7 SASKATCHEWAN’S OIL AND GAS INDUSTRY
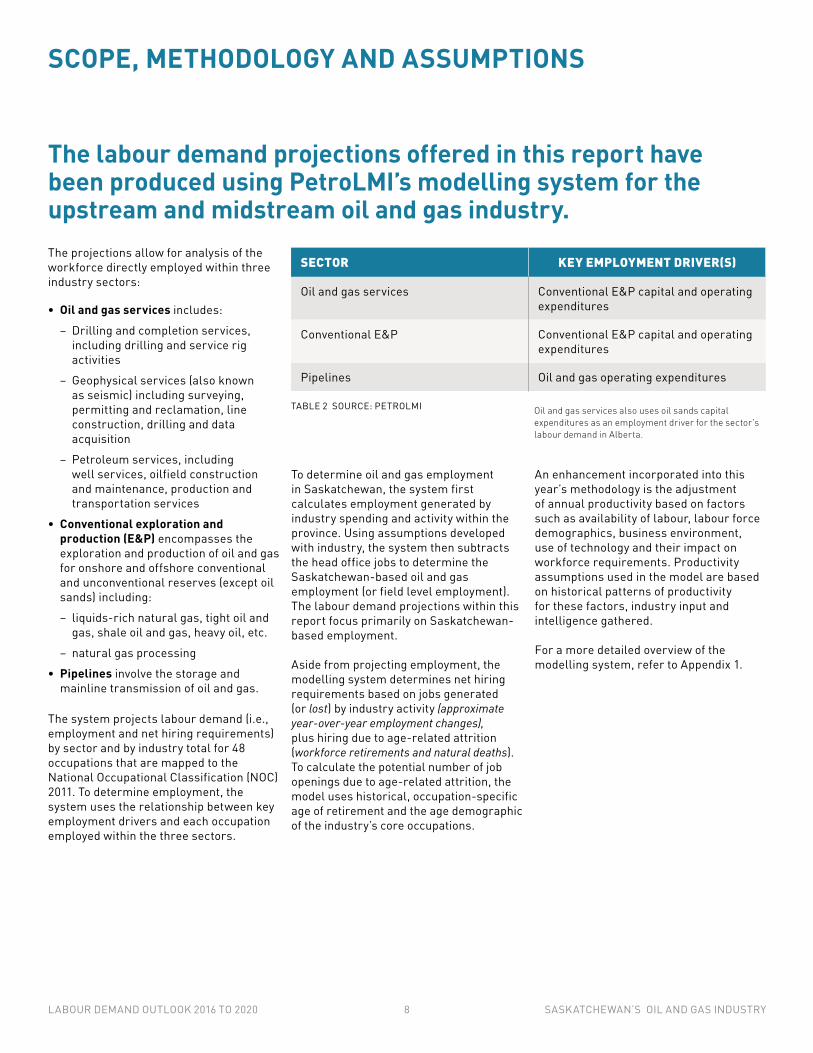
The projections allow for analysis of the workforce directly employed within three industry sectors:
• Oil and gas services includes:
– Drilling and completion services, including drilling and service rig activities
– Geophysical services (also known as seismic) including surveying, permitting and reclamation, line construction, drilling and data acquisition
– Petroleum services, including well services, oilfield construction and maintenance, production and transportation services
• Conventional exploration and production (E&P) encompasses the exploration and production of oil and gas for onshore and offshore conventional and unconventional reserves (except oil sands) including:
– liquids-rich natural gas, tight oil and gas, shale oil and gas, heavy oil, etc.
– natural gas processing
• Pipelines involve the storage and mainline transmission of oil and gas.
The system projects labour demand (i.e., employment and net hiring requirements) by sector and by industry total for 48 occupations that are mapped to the National Occupational Classification (NOC) 2011. To determine employment, the system uses the relationship between key employment drivers and each occupation employed within the three sectors.
SCOPE, METHODOLOGY AND ASSUMPTIONS
The labour demand projections offered in this report have been produced using PetroLMI’s modelling system for the upstream and midstream oil and gas industry.
SECTOR KEY EMPLOYMENT DRIVER(S)
Oil and gas services Conventional E&P capital and operating expenditures
Conventional E&P Conventional E&P capital and operating expenditures
Pipelines Oil and gas operating expenditures
To determine oil and gas employment in Saskatchewan, the system first calculates employment generated by industry spending and activity within the province. Using assumptions developed with industry, the system then subtracts the head office jobs to determine the Saskatchewan-based oil and gas employment (or field level employment). The labour demand projections within this report focus primarily on Saskatchewan-based employment.
Aside from projecting employment, the modelling system determines net hiring requirements based on jobs generated (or lost) by industry activity (approximate year-over-year employment changes), plus hiring due to age-related attrition (workforce retirements and natural deaths). To calculate the potential number of job openings due to age-related attrition, the model uses historical, occupation-specific age of retirement and the age demographic of the industry’s core occupations.
An enhancement incorporated into this year’s methodology is the adjustment of annual productivity based on factors such as availability of labour, labour force demographics, business environment, use of technology and their impact on workforce requirements. Productivity assumptions used in the model are based on historical patterns of productivity for these factors, industry input and intelligence gathered.
For a more detailed overview of the modelling system, refer to Appendix 1.
Oil and gas services also uses oil sands capital expenditures as an employment driver for the sector's labour demand in Alberta.
TABLE 2 SOURCE: PETROLMI
LABOUR DEMAND OUTLOOK 2016 TO 2020 8 SASKATCHEWAN’S OIL AND GAS INDUSTRY

From December 2015 to February 2016, PetroLMI conducted a series of consultations with industry associations and companies as well as select government and training agencies to help validate the expenditure forecasts, labour demand projections, key findings and analyses contained in this report. PetroLMI consulted with the Canadian Association of Petroleum Producers (CAPP), Petroleum Services Association of Canada (PSAC), Explorers and Producers Association of Canada (EPAC) and representatives from four oil and gas companies operating in Saskatchewan.
This report is accompanied by three additional reports:
• Oil Sands Construction, Operations and Maintenance Labour Demand Outlook to 2020 (released February 2016) analyzes the impact on oil sands construction, operations and maintenance workforce requirements as the sector shifts from a phase of significant expansion to one focused on operational efficiency and reliability.
• Labour Market Outlook 2016 to 2020 for Canada’s Oil and Gas Industry (released April 2016) presents employment projections for exploration and production, oil sands, oil and gas services and pipelines by operating area. This report examines the shift in employment between 2014 and 2015 and using two scenarios, presents workforce needs for 2016 to 2020. This report also includes labour supply projections at a national level.
• Exploring LNG in Canada: Workforce Requirements for Developing and Sustaining Canada’s Liquefied Natural Gas Sector (released April 2016) explores the conditions needed for an LNG sector to progress in Canada, including the workforce required to support it, should one or more affirmative investment decisions be reached by 2020.
UNDERSTANDING THE OIL AND GAS INDUSTRY’S LABOUR REQUIREMENTS TO 2020The Labour Demand Outlook 2016 to 2020 for Saskatchewan’s Oil and Gas Industry report provides a range of labour demand projections for the industry based on two scenarios, which include assumptions for potential price ranges, conventional E&P capital and operating expenditures, and industry-wide activity.
These scenarios and assumptions were developed with guidance from ARC Financial Corporation and align with the most recently available spending projections (January 2016), as well as forecasted production volumes released by CAPP in June 2015 (updated annually).
An overview of indirect and induced employment impacts due to oil and gas industry spending in Saskatchewan are also provided in this report at an aggregate level. Indirect and induced employment impacts were developed using Statistics Canada’s interprovincial and inter-industry Input-Output tables.
LOWER SCENARIO HIGHER SCENARIO
• Oil price averages about $US40 (West Texas Intermediate or WTI) for 2016 and conventional CAPEX declines 44% from 2015
• Oil price remains below US$45 (WTI)for 2016 and conventional CAPEX declines 29% from 2015
• Oil price remains below US$55 for 2017 and increases to US$60 for 2018–2020, and conventional CAPEX recovers to 58% of 2014 value by 2020
• Oil price increases to the US$60–80 range for 2017–2020, and conventional CAPEX recovers to 74% of 2014 value by 2020
• Natural gas prices average $2.25–2.85 (Alberta Energy Company or AECO) for the forecast period
• Natural gas prices average $2.50–2.90 (AECO) for the forecast period
Additional key assumptions for the two scenarios: • The industry will continue to struggle
through 2016, resulting in the need for industry to pursue additional cost reductions and to undergo more employment cuts.
• In the Higher scenario, some energy-producing countries will be motivated to cut production and manage their supply due to intensified social and economic instability. In the Lower scenario, oil supply management remains tenuous, causing prices to remain at US$60/bbl (WTI) to 2020.
• Both scenarios are optimistic that the demand for natural gas will expand due to its increased use domestically and internationally to curb greenhouse gas (GHG) emissions and the development of Canada’s emerging liquefied natural gas (LNG) sector.
TABLE 3 SOURCE: ARC FINANCIAL AS OF JANUARY 2016, PETROLMI
LABOUR DEMAND OUTLOOK 2016 TO 2020 9 SASKATCHEWAN’S OIL AND GAS INDUSTRY
Further reductions in expenditures or production will have a downward impact on employment.
$1,000
$2,000
$5,000
$4,000
$3,000
$6,000
$7,000
$201
5 M
illio
ns
2014a 2015e 2016f 2017f 2018f 2019f 2020f
f: FORECASTe: ESTIMATEa: ACTUAL
SK CAPEX – HigherSK CAPEX – Lower
SK OPEX – Higher and Lower
$3,108
$4,878
$3,784
$4,756
$3,691
$4,666
$3,593$3,724$3,172
$2,025$1,608
$2,857$3,088
$6,661
CONVENTIONAL E&P SPENDING IN SASKATCHEWAN TO 2020
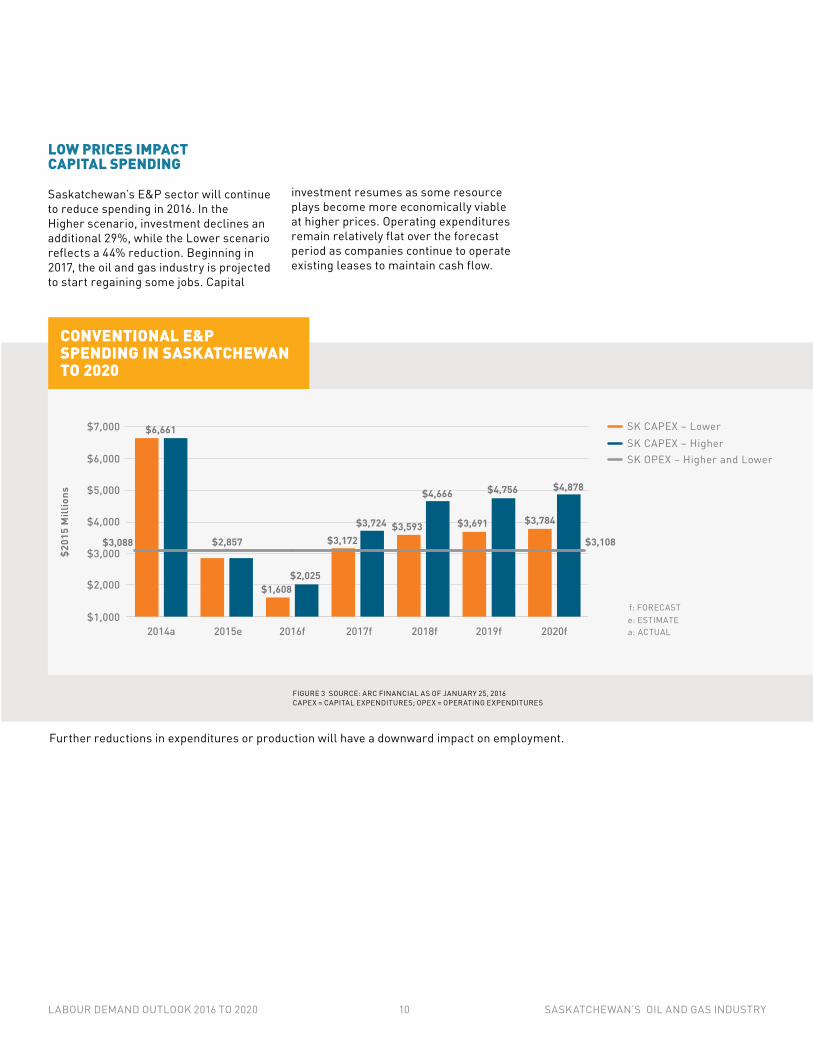
FIGURE 3 SOURCE: ARC FINANCIAL AS OF JANUARY 25, 2016 CAPEX = CAPITAL EXPENDITURES; OPEX = OPERATING EXPENDITURES
LOW PRICES IMPACT CAPITAL SPENDING
Saskatchewan’s E&P sector will continue to reduce spending in 2016. In the Higher scenario, investment declines an additional 29%, while the Lower scenario reflects a 44% reduction. Beginning in 2017, the oil and gas industry is projected to start regaining some jobs. Capital
investment resumes as some resource plays become more economically viable at higher prices. Operating expenditures remain relatively flat over the forecast period as companies continue to operate existing leases to maintain cash flow.
LABOUR DEMAND OUTLOOK 2016 TO 2020 10 SASKATCHEWAN’S OIL AND GAS INDUSTRY
SASKATCHEWAN’S LABOUR DEMAND TO 2020
9,000
15,000
14,000
13,000
12,000
11,000
10,000
Num
ber
of d
irec
t job
s
2020f2019f2018f2017f2016f2014e 2015e
Higher
f: FORECASTe: ESTIMATE
Lower14,395
10,265
10,870
13,615
12,395
SASKATCHEWAN DIRECT OIL AND GAS EMPLOYMENT PROJECTIONS TO 2020
FIGURE 4 SOURCE: STATISTICS CANADA, PETROLMI
5 PetroLMI's modeling system applies different head office versus field location ratios for each occupation and/or job family. The ratios were developed with industry input. When head offices are set up outside of Alberta, employment in certain occupations outside of Alberta maybe under-estimated.
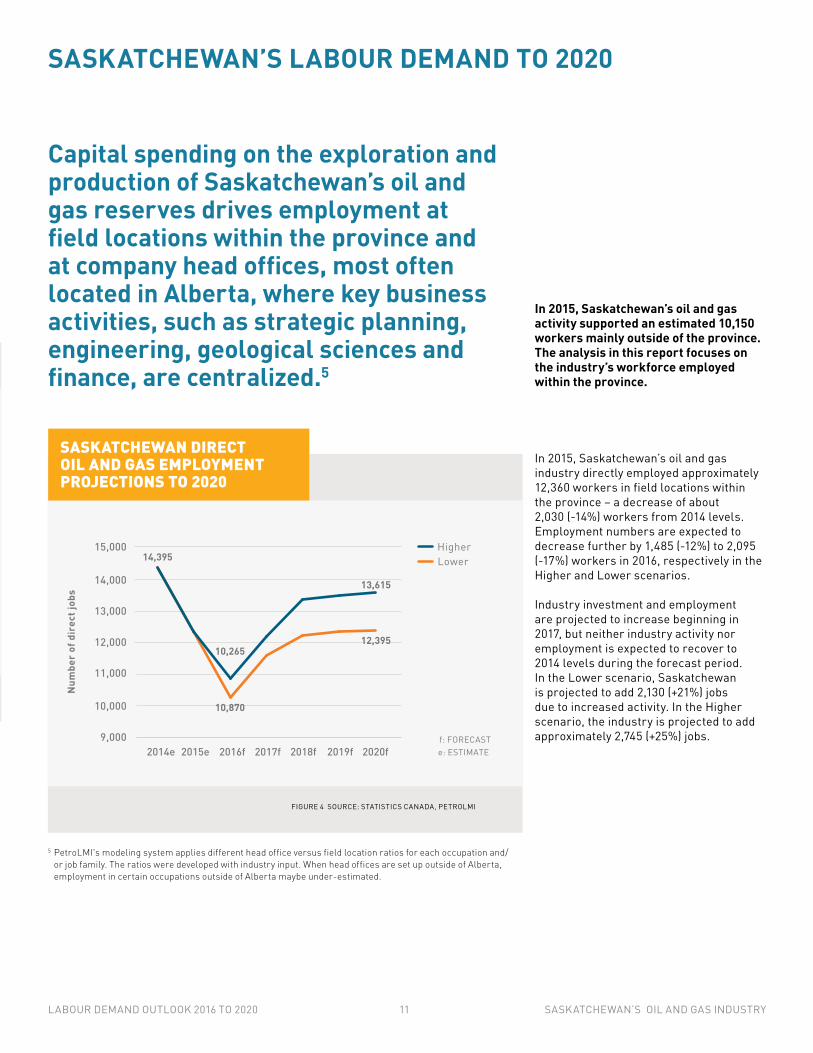
In 2015, Saskatchewan’s oil and gas industry directly employed approximately 12,360 workers in field locations within the province – a decrease of about 2,030 (-14%) workers from 2014 levels. Employment numbers are expected to decrease further by 1,485 (-12%) to 2,095 (-17%) workers in 2016, respectively in the Higher and Lower scenarios.
Industry investment and employment are projected to increase beginning in 2017, but neither industry activity nor employment is expected to recover to 2014 levels during the forecast period. In the Lower scenario, Saskatchewan is projected to add 2,130 (+21%) jobs due to increased activity. In the Higher scenario, the industry is projected to add approximately 2,745 (+25%) jobs.
Capital spending on the exploration and production of Saskatchewan’s oil and gas reserves drives employment at field locations within the province and at company head offices, most often located in Alberta, where key business activities, such as strategic planning, engineering, geological sciences and finance, are centralized.5
In 2015, Saskatchewan’s oil and gas activity supported an estimated 10,150 workers mainly outside of the province. The analysis in this report focuses on the industry’s workforce employed within the province.
LABOUR DEMAND OUTLOOK 2016 TO 2020 11 SASKATCHEWAN’S OIL AND GAS INDUSTRY
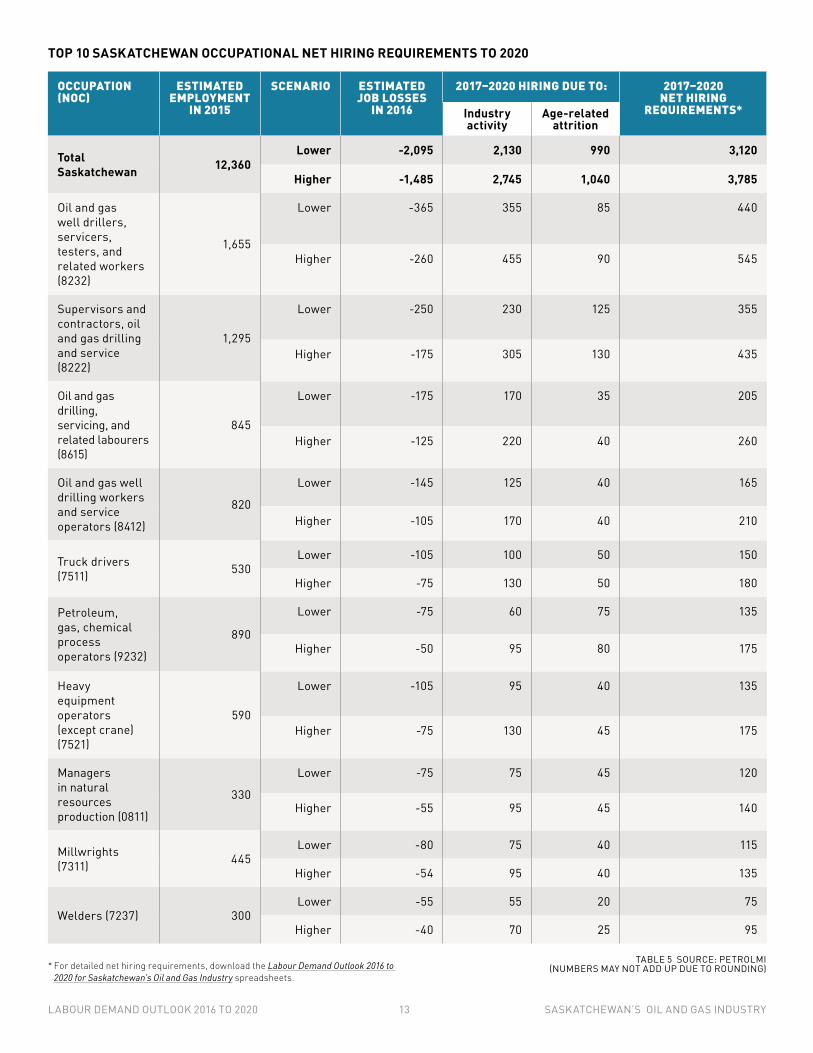
While occupations in the oil and gas services sector, such as drillers, servicers and operators, are expected to add the most jobs as activity picks up, many managerial, trades and key operational roles, such as power engineers and process operators, are projected to experience high rates of retirements. The potential loss of technical experience in the industry, therefore, is a concern at a time when operational expertise is needed to drive cost-saving operational efficiencies.
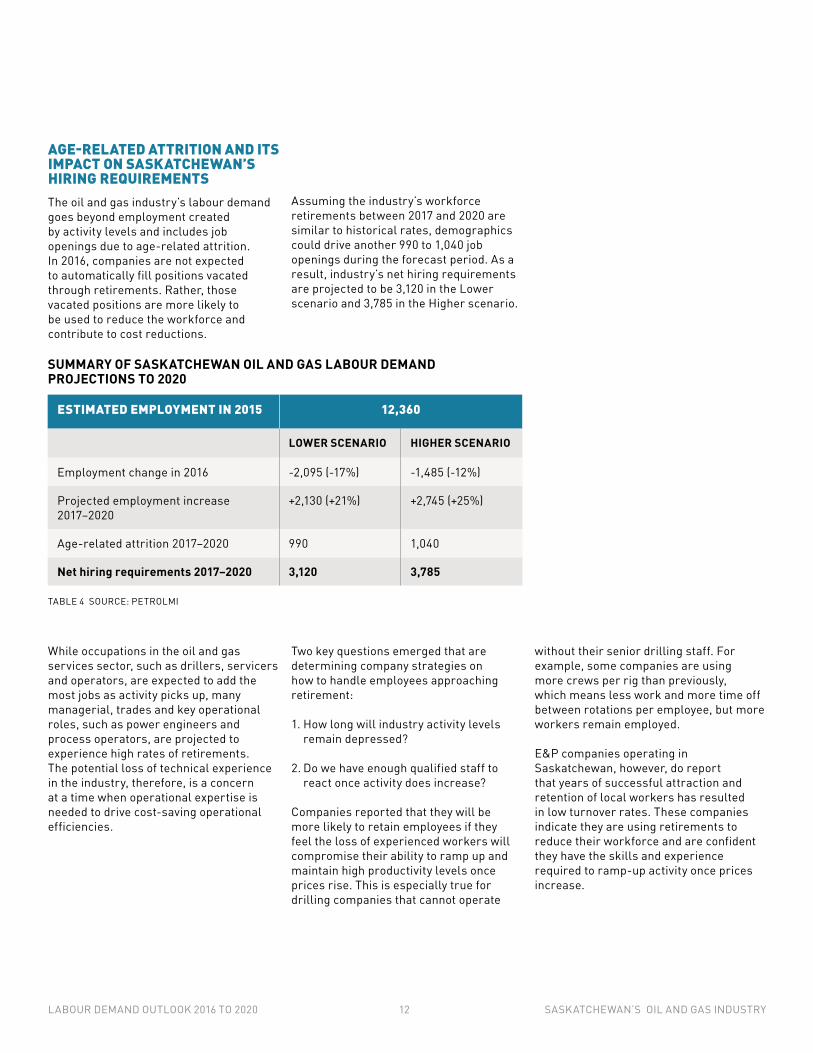
ESTIMATED EMPLOYMENT IN 2015 12,360
LOWER SCENARIO HIGHER SCENARIO
Employment change in 2016 -2,095 (-17%) -1,485 (-12%)
Projected employment increase 2017–2020
+2,130 (+21%) +2,745 (+25%)
Age-related attrition 2017–2020 990 1,040
Net hiring requirements 2017–2020 3,120 3,785
SUMMARY OF SASKATCHEWAN OIL AND GAS LABOUR DEMAND PROJECTIONS TO 2020
Two key questions emerged that are determining company strategies on how to handle employees approaching retirement:
1. How long will industry activity levels remain depressed?
2. Do we have enough qualified staff to react once activity does increase?
Companies reported that they will be more likely to retain employees if they feel the loss of experienced workers will compromise their ability to ramp up and maintain high productivity levels once prices rise. This is especially true for drilling companies that cannot operate
AGE-RELATED ATTRITION AND ITS IMPACT ON SASKATCHEWAN’S HIRING REQUIREMENTSThe oil and gas industry’s labour demand goes beyond employment created by activity levels and includes job openings due to age-related attrition. In 2016, companies are not expected to automatically fill positions vacated through retirements. Rather, those vacated positions are more likely to be used to reduce the workforce and contribute to cost reductions.
without their senior drilling staff. For example, some companies are using more crews per rig than previously, which means less work and more time off between rotations per employee, but more workers remain employed.
E&P companies operating in Saskatchewan, however, do report that years of successful attraction and retention of local workers has resulted in low turnover rates. These companies indicate they are using retirements to reduce their workforce and are confident they have the skills and experience required to ramp-up activity once prices increase.
Assuming the industry’s workforce retirements between 2017 and 2020 are similar to historical rates, demographics could drive another 990 to 1,040 job openings during the forecast period. As a result, industry’s net hiring requirements are projected to be 3,120 in the Lower scenario and 3,785 in the Higher scenario.
TABLE 4 SOURCE: PETROLMI
LABOUR DEMAND OUTLOOK 2016 TO 2020 12 SASKATCHEWAN’S OIL AND GAS INDUSTRY
continued
TOP 10 SASKATCHEWAN OCCUPATIONAL NET HIRING REQUIREMENTS TO 2020
OCCUPATION (NOC)
ESTIMATED EMPLOYMENT
IN 2015
SCENARIO ESTIMATED JOB LOSSES
IN 2016
2017–2020 HIRING DUE TO: 2017–2020 NET HIRING
REQUIREMENTS*Industry activity
Age-related attrition
Total Saskatchewan 12,360
Lower -2,095 2,130 990 3,120
Higher -1,485 2,745 1,040 3,785
Oil and gas well drillers, servicers, testers, and related workers (8232)
1,655
Lower -365 355 85 440
Higher -260 455 90 545
Supervisors and contractors, oil and gas drilling and service (8222)
1,295
Lower -250 230 125 355
Higher -175 305 130 435
Oil and gas drilling, servicing, and related labourers (8615)
845
Lower -175 170 35 205
Higher -125 220 40 260
Oil and gas well drilling workers and service operators (8412)
820
Lower -145 125 40 165
Higher -105 170 40 210
Truck drivers (7511) 530
Lower -105 100 50 150
Higher -75 130 50 180
Petroleum, gas, chemical process operators (9232)
890
Lower -75 60 75 135
Higher -50 95 80 175
Heavy equipment operators (except crane) (7521)
590
Lower -105 95 40 135
Higher -75 130 45 175
Managers in natural resources production (0811)
330
Lower -75 75 45 120
Higher -55 95 45 140
Millwrights (7311) 445
Lower -80 75 40 115
Higher -54 95 40 135
Welders (7237) 300Lower -55 55 20 75
Higher -40 70 25 95
TABLE 5 SOURCE: PETROLMI (NUMBERS MAY NOT ADD UP DUE TO ROUNDING)* For detailed net hiring requirements, download the Labour Demand Outlook 2016 to
2020 for Saskatchewan’s Oil and Gas Industry spreadsheets.
LABOUR DEMAND OUTLOOK 2016 TO 2020 13 SASKATCHEWAN’S OIL AND GAS INDUSTRY
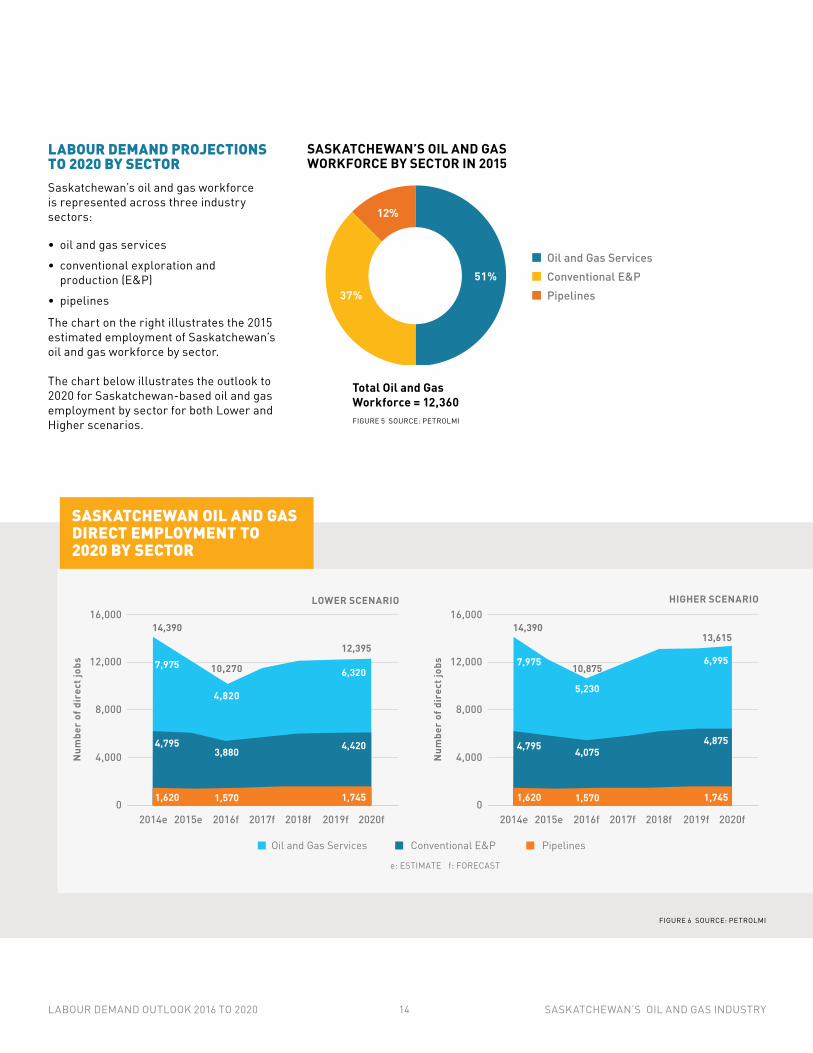
LABOUR DEMAND PROJECTIONS TO 2020 BY SECTORSaskatchewan’s oil and gas workforce is represented across three industry sectors:
• oil and gas services
• conventional exploration and production (E&P)
• pipelines
The chart on the right illustrates the 2015 estimated employment of Saskatchewan’s oil and gas workforce by sector.
The chart below illustrates the outlook to 2020 for Saskatchewan-based oil and gas employment by sector for both Lower and Higher scenarios.
SASKATCHEWAN’S OIL AND GAS WORKFORCE BY SECTOR IN 2015
FIGURE 5 SOURCE: PETROLMI
Total Oil and Gas Workforce = 12,360
Oil and Gas ServicesConventional E&PPipelines
51%37%
12%
e: ESTIMATE f: FORECAST
PipelinesConventional E&POil and Gas Services
0
4,000
16,000
12,000
8,000
Num
ber
of d
irec
t job
s
LOWER SCENARIO
2020f2019f2018f2017f2016f2014e 2015e0
4,000
16,000
12,000
8,000
Num
ber
of d
irec
t job
s
HIGHER SCENARIO
2020f2019f2018f2017f2016f2014e 2015e
4,795
7,975
14,390
1,620
4,875
6,995
13,615
1,745
5,230
4,075
1,570
10,875
4,795
7,975
14,390
1,620
4,420
6,320
12,395
1,745
4,820
3,880
1,570
10,270
SASKATCHEWAN OIL AND GAS DIRECT EMPLOYMENT TO 2020 BY SECTOR
FIGURE 6 SOURCE: PETROLMI
LABOUR DEMAND OUTLOOK 2016 TO 2020 14 SASKATCHEWAN’S OIL AND GAS INDUSTRY
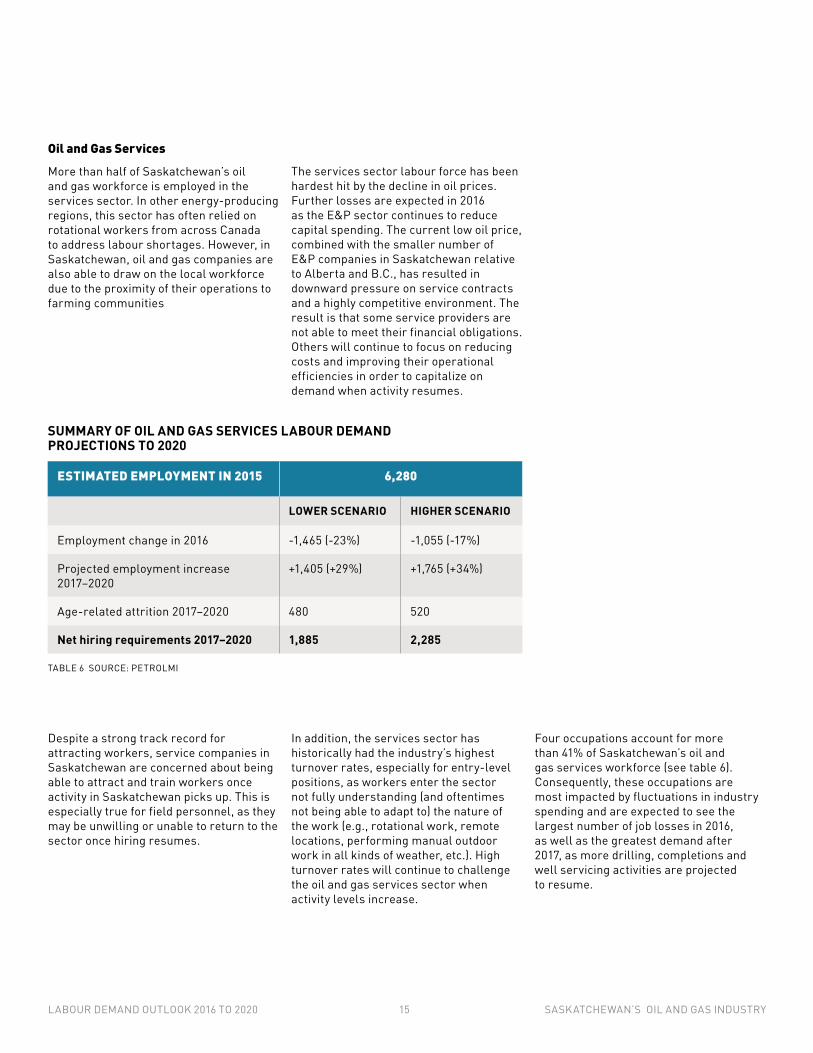
Oil and Gas Services
More than half of Saskatchewan’s oil and gas workforce is employed in the services sector. In other energy-producing regions, this sector has often relied on rotational workers from across Canada to address labour shortages. However, in Saskatchewan, oil and gas companies are also able to draw on the local workforce due to the proximity of their operations to farming communities
ESTIMATED EMPLOYMENT IN 2015 6,280
LOWER SCENARIO HIGHER SCENARIO
Employment change in 2016 -1,465 (-23%) -1,055 (-17%)
Projected employment increase 2017–2020
+1,405 (+29%) +1,765 (+34%)
Age-related attrition 2017–2020 480 520
Net hiring requirements 2017–2020 1,885 2,285
SUMMARY OF OIL AND GAS SERVICES LABOUR DEMAND PROJECTIONS TO 2020
Despite a strong track record for attracting workers, service companies in Saskatchewan are concerned about being able to attract and train workers once activity in Saskatchewan picks up. This is especially true for field personnel, as they may be unwilling or unable to return to the sector once hiring resumes.
In addition, the services sector has historically had the industry’s highest turnover rates, especially for entry-level positions, as workers enter the sector not fully understanding (and oftentimes not being able to adapt to) the nature of the work (e.g., rotational work, remote locations, performing manual outdoor work in all kinds of weather, etc.). High turnover rates will continue to challenge the oil and gas services sector when activity levels increase.
Four occupations account for more than 41% of Saskatchewan’s oil and gas services workforce (see table 6). Consequently, these occupations are most impacted by fluctuations in industry spending and are expected to see the largest number of job losses in 2016, as well as the greatest demand after 2017, as more drilling, completions and well servicing activities are projected to resume.
The services sector labour force has been hardest hit by the decline in oil prices. Further losses are expected in 2016 as the E&P sector continues to reduce capital spending. The current low oil price, combined with the smaller number of E&P companies in Saskatchewan relative to Alberta and B.C., has resulted in downward pressure on service contracts and a highly competitive environment. The result is that some service providers are not able to meet their financial obligations. Others will continue to focus on reducing costs and improving their operational efficiencies in order to capitalize on demand when activity resumes.
TABLE 6 SOURCE: PETROLMI
LABOUR DEMAND OUTLOOK 2016 TO 2020 15 SASKATCHEWAN’S OIL AND GAS INDUSTRY
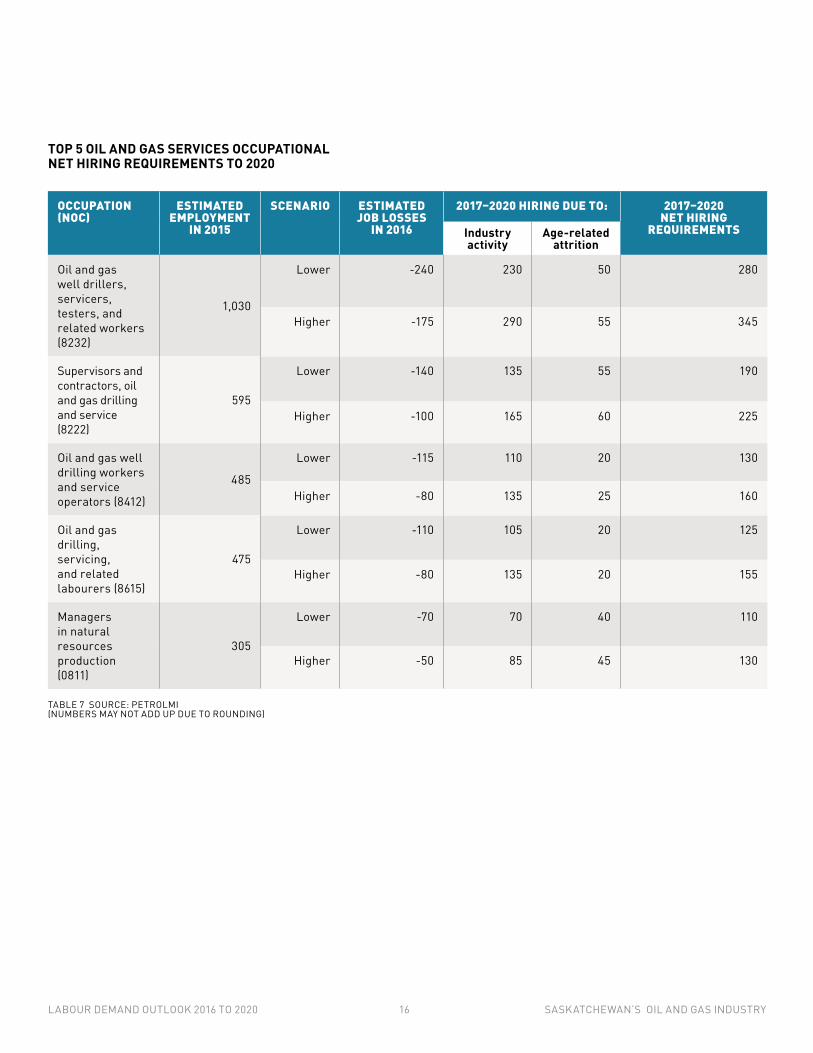
TOP 5 OIL AND GAS SERVICES OCCUPATIONAL NET HIRING REQUIREMENTS TO 2020
OCCUPATION (NOC)
ESTIMATED EMPLOYMENT
IN 2015
SCENARIO ESTIMATED JOB LOSSES
IN 2016
2017–2020 HIRING DUE TO: 2017–2020 NET HIRING
REQUIREMENTSIndustry activity
Age-related attrition
Oil and gas well drillers, servicers, testers, and related workers (8232)
1,030
Lower -240 230 50 280
Higher -175 290 55 345
Supervisors and contractors, oil and gas drilling and service (8222)
595
Lower -140 135 55 190
Higher -100 165 60 225
Oil and gas well drilling workers and service operators (8412)
485
Lower -115 110 20 130
Higher -80 135 25 160
Oil and gas drilling, servicing, and related labourers (8615)
475
Lower -110 105 20 125
Higher -80 135 20 155
Managers in natural resources production (0811)
305
Lower -70 70 40 110
Higher -50 85 45 130
TABLE 7 SOURCE: PETROLMI (NUMBERS MAY NOT ADD UP DUE TO ROUNDING)
LABOUR DEMAND OUTLOOK 2016 TO 2020 16 SASKATCHEWAN’S OIL AND GAS INDUSTRY
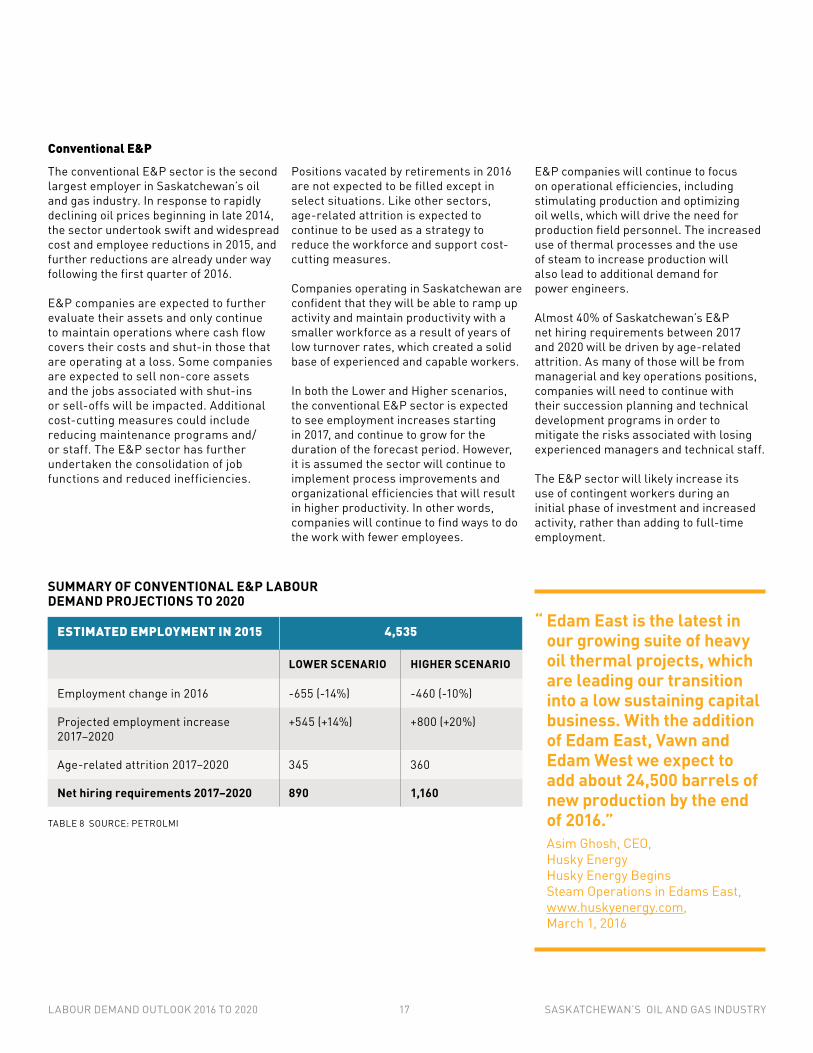
Conventional E&P
The conventional E&P sector is the second largest employer in Saskatchewan’s oil and gas industry. In response to rapidly declining oil prices beginning in late 2014, the sector undertook swift and widespread cost and employee reductions in 2015, and further reductions are already under way following the first quarter of 2016.
E&P companies are expected to further evaluate their assets and only continue to maintain operations where cash flow covers their costs and shut-in those that are operating at a loss. Some companies are expected to sell non-core assets and the jobs associated with shut-ins or sell-offs will be impacted. Additional cost-cutting measures could include reducing maintenance programs and/or staff. The E&P sector has further undertaken the consolidation of job functions and reduced inefficiencies.
Positions vacated by retirements in 2016 are not expected to be filled except in select situations. Like other sectors, age-related attrition is expected to continue to be used as a strategy to reduce the workforce and support cost-cutting measures.
Companies operating in Saskatchewan are confident that they will be able to ramp up activity and maintain productivity with a smaller workforce as a result of years of low turnover rates, which created a solid base of experienced and capable workers.
In both the Lower and Higher scenarios, the conventional E&P sector is expected to see employment increases starting in 2017, and continue to grow for the duration of the forecast period. However, it is assumed the sector will continue to implement process improvements and organizational efficiencies that will result in higher productivity. In other words, companies will continue to find ways to do the work with fewer employees.
ESTIMATED EMPLOYMENT IN 2015 4,535
LOWER SCENARIO HIGHER SCENARIO
Employment change in 2016 -655 (-14%) -460 (-10%)
Projected employment increase 2017–2020
+545 (+14%) +800 (+20%)
Age-related attrition 2017–2020 345 360
Net hiring requirements 2017–2020 890 1,160
SUMMARY OF CONVENTIONAL E&P LABOUR DEMAND PROJECTIONS TO 2020
E&P companies will continue to focus on operational efficiencies, including stimulating production and optimizing oil wells, which will drive the need for production field personnel. The increased use of thermal processes and the use of steam to increase production will also lead to additional demand for power engineers.
Almost 40% of Saskatchewan’s E&P net hiring requirements between 2017 and 2020 will be driven by age-related attrition. As many of those will be from managerial and key operations positions, companies will need to continue with their succession planning and technical development programs in order to mitigate the risks associated with losing experienced managers and technical staff.
The E&P sector will likely increase its use of contingent workers during an initial phase of investment and increased activity, rather than adding to full-time employment.
“ Edam East is the latest in our growing suite of heavy oil thermal projects, which are leading our transition into a low sustaining capital business. With the addition of Edam East, Vawn and Edam West we expect to add about 24,500 barrels of new production by the end of 2016.”Asim Ghosh, CEO, Husky EnergyHusky Energy Begins Steam Operations in Edams East, www.huskyenergy.com, March 1, 2016
TABLE 8 SOURCE: PETROLMI
LABOUR DEMAND OUTLOOK 2016 TO 2020 17 SASKATCHEWAN’S OIL AND GAS INDUSTRY
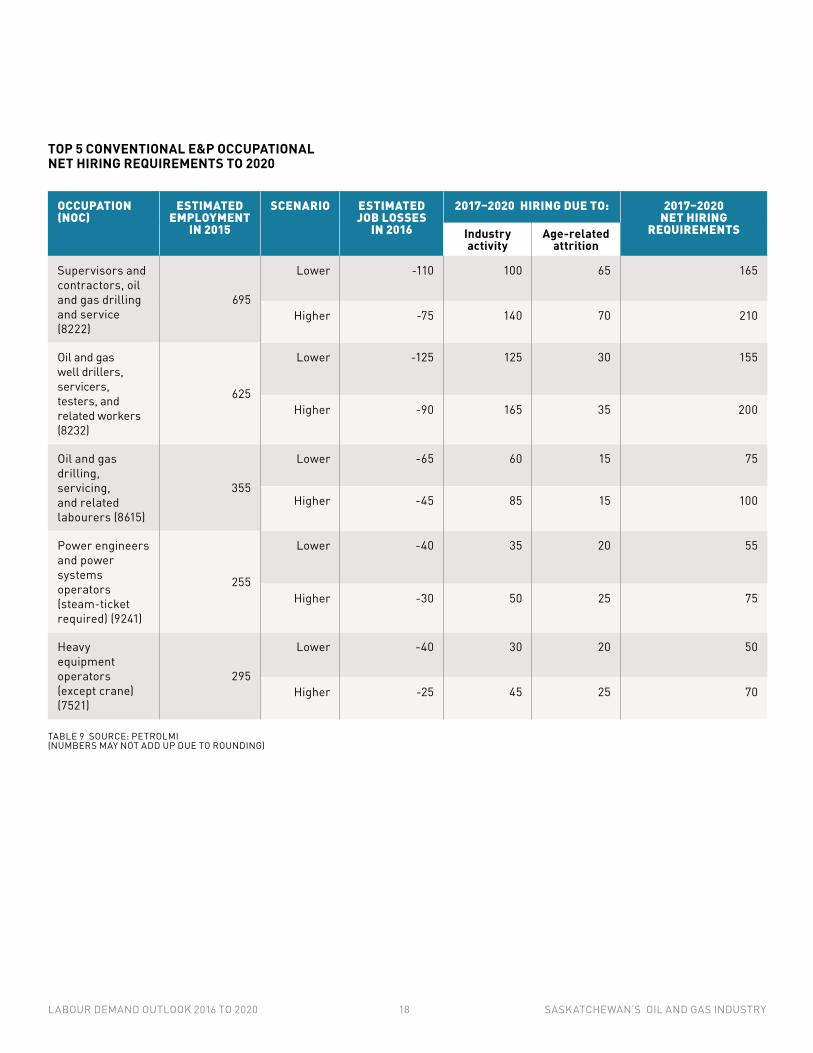
TOP 5 CONVENTIONAL E&P OCCUPATIONAL NET HIRING REQUIREMENTS TO 2020
OCCUPATION (NOC)
ESTIMATED EMPLOYMENT
IN 2015
SCENARIO ESTIMATED JOB LOSSES
IN 2016
2017–2020 HIRING DUE TO: 2017–2020 NET HIRING
REQUIREMENTSIndustry activity
Age-related attrition
Supervisors and contractors, oil and gas drilling and service (8222)
695
Lower -110 100 65 165
Higher -75 140 70 210
Oil and gas well drillers, servicers, testers, and related workers (8232)
625
Lower -125 125 30 155
Higher -90 165 35 200
Oil and gas drilling, servicing, and related labourers (8615)
355
Lower -65 60 15 75
Higher -45 85 15 100
Power engineers and power systems operators (steam-ticket required) (9241)
255
Lower -40 35 20 55
Higher -30 50 25 75
Heavy equipment operators (except crane) (7521)
295
Lower -40 30 20 50
Higher -25 45 25 70
TABLE 9 SOURCE: PETROLMI (NUMBERS MAY NOT ADD UP DUE TO ROUNDING)
LABOUR DEMAND OUTLOOK 2016 TO 2020 18 SASKATCHEWAN’S OIL AND GAS INDUSTRY
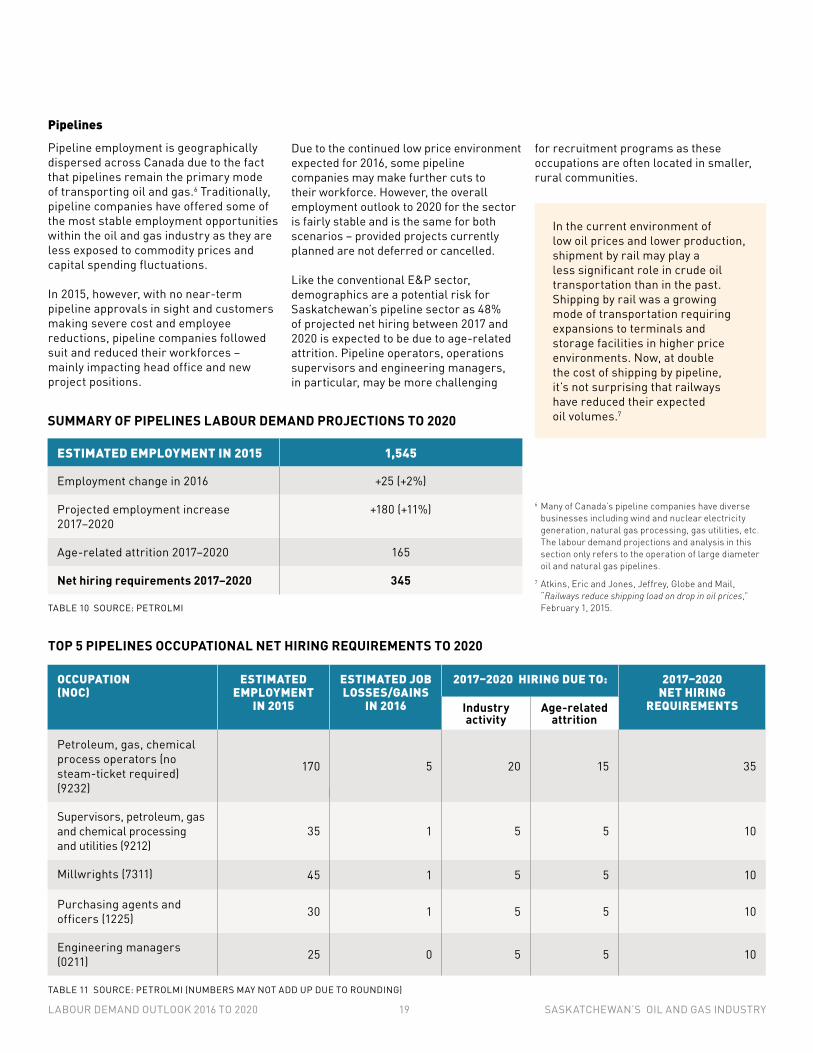
Pipelines
Pipeline employment is geographically dispersed across Canada due to the fact that pipelines remain the primary mode of transporting oil and gas.6 Traditionally, pipeline companies have offered some of the most stable employment opportunities within the oil and gas industry as they are less exposed to commodity prices and capital spending fluctuations.
In 2015, however, with no near-term pipeline approvals in sight and customers making severe cost and employee reductions, pipeline companies followed suit and reduced their workforces – mainly impacting head office and new project positions.
Due to the continued low price environment expected for 2016, some pipeline companies may make further cuts to their workforce. However, the overall employment outlook to 2020 for the sector is fairly stable and is the same for both scenarios – provided projects currently planned are not deferred or cancelled.
Like the conventional E&P sector, demographics are a potential risk for Saskatchewan’s pipeline sector as 48% of projected net hiring between 2017 and 2020 is expected to be due to age-related attrition. Pipeline operators, operations supervisors and engineering managers, in particular, may be more challenging
for recruitment programs as these occupations are often located in smaller, rural communities.
ESTIMATED EMPLOYMENT IN 2015 1,545
Employment change in 2016 +25 (+2%)
Projected employment increase 2017–2020
+180 (+11%)
Age-related attrition 2017–2020 165
Net hiring requirements 2017–2020 345
SUMMARY OF PIPELINES LABOUR DEMAND PROJECTIONS TO 2020
TOP 5 PIPELINES OCCUPATIONAL NET HIRING REQUIREMENTS TO 2020
In the current environment of low oil prices and lower production, shipment by rail may play a less significant role in crude oil transportation than in the past. Shipping by rail was a growing mode of transportation requiring expansions to terminals and storage facilities in higher price environments. Now, at double the cost of shipping by pipeline, it’s not surprising that railways have reduced their expected oil volumes.7
6 Many of Canada’s pipeline companies have diverse businesses including wind and nuclear electricity generation, natural gas processing, gas utilities, etc. The labour demand projections and analysis in this section only refers to the operation of large diameter oil and natural gas pipelines.
7 Atkins, Eric and Jones, Jeffrey, Globe and Mail, “Railways reduce shipping load on drop in oil prices,” February 1, 2015.
TOP 5 PIPELINE NET HIRING REQUIREMENTS TO 2020
OCCUPATION (NOC)
ESTIMATED EMPLOYMENT
IN 2015
ESTIMATED JOB LOSSES/GAINS
IN 2016
2017–2020 HIRING DUE TO: 2017–2020 NET HIRING
REQUIREMENTSIndustry activity
Age-related attrition
Petroleum, gas, chemical process operators (no steam-ticket required) (9232)
170 5 20 15 35
Supervisors, petroleum, gas and chemical processing and utilities (9212)
35 1 5 5 10
Millwrights (7311) 45 1 5 5 10
Purchasing agents and officers (1225) 30 1 5 5 10
Engineering managers (0211) 25 0 5 5 10
TABLE 10 SOURCE: PETROLMI
TABLE 11 SOURCE: PETROLMI (NUMBERS MAY NOT ADD UP DUE TO ROUNDING)
LABOUR DEMAND OUTLOOK 2016 TO 2020 19 SASKATCHEWAN’S OIL AND GAS INDUSTRY
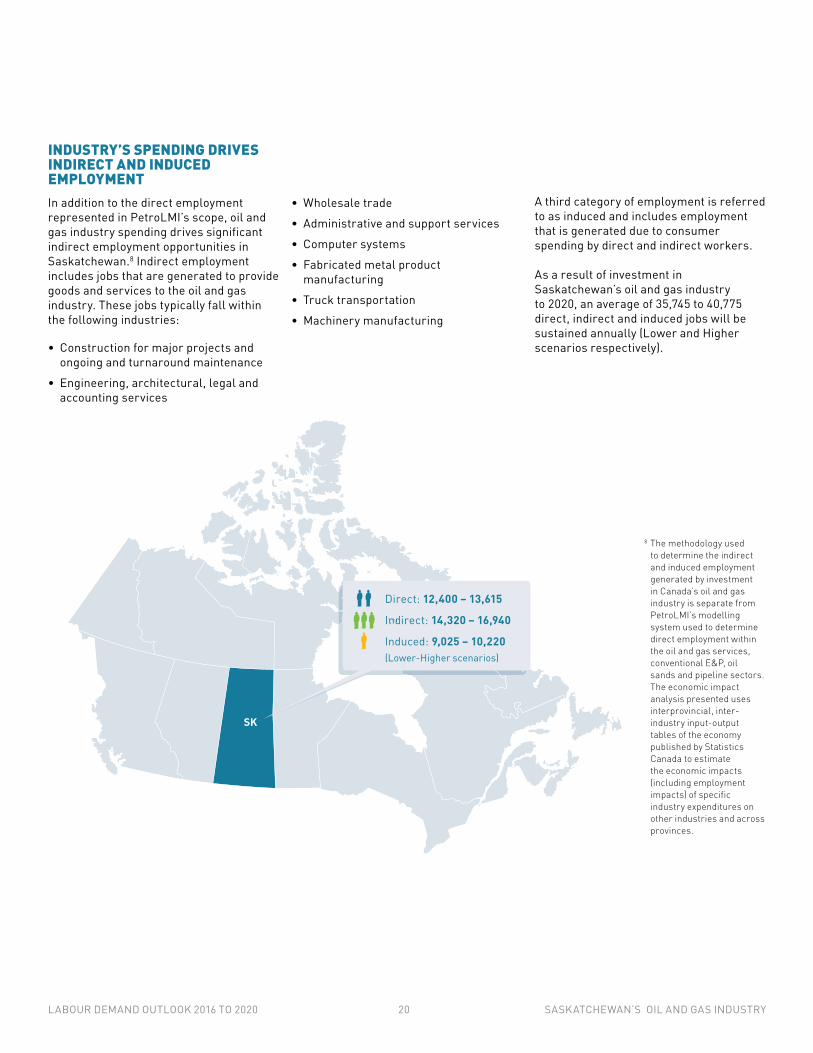
8 The methodology used to determine the indirect and induced employment generated by investment in Canada’s oil and gas industry is separate from PetroLMI’s modelling system used to determine direct employment within the oil and gas services, conventional E&P, oil sands and pipeline sectors. The economic impact analysis presented uses interprovincial, inter-industry input-output tables of the economy published by Statistics Canada to estimate the economic impacts (including employment impacts) of specific industry expenditures on other industries and across provinces.
INDUSTRY’S SPENDING DRIVES INDIRECT AND INDUCED EMPLOYMENT In addition to the direct employment represented in PetroLMI’s scope, oil and gas industry spending drives significant indirect employment opportunities in Saskatchewan.8 Indirect employment includes jobs that are generated to provide goods and services to the oil and gas industry. These jobs typically fall within the following industries:
• Construction for major projects and ongoing and turnaround maintenance
• Engineering, architectural, legal and accounting services
• Wholesale trade
• Administrative and support services
• Computer systems
• Fabricated metal product manufacturing
• Truck transportation
• Machinery manufacturing
A third category of employment is referred to as induced and includes employment that is generated due to consumer spending by direct and indirect workers.
As a result of investment in Saskatchewan’s oil and gas industry to 2020, an average of 35,745 to 40,775 direct, indirect and induced jobs will be sustained annually (Lower and Higher scenarios respectively).
SK
Direct: 12,400 – 13,615
Indirect: 14,320 – 16,940 Induced: 9,025 – 10,220(Lower-Higher scenarios)
LABOUR DEMAND OUTLOOK 2016 TO 2020 20 SASKATCHEWAN’S OIL AND GAS INDUSTRY
As oil prices continue to remain lower for longer than previous downward industry cycles, companies are looking beyond short-term cost-cutting measures in order to survive and maintain a competitive advantage once prices do recover.
PREPARING FOR SUSTAINED LOW OIL PRICES
Critically important will be the ability to attract and retain the talent required without re-escalating workforce costs and impacting cost-cutting measures implemented in the last 18 months.
Certain economic and business conditions are required to create an environment that will enable companies to move from a reactive, survival mode to a more strategic mode, including disciplined organizational change and investing in technology and innovation to catalyze growth.
The industry’s model of doing business means that companies and industry sectors will have differing abilities to shift their actions from short term and tactical to long term and strategic. For example, the oil and gas services sector relies on the E&P, oil sands and pipeline sectors for contracted work and it is dependent upon the profitability of these sectors. Therefore, the sector is likely to lag in its ability to invest in more strategic approaches.
The bottom line for all sectors, however, is that the inability to implement and invest in strategies that improve efficiency and productivity will have a negative impact on future profitability. In Saskatchewan, unlike other provinces, companies are not expected to be faced with any additional pressures from changes in royalties, regulations or taxes.
Changes to organizational structures and the implementation of technology and operational efficiencies intended to “reset” the cost environment and improve the competitiveness of Canada’s oil and gas industry will also drive the skill and knowledge requirements of the future workforce. The highly valued characteristics of this workforce will include:
• Adaptability and flexibility with the ability to adjust to new working situations
• Technologically savvy, including the skills to install and repair technical equipment
• Business acumen with the ability to understand the cost implications associated with their actions
• Continuous improvement focus with the skills to implement improvements
• Data gathering and analytical skills to inform decision-making
LABOUR DEMAND OUTLOOK 2016 TO 2020 21 SASKATCHEWAN’S OIL AND GAS INDUSTRY
Assuming hiring resumes in 2017, potential workers may be less attracted to the sector following more than two years of contraction. This is particularly true for oilfield services where both workers and companies have the flexibility to move into different industries. New entrants, career changers or workers downsized from the oil and gas industry will also likely have found employment in other industries.
Human resources departments across the oil and gas industry are expected to emerge from the current downturn with a commitment to maintain reduced levels of employee salaries, benefits and perks. Talent management and acquisition strategies are expected to align with the overall business model of cost management, while at the same time mitigate future labour shortages.
MITIGATING LABOUR SUPPLY RISKS WHEN ACTIVITY RESUMES
The oil and gas industry may be challenged to attract labour supply when a recovery does occur, regardless of whether it is a Lower or Higher scenario.
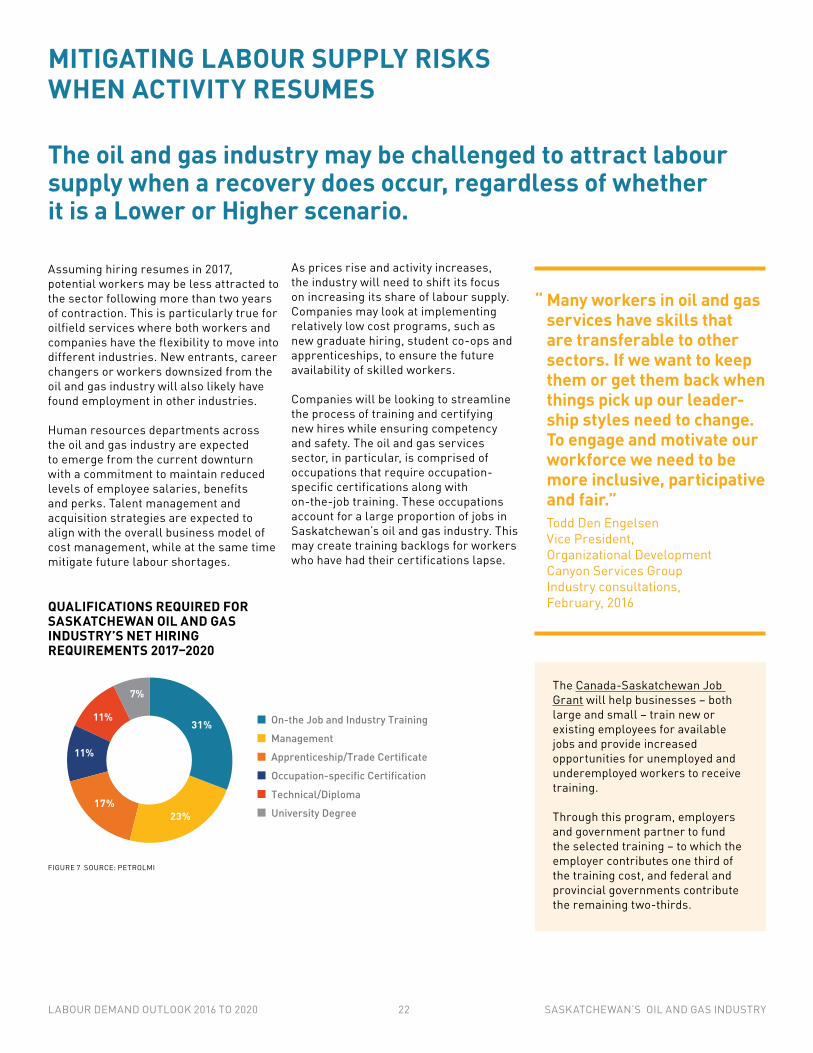
QUALIFICATIONS REQUIRED FOR SASKATCHEWAN OIL AND GAS INDUSTRY’S NET HIRING REQUIREMENTS 2017–2020
FIGURE 7 SOURCE: PETROLMI
On-the Job and Industry TrainingManagementApprenticeship/Trade CertificateOccupation-specific Certification
Technical/DiplomaUniversity Degree
31%
23%17%
11%
11%
7%
As prices rise and activity increases, the industry will need to shift its focus on increasing its share of labour supply. Companies may look at implementing relatively low cost programs, such as new graduate hiring, student co-ops and apprenticeships, to ensure the future availability of skilled workers.
Companies will be looking to streamline the process of training and certifying new hires while ensuring competency and safety. The oil and gas services sector, in particular, is comprised of occupations that require occupation-specific certifications along with on-the-job training. These occupations account for a large proportion of jobs in Saskatchewan’s oil and gas industry. This may create training backlogs for workers who have had their certifications lapse.
The Canada-Saskatchewan Job Grant will help businesses – both large and small – train new or existing employees for available jobs and provide increased opportunities for unemployed and underemployed workers to receive training.
Through this program, employers and government partner to fund the selected training – to which the employer contributes one third of the training cost, and federal and provincial governments contribute the remaining two-thirds.
“ Many workers in oil and gas services have skills that are transferable to other sectors. If we want to keep them or get them back when things pick up our leader-ship styles need to change. To engage and motivate our workforce we need to be more inclusive, participative and fair.”Todd Den EngelsenVice President, Organizational DevelopmentCanyon Services GroupIndustry consultations, February, 2016
LABOUR DEMAND OUTLOOK 2016 TO 2020 22 SASKATCHEWAN’S OIL AND GAS INDUSTRY
CONCLUSION
As the oil and gas industry continues to respond to low oil prices, reductions in costs and workers are expected to continue in 2016. Further consolidation through mergers and acquisitions and bankruptcies are also expected.
Overall, these changes will have a moderating effect on Saskatchewan’s status as an oil producing region. They will enable Saskatchewan, and Canada, to be more competitive provided cost and efficiency improvements can be maintained.
Looking ahead, the industry is likely to need fewer workers to do the same amount of work due to a renewed focus on productivity improvements. However, based on the Higher and Lower scenarios in this report, the hiring of workers due to increased industry activity and age-related attrition is expected to resume in 2017. Once activity increases, Saskatchewan’s oil and gas industry will need to reinvigorate its focus on increasing labour force participation by:
• Increasing participation of under-represented groups, such as Aboriginal people
• Developing the labour force so that skills and qualifications match those required by industry
• Attracting and retaining workers from outside of the province
In order to do that, the industry will want to identify and promote a value proposition for workers that goes beyond compensation; it will benefit from emphasizing a creative work environment in which employees derive career satisfaction from engaging in the success of the company and solving technical, environment and social issues through the implementation of innovative processes and technology solutions.
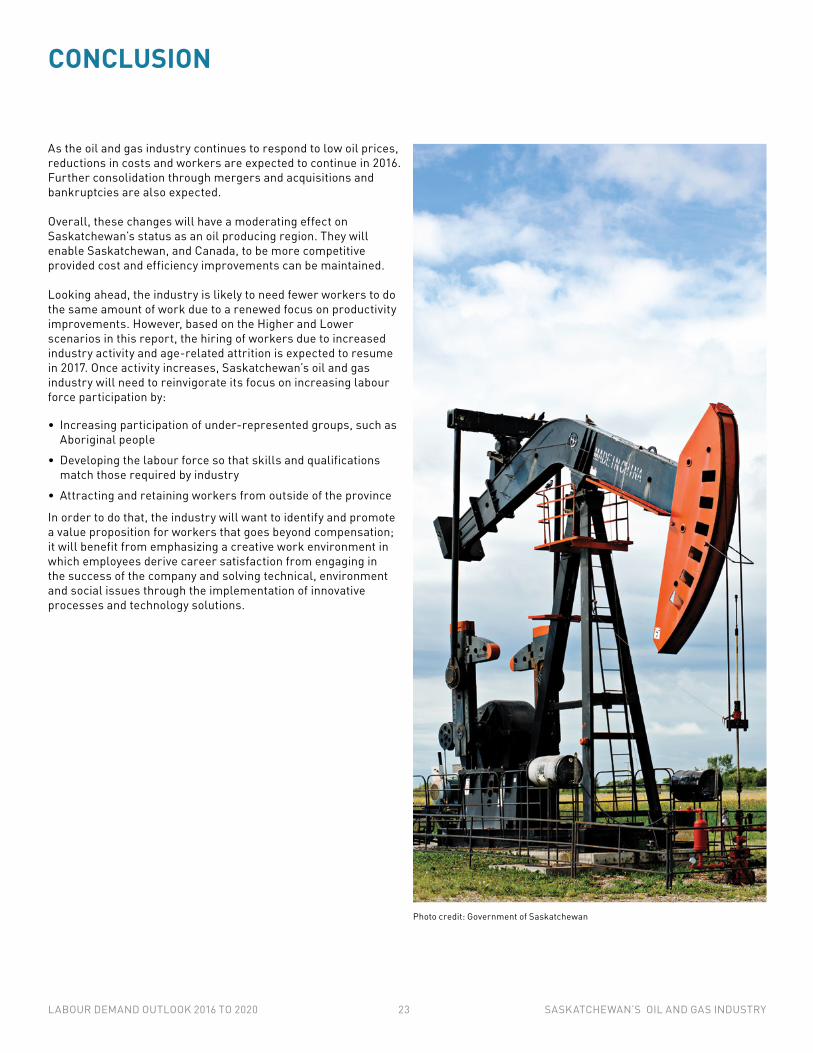
Photo credit: Government of Saskatchewan
LABOUR DEMAND OUTLOOK 2016 TO 2020 23 SASKATCHEWAN’S OIL AND GAS INDUSTRY
APPENDIX 1: PETROLMI’S LABOUR MARKET MODELLING SYSTEM DETAILED METHODOLOGY
PetroLMI’s labour market projections are produced using a modelling system developed in consultation with industry and expertise of labour market forecasting economists. The modelling system shows the relationship between industry activity and employment requirements, and identifies the potential labour supply available to the industry.
The modelling system produces projections for:
• Hiring due to industry activity: the projected change in the number of workers required to realize industry activity plus adjustments for productivity growth or other factors that impact employment growth (normal unemployment, etc.).
• Hiring due to age-related attrition: also referred to as replacement demand, is the number of industry positions that will be vacated due to retirements and natural deaths among industry’s workforce.
• Net hiring requirements: hiring due to industry activity + age-related attrition.
Determining Occupational Scope
The list of occupations detailed in the model was developed in consultation with industry and review of prevalent occupations in the petroleum industry. 48 core occupations were identified that were key and/or unique to the industry, had significant employment within the industry and/or were difficult to recruit for.
Core occupations were then mapped to the National Occupational Classifications (NOCs). An “other occupations” category is used to capture any residual occupations and ensure total petroleum industry workforce is accounted for.
Hiring Due to Industry Activity
The model projects an occupation’s growth using industry employment drivers that vary by sector:
• Oil and gas services: E&P capital and operations expenditures and oil sands capital expenditures.
• Exploration and production: E&P capital and operations expenditures.
• Pipelines: oil and gas operations expenditures.
Determining Current Workforce by Sector• Oil and gas services and E&P: 2010–
2014 employment numbers for these sectors were obtained from Statistics Canada Labour Force Survey (LFS) data. For E&P, estimated oil sands employment (described below) was removed from the Oil & Gas Extraction LFS Data (NAICS 211) to determine historical employment for the E&P Sector. For oil and gas services, only the estimated proportion of oil and gas service employment was used from the Support Activities for Mining and Oil and Gas Extraction Industry sector (NAICS 213 – excluding mining services). Occupational break down of employment was based on occupational employment percentages obtained from 2011 Statistics Canada National Household Survey (formerly Census long-form) and adjusted for occupational changes based on annual LFS Data 2010–2014.
• Pipelines: 2010–2014 employment is determined using Statistic Canada LFS data (NAICS 486). Occupational break down of employment was based on occupational employment percentages obtained from 2011 Statistics Canada National Household Survey and adjusted for occupational changes based on annual LFS Data 2010–2014.
Information was also validated with public financial data where available.
A previous survey conducted in 2011 was used to determine baseline oil sands employee occupational percentages.
Employment Driver Data Sources
The Canadian Association of Petroleum Producers (CAPP) is the information source for oil and gas production forecasts as well as past years’ actual capital and operations expenditures. CAPP’s Crude Oil Forecast and Market Outlook is released in June of each year. Their natural gas production forecast is updated periodically through the year. Actual E&P capital and operations expenditure information is available through CAPP every August/September.
For E&P and Oil and Gas Services
ARC Financial was hired to develop price scenarios and conventional capital and operations expenditure forecasts. Once production and pricing have been forecasted, E&P capital expenditures are determined by: calculating cash flow using forecasted price and forecasted production, then multiplying cash flow by a reinvestment ratio.
E&P operating costs per barrel of oil (bbl) are then calculated using the historical data from CAPP divided by production. Operating costs per bbl are then escalated by a cost adjustment factor in the forecast period dependent on the pricing scenario. Higher industry activity levels tend to result in higher cost inflation while a lower or decline in activity result in either lower cost inflation or cost deflation.
For E&P, the contribution of E&P operating costs and capital expenditures were weighted for each occupation. This reflects that some occupations are more driven by capital expenditures while other occupations are more driven by operating costs.
LABOUR DEMAND OUTLOOK 2016 TO 2020 24 SASKATCHEWAN’S OIL AND GAS INDUSTRY

The relationship between the growth in drivers and historical workforce growth was analyzed. The final model used to produce workforce forecasts relied on a combination of statistical fit and industry input. Validation of the model based on historical basis resulted in a strong model fit.8
For Pipelines
The model projects pipeline occupations’ employment requirements using operating expenditures for conventional E&P and oil sands, which were provided by ARC Financial. The relationship between the growth in drivers and historical workforce growth was analyzed for all industry segments. The final model used to produce workforce forecasts relied on a combination of statistical fit and industry input. Validation of the model based on historical basis resulted in a strong model fit.9 The workforce forecasts were also reviewed with industry representatives and/or associations prior to release.
Calculating Labour Demand by Province
The model provides labour demand specifically for B.C., AB, SK and Rest of Canada.
The manner in which data is collected by Statistics Canada is challenging when developing the provincial expansion demand models as the data for the in-scope occupations are measured by Statistics Canada on a Place of Residence basis. They specify where the employee resides. However, on a geographic basis, persons living in one geographic area may work in another area. That is, the Place of Residence and Place of Work can differ.
The data on oil and gas production, and capital and operating expenditures are, for the most part, measured for the province where the production and expenditures take place. It is assumed that the relationship between the occupations and the employment drivers already built into the petroleum labour demand models for the Canadian industry as a whole, are also the same for each province making it possible to use the provincial production and expenditure information to estimate employment. Where provincial estimates and projections did not add to the Canadian totals, the provincial estimates are normalized to the Canada totals. The oil sands employment is entirely allocated to Alberta.
As some occupations work in the field and others work from head office (typically in Alberta), a cross-section of E&P and services sector companies provided input into the percentage of each core occupation that is field or field-office located, and head-office located in order to estimate the location of the worker associated with expenditures within a province. The model assumes that 100% of head-office jobs are based in Alberta.
Productivity
For all segments, long-term technology-driven productivity improvement is assumed to be 1% per year. This affects employment demand. However, in the short term (1–4 years), productivity can be higher or lower, even negative, e.g. in the 2015 EP case where major capital reductions are not immediately reflected by staff reduction. The short term productivity improvements are determined through industry/expert consultations.
Hiring Due to Age-related Attrition
The labour modeling system also compares occupation-specific age of retirement to the age demographic of each core occupation to calculate age-related attrition rates of the industry’s workforce. The number of job openings due to age-related attrition is added to the number of jobs created (or lost) due to industry activity to determine net hiring requirements.
LABOUR DEMAND OUTLOOK 2016 TO 2020 25 SASKATCHEWAN’S OIL AND GAS INDUSTRY
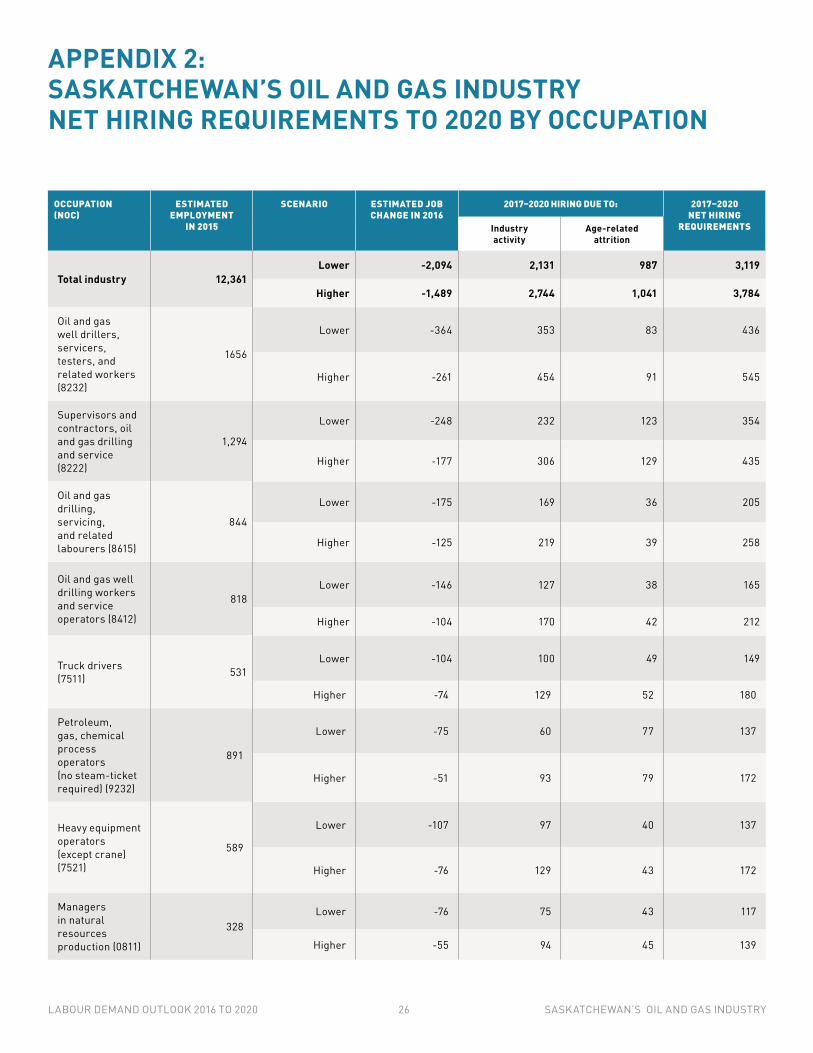
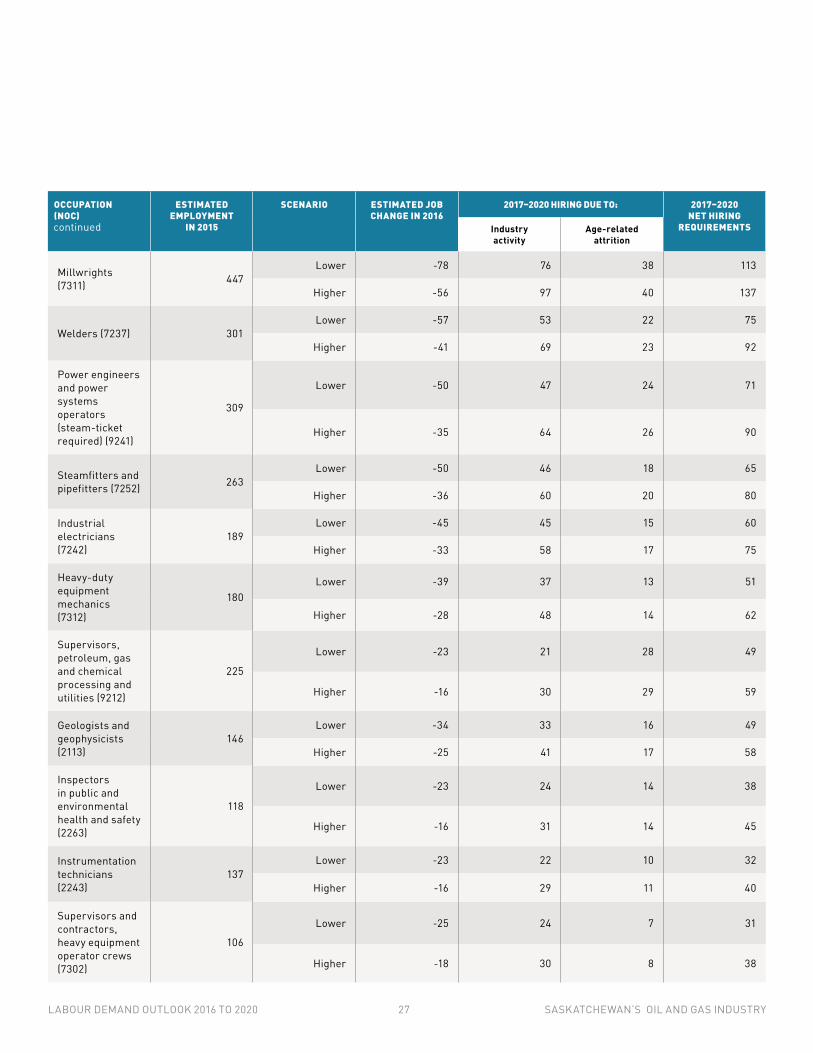
APPENDIX 2: SASKATCHEWAN’S OIL AND GAS INDUSTRY NET HIRING REQUIREMENTS TO 2020 BY OCCUPATION
OCCUPATION (NOC)
ESTIMATED EMPLOYMENT
IN 2015
SCENARIO ESTIMATED JOB CHANGE IN 2016
2017–2020 HIRING DUE TO: 2017–2020 NET HIRING
REQUIREMENTSIndustry activity
Age-related attrition
Total industry 12,361Lower -2,094 2,131 987 3,119
Higher -1,489 2,744 1,041 3,784
Oil and gas well drillers, servicers, testers, and related workers (8232)
1656
Lower -364 353 83 436
Higher -261 454 91 545
Supervisors and contractors, oil and gas drilling and service (8222)
1,294
Lower -248 232 123 354
Higher -177 306 129 435
Oil and gas drilling, servicing, and related labourers (8615)
844
Lower -175 169 36 205
Higher -125 219 39 258
Oil and gas well drilling workers and service operators (8412)
818Lower -146 127 38 165
Higher -104 170 42 212
Truck drivers (7511) 531
Lower -104 100 49 149
Higher -74 129 52 180
Petroleum, gas, chemical process operators (no steam-ticket required) (9232)
891
Lower -75 60 77 137
Higher -51 93 79 172
Heavy equipment operators (except crane) (7521)
589
Lower -107 97 40 137
Higher -76 129 43 172
Managers in natural resources production (0811)
328Lower -76 75 43 117
Higher -55 94 45 139
LABOUR DEMAND OUTLOOK 2016 TO 2020 26 SASKATCHEWAN’S OIL AND GAS INDUSTRY
OCCUPATION (NOC)
ESTIMATED EMPLOYMENT
IN 2015
SCENARIO ESTIMATED JOB CHANGE IN 2016
2017–2020 HIRING DUE TO: 2017–2020 NET HIRING
REQUIREMENTSIndustry activity
Age-related attrition
Millwrights (7311) 447
Lower -78 76 38 113
Higher -56 97 40 137
Welders (7237) 301Lower -57 53 22 75
Higher -41 69 23 92
Power engineers and power systems operators (steam-ticket required) (9241)
309
Lower -50 47 24 71
Higher -35 64 26 90
Steamfitters and pipefitters (7252) 263
Lower -50 46 18 65
Higher -36 60 20 80
Industrial electricians (7242)
189Lower -45 45 15 60
Higher -33 58 17 75
Heavy-duty equipment mechanics (7312)
180Lower -39 37 13 51
Higher -28 48 14 62
Supervisors, petroleum, gas and chemical processing and utilities (9212)
225
Lower -23 21 28 49
Higher -16 30 29 59
Geologists and geophysicists (2113)
146Lower -34 33 16 49
Higher -25 41 17 58
Inspectors in public and environmental health and safety (2263)
118
Lower -23 24 14 38
Higher -16 31 14 45
Instrumentation technicians (2243)
137Lower -23 22 10 32
Higher -16 29 11 40
Supervisors and contractors, heavy equipment operator crews (7302)
106
Lower -25 24 7 31
Higher -18 30 8 38
continued
LABOUR DEMAND OUTLOOK 2016 TO 2020 27 SASKATCHEWAN’S OIL AND GAS INDUSTRY
OCCUPATION (NOC)
ESTIMATED EMPLOYMENT
IN 2015
SCENARIO ESTIMATED JOB CHANGE IN 2016
2017–2020 HIRING DUE TO: 2017–2020 NET HIRING
REQUIREMENTSIndustry activity
Age-related attrition
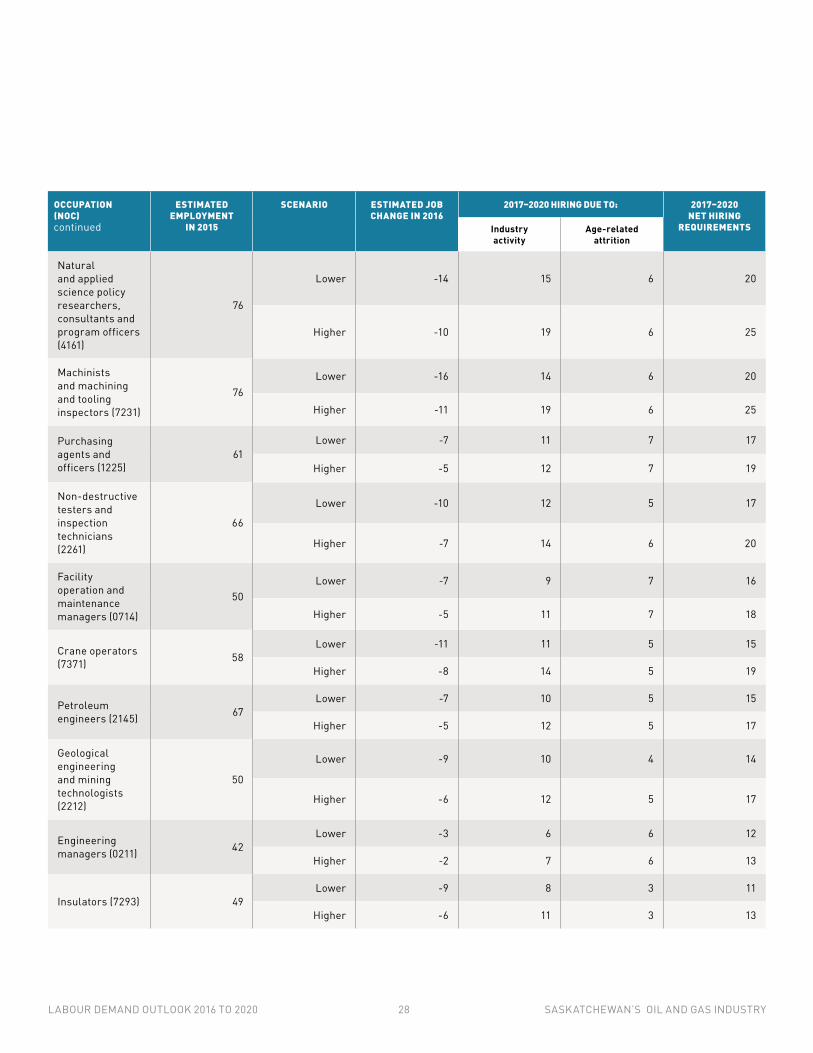
Natural and applied science policy researchers, consultants and program officers (4161)
76
Lower -14 15 6 20
Higher -10 19 6 25
Machinists and machining and tooling inspectors (7231)
76Lower -16 14 6 20
Higher -11 19 6 25
Purchasing agents and officers (1225)
61Lower -7 11 7 17
Higher -5 12 7 19
Non-destructive testers and inspection technicians (2261)
66
Lower -10 12 5 17
Higher -7 14 6 20
Facility operation and maintenance managers (0714)
50Lower -7 9 7 16
Higher -5 11 7 18
Crane operators (7371) 58
Lower -11 11 5 15
Higher -8 14 5 19
Petroleum engineers (2145) 67
Lower -7 10 5 15
Higher -5 12 5 17
Geological engineering and mining technologists (2212)
50
Lower -9 10 4 14
Higher -6 12 5 17
Engineering managers (0211) 42
Lower -3 6 6 12
Higher -2 7 6 13
Insulators (7293) 49Lower -9 8 3 11
Higher -6 11 3 13
continued
LABOUR DEMAND OUTLOOK 2016 TO 2020 28 SASKATCHEWAN’S OIL AND GAS INDUSTRY
OCCUPATION (NOC)
ESTIMATED EMPLOYMENT
IN 2015
SCENARIO ESTIMATED JOB CHANGE IN 2016
2017–2020 HIRING DUE TO: 2017–2020 NET HIRING
REQUIREMENTSIndustry activity
Age-related attrition
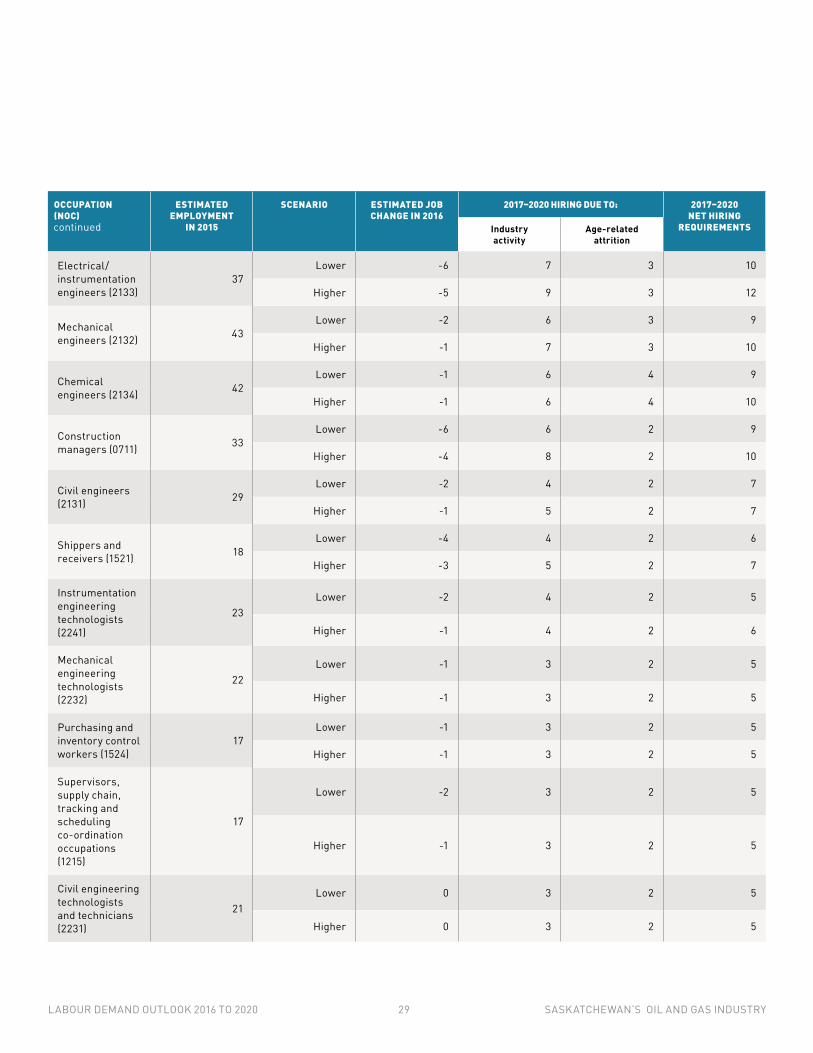
Electrical/instrumentation engineers (2133)
37Lower -6 7 3 10
Higher -5 9 3 12
Mechanical engineers (2132) 43
Lower -2 6 3 9
Higher -1 7 3 10
Chemical engineers (2134) 42
Lower -1 6 4 9
Higher -1 6 4 10
Construction managers (0711) 33
Lower -6 6 2 9
Higher -4 8 2 10
Civil engineers (2131) 29
Lower -2 4 2 7
Higher -1 5 2 7
Shippers and receivers (1521) 18
Lower -4 4 2 6
Higher -3 5 2 7
Instrumentation engineering technologists (2241)
23Lower -2 4 2 5
Higher -1 4 2 6
Mechanical engineering technologists (2232)
22Lower -1 3 2 5
Higher -1 3 2 5
Purchasing and inventory control workers (1524)
17Lower -1 3 2 5
Higher -1 3 2 5
Supervisors, supply chain, tracking and scheduling co-ordination occupations (1215)
17
Lower -2 3 2 5
Higher -1 3 2 5
Civil engineering technologists and technicians (2231)
21Lower 0 3 2 5
Higher 0 3 2 5
continued
LABOUR DEMAND OUTLOOK 2016 TO 2020 29 SASKATCHEWAN’S OIL AND GAS INDUSTRY
OCCUPATION (NOC)
ESTIMATED EMPLOYMENT
IN 2015
SCENARIO ESTIMATED JOB CHANGE IN 2016
2017–2020 HIRING DUE TO: 2017–2020 NET HIRING
REQUIREMENTSIndustry activity
Age-related attrition
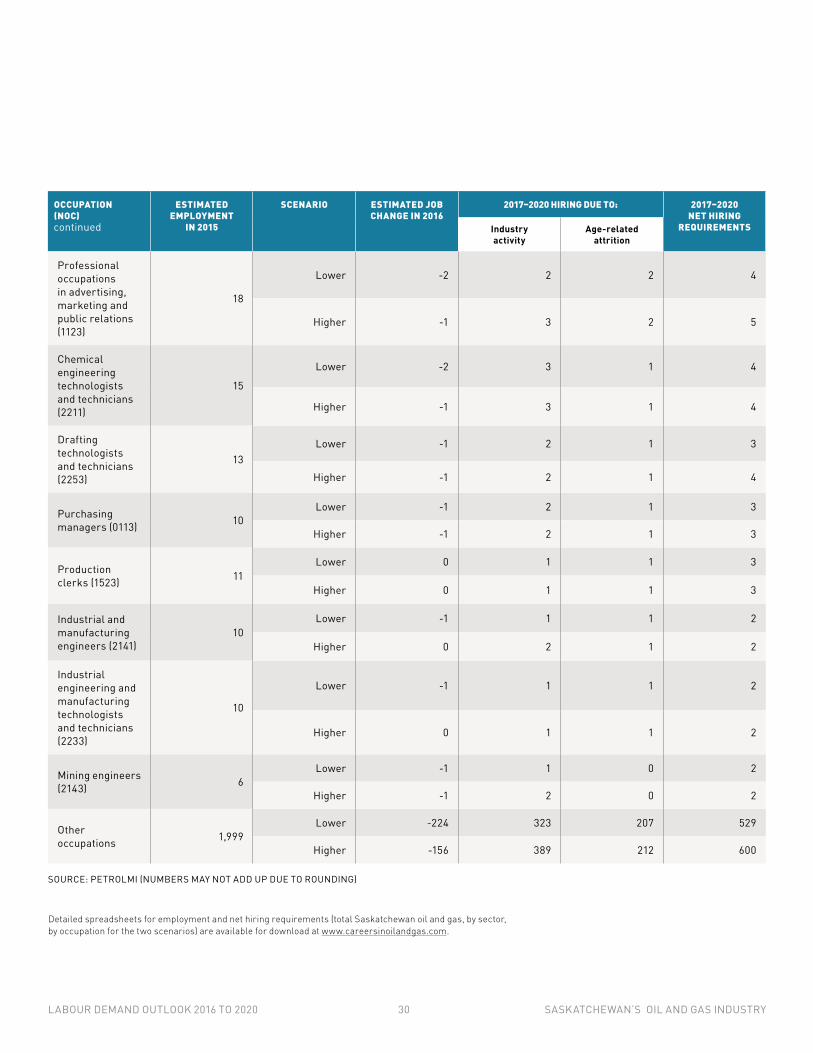
Professional occupations in advertising, marketing and public relations (1123)
18
Lower -2 2 2 4
Higher -1 3 2 5
Chemical engineering technologists and technicians (2211)
15
Lower -2 3 1 4
Higher -1 3 1 4
Drafting technologists and technicians (2253)
13Lower -1 2 1 3
Higher -1 2 1 4
Purchasing managers (0113) 10
Lower -1 2 1 3
Higher -1 2 1 3
Production clerks (1523) 11
Lower 0 1 1 3
Higher 0 1 1 3
Industrial and manufacturing engineers (2141)
10Lower -1 1 1 2
Higher 0 2 1 2
Industrial engineering and manufacturing technologists and technicians (2233)
10
Lower -1 1 1 2
Higher 0 1 1 2
Mining engineers (2143) 6
Lower -1 1 0 2
Higher -1 2 0 2
Other occupations 1,999
Lower -224 323 207 529
Higher -156 389 212 600
SOURCE: PETROLMI (NUMBERS MAY NOT ADD UP DUE TO ROUNDING)
Detailed spreadsheets for employment and net hiring requirements (total Saskatchewan oil and gas, by sector, by occupation for the two scenarios) are available for download at www.careersinoilandgas.com.
continued
LABOUR DEMAND OUTLOOK 2016 TO 2020 30 SASKATCHEWAN’S OIL AND GAS INDUSTRY

Age-related attrition: Jobs vacated due to retirements and deaths.
Attraction: Activities based around the goal of attracting workers to a company, organization or industry.
Capital expenditures (CAPEX): Funds used by a company to acquire or upgrade physical assets such as property, industrial buildings or equipment. It is often used to undertake new projects or investments.
Carbon (CO₂) sequestration: Capturing carbon dioxide (CO₂) from the atmosphere or from large-scale stationary sources like power plants and refineries before it is released to the atmosphere.
Conventional: Process of recovering petroleum from a well using standard drilling production methods.
Conventional exploration and production (E&P) sector: Activity for conventional and unconventional oil and gas reserves, excluding oil sands.
Downstream (sector): Term commonly used to refer to the refining of crude oil, and the selling and distribution of natural gas and products derived from crude oil.
Employment: The number of workers required to support the activity levels in a given year (direct employment only).
Enhanced oil recovery (EOR): The implementation of various techniques for increasing the amount of crude oil that can be extracted from an oil field. Enhanced oil recovery is also called improved oil recovery or tertiary recovery.
Hiring due to industry activity: This is the projected change in the number of workers required to support industry activity levels.
Labour demand: Number of workers required to fill job vacancies.
Labour market: Collective term describing the dynamics and interaction of workers and employers, including employment, unemployment, participation rates and wages.
Labour shortage: Labour supply is less than labour demand.
Labour supply: Availability of suitable workers in a labour market.
Liquefied natural gas (LNG): Natural gas that undergoes a cooling process and converted to liquid for ease of storage and/or transportation.
National Occupational Classification (NOC): Developed and updated in partnership with Statistics Canada, the NOC provides a standardized language for describing the work performed by Canadians in the labour market.
Net hiring requirements: Sum of job openings created due to industry activity plus age-related attrition.
Offshore: Exploration for oil and/or natural gas located offshore, often in oceans or other large bodies of water. The offshore industry in Canada is mainly found in Newfoundland and Labrador and Nova Scotia.
Oil and gas services sector: Contracted exploration, extraction and production services to the E&P and oil sands sectors. This sector includes: drilling and completions services, geophysical services and petroleum services.
Oil sands sector: Sector of the petroleum industry involved in the extraction and upgrading of bitumen.
Operating expenditures (OPEX): A category of expenditure that a business incurs as a result of performing its normal business operations.
Petroleum industry: Global processes of exploration extraction, refining, transporting and marketing petroleum products.
Pipeline sector: Petroleum industry sector responsible for mainline transmission for transporting daily crude oil and natural gas production.
Retention: Activities based around keeping, or retaining, workers within a company, organization or industry.
Sector: Subset of an industry.
Shale: Fine-grained sedimentary rock from which liquid hydrocarbons can be extracted.
Thermal oil recovery: The use of heat energy to enhance and facilitate the recovery of oil.
Transferability: Ability for something to be transferred. In this report, this term refers to the ability to transfer skills from one occupation, sector or industry to another.
Unemployment rate: Percentage of the economically active population that are not working but want to work and are actively looking for employment.
Upgrading: Process by which heavy oil and bitumen are converted into lighter crude by increasing the ratio of hydrogen to carbon, normally using either coking or hydroprocessing.
Upstream petroleum industry: Includes searching for, recovering and producing crude oil and natural gas.
Waterflooding: Method of enhanced oil recovery where water is injected into the oil reservoir to increase pressure and thereby stimulate production. Following waterflooding, Carbon (CO2) flooding, may be used to further enhance production. Once the injection of water causes the reservoir pressure to increase, the next step is to pump the CO2 down through the same injection wells.
Workforce: Labour pool available in an industry and/or sector.
APPENDIX 3: GLOSSARY
LABOUR DEMAND OUTLOOK 2016 TO 2020 31 SASKATCHEWAN’S OIL AND GAS INDUSTRY

ACKNOWLEDGMENTS
The Petroleum Labour Market Information (PetroLMI) Division of Enform gratefully acknowledges the Government of Canada’s department of Employment and Social Development Canada and the Government of Saskatchewan through the Ministry of Economy for the funding to undertake and complete this study.
PetroLMI is also grateful for the time and expertise provided by ARC Financial Corp., petroleum companies, industry associations, provincial representatives and other stakeholders.
Last but not least, PetroLMI acknowledges the contributions of Creative Links International Inc., Cheryl Knight and Associates, Stacy Kindopp, Dynawise Inc., Prism Economics and Analysis and Projektor Brand Image Ltd. for assisting in the production of this report.
LABOUR DEMAND OUTLOOK 2016 TO 2020 32 SASKATCHEWAN’S OIL AND GAS INDUSTRY

Disclaimer
All rights reserved.
The reader of this report has permission to use “limited labour market information (or LMI) content” for general reference or educational purposes in the reader’s analysis or research reports. “Limited LMI Content” is defined as not exceeding 400 words or a maximum of two data tables or graphs per document. Where Limited LMI Content is used, the reader must cite the source of the Limited LMI Content as follows: Source (or “adapted from”): PetroLMI, name or product, catalogue, volume and issue numbers, reference period and page(s).
The reader of this report cannot: • Market, distribute, export, translate,
transmit, merge, modify, transfer, adapt, loan, rent, lease, assign, share, sub-license or make available to another person or entity, this report in any way, in whole or in part
• Use this report and its contents to develop or derive any other information product or information service for commercial distribution or sale
• Use this report and its contents in any manner deemed competitive with any other product or service sold by PetroLMI
The information and projections contained herein have been prepared with information sources PetroLMI has deemed to be reliable.
PetroLMI makes no representations or warranties that this report is error free and therefore shall not be liable for any financial or other losses or damages of any nature whatsoever arising from or otherwise relating to any use of this document.
The opinions and interpretations in this publication are those of PetroLMI and do not necessarily reflect those of the Government of Canada.
For more information, contact:Petroleum Labour Market Information (PetroLMI) Division of EnformPhone: 403-516-8100Email: [email protected]
Back cover photo credits Top left: Cenovus.
Copyright © PetroLMI 2016
Published April 2016
The Petroleum Labour Market Information (PetroLMI) Division of Enform is a leading resource for labour market information and trends in the Canadian petroleum industry.
PetroLMI specializes in providing petroleum labour market data, analysis and insights, as well as occupation profiles and other resources for workforce and career planning.
With the support of industry, PetroLMI has developed the Careers in Oil + Gas website to provide its resources and key industry information to those in workforce planning or who are planning and pursuing careers in the oil and gas industry.
Follow us: