Embed Size (px)
Citation preview

SAT Aircraft Characteristics to be used for Demand Calculation
Document Number: SAT-Rdmp T1.2.1-InputDataDemCalc-V0
Page 2 of 32
Table of contents:
1 INTRODUCTION ...................................................................................................................... 3
2 DEFINITIONS AND EXPLANATIONS ................................................................................... 5
3 SAT AIRCRAFT CLASSIFICATION AND USE CATEGORIES ........................................... 10
3.1 CLASSES OF SAT AIRCRAFT ........................................................................................... 10
3.2 DISTRIBUTION OF PROJECTED RANGE OF SERVICE FOR THE CLASSES OF
AIRPLANES ............................................................................................................................... 11
3.3 OPERATIONAL COSTS ..................................................................................................... 11
SAT Aircraft Characteristics to be used for Demand Calculation
Document Number: SAT-Rdmp T1.2.1-InputDataDemCalc-V0
Page 3 of 32
1 INTRODUCTION
In 2006 The European Commission funded a SSA project named “European Personal Air
Transportation System – Study” – acronym EPATS under Framework Programme 6. The
EPATS project investigated an alternative to road transport means for business travellers by
offering a personal air transport system on distances longer than 200 km.
EPATS as a segment of high-speed transport market, which serves local and interregional low
traffic connections consists of the three main parts: Aircraft (small 4 to 19 seater - piston,
turboprop, jet); Infrastructure (on the ground and in the air - Regional Airports + ATM/ATC
services integrated in SESAR for Small Aircraft) and Informatized logistic network (working
on the basis of SESAR’s System Wide Information Management).
Project has executed in period January 2007 up to June 2008. Deliverables and Reports can be
found on webpage http://www.epats.eu/ .
Main results of EPATS project are defining potential Market in Europe for EPATS services in
2020. Using the methodology based on the generalized cost concept for business travellers the
EPATS project concluded that the potential transfer of traffic from road to Small Air Transport
would reach 40 million flight movements using around 90.000 personal aircraft in Europe in
2020.
The figures was cited as a number of opportunities for new air transport vehicles in ACARE
background document - “Beyond Vision 2020 (Towards 2050)” and also in bibliography to the
document EPATS Deliverable “D2.1 potential transfer of passenger demand to personal aviation
by 2020” can be found.
This aeronautical strategy documents and also the Agenda for Sustainable Future in Business and
General Aviation (recommended by the EU Parliament Resolution on 3rd February 2009) need
“to improve the understanding of the commercial role that small-size aircraft operating on
scheduled or non-scheduled flights can play as a component of the Air Transport System, in
order to satisfy the needs of transportation in regions where transport networks (especially
surface transport) are underdeveloped”. This clause was taken from framework of FP7-
AERONAUTICS and AIR TRANSPORT (AAT)-2010-RTD-1 Topic AAT.2010.7-12
“Assessing and further developing the role of small aircraft in the air transport system”.
Therefore 14 partners from 9 European countries representing Industry, Research, Academia,
and SMEs (with wide spectrum of expertise) decided to prepare proposal which will be fit to
above mentioned Topic and will explore deeply EPATS subjects.
The project use CSA-CA financial tool and it title is “Small Air Transport – Roadmap”
acronym SAT-Rdmp. It started in January 2011 and will last up to June 2012.
Main issues of the SAT-Rdmp study (CSA-SA) proposal are:
• Definition of a common vision of the small aircraft transport system for inter-regional
mobility and redefining demand, through the identification of the corresponding
SAT Aircraft Characteristics to be used for Demand Calculation
Document Number: SAT-Rdmp T1.2.1-InputDataDemCalc-V0
Page 4 of 32
requirements. The requirements will identify the technology needs and regulatory issues
to be addressed.
• Definition of a business case compliant with the identified requirements which describes
the relations among all the system’s components.
• Assessment of current capabilities versus the ATS demand, collection of previous
results and involvement of the stakeholders in Europe among all actors (manufacturers,
research establishment, EASA, airspace users, infrastructure providers, airport managers,
small aircraft service providers).
• Definition of a roadmap to fill the technology/regulatory/operative gaps in order to
fulfil the requirements considering the current capabilities. Identification of
dissemination actions and establishment of a network of stakeholders.
• Assessment of risks and benefits of the identified new system’s concept.
Very important issue is exploration Small Air Transport System for interregional mobility and
redefining demand. This work are foreseen in sub-task 1.2:
Task 1.2: Small Air Transport Aircraft Demand (M3S+BUTE+IoA+DUT+PIAGGIO)
In this subtask the demand for the use of Small Aircraft in the Air Transport System will be
evaluated. A demand model will be adopted in front of different scenarios and considering
uncertainty of input parameters.
Thus the activity performed in this subtask can be summarized as follows:
o Identification of the available inputs for the demand model;
o State-of-art of applicable demand models (revision of the relevant demand modelling
techniques, also the one made for the EPATS project);
o Refinement of the demand model made in the EPATS project with socio-economic
factors;
o Running of the new demand formula through a Monte-Carlo simulation in order to get
the probability of the occurrence of the demand estimation results;
o Demand estimation in chosen considered scenario;
o Sensitivity analysis in order to analyse the impact of each input parameter on the model's
outcome, such as the effect of fuel price increase on the demand of the Small Air
Transport aircraft;
A demand model outcome will consist of: required capacity such as number of aircraft per a
specific time interval, type of aircraft (Passengers and Regional Carriers, Non scheduled, Air
Taxi, General Aviation), geographical area allocation, required airports and related facilities
specifying Air Traffic Volume and Fuel Flowage.
This document “T1.2.1 SMALL AIR TRANSPORT AIRCRAFT CHARACTERISTICS
TO BE USED FOR DEMAND CALCULATION” defined input data for Task T.1.2
“Demand of Small Air Transport Aircraft”.
SAT Aircraft Characteristics to be used for Demand Calculation
Document Number: SAT-Rdmp T1.2.1-InputDataDemCalc-V0
Page 5 of 32
2 DEFINITIONS AND EXPLANATIONS
Cost estimation is based on algorithm and data included in Conclin&deDecker “Life Cycle Cost”
Program. Besides specification of current passenger air transport market the estimation takes into
consideration systemic and network character of projected Small Aircraft Transport System both
in technical and economic fields.
Total utilization costs can be divided into three main groups:
1. Variable costs
2. Fixed Costs
3. Other Costs
All of them consist of direct and indirect operating costs.
Key assumptions:
- Aircraft operated by specified company. Expected type and operator’s activity profile
resulted from process analysis or/and discussion of PPs. Other assumptions concerning
this issue listed below.
- Maximum reduction of fixed cost share was considered as one of the most important
priority concerning company mission profile definition.
- Expected length of aircraft utilization process estimated at 20 years.
- Purchase is assumed as a main aircraft acquisition method.
- Average annual flight hours – 3 scenarios: 500FH/YR, 1000 FH/YR and 1500FH/YR
- Average mission distance: For piston aircraft (ACP-1 and ACP-2) – 300km, for
turboprop engine (ACT-1 and ACT-2) – 600km and 900km in case of jet engine aircraft
(ACJ-1 and ACJ-2).
Variable costs
Fuel costs
Estimation based on average hourly fuel consumption during typical mission. Assumed fuel
price – retail price reduced by 10% (in wholesale):
- JETA-1 – EUR 1,00 and
- AVGAS 100LL – EUR 1,36.
Calculation based on average retail price in October 2010 in Poland.
CO2 Offset Cost It is proportional to fuel burnt according to the relation included in Conclin&deDecker software:
CO2Cost = FFlow*2,55/1000*C2Price
Currently air transport is not included in “Emission Trading Scheme”. The situation will change
with the beginning of 2012 when ETS will cover air transport as well. Nevertheless it is claimed
that due to ETS exclusions Small Aircraft Transport System will not be charged with CO2 offset
cost1.
1 According to 2006/101/EC amongst others the activity shall not include: flight performed by aircraft with a
certified maximum take-off mass of less than 5700 kg, flights performed in the framework of public service
obligation and operators which operate fewer than 243 flights per period for three consecutive three-month periods
or flights with total annual emission lower than 10000 tonnes per year (for twin-engine VLJ it is equivalent of 16000
flight hours per year, for single-engine piston aircraft it means about 56000 FH/YR)
SAT Aircraft Characteristics to be used for Demand Calculation
Document Number: SAT-Rdmp T1.2.1-InputDataDemCalc-V0
Page 6 of 32
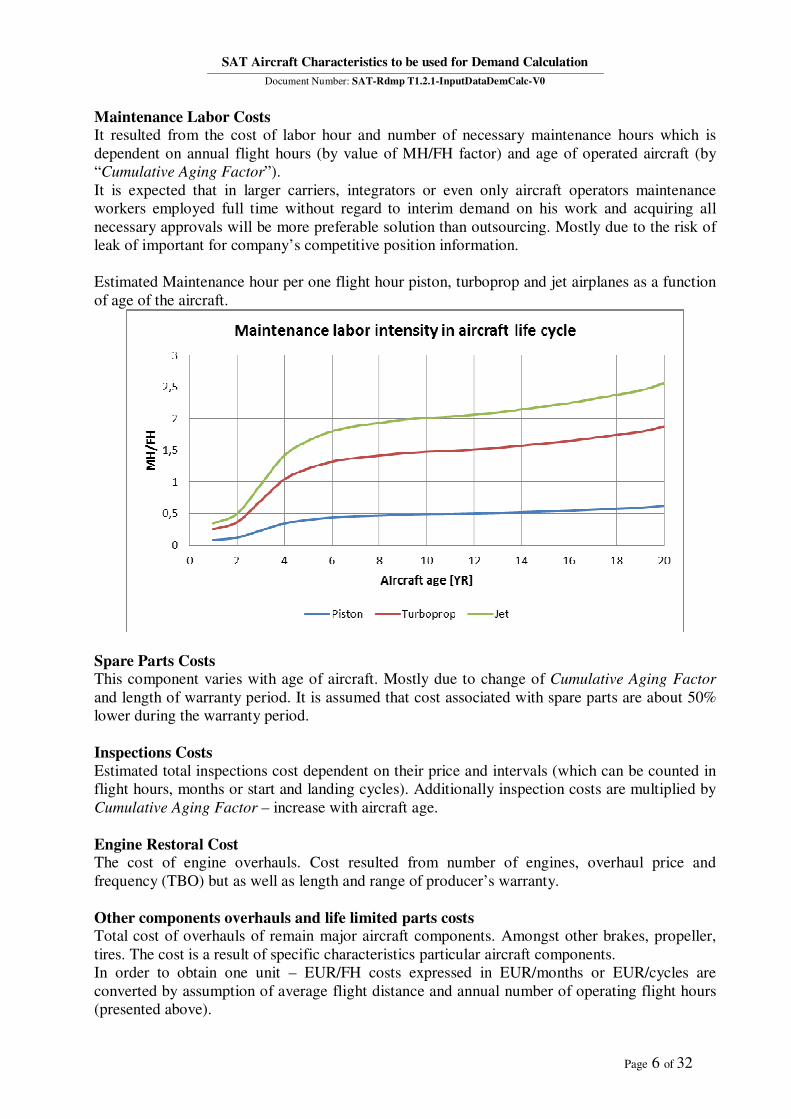
Maintenance Labor Costs It resulted from the cost of labor hour and number of necessary maintenance hours which is
dependent on annual flight hours (by value of MH/FH factor) and age of operated aircraft (by
“Cumulative Aging Factor”).
It is expected that in larger carriers, integrators or even only aircraft operators maintenance
workers employed full time without regard to interim demand on his work and acquiring all
necessary approvals will be more preferable solution than outsourcing. Mostly due to the risk of
leak of important for company’s competitive position information.
Estimated Maintenance hour per one flight hour piston, turboprop and jet airplanes as a function
of age of the aircraft.
Spare Parts Costs This component varies with age of aircraft. Mostly due to change of Cumulative Aging Factor
and length of warranty period. It is assumed that cost associated with spare parts are about 50%
lower during the warranty period.
Inspections Costs
Estimated total inspections cost dependent on their price and intervals (which can be counted in
flight hours, months or start and landing cycles). Additionally inspection costs are multiplied by
Cumulative Aging Factor – increase with aircraft age.
Engine Restoral Cost The cost of engine overhauls. Cost resulted from number of engines, overhaul price and
frequency (TBO) but as well as length and range of producer’s warranty.
Other components overhauls and life limited parts costs Total cost of overhauls of remain major aircraft components. Amongst other brakes, propeller,
tires. The cost is a result of specific characteristics particular aircraft components.
In order to obtain one unit – EUR/FH costs expressed in EUR/months or EUR/cycles are
converted by assumption of average flight distance and annual number of operating flight hours
(presented above).
SAT Aircraft Characteristics to be used for Demand Calculation
Document Number: SAT-Rdmp T1.2.1-InputDataDemCalc-V0
Page 7 of 32
Unscheduled maintenance cost
It is predicted that unscheduled maintenance cost will equal to about 10% of total aircraft
maintenance costs.
Landing fees
Cost charged by airport operators including start and landing procedure as well as ground
service, passenger service and fees resulted from noise restrictions. Polish regional airport
market analysis resulted in conclusion that total charges concerning landing and start operations
as well as ground services and noise charge are equal to about EUR 17,00 per one ton of
MTOW. Passenger service in EPATS transport system does not involve large investment thus it
is highly expected that passenger charge will vary about EUR 8,00 per passenger.
Route and terminal charges
Average adjusted unit rates (AUR) in the European Union is about EUR 57. Route charge (RC)
is calculated according to EUROCONTROL equation2:
RC [EUR] = AUR*Dis*(1/50*MTOW)0,5
Where:
Dis [km] – distance between origin and destination airports expressed in hundreds of kilometers
and reduced by 20 km for every start and landing operation. In this analysis Dis is an average
mission distance mentioned above and reduced by 40 kilometers.
Average in UE Terminal charges (TC) is calculated according to the EUROCONTROL
equation:
TC [EUR] = AUR*(MTOW)0,7
It is expected that small piston aircraft will have possibility to flight in uncontrolled area. Both
jet and turboprop aircraft will have to pay route charge. All types of EPATS aircraft will be
obliged to pay terminal charge. Nevertheless, according to 1794/2006 Members State shall
exempt from en route and terminal charges flights performed by aircraft of which maximum
take-off weight authorized is less than two metric tons.
Crew expenses Costs associated with crew travelling allowances. Generally it is expected that in most cases
crew will end their working day at the place (airport) where they will be employed. Thus it is
predicted that crew expenses cost will not appear.
2 According to regulation included in Commission Regulation (EC) No 1794/2006 of 6 December 2006 laying down
a common charging scheme for air navigation services.
SAT Aircraft Characteristics to be used for Demand Calculation
Document Number: SAT-Rdmp T1.2.1-InputDataDemCalc-V0
Page 8 of 32
Fixed costs
Salary costs
Costs concerning pilots, airworthiness specialists, maintenance technicians and unskilled
workers’ salaries. Data included in Conclin&deDecker software are based on Business Aviation
Association resources.
Data related to the European market indicate that average European pilots salary is about 30
percent lower, both for captain and first officer3.
Maintenance technicians earn in Poland between 20 and 40 thousand of Euro per year. It is
predicted that average EPATS technician salary will be about 30 thousand of Euro per year.
Airworthiness specialists’ salary in Poland varies between 10 thousand and 30 thousand of Euro
yearly. It is predicted that they salaries will equal to about 25 thousand of Euro.
Remain labor workers – unskilled, mainly employed in order to maintain passenger cabin, clean,
perform minor repairs etc. It is expected that their wages will amount to about 7 thousand of
Euro per year.
Other issue is number of workers necessary to realize company’s mission. According to current
regulation maximum flight duration of crew members cannot exceed 900 hours per year and 100
hours per month. It is assumed that number of crews is directly proportional to airplane yearly
flight hours (including part-time employment).
Number of maintenance technician depends on fleet structure - number of aircraft (types), fleet
ages and intensity of utilization as well. Number of technicians (or their working time) is
resulted from MH/FH factor specified for each aircraft. For piston aircraft any increase of 500
flight hours per year implies additional part-time (one-third) maintenance technician.
It is predicted that one airworthiness specialist will be able to conduct operation process of not
more than two types or two makes of aircraft at the same time. Thus it is assumed that one
aircraft will involve half-time airworthiness specialist.
Unskilled staff size is resulted from total number of fleet passenger seat. According to
Conclin&deDecker assumptions one seat in piston aircraft require about 10 hours of work per
year, one seat in turboprop and jet aircraft 20 and 30 hours per year respectively. Half-time per
aircraft is added for usual clean service.
Additionally for entire staff it is predicted benefits equal to about 10% of salary.
Hangar costs
According to small airport offer it is assumed that for smaller aircraft it is about EUR 400 (4-6
seats) per month. For larger about EUR 800.
Liability insurance cost
Insurance cost is partly resulted from European regulation included in 785/2004/EU defining
minimal amount for which every passenger and third party should be insured. According to it for
EPATS aircraft it will be sum between 3 and 18 million of SDR per seat for passengers and third
party. At the end of 2009 in Poland the amount of insurance contribution for 11th risk group was
equal to 0,041%. Estimated liability insurance cost is the product of insurance contribution and
amount of compensation.
3 Information based on author’s market reconnaissance.
SAT Aircraft Characteristics to be used for Demand Calculation
Document Number: SAT-Rdmp T1.2.1-InputDataDemCalc-V0
Page 9 of 32
Hull insurance cost Mainly due to market size it is assumed that hull insurance for EPATS aircraft will be higher by
10% than the rates in the USA (included in Conclin&deDecker database). It is confirmed by
offer received from Polish insurance agent.
Training cost
Due to difficulties in the cost estimation in Europe it is assumed the same values as included in
Conclin&deDecker (specified for every aircraft).
Registration and legalization of transport activity costs
In Poland estimated cost concerning obtaining all necessary permissions and licensees is equal to
1000 Euro per year per aircraft (average yearly cost in 20 year period).
Modernization cost
It mainly related to updating and upgrading of avionic systems and optional service bulletins.
According to Conclin&deDecker database for piston aircraft it is about 500 Euro per year for
new aircraft and 2500 for older than 10 years. For other types of aircraft it is between 15
thousand of Euro for new ones and 40 thousand of Euro for older than 10 years ones.
Passenger cabin maintenance costs
Cost of cleaning equipment. It is assumed that the cost will not exceed 250 euro per year per
aircraft.
Other Costs
Aircraft Purchase cost
Cost of Aircraft purchase reduced by aircraft residual value. After twenty-year period average
residual value for piston aircraft is equal to 16 percent, turboprop 18 percent and for jet aircraft
32 percent of purchase price.
Operation overhead and administrative overhead costs It is assumed that each of mentioned above cost is equal to about 15 percent of total variable cost
plus fixed cost.
SAT Aircraft Characteristics to be used for Demand Calculation
Document Number: SAT-Rdmp T1.2.1-InputDataDemCalc-V0
Page 10 of 32
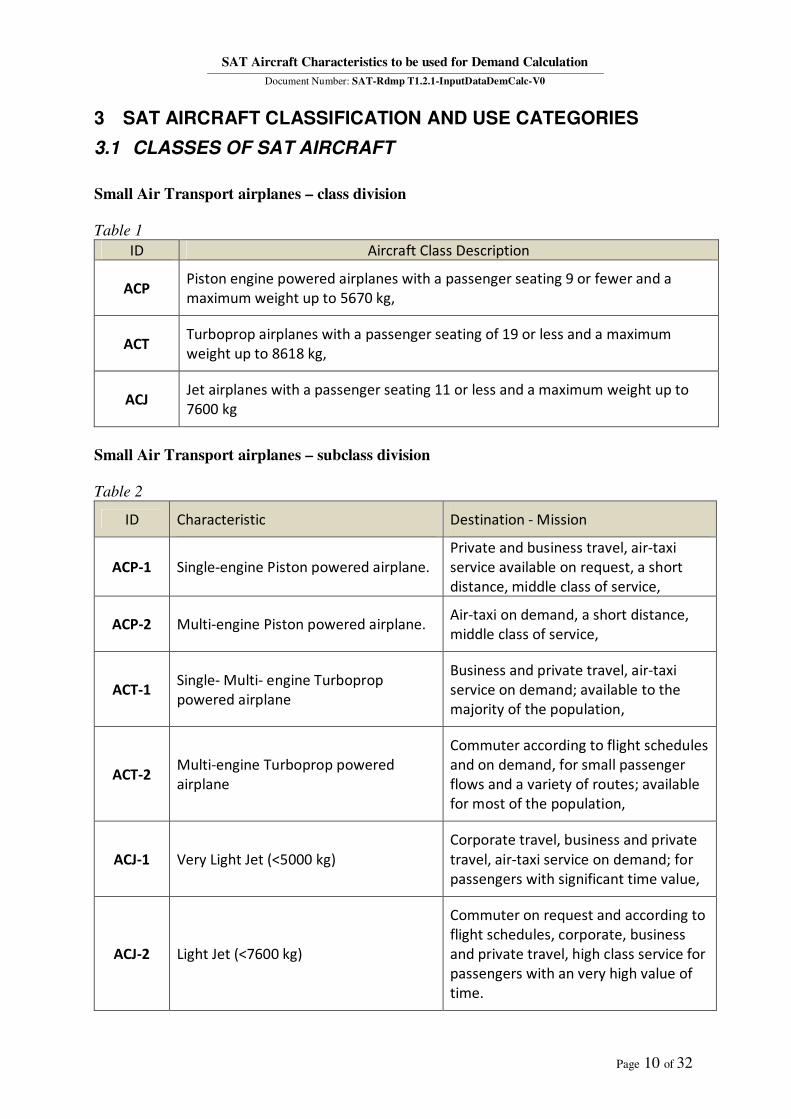
3 SAT AIRCRAFT CLASSIFICATION AND USE CATEGORIES
3.1 CLASSES OF SAT AIRCRAFT
Small Air Transport airplanes – class division
Table 1
ID Aircraft Class Description
ACP Piston engine powered airplanes with a passenger seating 9 or fewer and a
maximum weight up to 5670 kg,
ACT Turboprop airplanes with a passenger seating of 19 or less and a maximum
weight up to 8618 kg,
ACJ Jet airplanes with a passenger seating 11 or less and a maximum weight up to
7600 kg
Small Air Transport airplanes – subclass division
Table 2
ID Characteristic Destination - Mission
ACP-1 Single-engine Piston powered airplane.
Private and business travel, air-taxi
service available on request, a short
distance, middle class of service,
ACP-2 Multi-engine Piston powered airplane. Air-taxi on demand, a short distance,
middle class of service,
ACT-1 Single- Multi- engine Turboprop
powered airplane
Business and private travel, air-taxi
service on demand; available to the
majority of the population,
ACT-2 Multi-engine Turboprop powered
airplane
Commuter according to flight schedules
and on demand, for small passenger
flows and a variety of routes; available
for most of the population,
ACJ-1 Very Light Jet (<5000 kg)
Corporate travel, business and private
travel, air-taxi service on demand; for
passengers with significant time value,
ACJ-2 Light Jet (<7600 kg)
Commuter on request and according to
flight schedules, corporate, business
and private travel, high class service for
passengers with an very high value of
time.
SAT Aircraft Characteristics to be used for Demand Calculation
Document Number: SAT-Rdmp T1.2.1-InputDataDemCalc-V0
Page 11 of 32
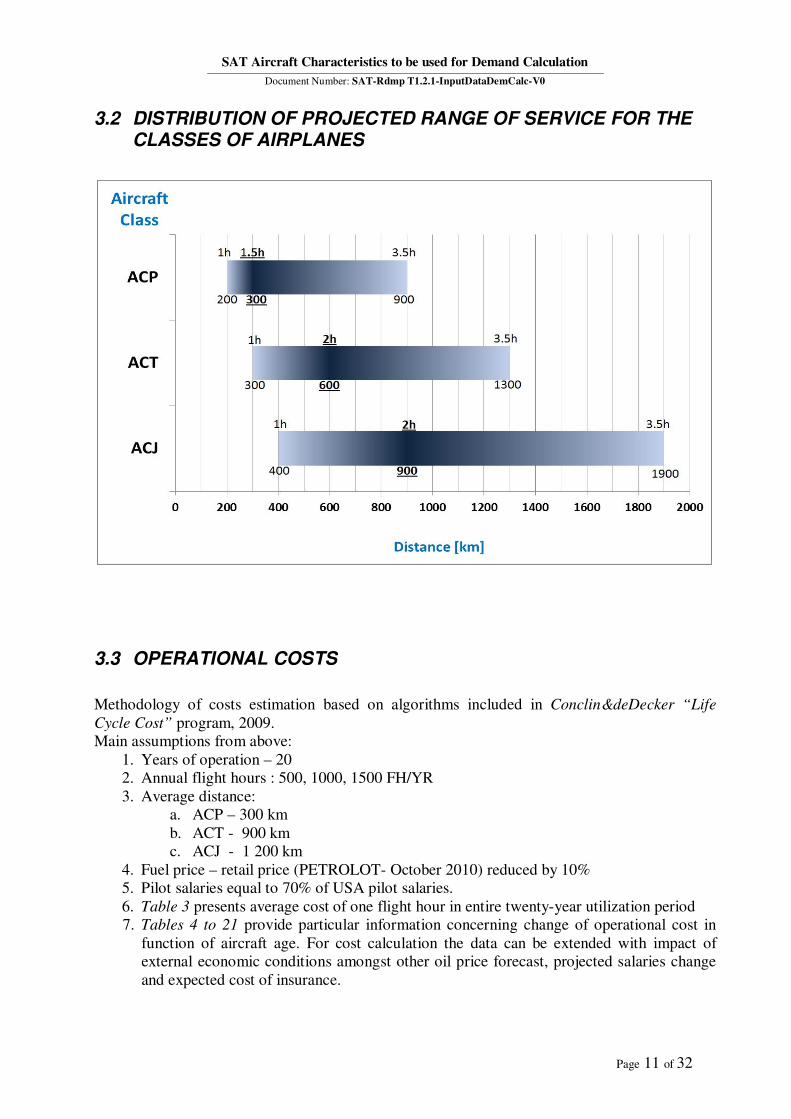
3.2 DISTRIBUTION OF PROJECTED RANGE OF SERVICE FOR THE
CLASSES OF AIRPLANES
3.3 OPERATIONAL COSTS
Methodology of costs estimation based on algorithms included in Conclin&deDecker “Life
Cycle Cost” program, 2009.
Main assumptions from above:
1. Years of operation – 20
2. Annual flight hours : 500, 1000, 1500 FH/YR
3. Average distance:
a. ACP – 300 km
b. ACT - 900 km
c. ACJ - 1 200 km
4. Fuel price – retail price (PETROLOT- October 2010) reduced by 10%
5. Pilot salaries equal to 70% of USA pilot salaries.
6. Table 3 presents average cost of one flight hour in entire twenty-year utilization period
7. Tables 4 to 21 provide particular information concerning change of operational cost in
function of aircraft age. For cost calculation the data can be extended with impact of
external economic conditions amongst other oil price forecast, projected salaries change
and expected cost of insurance.

SAT Aircraft Characteristics to be used for Demand Calculation
Document Number: SAT-Rdmp T1.2.1-InputDataDemCalc-V0
Page 12 of 32
8. Additionally for 2020 cost calculation particular cost component data (included in Tables
4 to 21) should be multiplied by factors specified below.
9. All costs are calculated at current prices, without taking into account inflation.
Historical data analysis indicates that in 2020:
Fuel consumption will be lower by 5% in ACP
8% in ACT
15% in ACJ
Total maintenance cost through reduced maintenance hour to one flight hour factor (MH/FH) is
expected to be lower by 5% in ACP
10% in ACT
20% in ACJ
All above-mentioned assumptions resulted in Average twenty-year operational cost 2020
included in Table 3
10. According to nomenclature used in EPATS project Average twenty-year operational cost
included in Table 4 constitutes Total Operational Cost can be divided into Direct and
Indirect Operational Costs. As mentioned above it is assumed that Indirect Operational
Costs are Operational and Administrative Overhead Costs and equal to 30% of Variable
Cost plus Fixed Cost. Therefore Indirect Cost account for about 24% of Total
Operational Costs.

SAT Aircraft Characteristics to be used for Demand Calculation
Document Number: SAT-Rdmp T1.2.1-InputDataDemCalc-V0
Page 13 of 32
SAT Aircraft Mission Characteristics
Table 3
Aircraft class ACP-1 ACP-2 ACT-1 ACT-2 ACJ-1 ACJ-2
Passenger seats (number of
pilots) 3 (1) 5 (1) 7 (1) 19 (2) 5 (2) 8 (2)
Cruise Speed [km/h] 270 337 500 533 700 817
Vclimb/Vcruise CC 0,5 0,5 0,55 0,55 0,6 0,6
Climb to cruise level (CT) [min] 10 20 20 20 20 20
Fixed Flight Operation Time
(FFOT) [min] 23 27 37 48 42 46
Waiting & Boarding Time
(WBT) [min] 10 12 15 20 15 18
Average Load Factor (LF)
[pas/PS] 0,7 0,7 0,7 0,7 0,7 0,7
Distance/Great Circle Distance
[D/GCD] 1 1 1,1 1,1 1,15 1,15
Assumptions for cost calculation
Block speed [km/h] 244 313 463 476 654 763
Average Distance [km] 300 300 900 900 1200 1200
Operational costs 2010 and 2020 [EUR/FH]
Annual flight hours [FH] 500 1000 1500 500 1000 1500 500 1000 1500 500 1000 1500 500 1000 1500 500 1000 1500
Average twenty-year
operational costs
2010 [EUR/FH]
DOC 256 215 200 464 409 389 1257 932 822 1725 1393 1282 1496 1355 1290 2053 1845 1755
IOC 77 64 60 139 123 117 377 279 246 518 418 384 449 407 387 616 553 527
Average twenty-year
operational costs
2020 [EUR/FH]
DOC 253 210 197 455 401 381 1230 904 794 1680 1347 1235 1392 1247 1182 1913 1701 1612
IOC 76 63 59 137 120 114 369 271 238 504 404 371 418 374 355 574 510 483
Reference Aircraft Da-40 Diamond Pa-34 Seneca V Pilatus PC-12 Next
Generation Hawker Beech 1900D Cessna Citation CJ1+ Hawker Beech 400XP

SAT Aircraft Characteristics to be used for Demand Calculation
Document Number: SAT-Rdmp T1.2.1-InputDataDemCalc-V0
Page 14 of 32
Table 4 ACP-1 DA-40
Aircraft Value €: 218415,29 Res. Value €: 43575,77 Annual Utilization (FH/YR): 500
Variable Cost/YR 1 2 3 4 5 6 7 8 9 10 11 12 13 14 15 16 17 18 19 20 Total
Fuel 28 099 28 099 28 099 28 099 28 099 28 099 28 099 28 099 28 099 28 099 28 099 28 099 28 099 28 099 28 099 28 099 28 099 28 099 28 099 28 099 561 983
Parts 344 492 1 901 2 819 3 278 3 573 3 737 3 836 3 934 3 999 4 032 4 098 4 163 4 262 4 360 4 458 4 590 4 721 4 852 5 081 72 531
Inspections 1 570,7 1 577 1 577 1 577 1 577 1 719 1 798 1 845 1 893 1 924 1 940 1 971 2 003 2 050 2 098 2 145 2 208 2 271 2 334 2 445 38 529
Engine Restoral 14 463 14 463 14 463 14 463 14 463 72 314
Component
Overhaul (All) 751 751 2 466 751 751 2 466 751 751 1 715 751 751 751 2 466 751 2 466 751 751 20 585
Life Limited
Components (All) 234 234 234 234 234 234 234 234 234 234 234 234 234 234 234 234 3 747
Unscheduled
Maintenance 1 033 1 033 1 033 1 033 1 033 1 033 1 033 1 033 1 033 1 033 1 033 1 033 1 033 1 033 1 033 1 033 1 033 1 033 1 033 1 033 20 661
ATC & Nav. Fees 1 707 1 707 1 707 1 707 1 707 1 707 1 707 1 707 1 707 1 707 1 707 1 707 1 707 1 707 1 707 1 707 1 707 1 707 1 707 1 707 34 145
Landing Fees 23 632 23 632 23 632 23 632 23 632 23 632 23 632 23 632 23 632 23 632 23 632 23 632 23 632 23 632 23 632 23 632 23 632 23 632 23 632 23 632 472 630
Tot Variable costs 56 392 57 525 58 934 76 030 60 311 59 763 60 991 77 314 61 282 61 379 62 158 75 988 61 622 61 768 63 628 75 537 62 253 64 162 62 642 77 444 1 297 126
Fixed Cost / YR 1 2 3 4 5 6 7 8 9 10 11 12 13 14 15 16 17 18 19 20 Total
Cockpit Crew Sal. 10 963 10 963 10 963 10 963 10 963 10 963 10 963 10 963 10 963 10 963 10 963 10 963 10 963 10 963 10 963 10 963 10 963 10 963 10 963 10 963 219 256
Airworthiness
specialists Sal. 12 466 12 466 12 466 12 466 12 466 12 466 12 466 12 466 12 466 12 466 12 466 12 466 12 466 12 466 12 466 12 466 12 466 12 466 12 466 12 466 249 311
Maint. Techn. Sal. 9 986 9 986 9 986 9 986 9 986 9 986 9 986 9 986 9 986 9 986 9 986 9 986 9 986 9 986 9 986 9 986 9 986 9 986 9 986 9 986 199 725
Other Sal. 3 444 3 444 3 444 3 444 3 444 3 444 3 444 3 444 3 444 3 444 3 444 3 444 3 444 3 444 3 444 3 444 3 444 3 444 3 444 3 444 68 871
Benefits 3 686 3 686 3 686 3 686 3 686 3 686 3 686 3 686 3 686 3 686 3 686 3 686 3 686 3 686 3 686 3 686 3 686 3 686 3 686 3 686 73 716
Hangar 4 821 4 821 4 821 4 821 4 821 4 821 4 821 4 821 4 821 4 821 4 821 4 821 4 821 4 821 4 821 4 821 4 821 4 821 4 821 4 821 96 419
Hull Insurance 2 403 2 403 2 403 2 403 2 403 2 403 2 403 2 403 2 403 2 403 2 403 2 403 2 403 2 403 2 403 2 403 2 403 2 403 2 403 2 403 48 051
Liability Insurance 5 096 5 096 5 096 5 096 5 096 5 096 5 096 5 096 5 096 5 096 5 096 5 096 5 096 5 096 5 096 5 096 5 096 5 096 5 096 5 096 101 928
Training
Pilot/Maint. 399 399 399 399 399 399 399 399 399 399 399 399 399 399 399 399 399 399 399 399 7 989
Registration Fee 689 689 689 689 689 689 689 689 689 689 689 689 689 689 689 689 689 689 689 689 13 774
Brokerage Fee 2 621 2 621
Modernization 1 446 1 446 1 446 1 446 1 446 1 446 1 446 1 446 1 446 1 446 1 446 1 446 1 446 1 446 1 446 1 446 1 446 1 446 1 446 1 446 28 926
Refurbishing 895 895 895 895 895 895 895 895 895 895 895 895 895 895 895 895 895 895 895 895 17 906
Total Fixed Costs 56 294 56 294 56 294 56 294 56 294 56 294 56 294 56 294 56 294 56 294 56 294 56 294 56 294 56 294 56 294 56 294 56 294 56 294 56 294 58 915 1 128 493
Total Acquisition
Cost/Resale 218415 -43 576 174 840
Oper. Overhead 16 903 17 073 17 284 19 849 17 491 17 409 17 593 20 041 17 636 17 651 17 768 19 842 17 687 17 709 17 988 19 775 17 782 18 068 17 840 20 454 363 843
Admin. Overhead 16 903 17 073 17 284 19 849 17 491 17 409 17 593 20 041 17 636 17 651 17 768 19 842 17 687 17 709 17 988 19 775 17 782 18 068 17 840 20 454 363 843
Total Costs 364 907 147 964 149 796 172 021 151 586 150 874 152 470 173 690 152 849 152 975 153 987 17 1966 153 291 153 480 155 899 171 380 154 111 156 593 154 616 133 691 3 328 145
Variable €/FH 113 115 118 152 121 120 122 155 123 123 124 152 123 124 127 151 125 128 125 155
Var + Fixed €/FH 225 228 230 265 233 232 235 267 235 235 237 265 236 236 240 264 237 241 238 273
Tot Ann Cost
€/FH 730 296 300 344 303 302 305 347 306 306 308 344 307 307 312 343 308 313 309 267

SAT Aircraft Characteristics to be used for Demand Calculation
Document Number: SAT-Rdmp T1.2.1-InputDataDemCalc-V0
Page 15 of 32
Table 5 ACP-1 DA-40
Aircraft Value €: 218415,29 Res. Value €: 43575,77 Annual Utilization (FH): 1000
Variable Cost/ YR 1 2 3 4 5 6 7 8 9 10 11 12 13 14 15 16 17 18 19 20 Total
Fuel 56 198 56 198 56 198 56 198 56 198 56 198 56 198 56 198 56 198 56 198 56 198 56 198 56 198 56 198 56 198 56 198 56 198 56 198 56 198 56 198 1 123 967
Parts 688 983 3 803 5 639 6 556 7 147 7 474 7 671 7 868 7 999 8 064 8 196 8 327 8 523 8 720 8 917 9 179 9 441 9 704 10 163 145 062
Inspections 1 577 1 577 1 577 1 577 1 577 1 719 1 798 1 845 1 893 1 924 1 940 1 971 2 003 2 050 2 098 2 145 2 208 2 271 2 334 2 445 38 529
Engine Restoral 14 463 14 463 14 463 14 463 14 463 14 463 14 463 14 463 14 463 14 463 144 628
Component
Overhaul (All) 751 3 216 751 3 216 1 501 2 466 1 501 2 466 3 216 1 501 2 466 1 501 3 216 751 3 216 751 3 216 3 216 751 3 216 42 886
Life Limited
Components (All) 234 468 234 468 468 234 468 234 468 468 234 468 468 234 468 234 468 468 234 468 7 493
Unscheduled
Maintenance 2 066 2 066 2 066 2 066 2 066 2 066 2 066 2 066 2 066 2 066 2 066 2 066 2 066 2 066 2 066 2 066 2 066 2 066 2 066 2 066 41 322
ATC & Nav. Fees 3 414 3 414 3 414 3 414 3 414 3 414 3 414 3 414 3 414 3 414 3 414 3 414 3 414 3 414 3 414 3 414 3 414 3 414 3 414 3 414 68 290
Landing Fees 47 263 47 263 47 263 47 263 47 263 47 263 47 263 47 263 47 263 47 263 47 263 47 263 47 263 47 263 47 263 47 263 47 263 47 263 47 263 47 263 945 261
Tot Variable costs 112 192 129 650 115 307 134 305 119 045 134 970 120 184 135 621 122 387 135 298 121 646 135 542 122 956 134 963 123 444 135 451 124 014 138 802 121 965 139 696 112 192
Fixed Cost /YR 1 2 3 4 5 6 7 8 9 10 11 12 13 14 15 16 17 18 19 20 Total
Cockpit Crew Sal. 21 926 21 926 21 926 21 926 21 926 21 926 21 926 21 926 21 926 21 926 21 926 21 926 21 926 21 926 21 926 21 926 21 926 21 926 21 926 21 926 438 512
Airworthiness
specialists Sal. 12 466 12 466 12 466 12 466 12 466 12 466 12 466 12 466 12 466 12 466 12 466 12 466 12 466 12 466 12 466 12 466 12 466 12 466 12 466 12 466 249 311
Maint. Techn. Sal. 19 972 19 972 19 972 19 972 19 972 19 972 19 972 19 972 19 972 19 972 19 972 19 972 19 972 19 972 19 972 19 972 19 972 19 972 19 972 19 972 399 449
Other Sal. 3 444 3 444 3 444 3 444 3 444 3 444 3 444 3 444 3 444 3 444 3 444 3 444 3 444 3 444 3 444 3 444 3 444 3 444 3 444 3 444 68 871
Benefits 5 781 5 781 5 781 5 781 5 781 5 781 5 781 5 781 5 781 5 781 5 781 5 781 5 781 5 781 5 781 5 781 5 781 5 781 5 781 5 781 115 614
Hangar 4 821 4 821 4 821 4 821 4 821 4 821 4 821 4 821 4 821 4 821 4 821 4 821 4 821 4 821 4 821 4 821 4 821 4 821 4 821 4 821 96 419
Hull Insurance 2 403 2 403 2 403 2 403 2 403 2 403 2 403 2 403 2 403 2 403 2 403 2 403 2 403 2 403 2 403 2 403 2 403 2 403 2 403 2 403 48 051
Liability Insurance 5 096 5 096 5 096 5 096 5 096 5 096 5 096 5 096 5 096 5 096 5 096 5 096 5 096 5 096 5 096 5 096 5 096 5 096 5 096 5 096 101 928
Training
Pilot/Maint. 799 799 799 799 799 799 799 799 799 799 799 799 799 799 799 799 799 799 799 799 15 978
Registration Fee 689 689 689 689 689 689 689 689 689 689 689 689 689 689 689 689 689 689 689 689 13 774
Brokerage Fee 2 621 2 621
Modernization 1 446 1 446 1 446 1 446 1 446 1 446 1 446 1 446 1 446 1 446 1 446 1 446 1 446 1 446 1 446 1 446 1 446 1 446 1 446 1 446 28 926
Refurbishing 895 895 895 895 895 895 895 895 895 895 895 895 895 895 895 895 895 895 895 895 17 906
Total Fixed Costs 79 737 79 737 79 737 79 737 79 737 79 737 79 737 79 737 79 737 79 737 79 737 79 737 79 737 79 737 79 737 79 737 79 737 79 737 79 737 82 358 1 597 361
Total Acquisition
Cost/Resale 218 415 -44 141 174 274
Op. Overhead 28 789 31 408 29 257 32 106 29 817 32 206 29 988 32 304 30 319 32 255 30 207 32 292 30 404 32 205 30 477 32 278 30 563 32 781 30 255 33 308 623 220
Adm. Overhead 28 789 31 408 29 257 32 106 29 817 32 206 29 988 32 304 30 319 32 255 30 207 32 292 30 404 32 205 30 477 32 278 30 563 32 781 30 255 33 308 623 220
Total Costs 467 924 272 203 253 557 278 255 258 417 279 119 259 897 279 965 262 761 279 545 261 798 279 862 263 501 279 110 264 136 279 745 264 876 284 100 262 212 244 530 5 575 513
Variable €/FH 112 130 115 134 119 135 120 136 122 135 122 136 123 135 123 135 124 139 122 140
Var + Fixed €/FH 192 209 195 214 199 215 200 215 202 215 201 215 203 215 203 215 204 219 202 222
Tot Ann Cost
€/FH 468 272 254 278 258 279 260 280 263 280 262 280 264 279 264 280 265 284 262 245
SAT Aircraft Characteristics to be used for Demand Calculation
Document Number: SAT-Rdmp T1.2.1-InputDataDemCalc-V0
Page 16 of 32
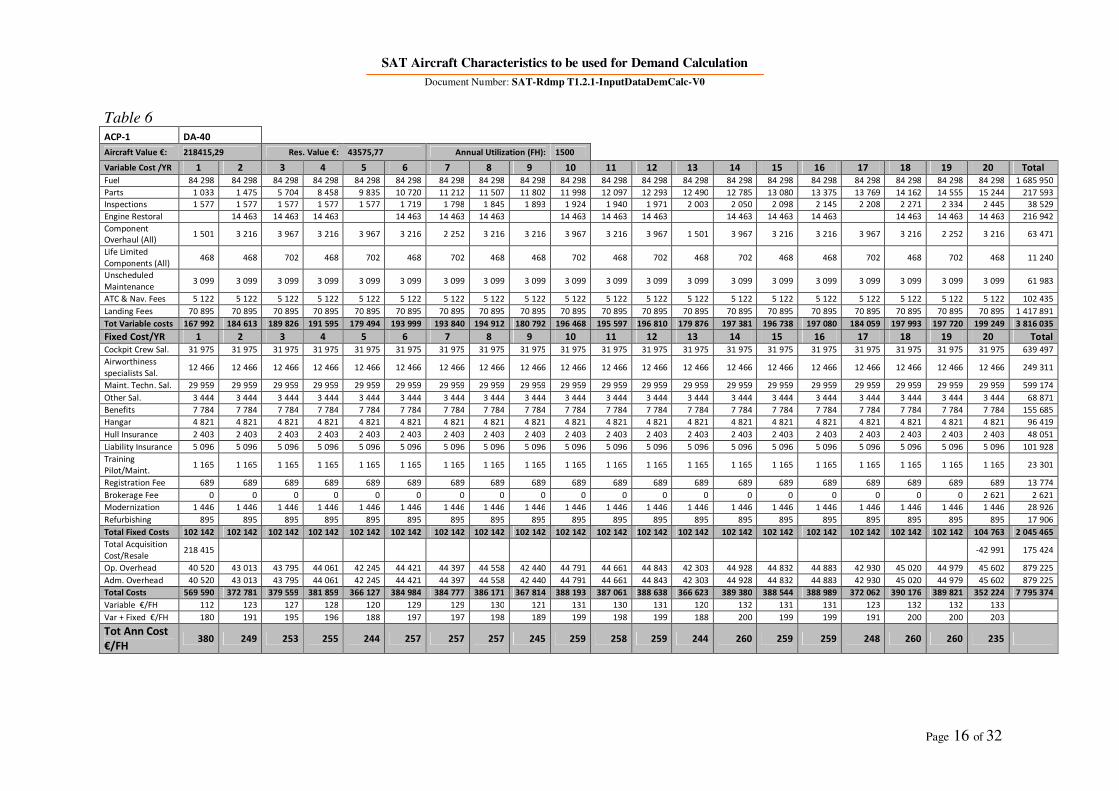
Table 6 ACP-1 DA-40
Aircraft Value €: 218415,29 Res. Value €: 43575,77 Annual Utilization (FH): 1500
Variable Cost /YR 1 2 3 4 5 6 7 8 9 10 11 12 13 14 15 16 17 18 19 20 Total
Fuel 84 298 84 298 84 298 84 298 84 298 84 298 84 298 84 298 84 298 84 298 84 298 84 298 84 298 84 298 84 298 84 298 84 298 84 298 84 298 84 298 1 685 950
Parts 1 033 1 475 5 704 8 458 9 835 10 720 11 212 11 507 11 802 11 998 12 097 12 293 12 490 12 785 13 080 13 375 13 769 14 162 14 555 15 244 217 593
Inspections 1 577 1 577 1 577 1 577 1 577 1 719 1 798 1 845 1 893 1 924 1 940 1 971 2 003 2 050 2 098 2 145 2 208 2 271 2 334 2 445 38 529
Engine Restoral 14 463 14 463 14 463 14 463 14 463 14 463 14 463 14 463 14 463 14 463 14 463 14 463 14 463 14 463 14 463 216 942
Component
Overhaul (All) 1 501 3 216 3 967 3 216 3 967 3 216 2 252 3 216 3 216 3 967 3 216 3 967 1 501 3 967 3 216 3 216 3 967 3 216 2 252 3 216 63 471
Life Limited
Components (All) 468 468 702 468 702 468 702 468 468 702 468 702 468 702 468 468 702 468 702 468 11 240
Unscheduled
Maintenance 3 099 3 099 3 099 3 099 3 099 3 099 3 099 3 099 3 099 3 099 3 099 3 099 3 099 3 099 3 099 3 099 3 099 3 099 3 099 3 099 61 983
ATC & Nav. Fees 5 122 5 122 5 122 5 122 5 122 5 122 5 122 5 122 5 122 5 122 5 122 5 122 5 122 5 122 5 122 5 122 5 122 5 122 5 122 5 122 102 435
Landing Fees 70 895 70 895 70 895 70 895 70 895 70 895 70 895 70 895 70 895 70 895 70 895 70 895 70 895 70 895 70 895 70 895 70 895 70 895 70 895 70 895 1 417 891
Tot Variable costs 167 992 184 613 189 826 191 595 179 494 193 999 193 840 194 912 180 792 196 468 195 597 196 810 179 876 197 381 196 738 197 080 184 059 197 993 197 720 199 249 3 816 035
Fixed Cost/YR 1 2 3 4 5 6 7 8 9 10 11 12 13 14 15 16 17 18 19 20 Total
Cockpit Crew Sal. 31 975 31 975 31 975 31 975 31 975 31 975 31 975 31 975 31 975 31 975 31 975 31 975 31 975 31 975 31 975 31 975 31 975 31 975 31 975 31 975 639 497
Airworthiness
specialists Sal. 12 466 12 466 12 466 12 466 12 466 12 466 12 466 12 466 12 466 12 466 12 466 12 466 12 466 12 466 12 466 12 466 12 466 12 466 12 466 12 466 249 311
Maint. Techn. Sal. 29 959 29 959 29 959 29 959 29 959 29 959 29 959 29 959 29 959 29 959 29 959 29 959 29 959 29 959 29 959 29 959 29 959 29 959 29 959 29 959 599 174
Other Sal. 3 444 3 444 3 444 3 444 3 444 3 444 3 444 3 444 3 444 3 444 3 444 3 444 3 444 3 444 3 444 3 444 3 444 3 444 3 444 3 444 68 871
Benefits 7 784 7 784 7 784 7 784 7 784 7 784 7 784 7 784 7 784 7 784 7 784 7 784 7 784 7 784 7 784 7 784 7 784 7 784 7 784 7 784 155 685
Hangar 4 821 4 821 4 821 4 821 4 821 4 821 4 821 4 821 4 821 4 821 4 821 4 821 4 821 4 821 4 821 4 821 4 821 4 821 4 821 4 821 96 419
Hull Insurance 2 403 2 403 2 403 2 403 2 403 2 403 2 403 2 403 2 403 2 403 2 403 2 403 2 403 2 403 2 403 2 403 2 403 2 403 2 403 2 403 48 051
Liability Insurance 5 096 5 096 5 096 5 096 5 096 5 096 5 096 5 096 5 096 5 096 5 096 5 096 5 096 5 096 5 096 5 096 5 096 5 096 5 096 5 096 101 928
Training
Pilot/Maint. 1 165 1 165 1 165 1 165 1 165 1 165 1 165 1 165 1 165 1 165 1 165 1 165 1 165 1 165 1 165 1 165 1 165 1 165 1 165 1 165 23 301
Registration Fee 689 689 689 689 689 689 689 689 689 689 689 689 689 689 689 689 689 689 689 689 13 774
Brokerage Fee 0 0 0 0 0 0 0 0 0 0 0 0 0 0 0 0 0 0 0 2 621 2 621
Modernization 1 446 1 446 1 446 1 446 1 446 1 446 1 446 1 446 1 446 1 446 1 446 1 446 1 446 1 446 1 446 1 446 1 446 1 446 1 446 1 446 28 926
Refurbishing 895 895 895 895 895 895 895 895 895 895 895 895 895 895 895 895 895 895 895 895 17 906
Total Fixed Costs 102 142 102 142 102 142 102 142 102 142 102 142 102 142 102 142 102 142 102 142 102 142 102 142 102 142 102 142 102 142 102 142 102 142 102 142 102 142 104 763 2 045 465
Total Acquisition
Cost/Resale 218 415 -42 991 175 424
Op. Overhead 40 520 43 013 43 795 44 061 42 245 44 421 44 397 44 558 42 440 44 791 44 661 44 843 42 303 44 928 44 832 44 883 42 930 45 020 44 979 45 602 879 225
Adm. Overhead 40 520 43 013 43 795 44 061 42 245 44 421 44 397 44 558 42 440 44 791 44 661 44 843 42 303 44 928 44 832 44 883 42 930 45 020 44 979 45 602 879 225
Total Costs 569 590 372 781 379 559 381 859 366 127 384 984 384 777 386 171 367 814 388 193 387 061 388 638 366 623 389 380 388 544 388 989 372 062 390 176 389 821 352 224 7 795 374
Variable €/FH 112 123 127 128 120 129 129 130 121 131 130 131 120 132 131 131 123 132 132 133
Var + Fixed €/FH 180 191 195 196 188 197 197 198 189 199 198 199 188 200 199 199 191 200 200 203
Tot Ann Cost
€/FH 380 249 253 255 244 257 257 257 245 259 258 259 244 260 259 259 248 260 260 235
SAT Aircraft Characteristics to be used for Demand Calculation
Document Number: SAT-Rdmp T1.2.1-InputDataDemCalc-V0
Page 17 of 32
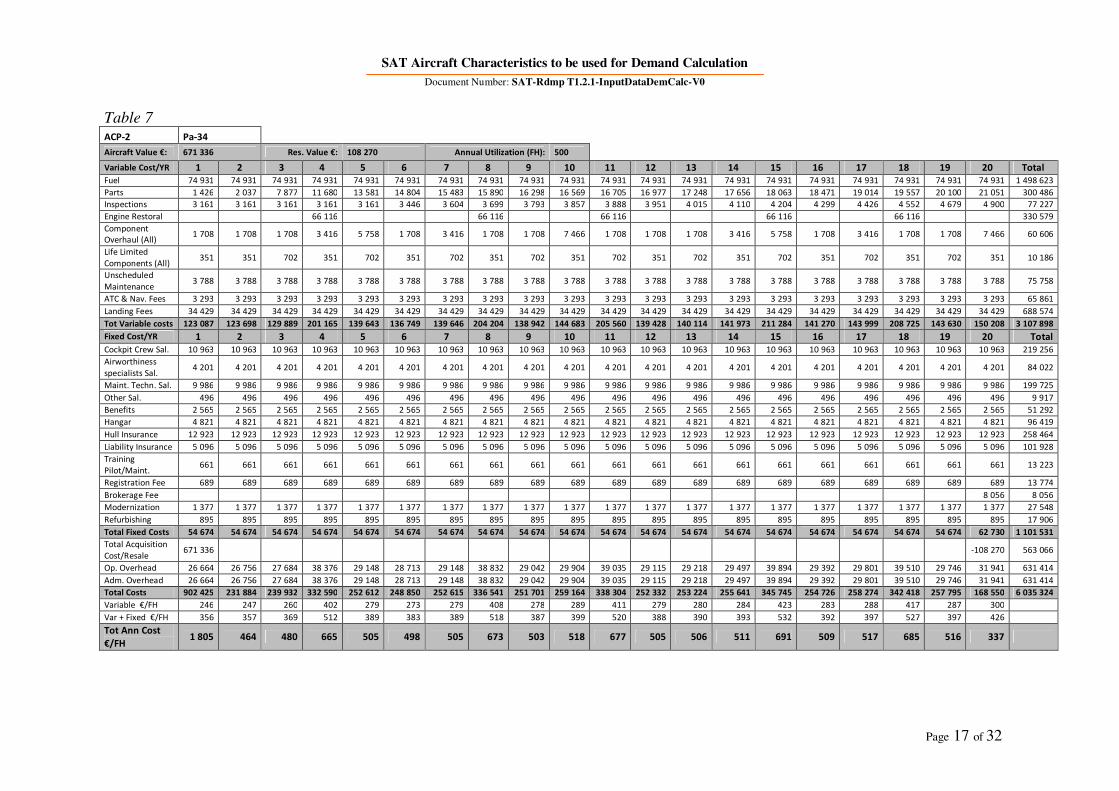
Table 7 ACP-2 Pa-34
Aircraft Value €: 671 336 Res. Value €: 108 270 Annual Utilization (FH): 500
Variable Cost/YR 1 2 3 4 5 6 7 8 9 10 11 12 13 14 15 16 17 18 19 20 Total
Fuel 74 931 74 931 74 931 74 931 74 931 74 931 74 931 74 931 74 931 74 931 74 931 74 931 74 931 74 931 74 931 74 931 74 931 74 931 74 931 74 931 1 498 623
Parts 1 426 2 037 7 877 11 680 13 581 14 804 15 483 15 890 16 298 16 569 16 705 16 977 17 248 17 656 18 063 18 471 19 014 19 557 20 100 21 051 300 486
Inspections 3 161 3 161 3 161 3 161 3 161 3 446 3 604 3 699 3 793 3 857 3 888 3 951 4 015 4 110 4 204 4 299 4 426 4 552 4 679 4 900 77 227
Engine Restoral 66 116 66 116 66 116 66 116 66 116 330 579
Component
Overhaul (All) 1 708 1 708 1 708 3 416 5 758 1 708 3 416 1 708 1 708 7 466 1 708 1 708 1 708 3 416 5 758 1 708 3 416 1 708 1 708 7 466 60 606
Life Limited
Components (All) 351 351 702 351 702 351 702 351 702 351 702 351 702 351 702 351 702 351 702 351 10 186
Unscheduled
Maintenance 3 788 3 788 3 788 3 788 3 788 3 788 3 788 3 788 3 788 3 788 3 788 3 788 3 788 3 788 3 788 3 788 3 788 3 788 3 788 3 788 75 758
ATC & Nav. Fees 3 293 3 293 3 293 3 293 3 293 3 293 3 293 3 293 3 293 3 293 3 293 3 293 3 293 3 293 3 293 3 293 3 293 3 293 3 293 3 293 65 861
Landing Fees 34 429 34 429 34 429 34 429 34 429 34 429 34 429 34 429 34 429 34 429 34 429 34 429 34 429 34 429 34 429 34 429 34 429 34 429 34 429 34 429 688 574
Tot Variable costs 123 087 123 698 129 889 201 165 139 643 136 749 139 646 204 204 138 942 144 683 205 560 139 428 140 114 141 973 211 284 141 270 143 999 208 725 143 630 150 208 3 107 898
Fixed Cost/YR 1 2 3 4 5 6 7 8 9 10 11 12 13 14 15 16 17 18 19 20 Total
Cockpit Crew Sal. 10 963 10 963 10 963 10 963 10 963 10 963 10 963 10 963 10 963 10 963 10 963 10 963 10 963 10 963 10 963 10 963 10 963 10 963 10 963 10 963 219 256
Airworthiness
specialists Sal. 4 201 4 201 4 201 4 201 4 201 4 201 4 201 4 201 4 201 4 201 4 201 4 201 4 201 4 201 4 201 4 201 4 201 4 201 4 201 4 201 84 022
Maint. Techn. Sal. 9 986 9 986 9 986 9 986 9 986 9 986 9 986 9 986 9 986 9 986 9 986 9 986 9 986 9 986 9 986 9 986 9 986 9 986 9 986 9 986 199 725
Other Sal. 496 496 496 496 496 496 496 496 496 496 496 496 496 496 496 496 496 496 496 496 9 917
Benefits 2 565 2 565 2 565 2 565 2 565 2 565 2 565 2 565 2 565 2 565 2 565 2 565 2 565 2 565 2 565 2 565 2 565 2 565 2 565 2 565 51 292
Hangar 4 821 4 821 4 821 4 821 4 821 4 821 4 821 4 821 4 821 4 821 4 821 4 821 4 821 4 821 4 821 4 821 4 821 4 821 4 821 4 821 96 419
Hull Insurance 12 923 12 923 12 923 12 923 12 923 12 923 12 923 12 923 12 923 12 923 12 923 12 923 12 923 12 923 12 923 12 923 12 923 12 923 12 923 12 923 258 464
Liability Insurance 5 096 5 096 5 096 5 096 5 096 5 096 5 096 5 096 5 096 5 096 5 096 5 096 5 096 5 096 5 096 5 096 5 096 5 096 5 096 5 096 101 928
Training
Pilot/Maint. 661 661 661 661 661 661 661 661 661 661 661 661 661 661 661 661 661 661 661 661 13 223
Registration Fee 689 689 689 689 689 689 689 689 689 689 689 689 689 689 689 689 689 689 689 689 13 774
Brokerage Fee 8 056 8 056
Modernization 1 377 1 377 1 377 1 377 1 377 1 377 1 377 1 377 1 377 1 377 1 377 1 377 1 377 1 377 1 377 1 377 1 377 1 377 1 377 1 377 27 548
Refurbishing 895 895 895 895 895 895 895 895 895 895 895 895 895 895 895 895 895 895 895 895 17 906
Total Fixed Costs 54 674 54 674 54 674 54 674 54 674 54 674 54 674 54 674 54 674 54 674 54 674 54 674 54 674 54 674 54 674 54 674 54 674 54 674 54 674 62 730 1 101 531
Total Acquisition
Cost/Resale 671 336 -108 270 563 066
Op. Overhead 26 664 26 756 27 684 38 376 29 148 28 713 29 148 38 832 29 042 29 904 39 035 29 115 29 218 29 497 39 894 29 392 29 801 39 510 29 746 31 941 631 414
Adm. Overhead 26 664 26 756 27 684 38 376 29 148 28 713 29 148 38 832 29 042 29 904 39 035 29 115 29 218 29 497 39 894 29 392 29 801 39 510 29 746 31 941 631 414
Total Costs 902 425 231 884 239 932 332 590 252 612 248 850 252 615 336 541 251 701 259 164 338 304 252 332 253 224 255 641 345 745 254 726 258 274 342 418 257 795 168 550 6 035 324
Variable €/FH 246 247 260 402 279 273 279 408 278 289 411 279 280 284 423 283 288 417 287 300
Var + Fixed €/FH 356 357 369 512 389 383 389 518 387 399 520 388 390 393 532 392 397 527 397 426
Tot Ann Cost
€/FH 1 805 464 480 665 505 498 505 673 503 518 677 505 506 511 691 509 517 685 516 337
SAT Aircraft Characteristics to be used for Demand Calculation
Document Number: SAT-Rdmp T1.2.1-InputDataDemCalc-V0
Page 18 of 32
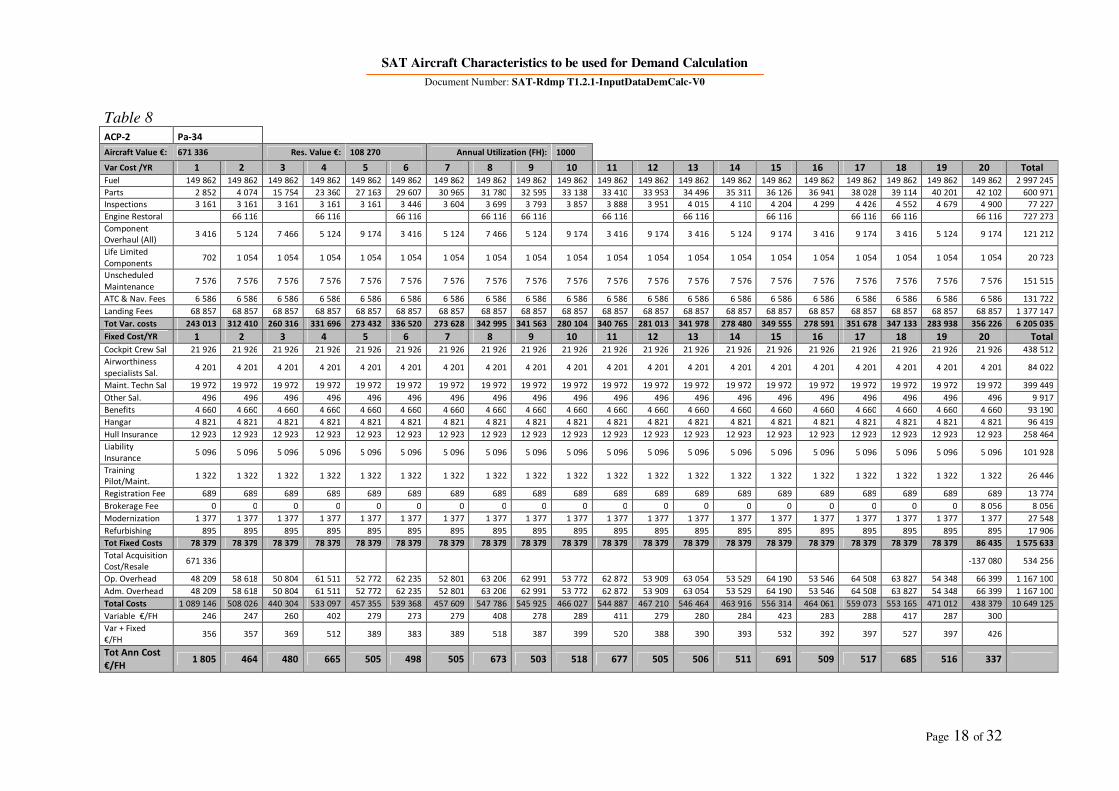
Table 8 ACP-2 Pa-34
Aircraft Value €: 671 336 Res. Value €: 108 270 Annual Utilization (FH): 1000
Var Cost /YR 1 2 3 4 5 6 7 8 9 10 11 12 13 14 15 16 17 18 19 20 Total
Fuel 149 862 149 862 149 862 149 862 149 862 149 862 149 862 149 862 149 862 149 862 149 862 149 862 149 862 149 862 149 862 149 862 149 862 149 862 149 862 149 862 2 997 245
Parts 2 852 4 074 15 754 23 360 27 163 29 607 30 965 31 780 32 595 33 138 33 410 33 953 34 496 35 311 36 126 36 941 38 028 39 114 40 201 42 102 600 971
Inspections 3 161 3 161 3 161 3 161 3 161 3 446 3 604 3 699 3 793 3 857 3 888 3 951 4 015 4 110 4 204 4 299 4 426 4 552 4 679 4 900 77 227
Engine Restoral 66 116 66 116 66 116 66 116 66 116 66 116 66 116 66 116 66 116 66 116 66 116 727 273
Component
Overhaul (All) 3 416 5 124 7 466 5 124 9 174 3 416 5 124 7 466 5 124 9 174 3 416 9 174 3 416 5 124 9 174 3 416 9 174 3 416 5 124 9 174 121 212
Life Limited
Components 702 1 054 1 054 1 054 1 054 1 054 1 054 1 054 1 054 1 054 1 054 1 054 1 054 1 054 1 054 1 054 1 054 1 054 1 054 1 054 20 723
Unscheduled
Maintenance 7 576 7 576 7 576 7 576 7 576 7 576 7 576 7 576 7 576 7 576 7 576 7 576 7 576 7 576 7 576 7 576 7 576 7 576 7 576 7 576 151 515
ATC & Nav. Fees 6 586 6 586 6 586 6 586 6 586 6 586 6 586 6 586 6 586 6 586 6 586 6 586 6 586 6 586 6 586 6 586 6 586 6 586 6 586 6 586 131 722
Landing Fees 68 857 68 857 68 857 68 857 68 857 68 857 68 857 68 857 68 857 68 857 68 857 68 857 68 857 68 857 68 857 68 857 68 857 68 857 68 857 68 857 1 377 147
Tot Var. costs 243 013 312 410 260 316 331 696 273 432 336 520 273 628 342 995 341 563 280 104 340 765 281 013 341 978 278 480 349 555 278 591 351 678 347 133 283 938 356 226 6 205 035
Fixed Cost/YR 1 2 3 4 5 6 7 8 9 10 11 12 13 14 15 16 17 18 19 20 Total
Cockpit Crew Sal 21 926 21 926 21 926 21 926 21 926 21 926 21 926 21 926 21 926 21 926 21 926 21 926 21 926 21 926 21 926 21 926 21 926 21 926 21 926 21 926 438 512
Airworthiness
specialists Sal. 4 201 4 201 4 201 4 201 4 201 4 201 4 201 4 201 4 201 4 201 4 201 4 201 4 201 4 201 4 201 4 201 4 201 4 201 4 201 4 201 84 022
Maint. Techn Sal 19 972 19 972 19 972 19 972 19 972 19 972 19 972 19 972 19 972 19 972 19 972 19 972 19 972 19 972 19 972 19 972 19 972 19 972 19 972 19 972 399 449
Other Sal. 496 496 496 496 496 496 496 496 496 496 496 496 496 496 496 496 496 496 496 496 9 917
Benefits 4 660 4 660 4 660 4 660 4 660 4 660 4 660 4 660 4 660 4 660 4 660 4 660 4 660 4 660 4 660 4 660 4 660 4 660 4 660 4 660 93 190
Hangar 4 821 4 821 4 821 4 821 4 821 4 821 4 821 4 821 4 821 4 821 4 821 4 821 4 821 4 821 4 821 4 821 4 821 4 821 4 821 4 821 96 419
Hull Insurance 12 923 12 923 12 923 12 923 12 923 12 923 12 923 12 923 12 923 12 923 12 923 12 923 12 923 12 923 12 923 12 923 12 923 12 923 12 923 12 923 258 464
Liability
Insurance 5 096 5 096 5 096 5 096 5 096 5 096 5 096 5 096 5 096 5 096 5 096 5 096 5 096 5 096 5 096 5 096 5 096 5 096 5 096 5 096 101 928
Training
Pilot/Maint. 1 322 1 322 1 322 1 322 1 322 1 322 1 322 1 322 1 322 1 322 1 322 1 322 1 322 1 322 1 322 1 322 1 322 1 322 1 322 1 322 26 446
Registration Fee 689 689 689 689 689 689 689 689 689 689 689 689 689 689 689 689 689 689 689 689 13 774
Brokerage Fee 0 0 0 0 0 0 0 0 0 0 0 0 0 0 0 0 0 0 0 8 056 8 056
Modernization 1 377 1 377 1 377 1 377 1 377 1 377 1 377 1 377 1 377 1 377 1 377 1 377 1 377 1 377 1 377 1 377 1 377 1 377 1 377 1 377 27 548
Refurbishing 895 895 895 895 895 895 895 895 895 895 895 895 895 895 895 895 895 895 895 895 17 906
Tot Fixed Costs 78 379 78 379 78 379 78 379 78 379 78 379 78 379 78 379 78 379 78 379 78 379 78 379 78 379 78 379 78 379 78 379 78 379 78 379 78 379 86 435 1 575 633
Total Acquisition
Cost/Resale 671 336 -137 080 534 256
Op. Overhead 48 209 58 618 50 804 61 511 52 772 62 235 52 801 63 206 62 991 53 772 62 872 53 909 63 054 53 529 64 190 53 546 64 508 63 827 54 348 66 399 1 167 100
Adm. Overhead 48 209 58 618 50 804 61 511 52 772 62 235 52 801 63 206 62 991 53 772 62 872 53 909 63 054 53 529 64 190 53 546 64 508 63 827 54 348 66 399 1 167 100
Total Costs 1 089 146 508 026 440 304 533 097 457 355 539 368 457 609 547 786 545 925 466 027 544 887 467 210 546 464 463 916 556 314 464 061 559 073 553 165 471 012 438 379 10 649 125
Variable €/FH 246 247 260 402 279 273 279 408 278 289 411 279 280 284 423 283 288 417 287 300
Var + Fixed
€/FH 356 357 369 512 389 383 389 518 387 399 520 388 390 393 532 392 397 527 397 426
Tot Ann Cost
€/FH 1 805 464 480 665 505 498 505 673 503 518 677 505 506 511 691 509 517 685 516 337

SAT Aircraft Characteristics to be used for Demand Calculation
Document Number: SAT-Rdmp T1.2.1-InputDataDemCalc-V0
Page 19 of 32
Table 9 ACP-2 Pa-34
Aircraft Value €: 671 336 Res. Value €: 108 270 Annual Utilization (FH): 1500
Var Cost/YR 1 2 3 4 5 6 7 8 9 10 11 12 13 14 15 16 17 18 19 20 Total
Fuel 224 793 224 793 224 793 224 793 224 793 224 793 224 793 224 793 224 793 224 793 224 793 224 793 224 793 224 793 224 793 224 793 224 793 224 793 224 793 224 793 4 495 868
Parts 4 278 6 112 23 631 35 040 40 744 44 411 46 448 47 670 48 893 49 707 50 115 50 930 51 745 52 967 54 189 55 412 57 041 58 671 60 301 63 153 901 457
Inspections 3 161 3 161 3 161 3 161 3 161 3 446 3 604 3 699 3 793 3 857 3 888 3 951 4 015 4 110 4 204 4 299 4 426 4 552 4 679 4 900 77 227
Engine Restoral 66 116 66 116 66 116 66 116 66 116 66 116 66 116 66 116 66 116 66 116 66 116 66 116 66 116 66 116 66 116 66 116 1 057 851
Component
Overhaul (All) 5 124 10 882 6 832 10 882 10 882 6 832 10 882 10 882 6 832 10 882 5 124 10 882 10 882 6 832 10 882 10 882 6 832 10 882 6 832 10 882 181 818
Life Limited
Components 1 405 1 405 1 756 1 405 1 756 1 405 1 756 1 405 1 756 1 405 1 756 1 405 1 405 1 756 1 405 1 756 1 405 1 756 1 405 1 756 31 260
Unscheduled
Maintenance 10 331 10 331 10 331 10 331 10 331 10 331 10 331 10 331 10 331 10 331 10 331 10 331 10 331 10 331 10 331 10 331 10 331 10 331 10 331 10 331 206 612
ATC & Nav. Fees 9 879 9 879 9 879 9 879 9 879 9 879 9 879 9 879 9 879 9 879 9 879 9 879 9 879 9 879 9 879 9 879 9 879 9 879 9 879 9 879 197 582
Landing Fees 103 286 103 286 103 286 103 286 103 286 103 286 103 286 103 286 103 286 103 286 103 286 103 286 103 286 103 286 103 286 103 286 103 286 103 286 103 286 103 286 2 065 721
Tot Var. costs 362 257 435 964 449 786 464 892 470 948 470 498 410 979 478 060 475 679 480 255 475 288 481 573 416 335 480 069 485 085 486 753 484 109 490 266 421 505 495 095 9 215 396
Fixed Cost/YR 1 2 3 4 5 6 7 8 9 10 11 12 13 14 15 16 17 18 19 20 Total
Cockpit Crew Sal 31 975 31 975 31 975 31 975 31 975 31 975 31 975 31 975 31 975 31 975 31 975 31 975 31 975 31 975 31 975 31 975 31 975 31 975 31 975 31 975 639 497
Airworthiness
specialists Sal. 4 201 4 201 4 201 4 201 4 201 4 201 4 201 4 201 4 201 4 201 4 201 4 201 4 201 4 201 4 201 4 201 4 201 4 201 4 201 4 201 84 022
Maint. Techn Sal 29 959 29 959 29 959 29 959 29 959 29 959 29 959 29 959 29 959 29 959 29 959 29 959 29 959 29 959 29 959 29 959 29 959 29 959 29 959 29 959 599 174
Other Sal. 496 496 496 496 496 496 496 496 496 496 496 496 496 496 496 496 496 496 496 496 9 917
Benefits 6 663 6 663 6 663 6 663 6 663 6 663 6 663 6 663 6 663 6 663 6 663 6 663 6 663 6 663 6 663 6 663 6 663 6 663 6 663 6 663 133 261
Hangar 4 821 4 821 4 821 4 821 4 821 4 821 4 821 4 821 4 821 4 821 4 821 4 821 4 821 4 821 4 821 4 821 4 821 4 821 4 821 4 821 96 419
Hull Insurance 12 923 12 923 12 923 12 923 12 923 12 923 12 923 12 923 12 923 12 923 12 923 12 923 12 923 12 923 12 923 12 923 12 923 12 923 12 923 12 923 258 464
Liability Ins 5 096 5 096 5 096 5 096 5 096 5 096 5 096 5 096 5 096 5 096 5 096 5 096 5 096 5 096 5 096 5 096 5 096 5 096 5 096 5 096 101 928
Training
Pilot/Maint. 1 928 1 928 1 928 1 928 1 928 1 928 1 928 1 928 1 928 1 928 1 928 1 928 1 928 1 928 1 928 1 928 1 928 1 928 1 928 1 928 38 567
Registration Fee 689 689 689 689 689 689 689 689 689 689 689 689 689 689 689 689 689 689 689 689 13 774
Brokerage Fee 8 056 8 056
Modernization 1 377 1 377 1 377 1 377 1 377 1 377 1 377 1 377 1 377 1 377 1 377 1 377 1 377 1 377 1 377 1 377 1 377 1 377 1 377 1 377 27 548
Refurbishing 895 895 895 895 895 895 895 895 895 895 895 895 895 895 895 895 895 895 895 895 17 906
Tot Fixed Costs 101 024 101 024 101 024 101 024 101 024 101 024 101 024 101 024 101 024 101 024 101 024 101 024 101 024 101 024 101 024 101 024 101 024 101 024 101 024 109 080 2 028 535
Total Acquisition
Cost/Resale 671 336 -99 774 571 562
Op. Overhead 69 492 80 548 82 621 84 887 85 796 85 728 76 800 86 863 86 505 87 192 86 447 87 389 77 604 87 164 87 916 88 167 87 770 88 693 78 379 90 626 1 686 590
Adm. Overhead 69 492 80 548 82 621 84 887 85 796 85 728 76 800 86 863 86 505 87 192 86 447 87 389 77 604 87 164 87 916 88 167 87 770 88 693 78 379 90 626 1 686 590
Total Costs 1 273 602 698 084 716 052 735 691 743 563 742 979 665 603 752 809 749 714 755 663 749 206 757 375 672 567 755 421 761 942 764 110 760 672 768 677 679 288 685 653 15 188 672
Variable €/FH 242 291 300 310 314 314 274 319 317 320 317 321 278 320 323 325 323 327 281 330
Var + Fixed
€/FH 309 358 367 377 381 381 341 386 384 388 384 388 345 387 391 392 390 394 348 403
Tot Ann Cost
€/FH 849 465 477 490 496 495 444 502 500 504 499 505 448 504 508 509 507 512 453 457

SAT Aircraft Characteristics to be used for Demand Calculation
Document Number: SAT-Rdmp T1.2.1-InputDataDemCalc-V0
Page 20 of 32
Table 10 ACT-1 Pc-12
Aircraft Value €: 3 388 609 Res. Value €: 568 467 Annual Utilization (FH): 500
Var Cost/YR 1 2 3 4 5 6 7 8 9 10 11 12 13 14 15 16 17 18 19 20 Total
Fuel 139 118 139 118 139 118 139 118 139 118 139 118 139 118 139 118 139 118 139 118 139 118 139 118 139 118 139 118 139 118 139 118 139 118 139 118 139 118 139 118 2 782 369
Parts 3 390 4 843 18 726 27 766 32 287 35 192 36 807 37 775 38 744 39 390 39 712 40 358 41 004 41 972 42 941 43 910 45 201 46 493 47 784 50 044 714 339
Inspections 3 904 13 948 4 477 5 157 17 720 45 205
Engine Restoral 28 512 124 105 28 512 124 105 28 512 333 747
Component
Overhaul (All) 4 153 4 153 10 331 4 725 861 5 799 861 3 292 22 149 5 585 4 153 3 292 9 545 3 292 861 83 051
Life Limited
Components 200 200 200 200 1 488 200 200 200 200 200 200 1 488 200 200 200 200 200 200 6 174
Unscheduled
Maintenance 5 854 5 854 5 854 5 854 5 854 5 854 5 854 5 854 5 854 5 854 5 854 5 854 5 854 5 854 5 854 5 854 5 854 5 854 5 854 5 854 117 080
ATC & Nav. Fees 41 660 41 660 41 660 41 660 41 660 41 660 41 660 41 660 41 660 41 660 41 660 41 660 41 660 41 660 41 660 41 660 41 660 41 660 41 660 41 660 833 203
Landing Fees 18 520 18 520 18 520 18 520 18 520 18 520 18 520 18 520 18 520 18 520 18 520 18 520 18 520 18 520 18 520 18 520 18 520 18 520 18 520 18 520 370 400
Tot Var. costs 208 543 214 148 224 079 265 784 237 639 254 779 372 276 243 989 249 895 259 551 276 869 272 336 246 356 378 303 248 294 253 415 253 846 295 060 256 429 273 978 5 285 568
Fixed Cost / YR 1 2 3 4 5 6 7 8 9 10 11 12 13 14 15 16 17 18 19 20 Total
Cockpit Crew Sal 20 248 20 248 20 248 20 248 20 248 20 248 20 248 20 248 20 248 20 248 20 248 20 248 20 248 20 248 20 248 20 248 20 248 20 248 20 248 20 248 404 959
Airworthiness
specialists Sal. 5 028 5 028 5 028 5 028 5 028 5 028 5 028 5 028 5 028 5 028 5 028 5 028 5 028 5 028 5 028 5 028 5 028 5 028 5 028 5 028 100 551
Maint. Techn Sal 19 972 19 972 19 972 19 972 19 972 19 972 19 972 19 972 19 972 19 972 19 972 19 972 19 972 19 972 19 972 19 972 19 972 19 972 19 972 19 972 399 449
Other Sal. 5 992 5 992 5 992 5 992 5 992 5 992 5 992 5 992 5 992 5 992 5 992 5 992 5 992 5 992 5 992 5 992 5 992 5 992 5 992 5 992 119 835
Benefits 5 124 5 124 5 124 5 124 5 124 5 124 5 124 5 124 5 124 5 124 5 124 5 124 5 124 5 124 5 124 5 124 5 124 5 124 5 124 5 124 102 479
Hangar 9 642 9 642 9 642 9 642 9 642 9 642 9 642 9 642 9 642 9 642 9 642 9 642 9 642 9 642 9 642 9 642 9 642 9 642 9 642 9 642 192 837
Hull Insurance 16 774 16 774 16 774 16 774 16 774 16 774 16 774 16 774 16 774 16 774 16 774 16 774 16 774 16 774 16 774 16 774 16 774 16 774 16 774 16 774 335 472
Liability Ins. 152 479 152 479 152 479 152 479 152 479 152 479 152 479 152 479 152 479 152 479 152 479 152 479 152 479 152 479 152 479 152 479 152 479 152 479 152 479 152 479 3 049 587
Training
Pilot/Maint. 438 438 438 438 438 438 438 438 438 438 438 438 438 438 438 438 438 438 438 438 8 760
Registration Fee 689 689 689 689 689 689 689 689 689 689 689 689 689 689 689 689 689 689 689 689 13 774
Brokerage Fee 8 056 8 056
Modernization 13 774 13 774 13 774 13 774 13 774 13 774 13 774 13 774 13 774 13 774 13 774 13 774 13 774 13 774 13 774 13 774 13 774 13 774 13 774 13 774 275 482
Refurbishing 4 477 4 477 4 477 4 477 4 477 4 477 4 477 4 477 4 477 4 477 4 477 4 477 4 477 4 477 4 477 4 477 4 477 4 477 4 477 4 477 89 532
Tot Fixed Costs 254 636 254 636 254 636 254 636 254 636 254 636 254 636 254 636 254 636 254 636 254 636 254 636 254 636 254 636 254 636 254 636 254 636 254 636 254 636 279 034 5 117 115
Total Acquisition
Cost/Resale 3 388 609 -568 467 2 820 141
Op. Overhead 69 477 70 318 71 807 78 063 73 841 76 412 94 037 74 794 75 680 77 128 79 726 79 046 75 149 94 941 75 439 76 208 76 272 82 454 76 660 82 952 1 560 403
Adm. Overhead 69 477 70 318 71 807 78 063 73 841 76 412 94 037 74 794 75 680 77 128 79 726 79 046 75 149 94 941 75 439 76 208 76 272 82 454 76 660 82 952 1 560 403
Total Costs 3 990 741 609 420 622 329 676 546 639 957 662 239 814 986 648 212 655 890 668 442 690 957 685 063 651 290 822 820 653 808 660 466 661 026 714 605 664 384 150 448 16 343 630
Variable €/FH 417 428 448 532 475 510 745 488 500 519 554 545 493 757 497 507 508 590 513 548
Var + Fixed
€/FH 926 938 957 1 041 985 1 019 1 254 997 1 009 1 028 1 063 1 054 1 002 1 266 1 006 1 016 1 017 1 099 1 022 1 106
Tot Ann Cost
€/FH 7 981 1 219 1 245 1 353 1 280 1 324 1 630 1 296 1 312 1 337 1 382 1 370 1 303 1 646 1 308 1 321 1 322 1 429 1 329 301

SAT Aircraft Characteristics to be used for Demand Calculation
Document Number: SAT-Rdmp T1.2.1-InputDataDemCalc-V0
Page 21 of 32
Table 11 ACT-1 Pc-12
Aircraft Value €: 3 388 609 Res. Value €: 568 467 Annual Utilization (FH): 1000
Var Cost/YR 1 2 3 4 5 6 7 8 9 10 11 12 13 14 15 16 17 18 19 20 Total
Fuel 278 237 278 237 278 237 278 237 278 237 278 237 278 237 278 237 278 237 278 237 278 237 278 237 278 237 278 237 278 237 278 237 278 237 278 237 278 237 278 237 5 564 738
Parts 6 780 9 686 37 452 55 533 64 573 70 385 73 613 75 550 77 488 78 779 79 425 80 716 82 008 83 945 85 882 87 819 90 402 92 985 95 568 100 088 1 428 678
Inspections 3 904 13 948 4 477 5 157 17 720 45 205
Engine Restoral 28 512 124 105 28 512 124 105 28 512 124 105 28 512 124 105 28 512 124 105 28 512 791 598
Component
Overhaul (All) 4 153 4 153 4 153 11 763 6 660 19 263 5 585 10 331 6 660 4 153 8 877 22 149 4 153 8 092 4 153 10 331 7 445 19 910 4 153 10 331 176 467
Life Limited
Components 400 1 688 400 400 1 688 400 400 400 1 688 400 400 1 688 400 400 400 1 688 400 30 290 43 526
Unscheduled
Maintenance 12 397 12 397 12 397 12 397 12 397 12 397 12 397 12 397 12 397 12 397 12 397 12 397 12 397 12 397 12 397 12 397 12 397 12 397 12 397 12 397 247 934
ATC & Nav. Fees 83 320 83 320 83 320 83 320 83 320 83 320 83 320 83 320 83 320 83 320 83 320 83 320 83 320 83 320 83 320 83 320 83 320 83 320 83 320 83 320 1 666 407
Landing Fees 37 040 37 040 37 040 37 040 37 040 37 040 37 040 37 040 37 040 37 040 37 040 37 040 37 040 37 040 37 040 37 040 37 040 37 040 37 040 37 040 740 800
Tot Var. costs 421 927 453 345 452 999 604 082 482 627 533 457 615 985 497 275 524 054 508 273 625 089 518 735 526 067 628 824 501 429 538 056 509 241 654 839 511 115 597 935 10 705 353
Fixed Cost/YR 1 2 3 4 5 6 7 8 9 10 11 12 13 14 15 16 17 18 19 20 Total
Cockpit Crew Sal 40 496 40 496 40 496 40 496 40 496 40 496 40 496 40 496 40 496 40 496 40 496 40 496 40 496 40 496 40 496 40 496 40 496 40 496 40 496 40 496 809 917
Airworthiness
specialists Sal. 5 028 5 028 5 028 5 028 5 028 5 028 5 028 5 028 5 028 5 028 5 028 5 028 5 028 5 028 5 028 5 028 5 028 5 028 5 028 5 028 100 551
Maint. Techn Sal 29 959 29 959 29 959 29 959 29 959 29 959 29 959 29 959 29 959 29 959 29 959 29 959 29 959 29 959 29 959 29 959 29 959 29 959 29 959 29 959 599 174
Other Sal. 5 992 5 992 5 992 5 992 5 992 5 992 5 992 5 992 5 992 5 992 5 992 5 992 5 992 5 992 5 992 5 992 5 992 5 992 5 992 5 992 119 835
Benefits 8 147 8 147 8 147 8 147 8 147 8 147 8 147 8 147 8 147 8 147 8 147 8 147 8 147 8 147 8 147 8 147 8 147 8 147 8 147 8 147 162 948
Hangar 9 642 9 642 9 642 9 642 9 642 9 642 9 642 9 642 9 642 9 642 9 642 9 642 9 642 9 642 9 642 9 642 9 642 9 642 9 642 9 642 192 837
Hull Ins. 16 774 16 774 16 774 16 774 16 774 16 774 16 774 16 774 16 774 16 774 16 774 16 774 16 774 16 774 16 774 16 774 16 774 16 774 16 774 16 774 335 472
Liability Ins. 152 479 152 479 152 479 152 479 152 479 152 479 152 479 152 479 152 479 152 479 152 479 152 479 152 479 152 479 152 479 152 479 152 479 152 479 152 479 152 479 3 049 587
Training
Pilot/Maint. 876 876 876 876 876 876 876 876 876 876 876 876 876 876 876 876 876 876 876 876 17 521
Registration Fee 689 689 689 689 689 689 689 689 689 689 689 689 689 689 689 689 689 689 689 689 13 774
Brokerage Fee 8 056 8 056
Modernization 13 774 13 774 13 774 13 774 13 774 13 774 13 774 13 774 13 774 13 774 13 774 13 774 13 774 13 774 13 774 13 774 13 774 13 774 13 774 13 774 275 482
Refurbishing 4 477 4 477 4 477 4 477 4 477 4 477 4 477 4 477 4 477 4 477 4 477 4 477 4 477 4 477 4 477 4 477 4 477 4 477 4 477 4 477 89 532
Tot Fixed Costs 288 331 288 331 288 331 288 331 288 331 288 331 288 331 288 331 288 331 288 331 288 331 288 331 288 331 288 331 288 331 288 331 288 331 288 331 288 331 312 729 5 791 027
Total Acquisition
Cost/Resale 3 388 609 -615 355 2 773 254
Op. Overhead 106 539 111 251 111 200 133 862 115 644 123 268 135 647 117 841 121 858 119 491 137 013 121 060 122 160 137 573 118 464 123 958 119 636 141 476 119 917 136 600 2 474 457
Adm. Overhead 106 539 111 251 111 200 133 862 115 644 123 268 135 647 117 841 121 858 119 491 137 013 121 060 122 160 137 573 118 464 123 958 119 636 141 476 119 917 136 600 2 474 457
Total Costs 4 311 945 964 180 963 730 1 160
138
1 002
245
1 068
326
1 175
611
1 021
288
1 056
101
1 035
586
1 187
446
1 049
187
1 058
718
1 192
302
1 026
688
1 074
304
1 036
844
1 226
122
1 039
280 568 509 24 218 548
Variable €/FH 422 453 453 604 483 533 616 497 524 508 625 519 526 629 501 538 509 655 511 598
Var + Fixed
€/FH 710 742 741 892 771 822 904 786 812 797 913 807 814 917 790 826 798 943 799 911
Tot Ann Cost
€/FH 4 312 964 964 1 160 1 002 1 068 1 176 1 021 1 056 1 036 1 187 1 049 1 059 1 192 1 027 1 074 1 037 1 226 1 039 569

SAT Aircraft Characteristics to be used for Demand Calculation
Document Number: SAT-Rdmp T1.2.1-InputDataDemCalc-V0
Page 22 of 32
Table 12 ACT-1 Pc-12
Aircraft Value €: 3 388 609 Res. Value €: 568 467 Annual Utilization (FH): 1500
Var Cost/YR 1 2 3 4 5 6 7 8 9 10 11 12 13 14 15 16 17 18 19 20 Total
Fuel 417 355 417 355 417 355 417 355 417 355 417 355 417 355 417 355 417 355 417 355 417 355 417 355 417 355 417 355 417 355 417 355 417 355 417 355 417 355 417 355 8 347 107
Parts 10 170 14 529 56 179 83 299 96 860 105 577 110 420 113 326 116 231 118 169 119 137 121 074 123 012 125 917 128 823 131 729 135 603 139 478 143 352 150 132 2 143 017
Inspections 3 581 4 190 13 948 4 477 4 871 23 271 54 337
Engine Restoral 28 512 124 105 28 512 124 105 28 512 124 105 28 512 124 105 28 512 124 105 28 512 124 105 28 512 124 105 28 512 124 105 28 512 1 249 449
Component
Overhaul (All) 4 153 8 306 17 562 20 124 5 585 16 990 8 877 26 302 6 660 9 738 13 623 24 063 7 445 12 624 9 952 26 302 8 877 7 521 15 055 20 124 269 883
Life Limited
Components 1 888 600 1 888 600 1 888 600 600 1 888 600 1 888 600 31 777 600 600 1 888 600 1 888 600 50 989
Unscheduled
Maintenance 18 595 18 595 18 595 18 595 18 595 18 595 18 595 18 595 18 595 18 595 18 595 18 595 18 595 18 595 18 595 18 595 18 595 18 595 18 595 18 595 371 901
ATC & Nav. Fees 124 981 124 981 124 981 124 981 124 981 124 981 124 981 124 981 124 981 124 981 124 981 124 981 124 981 124 981 124 981 124 981 124 981 124 981 124 981 124 981 2 499 610
Landing Fees 55 560 55 560 55 560 55 560 55 560 55 560 55 560 55 560 55 560 55 560 55 560 55 560 55 560 55 560 55 560 55 560 55 560 55 560 55 560 55 560 1 111 200
Tot Var. costs 630 814 667 838 816 224 752 607 844 928 768 170 861 780 760 908 768 494 884 338 778 363 892 098 776 060 910 914 755 866 808 504 886 964 792 601 900 890 839 131 16 097 493
Fixed Cost/YR 1 2 3 4 5 6 7 8 9 10 11 12 13 14 15 16 17 18 19 20 Total
Cockpit Crew Sal 59 056 59 056 59 056 59 056 59 056 59 056 59 056 59 056 59 056 59 056 59 056 59 056 59 056 59 056 59 056 59 056 59 056 59 056 59 056 59 056 1 181 129
Airworthiness
specialists Sal. 5 028 5 028 5 028 5 028 5 028 5 028 5 028 5 028 5 028 5 028 5 028 5 028 5 028 5 028 5 028 5 028 5 028 5 028 5 028 5 028 100 551
Maint. Techn Sal 39 945 39 945 39 945 39 945 39 945 39 945 39 945 39 945 39 945 39 945 39 945 39 945 39 945 39 945 39 945 39 945 39 945 39 945 39 945 39 945 798 898
Other Sal. 5 992 5 992 5 992 5 992 5 992 5 992 5 992 5 992 5 992 5 992 5 992 5 992 5 992 5 992 5 992 5 992 5 992 5 992 5 992 5 992 119 835
Benefits 11 002 11 002 11 002 11 002 11 002 11 002 11 002 11 002 11 002 11 002 11 002 11 002 11 002 11 002 11 002 11 002 11 002 11 002 11 002 11 002 220 041
Hangar 9 642 9 642 9 642 9 642 9 642 9 642 9 642 9 642 9 642 9 642 9 642 9 642 9 642 9 642 9 642 9 642 9 642 9 642 9 642 9 642 192 837
Hull Ins. 16 774 16 774 16 774 16 774 16 774 16 774 16 774 16 774 16 774 16 774 16 774 16 774 16 774 16 774 16 774 16 774 16 774 16 774 16 774 16 774 335 472
Liability Ins. 152 479 152 479 152 479 152 479 152 479 152 479 152 479 152 479 152 479 152 479 152 479 152 479 152 479 152 479 152 479 152 479 152 479 152 479 152 479 152 479 3 049 587
Training
Pilot/Maint. 1 278 1 278 1 278 1 278 1 278 1 278 1 278 1 278 1 278 1 278 1 278 1 278 1 278 1 278 1 278 1 278 1 278 1 278 1 278 1 278 25 551
Registration Fee 689 689 689 689 689 689 689 689 689 689 689 689 689 689 689 689 689 689 689 689 13 774
Brokerage Fee 8 056 8 056
Modernization 13 774 13 774 13 774 13 774 13 774 13 774 13 774 13 774 13 774 13 774 13 774 13 774 13 774 13 774 13 774 13 774 13 774 13 774 13 774 13 774 275 482
Refurbishing 4 477 4 477 4 477 4 477 4 477 4 477 4 477 4 477 4 477 4 477 4 477 4 477 4 477 4 477 4 477 4 477 4 477 4 477 4 477 4 477 89 532
Tot Fixed Costs 320 134 320 134 320 134 320 134 320 134 320 134 320 134 320 134 320 134 320 134 320 134 320 134 320 134 320 134 320 134 320 134 320 134 320 134 320 134 344 532 6 427 088
Total Acquisition
Cost/Resale 3 388 609 -629 045 2 759 564
Op. Overhead 142 642 148 196 170 454 160 911 174 759 163 246 177 287 162 156 163 294 180 671 164 775 181 835 164 429 184 657 161 400 169 296 181 065 166 910 183 154 177 549 3 378 687
Adm. Overhead 142 642 148 196 170 454 160 911 174 759 163 246 177 287 162 156 163 294 180 671 164 775 181 835 164 429 184 657 161 400 169 296 181 065 166 910 183 154 177 549 3 378 687
Total Costs 4 624 842 1 284
364
1 477
266
1 394
565
1 514
581
1 414
796
1 536
489
1 405
355
1 415
217
1 565
814
1 428
047
1 575
902
1 425
052
1 600
364
1 398
800
1 467
230
1 569
228
1 446
557
1 587
332 909 717 32 041 519
Variable €/FH 421 445 544 502 563 512 575 507 512 590 519 595 517 607 504 539 591 528 601 559
Var + Fixed
€/FH 634 659 758 715 777 726 788 721 726 803 732 808 731 821 717 752 805 742 814 789
Tot Ann Cost
€/FH 3 083 856 985 930 1 010 943 1 024 937 943 1 044 952 1 051 950 1 067 933 978 1 046 964 1 058 606

SAT Aircraft Characteristics to be used for Demand Calculation
Document Number: SAT-Rdmp T1.2.1-InputDataDemCalc-V0
Page 23 of 32
Table 13 ACT-2 Be-1900D
Aircraft Value €: 3 486 915 Res. Value €: 650 561 Annual Utilization (FH): 500
Var Cost/YR 1 2 3 4 5 6 7 8 9 10 11 12 13 14 15 16 17 18 19 20 Total
Fuel 229 545 229 545 229 545 229 545 229 545 229 545 229 545 229 545 229 545 229 545 229 545 229 545 229 545 229 545 229 545 229 545 229 545 229 545 229 545 229 545 4 590 909
Parts 6 847 9 781 18 910 28 039 32 603 35 538 37 168 38 146 39 124 39 776 40 102 40 754 41 406 42 384 43 362 44 340 45 645 46 949 48 253 50 535 729 662
Inspections 7 851 33 981 7 851 33 981 7 851 43 698 8 950 39 757 9 421 41 456 9 657 50 112 9 971 44 175 10 442 46 214 10 992 57 729 11 620 52 670 538 380
Engine Restoral 57 025 57 025 305 234 57 025 57 025 533 333
Component
Overhaul (All) 1 522 6 109 4 277 6 109 8 864 22 596 8 864 1 522 8 864 6 109 4 277 27 183 4 277 6 109 8 864 1 522 8 864 22 596 8 864 6 109 173 497
Life Limited
Components 2 247 2 247 2 247 2 247 6 930 9 279 2 247 2 247 2 247 9 100 2 247 9 279 2 247 2 247 6 930 2 247 2 247 9 279 2 247 9 100 89 105
Unscheduled
Maintenance 10 331 10 331 10 331 10 331 10 331 10 331 10 331 10 331 10 331 10 331 10 331 10 331 10 331 10 331 10 331 10 331 10 331 10 331 10 331 10 331 206 612
ATC & Nav. Fees 55 201 55 201 55 201 55 201 55 201 55 201 55 201 55 201 55 201 55 201 55 201 55 201 55 201 55 201 55 201 55 201 55 201 55 201 55 201 55 201 1 104 022
Landing Fees 76 154 76 154 76 154 76 154 76 154 76 154 76 154 76 154 76 154 76 154 76 154 76 154 76 154 76 154 76 154 76 154 76 154 76 154 76 154 76 154 1 523 085
Tot Var. costs 389 698 423 349 404 516 498 631 427 480 482 341 428 460 509 928 430 887 467 672 427 514 803 793 429 132 466 146 440 830 522 579 438 978 507 784 442 215 546 670 9 488 604
Fixed Cost/YR 1 2 3 4 5 6 7 8 9 10 11 12 13 14 15 16 17 18 19 20 Total
Cockpit Crew Sal 39 917 39 917 39 917 39 917 39 917 39 917 39 917 39 917 39 917 39 917 39 917 39 917 39 917 39 917 39 917 39 917 39 917 39 917 39 917 39 917 798 347
Airworthiness
specialists Sal. 5 028 5 028 5 028 5 028 5 028 5 028 5 028 5 028 5 028 5 028 5 028 5 028 5 028 5 028 5 028 5 028 5 028 5 028 5 028 5 028 100 551
Maint. Techn Sal 19 972 19 972 19 972 19 972 19 972 19 972 19 972 19 972 19 972 19 972 19 972 19 972 19 972 19 972 19 972 19 972 19 972 19 972 19 972 19 972 399 449
Other Sal. 5 992 5 992 5 992 5 992 5 992 5 992 5 992 5 992 5 992 5 992 5 992 5 992 5 992 5 992 5 992 5 992 5 992 5 992 5 992 5 992 119 835
Benefits 7 091 7 091 7 091 7 091 7 091 7 091 7 091 7 091 7 091 7 091 7 091 7 091 7 091 7 091 7 091 7 091 7 091 7 091 7 091 7 091 141 818
Hangar 9 642 9 642 9 642 9 642 9 642 9 642 9 642 9 642 9 642 9 642 9 642 9 642 9 642 9 642 9 642 9 642 9 642 9 642 9 642 9 642 192 837
Hull Ins. 17 260 17 260 17 260 17 260 17 260 17 260 17 260 17 260 17 260 17 260 17 260 17 260 17 260 17 260 17 260 17 260 17 260 17 260 17 260 17 260 345 205
Liability Ins. 152 479 152 479 152 479 152 479 152 479 152 479 152 479 152 479 152 479 152 479 152 479 152 479 152 479 152 479 152 479 152 479 152 479 152 479 152 479 152 479 3 049 587
Training
Pilot/Maint. 2 033 2 033 2 033 2 033 2 033 2 033 2 033 2 033 2 033 2 033 2 033 2 033 2 033 2 033 2 033 2 033 2 033 2 033 2 033 2 033 40 661
Registration Fee 689 689 689 689 689 689 689 689 689 689 689 689 689 689 689 689 689 689 689 689 13 774
Brokerage Fee 18 829 18 829
Modernization 13 774 13 774 13 774 13 774 13 774 13 774 13 774 13 774 13 774 13 774 13 774 13 774 13 774 13 774 13 774 13 774 13 774 13 774 13 774 13 774 275 482
Refurbishing 4 477 4 477 4 477 4 477 4 477 4 477 4 477 4 477 4 477 4 477 4 477 4 477 4 477 4 477 4 477 4 477 4 477 4 477 4 477 4 477 89 532
Tot Fixed Costs 278 354 278 354 278 354 278 354 278 354 278 354 278 354 278 354 278 354 278 354 278 354 278 354 278 354 278 354 278 354 278 354 278 354 278 354 278 354 297 183 5 585 907
Total Acquisition
Cost/Resale 3 486 915 -650 561 2 836 353
Op. Overhead 100 208 105 255 102 431 116 548 105 875 114 104 106 022 118 242 106 386 111 904 105 880 162 322 106 123 111 675 107 878 120 140 107 600 117 921 108 085 126 578 2 261 177
Adm. Overhead 100 208 105 255 102 431 116 548 105 875 114 104 106 022 118 242 106 386 111 904 105 880 162 322 106 123 111 675 107 878 120 140 107 600 117 921 108 085 126 578 2 261 177
Total Costs 4 355 382 912 213 887 731 1 010
081 917 583 988 904 918 858
1 024
767 922 014 969 834 917 628
1 406
791 919 732 967 850 934 938
1 041
213 932 532
1 021
979 936 739 446 447 22 433 218
Variable €/FH 779 847 809 997 855 965 857 1 020 862 935 855 1 608 858 932 882 1 045 878 1 016 884 1 093
Var + Fixed
€/FH 1 336 1 403 1 366 1 554 1 412 1 521 1 414 1 577 1 418 1 492 1 412 2 164 1 415 1 489 1 438 1 602 1 435 1 572 1 441 1 688
Tot Ann Cost
€/FH 8 711 1 824 1 775 2 020 1 835 1 978 1 838 2 050 1 844 1 940 1 835 2 814 1 839 1 936 1 870 2 082 1 865 2 044 1 873 893

SAT Aircraft Characteristics to be used for Demand Calculation
Document Number: SAT-Rdmp T1.2.1-InputDataDemCalc-V0
Page 24 of 32
Table 14 ACT-2 Be-1900D
Aircraft Value €: 3 486 915 Res. Value €: 650 561 Annual Utilization (FH): 1000
Var Cost/YR 1 2 3 4 5 6 7 8 9 10 11 12 13 14 15 16 17 18 19 20 Total
Fuel 459 091 459 091 459 091 459 091 459 091 459 091 459 091 459 091 459 091 459 091 459 091 459 091 459 091 459 091 459 091 459 091 459 091 459 091 459 091 459 091 9 181 818
Parts 13 693 19 562 37 820 56 078 65 207 71 075 74 336 76 292 78 248 79 552 80 204 81 508 82 812 84 769 86 725 88 681 91 289 93 898 96 506 101 070 1 459 324
Inspections 18 347 49 683 18 347 49 683 41 832 35 215 47 688 58 129 22 017 60 613 22 567 69 740 53 127 34 058 55 637 67 569 36 774 80 340 27 154 77 009 925 529
Engine Restoral 57 025 57 025 305 234 57 025 57 025 305 234 57 025 57 025 305 234 57 025 1 314 876
Component
Overhaul (All) 7 631 10 386 10 386 31 460 14 972 10 386 10 386 31 460 10 386 14 972 10 386 31 460 10 386 14 972 10 386 31 460 10 386 10 386 14 972 31 460 328 675
Life Limited
Components 4 494 4 494 4 494 4 494 13 123 7 579 4 494 4 494 8 440 11 346 4 494 7 579 4 494 8 440 9 177 4 494 4 494 11 525 4 494 11 346 137 989
Unscheduled
Maintenance 20 661 20 661 20 661 20 661 20 661 20 661 20 661 20 661 20 661 20 661 20 661 20 661 20 661 20 661 20 661 20 661 20 661 20 661 20 661 20 661 413 223
ATC & Nav. Fees 110 402 110 402 110 402 110 402 110 402 110 402 110 402 110 402 110 402 110 402 110 402 110 402 110 402 110 402 110 402 110 402 110 402 110 402 110 402 110 402 2 208 043
Landing Fees 152 308 152 308 152 308 152 308 152 308 152 308 152 308 152 308 152 308 152 308 152 308 152 308 152 308 152 308 152 308 152 308 152 308 152 308 152 308 152 308 3 046 170
Tot Var. costs 786 628 883 612 813 509 941 202 877 597 1 171
952 879 366 969 862 861 553 965 972 860 113
1 237
984 893 281 941 726 904 387 991 691 885 405
1 243
846 885 588
1 020
373 19 015 647
Fixed Cost/YR 1 2 3 4 5 6 7 8 9 10 11 12 13 14 15 16 17 18 19 20 Total
Cockpit Crew Sal 79 835 79 835 79 835 79 835 79 835 79 835 79 835 79 835 79 835 79 835 79 835 79 835 79 835 79 835 79 835 79 835 79 835 79 835 79 835 79 835 1 596 694
Airworthiness
specialists Sal. 5 028 5 028 5 028 5 028 5 028 5 028 5 028 5 028 5 028 5 028 5 028 5 028 5 028 5 028 5 028 5 028 5 028 5 028 5 028 5 028 100 551
Maint. Techn Sal 29 959 29 959 29 959 29 959 29 959 29 959 29 959 29 959 29 959 29 959 29 959 29 959 29 959 29 959 29 959 29 959 29 959 29 959 29 959 29 959 599 174
Other Sal. 5 992 5 992 5 992 5 992 5 992 5 992 5 992 5 992 5 992 5 992 5 992 5 992 5 992 5 992 5 992 5 992 5 992 5 992 5 992 5 992 119 835
Benefits 12 081 12 081 12 081 12 081 12 081 12 081 12 081 12 081 12 081 12 081 12 081 12 081 12 081 12 081 12 081 12 081 12 081 12 081 12 081 12 081 241 625
Hangar 9 642 9 642 9 642 9 642 9 642 9 642 9 642 9 642 9 642 9 642 9 642 9 642 9 642 9 642 9 642 9 642 9 642 9 642 9 642 9 642 192 837
Hull Ins. 17 260 17 260 17 260 17 260 17 260 17 260 17 260 17 260 17 260 17 260 17 260 17 260 17 260 17 260 17 260 17 260 17 260 17 260 17 260 17 260 345 205
Liability Ins. 152 479 152 479 152 479 152 479 152 479 152 479 152 479 152 479 152 479 152 479 152 479 152 479 152 479 152 479 152 479 152 479 152 479 152 479 152 479 152 479 3 049 587
Training
Pilot/Maint. 4 066 4 066 4 066 4 066 4 066 4 066 4 066 4 066 4 066 4 066 4 066 4 066 4 066 4 066 4 066 4 066 4 066 4 066 4 066 4 066 81 322
Registration Fee 689 689 689 689 689 689 689 689 689 689 689 689 689 689 689 689 689 689 689 689 13 774
Brokerage Fee 18 829 18 829
Modernization 13 774 13 774 13 774 13 774 13 774 13 774 13 774 13 774 13 774 13 774 13 774 13 774 13 774 13 774 13 774 13 774 13 774 13 774 13 774 13 774 275 482
Refurbishing 4 477 4 477 4 477 4 477 4 477 4 477 4 477 4 477 4 477 4 477 4 477 4 477 4 477 4 477 4 477 4 477 4 477 4 477 4 477 4 477 89 532
Tot Fixed Costs 335 281 335 281 335 281 335 281 335 281 335 281 335 281 335 281 335 281 335 281 335 281 335 281 335 281 335 281 335 281 335 281 335 281 335 281 335 281 354 110 6 724 447
Total Acquisition
Cost/Resale 3 486 915 -733 503 2 753 411
Oper. Overhead 168 286 182 834 172 318 191 472 181 932 226 085 182 197 195 771 179 525 195 188 179 309 235 990 184 284 191 551 185 950 199 046 183 103 236 869 183 130 206 172 3 861 014
Adm. Overhead 168 286 182 834 172 318 191 472 181 932 226 085 182 197 195 771 179 525 195 188 179 309 235 990 184 284 191 551 185 950 199 046 183 103 236 869 183 130 206 172 3 861 014
Total Costs 4 945 396 1 584
561
1 493
427
1 659
428
1 576
741
1 959
402
1 579
041
1 696
686
1 555
884
1 691
628
1 554
012
2 045
245
1 597
130
1 660
109
1 611
568
1 725
064
1 586
892
2 052
865
1 587
130
1 053
325 36 215 534
Variable €/FH 787 884 814 941 878 1 172 879 970 862 966 860 1 238 893 942 904 992 885 1 244 886 1 020
Var + Fixed
€/FH 1 122 1 219 1 149 1 276 1 213 1 507 1 215 1 305 1 197 1 301 1 195 1 573 1 229 1 277 1 240 1 327 1 221 1 579 1 221 1 374
Tot Ann Cost
€/FH 4 945 1 585 1 493 1 659 1 577 1 959 1 579 1 697 1 556 1 692 1 554 2 045 1 597 1 660 1 612 1 725 1 587 2 053 1 587 1 053

SAT Aircraft Characteristics to be used for Demand Calculation
Document Number: SAT-Rdmp T1.2.1-InputDataDemCalc-V0
Page 25 of 32
Table 15 ACT-2 Be-1900D
Aircraft Value €: 3 486 915 Res. Value €: 650 561 Annual Utilization (FH): 1500
Var Cost/YR 1 2 3 4 5 6 7 8 9 10 11 12 13 14 15 16 17 18 19 20 Total
Fuel 688 636 688 636 688 636 688 636 688 636 688 636 688 636 688 636 688 636 688 636 688 636 688 636 688 636 688 636 688 636 688 636 688 636 688 636 688 636 688 636 13 772 727
Parts 20 540 29 343 56 730 84 117 97 810 106 613 111 503 114 438 117 372 119 328 120 306 122 262 124 219 127 153 130 087 133 021 136 934 140 846 144 759 151 605 2 188 986
Inspections 26 198 57 534 57 534 57 534 49 683 69 371 65 589 67 315 59 620 70 192 80 509 79 554 63 098 74 795 76 521 78 247 36 678 91 646 85 151 89 178 1 335 949
Engine Restoral 57 025 57 025 305 234 57 025 57 025 305 234 57 025 57 025 305 234 57 025 57 025 305 234 57 025 57 025 305 234 2 096 419
Component
Overhaul (All) 11 908 16 494 40 323 16 494 19 249 32 982 19 249 37 569 16 494 19 249 37 569 14 662 16 494 40 323 16 494 37 569 14 662 16 494 40 323 16 494 481 098
Life Limited
Components 6 741 6 741 10 687 6 741 14 509 10 687 6 741 6 741 13 772 13 593 6 741 10 687 9 826 6 741 15 370 6 741 6 741 13 772 6 741 13 593 193 905
Unscheduled
Maintenance 30 992 30 992 30 992 30 992 30 992 30 992 30 992 30 992 30 992 30 992 30 992 30 992 30 992 30 992 30 992 30 992 30 992 30 992 30 992 30 992 619 835
ATC & Nav. Fees 165 603 165 603 165 603 165 603 165 603 165 603 165 603 165 603 165 603 165 603 165 603 165 603 165 603 165 603 165 603 165 603 165 603 165 603 165 603 165 603 3 312 065
Landing Fees 228 463 228 463 228 463 228 463 228 463 228 463 228 463 228 463 228 463 228 463 228 463 228 463 228 463 228 463 228 463 228 463 228 463 228 463 228 463 228 463 4 569 254
Tot Var. costs 1 179 081 1 280
831
1 335
993
1 583
814
1 294
946
1 390
372
1 373
801
1 644
990
1 320
952
1 393
081
1 415
843
1 646
094
1 327
331
1 419
731
1 409
191
1 674
506
1 308
709
1 433
478
1 447
693
1 689
800 28 570 237
Fixed Cost/YR 1 2 3 4 5 6 7 8 9 10 11 12 13 14 15 16 17 18 19 20 Total
Cockpit Crew Sal 116 426 116 426 116 426 116 426 116 426 116 426 116 426 116 426 116 426 116 426 116 426 116 426 116 426 116 426 116 426 116 426 116 426 116 426 116 426 116 426 2 328 512
Airworthiness
specialists Sal. 5 028 5 028 5 028 5 028 5 028 5 028 5 028 5 028 5 028 5 028 5 028 5 028 5 028 5 028 5 028 5 028 5 028 5 028 5 028 5 028 100 551
Maint. Techn Sal 40 634 40 634 40 634 40 634 40 634 40 634 40 634 40 634 40 634 40 634 40 634 40 634 40 634 40 634 40 634 40 634 40 634 40 634 40 634 40 634 812 672
Other Sal. 5 992 5 992 5 992 5 992 5 992 5 992 5 992 5 992 5 992 5 992 5 992 5 992 5 992 5 992 5 992 5 992 5 992 5 992 5 992 5 992 119 835
Benefits 16 808 16 808 16 808 16 808 16 808 16 808 16 808 16 808 16 808 16 808 16 808 16 808 16 808 16 808 16 808 16 808 16 808 16 808 16 808 16 808 336 157
Hangar 9 642 9 642 9 642 9 642 9 642 9 642 9 642 9 642 9 642 9 642 9 642 9 642 9 642 9 642 9 642 9 642 9 642 9 642 9 642 9 642 192 837
Hull Ins. 17 260 17 260 17 260 17 260 17 260 17 260 17 260 17 260 17 260 17 260 17 260 17 260 17 260 17 260 17 260 17 260 17 260 17 260 17 260 17 260 345 205
Liability Ins. 152 479 152 479 152 479 152 479 152 479 152 479 152 479 152 479 152 479 152 479 152 479 152 479 152 479 152 479 152 479 152 479 152 479 152 479 152 479 152 479 3 049 587
Training
Pilot/Maint. 5 930 5 930 5 930 5 930 5 930 5 930 5 930 5 930 5 930 5 930 5 930 5 930 5 930 5 930 5 930 5 930 5 930 5 930 5 930 5 930 118 595
Registration Fee 689 689 689 689 689 689 689 689 689 689 689 689 689 689 689 689 689 689 689 689 13 774
Brokerage Fee 18 829 18 829
Modernization 13 774 13 774 13 774 13 774 13 774 13 774 13 774 13 774 13 774 13 774 13 774 13 774 13 774 13 774 13 774 13 774 13 774 13 774 13 774 13 774 275 482
Refurbishing 4 477 4 477 4 477 4 477 4 477 4 477 4 477 4 477 4 477 4 477 4 477 4 477 4 477 4 477 4 477 4 477 4 477 4 477 4 477 4 477 89 532
Tot Fixed Costs 389 137 389 137 389 137 389 137 389 137 389 137 389 137 389 137 389 137 389 137 389 137 389 137 389 137 389 137 389 137 389 137 389 137 389 137 389 137 407 966 7 801 568
Total Acquisition
Cost/Resale 3 486 915 -791 458 2 695 456
Op. Overhead 235 233 250 495 258 770 295 943 252 612 266 926 264 441 305 119 256 513 267 333 270 747 305 285 257 470 271 330 269 749 309 546 254 677 273 392 275 524 314 665 5 455 771
Adm. Overhead 235 233 250 495 258 770 295 943 252 612 266 926 264 441 305 119 256 513 267 333 270 747 305 285 257 470 271 330 269 749 309 546 254 677 273 392 275 524 314 665 5 455 771
Total Costs 5 525 598 2 170
959
2 242
670
2 564
836
2 189
307
2 313
361
2 291
820
2 644
366
2 223
116
2 316
884
2 346
475
2 645
800
2 231
408
2 351
528
2 337
827
2 682
736
2 207
199
2 369
400
2 387
879
1 935
637 49 978 804
Variable €/FH 786 854 891 1 056 863 927 916 1 097 881 929 944 1 097 885 946 939 1 116 872 956 965 1 127
Var + Fixed
€/FH 1 045 1 113 1 150 1 315 1 123 1 186 1 175 1 356 1 140 1 188 1 203 1 357 1 144 1 206 1 199 1 376 1 132 1 215 1 225 1 399
Tot Ann Cost
€/FH 3 684 1 447 1 495 1 710 1 460 1 542 1 528 1 763 1 482 1 545 1 564 1 764 1 488 1 568 1 559 1 788 1 471 1 580 1 592 1 290

SAT Aircraft Characteristics to be used for Demand Calculation
Document Number: SAT-Rdmp T1.2.1-InputDataDemCalc-V0
Page 26 of 32
Table 16 ACJ-1 Cessna CJ1+
Aircraft Value €: 4 280 923 Res. Value €: 1 339 354 Annual Utilization (FH): 500
Var Cost/YR 1 2 3 4 5 6 7 8 9 10 11 12 13 14 15 16 17 18 19 20 Total
Fuel 245 196 245 196 245 196 245 196 245 196 245 196 245 196 245 196 245 196 245 196 245 196 245 196 245 196 245 196 245 196 245 196 245 196 245 196 245 196 245 196 4 903 926
Parts 4 251 6 073 11 741 17 409 20 243 44 129 46 154 47 368 48 583 49 392 49 797 50 607 51 417 52 631 53 846 55 060 56 680 58 299 59 919 62 753 846 350
Inspections 39 601 39 601 46 333 58 815 49 501 52 669 55 441 105 255 447 214
Engine Restoral 1 667 5 372 5 372 98 581 5 372 5 372 326 460 14 146 5 372 5 372 98 581 5 372 1 667 330 165 14 146 134 711 5 372 98 581 1 667 80 716 1 244 063
Component
Overhaul (All) 379 3 437 6 825 3 685 510 9 883 627 3 437 6 825 3 815 6 825 3 437 627 10 014 379 3 685 6 825 3 437 758 9 883 85 289
Life Limited
Components 1 136 1 136 1 136 1 983 1 426 11 000 11 847 11 000 11 000 12 136 11 000 11 000 11 847 11 289 11 000 11 847 11 000 11 000 12 136 11 000 176 921
Unscheduled
Maintenance 13 774 13 774 13 774 13 774 13 774 13 774 13 774 13 774 13 774 13 774 13 774 13 774 13 774 13 774 13 774 13 774 13 774 13 774 13 774 13 774 275 482
ATC & Nav. Fees 59 112 59 112 59 112 59 112 59 112 59 112 59 112 59 112 59 112 59 112 59 112 59 112 59 112 59 112 59 112 59 112 59 112 59 112 59 112 59 112 1 182 242
Landing Fees 34 050 34 050 34 050 34 050 34 050 34 050 34 050 34 050 34 050 34 050 34 050 34 050 34 050 34 050 34 050 34 050 34 050 34 050 34 050 34 050 680 996
Tot Var. costs 359 565 368 150 416 807 473 790 419 283 422 516 737 220 474 416 423 912 481 664 518 336 472 048 417 689 756 232 484 172 557 435 487 450 523 449 426 611 621 739 9 842 484
Fixed Cost/YR 1 2 3 4 5 6 7 8 9 10 11 12 13 14 15 16 17 18 19 20 Total
Cockpit Crew Sal 41 942 41 942 41 942 41 942 41 942 41 942 41 942 41 942 41 942 41 942 41 942 41 942 41 942 41 942 41 942 41 942 41 942 41 942 41 942 41 942 838 843
Airworthiness
specialists Sal. 6 336 6 336 6 336 6 336 6 336 6 336 6 336 6 336 6 336 6 336 6 336 6 336 6 336 6 336 6 336 6 336 6 336 6 336 6 336 6 336 126 722
Maint. Techn Sal 29 959 29 959 29 959 29 959 29 959 29 959 29 959 29 959 29 959 29 959 29 959 29 959 29 959 29 959 29 959 29 959 29 959 29 959 29 959 29 959 599 174
Other Sal. 758 758 758 758 758 758 758 758 758 758 758 758 758 758 758 758 758 758 758 758 15 152
Benefits 7 899 7 899 7 899 7 899 7 899 7 899 7 899 7 899 7 899 7 899 7 899 7 899 7 899 7 899 7 899 7 899 7 899 7 899 7 899 7 899 157 989
Hangar 9 642 9 642 9 642 9 642 9 642 9 642 9 642 9 642 9 642 9 642 9 642 9 642 9 642 9 642 9 642 9 642 9 642 9 642 9 642 9 642 192 837
Hull Ins. 10 831 10 831 10 831 10 831 10 831 10 831 10 831 10 831 10 831 10 831 10 831 10 831 10 831 10 831 10 831 10 831 10 831 10 831 10 831 10 831 216 615
Liability Ins. 12 672 12 672 12 672 12 672 12 672 12 672 12 672 12 672 12 672 12 672 12 672 12 672 12 672 12 672 12 672 12 672 12 672 12 672 12 672 12 672 253 444
Training
Pilot/Maint. 5 537 5 537 5 537 5 537 5 537 5 537 5 537 5 537 5 537 5 537 5 537 5 537 5 537 5 537 5 537 5 537 5 537 5 537 5 537 5 537 110 744
Registration Fee 689 689 689 689 689 689 689 689 689 689 689 689 689 689 689 689 689 689 689 689 13 774
Brokerage Fee 34 247 34 247
Modernization 13 774 13 774 13 774 13 774 13 774 13 774 13 774 13 774 13 774 13 774 13 774 13 774 13 774 13 774 13 774 13 774 13 774 13 774 13 774 13 774 275 482
Refurbishing 895 895 895 895 895 895 895 895 895 895 895 895 895 895 895 895 895 895 895 895 17 906
Tot Fixed Costs 140 934 140 934 140 934 140 934 140 934 140 934 140 934 140 934 140 934 140 934 140 934 140 934 140 934 140 934 140 934 140 934 140 934 140 934 140 934 175 181 2 852 928
Total Acquisition
Cost/Resale 4 280 923
-1 339
354 2 941 569
Op. Overhead 75 075 76 363 83 661 92 209 84 033 84 518 131 723 92 302 84 727 93 390 98 890 91 947 83 794 134 575 93 766 104 755 94 258 99 658 85 132 119 538 1 904 312
Adm. Overhead 75 075 76 363 83 661 92 209 84 033 84 518 131 723 92 302 84 727 93 390 98 890 91 947 83 794 134 575 93 766 104 755 94 258 99 658 85 132 119 538 1 904 312
Total Costs 4 931 572 661 809 725 063 799 142 728 282 732 485 1 141
600 799 955 734 300 809 377 857 051 796 877 726 210
1 166
316 812 637 907 880 816 899 863 698 737 809 -303 358 19 445 604
Variable €/FH 719 736 834 948 839 845 1 474 949 848 963 1 037 944 835 1 512 968 1 115 975 1 047 853 1 243
Var + Fixed
€/FH 1 001 1 018 1 115 1 229 1 120 1 127 1 756 1 231 1 130 1 245 1 319 1 226 1 117 1 794 1 250 1 397 1 257 1 329 1 135 1 594
Tot Ann Cost
€/FH 9 863 1 324 1 450 1 598 1 457 1 465 2 283 1 600 1 469 1 619 1 714 1 594 1 452 2 333 1 625 1 816 1 634 1 727 1 476 -607
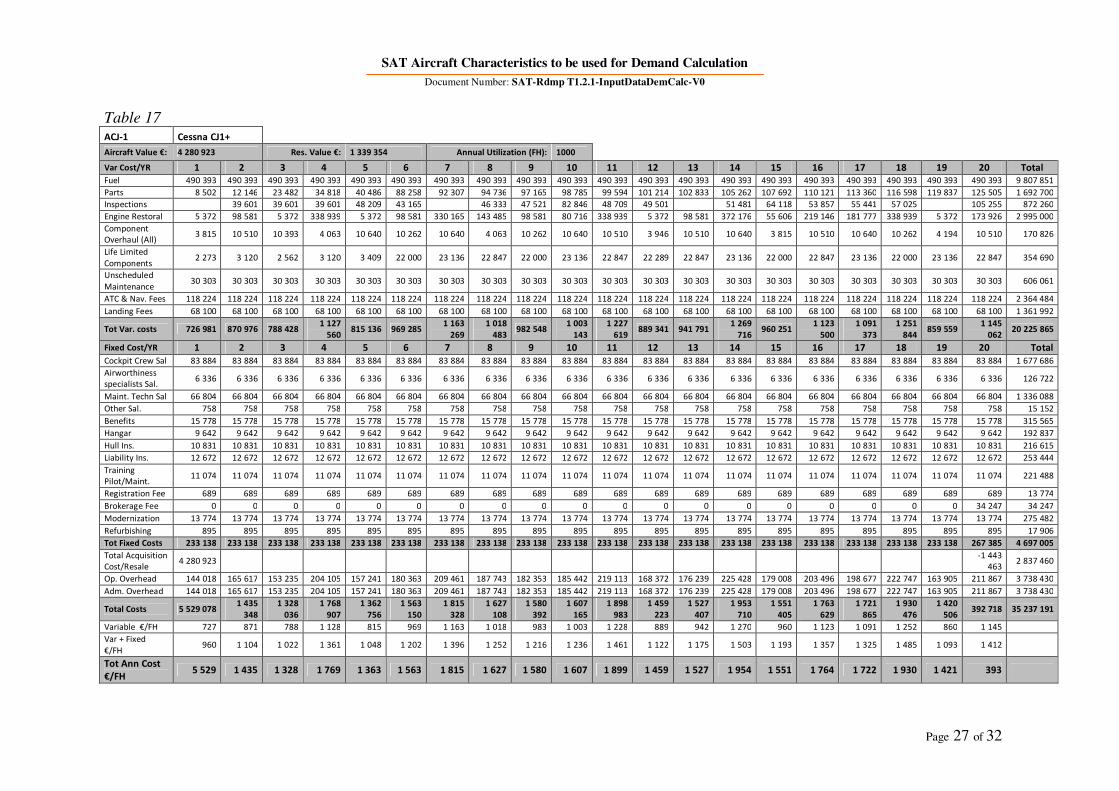
SAT Aircraft Characteristics to be used for Demand Calculation
Document Number: SAT-Rdmp T1.2.1-InputDataDemCalc-V0
Page 27 of 32
Table 17 ACJ-1 Cessna CJ1+
Aircraft Value €: 4 280 923 Res. Value €: 1 339 354 Annual Utilization (FH): 1000
Var Cost/YR 1 2 3 4 5 6 7 8 9 10 11 12 13 14 15 16 17 18 19 20 Total
Fuel 490 393 490 393 490 393 490 393 490 393 490 393 490 393 490 393 490 393 490 393 490 393 490 393 490 393 490 393 490 393 490 393 490 393 490 393 490 393 490 393 9 807 851
Parts 8 502 12 146 23 482 34 818 40 486 88 258 92 307 94 736 97 165 98 785 99 594 101 214 102 833 105 262 107 692 110 121 113 360 116 598 119 837 125 505 1 692 700
Inspections 39 601 39 601 39 601 48 209 43 165 46 333 47 521 82 846 48 709 49 501 51 481 64 118 53 857 55 441 57 025 105 255 872 260
Engine Restoral 5 372 98 581 5 372 338 939 5 372 98 581 330 165 143 485 98 581 80 716 338 939 5 372 98 581 372 176 55 606 219 146 181 777 338 939 5 372 173 926 2 995 000
Component
Overhaul (All) 3 815 10 510 10 393 4 063 10 640 10 262 10 640 4 063 10 262 10 640 10 510 3 946 10 510 10 640 3 815 10 510 10 640 10 262 4 194 10 510 170 826
Life Limited
Components 2 273 3 120 2 562 3 120 3 409 22 000 23 136 22 847 22 000 23 136 22 847 22 289 22 847 23 136 22 000 22 847 23 136 22 000 23 136 22 847 354 690
Unscheduled
Maintenance 30 303 30 303 30 303 30 303 30 303 30 303 30 303 30 303 30 303 30 303 30 303 30 303 30 303 30 303 30 303 30 303 30 303 30 303 30 303 30 303 606 061
ATC & Nav. Fees 118 224 118 224 118 224 118 224 118 224 118 224 118 224 118 224 118 224 118 224 118 224 118 224 118 224 118 224 118 224 118 224 118 224 118 224 118 224 118 224 2 364 484
Landing Fees 68 100 68 100 68 100 68 100 68 100 68 100 68 100 68 100 68 100 68 100 68 100 68 100 68 100 68 100 68 100 68 100 68 100 68 100 68 100 68 100 1 361 992
Tot Var. costs 726 981 870 976 788 428 1 127
560 815 136 969 285
1 163
269
1 018
483 982 548
1 003
143
1 227
619 889 341 941 791
1 269
716 960 251
1 123
500
1 091
373
1 251
844 859 559
1 145
062 20 225 865
Fixed Cost/YR 1 2 3 4 5 6 7 8 9 10 11 12 13 14 15 16 17 18 19 20 Total
Cockpit Crew Sal 83 884 83 884 83 884 83 884 83 884 83 884 83 884 83 884 83 884 83 884 83 884 83 884 83 884 83 884 83 884 83 884 83 884 83 884 83 884 83 884 1 677 686
Airworthiness
specialists Sal. 6 336 6 336 6 336 6 336 6 336 6 336 6 336 6 336 6 336 6 336 6 336 6 336 6 336 6 336 6 336 6 336 6 336 6 336 6 336 6 336 126 722
Maint. Techn Sal 66 804 66 804 66 804 66 804 66 804 66 804 66 804 66 804 66 804 66 804 66 804 66 804 66 804 66 804 66 804 66 804 66 804 66 804 66 804 66 804 1 336 088
Other Sal. 758 758 758 758 758 758 758 758 758 758 758 758 758 758 758 758 758 758 758 758 15 152
Benefits 15 778 15 778 15 778 15 778 15 778 15 778 15 778 15 778 15 778 15 778 15 778 15 778 15 778 15 778 15 778 15 778 15 778 15 778 15 778 15 778 315 565
Hangar 9 642 9 642 9 642 9 642 9 642 9 642 9 642 9 642 9 642 9 642 9 642 9 642 9 642 9 642 9 642 9 642 9 642 9 642 9 642 9 642 192 837
Hull Ins. 10 831 10 831 10 831 10 831 10 831 10 831 10 831 10 831 10 831 10 831 10 831 10 831 10 831 10 831 10 831 10 831 10 831 10 831 10 831 10 831 216 615
Liability Ins. 12 672 12 672 12 672 12 672 12 672 12 672 12 672 12 672 12 672 12 672 12 672 12 672 12 672 12 672 12 672 12 672 12 672 12 672 12 672 12 672 253 444
Training
Pilot/Maint. 11 074 11 074 11 074 11 074 11 074 11 074 11 074 11 074 11 074 11 074 11 074 11 074 11 074 11 074 11 074 11 074 11 074 11 074 11 074 11 074 221 488
Registration Fee 689 689 689 689 689 689 689 689 689 689 689 689 689 689 689 689 689 689 689 689 13 774
Brokerage Fee 0 0 0 0 0 0 0 0 0 0 0 0 0 0 0 0 0 0 0 34 247 34 247
Modernization 13 774 13 774 13 774 13 774 13 774 13 774 13 774 13 774 13 774 13 774 13 774 13 774 13 774 13 774 13 774 13 774 13 774 13 774 13 774 13 774 275 482
Refurbishing 895 895 895 895 895 895 895 895 895 895 895 895 895 895 895 895 895 895 895 895 17 906
Tot Fixed Costs 233 138 233 138 233 138 233 138 233 138 233 138 233 138 233 138 233 138 233 138 233 138 233 138 233 138 233 138 233 138 233 138 233 138 233 138 233 138 267 385 4 697 005
Total Acquisition
Cost/Resale 4 280 923
-1 443
463 2 837 460
Op. Overhead 144 018 165 617 153 235 204 105 157 241 180 363 209 461 187 743 182 353 185 442 219 113 168 372 176 239 225 428 179 008 203 496 198 677 222 747 163 905 211 867 3 738 430
Adm. Overhead 144 018 165 617 153 235 204 105 157 241 180 363 209 461 187 743 182 353 185 442 219 113 168 372 176 239 225 428 179 008 203 496 198 677 222 747 163 905 211 867 3 738 430
Total Costs 5 529 078 1 435
348
1 328
036
1 768
907
1 362
756
1 563
150
1 815
328
1 627
108
1 580
392
1 607
165
1 898
983
1 459
223
1 527
407
1 953
710
1 551
405
1 763
629
1 721
865
1 930
476
1 420
506 392 718 35 237 191
Variable €/FH 727 871 788 1 128 815 969 1 163 1 018 983 1 003 1 228 889 942 1 270 960 1 123 1 091 1 252 860 1 145
Var + Fixed
€/FH 960 1 104 1 022 1 361 1 048 1 202 1 396 1 252 1 216 1 236 1 461 1 122 1 175 1 503 1 193 1 357 1 325 1 485 1 093 1 412
Tot Ann Cost
€/FH 5 529 1 435 1 328 1 769 1 363 1 563 1 815 1 627 1 580 1 607 1 899 1 459 1 527 1 954 1 551 1 764 1 722 1 930 1 421 393

SAT Aircraft Characteristics to be used for Demand Calculation
Document Number: SAT-Rdmp T1.2.1-InputDataDemCalc-V0
Page 28 of 32
Table 18 ACJ-1 Cessna CJ1+
Aircraft Value €: 4 280 923 Res. Value €: 1 339 354 Annual Utilization (FH): 1500
Var Cost/YR 1 2 3 4 5 6 7 8 9 10 11 12 13 14 15 16 17 18 19 20 Total
Fuel 735 589 735 589 735 589 735 589 735 589 735 589 735 589 735 589 735 589 735 589 735 589 735 589 735 589 735 589 735 589 735 589 735 589 735 589 735 589 735 589 14 711 777
Parts 12 753 18 218 35 222 52 226 60 728 132 388 138 461 142 104 145 748 148 177 149 392 151 821 154 250 157 894 161 537 165 181 170 039 174 898 179 756 188 258 2 539 050
Inspections 39 601 39 601 39 601 48 209 39 601 43 165 77 413 46 333 47 521 58 815 48 709 49 501 50 293 88 278 52 669 53 857 67 493 57 025 58 609 105 255 1 111 545
Engine Restoral 5 372 98 581 338 939 98 581 338 939 227 920 405 510 14 146 140 592 380 399 395 551 338 939 89 807 414 284 14 146 227 920 338 939 140 592 330 165 215 386 4 554 711
Component
Overhaul (All) 10 640 14 077 10 888 14 077 11 019 13 946 11 019 14 077 10 888 14 077 17 466 13 946 11 019 14 077 10 888 14 077 11 019 13 946 11 019 14 077 256 247
Life Limited
Components 3 409 4 545 4 256 4 545 4 545 33 847 34 136 34 136 33 847 34 136 34 136 33 847 34 136 34 136 33 847 34 136 34 136 33 847 34 136 34 136 531 901
Unscheduled
Maintenance 45 455 45 455 45 455 45 455 45 455 45 455 45 455 45 455 45 455 45 455 45 455 45 455 45 455 45 455 45 455 45 455 45 455 45 455 45 455 45 455 909 091
ATC & Nav. Fees 177 336 177 336 177 336 177 336 177 336 177 336 177 336 177 336 177 336 177 336 177 336 177 336 177 336 177 336 177 336 177 336 177 336 177 336 177 336 177 336 3 546 726
Landing Fees 102 149 102 149 102 149 102 149 102 149 102 149 102 149 102 149 102 149 102 149 102 149 102 149 102 149 102 149 102 149 102 149 102 149 102 149 102 149 102 149 2 042 988
Tot Var. costs 1 132 304 1 235
552
1 489
436
1 278
169
1 515
362
1 511
795
1 727
068
1 311
325
1 439
125
1 696
135
1 705
782
1 648
583
1 400
034
1 769
198
1 333
617
1 555
700
1 682
156
1 480
837
1 674
215
1 617
641 30 204 035
Fixed Cost/YR 1 2 3 4 5 6 7 8 9 10 11 12 13 14 15 16 17 18 19 20 Total
Cockpit Crew Sal 122 331 122 331 122 331 122 331 122 331 122 331 122 331 122 331 122 331 122 331 122 331 122 331 122 331 122 331 122 331 122 331 122 331 122 331 122 331 122 331 2 446 625
Airworthiness
specialists Sal. 6 336 6 336 6 336 6 336 6 336 6 336 6 336 6 336 6 336 6 336 6 336 6 336 6 336 6 336 6 336 6 336 6 336 6 336 6 336 6 336 126 722
Maint. Techn Sal 96 763 96 763 96 763 96 763 96 763 96 763 96 763 96 763 96 763 96 763 96 763 96 763 96 763 96 763 96 763 96 763 96 763 96 763 96 763 96 763 1 935 262
Other Sal. 758 758 758 758 758 758 758 758 758 758 758 758 758 758 758 758 758 758 758 758 15 152
Benefits 22 619 22 619 22 619 22 619 22 619 22 619 22 619 22 619 22 619 22 619 22 619 22 619 22 619 22 619 22 619 22 619 22 619 22 619 22 619 22 619 452 376
Hangar 9 642 9 642 9 642 9 642 9 642 9 642 9 642 9 642 9 642 9 642 9 642 9 642 9 642 9 642 9 642 9 642 9 642 9 642 9 642 9 642 192 837
Hull Ins. 10 831 10 831 10 831 10 831 10 831 10 831 10 831 10 831 10 831 10 831 10 831 10 831 10 831 10 831 10 831 10 831 10 831 10 831 10 831 10 831 216 615
Liability Ins. 12 672 12 672 12 672 12 672 12 672 12 672 12 672 12 672 12 672 12 672 12 672 12 672 12 672 12 672 12 672 12 672 12 672 12 672 12 672 12 672 253 444
Training
Pilot/Maint. 16 150 16 150 16 150 16 150 16 150 16 150 16 150 16 150 16 150 16 150 16 150 16 150 16 150 16 150 16 150 16 150 16 150 16 150 16 150 16 150 323 003
Registration Fee 689 689 689 689 689 689 689 689 689 689 689 689 689 689 689 689 689 689 689 689 13 774
Brokerage Fee 34 247 34 247
Modernization 13 774 13 774 13 774 13 774 13 774 13 774 13 774 13 774 13 774 13 774 13 774 13 774 13 774 13 774 13 774 13 774 13 774 13 774 13 774 13 774 275 482
Refurbishing 895 895 895 895 895 895 895 895 895 895 895 895 895 895 895 895 895 895 895 895 17 906
Tot Fixed Costs 313 460 313 460 313 460 313 460 313 460 313 460 313 460 313 460 313 460 313 460 313 460 313 460 313 460 313 460 313 460 313 460 313 460 313 460 313 460 347 707 6 303 445
Total Acquisition
Cost/Resale 4 280 923
-1 433
539 2 847 383
Op. Overhead 216 865 232 352 270 434 238 744 274 323 273 788 306 079 243 718 262 888 301 439 302 886 294 306 257 024 312 399 247 061 280 374 299 342 269 145 298 151 294 802 5 476 122
Adm. Overhead 216 865 232 352 270 434 238 744 274 323 273 788 306 079 243 718 262 888 301 439 302 886 294 306 257 024 312 399 247 061 280 374 299 342 269 145 298 151 294 802 5 476 122
Total Costs 6 160 416 2 013
715
2 343
765
2 069
117
2 377
468
2 372
831
2 652
686
2 112
221
2 278
361
2 612
473
2 625
015
2 550
656
2 227
543
2 707
455
2 141
199
2 429
908
2 594
301
2 332
586
2 583
977
1 121
413 50 307 107
Variable €/FH 755 824 993 852 1 010 1 008 1 151 874 959 1 131 1 137 1 099 933 1 179 889 1 037 1 121 987 1 116 1 078
Var + Fixed
€/FH 964 1 033 1 202 1 061 1 219 1 217 1 360 1 083 1 168 1 340 1 346 1 308 1 142 1 388 1 098 1 246 1 330 1 196 1 325 1 310
Tot Ann Cost
€/FH 4 107 1 342 1 563 1 379 1 585 1 582 1 768 1 408 1 519 1 742 1 750 1 700 1 485 1 805 1 427 1 620 1 730 1 555 1 723 748

SAT Aircraft Characteristics to be used for Demand Calculation
Document Number: SAT-Rdmp T1.2.1-InputDataDemCalc-V0
Page 29 of 32
Table 19 ACJ-2 HB 400XP
Aircraft Value €: 6 217 631 Res. Value €: 1 927 072 Annual Utilization (FH): 500
Var Cost/YR 1 2 3 4 5 6 7 8 9 10 11 12 13 14 15 16 17 18 19 20 Total
Fuel 386 054 386 054 386 054 386 054 386 054 386 054 386 054 386 054 386 054 386 054 386 054 386 054 386 054 386 054 386 054 386 054 386 054 386 054 386 054 386 054 7 721 074
Parts 5 221 7 458 14 419 21 380 24 861 54 196 56 682 58 174 59 665 60 660 61 157 62 151 63 146 64 637 66 129 67 621 69 610 71 598 73 587 77 068 1 039 419
Inspections 28 650 33 521 104 860 35 813 114 314 40 110 133 223 490 490
Engine Restoral 73 967 387 466 73 967 387 466 73 967 996 832
Component
Overhaul (All) 7 087 19 325 7 225 19 325 7 225 19 325 7 087 19 463 38 767 19 463 14 036 12 514 14 036 12 376 14 174 12 376 14 174 44 056 14 036 12 514 328 581
Life Limited
Components 1 460 2 713 1 667 2 713 1 667 10 640 9 387 10 847 9 387 10 847 10 640 9 594 10 640 9 387 10 847 9 387 10 847 9 387 10 640 9 594 162 293
Unscheduled
Maintenance 15 152 15 152 15 152 15 152 15 152 15 152 15 152 15 152 15 152 15 152 15 152 15 152 15 152 15 152 15 152 15 152 15 152 15 152 15 152 15 152 303 030
ATC & Nav. Fees 85 629 85 629 85 629 85 629 85 629 85 629 85 629 85 629 85 629 85 629 85 629 85 629 85 629 85 629 85 629 85 629 85 629 85 629 85 629 85 629 1 712 587
Landing Fees 63 585 63 585 63 585 63 585 63 585 63 585 63 585 63 585 63 585 63 585 63 585 63 585 63 585 63 585 63 585 63 585 63 585 63 585 63 585 63 585 1 271 707
Tot Var. costs 564 187 579 917 602 380 667 805 584 172 634 581 1 011
041 672 424 658 239 746 249 710 220 670 491 638 242
1 024
286 755 884 639 804 685 160 749 429 648 683 782 818 14 026 014
Fixed Cost/YR 1 2 3 4 5 6 7 8 9 10 11 12 13 14 15 16 17 18 19 20 Total
Cockpit Crew Sal 41 942 41 942 41 942 41 942 41 942 41 942 41 942 41 942 41 942 41 942 41 942 41 942 41 942 41 942 41 942 41 942 41 942 41 942 41 942 41 942 838 843
Airworthiness
specialists Sal. 6 336 6 336 6 336 6 336 6 336 6 336 6 336 6 336 6 336 6 336 6 336 6 336 6 336 6 336 6 336 6 336 6 336 6 336 6 336 6 336 126 722
Maint. Techn Sal 29 959 29 959 29 959 29 959 29 959 29 959 29 959 29 959 29 959 29 959 29 959 29 959 29 959 29 959 29 959 29 959 29 959 29 959 29 959 29 959 599 174
Other Sal. 758 758 758 758 758 758 758 758 758 758 758 758 758 758 758 758 758 758 758 758 15 152
Benefits 7 899 7 899 7 899 7 899 7 899 7 899 7 899 7 899 7 899 7 899 7 899 7 899 7 899 7 899 7 899 7 899 7 899 7 899 7 899 7 899 157 989
Hangar 9 642 9 642 9 642 9 642 9 642 9 642 9 642 9 642 9 642 9 642 9 642 9 642 9 642 9 642 9 642 9 642 9 642 9 642 9 642 9 642 192 837
Hull Ins. 27 358 27 358 27 358 27 358 27 358 27 358 27 358 27 358 27 358 27 358 27 358 27 358 27 358 27 358 27 358 27 358 27 358 27 358 27 358 27 358 547 152
Liability Ins. 12 672 12 672 12 672 12 672 12 672 12 672 12 672 12 672 12 672 12 672 12 672 12 672 12 672 12 672 12 672 12 672 12 672 12 672 12 672 12 672 253 444
Training
Pilot/Maint. 6 074 6 074 6 074 6 074 6 074 6 074 6 074 6 074 6 074 6 074 6 074 6 074 6 074 6 074 6 074 6 074 6 074 6 074 6 074 6 074 121 488
Registration Fee 689 689 689 689 689 689 689 689 689 689 689 689 689 689 689 689 689 689 689 689 13 774
Brokerage Fee 49 741 49 741
Modernization 13 774 13 774 13 774 13 774 13 774 13 774 13 774 13 774 13 774 13 774 13 774 13 774 13 774 13 774 13 774 13 774 13 774 13 774 13 774 13 774 275 482
Refurbishing 895 895 895 895 895 895 895 895 895 895 895 895 895 895 895 895 895 895 895 895 17 906
Tot Fixed Costs 157 998 157 998 157 998 157 998 157 998 157 998 157 998 157 998 157 998 157 998 157 998 157 998 157 998 157 998 157 998 157 998 157 998 157 998 157 998 207 739 3 209 702
Total Acquisition
Cost/Resale 6 217 631
-1 927
072 4 290 559
Op. Overhead 108 328 110 687 114 057 123 871 111 325 118 887 175 356 124 563 122 436 135 637 130 233 124 273 119 436 177 343 137 082 119 670 126 474 136 114 121 002 148 584 2 585 358
Adm. Overhead 108 328 110 687 114 057 123 871 111 325 118 887 175 356 124 563 122 436 135 637 130 233 124 273 119 436 177 343 137 082 119 670 126 474 136 114 121 002 148 584 2 585 358
Total Costs 7 156 472 959 289 988 492 1 073
545 964 821
1 030
353
1 519
751
1 079
549
1 061
109
1 175
521
1 128
684
1 077
036
1 035
112
1 536
969
1 188
046
1 037
142
1 096
106
1 179
655
1 048
686 -639 347 26 696 991
Variable €/FH 1 128 1 160 1 205 1 336 1 168 1 269 2 022 1 345 1 316 1 492 1 420 1 341 1 276 2 049 1 512 1 280 1 370 1 499 1 297 1 566
Var + Fixed
€/FH 1 444 1 476 1 521 1 652 1 484 1 585 2 338 1 661 1 632 1 808 1 736 1 657 1 592 2 365 1 828 1 596 1 686 1 815 1 613 1 981
Tot Ann Cost
€/FH 14 313 1 919 1 977 2 147 1 930 2 061 3 040 2 159 2 122 2 351 2 257 2 154 2 070 3 074 2 376 2 074 2 192 2 359 2 097 -1 279

SAT Aircraft Characteristics to be used for Demand Calculation
Document Number: SAT-Rdmp T1.2.1-InputDataDemCalc-V0
Page 30 of 32
Table 20 ACJ-2 HB 400XP
Aircraft Value €: 6 217 631 Res. Value €: 1 927 072 Annual Utilization (FH): 1000
Var Cost/YR 1 2 3 4 5 6 7 8 9 10 11 12 13 14 15 16 17 18 19 20 Total
Fuel 772 107 772 107 772 107 772 107 772 107 772 107 772 107 772 107 772 107 772 107 772 107 772 107 772 107 772 107 772 107 772 107 772 107 772 107 772 107 772 107 15 442 149
Parts 10 441 14 916 28 838 42 760 49 721 108 392 113 364 116 347 119 331 121 319 122 314 124 303 126 292 129 275 132 258 135 241 139 219 143 197 147 174 154 135 2 078 838
Inspections 28 650 28 650 85 950 31 229 100 562 34 380 104 860 35 240 107 438 37 245 114 314 38 964 120 331 41 256 133 223 1 042 292
Engine Restoral 73 967 387 466 73 967 387 466 73 967 387 466 73 967 387 466 73 967 387 466 73 967 2 381 129
Component
Overhaul (All) 26 412 26 550 26 550 26 550 58 230 26 550 26 412 26 550 58 230 26 550 33 499 26 550 26 412 58 230 26 550 26 550 26 550 58 230 26 412 26 550 664 112
Life Limited
Components 4 174 4 380 4 380 4 380 4 380 20 234 20 028 20 234 20 234 20 234 21 488 20 234 20 028 20 234 20 234 20 234 20 234 20 234 20 028 20 234 325 840
Unscheduled
Maintenance 32 369 32 369 32 369 32 369 32 369 32 369 32 369 32 369 32 369 32 369 32 369 32 369 32 369 32 369 32 369 32 369 32 369 32 369 32 369 32 369 647 383
ATC & Nav. Fees 171 259 171 259 171 259 171 259 171 259 171 259 171 259 171 259 171 259 171 259 171 259 171 259 171 259 171 259 171 259 171 259 171 259 171 259 171 259 171 259 3 425 174
Landing Fees 127 171 127 171 127 171 127 171 127 171 127 171 127 171 127 171 127 171 127 171 127 171 127 171 127 171 127 171 127 171 127 171 127 171 127 171 127 171 127 171 2 543 413
Tot Var. costs 1 143 933 1 251
369
1 162
674
1 592
712
1 301
188
1 363
277
1 650
175
1 366
599
1 409
048
1 375
869
1 702
911
1 381
430
1 349
604
1 735
356
1 396
262
1 397
862
1 409
239
1 753
289
1 296
520
1 511
015 28 550 330
Fixed Cost/YR 1 2 3 4 5 6 7 8 9 10 11 12 13 14 15 16 17 18 19 20 Total
Cockpit Crew Sal 83 884 83 884 83 884 83 884 83 884 83 884 83 884 83 884 83 884 83 884 83 884 83 884 83 884 83 884 83 884 83 884 83 884 83 884 83 884 83 884 1 677 686
Airworthiness
specialists Sal. 6 336 6 336 6 336 6 336 6 336 6 336 6 336 6 336 6 336 6 336 6 336 6 336 6 336 6 336 6 336 6 336 6 336 6 336 6 336 6 336 126 722
Maint. Techn Sal 66 804 66 804 66 804 66 804 66 804 66 804 66 804 66 804 66 804 66 804 66 804 66 804 66 804 66 804 66 804 66 804 66 804 66 804 66 804 66 804 1 336 088
Other Sal. 758 758 758 758 758 758 758 758 758 758 758 758 758 758 758 758 758 758 758 758 15 152
Benefits 15 778 15 778 15 778 15 778 15 778 15 778 15 778 15 778 15 778 15 778 15 778 15 778 15 778 15 778 15 778 15 778 15 778 15 778 15 778 15 778 315 565
Hangar 9 642 9 642 9 642 9 642 9 642 9 642 9 642 9 642 9 642 9 642 9 642 9 642 9 642 9 642 9 642 9 642 9 642 9 642 9 642 9 642 192 837
Hull Ins. 27 358 27 358 27 358 27 358 27 358 27 358 27 358 27 358 27 358 27 358 27 358 27 358 27 358 27 358 27 358 27 358 27 358 27 358 27 358 27 358 547 152
Liability Ins. 12 672 12 672 12 672 12 672 12 672 12 672 12 672 12 672 12 672 12 672 12 672 12 672 12 672 12 672 12 672 12 672 12 672 12 672 12 672 12 672 253 444
Training
Pilot/Maint. 12 149 12 149 12 149 12 149 12 149 12 149 12 149 12 149 12 149 12 149 12 149 12 149 12 149 12 149 12 149 12 149 12 149 12 149 12 149 12 149 242 975
Registration Fee 689 689 689 689 689 689 689 689 689 689 689 689 689 689 689 689 689 689 689 689 13 774
Brokerage Fee 49 741 49 741
Modernization 13 774 13 774 13 774 13 774 13 774 13 774 13 774 13 774 13 774 13 774 13 774 13 774 13 774 13 774 13 774 13 774 13 774 13 774 13 774 13 774 275 482
Refurbishing 895 895 895 895 895 895 895 895 895 895 895 895 895 895 895 895 895 895 895 895 17 906
Tot Fixed Costs 250 739 250 739 250 739 250 739 250 739 250 739 250 739 250 739 250 739 250 739 250 739 250 739 250 739 250 739 250 739 250 739 250 739 250 739 250 739 300 480 5 064 523
Total Acquisition
Cost/Resale 6 217 631
-1 952
215 4 265 416
Op. Overhead 209 201 225 316 212 012 276 518 232 789 242 102 285 137 242 601 248 968 243 991 293 048 244 825 240 051 297 914 247 050 247 290 248 997 300 604 232 089 271 724 5 042 228
Adm. Overhead 209 201 225 316 212 012 276 518 232 789 242 102 285 137 242 601 248 968 243 991 293 048 244 825 240 051 297 914 247 050 247 290 248 997 300 604 232 089 271 724 5 042 228
Total Costs 8 030 704 1 952
741
1 837
437
2 396
486
2 017
505
2 098
221
2 471
188
2 102
540
2 157
723
2 114
590
2 539
745
2 121
820
2 080
446
2 581
923
2 141
101
2 143
182
2 157
972
2 605
236
2 011
436 402 729 47 964 726
Variable €/FH 1 144 1 251 1 163 1 593 1 301 1 363 1 650 1 367 1 409 1 376 1 703 1 381 1 350 1 735 1 396 1 398 1 409 1 753 1 297 1 511
Var + Fixed
€/FH 1 395 1 502 1 413 1 843 1 552 1 614 1 901 1 617 1 660 1 627 1 954 1 632 1 600 1 986 1 647 1 649 1 660 2 004 1 547 1 811
Tot Ann Cost
€/FH 8 031 1 953 1 837 2 396 2 018 2 098 2 471 2 103 2 158 2 115 2 540 2 122 2 080 2 582 2 141 2 143 2 158 2 605 2 011 403
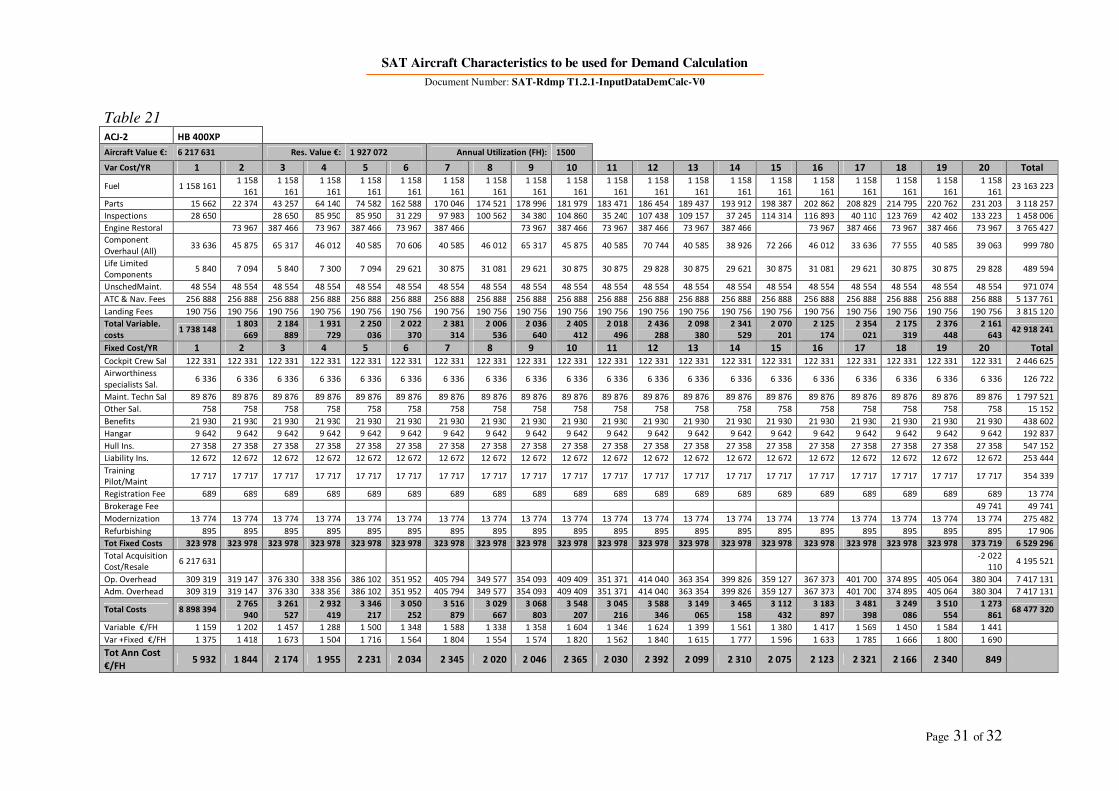
SAT Aircraft Characteristics to be used for Demand Calculation
Document Number: SAT-Rdmp T1.2.1-InputDataDemCalc-V0
Page 31 of 32
Table 21 ACJ-2 HB 400XP
Aircraft Value €: 6 217 631 Res. Value €: 1 927 072 Annual Utilization (FH): 1500
Var Cost/YR 1 2 3 4 5 6 7 8 9 10 11 12 13 14 15 16 17 18 19 20 Total
Fuel 1 158 161 1 158
161
1 158
161
1 158
161
1 158
161
1 158
161
1 158
161
1 158
161
1 158
161
1 158
161
1 158
161
1 158
161
1 158
161
1 158
161
1 158
161
1 158
161
1 158
161
1 158
161
1 158
161
1 158
161 23 163 223
Parts 15 662 22 374 43 257 64 140 74 582 162 588 170 046 174 521 178 996 181 979 183 471 186 454 189 437 193 912 198 387 202 862 208 829 214 795 220 762 231 203 3 118 257
Inspections 28 650 28 650 85 950 85 950 31 229 97 983 100 562 34 380 104 860 35 240 107 438 109 157 37 245 114 314 116 893 40 110 123 769 42 402 133 223 1 458 006
Engine Restoral 73 967 387 466 73 967 387 466 73 967 387 466 73 967 387 466 73 967 387 466 73 967 387 466 73 967 387 466 73 967 387 466 73 967 3 765 427
Component
Overhaul (All) 33 636 45 875 65 317 46 012 40 585 70 606 40 585 46 012 65 317 45 875 40 585 70 744 40 585 38 926 72 266 46 012 33 636 77 555 40 585 39 063 999 780
Life Limited
Components 5 840 7 094 5 840 7 300 7 094 29 621 30 875 31 081 29 621 30 875 30 875 29 828 30 875 29 621 30 875 31 081 29 621 30 875 30 875 29 828 489 594
UnschedMaint. 48 554 48 554 48 554 48 554 48 554 48 554 48 554 48 554 48 554 48 554 48 554 48 554 48 554 48 554 48 554 48 554 48 554 48 554 48 554 48 554 971 074
ATC & Nav. Fees 256 888 256 888 256 888 256 888 256 888 256 888 256 888 256 888 256 888 256 888 256 888 256 888 256 888 256 888 256 888 256 888 256 888 256 888 256 888 256 888 5 137 761
Landing Fees 190 756 190 756 190 756 190 756 190 756 190 756 190 756 190 756 190 756 190 756 190 756 190 756 190 756 190 756 190 756 190 756 190 756 190 756 190 756 190 756 3 815 120
Total Variable.
costs 1 738 148
1 803
669
2 184
889
1 931
729
2 250
036
2 022
370
2 381
314
2 006
536
2 036
640
2 405
412
2 018
496
2 436
288
2 098
380
2 341
529
2 070
201
2 125
174
2 354
021
2 175
319
2 376
448
2 161
643 42 918 241
Fixed Cost/YR 1 2 3 4 5 6 7 8 9 10 11 12 13 14 15 16 17 18 19 20 Total
Cockpit Crew Sal 122 331 122 331 122 331 122 331 122 331 122 331 122 331 122 331 122 331 122 331 122 331 122 331 122 331 122 331 122 331 122 331 122 331 122 331 122 331 122 331 2 446 625
Airworthiness
specialists Sal. 6 336 6 336 6 336 6 336 6 336 6 336 6 336 6 336 6 336 6 336 6 336 6 336 6 336 6 336 6 336 6 336 6 336 6 336 6 336 6 336 126 722
Maint. Techn Sal 89 876 89 876 89 876 89 876 89 876 89 876 89 876 89 876 89 876 89 876 89 876 89 876 89 876 89 876 89 876 89 876 89 876 89 876 89 876 89 876 1 797 521
Other Sal. 758 758 758 758 758 758 758 758 758 758 758 758 758 758 758 758 758 758 758 758 15 152
Benefits 21 930 21 930 21 930 21 930 21 930 21 930 21 930 21 930 21 930 21 930 21 930 21 930 21 930 21 930 21 930 21 930 21 930 21 930 21 930 21 930 438 602
Hangar 9 642 9 642 9 642 9 642 9 642 9 642 9 642 9 642 9 642 9 642 9 642 9 642 9 642 9 642 9 642 9 642 9 642 9 642 9 642 9 642 192 837
Hull Ins. 27 358 27 358 27 358 27 358 27 358 27 358 27 358 27 358 27 358 27 358 27 358 27 358 27 358 27 358 27 358 27 358 27 358 27 358 27 358 27 358 547 152
Liability Ins. 12 672 12 672 12 672 12 672 12 672 12 672 12 672 12 672 12 672 12 672 12 672 12 672 12 672 12 672 12 672 12 672 12 672 12 672 12 672 12 672 253 444
Training
Pilot/Maint 17 717 17 717 17 717 17 717 17 717 17 717 17 717 17 717 17 717 17 717 17 717 17 717 17 717 17 717 17 717 17 717 17 717 17 717 17 717 17 717 354 339
Registration Fee 689 689 689 689 689 689 689 689 689 689 689 689 689 689 689 689 689 689 689 689 13 774
Brokerage Fee 49 741 49 741
Modernization 13 774 13 774 13 774 13 774 13 774 13 774 13 774 13 774 13 774 13 774 13 774 13 774 13 774 13 774 13 774 13 774 13 774 13 774 13 774 13 774 275 482
Refurbishing 895 895 895 895 895 895 895 895 895 895 895 895 895 895 895 895 895 895 895 895 17 906
Tot Fixed Costs 323 978 323 978 323 978 323 978 323 978 323 978 323 978 323 978 323 978 323 978 323 978 323 978 323 978 323 978 323 978 323 978 323 978 323 978 323 978 373 719 6 529 296
Total Acquisition
Cost/Resale 6 217 631
-2 022
110 4 195 521
Op. Overhead 309 319 319 147 376 330 338 356 386 102 351 952 405 794 349 577 354 093 409 409 351 371 414 040 363 354 399 826 359 127 367 373 401 700 374 895 405 064 380 304 7 417 131
Adm. Overhead 309 319 319 147 376 330 338 356 386 102 351 952 405 794 349 577 354 093 409 409 351 371 414 040 363 354 399 826 359 127 367 373 401 700 374 895 405 064 380 304 7 417 131
Total Costs 8 898 394 2 765
940
3 261
527
2 932
419
3 346
217
3 050
252
3 516
879
3 029
667
3 068
803
3 548
207
3 045
216
3 588
346
3 149
065
3 465
158
3 112
432
3 183
897
3 481
398
3 249
086
3 510
554
1 273
861 68 477 320
Variable €/FH 1 159 1 202 1 457 1 288 1 500 1 348 1 588 1 338 1 358 1 604 1 346 1 624 1 399 1 561 1 380 1 417 1 569 1 450 1 584 1 441
Var +Fixed €/FH 1 375 1 418 1 673 1 504 1 716 1 564 1 804 1 554 1 574 1 820 1 562 1 840 1 615 1 777 1 596 1 633 1 785 1 666 1 800 1 690
Tot Ann Cost
€/FH 5 932 1 844 2 174 1 955 2 231 2 034 2 345 2 020 2 046 2 365 2 030 2 392 2 099 2 310 2 075 2 123 2 321 2 166 2 340 849
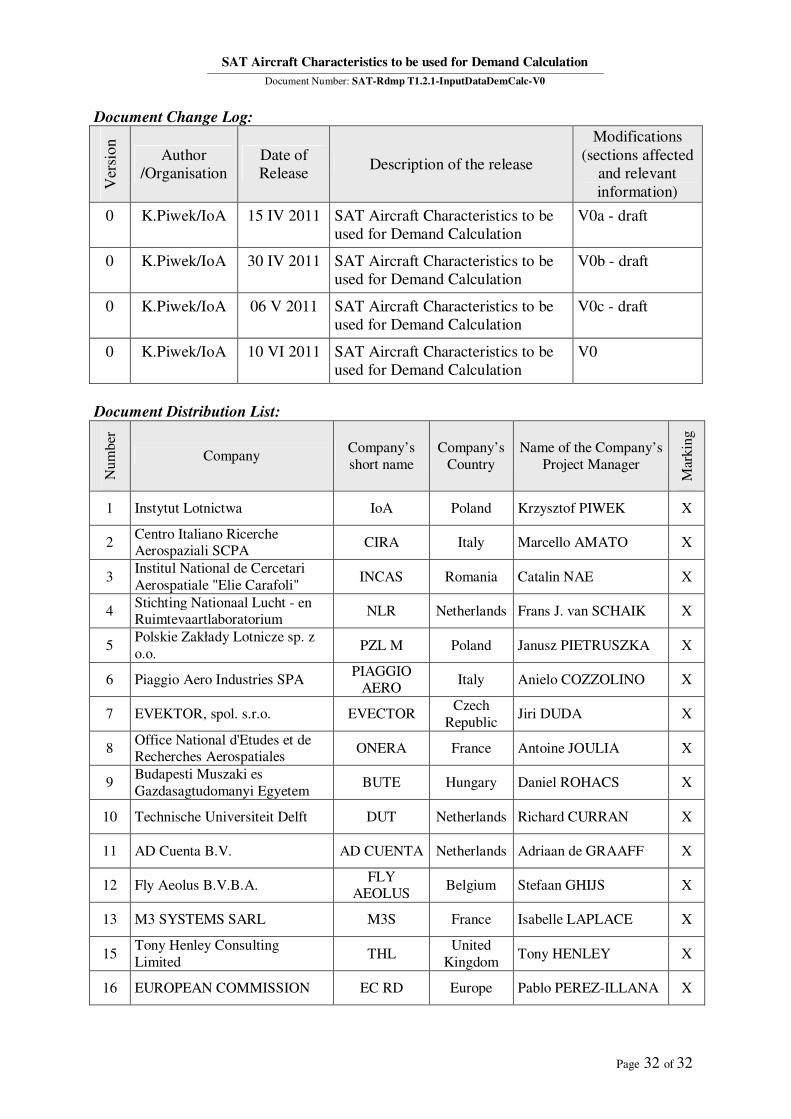
SAT Aircraft Characteristics to be used for Demand Calculation
Document Number: SAT-Rdmp T1.2.1-InputDataDemCalc-V0
Page 32 of 32
Document Change Log: V
ersi
on
Author
/Organisation
Date of
Release Description of the release
Modifications
(sections affected
and relevant
information)
0 K.Piwek/IoA 15 IV 2011 SAT Aircraft Characteristics to be
used for Demand Calculation
V0a - draft
0 K.Piwek/IoA 30 IV 2011 SAT Aircraft Characteristics to be
used for Demand Calculation
V0b - draft
0 K.Piwek/IoA 06 V 2011 SAT Aircraft Characteristics to be
used for Demand Calculation
V0c - draft
0 K.Piwek/IoA 10 VI 2011 SAT Aircraft Characteristics to be
used for Demand Calculation
V0
Document Distribution List:
Nu
mber
Company Company’s
short name
Company’s
Country
Name of the Company’s
Project Manager
Mar
kin
g
1 Instytut Lotnictwa IoA Poland Krzysztof PIWEK X
2 Centro Italiano Ricerche Aerospaziali SCPA
CIRA Italy Marcello AMATO X
3 Institul National de Cercetari
Aerospatiale "Elie Carafoli" INCAS Romania Catalin NAE X
4 Stichting Nationaal Lucht - en Ruimtevaartlaboratorium
NLR Netherlands Frans J. van SCHAIK X
5 Polskie Zakłady Lotnicze sp. z
o.o. PZL M Poland Janusz PIETRUSZKA X
6 Piaggio Aero Industries SPA PIAGGIO
AERO Italy Anielo COZZOLINO X
7 EVEKTOR, spol. s.r.o. EVECTOR Czech
Republic Jiri DUDA X
8 Office National d'Etudes et de Recherches Aerospatiales
ONERA France Antoine JOULIA X
9 Budapesti Muszaki es
Gazdasagtudomanyi Egyetem BUTE Hungary Daniel ROHACS X
10 Technische Universiteit Delft DUT Netherlands Richard CURRAN X
11 AD Cuenta B.V. AD CUENTA Netherlands Adriaan de GRAAFF X
12 Fly Aeolus B.V.B.A. FLY
AEOLUS Belgium Stefaan GHIJS X
13 M3 SYSTEMS SARL M3S France Isabelle LAPLACE X
15 Tony Henley Consulting
Limited THL
United
Kingdom Tony HENLEY X
16 EUROPEAN COMMISSION EC RD Europe Pablo PEREZ-ILLANA X