Embed Size (px)
Citation preview
SATELLITE IMAGERY AND LIDAR DATA FOR EFFICIENTLY DESCRIBING
STRUCTURES AND DENSITIES IN RESIDENTIAL URBAN LAND USES
CLASSIFICATION
B. I. Alhaddad a, *, J. Roca a, M. C. Burns a, J. Garcia b
a CPSV, Dept. of Architectonic Construction 1, Polytechnic University of Catalonia (UPC) 08028 Barcelona, Spain -
(bahaa.alhaddad, josep.roca, malcolm.burns)@upc.edu b GRAHI, Dept. of Civil Engineering, , Polytechnic University of Catalonia (UPC) 08034 Barcelona, Spain –
Commission VI, WG VI/4
KEY WORDS: SPOT, LIDAR, Pixel-based classification, Building density, FAR, BCR
ABSTRACT:
Urban areas are complicated due to the mix of man-made features and natural features. A higher level of structural information plays
an important role in land cover/use classification of urban areas. Additional spatial indicators have to be extracted based on structural
analysis in order to understand and identify spatial patterns or the spatial organization of features, especially for man-made feature.
It’s very difficult to extract such spatial patterns by using only pixel-based approaches. Sections of building occupation densities
which are integral parts of other uses may be difficult to identify. A lot of public resources have been directed towards seeking to
develop a standardized classification system and to provide as much compatibility as possible to ensure the widespread use of such
categorized data obtained from remote sensor sources. The definition of “building densities”, for example, includes those uses
similarly classified.
This paper examines the utility of high-resolution remote sensing image and airborne laser altimetry data for mapping residential
land uses within the spatial limits of Barcelona City Council (Spain). It was possible to discriminate different densities of residential
development, and to separate these from commercial/industrial and agricultural areas. Difficulties arose in the discrimination of low-
density residential areas due to the range of land cover types within this specific land use, and their associated spatial variability. The
greater classification errors associated with these low-density developed areas were not unexpected. It was found that these errors
could be mitigated somewhat with techniques that consider the mode of training data selection and by incorporation of methods that
account for the presence and amount of impervious surfaces.
This paper focuses on a methodology developed based on the pixel-based approach and three dimension analysis of artificial and
residential areas. The combination of high spatial resolution airborne LiDAR and SPOT imagery offers great application
opportunities, especially in the urban areas. Since residential urban areas are complicated, a comprehensive approach is needed and
different setting have to be investigated to cope with different type of urban areas and to different type of cities.
* Corresponding author.
1. INTRODUCTION
Density is a controversial term. Increased density is feared by
those who imagine ugly buildings, overshadowed open space,
parking problems, and irresponsible residents. It is promoted by
those who value urbane streetscapes, efficient infrastructure
supply, walkable neighbourhoods, and increased housing
options. However, High and dens buildings congested in small
place reduce people’s quality-of-life. The literature confirms the
influence of urban design on many aspects of people’s physical
and mental health, and social and culture vibrancy. Building
density is not only an important issue in urban planning and
land management, but also an indicator of a city’s evolution,
because the buildings constructed in different styles and vary
greatly in how the land is used (Ann Forsyth, 2003).
Areas of built form comprise areas of intensive use with much
of the land covered by structures. Included in this category are
cities, towns, and villages, strip developments along highways,
transportation, and areas such as those occupied by industrial
and commercial complexes, and institutions that may, in some
instances, be isolated from urban areas. Pixel-based image
analysis, drawing upon ENVI 4.2, was used to classify SPOT5
images together with data derived from an airborne laser
scanner. After the initial classification of different land cover
types, a subset only containing buildings was integrated. The
study area is defined by physical characteristics such as building
density and height, and includes land use.
The capability of remote sensing to support the assessment of
construction distribution will be focused on. The up-to-date and
area-wide classification of structure characteristics of the
physical urban environment from high resolution satellite data
provides the basis. How the provision of structural criteria can
allow for a distribution of two different types of input data is
presented. The methods have the capability to support urban
planning or management operations with land-use and built-
form information.
This study will examine in a simple way the relation between
building site coverage ratio (BCR) and floor area ratio (FAR) to
estimate building density of a city from two aspects, the
buildings stretching on the surface and growing along the third
dimension. A BCR is the ratio of the total occupation area to the
total area of the interest area, while a FAR is the ratio of the
35
height building area to the total area of the interest area. Manual
survey is the traditional method to calculate the aforementioned
ratios to obtain the heights and shapes of all buildings. The
Light Detection and Ranging (LiDAR) approach is a quick
method to collect topographic data, and is also applicable in
extraction of urban building forms. Another way is to obtain the
building’s information from the GIS and the aerial photos. But
they are not always affordable (Halla and Walter, 1999).
To specify the ideas and goals this methodology provides
answers to the following related points:
1. Can the morphology of a city be meaningfully
described by such an urban volume layer in a
reproducible manner?
2. Can this study of densities show the rising/decreasing
importance of polynuclearity in the city?
3. Can areas of high intensity land use be discovered?
Finally, the objectives of this study are to measure the variation
of building density by using BCR and FAR indices in some
areas of interest in Barcelona. The method use high resolution
satellite images and LiDAR data set for building extraction
heights and standing areas. This method is useful in analyzing
urban building density in similar regions.
2. DATA AND STUDY AREA
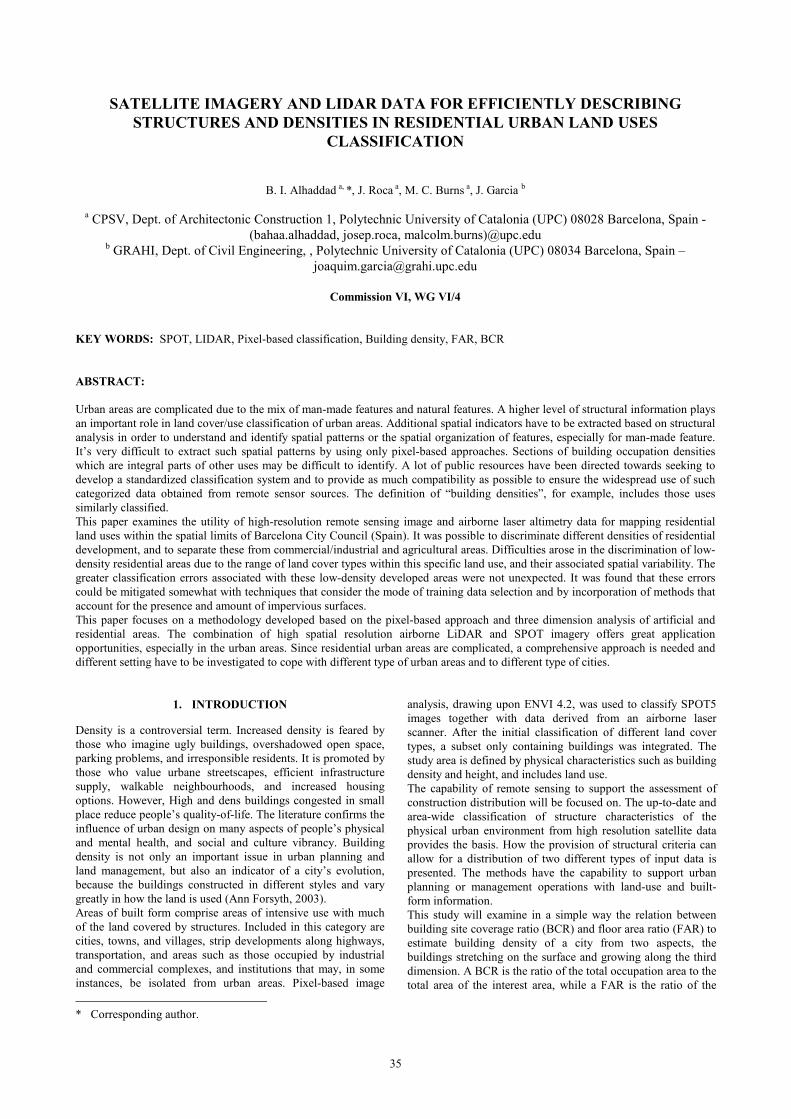
The chosen area is Barcelona, which is the regional capital of
Catalonia, lying in the north-east of Spain (see Figure 1). The
physical limits of Barcelona extend to almost 100 Km2. and the
city had a population of some 1,595,110 inhabitants in January
2007 leading to a population density of almost 16,000
inhabitants / Km2 (Campaign, 1991).
Figure 1: The Autonomous Community of Catalonia.
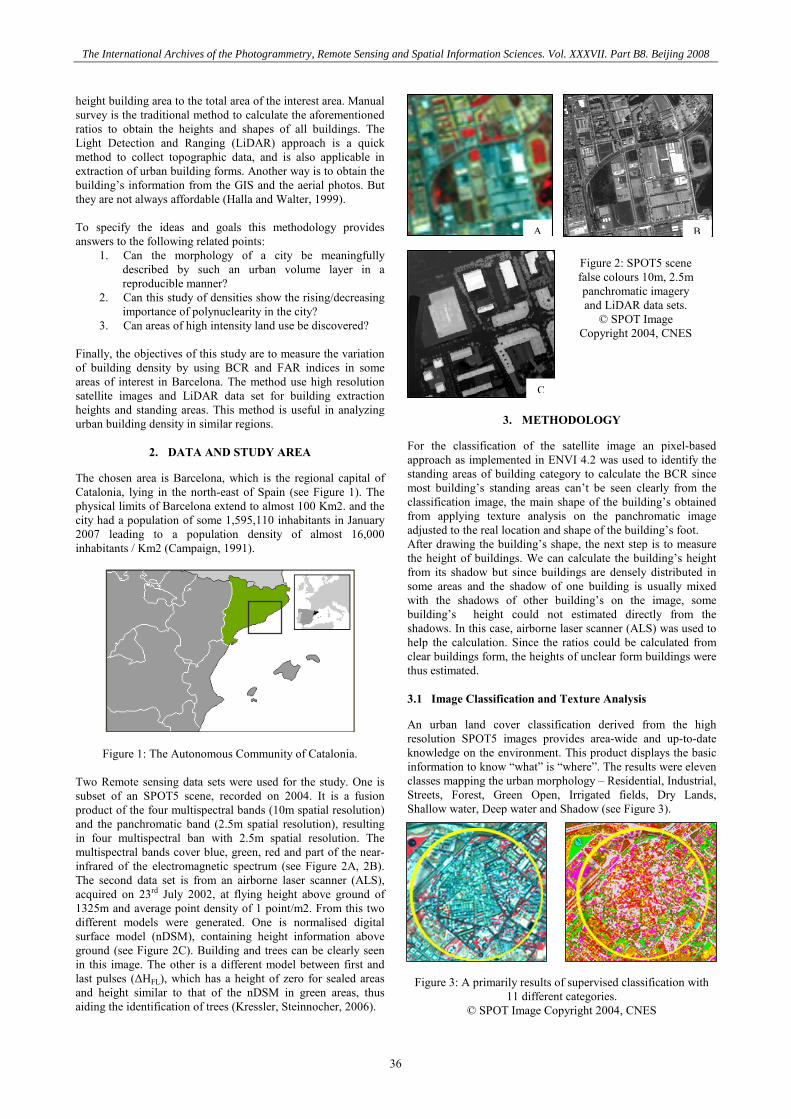
Two Remote sensing data sets were used for the study. One is
subset of an SPOT5 scene, recorded on 2004. It is a fusion
product of the four multispectral bands (10m spatial resolution)
and the panchromatic band (2.5m spatial resolution), resulting
in four multispectral ban with 2.5m spatial resolution. The
multispectral bands cover blue, green, red and part of the near-
infrared of the electromagnetic spectrum (see Figure 2A, 2B).
The second data set is from an airborne laser scanner (ALS),
acquired on 23rd July 2002, at flying height above ground of
1325m and average point density of 1 point/m2. From this two
different models were generated. One is normalised digital
surface model (nDSM), containing height information above
ground (see Figure 2C). Building and trees can be clearly seen
in this image. The other is a different model between first and
last pulses (∆HFL), which has a height of zero for sealed areas
and height similar to that of the nDSM in green areas, thus
aiding the identification of trees (Kressler, Steinnocher, 2006).
3. METHODOLOGY
For the classification of the satellite image an pixel-based
approach as implemented in ENVI 4.2 was used to identify the
standing areas of building category to calculate the BCR since
most building’s standing areas can’t be seen clearly from the
classification image, the main shape of the building’s obtained
from applying texture analysis on the panchromatic image
adjusted to the real location and shape of the building’s foot.
After drawing the building’s shape, the next step is to measure
the height of buildings. We can calculate the building’s height
from its shadow but since buildings are densely distributed in
some areas and the shadow of one building is usually mixed
with the shadows of other building’s on the image, some
building’s height could not estimated directly from the
shadows. In this case, airborne laser scanner (ALS) was used to
help the calculation. Since the ratios could be calculated from
clear buildings form, the heights of unclear form buildings were
thus estimated.
3.1 Image Classification and Texture Analysis
An urban land cover classification derived from the high
resolution SPOT5 images provides area-wide and up-to-date
knowledge on the environment. This product displays the basic
information to know “what” is “where”. The results were eleven
classes mapping the urban morphology – Residential, Industrial,
Streets, Forest, Green Open, Irrigated fields, Dry Lands,
Shallow water, Deep water and Shadow (see Figure 3).
Figure 3: A primarily results of supervised classification with
11 different categories.
© SPOT Image Copyright 2004, CNES
A B
C
Figure 2: SPOT5 scene
false colours 10m, 2.5m
panchromatic imagery
and LiDAR data sets.
© SPOT Image
Copyright 2004, CNES
The International Archives of the Photogrammetry, Remote Sensing and Spatial Information Sciences. Vol. XXXVII. Part B8. Beijing 2008
36

The Pixel-based classification methodology has been presented
elsewhere (Alhaddad, Roca, Burns, 2005), showing an accuracy
of 85.94% correctly detected buildings. It specifically shows a
user accuracy of 86.2% and an 83.8% producer accuracy
adapted from 130 randomly distributed sample points. Based
upon this result methodologies have been developed to analyse
urban structure for regionalization based on homogeneous
urban structure features. From the classification result only the
identified building objects were used for the integration with
airborne laser scanner data. In Figures 4 and 5 texture analysis
approach was performed only on the basis of the panchromatic
image in uncovered areas by LiDAR data (Alhaddad, Roca,
Burns, 2007) and normalised digital surface model (nDSM)
data to extract buildings boundary (Zeng, Zhang, Wang, and
Lin, Z., 2002).
Figure 4: applying texture analysis on the panchromatic image
will give clear element boundaries.
© SPOT Image Copyright 2004, CNES
Here LiDAR provides the opportunity to identify land use types
such as roads and buildings with high degree of accuracy. The
nDSM information greatly improves the differentiation between
roads and buildings; the quality being was mainly dependent on
the resolution of the data but not on any ambiguity within the
data (Priestnalla, Jaafara and Duncanb, 2000).
Figure 5: some areas already cover by LiDAR data and by
applying texture analysis clear buildings boundaries will show.
© SPOT Image Copyright 2004, CNES
Airborne laser altimetry data and high resolution Panchromatic
image offer possibilities for feature extraction and correct
classification errors in urban areas (see Figure 6), high
classification accuracy will be important for building site
coverage ratio (BCR) calculations. Since in particular the
texture analysis to detect the building boundaries may contain
noisy pixels caused by adjacent vegetation or structures in
gardens as shown in Figure 4, it is up to the user or application
objectives to decide from which level to extract the outline of
the base at ground level (Alhaddad, Roca, Burns, 2007).
Figure 6: Red class illustrates buildings area. Extracted
boundary from ALS and panchromatic image offer possibilities
for classification correction results.
A correlation of LiDAR with corresponding building height is
used to assess building height classes. Nine different height
classes (1-3, 3-6… 15 and more floors) were derived. Figure 7
shows an urban land cover classification differentiating the
class “buildings” by height. ArcGIS software was used in the
3D simulation.
Figure 7: 3D simulation illustrates the building heights from
LiDAR data integrated with 10m grid cells.
3.2 Integration and Calculation
For the data integration, only the identified buildings were use.
The first involved the integration with specific grid cell data
(10m). This allowed for the separation of buildings based on the
building site coverage ratio (BCR) in the cell area. The
buildings were assigned to one of four classes of cell occupation
- complete, high, medium and low BCR ratio. For each building
a mean height is available, allowing the calculation of volume.
In the research, small area inside Barcelona was selected to
measure the BCR, the FAR and the integration between both
ratios. After obtaining the building’s height, the BCR and the
FAR within an area of interest was calculated from the
following equations:
Where H is the height of a building, F is the area of the cell
occupied by the building at ground level, C is a constant which
represents the average height of one storey of all the buildings
(C = 2.9m), A is the total area of the cell grid (100m2), FAR and
BCR is the floor area ratio and building coverage ratio of a site.
A site here refers to a cell area, usually including one cell. There
are a number of other potential measures of density, and even
FAR = ∑ (H / C * F) / A (2)
BCR = ∑ F / A (1)
The International Archives of the Photogrammetry, Remote Sensing and Spatial Information Sciences. Vol. XXXVII. Part B8. Beijing 2008
37
more of perceived density (Pan, Zhao, Chen, Liang and Sun,
2008).
4. RESULTS
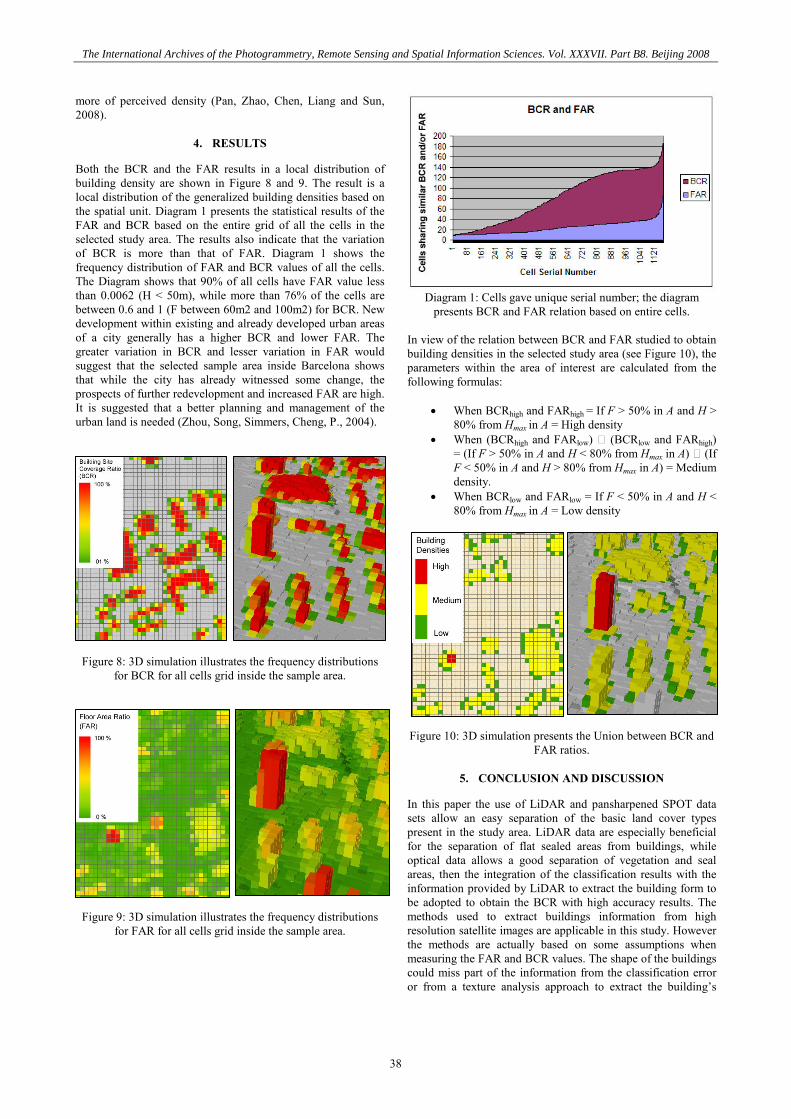
Both the BCR and the FAR results in a local distribution of
building density are shown in Figure 8 and 9. The result is a
local distribution of the generalized building densities based on
the spatial unit. Diagram 1 presents the statistical results of the
FAR and BCR based on the entire grid of all the cells in the
selected study area. The results also indicate that the variation
of BCR is more than that of FAR. Diagram 1 shows the
frequency distribution of FAR and BCR values of all the cells.
The Diagram shows that 90% of all cells have FAR value less
than 0.0062 (H < 50m), while more than 76% of the cells are
between 0.6 and 1 (F between 60m2 and 100m2) for BCR. New
development within existing and already developed urban areas
of a city generally has a higher BCR and lower FAR. The
greater variation in BCR and lesser variation in FAR would
suggest that the selected sample area inside Barcelona shows
that while the city has already witnessed some change, the
prospects of further redevelopment and increased FAR are high.
It is suggested that a better planning and management of the
urban land is needed (Zhou, Song, Simmers, Cheng, P., 2004).
Figure 8: 3D simulation illustrates the frequency distributions
for BCR for all cells grid inside the sample area.
Figure 9: 3D simulation illustrates the frequency distributions
for FAR for all cells grid inside the sample area.
Diagram 1: Cells gave unique serial number; the diagram
presents BCR and FAR relation based on entire cells.
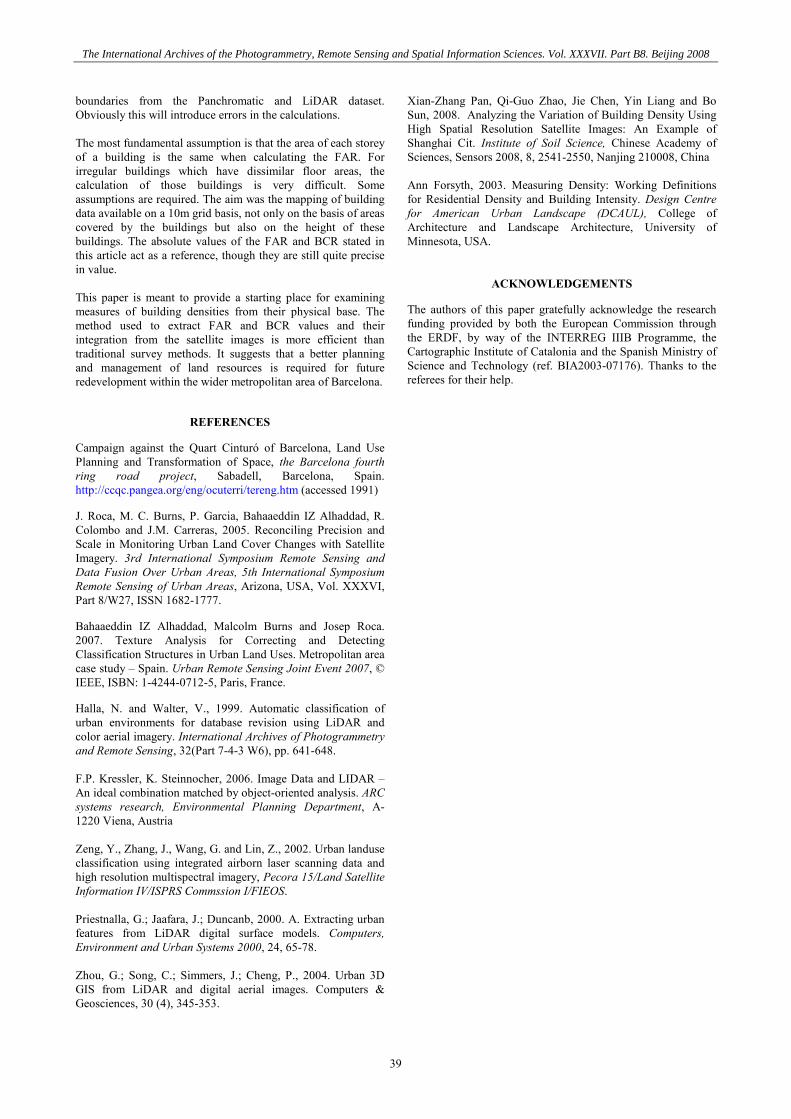
In view of the relation between BCR and FAR studied to obtain
building densities in the selected study area (see Figure 10), the
parameters within the area of interest are calculated from the
following formulas:
• When BCRhigh and FARhigh = If F > 50% in A and H >
80% from Hmax in A = High density
• When (BCRhigh and FARlow) ∪ (BCRlow and FARhigh)
= (If F > 50% in A and H < 80% from Hmax in A) ∪ (If
F < 50% in A and H > 80% from Hmax in A) = Medium
density.
• When BCRlow and FARlow = If F < 50% in A and H <
80% from Hmax in A = Low density
Figure 10: 3D simulation presents the Union between BCR and
FAR ratios.
5. CONCLUSION AND DISCUSSION
In this paper the use of LiDAR and pansharpened SPOT data
sets allow an easy separation of the basic land cover types
present in the study area. LiDAR data are especially beneficial
for the separation of flat sealed areas from buildings, while
optical data allows a good separation of vegetation and seal
areas, then the integration of the classification results with the
information provided by LiDAR to extract the building form to
be adopted to obtain the BCR with high accuracy results. The
methods used to extract buildings information from high
resolution satellite images are applicable in this study. However
the methods are actually based on some assumptions when
measuring the FAR and BCR values. The shape of the buildings
could miss part of the information from the classification error
or from a texture analysis approach to extract the building’s
The International Archives of the Photogrammetry, Remote Sensing and Spatial Information Sciences. Vol. XXXVII. Part B8. Beijing 2008
38
boundaries from the Panchromatic and LiDAR dataset.
Obviously this will introduce errors in the calculations.
The most fundamental assumption is that the area of each storey
of a building is the same when calculating the FAR. For
irregular buildings which have dissimilar floor areas, the
calculation of those buildings is very difficult. Some
assumptions are required. The aim was the mapping of building
data available on a 10m grid basis, not only on the basis of areas
covered by the buildings but also on the height of these
buildings. The absolute values of the FAR and BCR stated in
this article act as a reference, though they are still quite precise
in value.
This paper is meant to provide a starting place for examining
measures of building densities from their physical base. The
method used to extract FAR and BCR values and their
integration from the satellite images is more efficient than
traditional survey methods. It suggests that a better planning
and management of land resources is required for future
redevelopment within the wider metropolitan area of Barcelona.
REFERENCES
Campaign against the Quart Cinturó of Barcelona, Land Use
Planning and Transformation of Space, the Barcelona fourth
ring road project, Sabadell, Barcelona, Spain.
http://ccqc.pangea.org/eng/ocuterri/tereng.htm (accessed 1991)
J. Roca, M. C. Burns, P. Garcia, Bahaaeddin IZ Alhaddad, R.
Colombo and J.M. Carreras, 2005. Reconciling Precision and
Scale in Monitoring Urban Land Cover Changes with Satellite
Imagery. 3rd International Symposium Remote Sensing and
Data Fusion Over Urban Areas, 5th International Symposium
Remote Sensing of Urban Areas, Arizona, USA, Vol. XXXVI,
Part 8/W27, ISSN 1682-1777.
Bahaaeddin IZ Alhaddad, Malcolm Burns and Josep Roca.
2007. Texture Analysis for Correcting and Detecting
Classification Structures in Urban Land Uses. Metropolitan area
case study – Spain. Urban Remote Sensing Joint Event 2007, ©
IEEE, ISBN: 1-4244-0712-5, Paris, France.
Halla, N. and Walter, V., 1999. Automatic classification of
urban environments for database revision using LiDAR and
color aerial imagery. International Archives of Photogrammetry
and Remote Sensing, 32(Part 7-4-3 W6), pp. 641-648.
F.P. Kressler, K. Steinnocher, 2006. Image Data and LIDAR –
An ideal combination matched by object-oriented analysis. ARC
systems research, Environmental Planning Department, A-
1220 Viena, Austria
Zeng, Y., Zhang, J., Wang, G. and Lin, Z., 2002. Urban landuse
classification using integrated airborn laser scanning data and
high resolution multispectral imagery, Pecora 15/Land Satellite
Information IV/ISPRS Commssion I/FIEOS.
Priestnalla, G.; Jaafara, J.; Duncanb, 2000. A. Extracting urban
features from LiDAR digital surface models. Computers,
Environment and Urban Systems 2000, 24, 65-78.
Zhou, G.; Song, C.; Simmers, J.; Cheng, P., 2004. Urban 3D
GIS from LiDAR and digital aerial images. Computers &
Geosciences, 30 (4), 345-353.
Xian-Zhang Pan, Qi-Guo Zhao, Jie Chen, Yin Liang and Bo
Sun, 2008. Analyzing the Variation of Building Density Using
High Spatial Resolution Satellite Images: An Example of
Shanghai Cit. Institute of Soil Science, Chinese Academy of
Sciences, Sensors 2008, 8, 2541-2550, Nanjing 210008, China
Ann Forsyth, 2003. Measuring Density: Working Definitions
for Residential Density and Building Intensity. Design Centre
for American Urban Landscape (DCAUL), College of
Architecture and Landscape Architecture, University of
Minnesota, USA.
ACKNOWLEDGEMENTS
The authors of this paper gratefully acknowledge the research
funding provided by both the European Commission through
the ERDF, by way of the INTERREG IIIB Programme, the
Cartographic Institute of Catalonia and the Spanish Ministry of
Science and Technology (ref. BIA2003-07176). Thanks to the
referees for their help.
The International Archives of the Photogrammetry, Remote Sensing and Spatial Information Sciences. Vol. XXXVII. Part B8. Beijing 2008
39

The International Archives of the Photogrammetry, Remote Sensing and Spatial Information Sciences. Vol. XXXVII. Part B8. Beijing 2008
40