Embed Size (px)
DESCRIPTION
aiueaiuea ieauieaui uieauieaueia uieaauiea eaiua aiueaaiuaeu iaueaa uiea eiaiu eieiuaua ieua
Citation preview
Taylor & Francis, Ltd. is collaborating with JSTOR to digitize, preserve and extend access to The Journal of Personal Selling and Sales Management.
http://www.jstor.org
Evaluation of Selling Performance: A Study of Current Practices Author(s): Donald W. Jackson Jr., Janet E. Keith and John L. Schlacter Source: The Journal of Personal Selling and Sales Management, Vol. 3, No. 2 (Nov., 1983), pp. 42-
51Published by: Taylor & Francis, Ltd.Stable URL: http://www.jstor.org/stable/40471171Accessed: 03-09-2015 07:24 UTC
Your use of the JSTOR archive indicates your acceptance of the Terms & Conditions of Use, available at http://www.jstor.org/page/ info/about/policies/terms.jsp
JSTOR is a not-for-profit service that helps scholars, researchers, and students discover, use, and build upon a wide range of content in a trusted digital archive. We use information technology and tools to increase productivity and facilitate new forms of scholarship. For more information about JSTOR, please contact [email protected].
This content downloaded from 88.255.149.195 on Thu, 03 Sep 2015 07:24:11 UTCAll use subject to JSTOR Terms and Conditions
42 Journal of Personal Selling & Sales Management
Donald W. Jackson, Jr. is Professor of Marketing and Di- rector of Research in the College of Business Administra- tion at Arizona State University. He is a frequent contrib- utor to the business literature, having published articles in the Journal 0/ Advertising and the Journal 0/ the Acad- emy of Marketing Science among others. Dr. Jackson also serves on the Editorial Review Board of the Journal of Marketing. He is an active consultant and has trained salespeople and sales managers throughout North Amer- ica.
Janet E. Keith is a doctoral candidate in the Department of Marketing at Arizona State University. She is a 1983- 84 recipient of a Richard D. Irwin Doctoral Fellowship and an Academy of Marketing Science Scholarship. Her re- search interests center around channels of distribution and sales management.
John L. Schlacter (Ph.D., Ohio State University) is Profes- sor of Marketing at Arizona State University. He is in- volved in executive development programs at Arizona State University and with Sales and Marketing Executives International. In addition, he is a consultant in both the profit and not-for-profit sectors, where he is a frequent contributor to the management and marketing literature.
This content downloaded from 88.255.149.195 on Thu, 03 Sep 2015 07:24:11 UTCAll use subject to JSTOR Terms and Conditions
November 1983 43
Evaluation of Selling Performance: A Study of Current Practices by Donald W. Jackson, Jr., Janet E. Keith, and John L. Schlacter
Evaluation and control of the sales organization is essential in order to ensure that performance of salespeople contributes to overall corporate effi- ciency and profitability. Performance evaluation is the process by which a sales manager monitors and appraises the performance of the salesforce. Judg- mental decisions related to promotion, compensa- tion, transfer, and retention of the salesforce are based upon data obtained in performance appraisal (Cocanaugher and Ivancevich 1978, Kearney 1976). The high performer should receive recognition through increased compensation, promotion, or awards. The unsatisfactory performer should not receive this recognition, should be counseled and, in the extreme case when necessary, should be dismissed (Jolson 1977).
Evaluation and control of the salesforce is also advantageous for the individual salesperson, since it provides the necessary feedback that helps him/her to adjust to management's expectations. In fact, Jol- son (1977) asserts that "the ideal purpose of the performance evaluation is to uncover the areas where corrective measures will serve to improve the salesforce member's future results."
The sales management literature on performance evaluation includes conceptual or empirical studies aimed at developing methodologies for effectively evaluating salespeople, studies which include eval- uation as part of a larger study of sales management practices, and studies on salesforce evaluation prac- tices. Since the literature included few studies of currently employed evaluation methods, the study reported here will examine the sales performance review process itself, analyze performance evalua- tion methods actually utilized, and offer suggestions for improvements in performance evaluation.
Background Literature
Several conceptual and empirical studies have sought to determine methodologies for effectively evaluating the salesforce. Behrman and Perrault (1982) reviewed issues relevant to measuring the performance of salespersons and presented a self- report performance scale developed for use in in- dustrial sales jobs. The self-report measure of per- formance was consistent with manager evaluations,
profitability data, internal company ratings, and a need for achievement rating.
Cocanaugher and Ivancevich (1978) presented a procedure for developing a "BARS" (behaviorally anchored rating scale) evaluation system for the field salesforce. The system was based on the prem- ise that management can determine which behav- iors are associated with desired sales performance, and that these behaviors can be measured or rated for individual salespeople.
Jackson and Aldag (1974) advocated management by objectives (MBO) as a method for managing the salesforce. MBO involves setting goals with the salesperson, planning strategies to reach these goals, and joint performance appraisal. The authors main- tained that MBO provides better and more clearly defined performance objectives and appraisal crite- ria, thereby reducing ambiguity in desired sales performance.
Cravens, Woodruff, and Stamper (1972) developed a model for predicting and evaluating sales territory performance. Territory performance was measured in terms of total unit sales. Determinants of sales volume included in the model were (1) market po- tential, (2) territory workload, (3) salesperson expe- rience, (4) salesperson motivation and effort, (5) com- pany experience, and (6) company effort.
Cotham and Cravens (1969) presented a method of analysis with which sales managers can compare a variety of dimensions of sales performance both within and between sales groups. The authors main- tained that if multiple measures of sales perform- ance are utilized or if performance is evaluated from data generated across a variety of diverse selling situations, then a method is needed to make these data more comparable. They suggested using the standard deviation, a measure of variability in per- formance, to standardize performance measures. This measure allows seemingly incomparable per- formance data to be adjusted and performance com- parisons to be made across diverse selling situations.
Some studies included evaluation of the salesforce as part of larger studies of sales management or marketing practices. For example, Dubinsky and Barry (1982) examined tools and practices employed by chief sales executives in industrial companies. The study explored seven key managerial areas,
This content downloaded from 88.255.149.195 on Thu, 03 Sep 2015 07:24:11 UTCAll use subject to JSTOR Terms and Conditions
44 Journal of Personal Selling & Sales Management
including supervision and evaluation. Results dis- closed the extensive use of expense reports, sales manager coaching and, to a lesser extent, new busi- ness reports and call/activity reports to supervise the salesforce. Large companies were more likely to use management by objectives as a supervisory tool. Performance evaluation focused primarily on sales volume, though large organizations were more likely to also utilize personal characteristics, profit, and preselling activities to evaluate sales personnel. Finally, most companies used an annual perform- ance appraisal.
Jackson, Ostrom, and Evans (1982) surveyed in- dustrial manufacturers to investigate the extent to which control segmental analysis was used, and to ascertain the measures used to evaluate control seg- ment performance. Control segments examined in- cluded products, customers, sales territories, geo- graphical areas, and order sizes. With respect to evaluation of salespeople, the most frequently cited performance criterion was sales volume. Few re- spondents reported using profitability measures such as contribution to profit or net profit in per- formance evaluation.
Jackson and Schlacter (1980) explored the use of management by objectives (MBO) among sales man- agers of manufacturing, wholesaling, retailing, and service organizations. The authors found that most respondents did formally evaluate salespersons. The most frequently used performance criteria were sales volume and qualitative factors such as attitude, product knowledge, and selling skills.
Only one study focused specifically on salesforce evaluation practices of sales managers. Darden and French (1970) examined factors that cause a sales manager to adopt a given set of salesforce evaluation criteria. They noted the absence of a universal set of evaluation criteria which are weighted similarly by sales managers. They concluded that salesforce appraisal criteria were a result of firm-industry con- ditions, executive characteristics, and product fea- tures.
The next section reviews the performance evalu- ation process itself, delineating the steps necessary in an effective evaluation procedure.
The Performance Evaluation Procedure
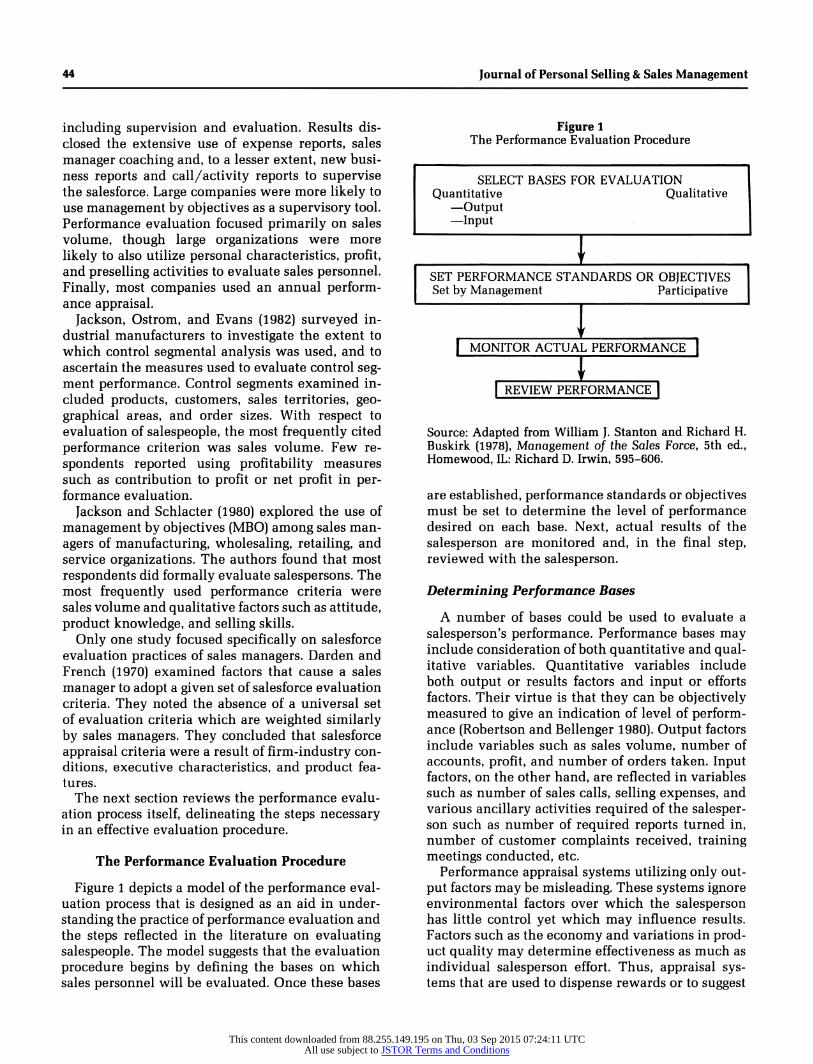
Figure 1 depicts a model of the performance eval- uation process that is designed as an aid in under- standing the practice of performance evaluation and the steps reflected in the literature on evaluating salespeople. The model suggests that the evaluation procedure begins by defining the bases on which sales personnel will be evaluated. Once these bases
Figure 1 The Performance Evaluation Procedure
SELECT BASES FOR EVALUATION Quantitative Qualitative
-Output - Input
' f
SET PERFORMANCE STANDARDS OR OBJECTIVES Set by Management Participative
) f
| MONITOR ACTUAL PERFORMANCE 1 T | REVIEW PERFORMANCE |
Source: Adapted from William J. Stanton and Richard H. Buskirk (1978), Management of the Sales Force, 5th ed., Homewood, IL: Richard D. Irwin, 595-606.
are established, performance standards or objectives must be set to determine the level of performance desired on each base. Next, actual results of the salesperson are monitored and, in the final step, reviewed with the salesperson.
Determining Performance Bases
A number of bases could be used to evaluate a salesperson's performance. Performance bases may include consideration of both quantitative and qual- itative variables. Quantitative variables include both output or results factors and input or efforts factors. Their virtue is that they can be objectively measured to give an indication of level of perform- ance (Robertson and Bellenger 1980). Output factors include variables such as sales volume, number of accounts, profit, and number of orders taken. Input factors, on the other hand, are reflected in variables such as number of sales calls, selling expenses, and various ancillary activities required of the salesper- son such as number of required reports turned in, number of customer complaints received, training meetings conducted, etc.
Performance appraisal systems utilizing only out- put factors may be misleading. These systems ignore environmental factors over which the salesperson has little control yet which may influence results. Factors such as the economy and variations in prod- uct quality may determine effectiveness as much as individual salesperson effort. Thus, appraisal sys- tems that are used to dispense rewards or to suggest
This content downloaded from 88.255.149.195 on Thu, 03 Sep 2015 07:24:11 UTCAll use subject to JSTOR Terms and Conditions
November 1983 45
improvements in individual behavior should also include input factors over which an individual has control and which an individual can change (Kear- ney 1976). Evaluation based on effort or inputs is further justified on the grounds that favorable out- puts may be a function of favorable effort Qolson 1977).
Performance bases should be derived from and closely related to the salesperson's job description. Where effort is closely related to results, output factors may be more appropriately utilized in per- formance evaluation. Where the relationship be- tween effort and results does not exist, input factors may be more appropriate. For instance, when selling large computer installations, it may take several years to close a sale. In this case, utilizing output factors alone to evaluate the salesperson may be misleading.
Another set of variables that can be utilized to evaluate performance are qualitative in nature. Qualitative bases are subjectively assessed by sales managers and include such characteristics as atti- tude, product knowledge, appearance, planning abil- ity, etc.
Although qualitative bases are used in perform- ance evaluation, they are not without their limita- tions. First, since these factors are subjectively as- sessed, there is nothing to preclude the sales man- ager from introducing preconceptions or biases into the evaluation. Second, qualitative factors allow for differences of opinion such as when the salesperson and sales manager disagree over the salesperson's attitude. Thus, since qualitative factors cannot easily be related to performance, these factors should be used as supplementary evidence in salesperson eval- uation.
Establishing Performance Standards
The second step in the performance evaluation procedure is to set performance standards or objec- tives. This determines the level of performance de- sired for each of the bases used to evaluate perform- ance.
Performance standards should be specific and measurable in order to determine whether stated objectives are actually being achieved (Jackson and Aldag 1974). This would seem to speak for quanti- tative bases for evaluating performance rather than qualitative bases which are harder to specify or measure. Nevertheless, Jolson (1977) asserts that a certain amount of informal, subjective appraisal is both inevitable and desirable.
Performance levels may be set by management or may be arrived at jointly between managers and
salespeople. Participation by the salesperson in set- ting performance levels tends to generate more com- mitment and to increase motivation, thus ensuring that work activities lead to stated objectives (Jack- son and Aldag 1974).
Monitoring Performance The third step in the evaluation procedure is to
monitor actual performance. This may be accom- plished through monitoring accounting records, in- voices, order forms, expense reports, or call reports; through informal feedback from other salespersons and from customers; and through direct observation of the salesperson by the sales manager or sales staff. Computers and other forms of data processing can make the accumulation of this information timely and available at a relatively low cost.
Reviewing Performance The final step in performance evaluation is to
review performance with the salesperson. The eval- uation interview provides an opportunity for feed- back and allows for clarification of different percep- tions about performance. Actual performance is compared to the benchmark standards or objectives established in step two, above. Thus, the perform- ance review is designed to correct deviations be- tween actual and desired results and to communi- cate desired behavior. It is also necessary if devel- opment of the salesperson is to take place.
The evaluation process requires considerable time and effort on the part of both the sales manager and the salesperson. Performance standards must be fair and equitable to ensure acceptance. Performance appraisal must be accurate and timely in order to be useful.
In order to examine the performance evaluation practices actually utilized by sales managers in U.S. manufacturing and distributing organizations, a study was undertaken. The study addressed a num- ber of questions, including:
1. What bases of performance are used in perform- ance evaluation?
2. What procedures are used to evaluate perform- ance?
3. How much participation by sales personnel is in- cluded in the evaluation process?
4. What sources of information are used to monitor performance?
5. How do firms review performance? The steps in the performance review process form
a logical structure for the study and provide the organization for the rest of the paper.
This content downloaded from 88.255.149.195 on Thu, 03 Sep 2015 07:24:11 UTCAll use subject to JSTOR Terms and Conditions
46 Journal of Personal Selling & Sales Management
Table I Profile of Respondents
Type of Business Percentage Manufacturer of industrial goods 44 Manufacturer of consumer goods 16 Wholesaler 9 Retailer 4 Services _27
Total 100
Annual Dollar Sales Volume (in 000) Percentage Over $100,000 46 $51,000-$100,000 12 $ll,000-$50,999 27 Under $11,000 Jj>
Total 100
Sales Management Position Percentage Vice president sales 3 National sales manager 4 Regional sales manager 34 Zone sales manager 6 Field sales manager 37 Other sales management titles 16
Total 100
The Study
The questionnaire asked respondents to indicate the performance bases they actually used to evalu- ate salespeople by placing a check next to the base identified on the questionnaire. Questions were also asked about setting performance standards, moni- toring actual performance, and reviewing perform- ance. Finally, demographic data were collected in order to describe the characteristics of the sample included in the study. The instrument was then pretested on a group of sales managers attending a meeting of Sales Marketing Executives International to ensure that questions would be clearly under- stood by respondents and that question alternatives were relatively exhaustive.
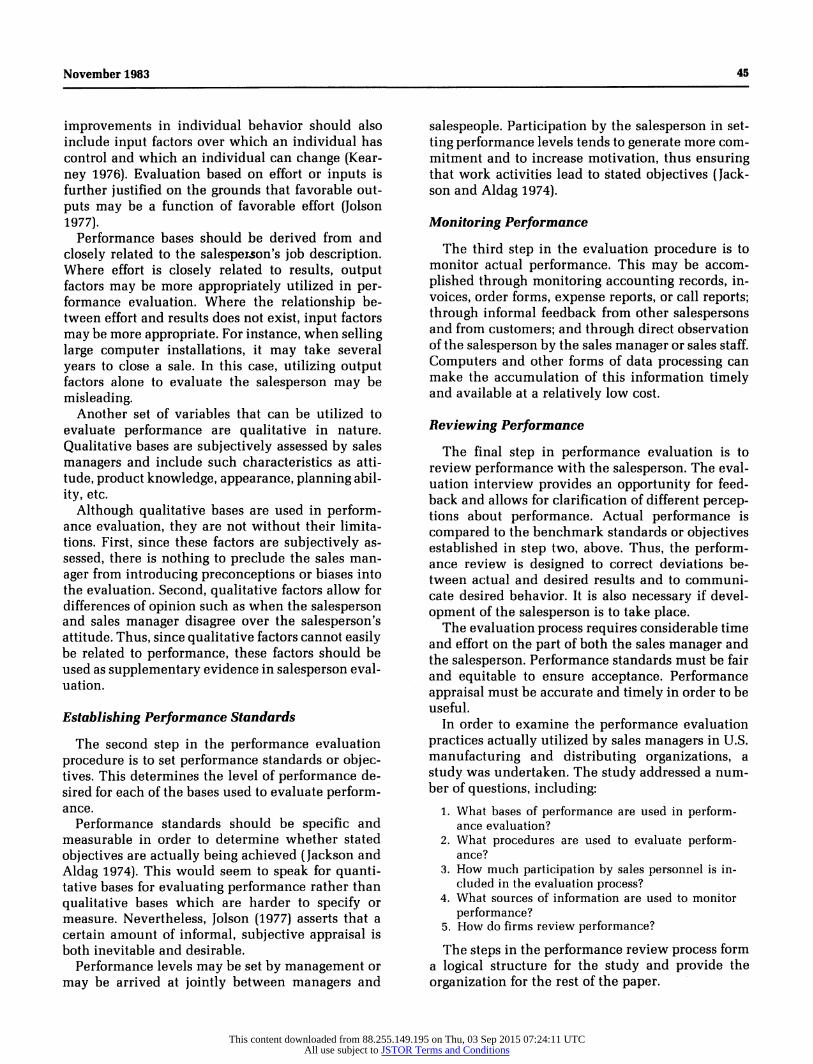
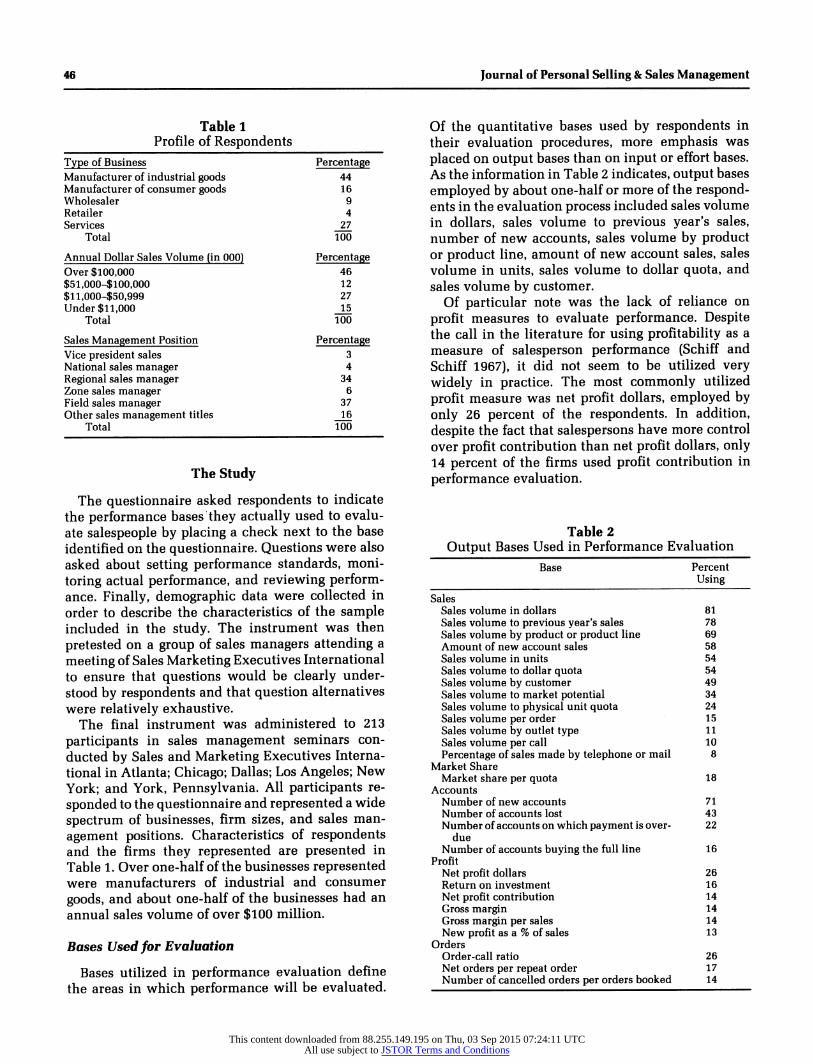
The final instrument was administered to 213 participants in sales management seminars con- ducted by Sales and Marketing Executives Interna- tional in Atlanta; Chicago; Dallas; Los Angeles; New York; and York, Pennsylvania. All participants re- sponded to the questionnaire and represented a wide spectrum of businesses, firm sizes, and sales man- agement positions. Characteristics of respondents and the firms they represented are presented in Table 1. Over one-half of the businesses represented were manufacturers of industrial and consumer goods, and about one-half of the businesses had an annual sales volume of over $100 million.
Bases Used for Evaluation
Bases utilized in performance evaluation define the areas in which performance will be evaluated.
Of the quantitative bases used by respondents in their evaluation procedures, more emphasis was placed on output bases than on input or effort bases. As the information in Table 2 indicates, output bases employed by about one-half or more of the respond- ents in the evaluation process included sales volume in dollars, sales volume to previous year's sales, number of new accounts, sales volume by product or product line, amount of new account sales, sales volume in units, sales volume to dollar quota, and sales volume by customer.
Of particular note was the lack of reliance on profit measures to evaluate performance. Despite the call in the literature for using profitability as a measure of salesperson performance (Schiff and Schiff 1967), it did not seem to be utilized very widely in practice. The most commonly utilized profit measure was net profit dollars, employed by only 26 percent of the respondents. In addition, despite the fact that salespersons have more control over profit contribution than net profit dollars, only 14 percent of the firms used profit contribution in performance evaluation.
Table 2 Output Bases Used in Performance Evaluation
Base Percent Using
Sales Sales volume in dollars 81 Sales volume to previous year's sales 78 Sales volume by product or product line 69 Amount of new account sales 58 Sales volume in units 54 Sales volume to dollar quota 54 Sales volume by customer 49 Sales volume to market potential 34 Sales volume to physical unit quota 24 Sales volume per order 15 Sales volume by outlet type 11 Sales volume per call 10 Percentage of sales made by telephone or mail 8
Market Share Market share per quota 18
Accounts Number of new accounts 71 Number of accounts lost 43 Number of accounts on which payment is over- 22
due Number of accounts buying the full line 16
Profit Net profit dollars 26 Return on investment 16 Net profit contribution 14 Gross margin 14 Gross margin per sales 14 New profit as a % of sales 13
Orders Order-call ratio 26 Net orders per repeat order 17 Number of cancelled orders per orders booked 14
This content downloaded from 88.255.149.195 on Thu, 03 Sep 2015 07:24:11 UTCAll use subject to JSTOR Terms and Conditions
November 1983 47
Table 3 Input Bases Used in Performance Evaluation
Base Percent Using
Calls Calls per period 57 Number of calls per number of customers (by 17
product class) Selling Expense
Selling expense to sales 41 Selling expense to quota 22 Average cost per call 13
Ancillary Activities Number of required reports turned in 44 Number of customer complaints 31 Training meetings conducted 28 Number of letters/phone calls to prospects 25 Number of demonstrations conducted 25 Number of service calls made 24 Number of dealer meetings held 15 Advertising displays set up 12
Table 4 Qualitative Bases Used in Performance Evaluation
Base Percent Using
Attitude 90 Product knowledge 89 Selling skills 85 Appearance and manner 82 Communication skills 81 Initiative and aggressiveness 80 Planning ability 78 Time management 73 Knowledge of competition 72 Judgment 69 Creativity 61 Knowledge of company policies 59 Report preparation and submission 59 Customer goodwill generated 50 Degree of respect from trade and competition 34 Good citizenship 23
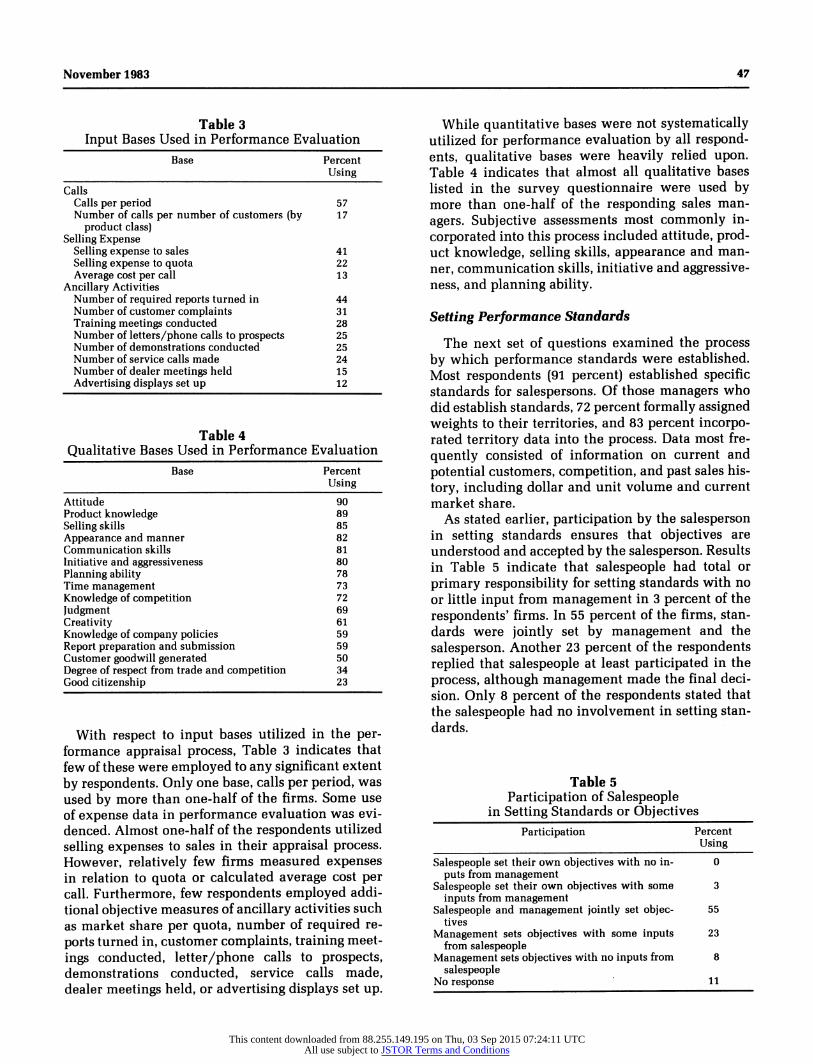
With respect to input bases utilized in the per- formance appraisal process, Table 3 indicates that few of these were employed to any significant extent by respondents. Only one base, calls per period, was used by more than one-half of the firms. Some use of expense data in performance evaluation was evi- denced. Almost one-half of the respondents utilized selling expenses to sales in their appraisal process. However, relatively few firms measured expenses in relation to quota or calculated average cost per call. Furthermore, few respondents employed addi- tional objective measures of ancillary activities such as market share per quota, number of required re- ports turned in, customer complaints, training meet- ings conducted, letter/phone calls to prospects, demonstrations conducted, service calls made, dealer meetings held, or advertising displays set up.
While quantitative bases were not systematically utilized for performance evaluation by all respond- ents, qualitative bases were heavily relied upon. Table 4 indicates that almost all qualitative bases listed in the survey questionnaire were used by more than one-half of the responding sales man- agers. Subjective assessments most commonly in- corporated into this process included attitude, prod- uct knowledge, selling skills, appearance and man- ner, communication skills, initiative and aggressive- ness, and planning ability.
Setting Performance Standards
The next set of questions examined the process by which performance standards were established. Most respondents (91 percent) established specific standards for salespersons. Of those managers who did establish standards, 72 percent formally assigned weights to their territories, and 83 percent incorpo- rated territory data into the process. Data most fre- quently consisted of information on current and potential customers, competition, and past sales his- tory, including dollar and unit volume and current market share.
As stated earlier, participation by the salesperson in setting standards ensures that objectives are understood and accepted by the salesperson. Results in Table 5 indicate that salespeople had total or primary responsibility for setting standards with no or little input from management in 3 percent of the respondents' firms. In 55 percent of the firms, stan- dards were jointly set by management and the salesperson. Another 23 percent of the respondents replied that salespeople at least participated in the process, although management made the final deci- sion. Only 8 percent of the respondents stated that the salespeople had no involvement in setting stan- dards.
Table 5 Participation of Salespeople
in Setting Standards or Objectives Participation Percent
Using
Salespeople set their own objectives with no in- 0 puts from management
Salespeople set their own objectives with some 3 inputs from management
Salespeople and management jointly set objec- 55 tives
Management sets objectives with some inputs 23 from salespeople
Management sets objectives with no inputs from 8 salespeople
No response 11
This content downloaded from 88.255.149.195 on Thu, 03 Sep 2015 07:24:11 UTCAll use subject to JSTOR Terms and Conditions
48 Journal of Personal Selling & Sales Management
Table 6 Sources of Information
Used in Salesperson Evaluation Source Percent
Using Printed form for performance evaluation 56 Analysis of computer printouts for each territory 50 Analysis of call reports 48 Other (supervisory calls, feedback from clients) 44
Table 7 Frequency of Performance Review
Frequency of Review Percentage of Respondents
Weekly 5 Monthly 8 Quarterly 28 Semiannually 26 Annually 33
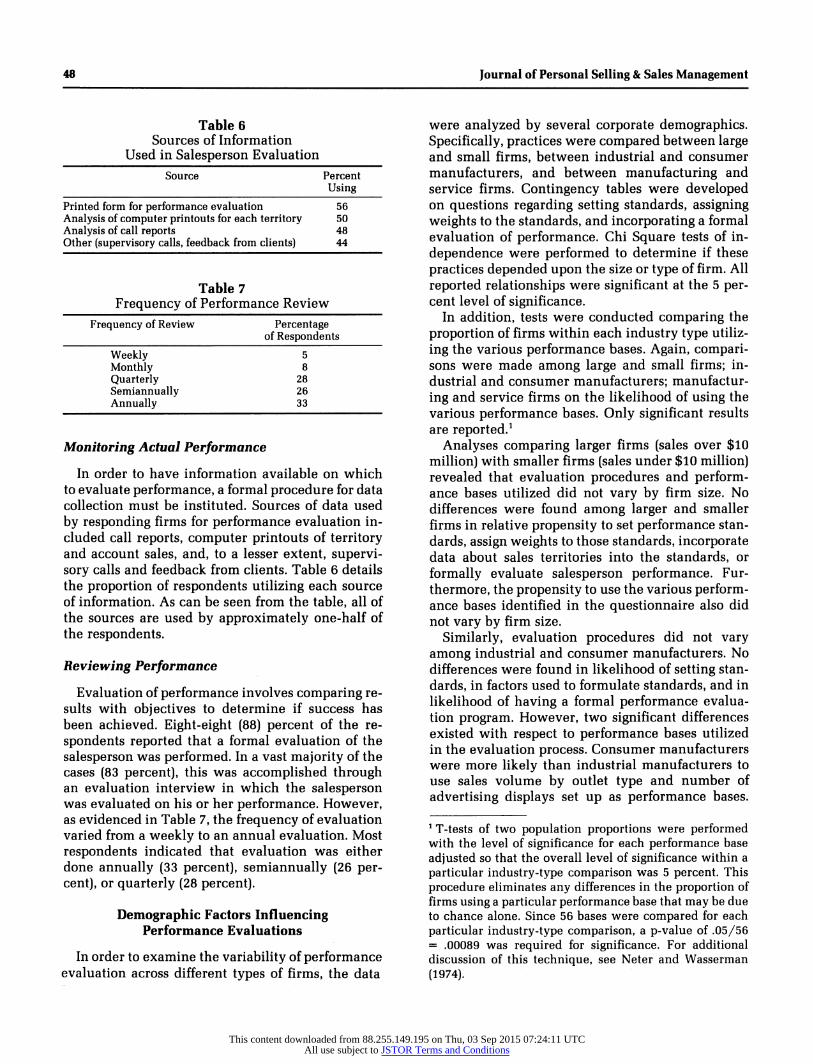
Monitoring Actual Performance
In order to have information available on which to evaluate performance, a formal procedure for data collection must be instituted. Sources of data used by responding firms for performance evaluation in- cluded call reports, computer printouts of territory and account sales, and, to a lesser extent, supervi- sory calls and feedback from clients. Table 6 details the proportion of respondents utilizing each source of information. As can be seen from the table, all of the sources are used by approximately one-half of the respondents.
Reviewing Performance
Evaluation of performance involves comparing re- sults with objectives to determine if success has been achieved. Eight-eight (88) percent of the re- spondents reported that a formal evaluation of the salesperson was performed. In a vast majority of the cases (83 percent), this was accomplished through an evaluation interview in which the salesperson was evaluated on his or her performance. However, as evidenced in Table 7, the frequency of evaluation varied from a weekly to an annual evaluation. Most respondents indicated that evaluation was either done annually (33 percent), semiannually (26 per- cent), or quarterly (28 percent).
Demographic Factors Influencing Performance Evaluations
In order to examine the variability of performance evaluation across different types of firms, the data
were analyzed by several corporate demographics. Specifically, practices were compared between large and small firms, between industrial and consumer manufacturers, and between manufacturing and service firms. Contingency tables were developed on questions regarding setting standards, assigning weights to the standards, and incorporating a formal evaluation of performance. Chi Square tests of in- dependence were performed to determine if these practices depended upon the size or type of firm. All reported relationships were significant at the 5 per- cent level of significance.
In addition, tests were conducted comparing the proportion of firms within each industry type utiliz- ing the various performance bases. Again, compari- sons were made among large and small firms; in- dustrial and consumer manufacturers; manufactur- ing and service firms on the likelihood of using the various performance bases. Only significant results are reported.1
Analyses comparing larger firms (sales over $10 million) with smaller firms (sales under $10 million) revealed that evaluation procedures and perform- ance bases utilized did not vary by firm size. No differences were found among larger and smaller firms in relative propensity to set performance stan- dards, assign weights to those standards, incorporate data about sales territories into the standards, or formally evaluate salesperson performance. Fur- thermore, the propensity to use the various perform- ance bases identified in the questionnaire also did not vary by firm size.
Similarly, evaluation procedures did not vary among industrial and consumer manufacturers. No differences were found in likelihood of setting stan- dards, in factors used to formulate standards, and in likelihood of having a formal performance evalua- tion program. However, two significant differences existed with respect to performance bases utilized in the evaluation process. Consumer manufacturers were more likely than industrial manufacturers to use sales volume by outlet type and number of advertising displays set up as performance bases.
1 T-tests of two population proportions were performed with the level of significance for each performance base adjusted so that the overall level of significance within a particular industry-type comparison was 5 percent. This procedure eliminates any differences in the proportion of firms using a particular performance base that may be due to chance alone. Since 56 bases were compared for each particular industry-type comparison, a p-value of .05/56 = .00089 was required for significance. For additional discussion of this technique, see Neter and Wasserman (1974).
This content downloaded from 88.255.149.195 on Thu, 03 Sep 2015 07:24:11 UTCAll use subject to JSTOR Terms and Conditions
November 1983 49
Since consumer manufacturers are more likely than industrial manufacturers to distribute indirectly through a variety of channels, these bases would be more appropriate for the consumer manufacturer.
Finally, the analyses revealed several differences among manufacturers and service firms in proce- dures and bases used in performance evaluation. Although there were no differences in their tend- ency to set standards for salespeople or to use a formal evaluation process, manufacturers were more likely than service firms to assign weights or priorities to salespeople's territories and to incorpo- rate data about the territory when setting standards.
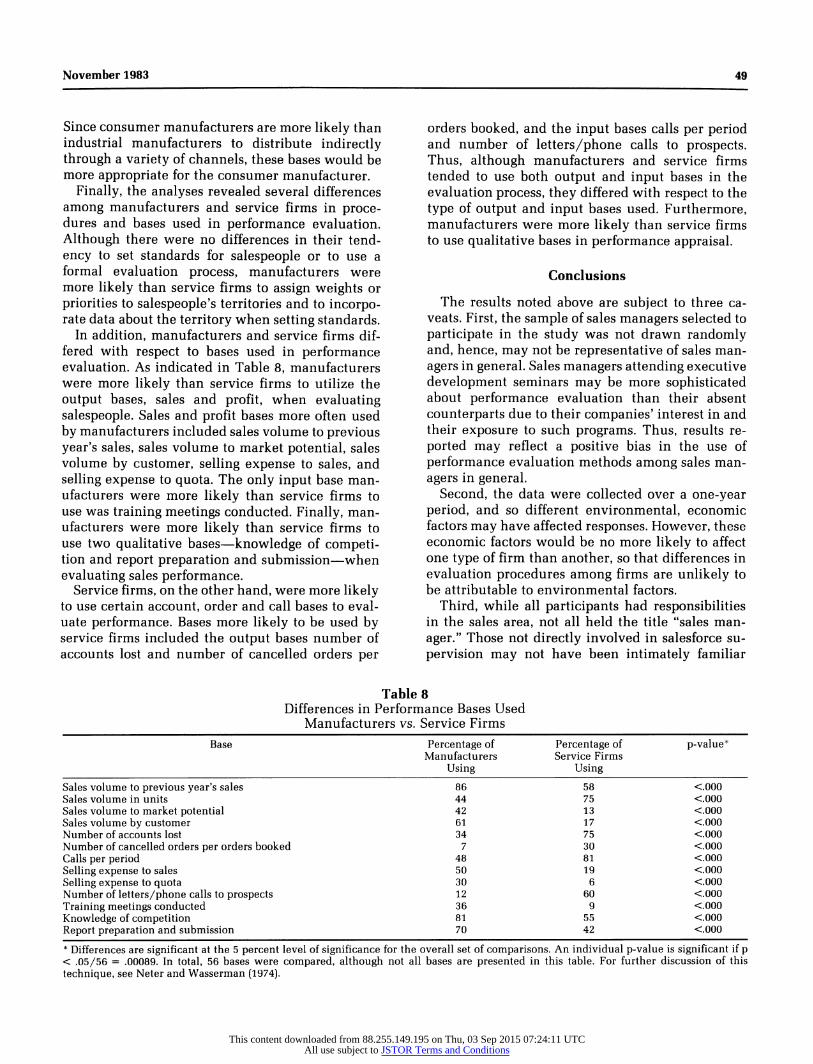
In addition, manufacturers and service firms dif- fered with respect to bases used in performance evaluation. As indicated in Table 8, manufacturers were more likely than service firms to utilize the output bases, sales and profit, when evaluating salespeople. Sales and profit bases more often used by manufacturers included sales volume to previous year's sales, sales volume to market potential, sales volume by customer, selling expense to sales, and selling expense to quota. The only input base man- ufacturers were more likely than service firms to use was training meetings conducted. Finally, man- ufacturers were more likely than service firms to use two qualitative bases - knowledge of competi- tion and report preparation and submission - when evaluating sales performance.
Service firms, on the other hand, were more likely to use certain account, order and call bases to eval- uate performance. Bases more likely to be used by service firms included the output bases number of accounts lost and number of cancelled orders per
orders booked, and the input bases calls per period and number of letters/phone calls to prospects. Thus, although manufacturers and service firms tended to use both output and input bases in the evaluation process, they differed with respect to the type of output and input bases used. Furthermore, manufacturers were more likely than service firms to use qualitative bases in performance appraisal.
Conclusions
The results noted above are subject to three ca- veats. First, the sample of sales managers selected to participate in the study was not drawn randomly and, hence, may not be representative of sales man- agers in general. Sales managers attending executive development seminars may be more sophisticated about performance evaluation than their absent counterparts due to their companies' interest in and their exposure to such programs. Thus, results re- ported may reflect a positive bias in the use of performance evaluation methods among sales man- agers in general.
Second, the data were collected over a one-year period, and so different environmental, economic factors may have affected responses. However, these economic factors would be no more likely to affect one type of firm than another, so that differences in evaluation procedures among firms are unlikely to be attributable to environmental factors.
Third, while all participants had responsibilities in the sales area, not all held the title "sales man- ager." Those not directly involved in salesforce su- pervision may not have been intimately familiar
Table 8 Differences in Performance Bases Used
Manufacturers vs. Service Firms Base Percentage of Percentage of p-value*
Manufacturers Service Firms Using Using
Sales volume to previous year's sales 86 58 <.000 Sales volume in units 44 75 <.000 Sales volume to market potential 42 13 <.000 Sales volume by customer 61 17 <.000 Number of accounts lost 34 75 <.000 Number of cancelled orders per orders booked 7 30 <.000 Calls per period 48 81 <.000 Selling expense to sales 50 19 <.000 Selling expense to quota 30 6 <.000 Number of letters/phone calls to prospects 12 60 <.000 Training meetings conducted 36 9 <.000 Knowledge of competition 81 55 <.000 Report preparation and submission 70 42 <.000 * Differences are significant at the 5 percent level of significance for the overall set of comparisons. An individual p-value is significant if p < .05/56 = .00089. In total, 56 bases were compared, although not all bases are presented in this table. For further discussion of this technique, see Neter and Wasserman (1974).
This content downloaded from 88.255.149.195 on Thu, 03 Sep 2015 07:24:11 UTCAll use subject to JSTOR Terms and Conditions
50 Journal of Personal Selling & Sales Management
with the specifics of the performance review pro- cess. This event seems unlikely, however, since all respondents held ultimate responsibility for evalu- ating performance.
Despite these limitations, several conclusions can be drawn from the study. First, although literature on salesforce evaluation has called for using specific, measurable bases in the performance appraisal pro- cess (Jackson and Aldag 1974), sales managers tended to place a great deal of emphasis on qualita- tive bases rather than quantitative bases. This em- phasis was confirmed by responses to the question, "What five factors do you use and consider to be most important in the evaluation of salespeople?" Criteria named most often included four qualitative bases - attitude, aggressiveness, judgment/deci- sion-making ability, and planning - and only one quantitative base - sales volume.
Second, only a narrow set of quantitative bases were used by most firms in the evaluation process. Quantitative bases employed tended to be sales re- lated, whereas significant measures of success such as net profit, gross margin, and profit contribution were less frequently utilized. Furthermore, of these profit measures, net profit rather than profit contri- bution was used most often despite the fact that the salesperson has relatively little control over net profit. In addition, measures of efficiency such as selling expense to quota or average cost per call were seldom utilized, although personnel expense is often the most significant expense category for a firm.
Third, evaluation of the salesperson on a narrow range of selling activities suggests a relatively re- stricted view on management's part of the salesper- son's responsibilities. When performance bases are limited, salespeople tend to concentrate on only those areas in which they know they will be evalu- ated and rewarded. For example, if profitability measures are not used to evaluate salespeople, it follows that salespeople are more likely to push fast- moving, low-margin products.
Given these findings, it may be useful for sales managers to think through all of the activities in- herent in the sales job and to develop more quanti- fiable bases for evaluation of sales performance. Quantifiable bases enable more accurate perform- ance assessment, enhance the credibility of the per- formance evaluation process, and help direct sales- force activities to increase contributions to the firm's marketing and corporate objectives.
Sales managers should create performance bases to reflect the entire range of a salesperson's respon- sibilities. These bases should recognize output vari-
ables such as profit, accounts, and orders as well as sales. Bases may also recognize input variables such as call rate, days worked, selling expense, market share, and various ancillary selling activities such as number of required reports turned in, number of customer complaints, training meetings conducted, etc. Recognition of input is particularly important when effort is not directly related to output as it provides a more equitable way to reward or improve salesperson behavior.
Finally, sales managers should place less emphasis on subjective, qualitative evaluation bases. These bases are difficult to assess and are subject to bias and misinterpretation. To the extent they are em- ployed, they should be utilized as complementary rather than primary criteria.
With regard to setting performance standards, most sales managers did establish objectives for their salespeople, and most did so in conjunction with their salespeople. However, there were still some firms in which standards were set unilaterally. Per- haps in these companies this management style is effective and justifiable. However, an opportunity would seem to exist to increase salesperson moti- vation and commitment to performance by involv- ing them in the setting of performance standards.
In the area of monitoring actual performance, results indicated that various sources of information were examined, including printed forms, computer printouts, call reports and joint calls. However, it may be appropriate for firms to expand their data collection. None of the sources of information in- cluded in the study were utilized by more than 56 percent of the firms. Again, an opportunity is per- haps being overlooked to increase the validity of the evaluation process by gathering more information.
Finally, with respect to performance review, a majority of the firms used a performance evaluation interview. Almost 25 percent of the firms, however, did not take advantage of this opportunity to share results with salespeople. In these cases, valuable two-way feedback may have been lost. The fre- quency of performance evaluations also varied sig- nificantly from firm to firm, ranging from weekly to yearly. There are several possible reasons for this. First, sales jobs of the respondents' firms may have varied enough to make the frequencies of evalua- tions justifiable on an economic basis. Second, sales managers may have responded to the questions from different frames-of-reference, with some referring to informal, weekly meetings and others to formal, year-end reviews. The important point, neverthe- less, is that performance reviews should be done systematically. There should be a predetermined
This content downloaded from 88.255.149.195 on Thu, 03 Sep 2015 07:24:11 UTCAll use subject to JSTOR Terms and Conditions
November 1983 51
time frame for review that is known by the sales- people, and the time period should be determined by the nature of the job rather than by some arbi- trary method.
In general, the overall results of the study suggest that salesforce performance review takes place in an unsystematic and often arbitrary manner. More to the point, sales managers may be missing an opportunity to better define sales jobs, set standards, and monitor and review performance. Jolson (1977) noted that the evaluation procedure is improved when it becomes systematic such that the evaluation is complete, free of personal bias, consistent over time, and comparable in scope for all those being assessed. In addition, such a system can ensure that the sales job is defined properly, can serve as an early warning system to spot deviations in perform- ance, can ensure that performance of the salesforce is contributing to marketing and corporate objec- tives, and can act as a motivator to sales personnel.
The data in this study indicate that salesforce evaluation procedures utilized in practice differ somewhat from those espoused in the sales manage- ment literature. The discrepancy may be caused by the fact that procedures advocated in the literature are difficult to operationalize. The lack of emphasis on quantitative measures and the overemphasis on qualitative measures would certainly seem to sug- gest this explanation. Careful selection of perform- ance criteria and evaluation and reward of the sales- person on the basis of effort and performance may involve more than sales managers feel qualified to handle. Whatever the explanation, the results sug- gest that a more systematic evaluation process may improve the validity of salesforce evaluation.
The authors would like to thank Sales and Marketing Executives International for their cooperation in the study and would like to acknowledge the valuable suggestions offered by anonymous reviewers on an earlier draft of this article.
References
Behrman, Douglas N. and William D. Perrault, Jr. (1982), "Measuring the Performance of Industrial Salespersons,"
Journal of Business Research, 10 (September), 355-370. Cocanaugher, A. Benton and John M. Ivancevich (1978),
"'BARS' Performance Rating for Sales Force Personnel," Journal of Marketing, 42 (July), 87-95.
Conference Board (1965), "Measuring Salesmen's Perform- ance," Studies in Business Policy, 14, New York: Confer- ence Board.
Cotham, James C. and David W. Cravens (1969), "Improv- ing Measurement of Salesmen's Performance," Business Horizons, 12 (June), 79-83.
Cravens, David W., Robert B. Woodruff, and Joe C. Stamper (1972), "An Analytic Approach for Evaluating Sales Territory Performance," Journal of Marketing, 36 (January), 31-37.
Darden, Bill R. and Warren French (1970), "An Investiga- tion into the Salesman Evaluation Practices of Sales Managers," The Southern Journal of Business, 5 (July), 47-56.
Dubinsky, Alan J. and Thomas E. Barry (1982), "A Survey of Sales Management Practices," industrial Marketing Management, 11 (April), 133-141.
Jackson, Donald W., Jr., Lonnie L. Ostrom, and Kenneth R. Evans (1982), "Measures Used to Evaluate Industrial Marketing Activities," Industrial Marketing Manage- ment, 11 (October), 269-274.
and John L. Schlacter (1980), "Do Sales Managers Really Manage by Objectives," Marketing in the 80's: Changes and Challenges, Educator's Conference Pro- ceedings, Series 46, Richard P. Bagozzi et al., eds., Chi- cago: American Marketing Association, 248-251.
and Ramon J. Aldag (1974), "Managing the Sales Force by Objectives," MSU Business Topics, 27 (Spring), 53-60.
Jolson, Marvin A. (1977), SaJes Management: A Tactical Approach, New York: Petrocelli/Charter.
Kearney, William J. (1976), "The Value of Behavioral Based Performance Appraisals," Business Horizons, 19 (June), 75-83.
Neter, John and William Wasserman (1974), Applied Lin- ear Statistical Models, Homewood, IL: R. D. Irwin.
Robertson, Dan H. and Danny N. Bellenger (1980), Sales Management: Decision Making for Improved Profitabil- ity, New York: Macmillan.
Schiff, Jack S. and Michael Schiff (1967), "New Sales Man- agement Tool: ROAM," Harvard Business Review, 45 (July-August), 59-66.
Stanton, William J. and Richard H. Buskirk (1978), Man- agement of the Sales Force, 5th ed., Homewood, IL: Richard D. Irwin.
This content downloaded from 88.255.149.195 on Thu, 03 Sep 2015 07:24:11 UTCAll use subject to JSTOR Terms and Conditions