Embed Size (px)
Citation preview

Save Money by Saving Carbon
Decision Making in the NHS using Marginal Abatement Cost Curves
Background 2
What is a Marginal Abatement Cost (MAC) Curve? 2
Purpose of this document 3
Why would you create a MAC Curve? 3
Reading a MAC Curve 4
NHS England MAC Curve 5
Combining a Marginal Abatement Cost Curve with other investment appraisal concepts
6
How to Create a Marginal Abatement Cost Curve 8
Tools 12
Annex 1 What is Net Present Value 13
Annex 2 Examples using NHS Evidence QIPP case studies 15
Glossary 16
Contents
1 Saving Money by Saving Carbon

Background
The 2008 Climate Change Act has been ground-breaking. It made the UK the first country in the world to have a legally binding long-term framework to cut carbon emissions. This means by law we must reduce greenhouse gases by 34% by 2020 and 80% by 2050.
The NHS is a major contributor to the UK’s carbon footprint and one of the planets largest public sector polluters. It must therefore play its part in reduc-ing emissions and help the UK meet its legally binding targets.
To help the NHS achieve its pledge of reducing greenhouse gas emissions the NHS Sustainable Development Unit has published “A Marginal Abatement Cost Curve for NHS England.”
What is a Marginal Abatement Cost (MAC) Curve?
A MAC Curve is an investment analysis tool. It will help NHS organisations work out which investment decisions will save most money and most carbon.
The MAC Curve will aid the consideration of sustainability principles in the busi-ness decision making process. It will be particularly beneficial to professionals in both Estates and Finance.
A MAC Curve condenses technical data into an easily understandable graph showing cost effectiveness and magnitude of carbon saved for different mea-sures.
Many measures taken specifically to reduce carbon emissions will also save money. These carbon and financial savings can be achieved in many ways, including:
investment in NHS estates, facilities and services•making current activities more efficient•altering service delivery models•
Saving Money by Saving Carbon 2
The NHS Sustainable Development Unit (SDU) is keen to promote the appropri-ate use of MAC Curves as part of investment appraisal and to help organisations make changes to their service delivery or business activities.
This document will consider:
The benefits of a MAC Curve for your NHS organisation•How to create one•Where to source data to support MAC Curve calculations•How to mitigate risks surrounding this information and its use•How MAC Curves empower decision making•Potential future uses of MAC Curves•
MAC Curves can be used to illustrate many measures from transformative changes in service delivery models to investments in energy savings and es-tates management.
In all cases good data is essential to produce a worthwhile MAC Curve.
Why would you create a MAC Curve?
A MAC Curve has many useful applications for a Trust. For example it could use a MAC Curve:
to support prioritisation of one investment over another, where a Trust is as-•sessing the carbon emission and financial impact of a project ;to support the case being made for specific investments or canges, for ex-•ample during the business case process;as part of its annual reporting process, highlighting which steps have been •taken to reduce the environmental impact of the organisation, and which will form its priorities in the future; to contribute to the QIPP case for a capital or revenue investment; and•in conjunction with payback period analysis to identify quick wins, particu-•larly where legislation such as the Carbon Reduction Commitment Energy Efficiency Scheme (CRC) pressurises organisations to reduce emissions quickly with limited resources.
One of the benefits of the MAC Curve is that it allows you to compare very dis-similar investments, capital programmes or programme activities on the same basis.
Purpose of this document
3 Saving Money by Saving Carbon

In brief
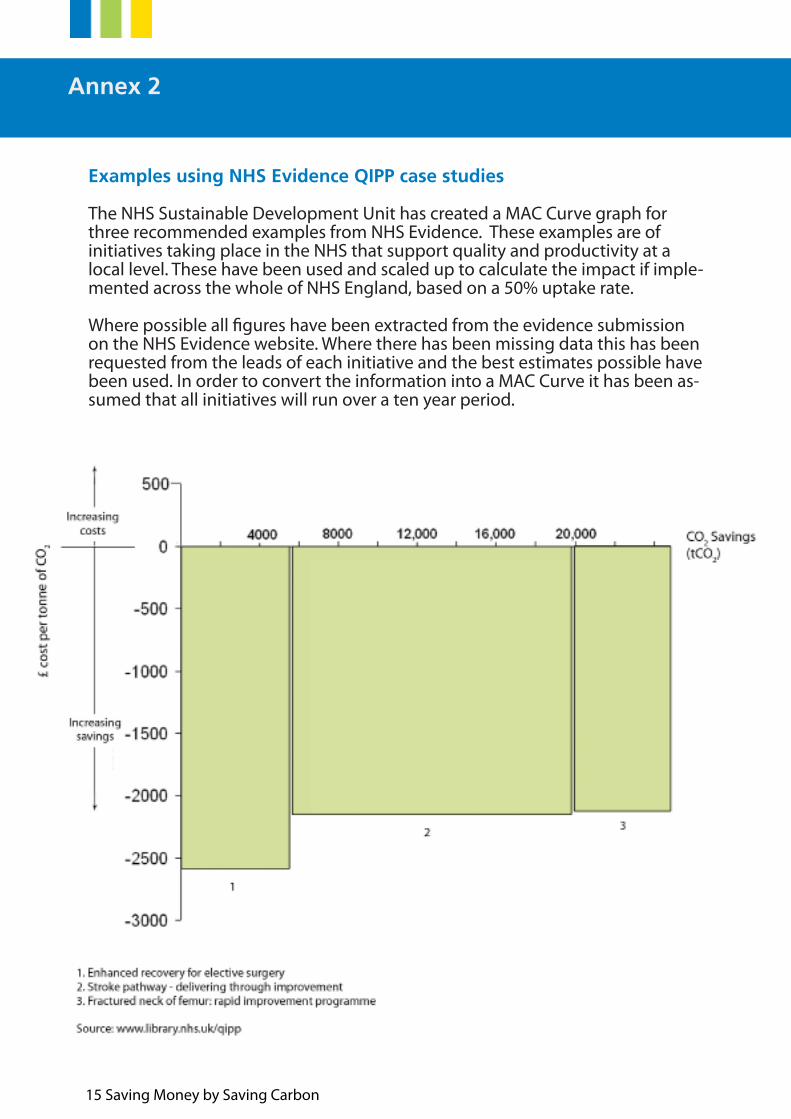
1. The width of each block illustrates the amount of greenhouse gas emis- sions saved per year. The greater the width, the greater the carbon saving.2. The height of the block illustrates the net financial saving or cost (of a mea- sure) per tonne of carbon.3. If a block is below the line this carbon reduction measure will save more money than it originally cost to introduce. If it is above the line the cash invested will not be recovered over the lifetime of the project.
In detail
Organisations considering making changes or investments that will affect their emissions can easily reproduce the carbon and cost implications on a MAC Curve.
If an organisation is considering measures which increase carbon emissions, these will appear to the left of the vertical line.
The combined carbon and financial win-wins are those measures which appear as tall, broad columns below the line. This signifies a significant carbon and finan-cial saving will be generated by a project with a high Net Present Value (NPV).
NPV is an investment decision making calculation which offsets financial costs and benefits and takes into consideration the idea that money now is worth more to an organisation than the same amount of money received in the future. This document contains a quick guide on how to calculate this value.
It is likely that the cause of a high NPV in the context of estates management will be low initial capital costs and/or, large reductions in organisational running costs.
The value for each measure on the graph is calculated by dividing the project’s NPV by the annual emissions saving (either an average value for the project, or the emissions saving in a given year). The result is the Marginal Abatement Cost.
Options which result in less financial savings per tonne of CO2 will appear as in-creasingly shallow columns below the horizontal line.
In “A Marginal Abatement Cost Curve for NHS England” the carbon savings used are what could be achieved in 2015 if all the measures were enacted immedi-ately.
It is worth revisiting and reviewing the MAC Curve periodically. As changes arise in the costs of technologies or the value of incentives, such as the price of carbon in the CRC scheme then some projects will become more cost effective. This should be factored into the decision making process.
Reading a MAC Curve
Saving Money by Saving Carbon 4
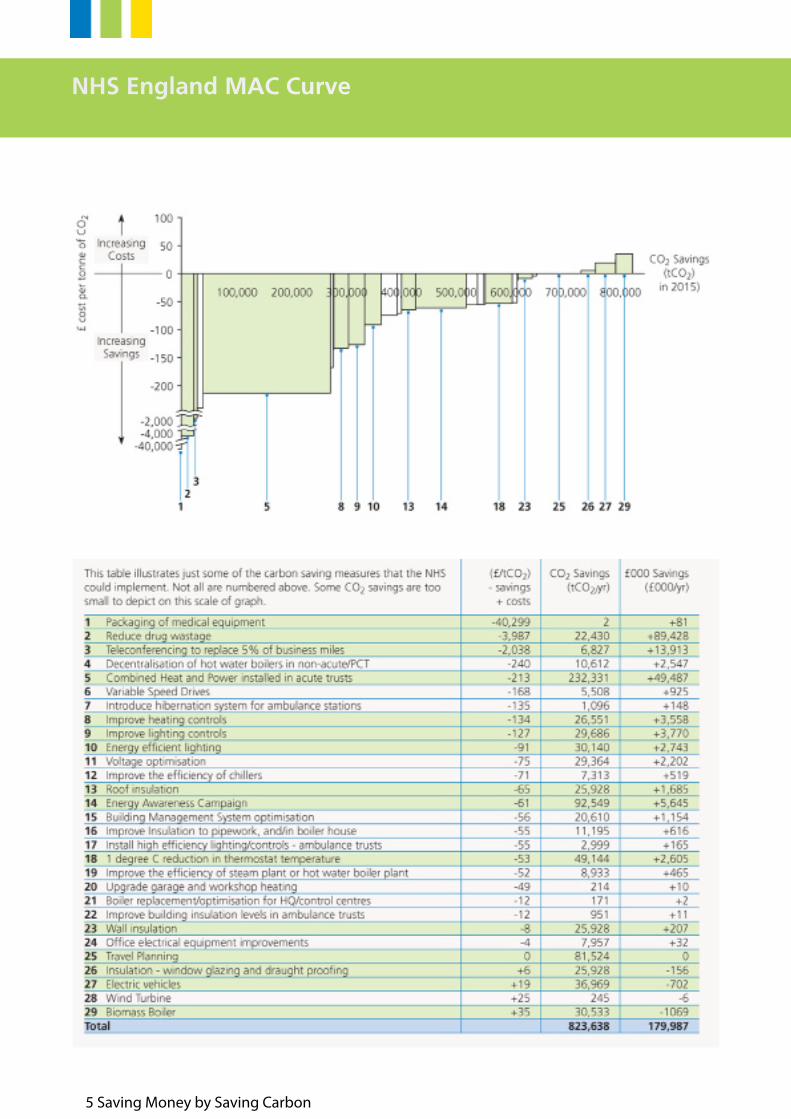
NHS England MAC Curve
5 Saving Money by Saving Carbon
MAC Curves are an ideal way to compare different investments or changes on a similar basis. However, they do not include all of the criteria upon which an investment decision should be made.
NPV and MAC Curves
A key investment decision making concept is NPV. This is the result of compar-ing the future cash flows, both positive and negative, to determine whether a project will have a net positive impact upon an organisation. The design of the MAC Curve recognises the utility and importance of NPV by making the Mar-ginal Abatement Cost dependent on NPV. A project’s NPV is a summary of the costs and changes to future cash flows.
Combining MAC Curves with other investment appraisal concepts
Payback Period, Rate of Return and MAC Curves
An investment concept which coexists with MAC Curves and NPV is Payback Period. This is an indicator of how long it will take to recoup an initial invest-ment from savings generated. Payback Period is the length of time over which savings must accrue or additional revenue be generated before the NPV of a project is zero.
Payback Period is widely used in the commercial, construction and facilities management sector, where it is a key part of the decision making process. As budgets are increasingly constrained, the NHS may find this concept of increas-ing value especially if a choice needs to be made between two investments. For example, an investment where expenditure can be classified as revenue, and the impact on the bottom line is immediate may be preferred to a capital investment with a more long lasting impact, or which delivers more environ-mental benefits. The opportunity cost or knock on effects of such investments should be considered, and this is an area in which MAC Curves can play a role.
Rate of Return (RoR) is an alternative method of displaying the speed with which an investment improves the bottom line. Rate of Return is given as a percentage, and is calculated by dividing the average annual benefit (saving plus increase in revenue) by the total investment cost.
The best way of combining either investment appraisal method with a MAC Curve is by creating MAC Curves with similar Rates of Return or Payback Periods or by highlighting on the MAC Curve itself what the Rates of Return or Payback periods are for various projects.
It might also be useful to rank projects by the total investment required. This will allow a distinction to be drawn between projects that require significant capital input and which may require external funding, through PFI, loans or grants, and those which fit within the Trust’s own spending limits and plans.
Saving Money by Saving Carbon 6
Timelines and MAC Curves
The timing and volume of carbon savings might prove critical – you might want to consider projecting the timing of various carbon savings on a timeline or bar chart, to make sure that the measures you are considering will help you to meet your targets. The MAC Curve could then be used to help bridge the gaps which arise.
How to spot a “quick win”
The combination of short payback periods and carbon reductions can be seen as “quick wins.”
With the increasing demands on NHS organisations to reduce their carbon foot-prints, there is pressure to find ways to swiftly reduce carbon and costs. This pressure might combine or compete with the need for a longer term strategy if an organisation is to match or exceed average performance in the CRC scheme. If the NHS needs to cut its greenhouse gas emissions by 80% by 2050 then or-ganisations will need to reduce their energy usage year on year by 3% or more.
To identify a “quick win”, combine your MAC Curve with the most relevant con-straint faced by your organisation. This might be achieving a short payback period or high rate of return, a limited pool of capital for initial investment, or achieving the highest net present value. The tall, broad bars on the resulting MAC Curve will then be the most appropriate courses to pursue.
7 Saving Money by Saving Carbon
How To Create A MAC Curve
Approximate costs and CO2 savings for certain carbon reduction measures (CRM) can be acquired by scaling the results from the SDU’s previous publica-tion on MAC Curves. This will provide a high-level overview and identify mea-sures meriting further investigation.
Before making investments Trusts may wish to compile an organisation spe-cific MAC Curve, gathering a clear picture of the cost effectiveness of a range of investments or changes relevant to their specific circumstances.
A MAC Curve relies on calculating the marginal changes to an organisation, both in terms of the amount of expenditure required to enact each change, and in terms of the impact the change will have on carbon emissions (for a descrip-tion of what this entails, see the NPV calculation annex).
MAC Curves need to be approached in a logical sequence:
A. What is the current situation?
B. What types of changes are you making?
C. What will the impact of these changes be on the current position?
What is the current situation?
Data needs to be gathered to establish the current situation. At this point it is crucial that the quality and source of the information is understood. The follow-ing questions may prove useful:
• Wherecanyougettheinformationfrom?• Isthereadifferencebetweenstandard/averagedataandspecificdatafor your organisation?• Whatrisksareassociatedwiththisdata?• Whereappropriate,canyoumitigatetheserisks?• Whatassuranceexistsaroundthevaluationsyouareusing?
Standard/average data
To save time and money some information can be drawn directly from the SDU’s existing NHS MAC Curves which are available on the SDU website1.
For example obtaining a market cost for a combined heat and power plant is unnecessary since it can be drawn from the appropriate MAC Curves.
Other examples are:
• Unusualrevenuecosts(e.g.Biomassfuelcosts)• Assumptionsaboutinteractionsandoverlaps
Saving Money by Saving Carbon 8

By the latter we mean that some decisions will have an impact on the same consumption value – for example, changes to the insulation of a building might reduce the fuel needed to heat it, but reducing the thermostat temperature by 1 degree will also affect this value. The NHS wide MAC Curve contains assump-tions about the order that these actions will be taken in, in order that the cost and impact reflects the marginal change in costs and benefits.
Energy consumption will need to be converted from its raw form to show the carbon impact it generates. Conversion factors for gas, electricity, transport and other activities are provided on the Defra website2.
Data sources – Specific Data
Some data to generate the MAC Curve is already likely to exist within your organisation. When collating the support for Display Energy Certificates (DEC), Estates Return Information Collection (ERIC) returns and CRC requirements you will have measured information as the electricity consumption of your sites, rel-evant floor spaces, building heated volume and site-by-site fuel consumption.
Carbon footprint data could also be used to support the calculation of the baseline for carbon emissions for the organisation. A carbon footprint is the expression of how large the greenhouse gas emissions for an organisation are. Guidance on how these values are arrived at is available on the NHS SDU web-site3 based on national guidance from Defra. The Carbon Trust also provide free tools, aligned with this advice, for creating an organisation carbon footprint.
The organisation carbon footprint may also be useful as a basis for the docu-mentation required for CRC.
MAC curves can be created on a building-by-building basis, to give a more de-tailed picture about the impact of changes proposed. Gathering data that sets out energy consumption, floor space, heating and lighting requirement for the components of your Estate may well be a good starting point for helping your organisation become more environmentally sustainable, regardless of the level of granularity required for your MAC Curves.
When looking at Estates investments, the information collected for DEC may be useful for individual buildings. In order to assess changes to service delivery, staff operating hours, patient demand and potential alterations to site use then analysis of the current position and projections of future provision need to be considered.
Data sources – Estimates and Assumptions
Estimates and assumptions may be the basis for some data used in MAC Curve calculations. For example, when creating a MAC Curve, it might be desirable to calculate the relevant heating demand for a building, (or section of it), based on its floor area – here the assumption is that heating demand is consistent be-tween floors and buildings.
9 Saving Money by Saving Carbon

Of course any actual site-specific data should be used wherever possible to pro-vide the best MAC results.
Site/building opening or operating hours will also influence consumption of electricity for medical equipment, lighting, computers etc, and could also in-form the calculation of potential saving in these areas.
Travel of staff, patients and visitors to the Trust is an example of a situation where activity might not be heavily monitored. In such cases, it is best to de-velop estimates allowing for degrees of error or variance. It is also worth con-sidering what data sources you could use to substitute for missing data groups such as the results of surveys, or information gathered by partner organisations or stakeholders.
Using Data - Risks and Assurance
When relying on data it is important to consider the risks related to its creation.
Accurate, quality and reliable data is essential. In the future the performance of teams in the estates function might be measured in part based on the reduc-tion in electricity meter readings from one year to the next. This could create an incentive to only include electricity meters for areas where reductions are likely to occur. It would be worthwhile considering what incentives for under-reporting exist in your organisation.
Another risk might occur where no monitoring or measurement of local data occurs, because in this instance there is no incentive for accuracy in measure-ment. With each risk, and each piece of data, it would be appropriate to con-sider whether to gather additional information or assurance. If the impact of a change is likely to be low, then the extra assurance gained might not be worth the additional work.
Another source of data for the MAC Curve will be a third party (electricity bills, gas bills etc). In these instances it is important to know whether these bills make estimates in the billing or consumption statistics reported, and what work if any the Trust is performing to reconcile measurements back to the underlying data (meter readings by the supplier against meter readings by Estates staff, for instance).
These good governance processes are useful for highlighting unnecessary ex-penditure and will also help create an accurate MAC Curve.
For much of your information, it is likely that you are already seeking and gath-ering assurance. Perhaps outside consultants conducted work with other goals in mind, the data from which remains valid and can be applied to MAC Curve creation. Perhaps the data comes from verified independent sources. Perhaps the information is audited, and so audit packs are created periodically. When creating a MAC Curve it will not be necessary to repeat these types of activties, indeed a significant amount of the work which would be required to create a MAC Curve for a new organisation will already have been conducted in the NHS. Saving Money by Saving Carbon 10

What type of change are you making?
Some carbon reduction measures are unlikely to suit all organisations, and this is reflected in the NHS MAC Curve uptake rates. It is worth considering which measures match your specific circumstances, and the proportion of your activ-ity to which the measures apply – the uptake rate.
Options Selection
A Central London Acute Trust might struggle to gather sufficient fuel for a bio-mass heating system from local sources, and shipping biomass in would negate the carbon savings intended in the investment. Equally, a small rural site might find that investing in a Combined Heat and Power plant is not cost effective.
Uptake rate
For Estates - understanding the site-by-site situation in your organisation could lead to significant adjustments to the wider MAC Curves. For instance improv-ing the glazing and draft proofing of all buildings might be something that would create a substantial benefit for your organisation, whereas in the Large Acute Trust MAC Curve only 20% uptake is assumed. When considering uptake the specificities of a site’s operation will also be important, as hours of opening will have a significant impact on technologies such as lighting controls.
For changes to service delivery the uptake rate appropriate will be driven by how much of the service you are proposing to change – for example, if your Trust is pursuing a larger proportion of home births as opposed to births in hospital, how large a percentage of your service is intended to be transferred? Another important consideration will be how much of the service patients will be willing to see transferred? In the case of maternity, some expectant mothers will always prefer a hospital birth, but this consideration applies to other areas too – whether it is Accident and Emergency care or shifting from face to face to telephone based outpatient appointments.
11 Saving Money by Saving Carbon

Impact of these changes on the current position
With some investment decisions the impact of a change will be relatively simple to find – if a boiler uses 10% less fuel than an alternative, then a simple substitution calculation will suffice to identify the carbon saving.
Some changes will require more consideration. For example:
•Ifaclinicisgoingtobeopenfor3morehoursintheevening,thenstaffwillhave to be paid to man it for that time but the clinic will also require extra heat-ing and lighting.
•Ifpatientsareaskedtocometoanewcentre,ratherthanhaveanursevisitthem, the nurse’s time will be more efficiently spent and her travelling mileage reduced but the patients travel needs to be taken into account.
The same basic considerations will apply to the projections of future activity as apply to the establishment of the baseline, namely, what is the source of the data for the projections, what variance might exist, what are the risks and how do we mitigate them. As with costs and benefits, pilots, best practice guidance and surveys are all good places to start.
TOOLS
When considering whether to create a MAC Curve there are several options. You might rely on an existing MAC Curve creation tool, sourced from the inter-net4 , to create your own tool to generate a MAC Curve, or to outsource some or all of the work of creating a MAC Curve to a specialist consultancy.
Whichever route you opt for, the same basic requirements exist:
1. Ongoing ownership of the underlying source dataYour organisation needs to retain intellectual property rights data and method-ologies, to ensure that software licences are in the appropriate name and pro-tect commercially sensitive information. Included in this necessity is a require-ment to ensure that knowledge of where data has been drawn from, and how it was collected. Without this, making changes and adjustments in the future becomes a lot harder.
2. The capacity to adjust your output based on new or changing informationAs discussed above, you may want to adjust the MAC Curve output to include other decision-making information or outputs in the graph. This might be more challenging if using a stock tool.
3. Time required to create the MAC CurveOutsourcing the creation of a MAC Curve to a specialist consultancy provider may save your staff time. However, there will need to be a balance struck be-tween the value of having external expertise bought in, and the need to sup-port and inform their work, and the relative financial cost.
Saving Money by Saving Carbon 12
Annex 1
What is Net Present Value?
Net Present Value (NPV) is the current value of the future cash flows of a project or investment.
The method takes into account the timing of future cash flows, as well as their values. Future income or savings generated by the project are offset against any initial investment or ongoing increases in cost, after a required rate of re-turn is applied. The result of this calculation is an expression of the benefit an organisation will gain from a course of action, expressed in monetary terms.
To calculate a project’s NPV the following pieces of information are required: the investment cost, any impacts on ongoing expenditure, the projected timing of these impacts, and the discount rate.
When calculating an NPV only the marginal increase in cost should be used. For example, if the investment being appraised was the introduction of a new type of boiler, instead of continuing with the current boiler replacement programme, then only the increase in costs between the new type of boiler and the old type would be relevant for assessment.
The discount factor is calculated using the required rate of return for an invest-ment. As such it includes both interest and inflation. Using this to calculate NPV is based on the principle that money now is worth more than money in the future and ensures that this is reflected in the project valuation.
13 Saving Money by Saving Carbon

Example NPV – LED lighting
Cash Flow Y0 Y1 Y2 Y3 Y4Installation of LEDs (£5,000)Increase in maintenance costs (£100) (£100) (£100) (£100)Reduced electricity cost £1,500 £1,500 £1,500 £1,500Discount factor @ 3.5% 1 0.966 0.934 0.902 0.871Present Value (£5,000) £1352 £1308 £1263 £1,219Net Present Value £142
In this example the installation cost of LED lighting is £5,000.
The new system also requires £100 of extra maintenance costs, but it does bring a significant reduction in the electricity cost of £1,500 per annum for each of LED lighting system’s four years of life.
It is convention that costs which occur during a period, whether it is a year or a month, are recorded as having occurred at the end of that financial period. The initial outlay/investment in a project is recorded as occurring at the start of the first financial period, and hence is not discounted.
The amount by which cash flows are reduced (the discount factor) escalates each year. This reflects how much the money initially invested would have been worth if it had been spent in other ways (the opportunity cost).
The future cash flows are reduced by the discount factor, which is given by the formula 1
----------(1+DF)y
Where DF is the discount factor (in the example, we have used 3.5% which is the Treasury’s required rate of return) and y is the number of years that have passed.
The sum of these discounted flows forms the NPV of the project. In this exam-ple the project’s NPV is £142, which means that the organisation will gain £142 more benefit than its overall investment during the project’s life.
Saving Money by Saving Carbon 14
Annex 2
Examples using NHS Evidence QIPP case studies
The NHS Sustainable Development Unit has created a MAC Curve graph for three recommended examples from NHS Evidence. These examples are of initiatives taking place in the NHS that support quality and productivity at a local level. These have been used and scaled up to calculate the impact if imple-mented across the whole of NHS England, based on a 50% uptake rate.
Where possible all figures have been extracted from the evidence submission on the NHS Evidence website. Where there has been missing data this has been requested from the leads of each initiative and the best estimates possible have been used. In order to convert the information into a MAC Curve it has been as-sumed that all initiatives will run over a ten year period.
15 Saving Money by Saving Carbon

Glossary
CO2 – Carbon Dioxide
DF – Discount Factor
MACC – Marginal Abatement Cost Curve
NHS SDU – National Health Service Sustainable Development Unit
NPV – Net Present Value
DEC – Displayed Energy Certificate
References
1. http://www.sdu.nhs.uk/page.php?page_id=160
2. http://www.defra.gov.uk/environment/business/reporting/pdf/conversion-factors.pdf - care should be used to ensure that CO2e factors are used.
3. http://www.sdu.nhs.uk/page.php?page_id=126
4. Two examples of these are available from low carbon cities or the Carbon Trust:
http://www.lowcarboncities.co.uk/cms/assets/Toolkit-Documents/3-Identify-City-wide-Opportunities/MACC-Calculation.xls?phpMyAdmin=b2269d0b74f0653ad75eab0d458e983d
http://www.carbontrust.co.uk/SiteCollectionDocuments/press_releases/5-CM-PR-2009-v1-1.xls
Saving Money by Saving Carbon 16

NHS Sustainable Development Unit
Victoria House, Capital ParkFulbourn, Cambridge CB21 5XB
Tel: 01223 597 792 Fax: 01223 597 712 Web: www.sdu.nhs.uk
The NHS Sustainable Development Unit develops organisations, people,
tools, policy, and research to help the NHS in England fulfil its
potential as a leading sustainable and low carbon organisation.