Embed Size (px)
Citation preview
—SAX and a lake model
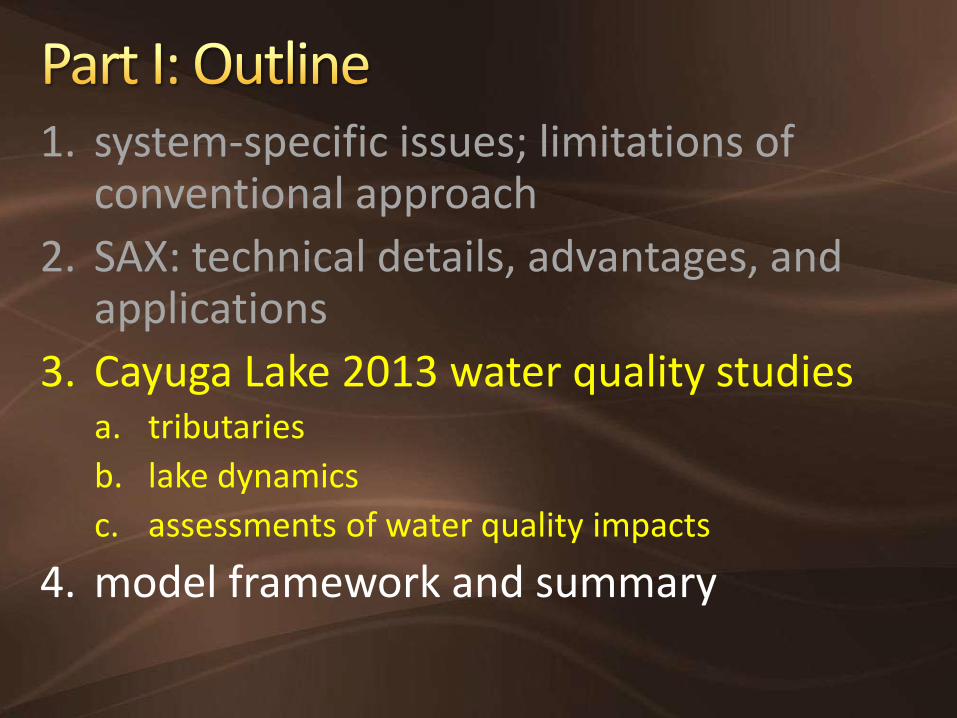
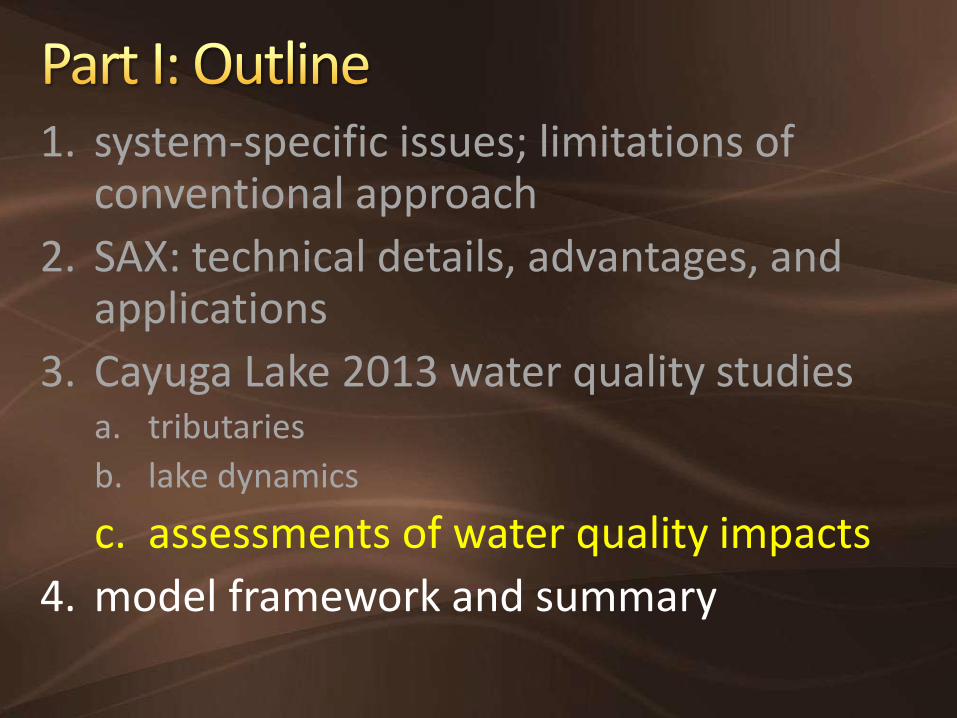
1. system-specific issues; limitations of conventional approach
2. SAX: technical details, advantages, and applications
3. Cayuga Lake 2013 water quality studies a. tributaries
b. lake dynamics
c. assessments of water quality impacts
4. model framework and summary
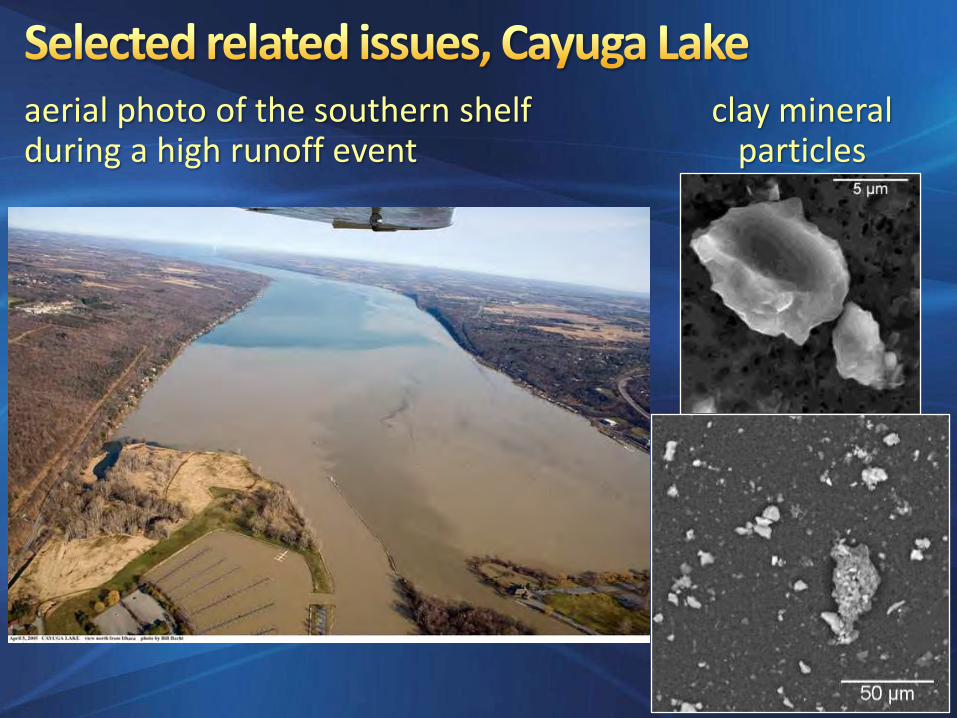
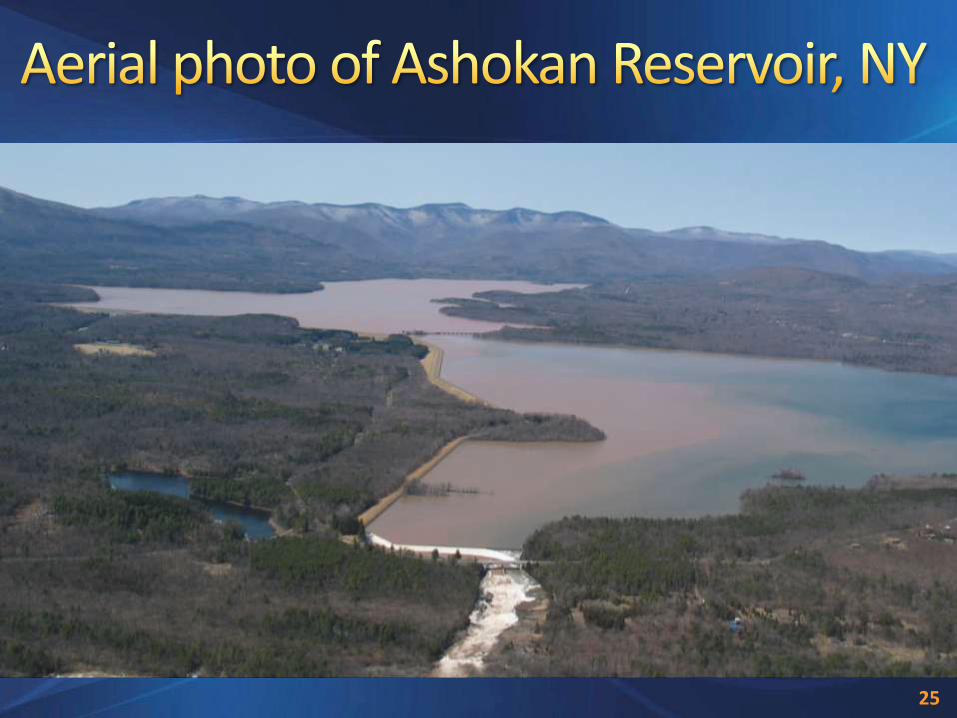
aerial photo of the southern shelf during a high runoff event
clay mineral particles
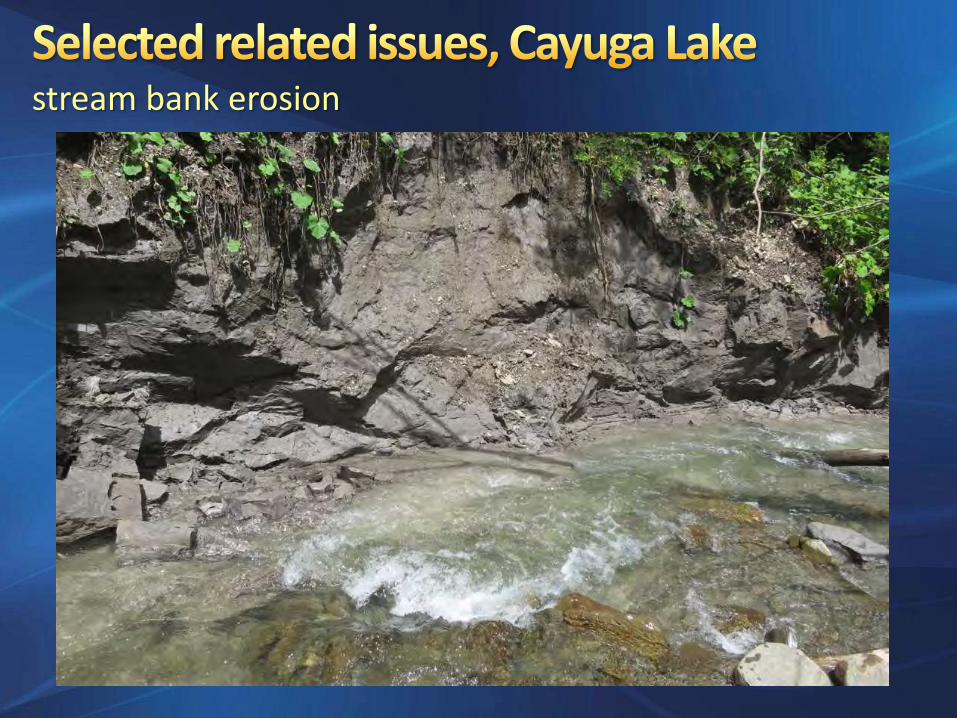
stream bank erosion
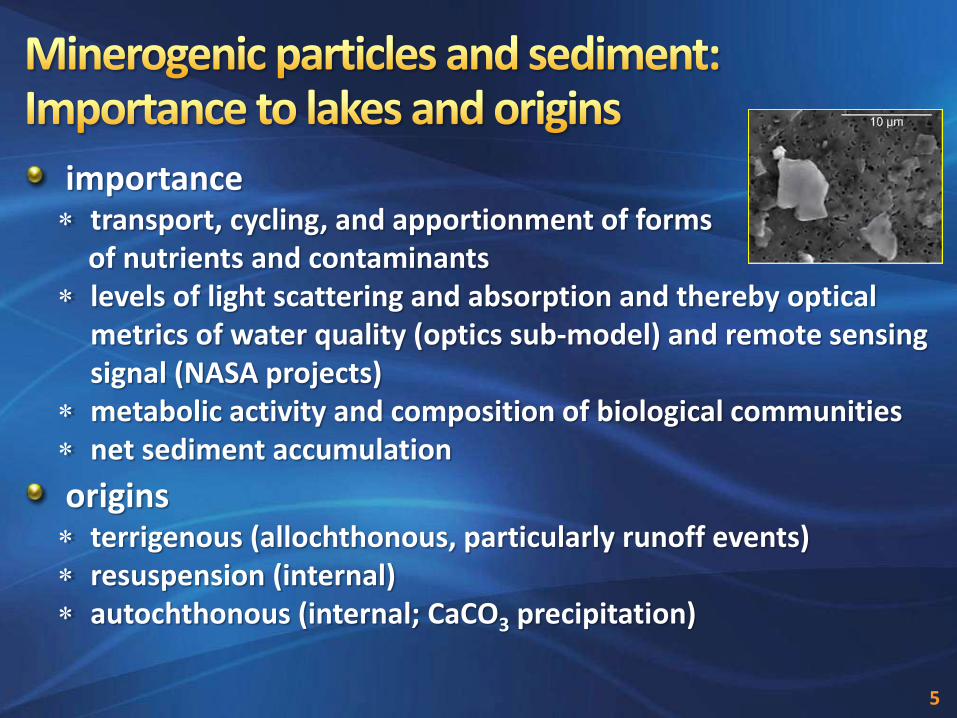
importance transport, cycling, and apportionment of forms of nutrients and contaminants levels of light scattering and absorption and thereby optical
metrics of water quality (optics sub-model) and remote sensing signal (NASA projects)
metabolic activity and composition of biological communities net sediment accumulation
origins terrigenous (allochthonous, particularly runoff events) resuspension (internal) autochthonous (internal; CaCO3 precipitation)
5
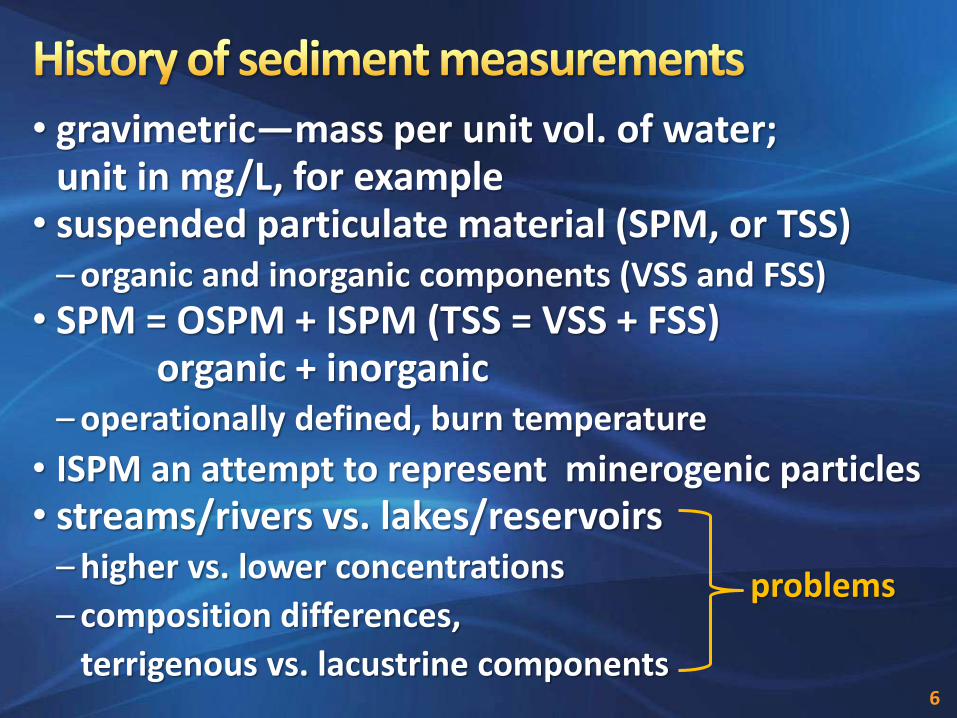
• gravimetric—mass per unit vol. of water; unit in mg/L, for example
• suspended particulate material (SPM, or TSS) – organic and inorganic components (VSS and FSS)
• SPM = OSPM + ISPM (TSS = VSS + FSS) organic + inorganic
– operationally defined, burn temperature
• ISPM an attempt to represent minerogenic particles • streams/rivers vs. lakes/reservoirs
– higher vs. lower concentrations
– composition differences,
terrigenous vs. lacustrine components
6
problems
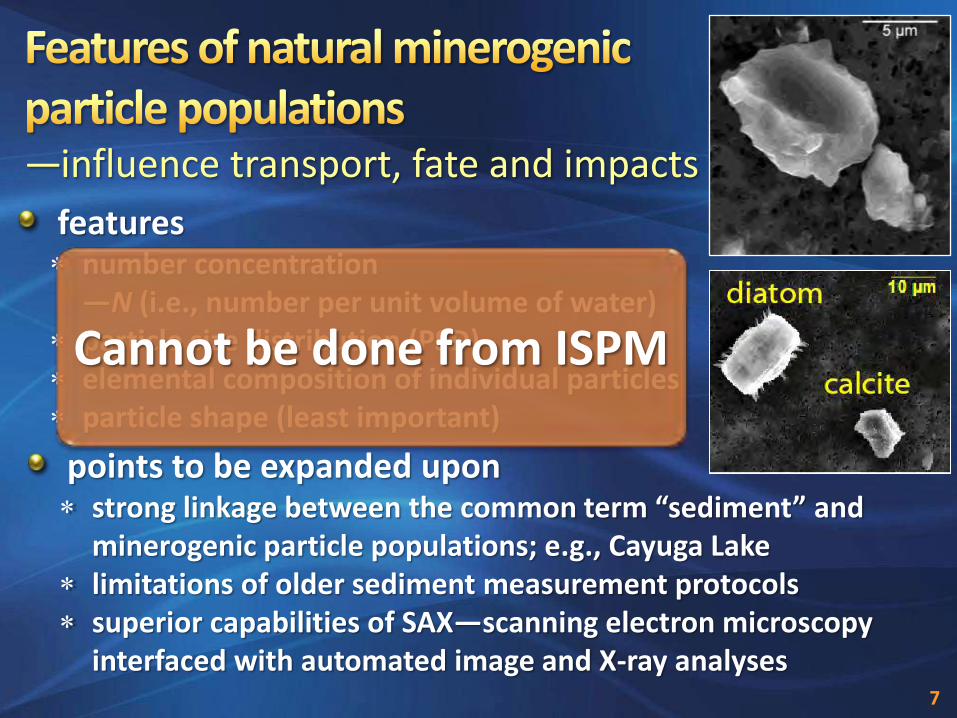
features number concentration
—N (i.e., number per unit volume of water) particle size distribution (PSD) elemental composition of individual particles particle shape (least important)
—influence transport, fate and impacts
points to be expanded upon strong linkage between the common term “sediment” and
minerogenic particle populations; e.g., Cayuga Lake limitations of older sediment measurement protocols superior capabilities of SAX—scanning electron microscopy
interfaced with automated image and X-ray analyses 7
Cannot be done from ISPM

1. system-specific issues; limitations of conventional approach
2. SAX: technical details, advantages, and applications
3. Cayuga Lake 2013 water quality studies a. tributaries
b. lake dynamics
c. assessments of water quality impacts
4. model framework and summary
0 1 2 3 4
0
1000
2000
3000
4000
AlK
X-r
ay C
ou
nts
Energy (keV)
Si
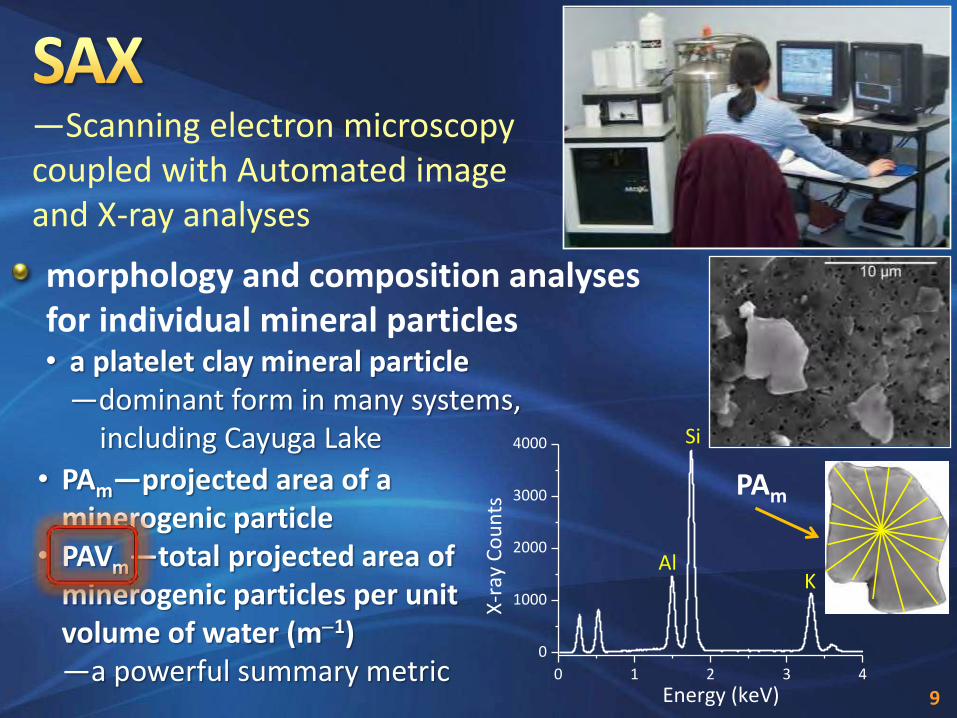
—Scanning electron microscopy coupled with Automated image and X-ray analyses
• PAm—projected area of a minerogenic particle
• PAVm—total projected area of minerogenic particles per unit volume of water (m-1) —a powerful summary metric
PAm
morphology and composition analyses for individual mineral particles • a platelet clay mineral particle
—dominant form in many systems, including Cayuga Lake
9
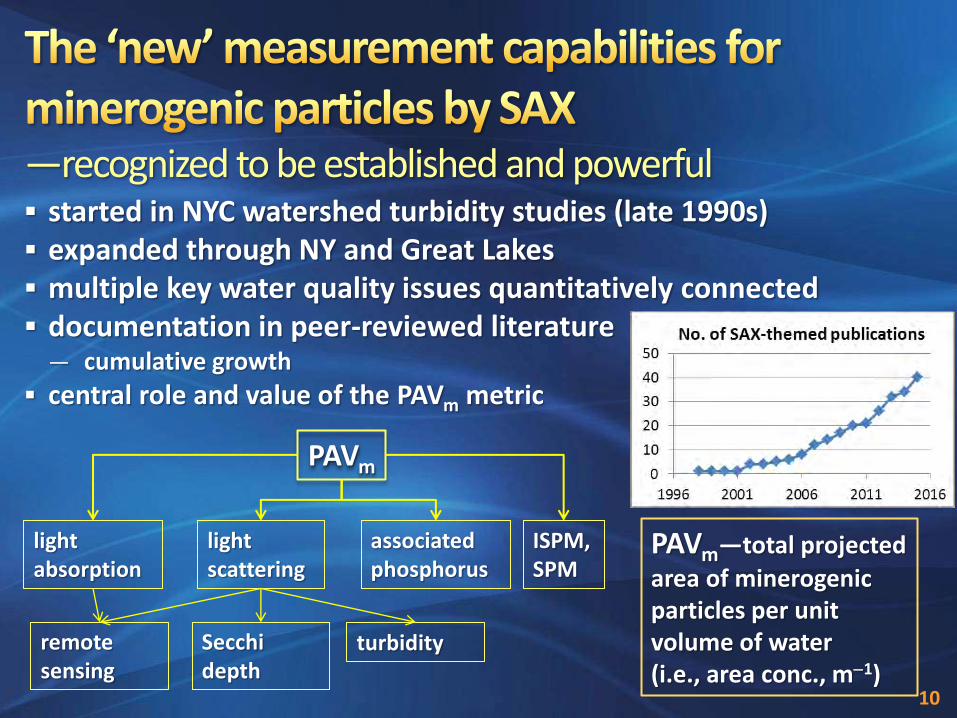
started in NYC watershed turbidity studies (late 1990s) expanded through NY and Great Lakes multiple key water quality issues quantitatively connected documentation in peer-reviewed literature
— cumulative growth
central role and value of the PAVm metric
PAVm
light scattering
light absorption
associated phosphorus
ISPM, SPM
remote sensing
Secchi depth
turbidity
—recognized to be established and powerful
PAVm—total projected
area of minerogenic particles per unit volume of water (i.e., area conc., m-1)
10
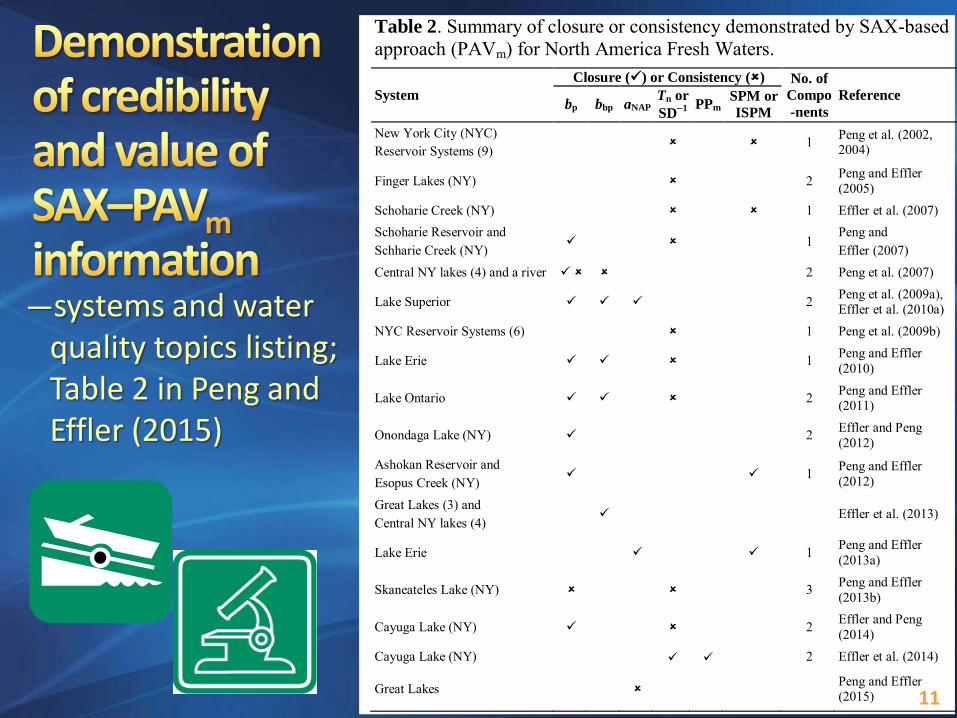
—systems and water quality topics listing; Table 2 in Peng and Effler (2015)
Table 2. Summary of closure or consistency demonstrated by SAX-based approach (PAVm) for North America Fresh Waters.
System
Closure () or Consistency () No. of
Compo
-nents
Reference bp bbp aNAP
Tn or
SD-1
PPm
SPM or
ISPM
New York City (NYC) Reservoir Systems (9)
1 Peng et al. (2002, 2004)
Finger Lakes (NY) 2 Peng and Effler (2005)
Schoharie Creek (NY) 1 Effler et al. (2007) Schoharie Reservoir and Schharie Creek (NY)
1 Peng and Effler (2007)
Central NY lakes (4) and a river 2 Peng et al. (2007)
Lake Superior 2 Peng et al. (2009a), Effler et al. (2010a)
NYC Reservoir Systems (6) 1 Peng et al. (2009b)
Lake Erie 1 Peng and Effler (2010)
Lake Ontario 2 Peng and Effler (2011)
Onondaga Lake (NY) 2 Effler and Peng (2012)
Ashokan Reservoir and Esopus Creek (NY)
1 Peng and Effler (2012)
Great Lakes (3) and Central NY lakes (4)
Effler et al. (2013)
Lake Erie 1 Peng and Effler (2013a)
Skaneateles Lake (NY) 3 Peng and Effler (2013b)
Cayuga Lake (NY) 2 Effler and Peng (2014)
Cayuga Lake (NY) 2 Effler et al. (2014)
Great Lakes Peng and Effler (2015)
11
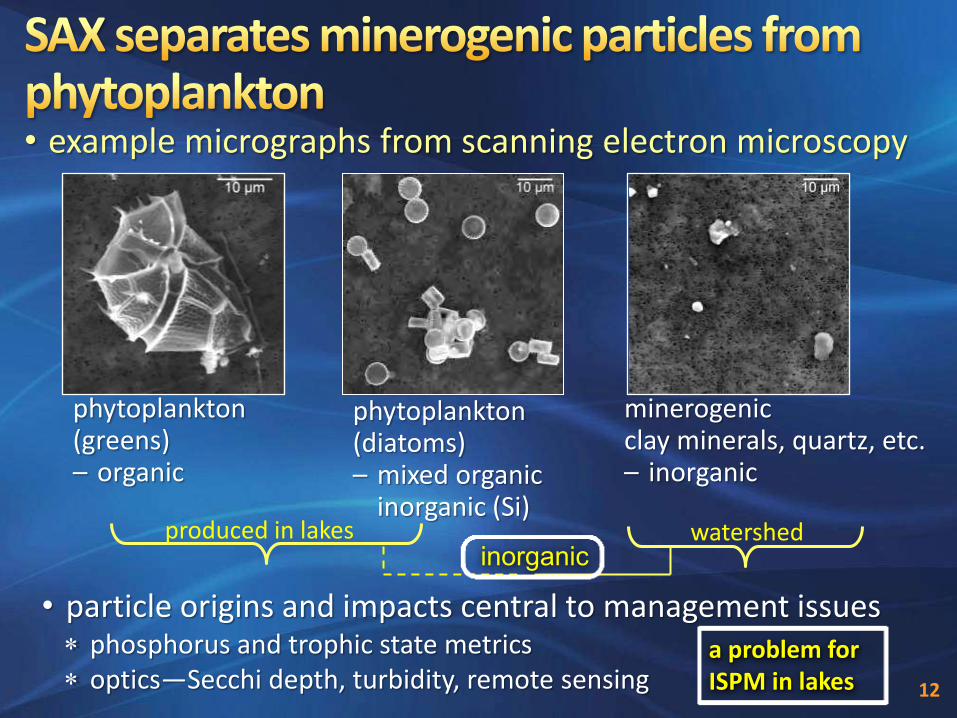
• example micrographs from scanning electron microscopy
• particle origins and impacts central to management issues phosphorus and trophic state metrics optics—Secchi depth, turbidity, remote sensing
phytoplankton (greens) – organic
phytoplankton (diatoms) – mixed organic
inorganic (Si) produced in lakes
minerogenic clay minerals, quartz, etc. – inorganic
watershed inorganic
12
a problem for ISPM in lakes
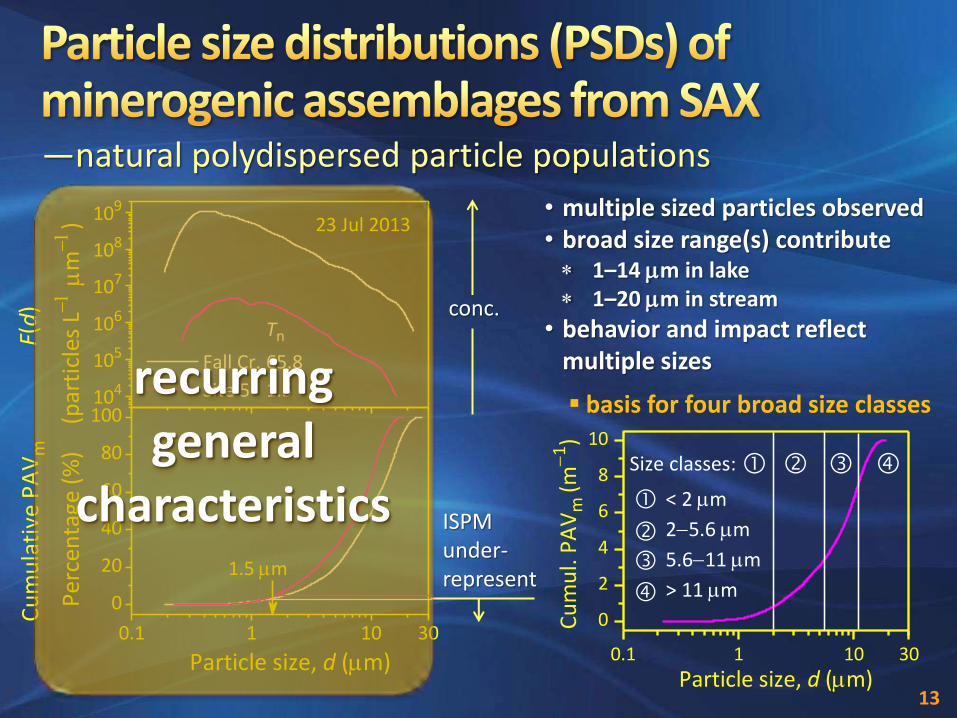
• multiple sized particles observed • broad size range(s) contribute
1–14 m in lake 1–20 m in stream
• behavior and impact reflect multiple sizes
—natural polydispersed particle populations
104
105
106
107
108
109
0.1 1 10 30
0
20
40
60
80
100
Tn
65.8
1.5
F(d
)
(par
ticl
es L
-
m-
)
Fall Cr.
Site 5
23 Jul 2013
Cu
mu
lati
ve P
AV
m
Per
cen
tage
(%
)
Particle size, d (m)
1.5 m
conc.
ISPM under-represent
13
0.1 1 10 30
0
2
4
6
8
10
Cu
mu
l. P
AV
m (m
-1)
Particle size, d (m)
Size classes:
< 2 m
2-5.6 m
5.6-11 m
> 11 m
basis for four broad size classes recurring general
characteristics
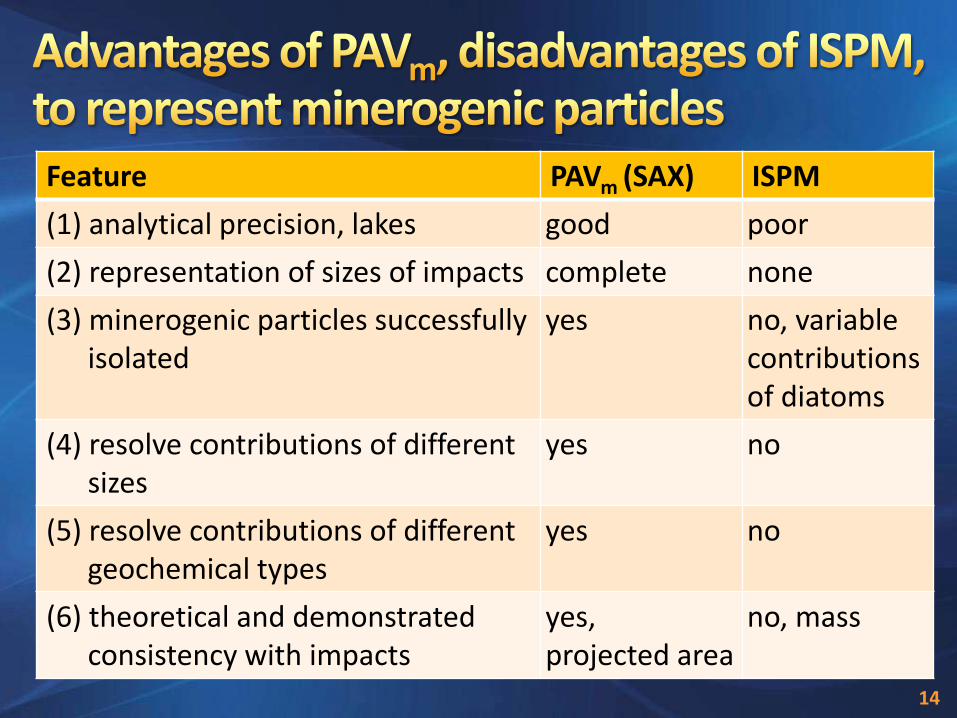
Feature PAVm (SAX) ISPM
(1) analytical precision, lakes good poor
(2) representation of sizes of impacts complete none
(3) minerogenic particles successfully isolated
yes no, variable contributions of diatoms
(4) resolve contributions of different sizes
yes no
(5) resolve contributions of different geochemical types
yes no
(6) theoretical and demonstrated consistency with impacts
yes, projected area
no, mass
14
1. system-specific issues; limitations of conventional approach
2. SAX: technical details, advantages, and applications
3. Cayuga Lake 2013 water quality studies a. tributaries
b. lake dynamics
c. assessments of water quality impacts
4. model framework and summary
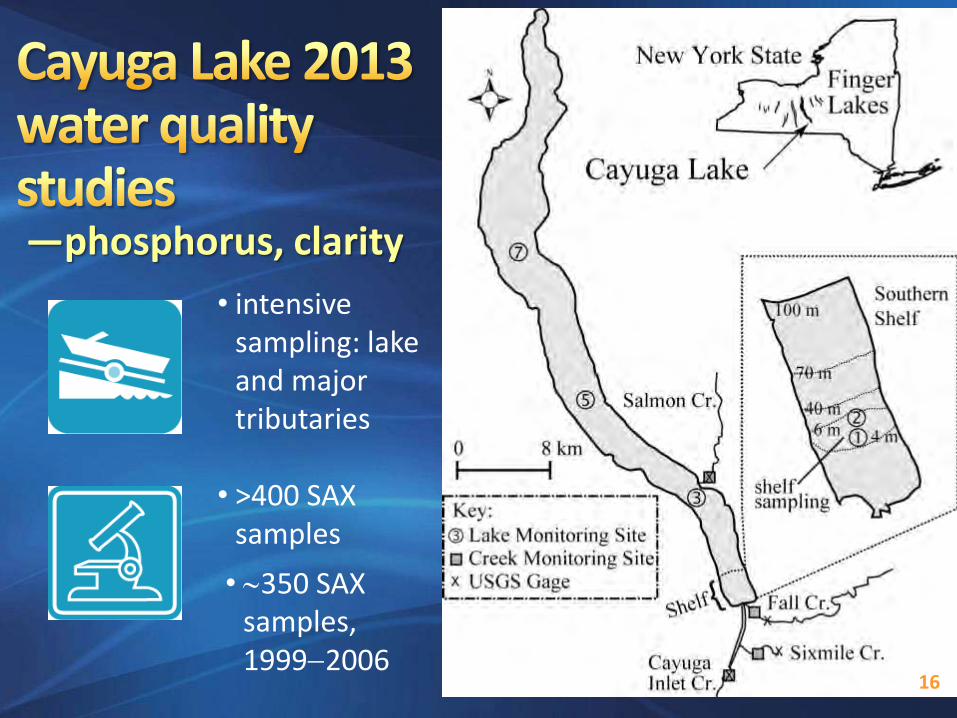
• intensive sampling: lake and major tributaries
• >400 SAX samples
—phosphorus, clarity
16
• 350 SAX samples, 1999-2006
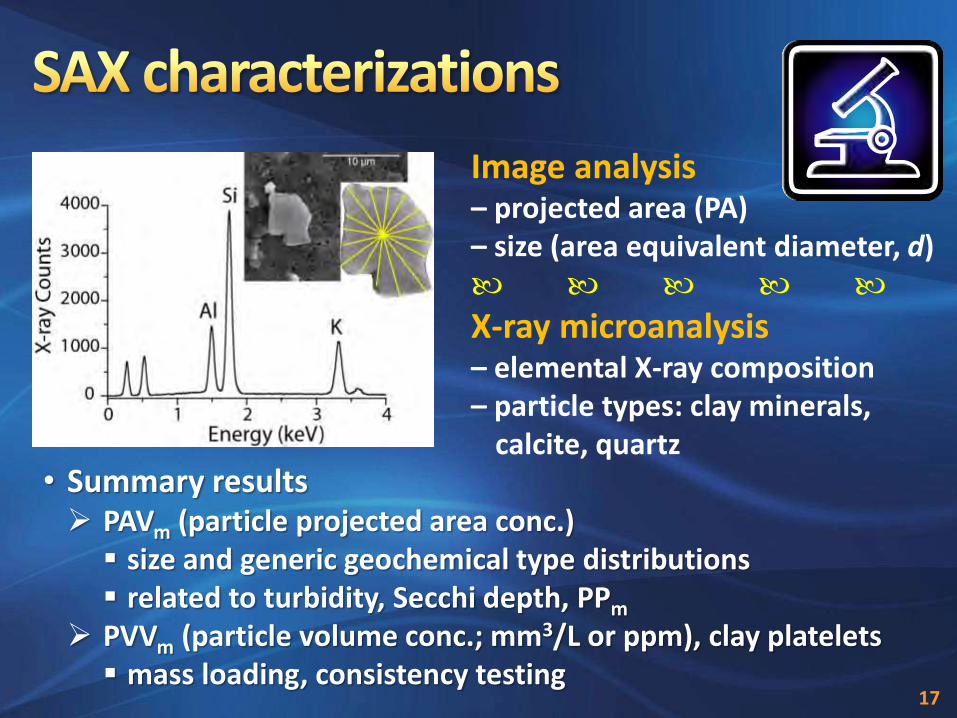
Image analysis – projected area (PA) – size (area equivalent diameter, d)
X-ray microanalysis – elemental X-ray composition – particle types: clay minerals,
calcite, quartz • Summary results PAVm (particle projected area conc.) size and generic geochemical type distributions related to turbidity, Secchi depth, PPm
PVVm (particle volume conc.; mm3/L or ppm), clay platelets mass loading, consistency testing
17
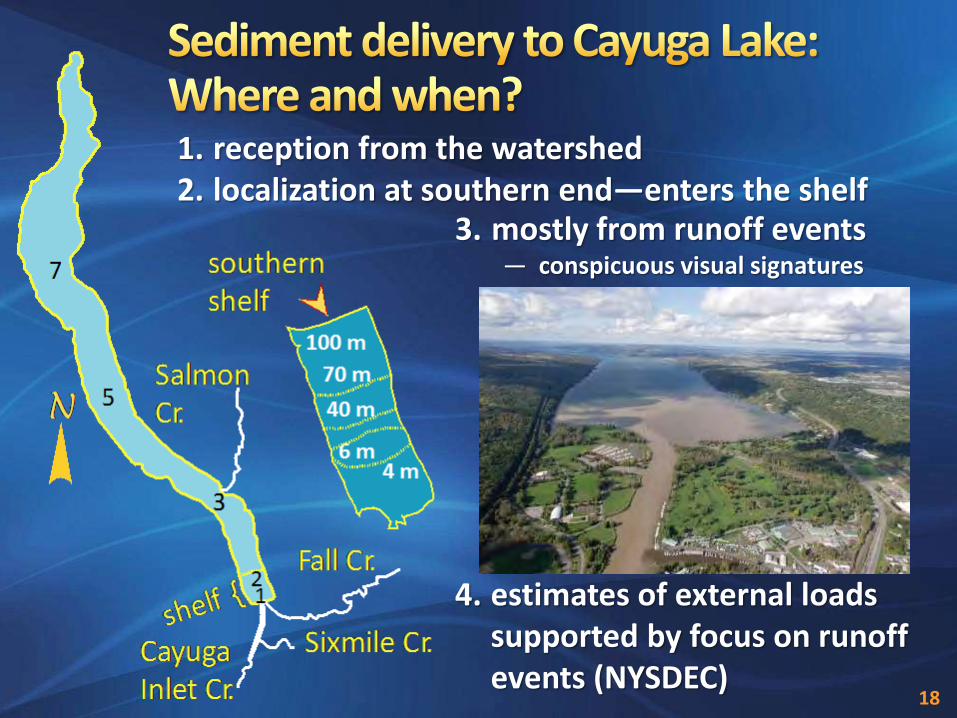
3. mostly from runoff events — conspicuous visual signatures
4. estimates of external loads supported by focus on runoff events (NYSDEC)
18
1. reception from the watershed 2. localization at southern end—enters the shelf
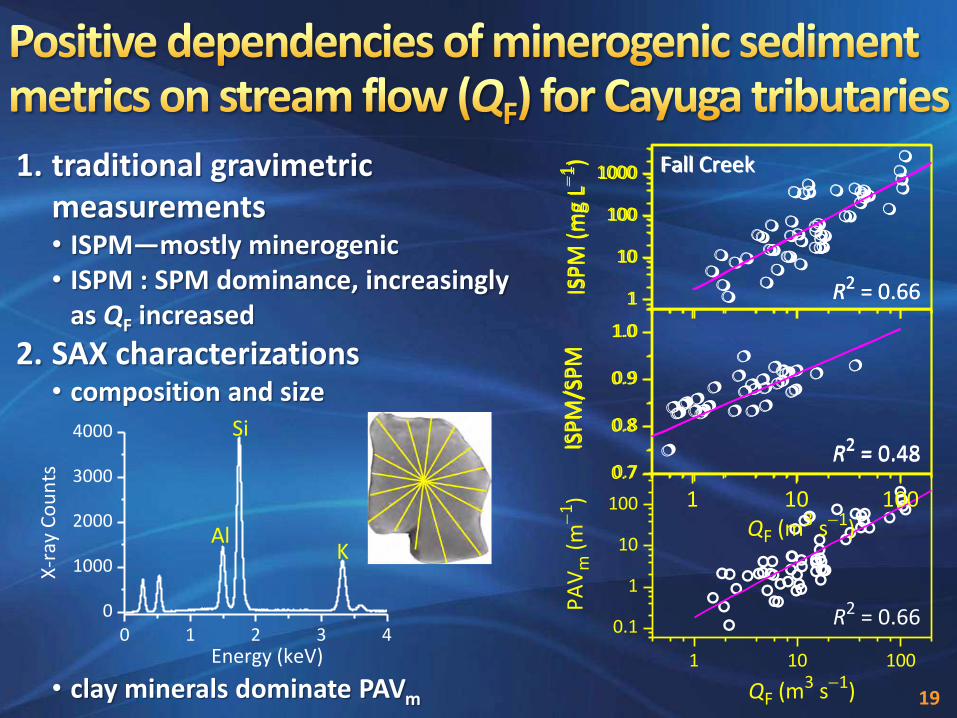
1. traditional gravimetric measurements • ISPM—mostly minerogenic • ISPM : SPM dominance, increasingly
as QF increased
2. SAX characterizations • composition and size
• clay minerals dominate PAVm
0 1 2 3 40
1000
2000
3000
4000
AlK
X-r
ay C
ou
nts
Energy (keV)
Si
19
0.7
0.8
0.9
1.0
1
10
100
1000
1 10 100
0.1
1
10
100
ISP
M/S
PM
R2 = 0.48
ISP
M (
mg
L-1) Fall Creek
R2 = 0.66
R2 = 0.66
QF (m3 s-1)
PA
Vm
(m
-1)
1 10 1000.7
0.8
0.9
1.0
1
10
100
1000
QF (m3 s-1)
ISP
M/S
PM
R2 = 0.48
ISP
M (
mg
L-1 ) Fall Creek
R2 = 0.66
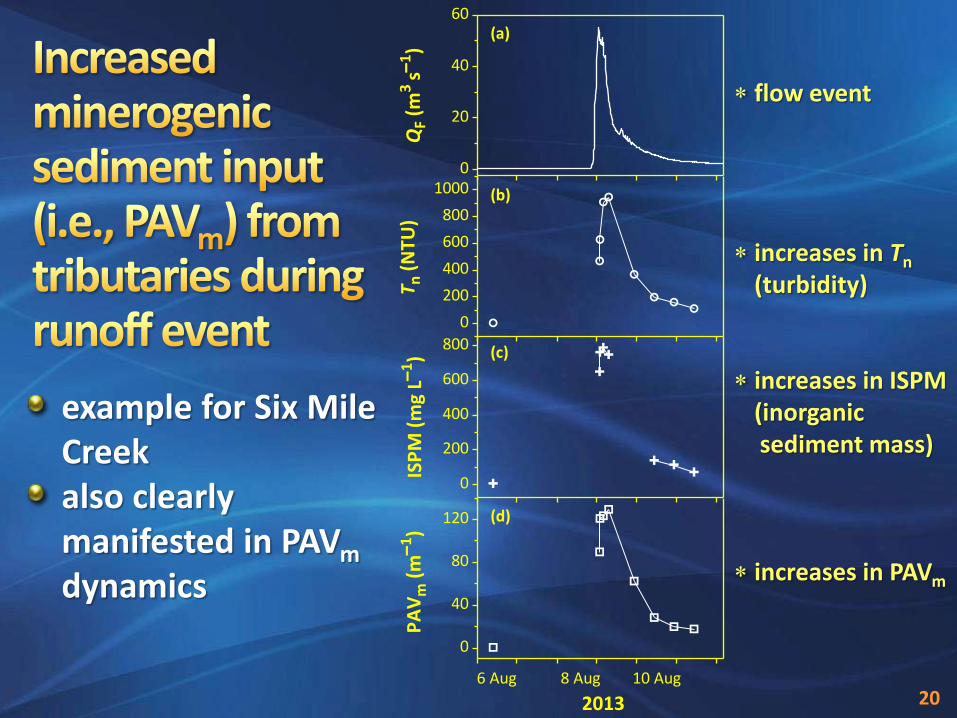
example for Six Mile Creek also clearly manifested in PAVm dynamics
flow event
increases in Tn (turbidity)
increases in ISPM (inorganic
sediment mass)
increases in PAVm
20
0
20
40
60
0
200
400
600
800
0
40
80
120
0
200
400
600
800
1000
QF
(m3
s-1)
(a)
6 Aug 8 Aug 10 Aug
2013
(c)
ISP
M (
mg
L-1)
(d)
PA
Vm
(m
-1)
(b)
T n (
NTU
)

• Tn—turbidity • strong dependencies • linkage of PAVm to an
optical metric of quality
• PP—particulate P (= TP – TDP)
• strong dependencies • linkage to a trophic state
metric
—driven by runoff event sampling (NYSDEC)
21
0
100
200
300
400
500
0
1000
2000
3000
Fall Creek
(a)
PAVm (m-1)
Tn (
NTU
)
R2 = 0.96
Salmon Creek
(b)
PAVm (m-1)
PP
(
g L-
1 )
R2 = 0.99
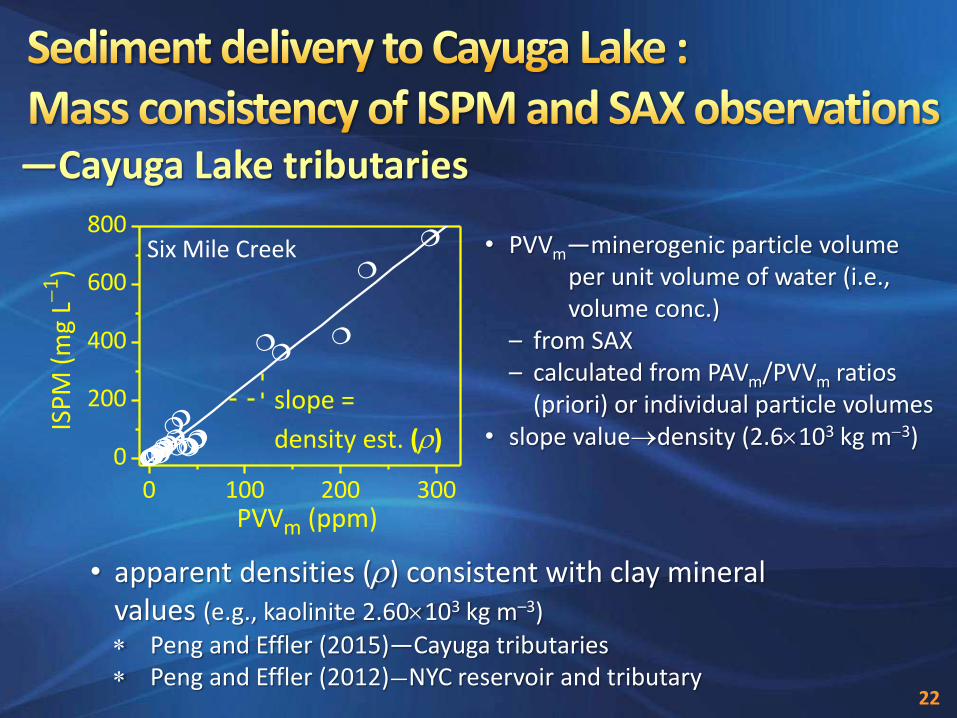
—Cayuga Lake tributaries
• apparent densities (r) consistent with clay mineral values (e.g., kaolinite 2.60103 kg m–3)
Peng and Effler (2015)—Cayuga tributaries Peng and Effler (2012)—NYC reservoir and tributary
• PVVm—minerogenic particle volume per unit volume of water (i.e., volume conc.)
– from SAX – calculated from PAVm/PVVm ratios
(priori) or individual particle volumes • slope valuedensity (2.6103 kg m-3)
22
0 100 200 300
0
200
400
600
800
PVVm (ppm)
ISP
M (
mg
L-1 )
slope =
density est. (r)
Six Mile Creek
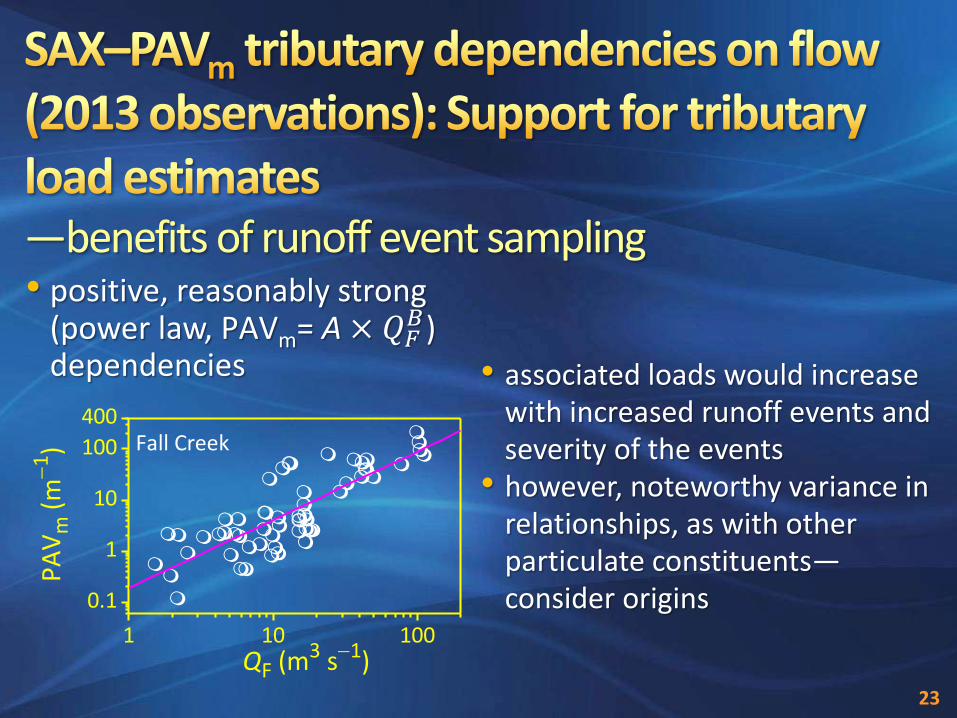
—benefits of runoff event sampling
• associated loads would increase with increased runoff events and severity of the events
• however, noteworthy variance in relationships, as with other particulate constituents—consider origins
23
1 10 100
0.1
1
10
100
400
QF (m3 s-1)
PA
Vm
(m
-1)
Fall Creek
• positive, reasonably strong (power law, PAVm= A × 𝑄𝐹
𝐵) dependencies

NYC Reservoir System, Catskill region: Stream bank erosion—a problem
10 100 5000.1
1
10
100
PA
Vm
(m
-1)
QF (m3 s-1)
24
25
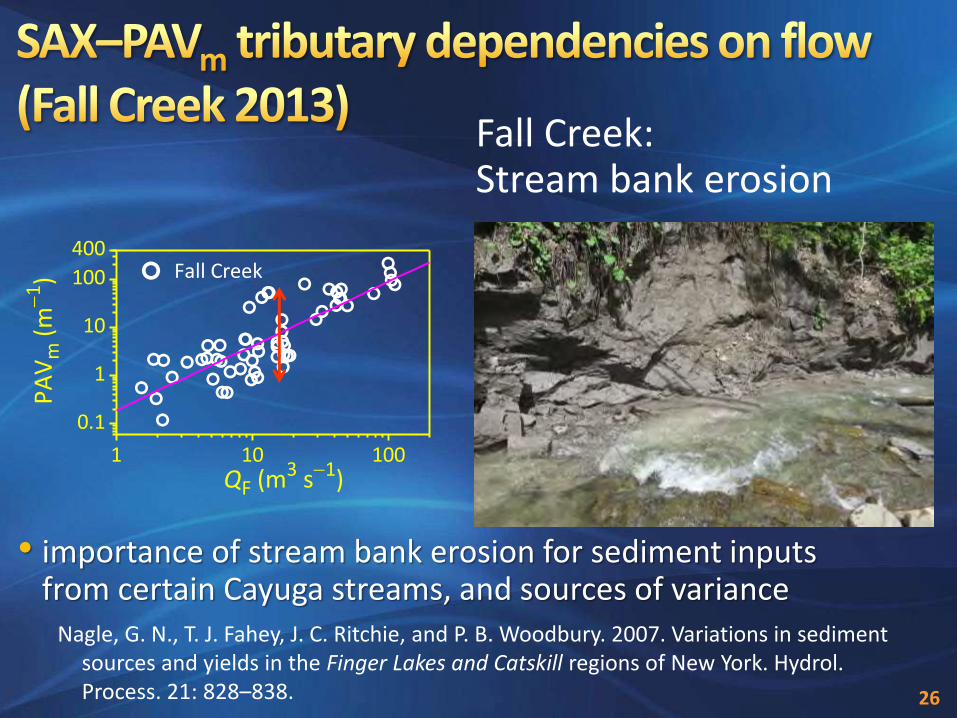
Fall Creek: Stream bank erosion
26
Nagle, G. N., T. J. Fahey, J. C. Ritchie, and P. B. Woodbury. 2007. Variations in sediment sources and yields in the Finger Lakes and Catskill regions of New York. Hydrol. Process. 21: 828–838.
1 10 100
0.1
1
10
100
400
QF (m3 s-1)
PA
Vm
(m
-1)
Fall Creek
• importance of stream bank erosion for sediment inputs from certain Cayuga streams, and sources of variance

tributary impacts concentrated on shelf during runoff events
great spatial PAVm gradient along the lake’s major axis observed
27

Table 4. Minerogenic particle population characteristics, in terms of contributions to PAVm by geochemical and size classes, for Cayuga Lake tributaries and lake sites in 2013 (Peng and Effler 2015)
Stream or
Lake Site
Avg.
PAVm % Contributions by Particle Types to PAVm
% Contributions by
Size (µm) Classes
(m–1) Clay Quartz Calcite Ca-agg Si-rich Misc. <2 2–5.6 5.6–11 11
Fall Creek 23.94 86.5 6.9 0.7 3.9 0.4 1.7 8.3 25.63 30.63 35.5
Cayuga Inlet Cr. 129.3 83.8 7.7 1.0 4.9 0.6 2.0 12.0 29.53 30.7 27.8
Salmon Creek 19.68 82.2 5.7 1.6 7.7 0.6 2.3 9.6 22.5 26.6 41.3
Six Mile Creek
26.30 84.8 6.1 1.1 5.4 0.6 2.1 16.8 41.7 25.4 16.1
Site 1 2.74 83.2 6.6 2.3 4.2 0.6 3.2 17.3 42.6 27.7 12.4
Site 2 0.35 82.5 6.4 2.9 4.1 0.5 3.7 18.8 44.0 28.2 9.0
Site 3 0.071 74.6 5.4 8.7 6.1 0.5 4.7 18.5 44.6 27.5 9.4
Site 5 0.053 70.7 5.6 11.9 6.9 0.5 4.5 18.0 42.6 27.2 12.3
Site 7 0.058 67.1 5.5 10.2 9.8 0.8 6.6 19.2 43.4 28.0 9.4
28
Key features: 1. PAVm gradient: southern tribs→shelf→pelagic 2. clay dominance, calcite secondary for pelagic 3. shift in PSD from tribs to lake—larger to smaller particles

29
0.0
0.2
0.4
100
101
102
0
5
1080
0
100
200
PA
Vm
(m
-1)
Site 3
OctSepAugJulMay JunApr
QF
(m3 s
-1)
2013
Site 1
Fall Creek
3+
0
10
20
(b) Site 1
(c) Site 2
(d) pelagic
<
0.1 1 10
%
0
2
4
6
< +
(a) Fall Cr.
%
0
4
8
PAVm (m
-1)0.01 0.1 1
0
10
20
• runoff event driven dynamics
• the general south–north
gradient
%
1. system-specific issues; limitations of conventional approach
2. SAX: technical details, advantages, and applications
3. Cayuga Lake 2013 water quality studies a. tributaries
b. lake dynamics
c. assessments of water quality impacts
4. model framework and summary
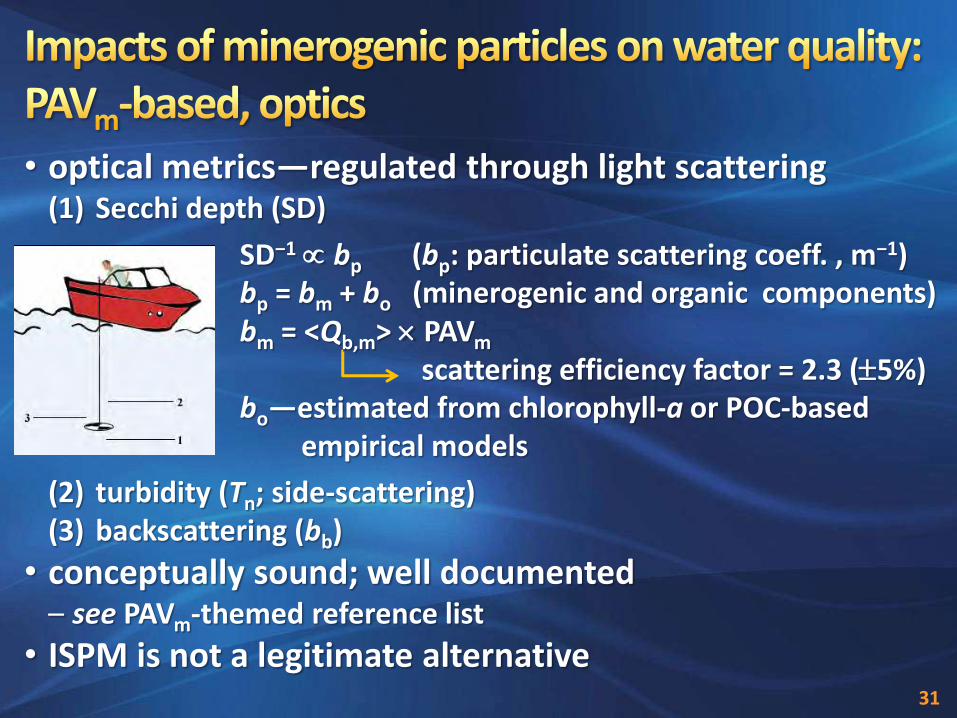
• optical metrics—regulated through light scattering (1) Secchi depth (SD)
SD−1 bp (bp: particulate scattering coeff. , m−1) bp = bm + bo (minerogenic and organic components) bm = <Qb,m> PAVm
scattering efficiency factor = 2.3 (5%) bo—estimated from chlorophyll-a or POC-based
empirical models (2) turbidity (Tn; side-scattering) (3) backscattering (bb)
• conceptually sound; well documented – see PAVm-themed reference list
• ISPM is not a legitimate alternative
31
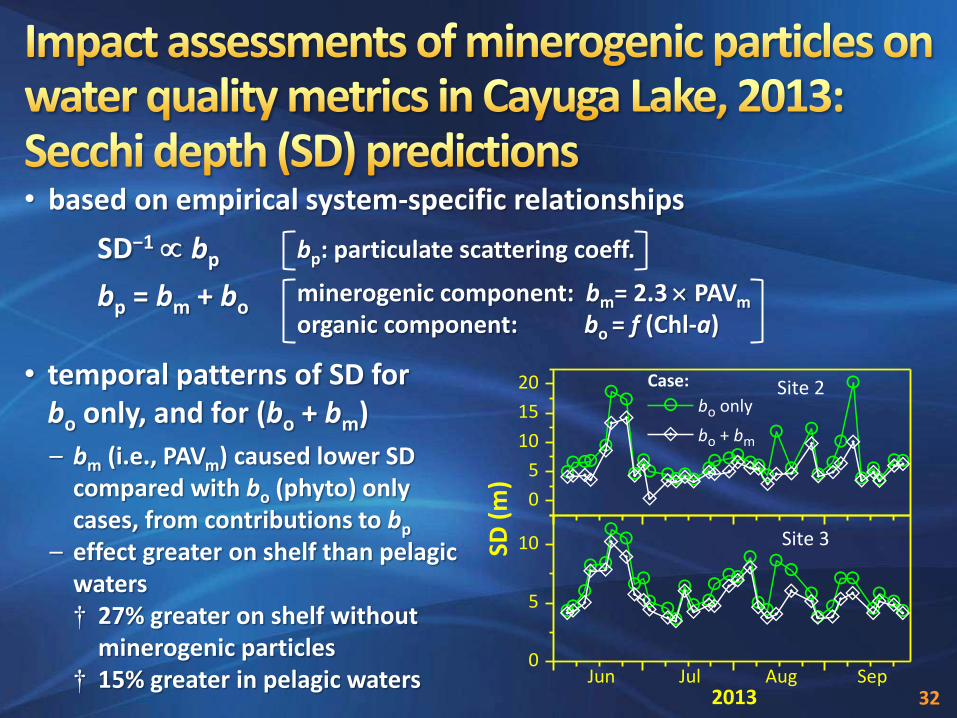
• based on empirical system-specific relationships
• temporal patterns of SD for bo only, and for (bo + bm)
SD−1 bp bp: particulate scattering coeff.
bp = bm + bo minerogenic component: bm= 2.3 PAVm
organic component: bo = f (Chl-a)
– bm (i.e., PAVm) caused lower SD compared with bo (phyto) only cases, from contributions to bp
– effect greater on shelf than pelagic waters † 27% greater on shelf without
minerogenic particles † 15% greater in pelagic waters
0
5
10
15
20
Jun Jul Aug Sep0
5
10
SD (
m)
Case:
bo only
bo + bm
Site 2
2013
Site 3
32
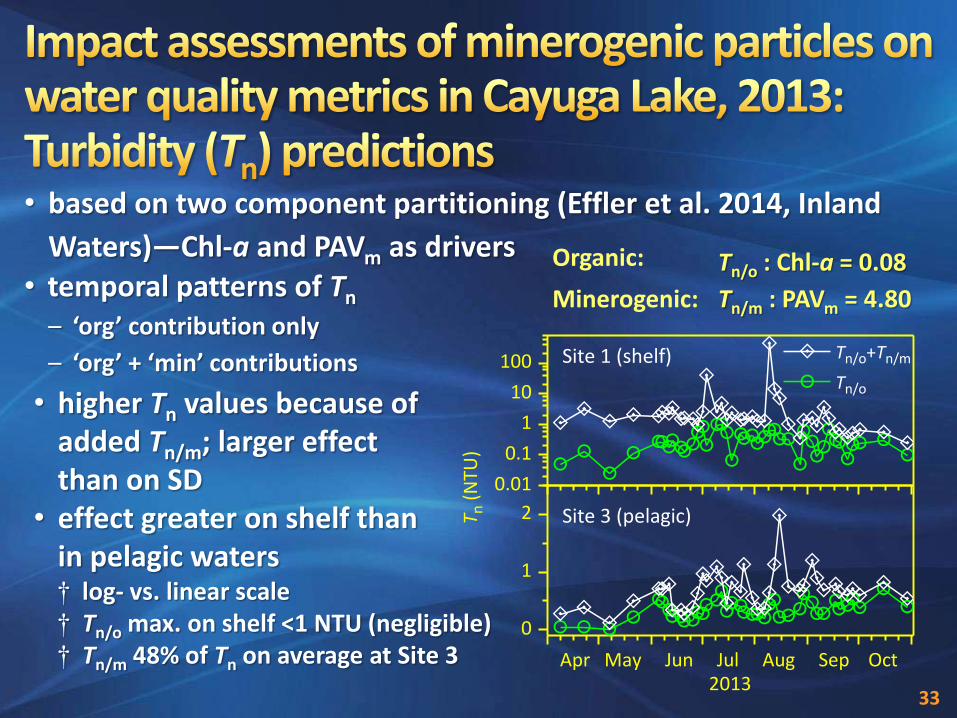
• based on two component partitioning (Effler et al. 2014, Inland
Waters)—Chl-a and PAVm as drivers • temporal patterns of Tn
– ‘org’ contribution only
– ‘org’ + ‘min’ contributions
Organic: Tn/o : Chl-a = 0.08
Minerogenic: Tn/m : PAVm = 4.80
• higher Tn values because of added Tn/m; larger effect than on SD
• effect greater on shelf than in pelagic waters † log- vs. linear scale † Tn/o max. on shelf <1 NTU (negligible) † Tn/m 48% of Tn on average at Site 3
33
0.01
0.1
1
10
100
0
1
2
Tn (
NTU
)
Tn/o+Tn/m
Tn/o
Site 1 (shelf)
Site 3 (pelagic)
Apr May Jun Jul Aug Sep Oct
2013
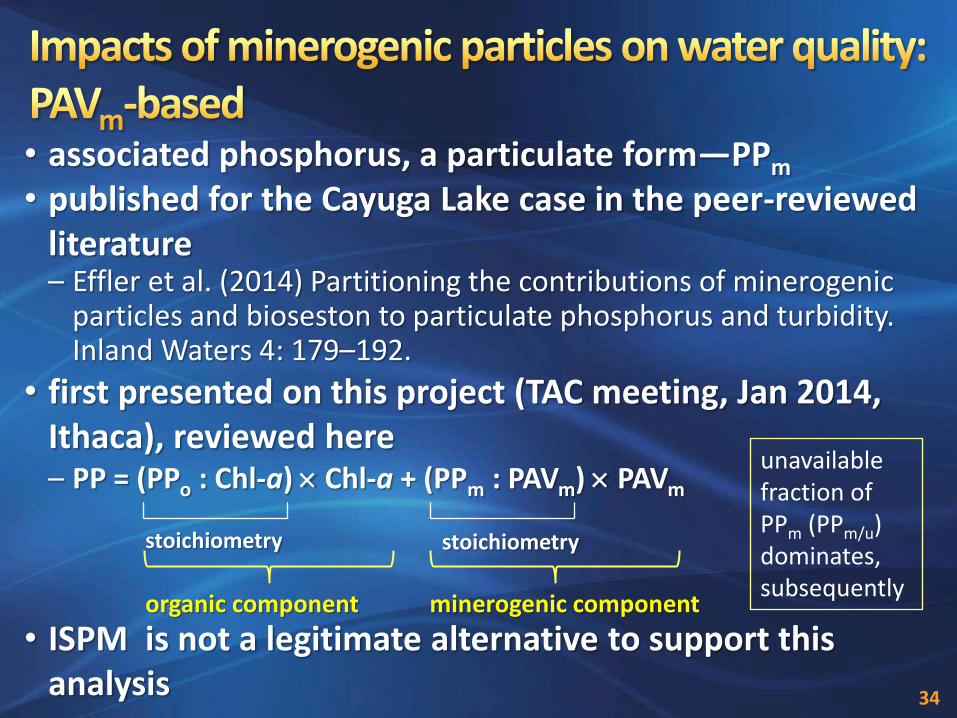
• associated phosphorus, a particulate form—PPm • published for the Cayuga Lake case in the peer-reviewed
literature – Effler et al. (2014) Partitioning the contributions of minerogenic
particles and bioseston to particulate phosphorus and turbidity. Inland Waters 4: 179–192.
• first presented on this project (TAC meeting, Jan 2014, Ithaca), reviewed here – PP = (PPo : Chl-a) Chl-a + (PPm : PAVm) PAVm
• ISPM is not a legitimate alternative to support this analysis
stoichiometry stoichiometry
organic component minerogenic component
34
unavailable fraction of PPm (PPm/u) dominates, subsequently

• based on empirical system-specific model of Effler et al. (2014); paired measurements of PP, PAVm, and Chl-a
PP = (PPo : Chl-a) Chl-a + (PPm : PAVm) PAVm
—PPm and PPo are the minerogenic and organic (phyto) particle components
• summer avg. TP (and PP) concentrations partitioned
– 20 g/L NYS guidance value – higher PPm concentrations primarily
cause of higher shelf TP levels
– negative implications for listing and application of guidance value
35
0
10
20
30
40
pelagicshelf
8.53
6.03
13.25
6.07 4.34
P (
g
L-1)
PPm
PPo
TDP
TP limit
15.88
6.10
0.73
6.47
shelf
1. system-specific issues; limitations of conventional approach
2. SAX: technical details, advantages, and applications
3. Cayuga Lake 2013 water quality studies a. tributaries
b. lake dynamics
c. assessments of water quality impacts
4. model framework and summary
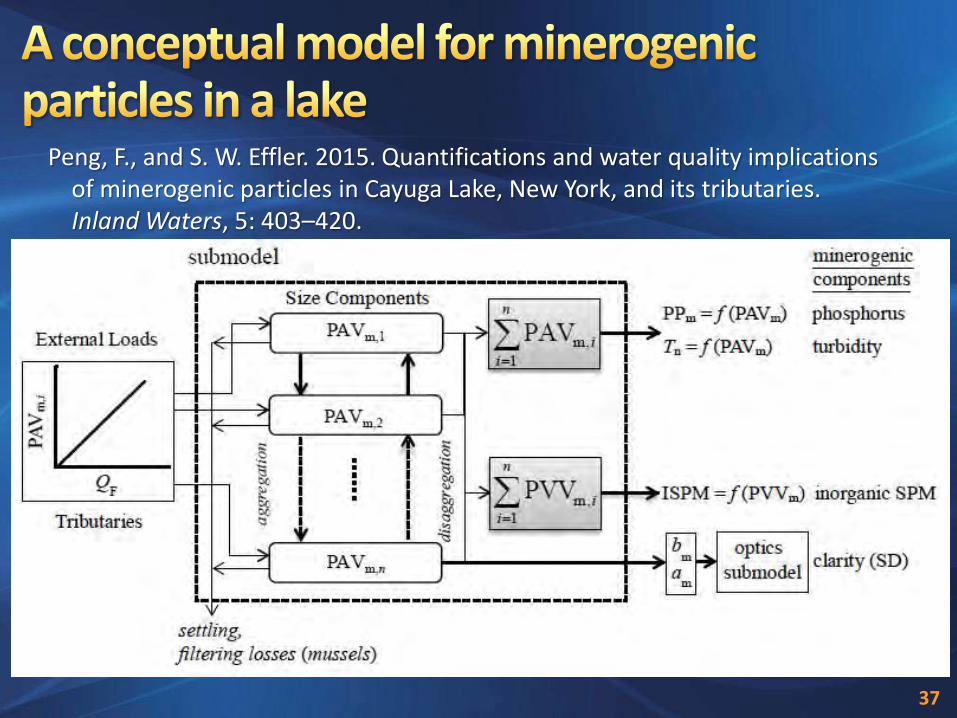
Peng, F., and S. W. Effler. 2015. Quantifications and water quality implications of minerogenic particles in Cayuga Lake, New York, and its tributaries. Inland Waters, 5: 403–420.
37
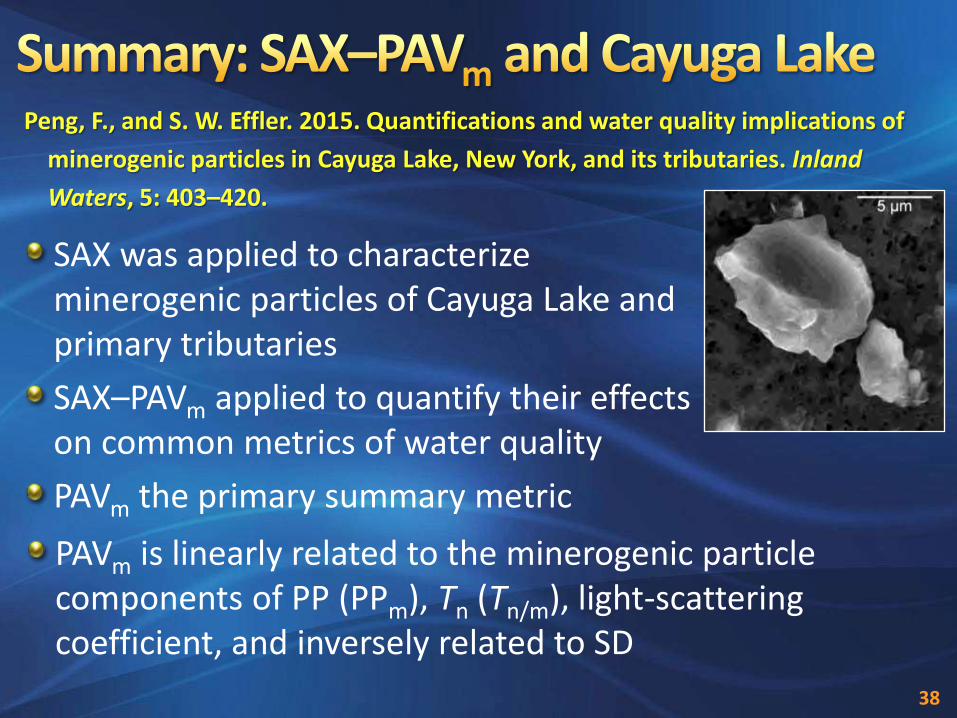
SAX was applied to characterize minerogenic particles of Cayuga Lake and primary tributaries
SAX–PAVm applied to quantify their effects on common metrics of water quality
PAVm the primary summary metric
Peng, F., and S. W. Effler. 2015. Quantifications and water quality implications of
minerogenic particles in Cayuga Lake, New York, and its tributaries. Inland
Waters, 5: 403–420.
PAVm is linearly related to the minerogenic particle components of PP (PPm), Tn (Tn/m), light-scattering coefficient, and inversely related to SD
38
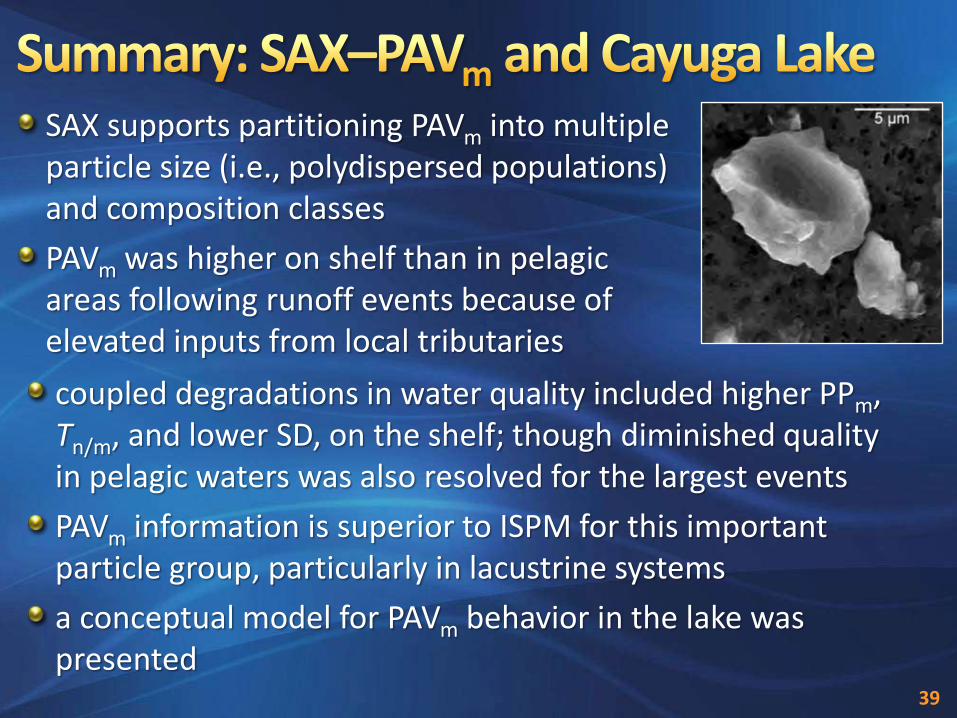
SAX supports partitioning PAVm into multiple particle size (i.e., polydispersed populations) and composition classes
PAVm was higher on shelf than in pelagic areas following runoff events because of elevated inputs from local tributaries
coupled degradations in water quality included higher PPm, Tn/m, and lower SD, on the shelf; though diminished quality in pelagic waters was also resolved for the largest events
PAVm information is superior to ISPM for this important particle group, particularly in lacustrine systems
a conceptual model for PAVm behavior in the lake was presented
39

—PAVm based Gelda, Effler, Prestigiacomo, Peng, and Watkins. 2015b. “Simulation of
minerogenic particle populations in time and space in Cayuga Lake, New York, in response to runoff events”, submitted to Inland Waters
40


![Finale 2003 - [Jesus Cristo.MUS] · Sax Soprano (Bb) I Sax Alto (Eb) III Sax Alto (Eb) II Sax Tenor (Bb) IV Sax Tenor (Bb) Sax Barítono ( Eb) I Trompete (Bb) II Trompete (Bb) III](https://img.pdfslide.net/doc/110x75/5b8b495409d3f21d498b5c73/finale-2003-jesus-sax-soprano-bb-i-sax-alto-eb-iii-sax-alto-eb-ii.jpg)