Embed Size (px)
Citation preview
—SAX and a lake model
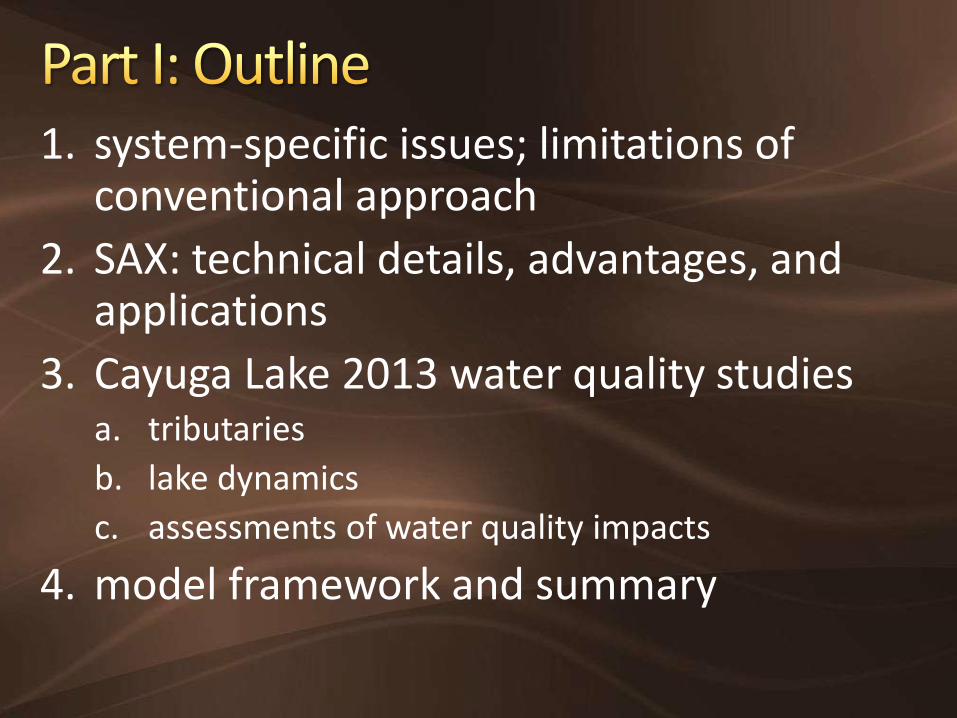
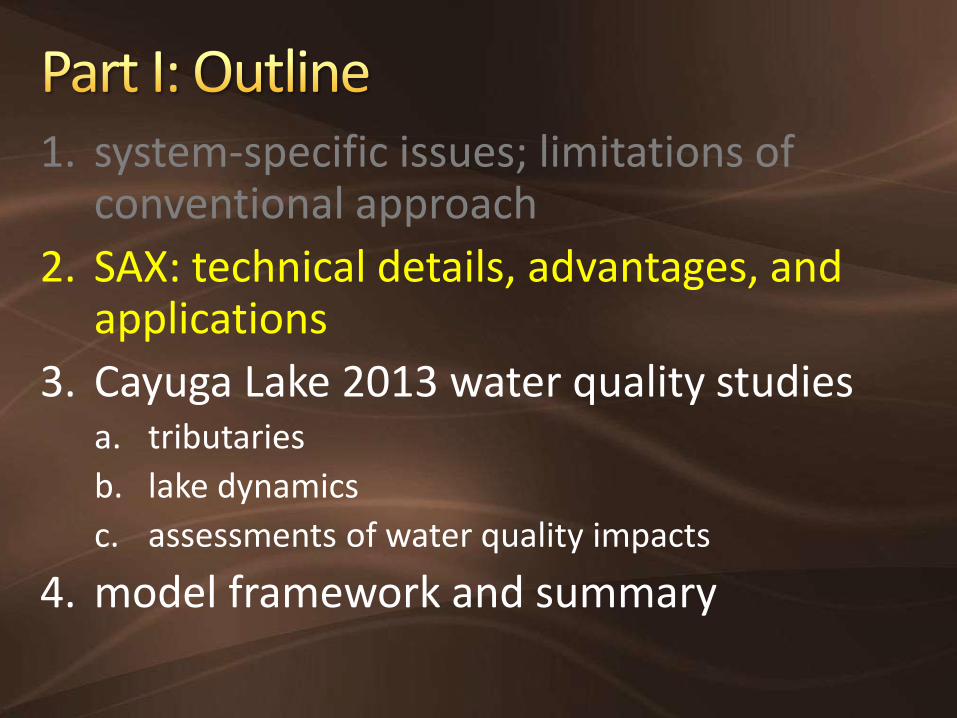
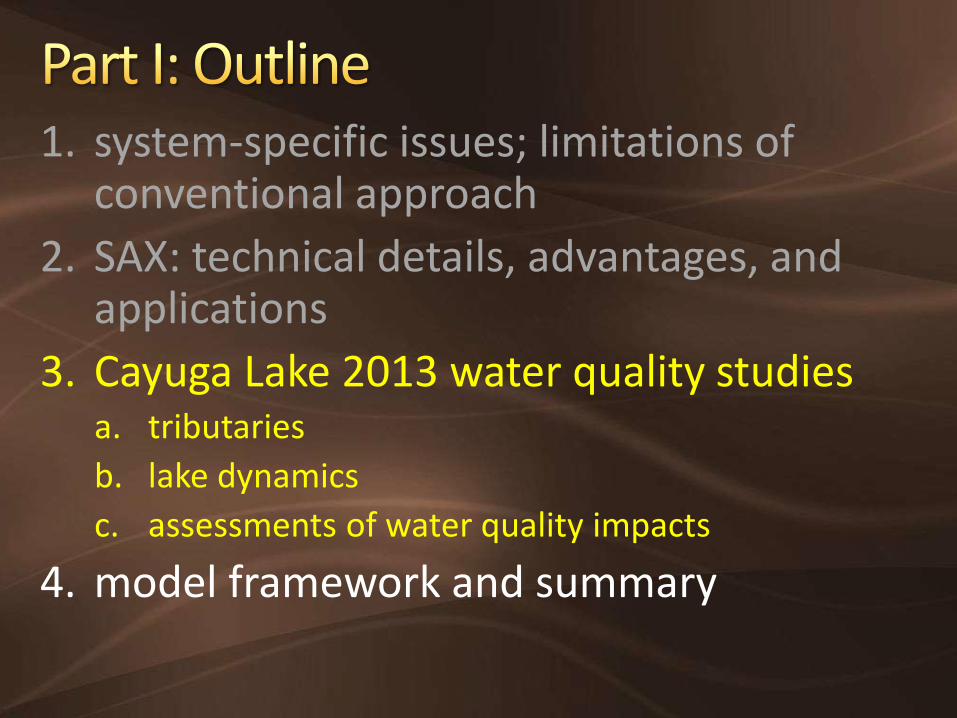
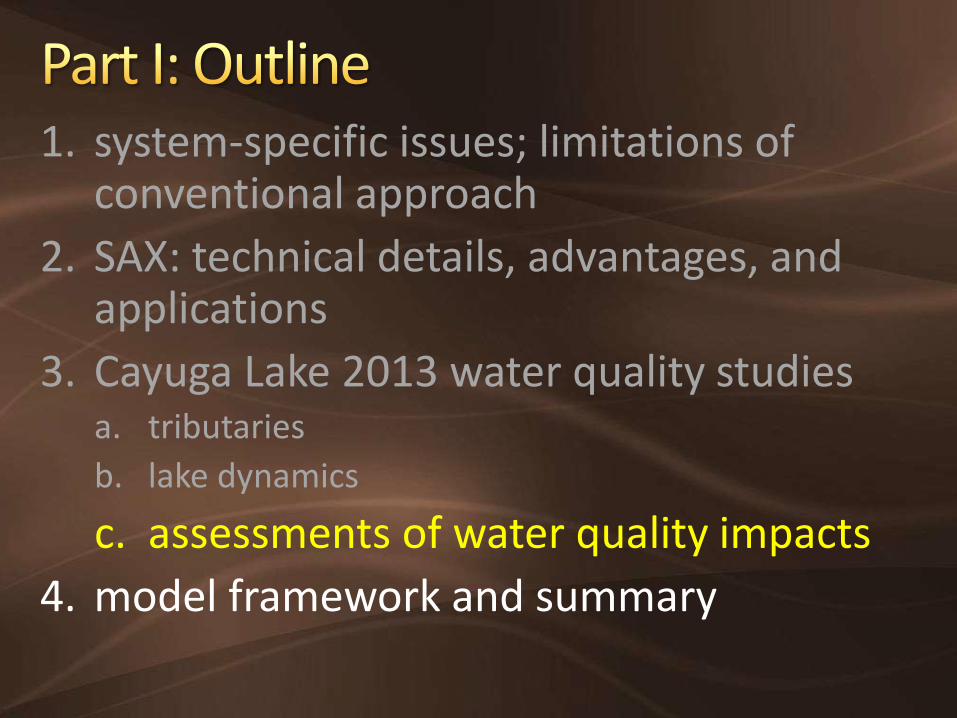
1. system-specific issues; limitations of conventional approach
2. SAX: technical details, advantages, and applications
3. Cayuga Lake 2013 water quality studies a. tributaries
b. lake dynamics
c. assessments of water quality impacts
4. model framework and summary
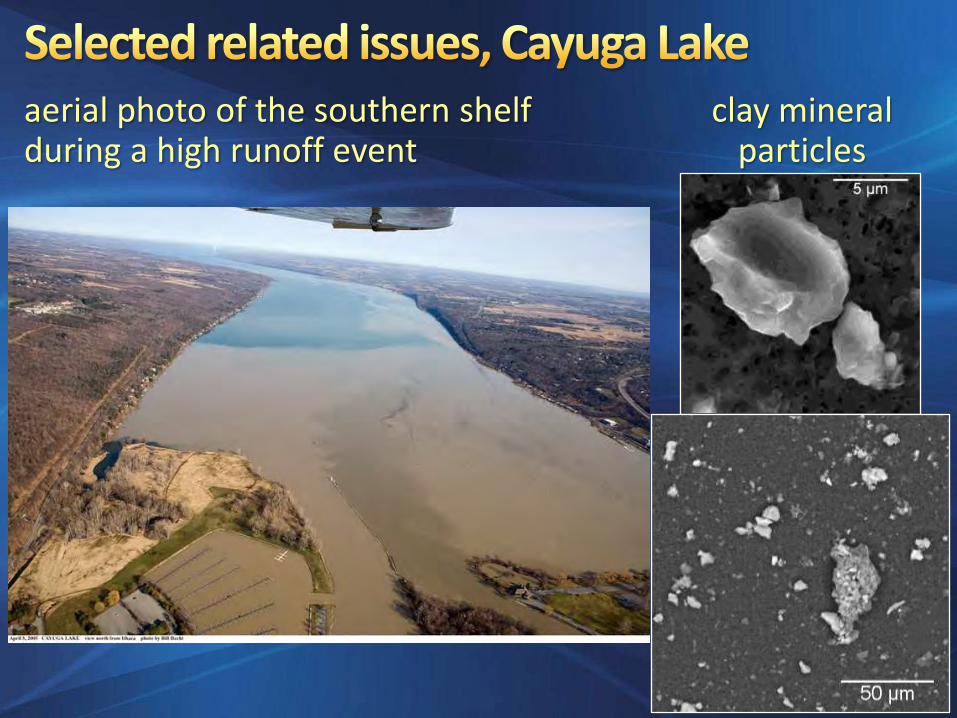
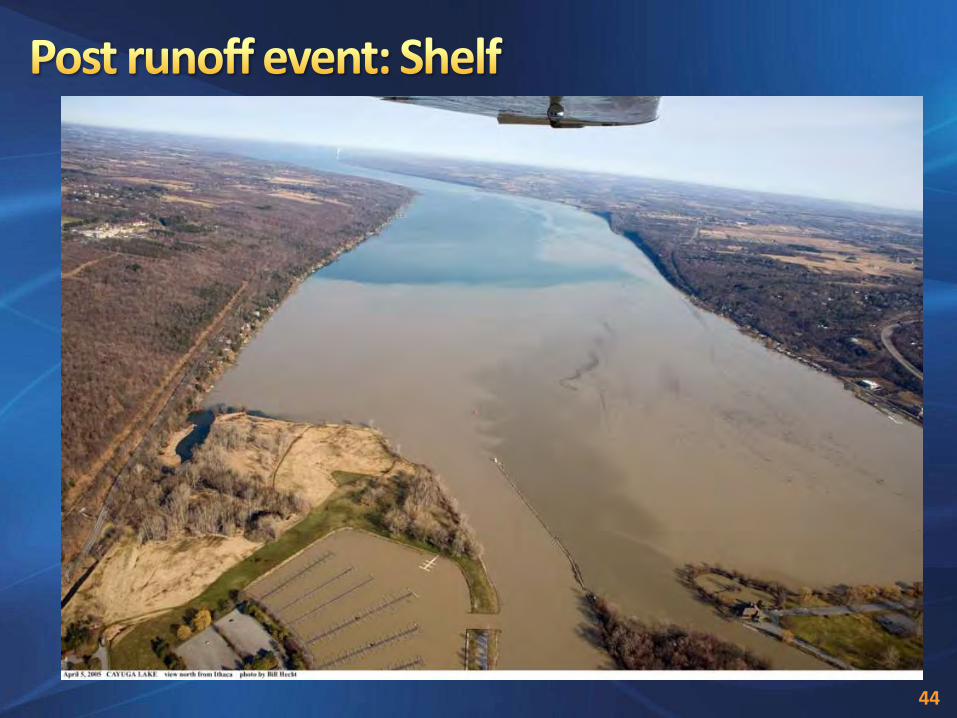
aerial photo of the southern shelf during a high runoff event
clay mineral particles

stream bank erosion

importance transport, cycling, and apportionment of forms of nutrients and contaminants levels of light scattering and absorption and thereby optical
metrics of water quality (optics sub-model) and remote sensing signal (NASA projects)
metabolic activity and composition of biological communities net sediment accumulation
origins terrigenous (allochthonous, particularly runoff events) resuspension (internal) autochthonous (internal; CaCO3 precipitation)
5
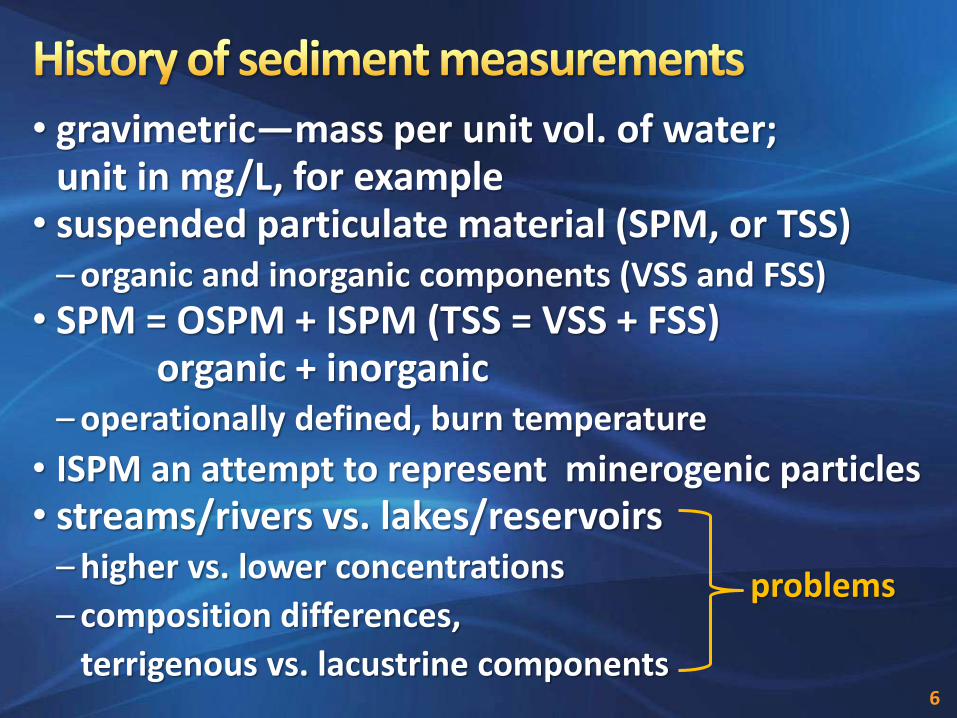
• gravimetric—mass per unit vol. of water; unit in mg/L, for example
• suspended particulate material (SPM, or TSS) – organic and inorganic components (VSS and FSS)
• SPM = OSPM + ISPM (TSS = VSS + FSS) organic + inorganic
– operationally defined, burn temperature
• ISPM an attempt to represent minerogenic particles • streams/rivers vs. lakes/reservoirs
– higher vs. lower concentrations
– composition differences,
terrigenous vs. lacustrine components
6
problems
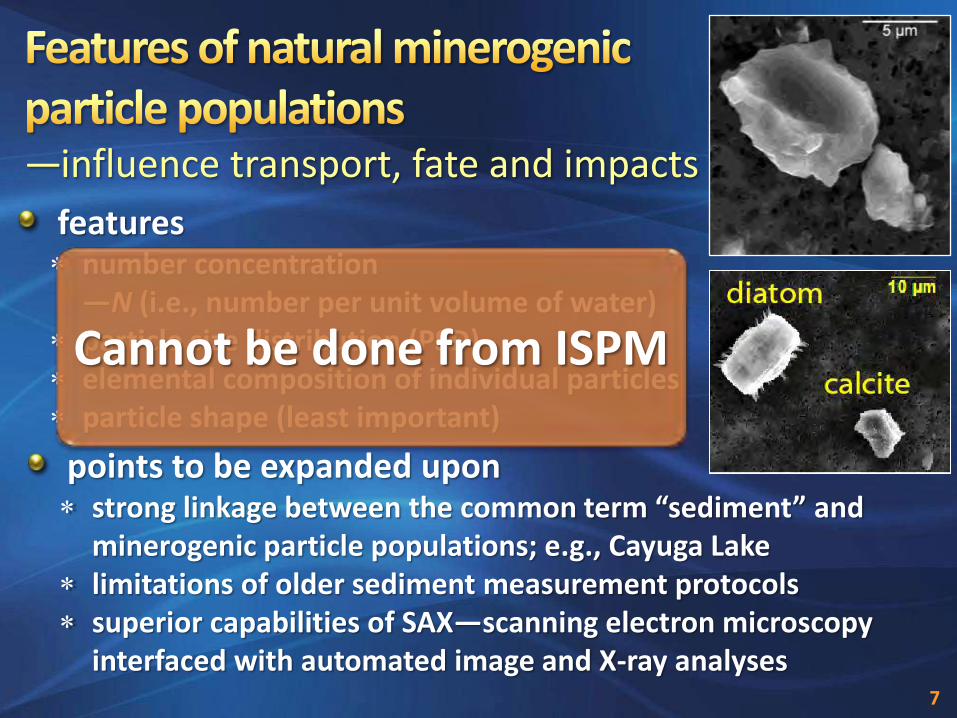
features number concentration
—N (i.e., number per unit volume of water) particle size distribution (PSD) elemental composition of individual particles particle shape (least important)
—influence transport, fate and impacts
points to be expanded upon strong linkage between the common term “sediment” and
minerogenic particle populations; e.g., Cayuga Lake limitations of older sediment measurement protocols superior capabilities of SAX—scanning electron microscopy
interfaced with automated image and X-ray analyses 7
Cannot be done from ISPM
1. system-specific issues; limitations of conventional approach
2. SAX: technical details, advantages, and applications
3. Cayuga Lake 2013 water quality studies a. tributaries
b. lake dynamics
c. assessments of water quality impacts
4. model framework and summary
0 1 2 3 4
0
1000
2000
3000
4000
AlK
X-r
ay C
ou
nts
Energy (keV)
Si
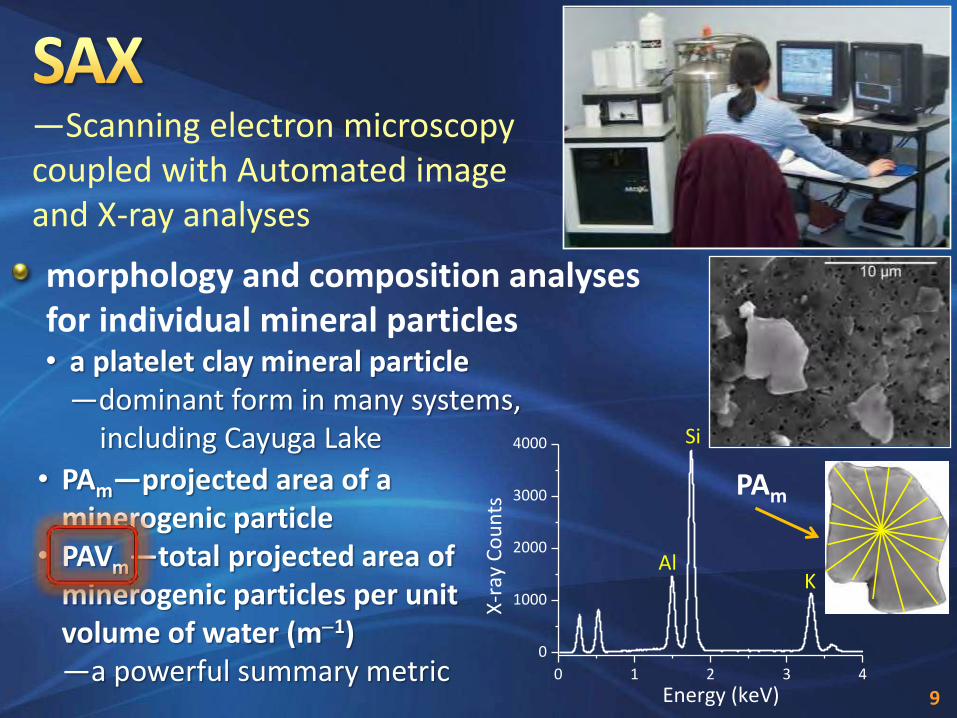
—Scanning electron microscopy coupled with Automated image and X-ray analyses
• PAm—projected area of a minerogenic particle
• PAVm—total projected area of minerogenic particles per unit volume of water (m-1) —a powerful summary metric
PAm
morphology and composition analyses for individual mineral particles • a platelet clay mineral particle
—dominant form in many systems, including Cayuga Lake
9
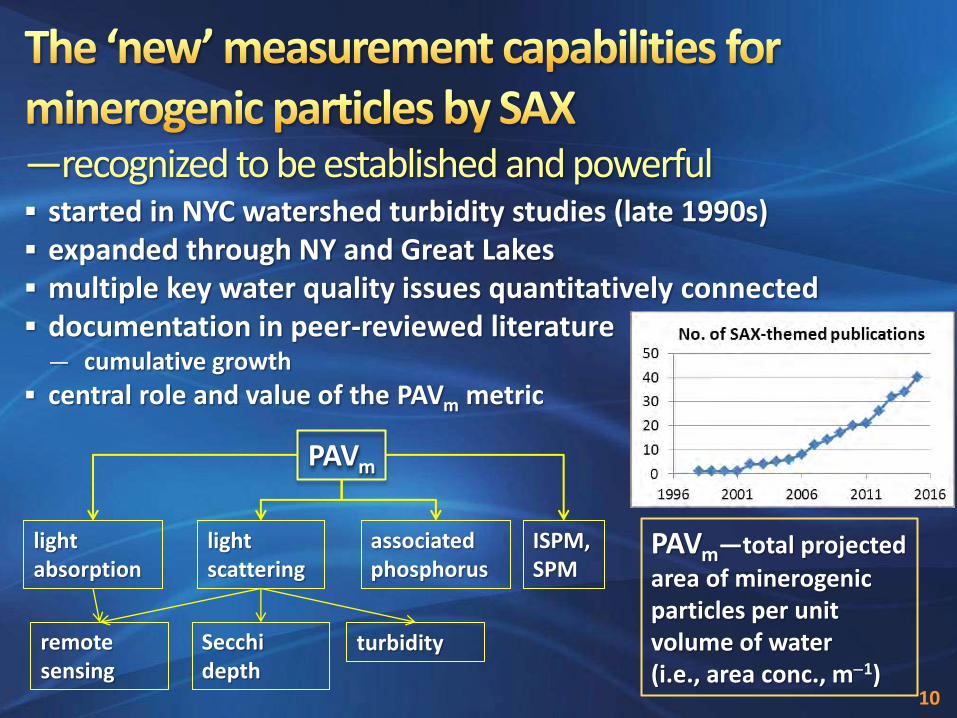
started in NYC watershed turbidity studies (late 1990s) expanded through NY and Great Lakes multiple key water quality issues quantitatively connected documentation in peer-reviewed literature
— cumulative growth
central role and value of the PAVm metric
PAVm
light scattering
light absorption
associated phosphorus
ISPM, SPM
remote sensing
Secchi depth
turbidity
—recognized to be established and powerful
PAVm—total projected
area of minerogenic particles per unit volume of water (i.e., area conc., m-1)
10
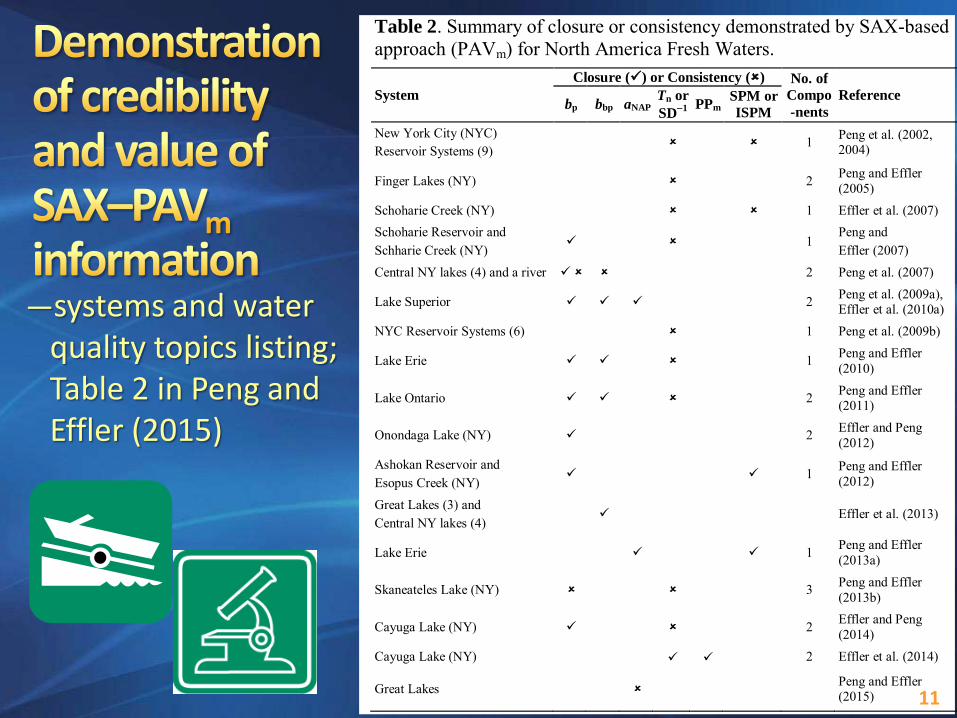
—systems and water quality topics listing; Table 2 in Peng and Effler (2015)
Table 2. Summary of closure or consistency demonstrated by SAX-based approach (PAVm) for North America Fresh Waters.
System
Closure () or Consistency () No. of
Compo
-nents
Reference bp bbp aNAP
Tn or
SD-1
PPm
SPM or
ISPM
New York City (NYC) Reservoir Systems (9)
1 Peng et al. (2002, 2004)
Finger Lakes (NY) 2 Peng and Effler (2005)
Schoharie Creek (NY) 1 Effler et al. (2007) Schoharie Reservoir and Schharie Creek (NY)
1 Peng and Effler (2007)
Central NY lakes (4) and a river 2 Peng et al. (2007)
Lake Superior 2 Peng et al. (2009a), Effler et al. (2010a)
NYC Reservoir Systems (6) 1 Peng et al. (2009b)
Lake Erie 1 Peng and Effler (2010)
Lake Ontario 2 Peng and Effler (2011)
Onondaga Lake (NY) 2 Effler and Peng (2012)
Ashokan Reservoir and Esopus Creek (NY)
1 Peng and Effler (2012)
Great Lakes (3) and Central NY lakes (4)
Effler et al. (2013)
Lake Erie 1 Peng and Effler (2013a)
Skaneateles Lake (NY) 3 Peng and Effler (2013b)
Cayuga Lake (NY) 2 Effler and Peng (2014)
Cayuga Lake (NY) 2 Effler et al. (2014)
Great Lakes Peng and Effler (2015)
11
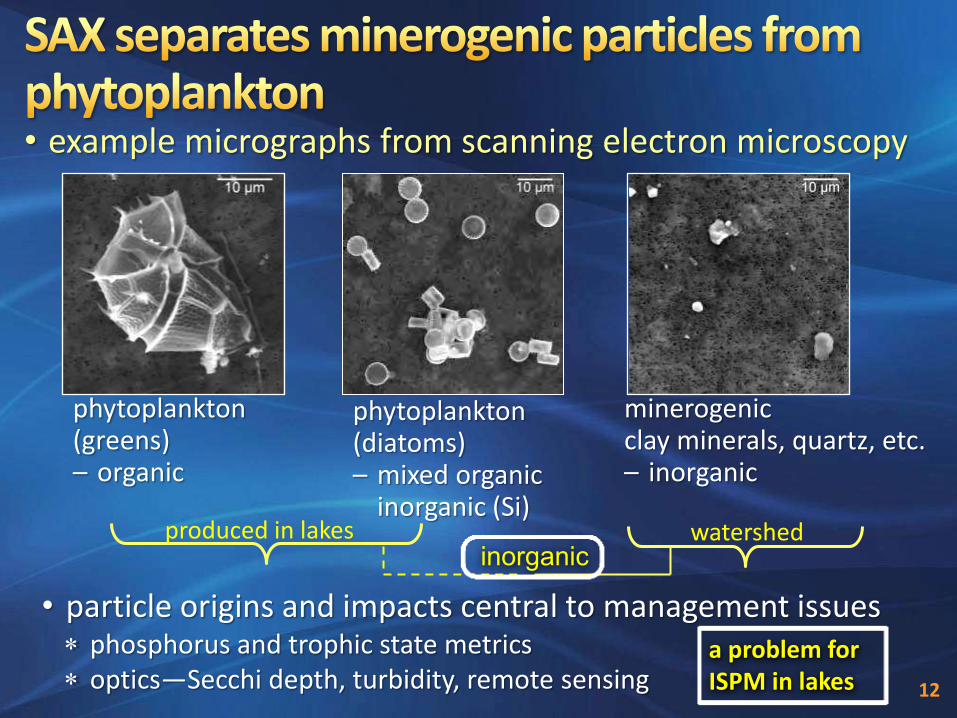
• example micrographs from scanning electron microscopy
• particle origins and impacts central to management issues phosphorus and trophic state metrics optics—Secchi depth, turbidity, remote sensing
phytoplankton (greens) – organic
phytoplankton (diatoms) – mixed organic
inorganic (Si) produced in lakes
minerogenic clay minerals, quartz, etc. – inorganic
watershed inorganic
12
a problem for ISPM in lakes
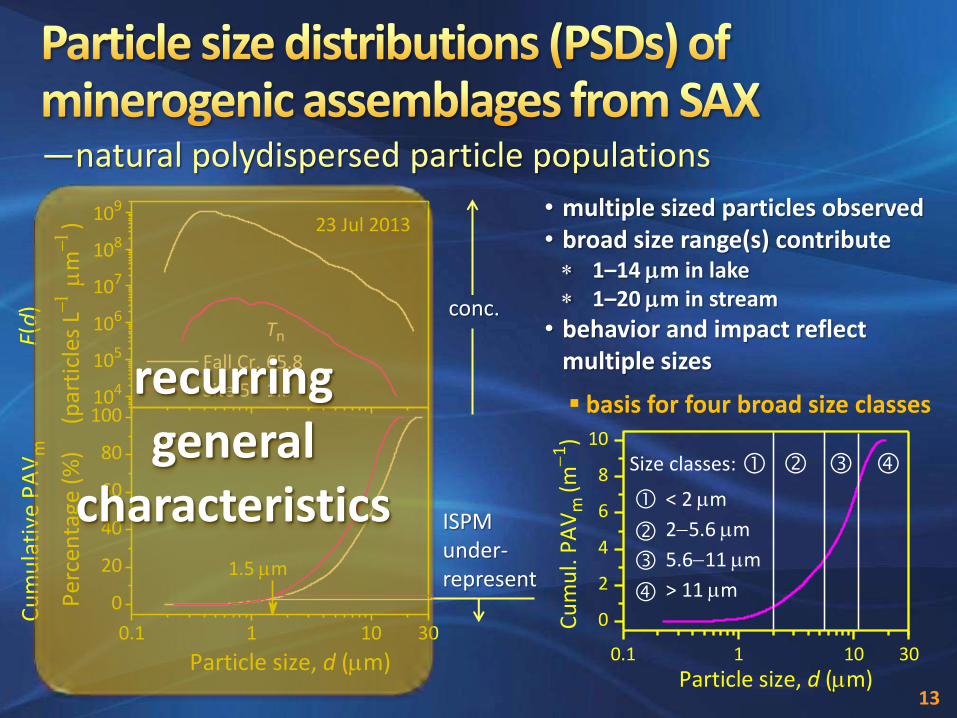
• multiple sized particles observed • broad size range(s) contribute
1–14 m in lake 1–20 m in stream
• behavior and impact reflect multiple sizes
—natural polydispersed particle populations
104
105
106
107
108
109
0.1 1 10 30
0
20
40
60
80
100
Tn
65.8
1.5
F(d
)
(par
ticl
es L
-
m-
)
Fall Cr.
Site 5
23 Jul 2013
Cu
mu
lati
ve P
AV
m
Per
cen
tage
(%
)
Particle size, d (m)
1.5 m
conc.
ISPM under-represent
13
0.1 1 10 30
0
2
4
6
8
10
Cu
mu
l. P
AV
m (m
-1)
Particle size, d (m)
Size classes:
< 2 m
2-5.6 m
5.6-11 m
> 11 m
basis for four broad size classes recurring general
characteristics
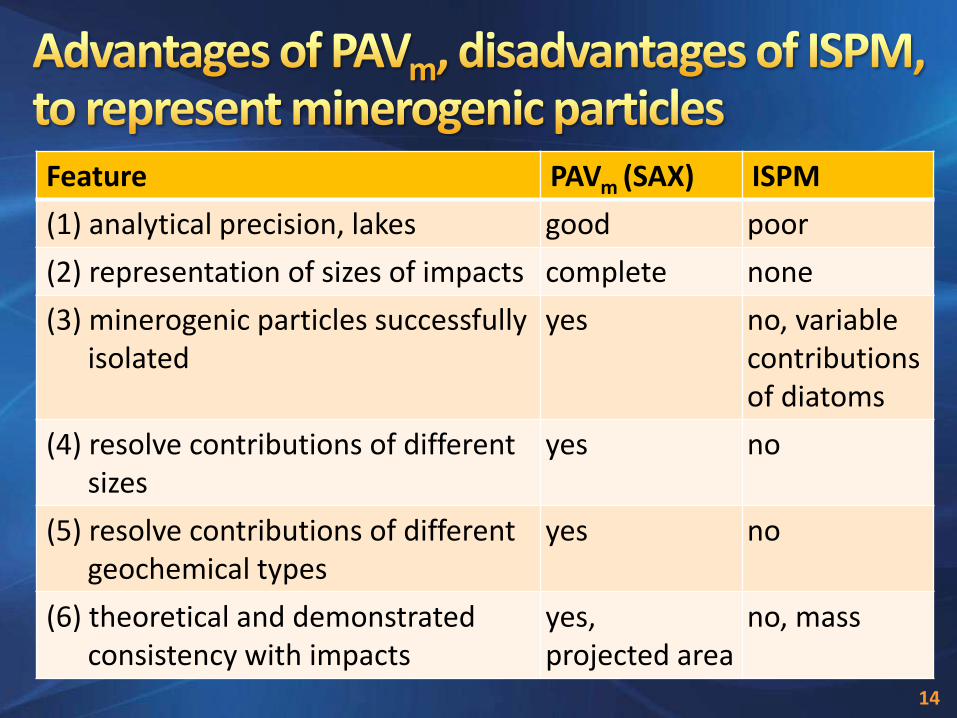
Feature PAVm (SAX) ISPM
(1) analytical precision, lakes good poor
(2) representation of sizes of impacts complete none
(3) minerogenic particles successfully isolated
yes no, variable contributions of diatoms
(4) resolve contributions of different sizes
yes no
(5) resolve contributions of different geochemical types
yes no
(6) theoretical and demonstrated consistency with impacts
yes, projected area
no, mass
14
1. system-specific issues; limitations of conventional approach
2. SAX: technical details, advantages, and applications
3. Cayuga Lake 2013 water quality studies a. tributaries
b. lake dynamics
c. assessments of water quality impacts
4. model framework and summary

• intensive sampling: lake and major tributaries
• >400 SAX samples
—phosphorus, clarity
16
• 350 SAX samples, 1999-2006
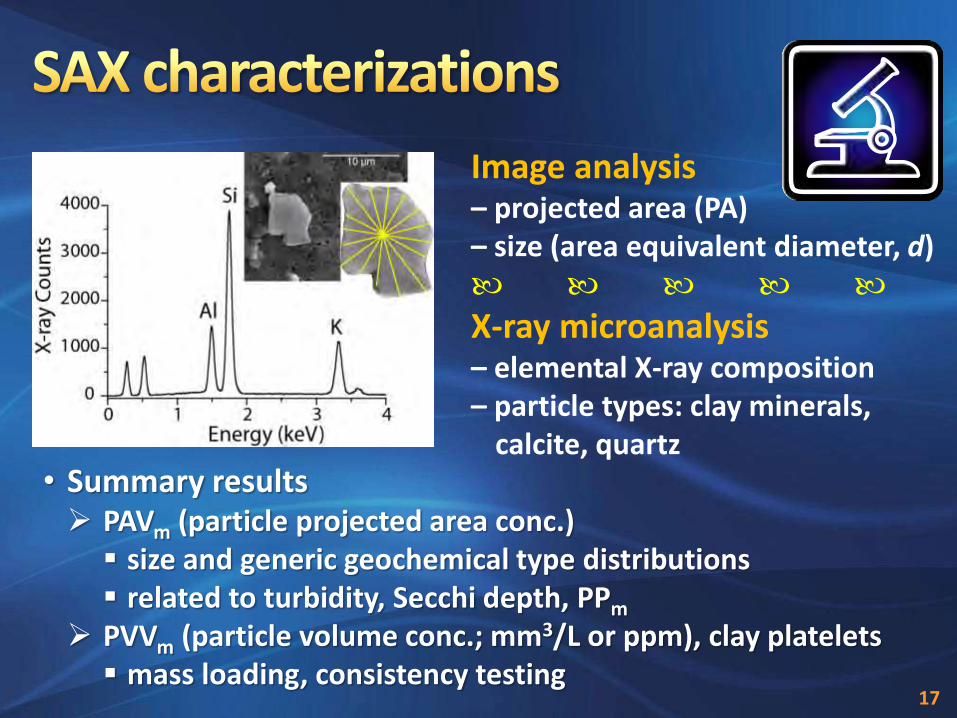
Image analysis – projected area (PA) – size (area equivalent diameter, d)
X-ray microanalysis – elemental X-ray composition – particle types: clay minerals,
calcite, quartz • Summary results PAVm (particle projected area conc.) size and generic geochemical type distributions related to turbidity, Secchi depth, PPm
PVVm (particle volume conc.; mm3/L or ppm), clay platelets mass loading, consistency testing
17
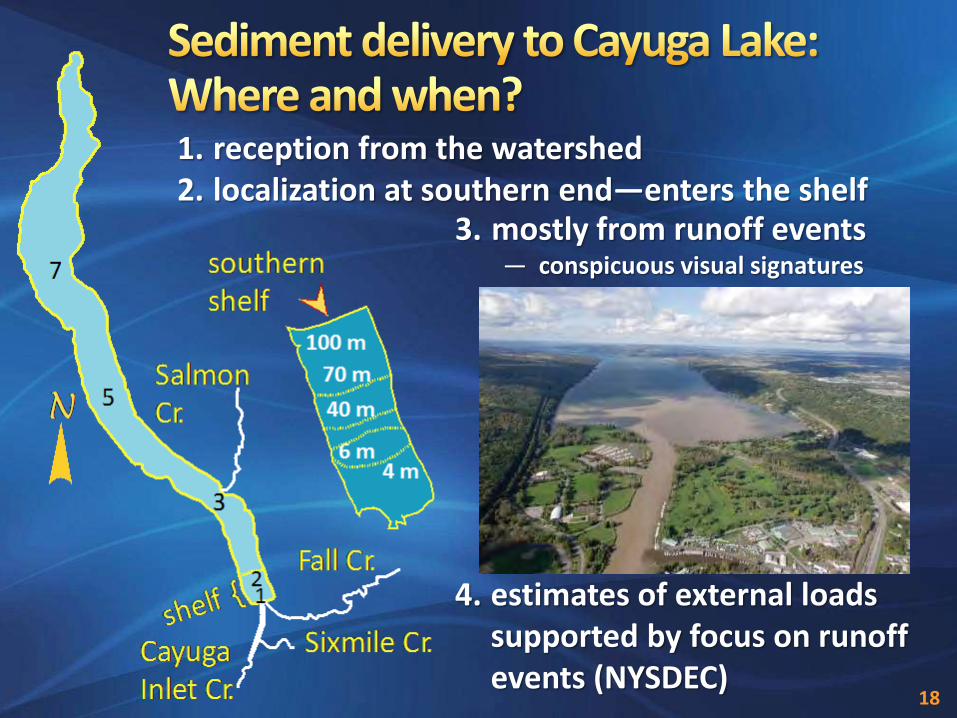
3. mostly from runoff events — conspicuous visual signatures
4. estimates of external loads supported by focus on runoff events (NYSDEC)
18
1. reception from the watershed 2. localization at southern end—enters the shelf

1. traditional gravimetric measurements • ISPM—mostly minerogenic • ISPM : SPM dominance, increasingly
as QF increased
2. SAX characterizations • composition and size
• clay minerals dominate PAVm
0 1 2 3 40
1000
2000
3000
4000
AlK
X-r
ay C
ou
nts
Energy (keV)
Si
19
0.7
0.8
0.9
1.0
1
10
100
1000
1 10 100
0.1
1
10
100
ISP
M/S
PM
R2 = 0.48
ISP
M (
mg
L-1) Fall Creek
R2 = 0.66
R2 = 0.66
QF (m3 s-1)
PA
Vm
(m
-1)
1 10 1000.7
0.8
0.9
1.0
1
10
100
1000
QF (m3 s-1)
ISP
M/S
PM
R2 = 0.48
ISP
M (
mg
L-1 ) Fall Creek
R2 = 0.66
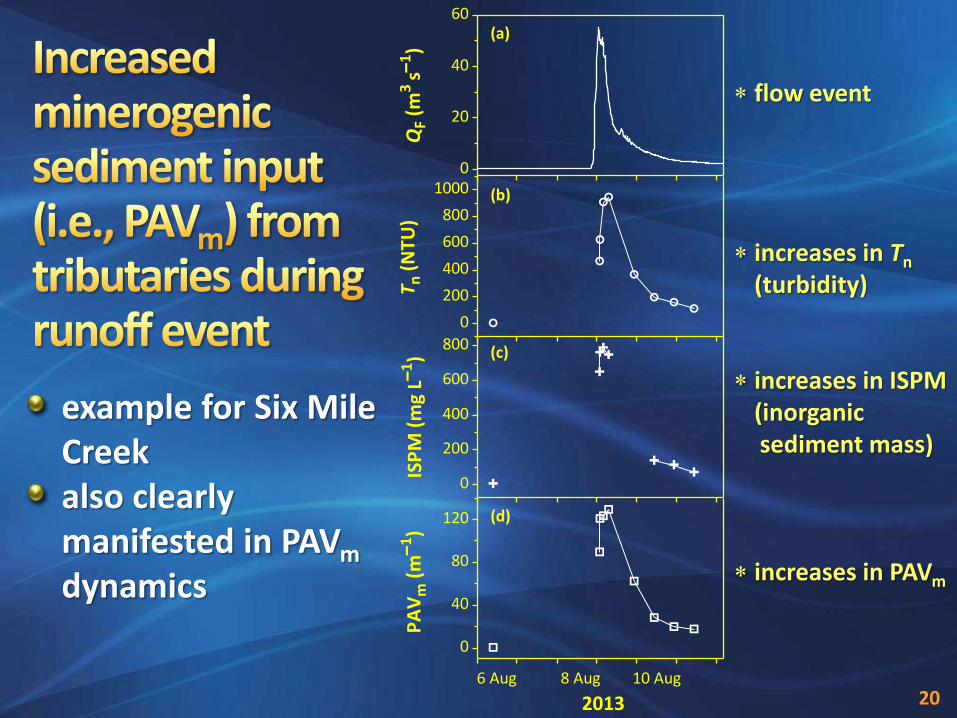
example for Six Mile Creek also clearly manifested in PAVm dynamics
flow event
increases in Tn (turbidity)
increases in ISPM (inorganic
sediment mass)
increases in PAVm
20
0
20
40
60
0
200
400
600
800
0
40
80
120
0
200
400
600
800
1000
QF
(m3
s-1)
(a)
6 Aug 8 Aug 10 Aug
2013
(c)
ISP
M (
mg
L-1)
(d)
PA
Vm
(m
-1)
(b)
T n (
NTU
)
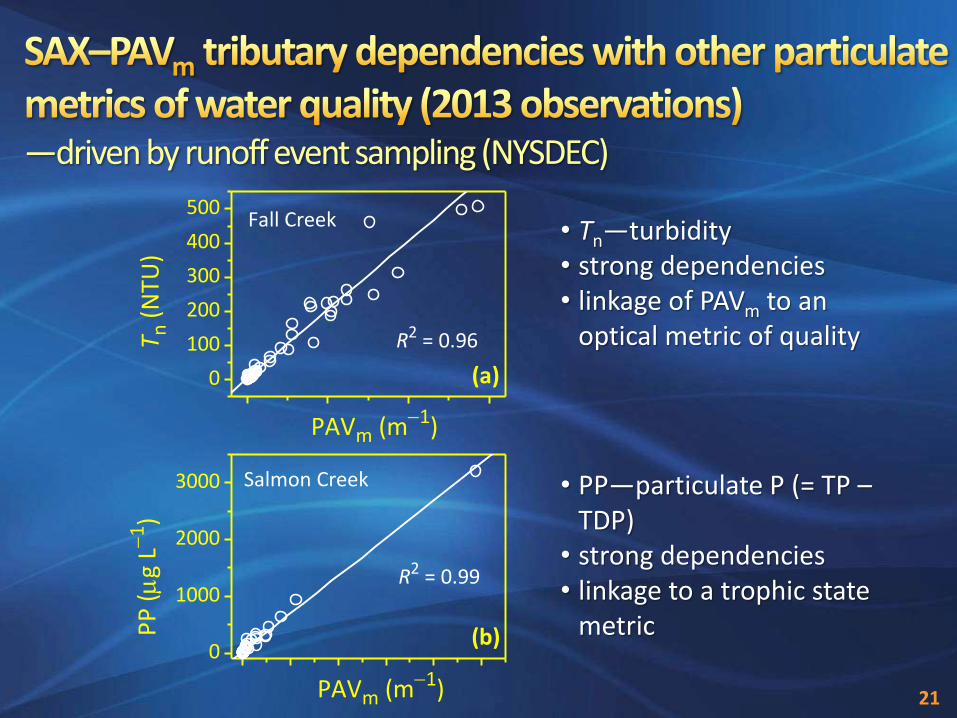
• Tn—turbidity • strong dependencies • linkage of PAVm to an
optical metric of quality
• PP—particulate P (= TP – TDP)
• strong dependencies • linkage to a trophic state
metric
—driven by runoff event sampling (NYSDEC)
21
0
100
200
300
400
500
0
1000
2000
3000
Fall Creek
(a)
PAVm (m-1)
Tn (
NTU
)
R2 = 0.96
Salmon Creek
(b)
PAVm (m-1)
PP
(
g L-
1 )
R2 = 0.99
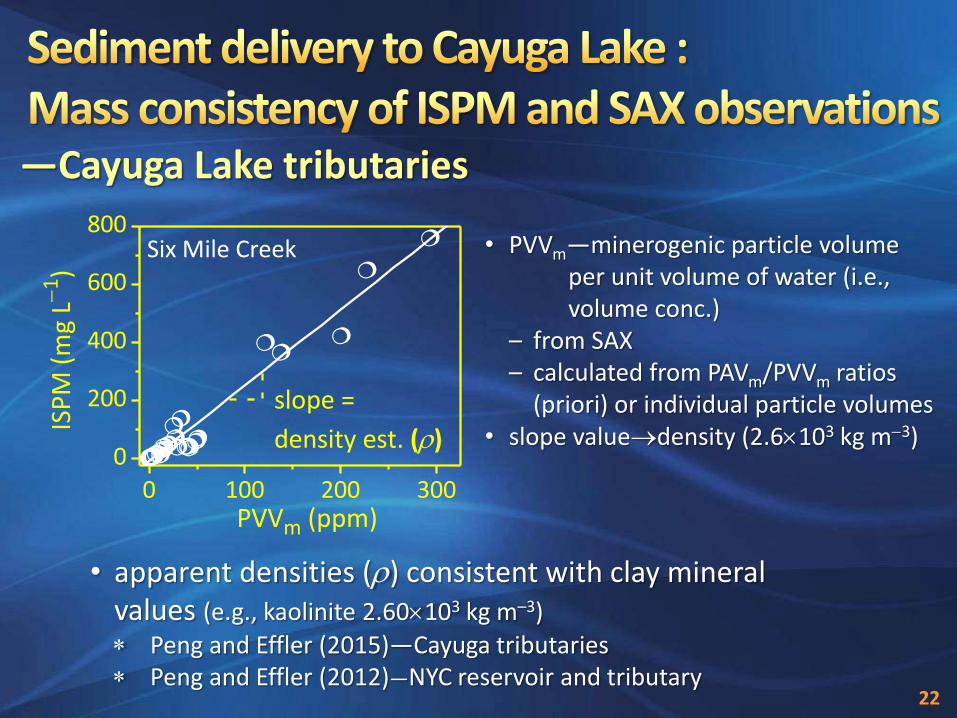
—Cayuga Lake tributaries
• apparent densities (r) consistent with clay mineral values (e.g., kaolinite 2.60103 kg m–3)
Peng and Effler (2015)—Cayuga tributaries Peng and Effler (2012)—NYC reservoir and tributary
• PVVm—minerogenic particle volume per unit volume of water (i.e., volume conc.)
– from SAX – calculated from PAVm/PVVm ratios
(priori) or individual particle volumes • slope valuedensity (2.6103 kg m-3)
22
0 100 200 300
0
200
400
600
800
PVVm (ppm)
ISP
M (
mg
L-1 )
slope =
density est. (r)
Six Mile Creek
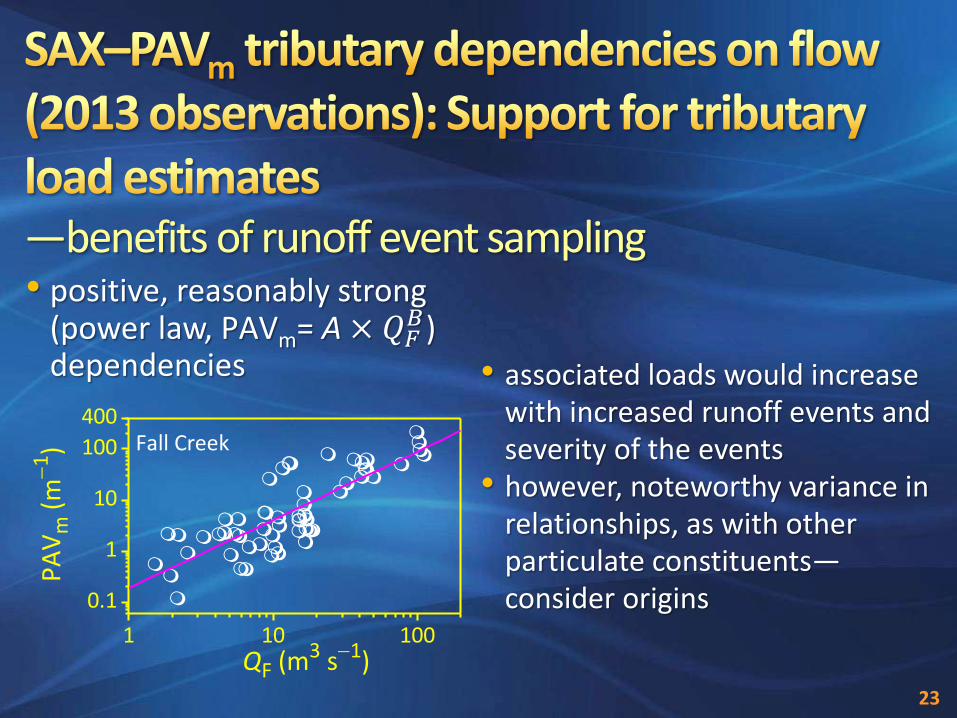
—benefits of runoff event sampling
• associated loads would increase with increased runoff events and severity of the events
• however, noteworthy variance in relationships, as with other particulate constituents—consider origins
23
1 10 100
0.1
1
10
100
400
QF (m3 s-1)
PA
Vm
(m
-1)
Fall Creek
• positive, reasonably strong (power law, PAVm= A × 𝑄𝐹
𝐵) dependencies
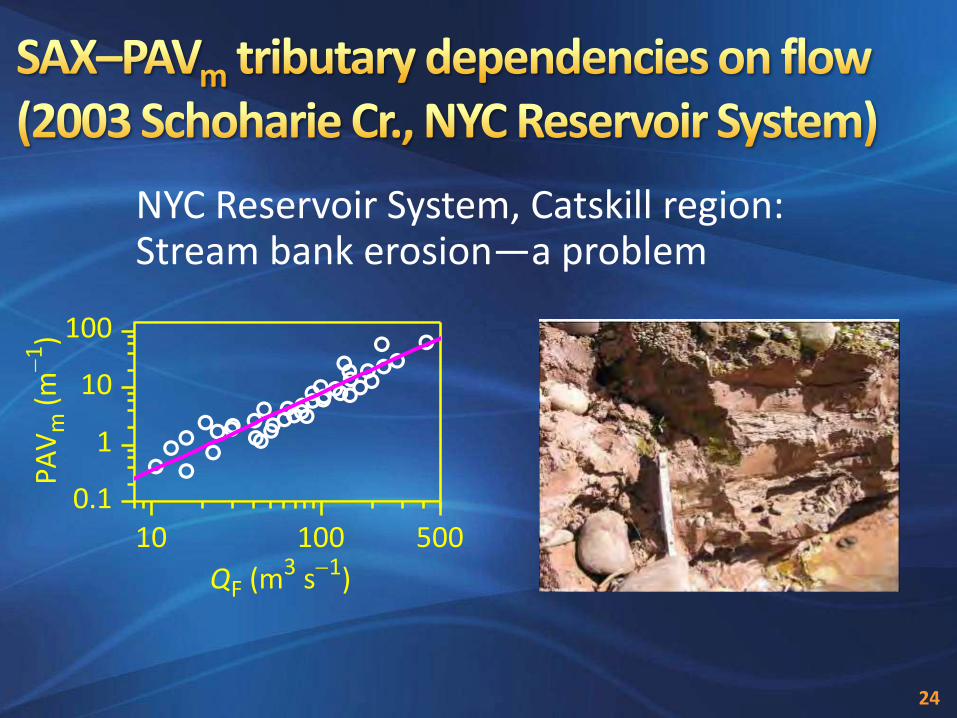
NYC Reservoir System, Catskill region: Stream bank erosion—a problem
10 100 5000.1
1
10
100
PA
Vm
(m
-1)
QF (m3 s-1)
24
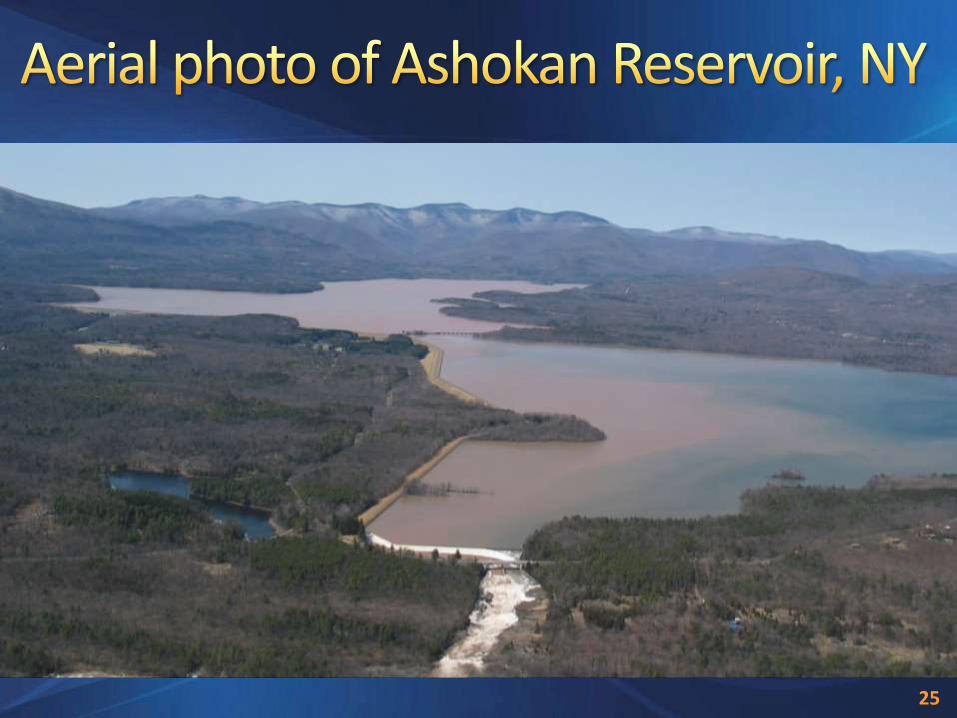
25
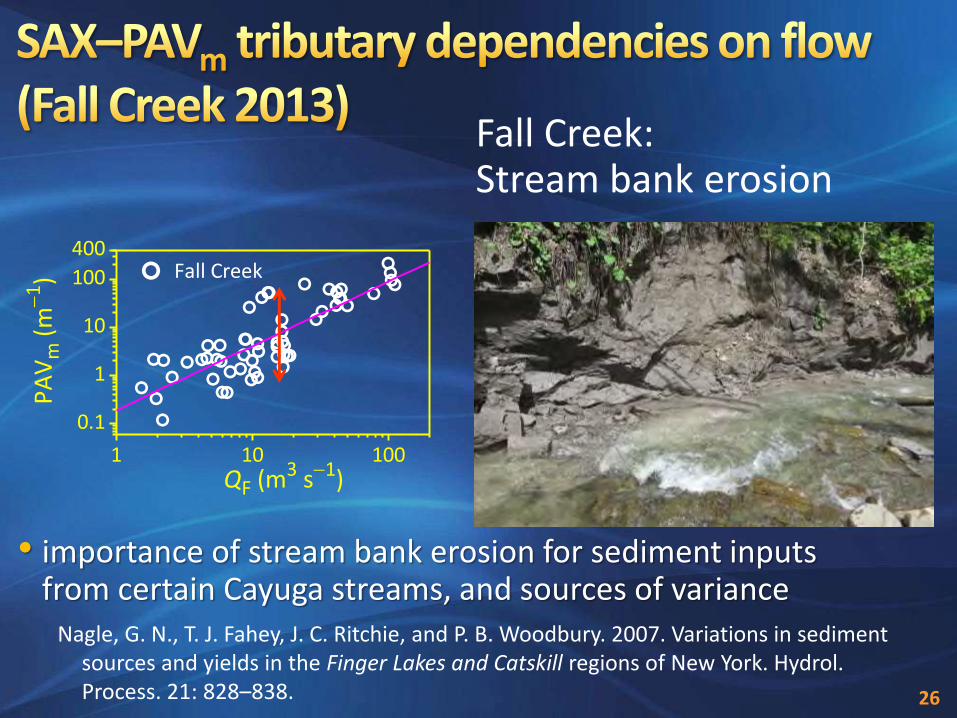
Fall Creek: Stream bank erosion
26
Nagle, G. N., T. J. Fahey, J. C. Ritchie, and P. B. Woodbury. 2007. Variations in sediment sources and yields in the Finger Lakes and Catskill regions of New York. Hydrol. Process. 21: 828–838.
1 10 100
0.1
1
10
100
400
QF (m3 s-1)
PA
Vm
(m
-1)
Fall Creek
• importance of stream bank erosion for sediment inputs from certain Cayuga streams, and sources of variance
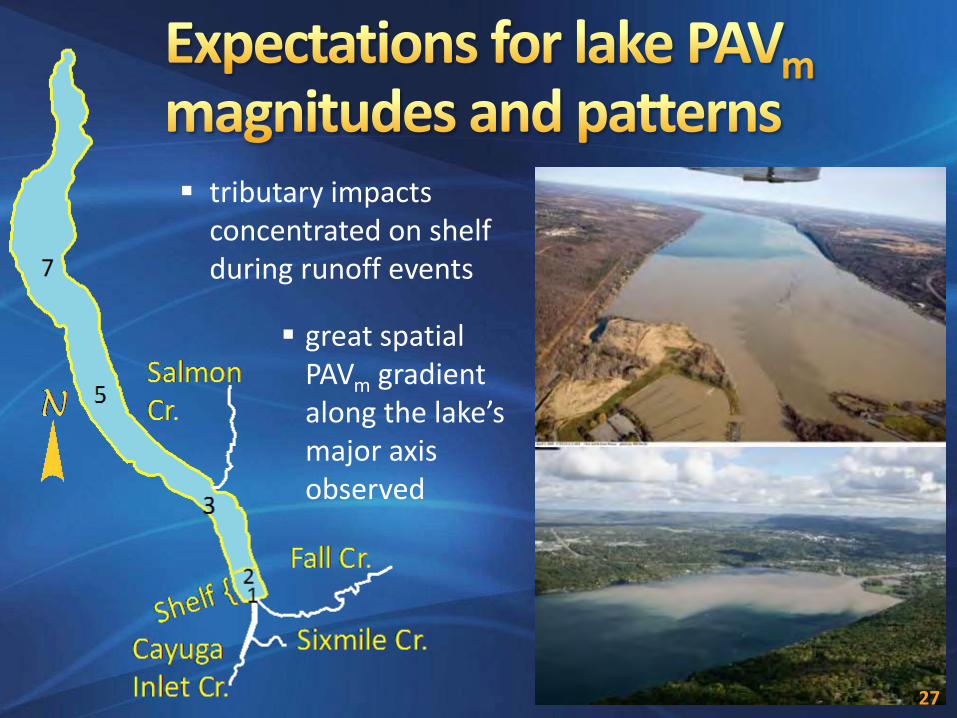
tributary impacts concentrated on shelf during runoff events
great spatial PAVm gradient along the lake’s major axis observed
27
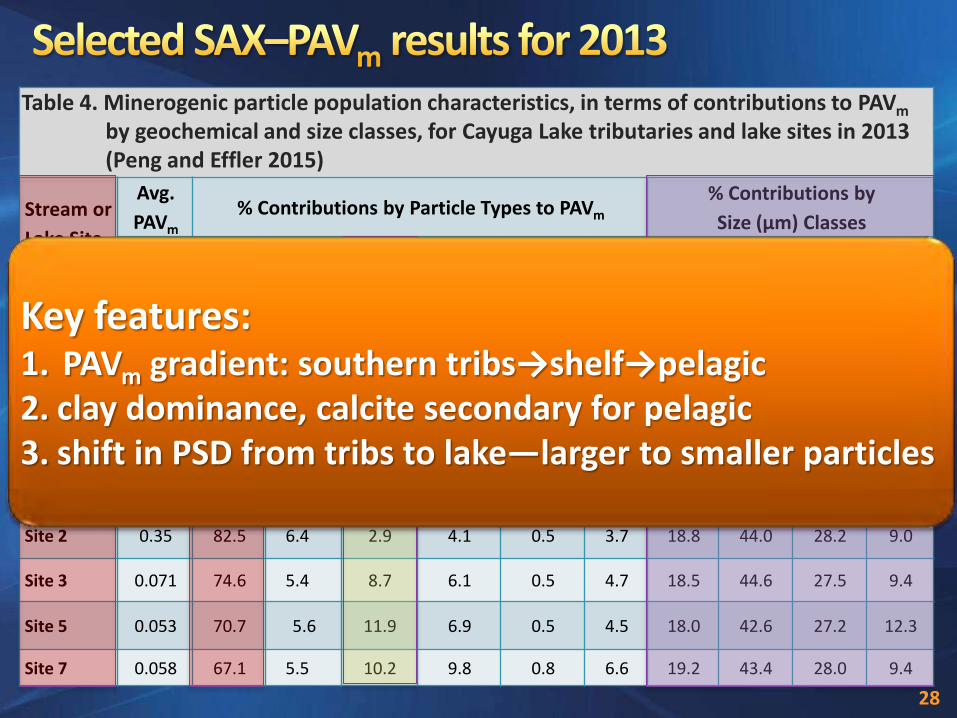
Table 4. Minerogenic particle population characteristics, in terms of contributions to PAVm by geochemical and size classes, for Cayuga Lake tributaries and lake sites in 2013 (Peng and Effler 2015)
Stream or
Lake Site
Avg.
PAVm % Contributions by Particle Types to PAVm
% Contributions by
Size (µm) Classes
(m–1) Clay Quartz Calcite Ca-agg Si-rich Misc. <2 2–5.6 5.6–11 11
Fall Creek 23.94 86.5 6.9 0.7 3.9 0.4 1.7 8.3 25.63 30.63 35.5
Cayuga Inlet Cr. 129.3 83.8 7.7 1.0 4.9 0.6 2.0 12.0 29.53 30.7 27.8
Salmon Creek 19.68 82.2 5.7 1.6 7.7 0.6 2.3 9.6 22.5 26.6 41.3
Six Mile Creek
26.30 84.8 6.1 1.1 5.4 0.6 2.1 16.8 41.7 25.4 16.1
Site 1 2.74 83.2 6.6 2.3 4.2 0.6 3.2 17.3 42.6 27.7 12.4
Site 2 0.35 82.5 6.4 2.9 4.1 0.5 3.7 18.8 44.0 28.2 9.0
Site 3 0.071 74.6 5.4 8.7 6.1 0.5 4.7 18.5 44.6 27.5 9.4
Site 5 0.053 70.7 5.6 11.9 6.9 0.5 4.5 18.0 42.6 27.2 12.3
Site 7 0.058 67.1 5.5 10.2 9.8 0.8 6.6 19.2 43.4 28.0 9.4
28
Key features: 1. PAVm gradient: southern tribs→shelf→pelagic 2. clay dominance, calcite secondary for pelagic 3. shift in PSD from tribs to lake—larger to smaller particles
29
0.0
0.2
0.4
100
101
102
0
5
1080
0
100
200
PA
Vm
(m
-1)
Site 3
OctSepAugJulMay JunApr
QF
(m3 s
-1)
2013
Site 1
Fall Creek
3+
0
10
20
(b) Site 1
(c) Site 2
(d) pelagic
<
0.1 1 10
%
0
2
4
6
< +
(a) Fall Cr.
%
0
4
8
PAVm (m
-1)0.01 0.1 1
0
10
20
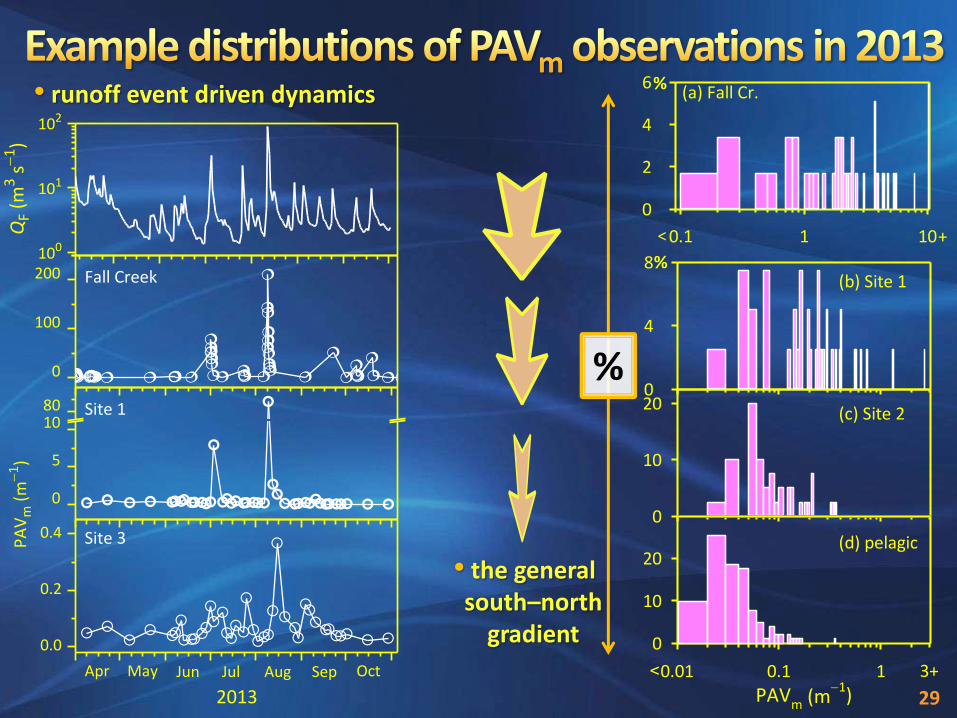
• runoff event driven dynamics
• the general south–north
gradient
%
1. system-specific issues; limitations of conventional approach
2. SAX: technical details, advantages, and applications
3. Cayuga Lake 2013 water quality studies a. tributaries
b. lake dynamics
c. assessments of water quality impacts
4. model framework and summary
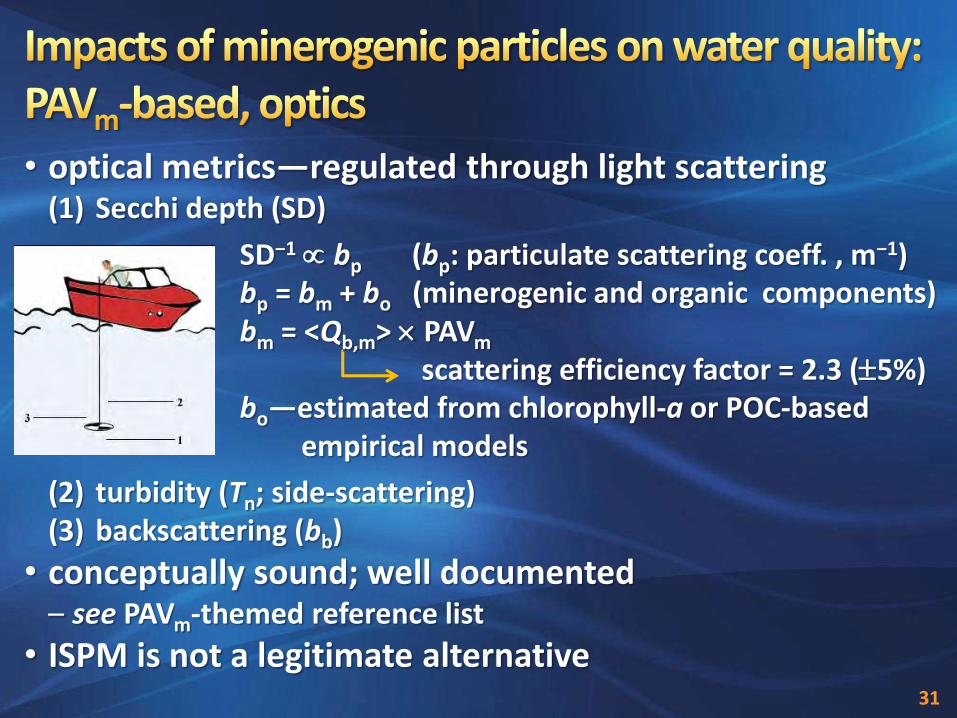
• optical metrics—regulated through light scattering (1) Secchi depth (SD)
SD−1 bp (bp: particulate scattering coeff. , m−1) bp = bm + bo (minerogenic and organic components) bm = <Qb,m> PAVm
scattering efficiency factor = 2.3 (5%) bo—estimated from chlorophyll-a or POC-based
empirical models (2) turbidity (Tn; side-scattering) (3) backscattering (bb)
• conceptually sound; well documented – see PAVm-themed reference list
• ISPM is not a legitimate alternative
31
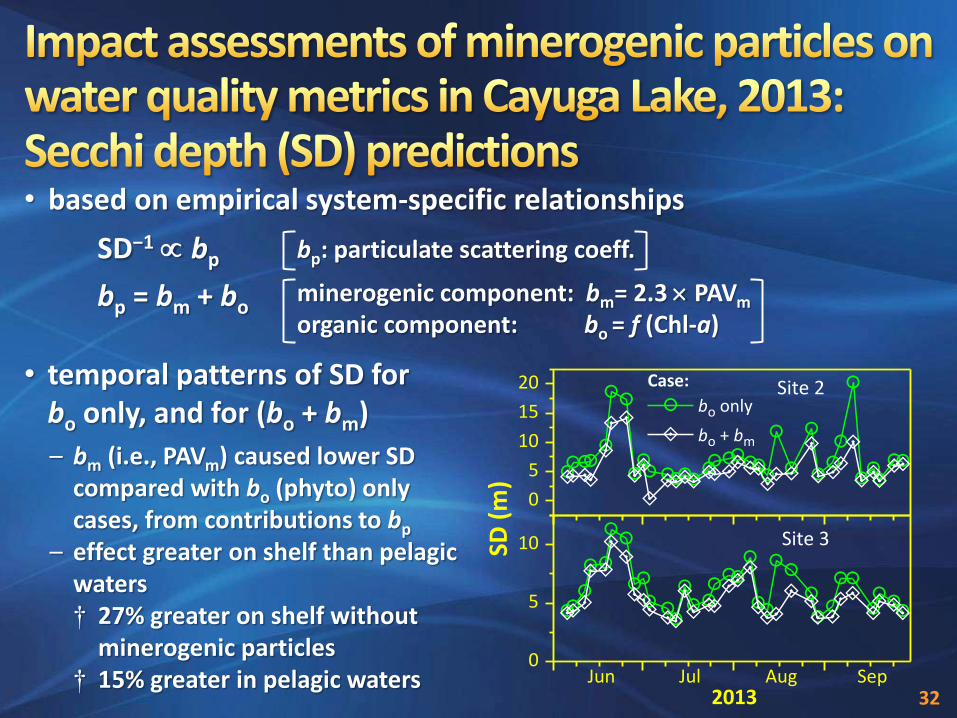
• based on empirical system-specific relationships
• temporal patterns of SD for bo only, and for (bo + bm)
SD−1 bp bp: particulate scattering coeff.
bp = bm + bo minerogenic component: bm= 2.3 PAVm
organic component: bo = f (Chl-a)
– bm (i.e., PAVm) caused lower SD compared with bo (phyto) only cases, from contributions to bp
– effect greater on shelf than pelagic waters † 27% greater on shelf without
minerogenic particles † 15% greater in pelagic waters
0
5
10
15
20
Jun Jul Aug Sep0
5
10
SD (
m)
Case:
bo only
bo + bm
Site 2
2013
Site 3
32
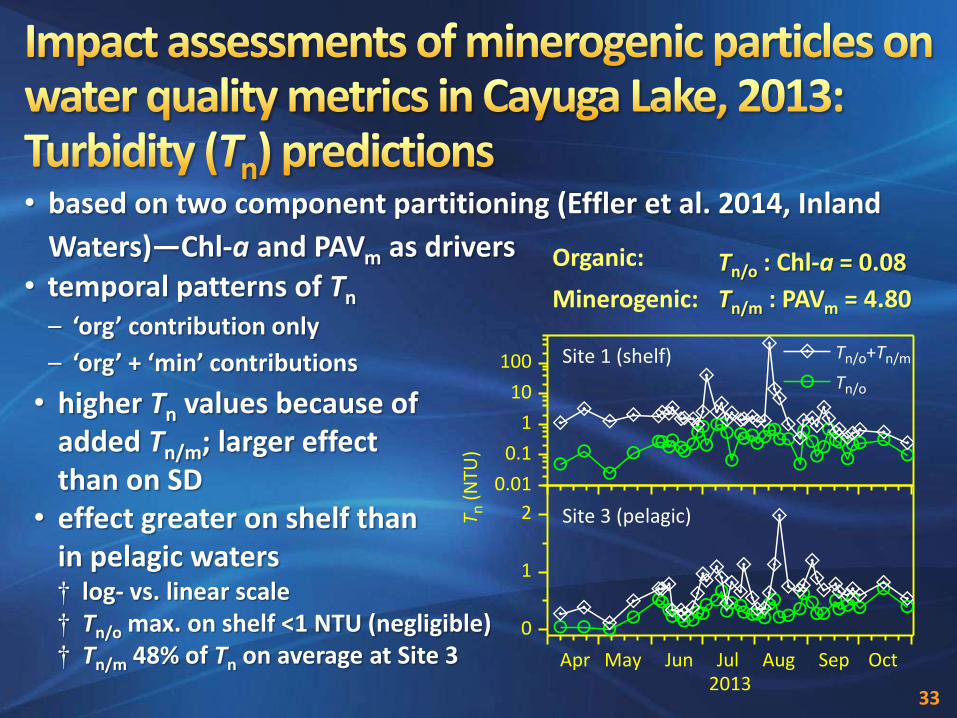
• based on two component partitioning (Effler et al. 2014, Inland
Waters)—Chl-a and PAVm as drivers • temporal patterns of Tn
– ‘org’ contribution only
– ‘org’ + ‘min’ contributions
Organic: Tn/o : Chl-a = 0.08
Minerogenic: Tn/m : PAVm = 4.80
• higher Tn values because of added Tn/m; larger effect than on SD
• effect greater on shelf than in pelagic waters † log- vs. linear scale † Tn/o max. on shelf <1 NTU (negligible) † Tn/m 48% of Tn on average at Site 3
33
0.01
0.1
1
10
100
0
1
2
Tn (
NTU
)
Tn/o+Tn/m
Tn/o
Site 1 (shelf)
Site 3 (pelagic)
Apr May Jun Jul Aug Sep Oct
2013
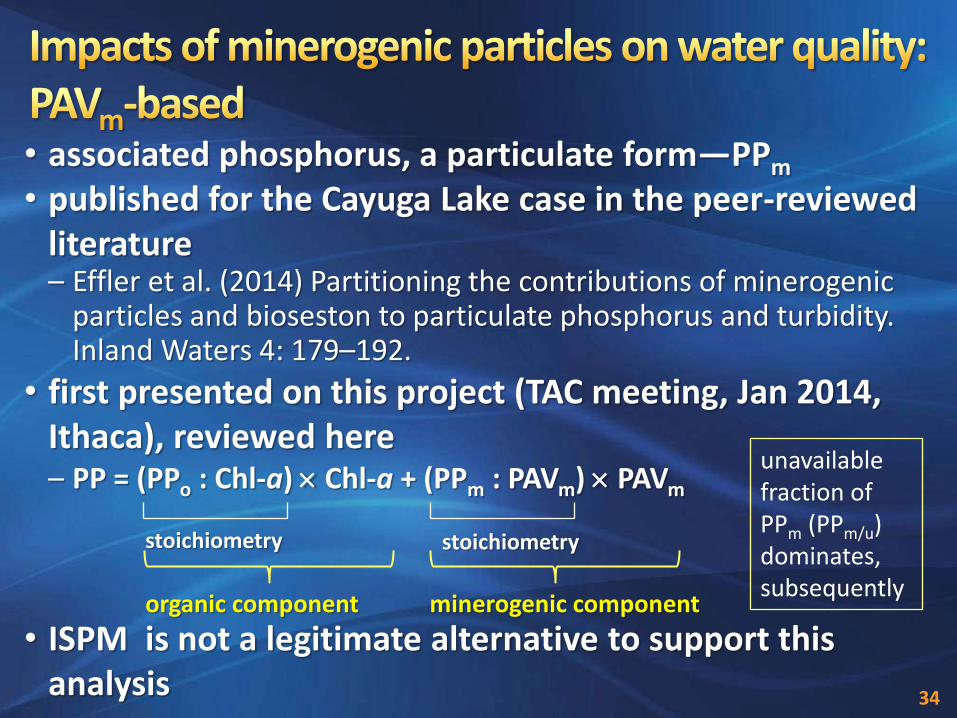
• associated phosphorus, a particulate form—PPm • published for the Cayuga Lake case in the peer-reviewed
literature – Effler et al. (2014) Partitioning the contributions of minerogenic
particles and bioseston to particulate phosphorus and turbidity. Inland Waters 4: 179–192.
• first presented on this project (TAC meeting, Jan 2014, Ithaca), reviewed here – PP = (PPo : Chl-a) Chl-a + (PPm : PAVm) PAVm
• ISPM is not a legitimate alternative to support this analysis
stoichiometry stoichiometry
organic component minerogenic component
34
unavailable fraction of PPm (PPm/u) dominates, subsequently
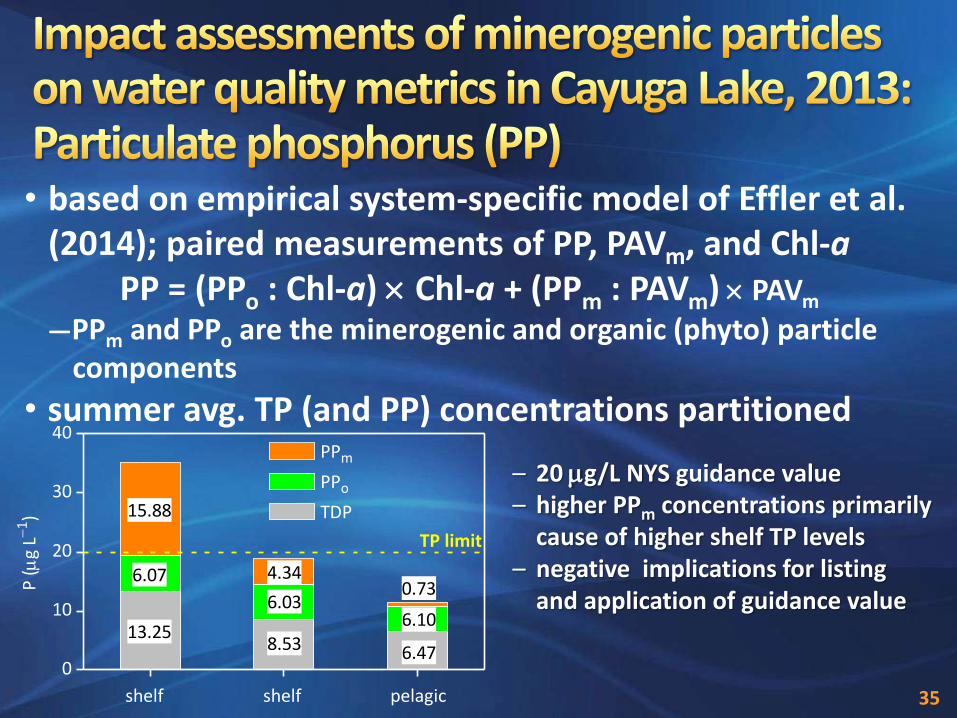
• based on empirical system-specific model of Effler et al. (2014); paired measurements of PP, PAVm, and Chl-a
PP = (PPo : Chl-a) Chl-a + (PPm : PAVm) PAVm
—PPm and PPo are the minerogenic and organic (phyto) particle components
• summer avg. TP (and PP) concentrations partitioned
– 20 g/L NYS guidance value – higher PPm concentrations primarily
cause of higher shelf TP levels
– negative implications for listing and application of guidance value
35
0
10
20
30
40
pelagicshelf
8.53
6.03
13.25
6.07 4.34
P (
g
L-1)
PPm
PPo
TDP
TP limit
15.88
6.10
0.73
6.47
shelf

1. system-specific issues; limitations of conventional approach
2. SAX: technical details, advantages, and applications
3. Cayuga Lake 2013 water quality studies a. tributaries
b. lake dynamics
c. assessments of water quality impacts
4. model framework and summary

Peng, F., and S. W. Effler. 2015. Quantifications and water quality implications of minerogenic particles in Cayuga Lake, New York, and its tributaries. Inland Waters, 5: 403–420.
37
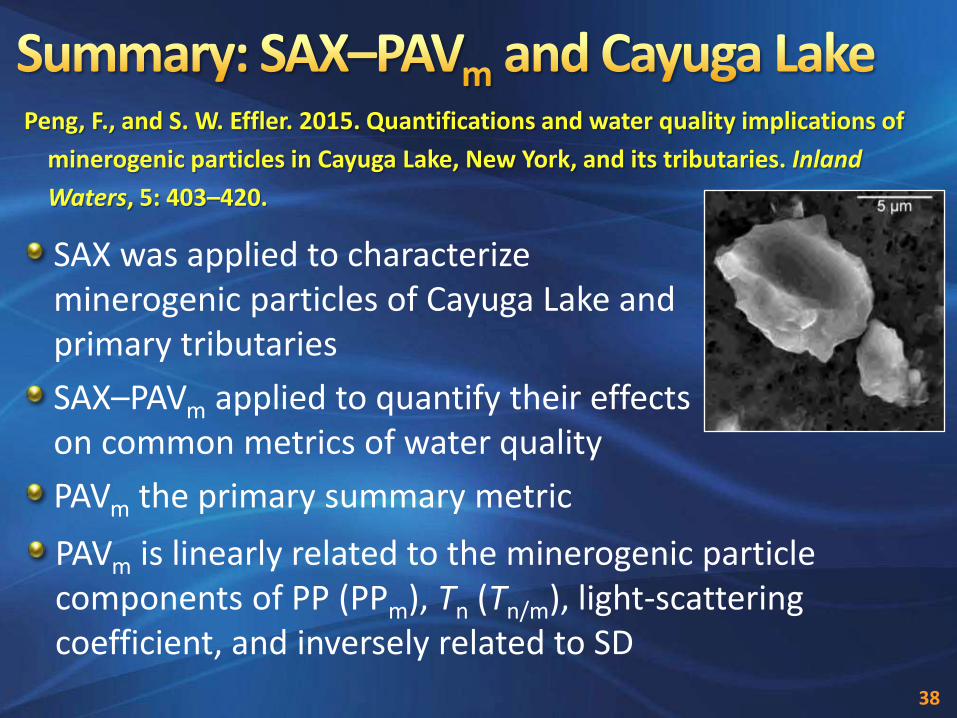
SAX was applied to characterize minerogenic particles of Cayuga Lake and primary tributaries
SAX–PAVm applied to quantify their effects on common metrics of water quality
PAVm the primary summary metric
Peng, F., and S. W. Effler. 2015. Quantifications and water quality implications of
minerogenic particles in Cayuga Lake, New York, and its tributaries. Inland
Waters, 5: 403–420.
PAVm is linearly related to the minerogenic particle components of PP (PPm), Tn (Tn/m), light-scattering coefficient, and inversely related to SD
38
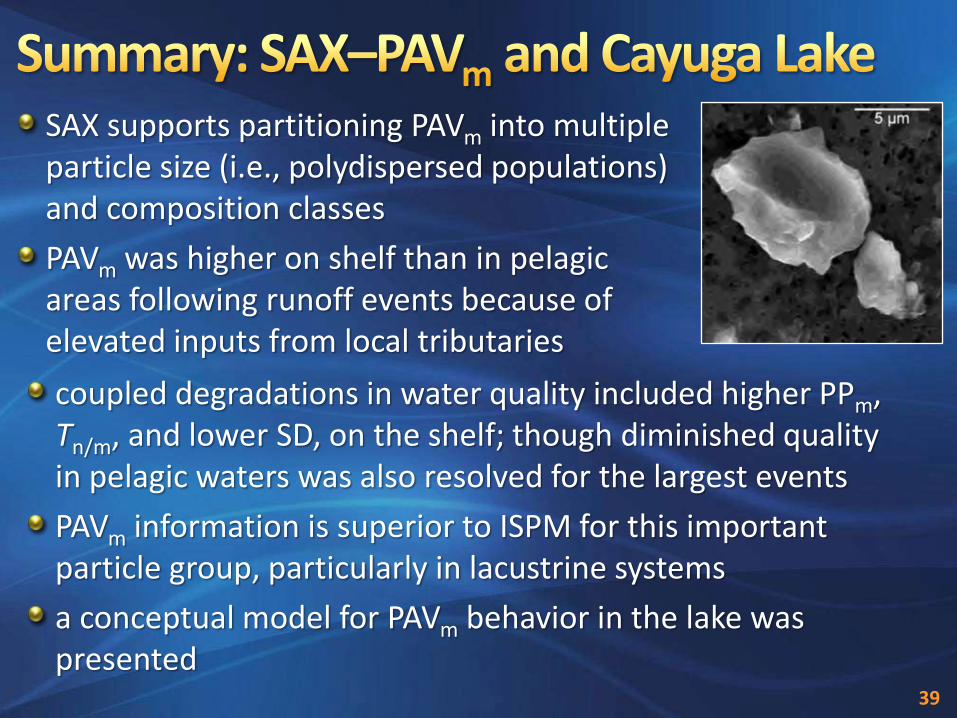
SAX supports partitioning PAVm into multiple particle size (i.e., polydispersed populations) and composition classes
PAVm was higher on shelf than in pelagic areas following runoff events because of elevated inputs from local tributaries
coupled degradations in water quality included higher PPm, Tn/m, and lower SD, on the shelf; though diminished quality in pelagic waters was also resolved for the largest events
PAVm information is superior to ISPM for this important particle group, particularly in lacustrine systems
a conceptual model for PAVm behavior in the lake was presented
39
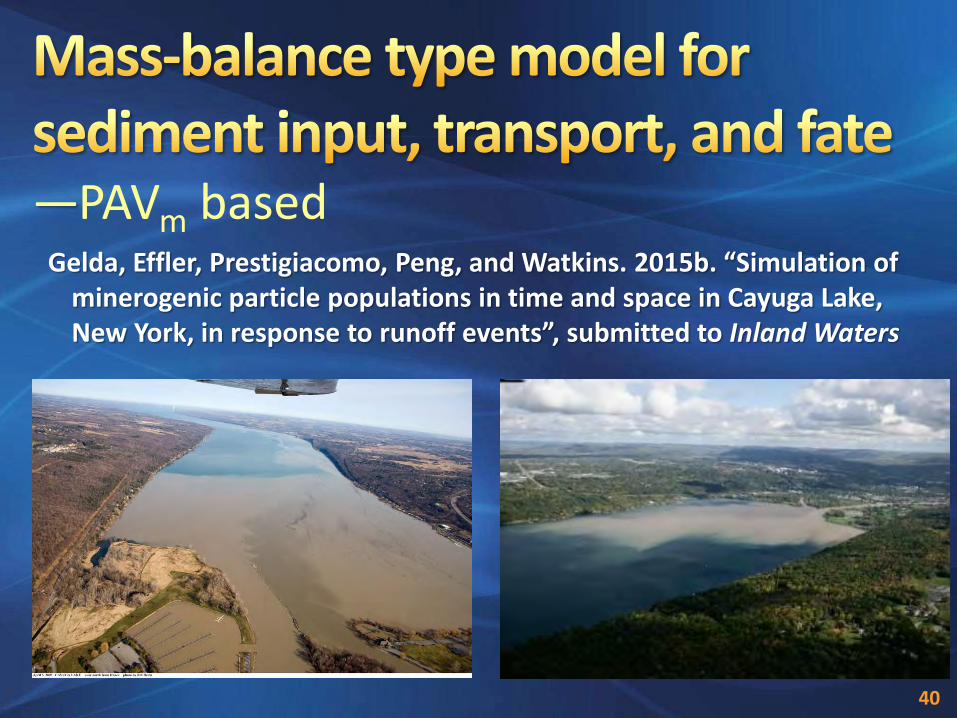
—PAVm based Gelda, Effler, Prestigiacomo, Peng, and Watkins. 2015b. “Simulation of
minerogenic particle populations in time and space in Cayuga Lake, New York, in response to runoff events”, submitted to Inland Waters
40
1. PAVm model concepts
2. modeled particle loss processes
3. model performance targets
4. model performance evaluations
5. model applications
6. summary
• drivers
demonstrate importance for multiple water quality
metrics (Tn, PPm, SD)—shelf vs. pelagic waters
value/implications for ‘listing’ of water quality
issues—phosphorus and sediment
rich data sets of SAX–PAVm measurements for lakes
and tributaries
42

• model state variables—multiple size classes of PAVm, PAVm,n, n = 4
• sources and sinks
external loads from tributaries
Stokes settling
augmented by coagulation
filtration mussels
• parsimonious approach – complex feature, PAVm,n, but necessary – simplifying, number of sink processes
and size classes
0.1 1 10 30
0
2
4
6
8
10
PA
Vm
(m-
1)
Particle size, d (m)
Size classes:
• size class contributions
PAV𝐦, 𝒊
𝒏
𝒊=𝟏
= PAV𝐦
PAVm,4
PAVm,3
PAVm,2
PAVm,1
43
44
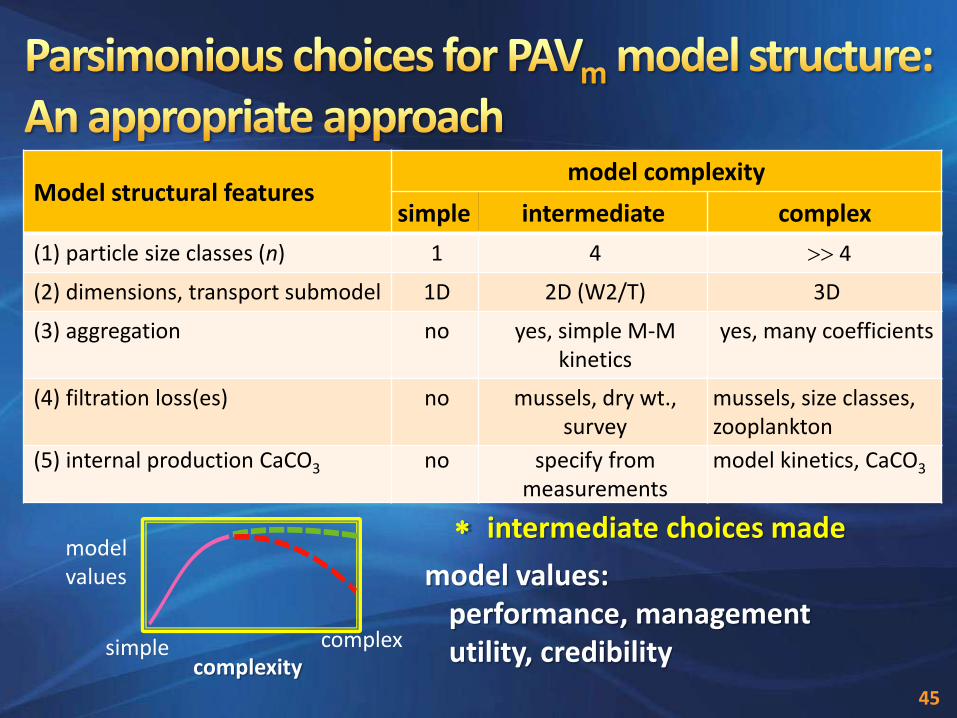
Model structural features model complexity
simple intermediate complex
(1) particle size classes (n) 1 4 4
(2) dimensions, transport submodel 1D 2D (W2/T) 3D
(3) aggregation no yes, simple M-M kinetics
yes, many coefficients
(4) filtration loss(es) no mussels, dry wt., survey
mussels, size classes, zooplankton
(5) internal production CaCO3 no specify from measurements
model kinetics, CaCO3
simple
model values
complexity complex
intermediate choices made
model values: performance, management utility, credibility
45
1. PAVm model concepts
2. modeled particle loss processes
3. model performance targets
4. model performance evaluations
5. model applications
6. summary
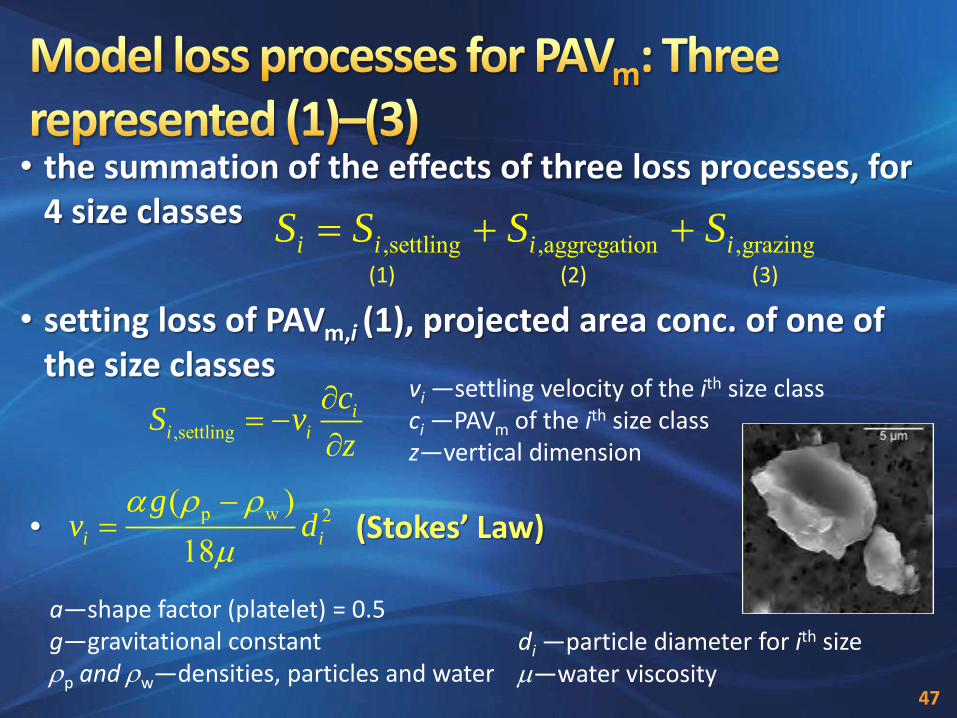
• the summation of the effects of three loss processes, for 4 size classes
• setting loss of PAVm,i (1), projected area conc. of one of the size classes
• (Stokes’ Law)
47
,settling ,aggregation ,grazingi i i iS S S S (1) (2) (3)
,settlingi
i i
cS v
z
-
vi —settling velocity of the ith size class ci —PAVm of the ith size class z—vertical dimension
p w 2( )18i i
gv d
r r
-
a—shape factor (platelet) = 0.5 g—gravitational constant rp and rw—densities, particles and water
di —particle diameter for ith size —water viscosity

• parsimonious approach—the three smallest of those size classes are subject to aggregation, through conversion to the largest, most rapidly settling size class
48
kc,i = 0.5 m·d-1, aggregation rate constant for the ith PAVm size class (i = 1, 2 and 3) K = 0.05 m−1,Michaelis-Menten constant
for i = classes 1, 2, 3
for class 4
2,aggregation , i
i c i i
i
cS k c
c K
-
3
24,aggregation ,
1
ic i i
i i
cS k c
c K
– positively dependent on particle concentrations, from increased collisions
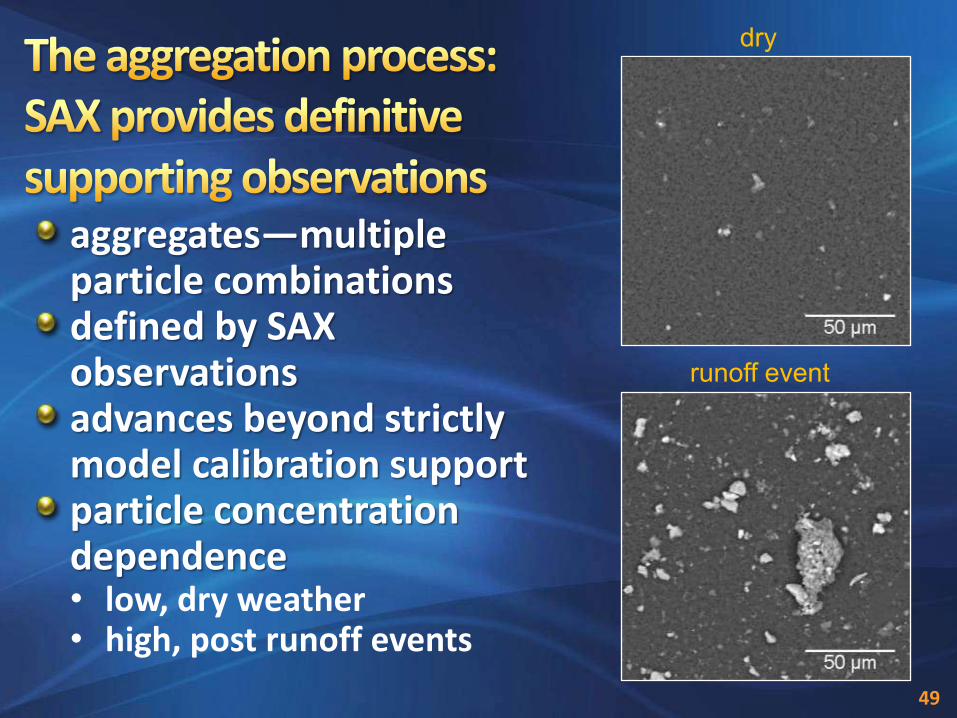
dry
runoff event
aggregates—multiple particle combinations defined by SAX observations advances beyond strictly model calibration support particle concentration dependence • low, dry weather • high, post runoff events
49
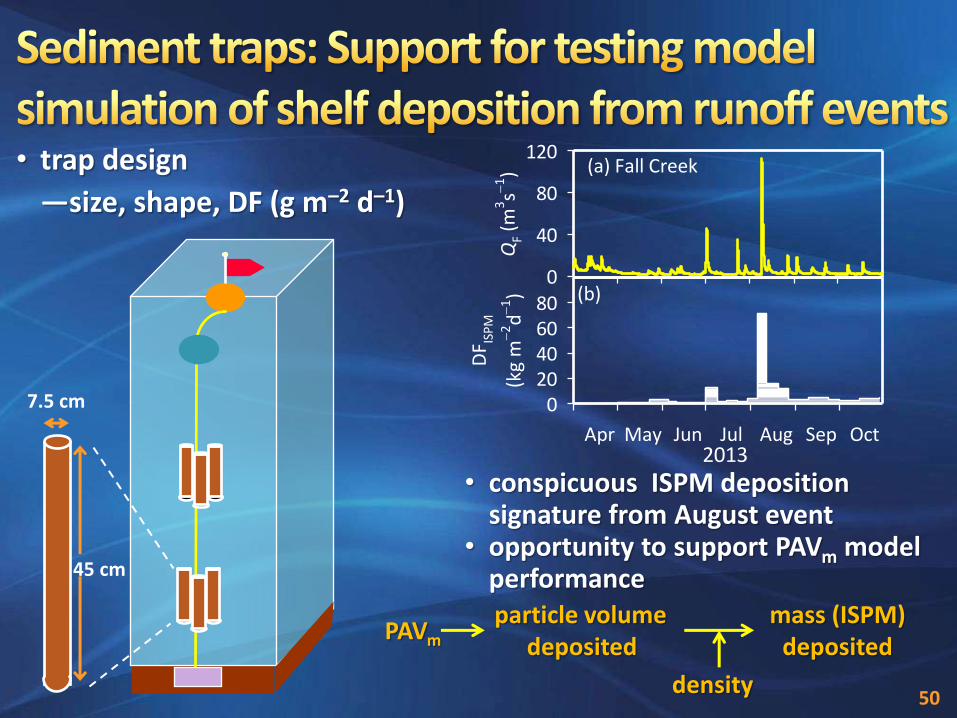
• trap design
—size, shape, DF (g m–2 d–1)
• conspicuous ISPM deposition signature from August event
• opportunity to support PAVm model performance
PAVm particle volume
deposited mass (ISPM)
deposited
density
7.5 cm
45 cm
50
Apr May Jun Jul Aug Sep Oct
DF IS
PM
(kg
m-
2d
-1)
020406080
QF (
m3s-
1)
0
40
80
120(a) Fall Creek
(b)
2013
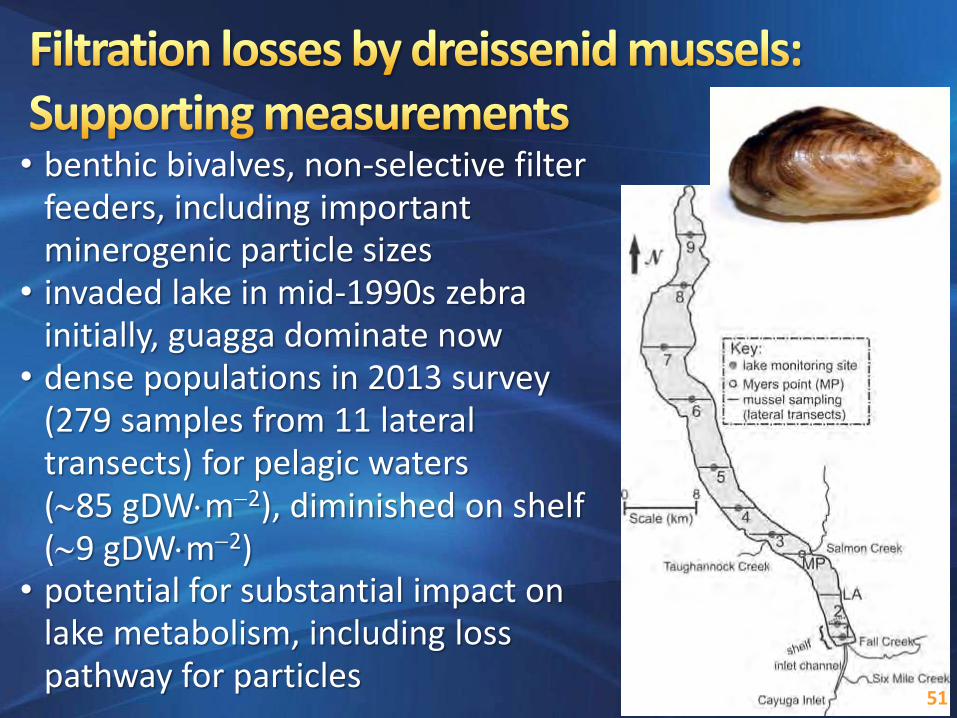
• benthic bivalves, non-selective filter feeders, including important minerogenic particle sizes
• invaded lake in mid-1990s zebra initially, guagga dominate now
• dense populations in 2013 survey (279 samples from 11 lateral transects) for pelagic waters (85 gDWm-2), diminished on shelf (9 gDWm-2)
• potential for substantial impact on lake metabolism, including loss pathway for particles
51
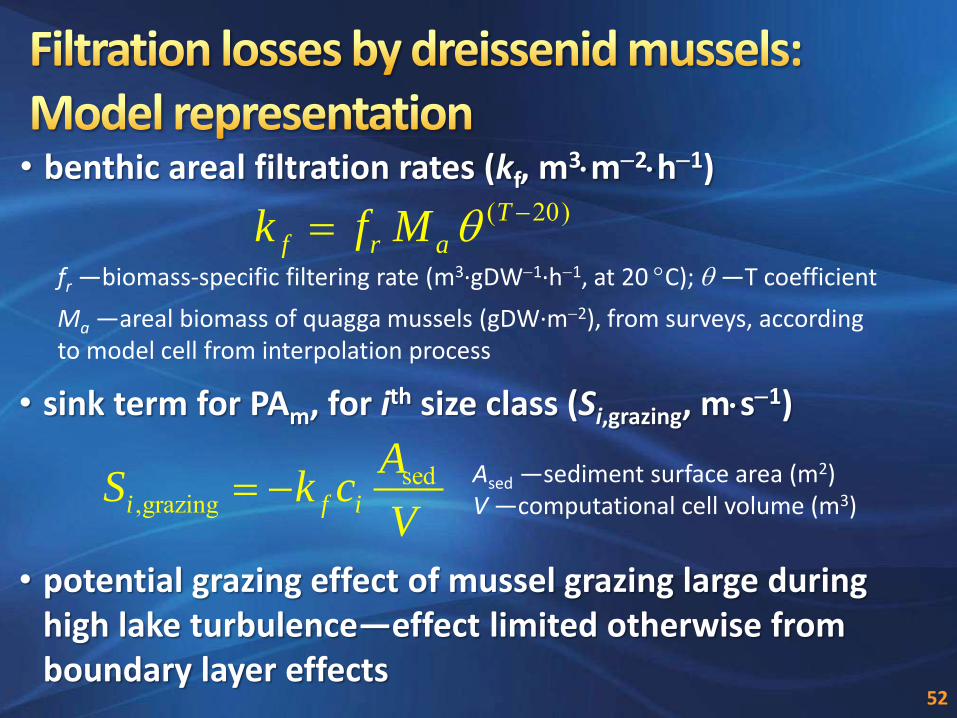
• benthic areal filtration rates (kf, m3m-2h-1)
52
• sink term for PAm, for ith size class (Si,grazing, ms-1)
• potential grazing effect of mussel grazing large during high lake turbulence—effect limited otherwise from boundary layer effects
( 20) T
f r ak f M -fr —biomass-specific filtering rate (m3·gDW-1·h-1, at 20 C); —T coefficient
Ma —areal biomass of quagga mussels (gDW·m-2), from surveys, according to model cell from interpolation process
sed,grazingi f i
AS k c
V - Ased —sediment surface area (m2)
V —computational cell volume (m3)
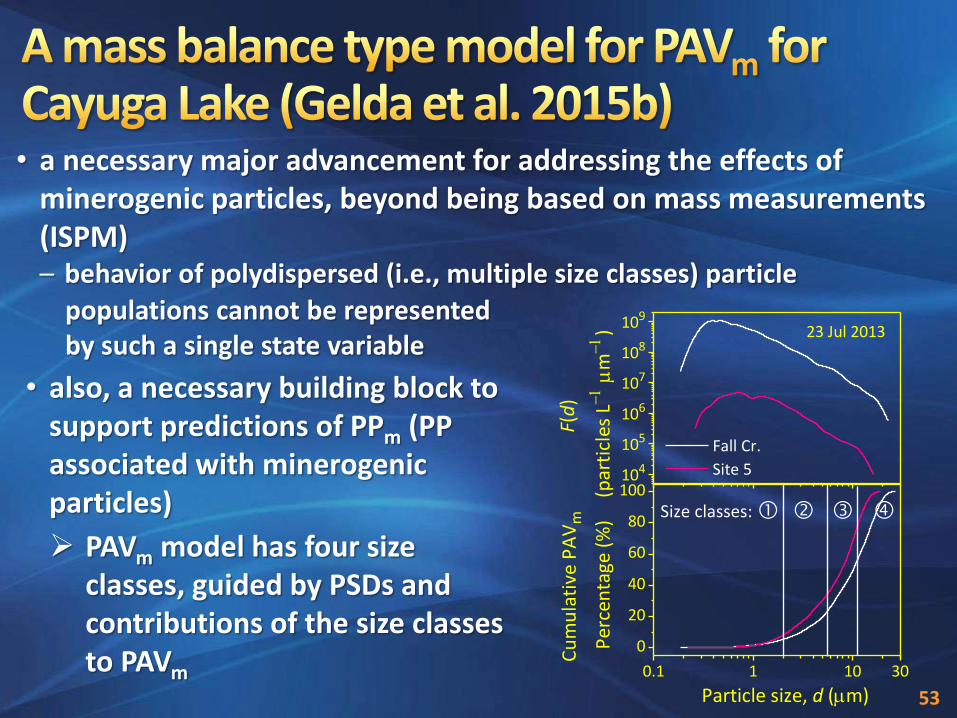
• a necessary major advancement for addressing the effects of minerogenic particles, beyond being based on mass measurements (ISPM) – behavior of polydispersed (i.e., multiple size classes) particle
PAVm model has four size classes, guided by PSDs and contributions of the size classes to PAVm
104
105
106
107
108
109
0.1 1 10 30
0
20
40
60
80
100
F(d
)
(par
ticl
es L
-
m-
)
Fall Cr.
Site 5
23 Jul 2013
Cu
mu
lati
ve P
AV
m
Per
cen
tage
(%
)
Particle size, d (m)
Size classes:
53
• also, a necessary building block to support predictions of PPm (PP associated with minerogenic particles)
populations cannot be represented by such a single state variable
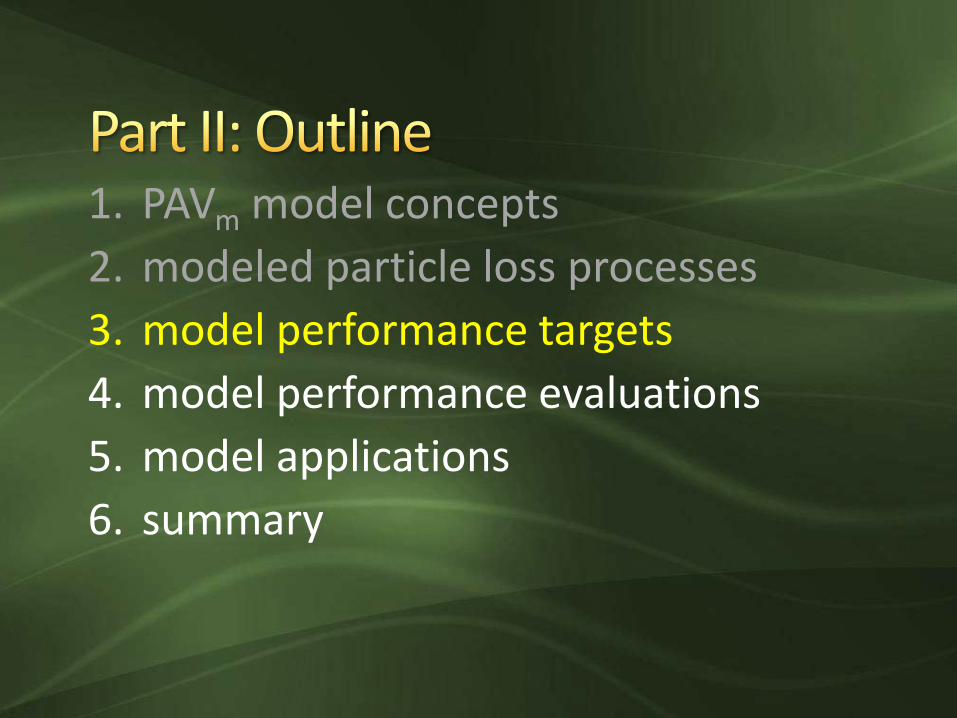
1. PAVm model concepts
2. modeled particle loss processes
3. model performance targets
4. model performance evaluations
5. model applications
6. summary
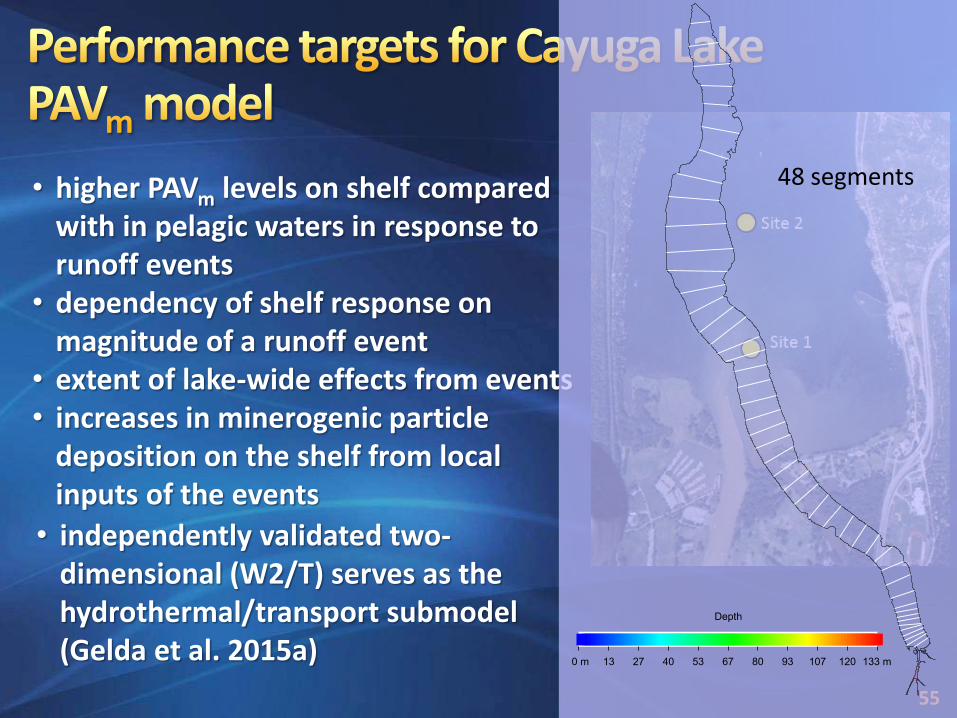
• higher PAVm levels on shelf compared with in pelagic waters in response to runoff events
• dependency of shelf response on magnitude of a runoff event
• extent of lake-wide effects from events • increases in minerogenic particle
deposition on the shelf from local inputs of the events
• independently validated two-dimensional (W2/T) serves as the hydrothermal/transport submodel (Gelda et al. 2015a)
55
0 m 13 27 40 53 67 80 93 107 120 133 m
Depth
48 segments

• narrowing of distributions • decreases in central metrics
3+
0
10
20
(b) Site 1
(c) Site 2
(d) pelagic
<
0.1 1 10
%
0
2
4
6
< +
(a) Fall Cr.
%
0
4
8
PAVm (m
1)0.01 0.1 1
0
10
20
lake gradient
56
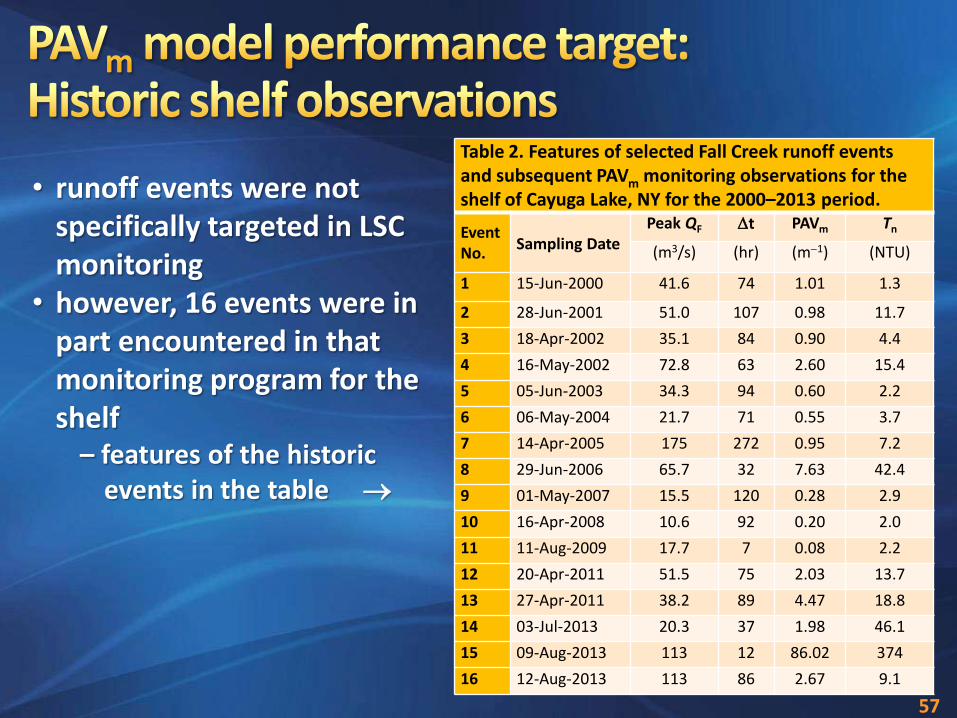
• runoff events were not specifically targeted in LSC monitoring
• however, 16 events were in part encountered in that monitoring program for the shelf
– features of the historic events in the table
Table 2. Features of selected Fall Creek runoff events and subsequent PAVm monitoring observations for the shelf of Cayuga Lake, NY for the 2000–2013 period.
Event No.
Sampling Date
Peak QF Dt PAVm Tn
(m3/s) (hr) (m-1) (NTU)
1 15-Jun-2000 41.6 74 1.01 1.3
2 28-Jun-2001 51.0 107 0.98 11.7
3 18-Apr-2002 35.1 84 0.90 4.4
4 16-May-2002 72.8 63 2.60 15.4
5 05-Jun-2003 34.3 94 0.60 2.2
6 06-May-2004 21.7 71 0.55 3.7
7 14-Apr-2005 175 272 0.95 7.2
8 29-Jun-2006 65.7 32 7.63 42.4
9 01-May-2007 15.5 120 0.28 2.9
10 16-Apr-2008 10.6 92 0.20 2.0
11 11-Aug-2009 17.7 7 0.08 2.2
12 20-Apr-2011 51.5 75 2.03 13.7
13 27-Apr-2011 38.2 89 4.47 18.8
14 03-Jul-2013 20.3 37 1.98 46.1
15 09-Aug-2013 113 12 86.02 374
16 12-Aug-2013 113 86 2.67 9.1
57
1. PAVm model concepts
2. modeled particle loss processes
3. model performance targets
4. model performance evaluations
5. model applications
6. summary
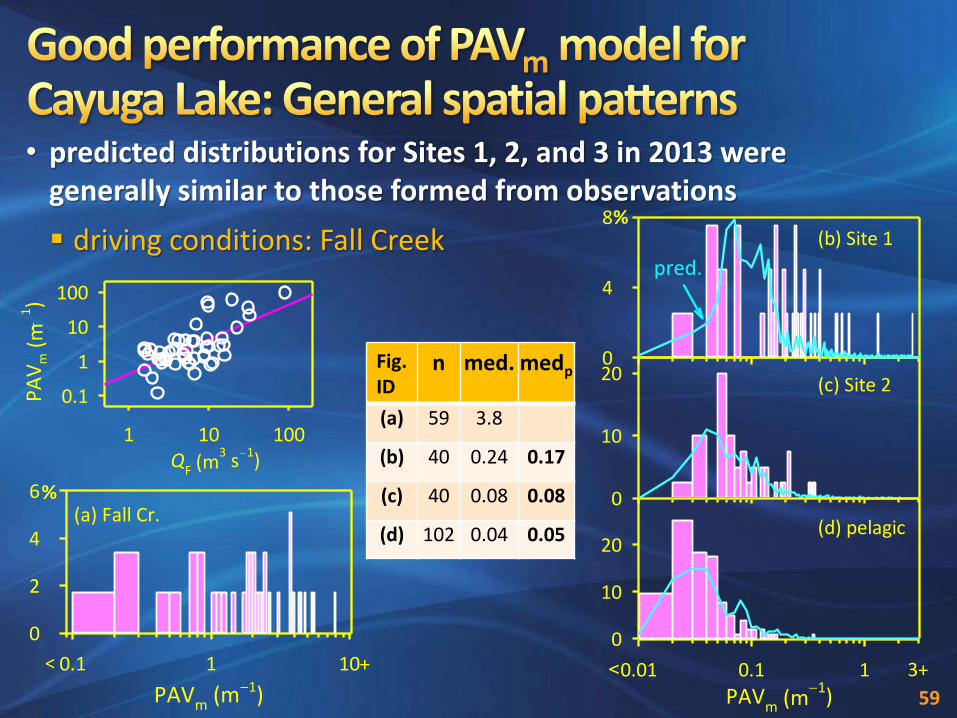
Fig. ID
n med. medp
(a) 59 3.8
(b) 40 0.24 0.17
(c) 40 0.08 0.08
(d) 102 0.04 0.05
• predicted distributions for Sites 1, 2, and 3 in 2013 were generally similar to those formed from observations
59
driving conditions: Fall Creek
3+
0
10
20
(b) Site 1
(c) Site 2
(d) pelagic
<
pred.
%
0
4
8
PAVm (m
-1)0.01 0.1 1
0
10
20
QF (m
3 s
1)
1 10 100
PA
Vm
(m
1)
0.1
1
10
100
PAVm (m 1)
0.1 1 10
%
0
2
4
6
< +
(a) Fall Cr.

• 16 runoff events captured during LSC monitoring program for the shelf
• good performance across the wide range of events
PAVm pred. (m-1)
0.01 0.1 1 10 100
PA
Vm
ob
s. (
m-
1)
0.01
0.1
1
10
100
1 2 3 4
5 6 7
8
9 10 11
12 13
14
15
16
int = 0.10S = 1.15
R2 = 0.86
event numbers, see Table 2
60
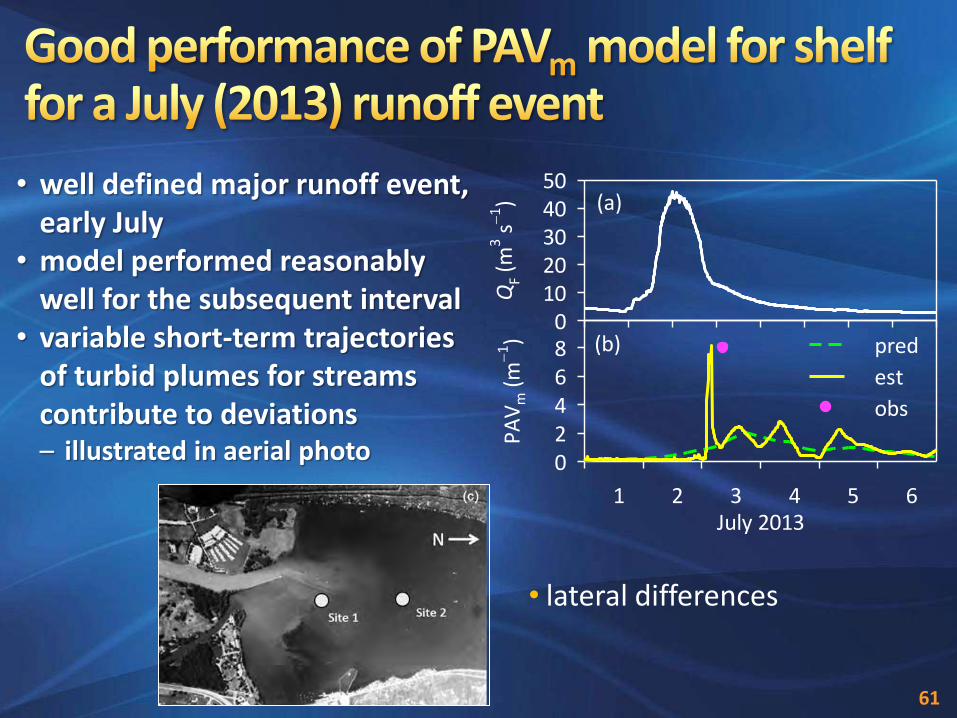
• well defined major runoff event, early July
• model performed reasonably well for the subsequent interval
• variable short-term trajectories of turbid plumes for streams contribute to deviations – illustrated in aerial photo
61
• lateral differences
July 2013 1 2 3 4 5 6
PA
Vm
(m
-1)
02468 pred
est
obs
(a)
(b)
QF (
m3 s
-1)
01020304050
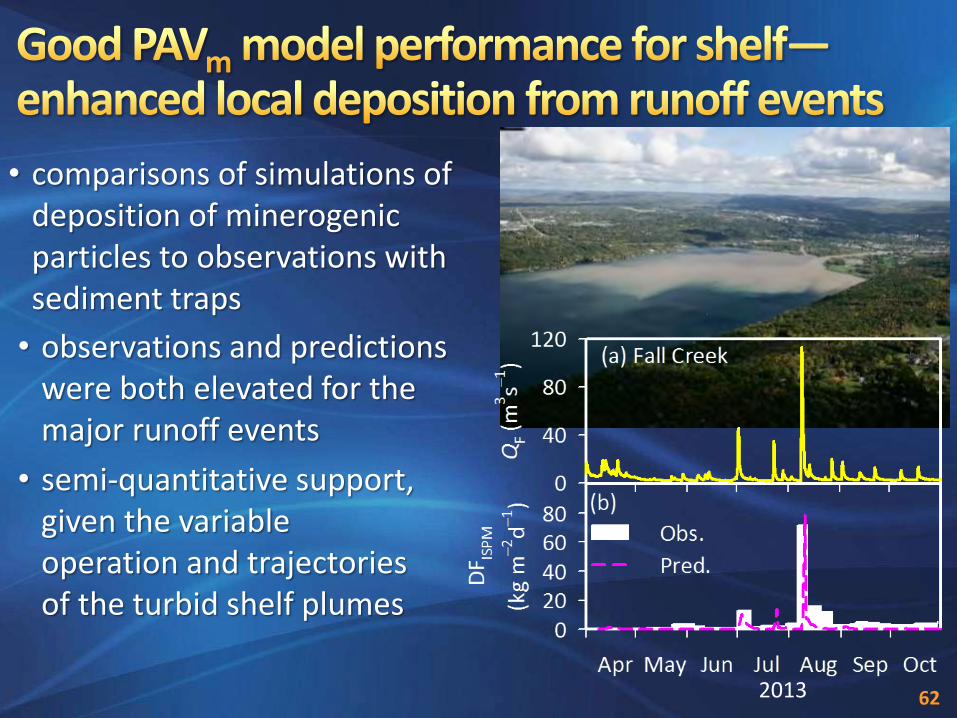
• comparisons of simulations of deposition of minerogenic particles to observations with sediment traps
62
• observations and predictions were both elevated for the major runoff events
• semi-quantitative support, given the variable operation and trajectories of the turbid shelf plumes
2013

1. PAVm model concepts
2. modeled particle loss processes
3. model performance targets
4. model performance evaluations
5. model applications
6. summary

• Fall Creek peak QF for the
earlier runoff events
• corresponding predicted peak
PAVm at Site 2 on shelf
• strong, positive dependency on
event magnitude
• sources of variance—variations
in ambient mixing, limitations
in peak QF defining external
loads
64
Fall Cr. QF Peak (m3s-1)
10 100
Site
2 P
eak
PA
Vm
(m
-1)
0.1
1
10
100
1 2 3
4 5
6
7 8
9 10
11
12
13
14
15 16 R² = 0.59
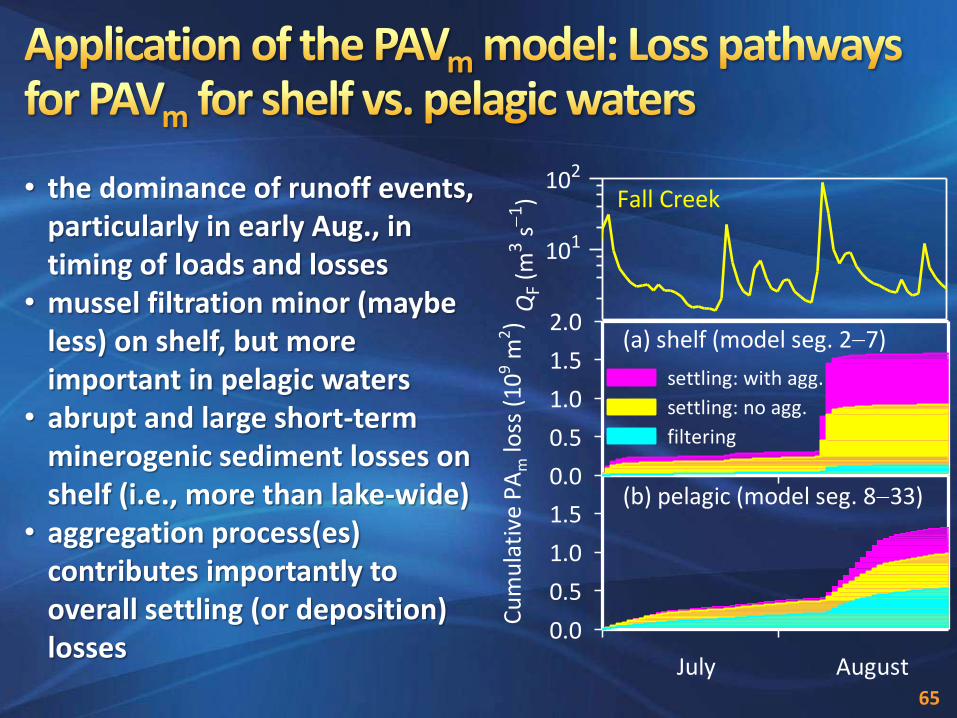
• the dominance of runoff events, particularly in early Aug., in timing of loads and losses
• mussel filtration minor (maybe less) on shelf, but more important in pelagic waters
• abrupt and large short-term minerogenic sediment losses on shelf (i.e., more than lake-wide)
• aggregation process(es) contributes importantly to overall settling (or deposition) losses
July August
0.0
0.5
1.0
1.5C
um
ula
tive
PA
m lo
ss (
109 m
2)
0.0
0.5
1.0
1.5
2.0
settling: with agg.
settling: no agg.
filtering
(a) shelf (model seg. 2 7)
(b) pelagic (model seg. 8 33)
65
101
102
QF
(m3 s
-1) Fall Creek
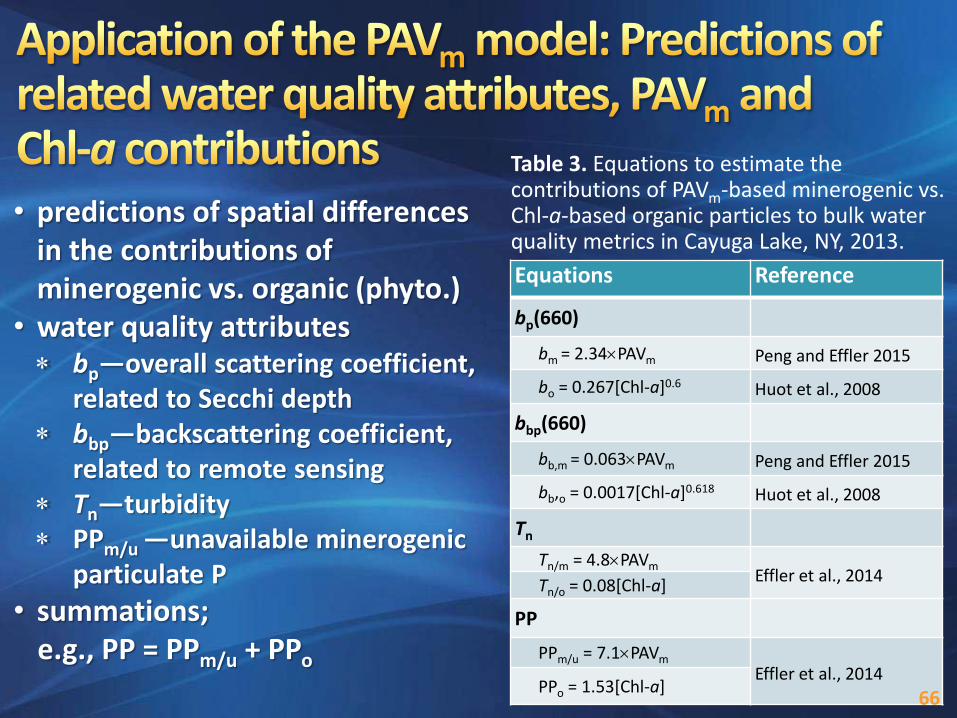
Table 3. Equations to estimate the contributions of PAVm-based minerogenic vs. Chl-a-based organic particles to bulk water quality metrics in Cayuga Lake, NY, 2013.
Equations Reference
bp(660)
bm = 2.34PAVm Peng and Effler 2015
bo = 0.267[Chl-a]0.6 Huot et al., 2008
bbp(660)
bb,m = 0.063PAVm Peng and Effler 2015
bb,o = 0.0017[Chl-a]0.618 Huot et al., 2008
Tn
Tn/m = 4.8PAVm Effler et al., 2014
Tn/o = 0.08[Chl-a]
PP
PPm/u = 7.1PAVm Effler et al., 2014
PPo = 1.53[Chl-a]
• predictions of spatial differences in the contributions of minerogenic vs. organic (phyto.)
• water quality attributes bp—overall scattering coefficient,
related to Secchi depth bbp—backscattering coefficient,
related to remote sensing Tn—turbidity PPm/u —unavailable minerogenic
particulate P
• summations; e.g., PP = PPm/u + PPo
66
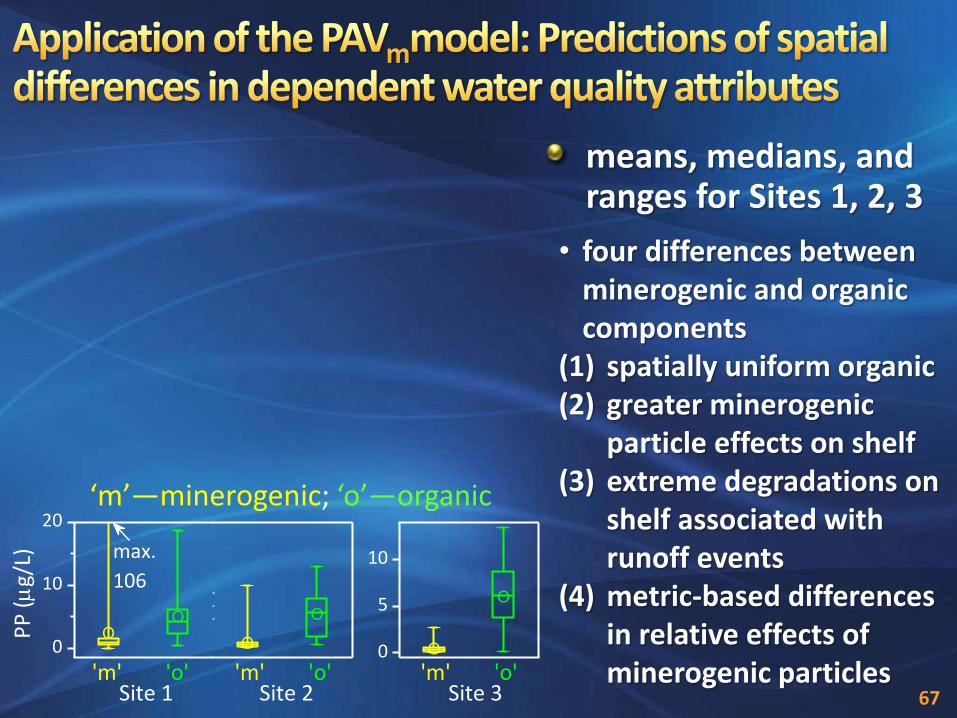
• four differences between minerogenic and organic components
(1) spatially uniform organic (2) greater minerogenic
particle effects on shelf (3) extreme degradations on
shelf associated with runoff events
(4) metric-based differences in relative effects of minerogenic particles
means, medians, and ranges for Sites 1, 2, 3
67
‘m’—minerogenic; ‘o’—organic
max.
106
O
O
OO
O
O
0
5
10
'm' 'o'
Site 3
0
10
20
'm' 'o'Site 1
PP
(
g/L)
'm' 'o'Site 2
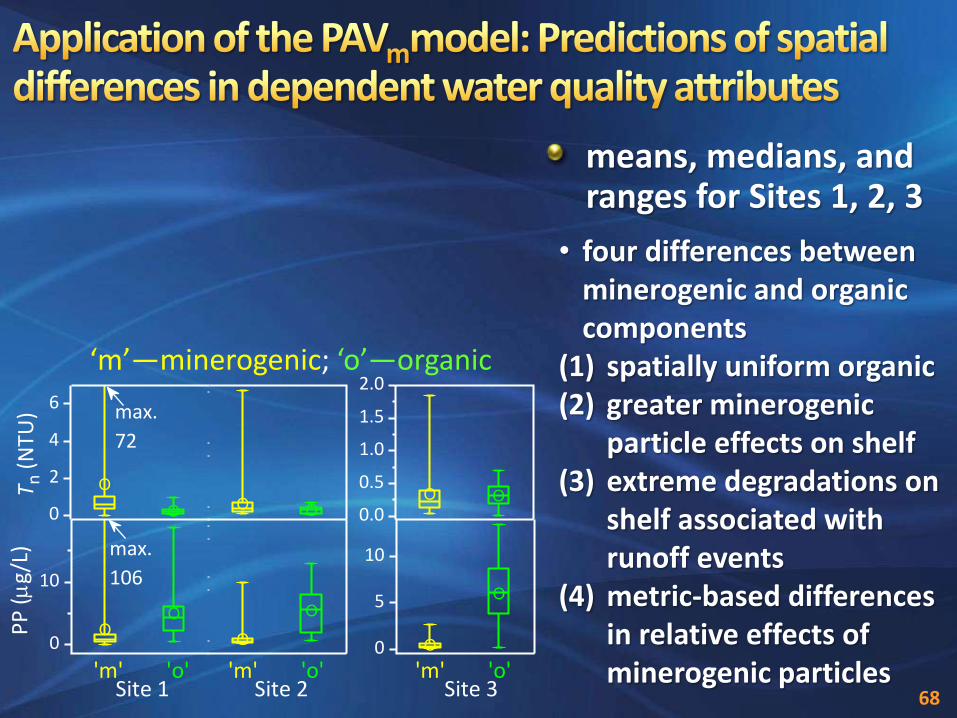
• four differences between minerogenic and organic components
(1) spatially uniform organic (2) greater minerogenic
particle effects on shelf (3) extreme degradations on
shelf associated with runoff events
(4) metric-based differences in relative effects of minerogenic particles
means, medians, and ranges for Sites 1, 2, 3
max.
106
max.
72
O
O
OO
O
O
O
O O OO O
0
5
10
'm' 'o'
Site 3
0
10
'm' 'o'Site 1
PP
(
g/L)
'm' 'o'Site 2
0
2
4
6
T n (
NTU
)
0.0
0.5
1.0
1.5
2.0‘m’—minerogenic; ‘o’—organic
68
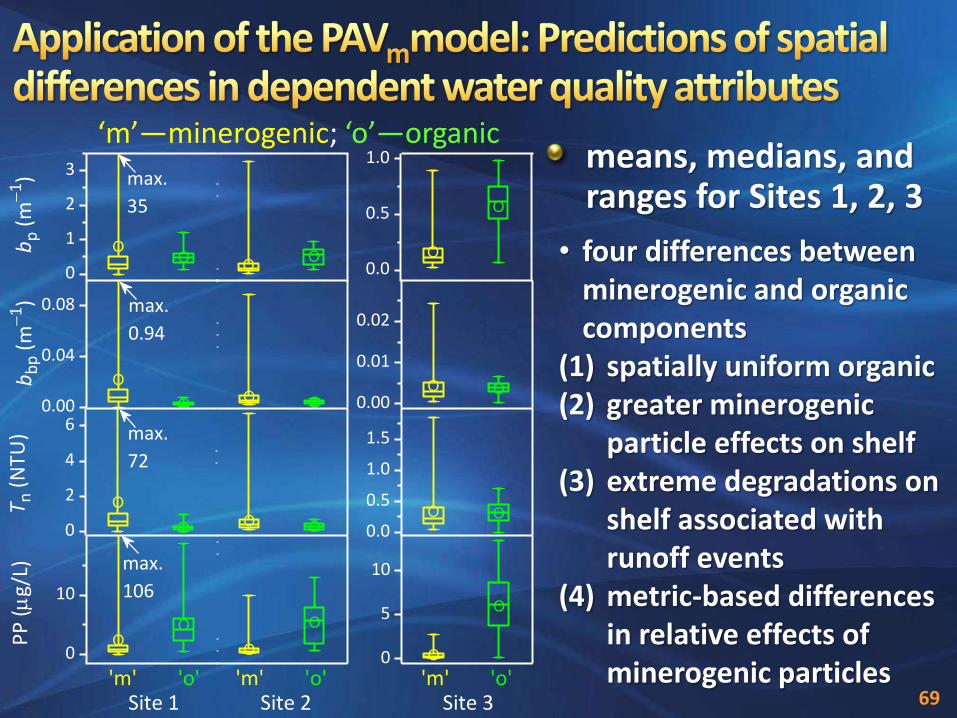
• four differences between minerogenic and organic components
(1) spatially uniform organic (2) greater minerogenic
particle effects on shelf (3) extreme degradations on
shelf associated with runoff events
(4) metric-based differences in relative effects of minerogenic particles
means, medians, and ranges for Sites 1, 2, 3
max.
106
max.
72
max.
0.94
max.
35
O
O
OO
O
O
O
O O OO O
O
O O OO O
OO
OO O
O
0
5
10
Site 3'm' 'o' 'm' 'o' 'm' 'o'
0
10
Site 1
PP
(
g/L)
Site 2
0
2
4
6
T n (
NTU
)
0.0
0.5
1.0
1.5
0.00
0.04
0.08
bb
p (
m-
1)
0.00
0.01
0.02
0
1
2
3
bp (
m-
1 )
0.0
0.5
1.0‘m’—minerogenic; ‘o’—organic
69
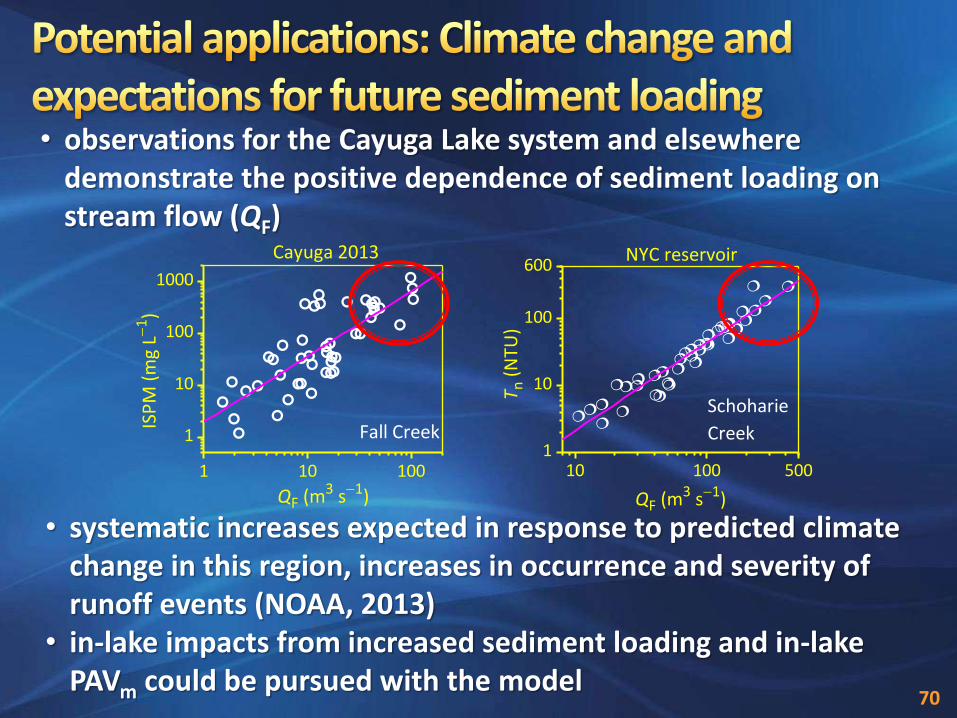
• observations for the Cayuga Lake system and elsewhere
demonstrate the positive dependence of sediment loading on stream flow (QF)
• systematic increases expected in response to predicted climate change in this region, increases in occurrence and severity of runoff events (NOAA, 2013)
• in-lake impacts from increased sediment loading and in-lake PAVm could be pursued with the model
1 10 100
1
10
100
1000
Fall CreekISP
M (
mg
L-1)
QF (m3 s-1)
Cayuga 2013
10 100 5001
10
100
600
Schoharie
Creek
NYC reservoir
T n (
NTU
)QF (m3 s-1)
70
1. PAVm model concepts
2. modeled particle loss processes
3. model performance targets
4. model performance evaluations
5. model applications
6. summary
mass balance type model for PAVm, partitioned into four size class contributions, has been developed and successfully tested for Cayuga Lake supported by long-term monitoring of PAVm in the lake, shorter-term for the tributaries sources of PAVm—inputs from tributaries, primarily during runoff events sink processes (n = 3) represented: (1) settling, (2) enhancement from aggregation, and (3) grazing by mussels
72
See Abstract: Gelda, Effler, Prestigiacomo, Peng, and Watkins. 2015b. “Simulation of minerogenic particle populations in time and space in Cayuga Lake, New York, in response to runoff events”, submitted to Inland Waters
localized external loads of minerogenic sediment and increases from runoff events were well simulated, including: 1) higher PAVm levels on the shelf following events 2) positive dependence of the shelf increases on magnitude of the
event 3) shelf deposition predictions consistent with sediment trap
observations
settling/aggregation losses large for PAVm on the shelf for major runoff events protocols to use PAVm predictions to quantify the important effects of these particles on optical and P water quality metrics, particularly for the shelf, are demonstrated
73