Embed Size (px)
Citation preview
1
Measuring and Enabling Resiliency in Distribution Systems With Multiple Microgrids
Sayonsom ChandaMajor Advisor: Dr. Anurag K. Srivastava
2
Presentation Outline
– Problem Statement• Concept of Resiliency applied to power systems
– Literature Review• What has been done so far and what are the research gaps?
– Computation of Resiliency Metrics• mathematical formulation
– Enabling resiliency• Using multiple microgrids
– Simulation and Results• On real and standard test feeders
– Conclusions
3
Presentation Outline
– Problem Statement• Concept of Resiliency applied to power systems
– Literature Review• What has been done so far and what are the research gaps?
– Computation of Resiliency Metrics• mathematical formulation
– Enabling resiliency• Using multiple microgrids
– Simulation and Results• On real and standard test feeders
– Conclusions
4
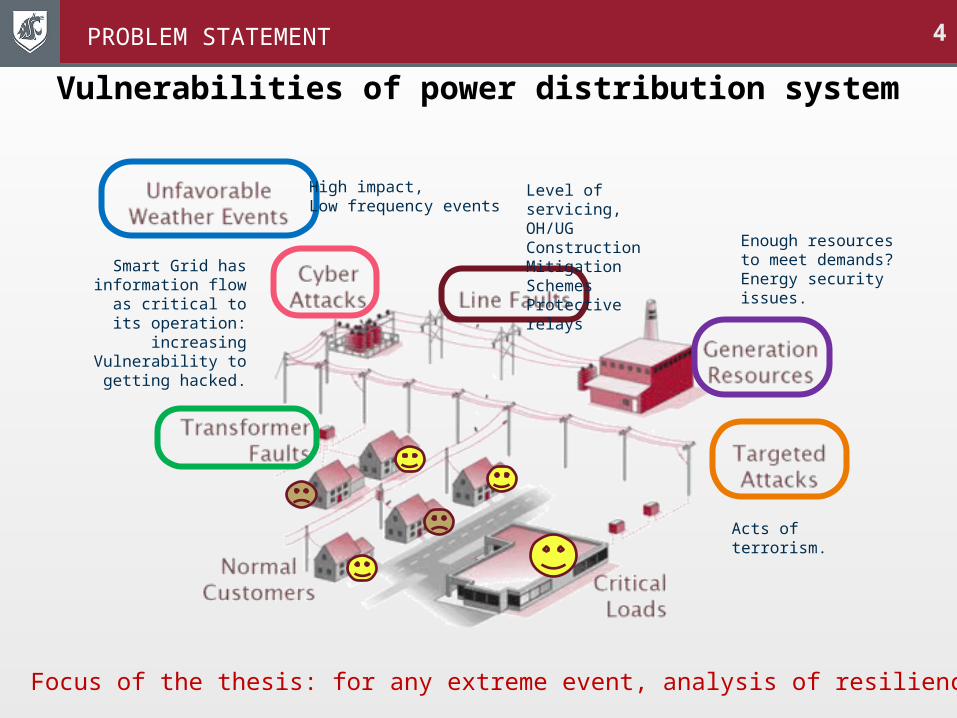
Vulnerabilities of power distribution system
High impact,Low frequency events
Smart Grid has information flowas critical to its
operation: increasingVulnerability to getting
hacked.
Level of servicing,OH/UG ConstructionMitigation SchemesProtective relays Enough resources to
meet demands? Energy security issues.
Acts of terrorism.
PROBLEM STATEMENT
Focus of the thesis: for any extreme event, analysis of resiliency.
Background: Effect of weather on continuity of power supply
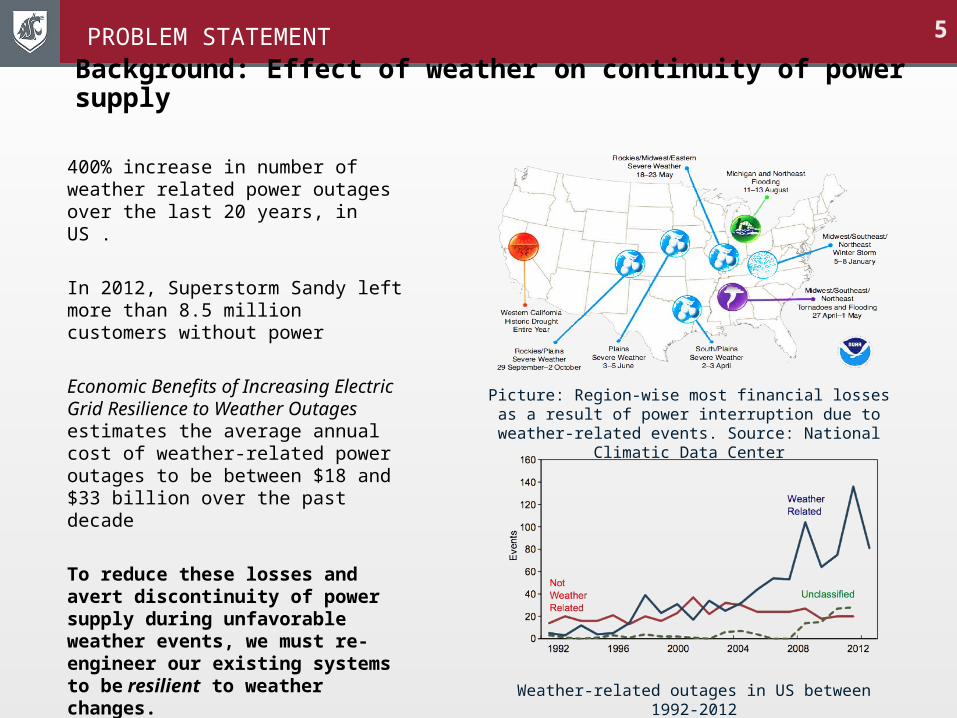
400% increase in number of weather related power outages over the last 20 years, in US .
In 2012, Superstorm Sandy left more than 8.5 million customers without power
Economic Benefits of Increasing Electric Grid Resilience to Weather Outages estimates the average annual cost of weather-related power outages to be between $18 and $33 billion over the past decade
To reduce these losses and avert discontinuity of power supply during unfavorable weather events, we must re-engineer our existing systems to be resilient to weather changes.
Weather-related outages in US between 1992-2012
Picture: Region-wise most financial losses as a result of power interruption due to weather-related events.
Source: National Climatic Data Center
PROBLEM STATEMENT 5
6
Presentation Outline
– Problem Statement• Concept of Resiliency applied to power systems
– Literature Review• What has been done so far and what are the research gaps?
– Computation of Resiliency Metrics• mathematical formulation
– Enabling resiliency• Using multiple microgrids
– Simulation and Results• On real and standard test feeders
– Conclusions
7
Concept of resilience applied to power systems
• Resilience of networks [social networks, water networks, airport networks] is well-studied. However, resilience of power distribution system is a new topic of interest.
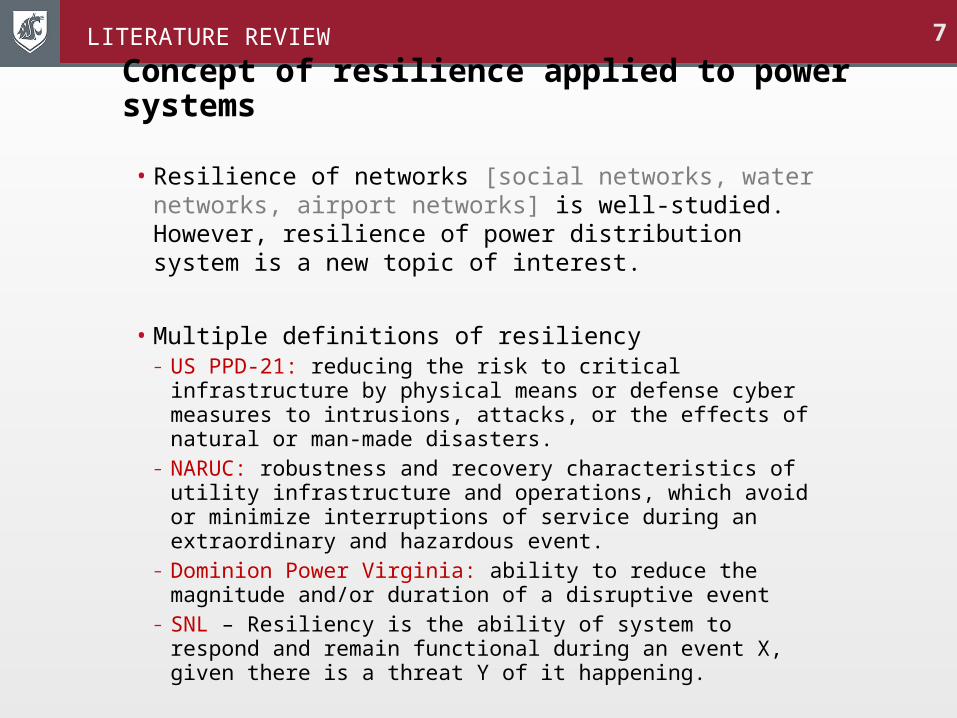
• Multiple definitions of resiliency– US PPD-21: reducing the risk to critical infrastructure by
physical means or defense cyber measures to intrusions, attacks, or the effects of natural or man-made disasters.
– NARUC: robustness and recovery characteristics of utility infrastructure and operations, which avoid or minimize interruptions of service during an extraordinary and hazardous event.
– Dominion Power Virginia: ability to reduce the magnitude and/or duration of a disruptive event
– SNL – Resiliency is the ability of system to respond and remain functional during an event X, given there is a threat Y of it happening.
LITERATURE REVIEW
8
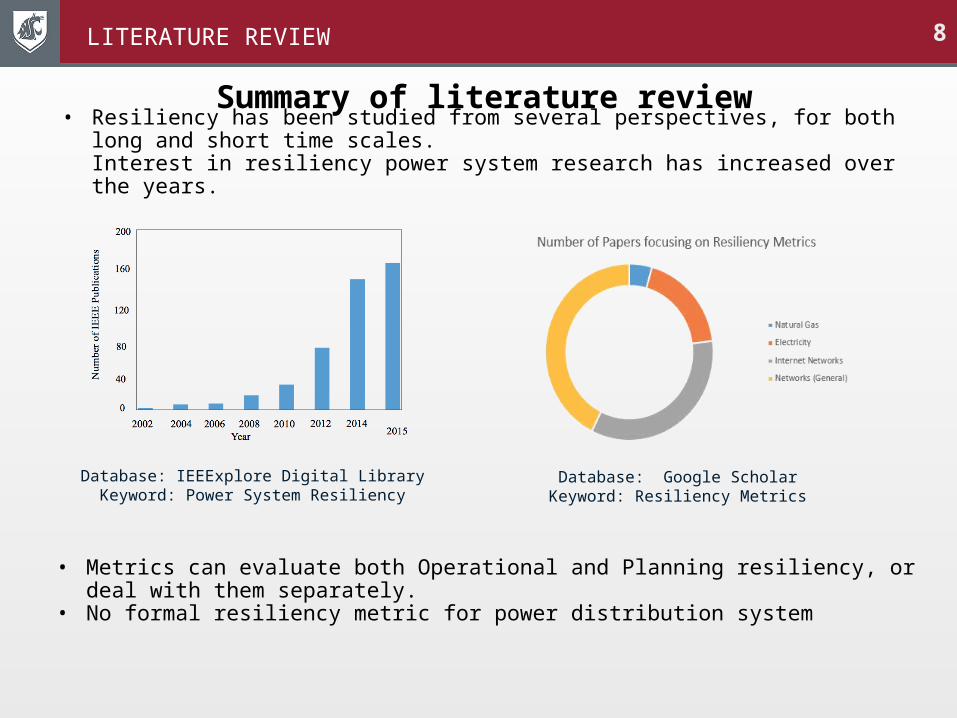
• Resiliency has been studied from several perspectives, for both long and short time scales.Interest in resiliency power system research has increased over the years.
LITERATURE REVIEW
Summary of literature review
Database: IEEExplore Digital LibraryKeyword: Power System Resiliency
Database: Google ScholarKeyword: Resiliency Metrics
• Metrics can evaluate both Operational and Planning resiliency, or deal with them separately.
• No formal resiliency metric for power distribution system
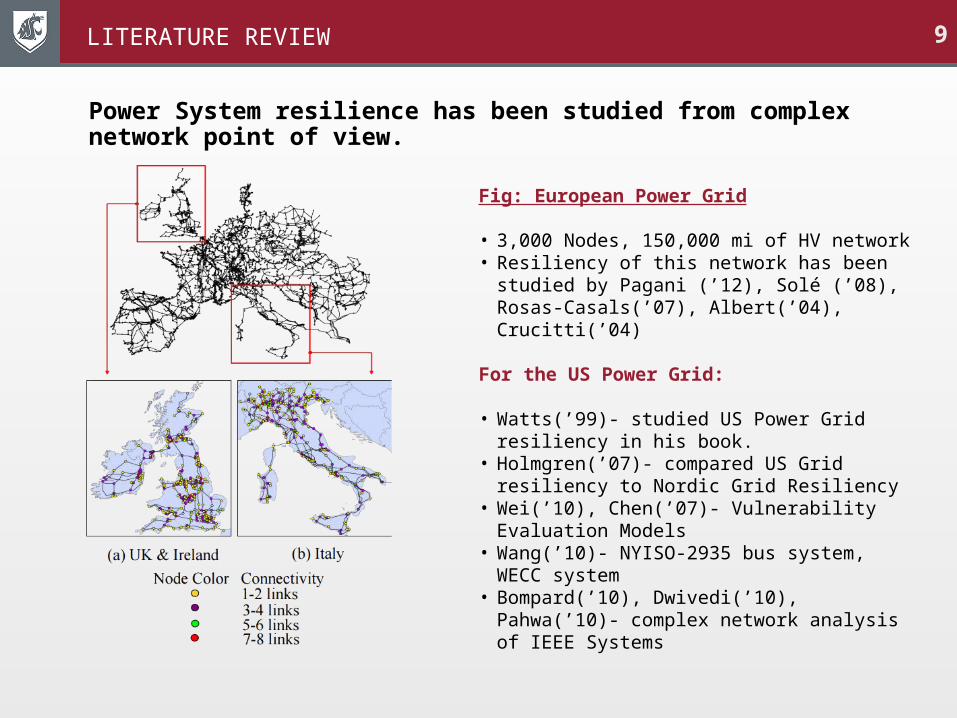
Power System resilience has been studied from complex network point of view.
Fig: European Power Grid
• 3,000 Nodes, 150,000 mi of HV network• Resiliency of this network has been studied
by Pagani (’12), Solé (’08), Rosas-Casals(’07), Albert(’04), Crucitti(’04)
For the US Power Grid:
• Watts(’99)- studied US Power Grid resiliency in his book.
• Holmgren(’07)- compared US Grid resiliency to Nordic Grid Resiliency
• Wei(’10), Chen(’07)- Vulnerability Evaluation Models
• Wang(’10)- NYISO-2935 bus system, WECC system
• Bompard(’10), Dwivedi(’10), Pahwa(’10)- complex network analysis of IEEE Systems
9LITERATURE REVIEW
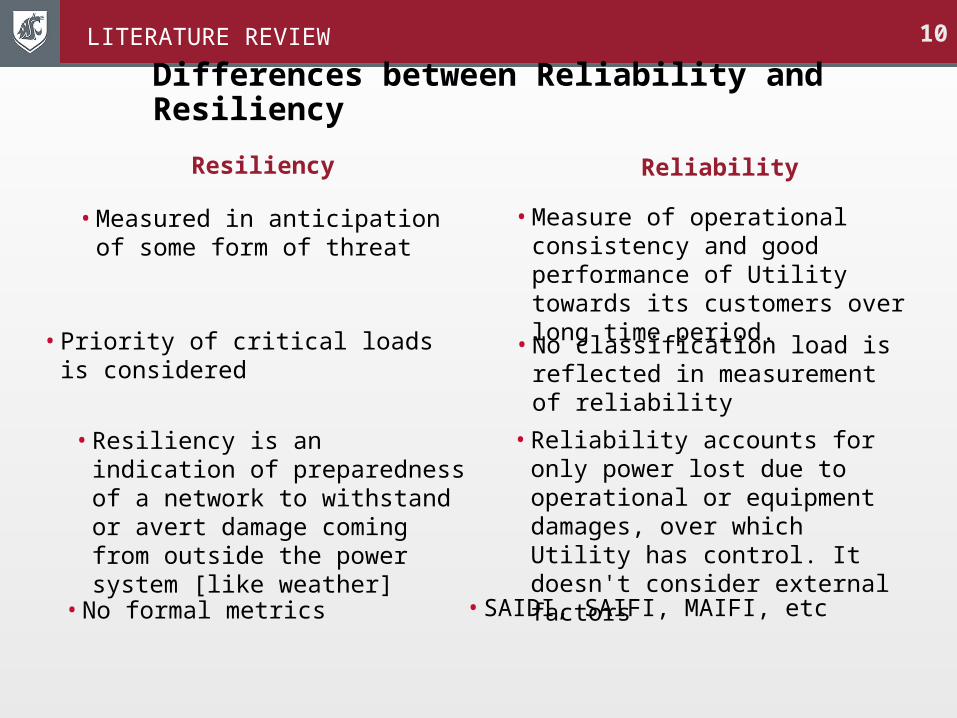
Differences between Reliability and Resiliency
Resiliency
• Measured in anticipation of some form of threat
Reliability
• Measure of operational consistency and good performance of Utility towards its customers over long time period.
• Priority of critical loads is considered
• No classification load is reflected in measurement of reliability
• Resiliency is an indication of preparedness of a network to withstand or avert damage coming from outside the power system [like weather]
• Reliability accounts for only power lost due to operational or equipment damages, over which Utility has control. It doesn't consider external factors
• No formal metrics • SAIDI, SAIFI, MAIFI, etc
10LITERATURE REVIEW
11LITERATURE REVIEW
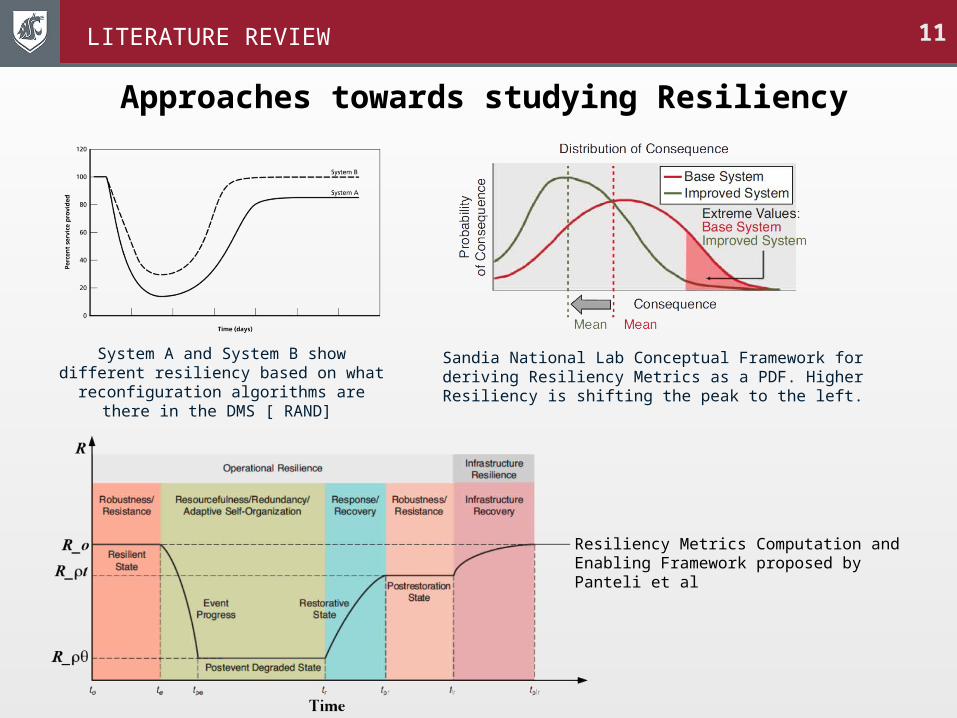
Approaches towards studying Resiliency
System A and System B show different resiliency based on what reconfiguration algorithms are there in the DMS [ RAND]
Sandia National Lab Conceptual Framework for deriving Resiliency Metrics as a PDF. Higher Resiliency is shifting the peak to the left.
Resiliency Metrics Computation and Enabling Framework proposed by Panteli et al
12
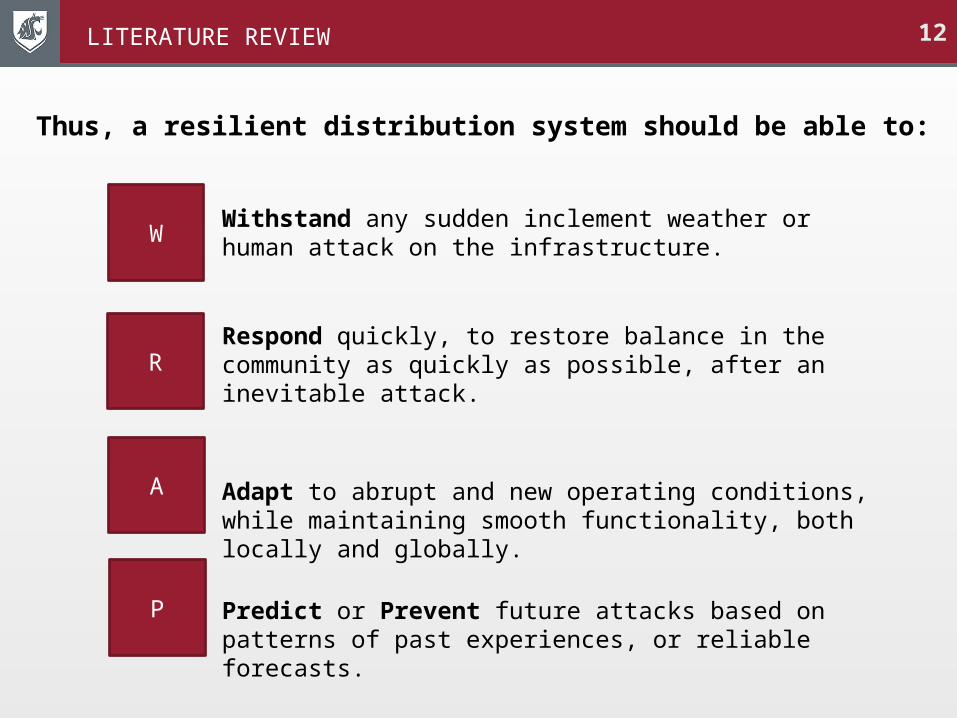
Thus, a resilient distribution system should be able to:
W
R
A
P
Withstand any sudden inclement weather or human attack on the infrastructure.
Respond quickly, to restore balance in the community as quickly as possible, after an inevitable attack.
Adapt to abrupt and new operating conditions, while maintaining smooth functionality, both locally and globally.
Predict or Prevent future attacks based on patterns of past experiences, or reliable forecasts.
LITERATURE REVIEW
13
Presentation Outline
– Problem Statement• Concept of Resiliency applied to power systems
– Literature Review• What has been done so far and what are the research gaps?
– Computation of Resiliency Metrics• mathematical formulation
– Enabling resiliency• Using multiple microgrids
– Simulation and Results• On real and standard test feeders
– Conclusions
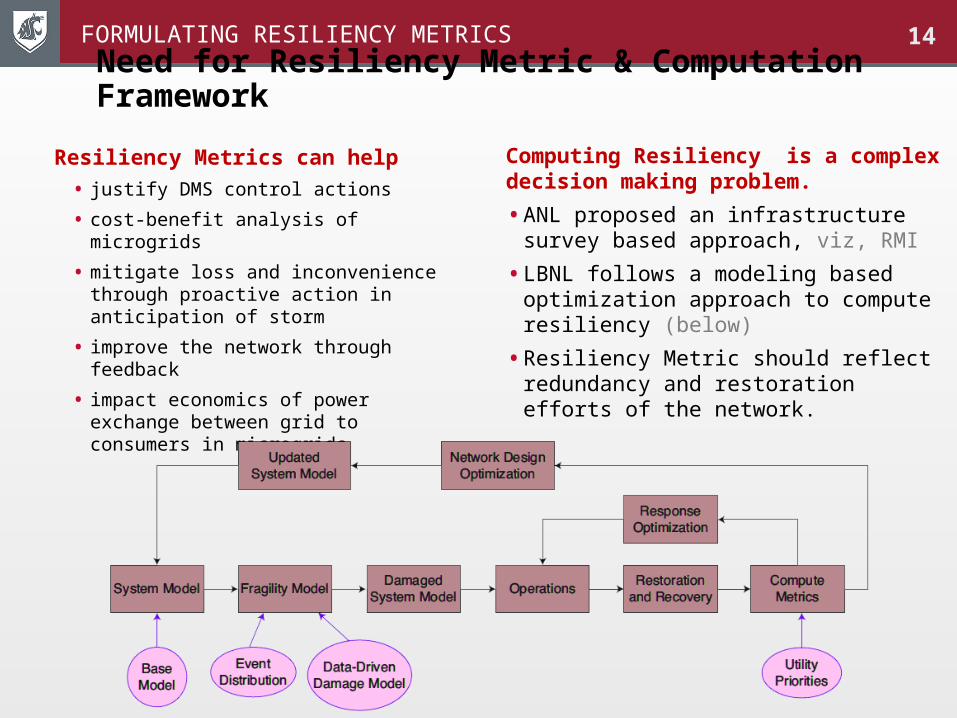
Need for Resiliency Metric & Computation Framework
Resiliency Metrics can help
• justify DMS control actions
• cost-benefit analysis of microgrids
• mitigate loss and inconvenience through proactive action in anticipation of storm
• improve the network through feedback
• impact economics of power exchange between grid to consumers in microgrids
Computing Resiliency is a complex decision making problem.
• ANL proposed an infrastructure survey based approach, viz, RMI
• LBNL follows a modeling based optimization approach to compute resiliency (below)
• Resiliency Metric should reflect redundancy and restoration efforts of the network.
14FORMULATING RESILIENCY METRICS
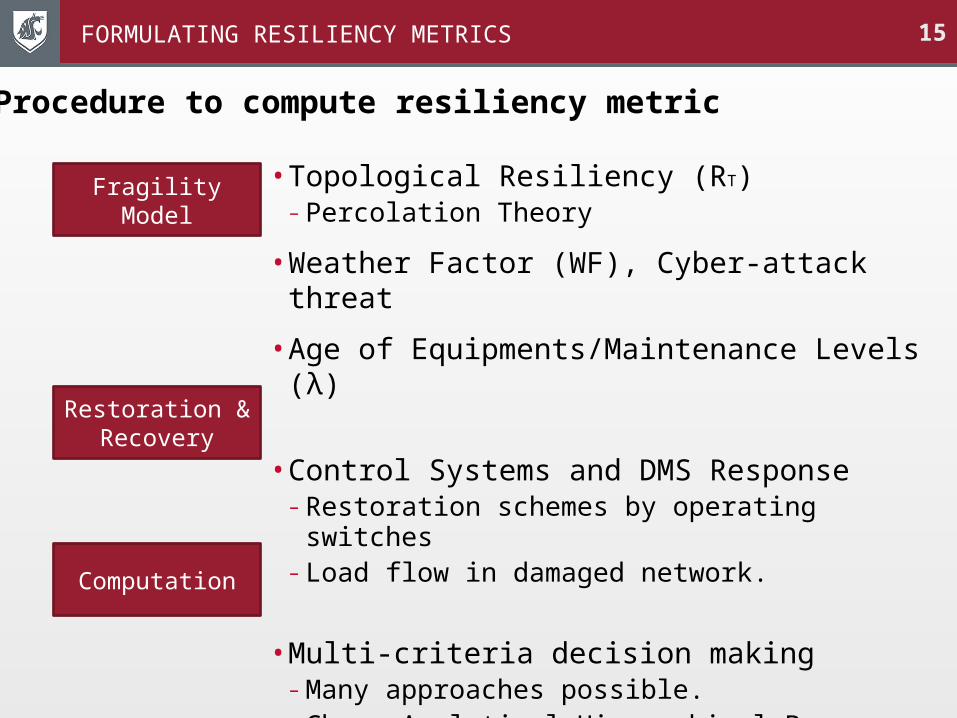
15
Procedure to compute resiliency metric
• Topological Resiliency (RT)– Percolation Theory
• Weather Factor (WF), Cyber-attack threat
• Age of Equipments/Maintenance Levels (λ)
• Control Systems and DMS Response– Restoration schemes by operating switches– Load flow in damaged network.
• Multi-criteria decision making– Many approaches possible.– Chose Analytical Hierarchical Process (AHP)
FORMULATING RESILIENCY METRICS
Fragility Model
Restoration & Recovery
Computation
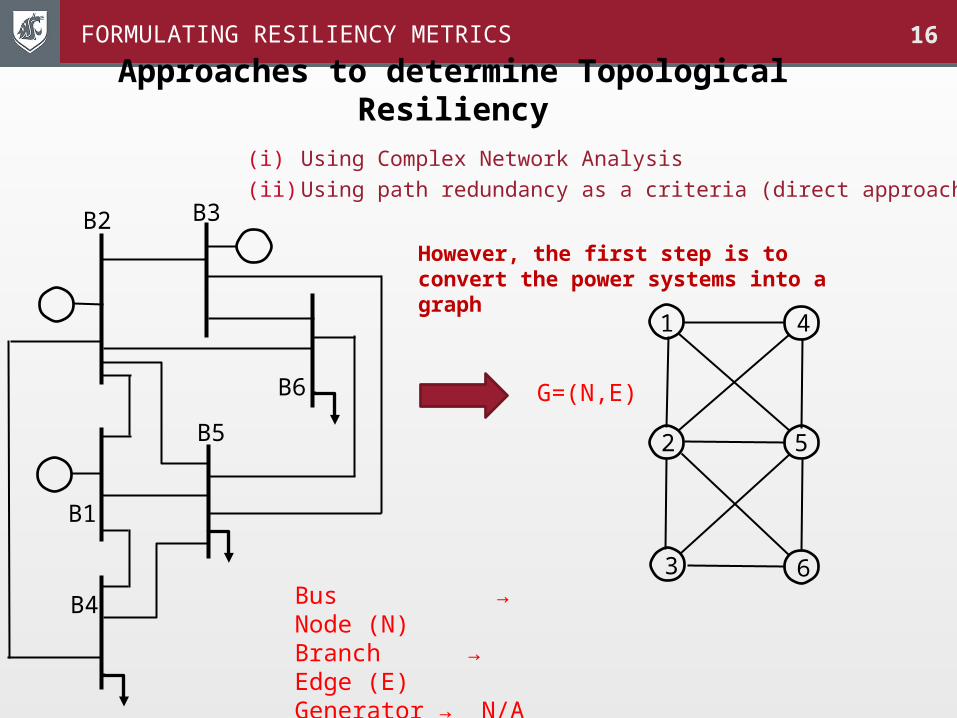
Approaches to determine Topological Resiliency
(i) Using Complex Network Analysis(ii) Using path redundancy as a criteria (direct approach)
However, the first step is to convert the power systems into a graph
B1
B6
B2 B3
B4
B5
1
2
3
4
5
6Bus → Node (N)Branch → Edge (E)Generator → N/ALoad → N/A
G=(N,E)
16FORMULATING RESILIENCY METRICS
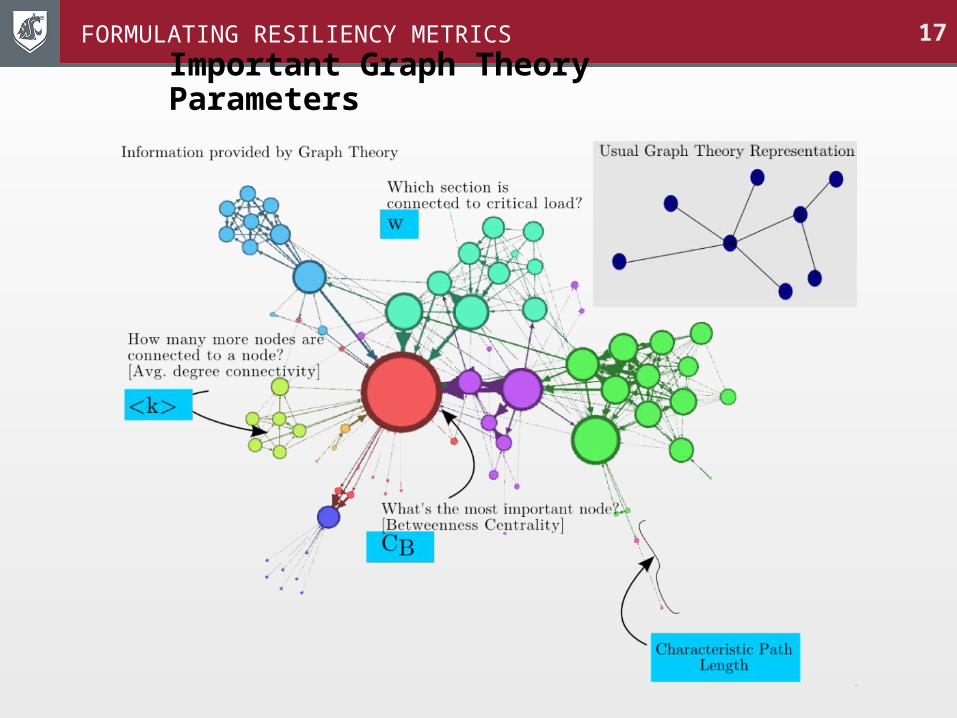
17Important Graph Theory Parameters
FORMULATING RESILIENCY METRICS
18
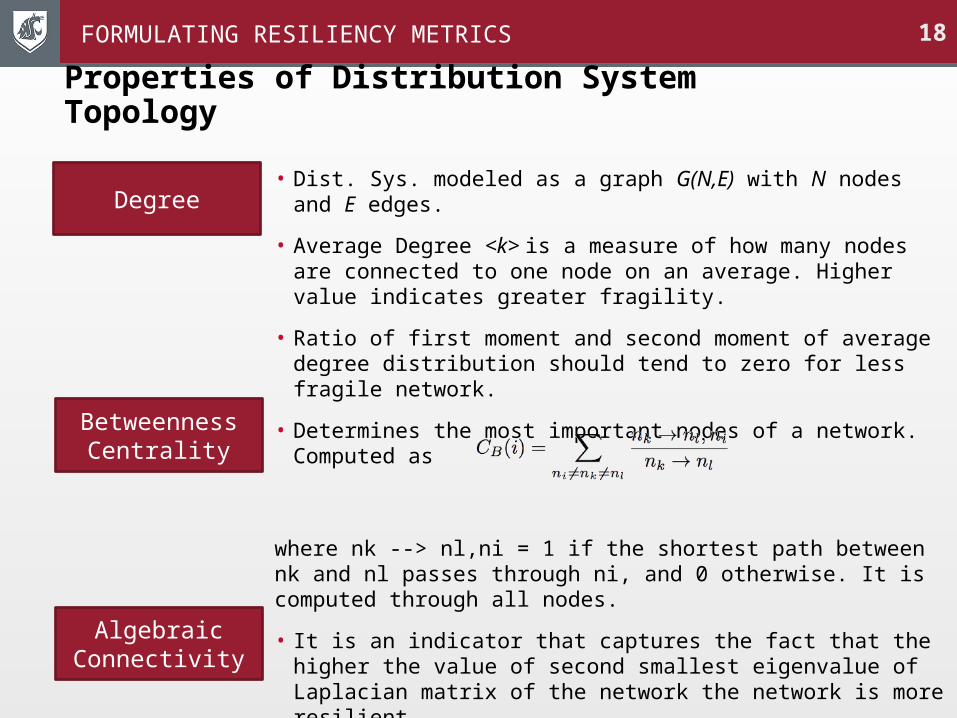
Properties of Distribution System Topology
• Dist. Sys. modeled as a graph G(N,E) with N nodes and E edges.
• Average Degree <k> is a measure of how many nodes are connected to one node on an average. Higher value indicates greater fragility.
• Ratio of first moment and second moment of average degree distribution should tend to zero for less fragile network.
• Determines the most important nodes of a network. Computed as
where nk --> nl,ni = 1 if the shortest path between nk and nl passes through ni, and 0 otherwise. It is computed through all nodes.
• It is an indicator that captures the fact that the higher the value of second smallest eigenvalue of Laplacian matrix of the network the network is more resilient
Degree
Betweenness Centrality
Algebraic Connectivity
FORMULATING RESILIENCY METRICS
19
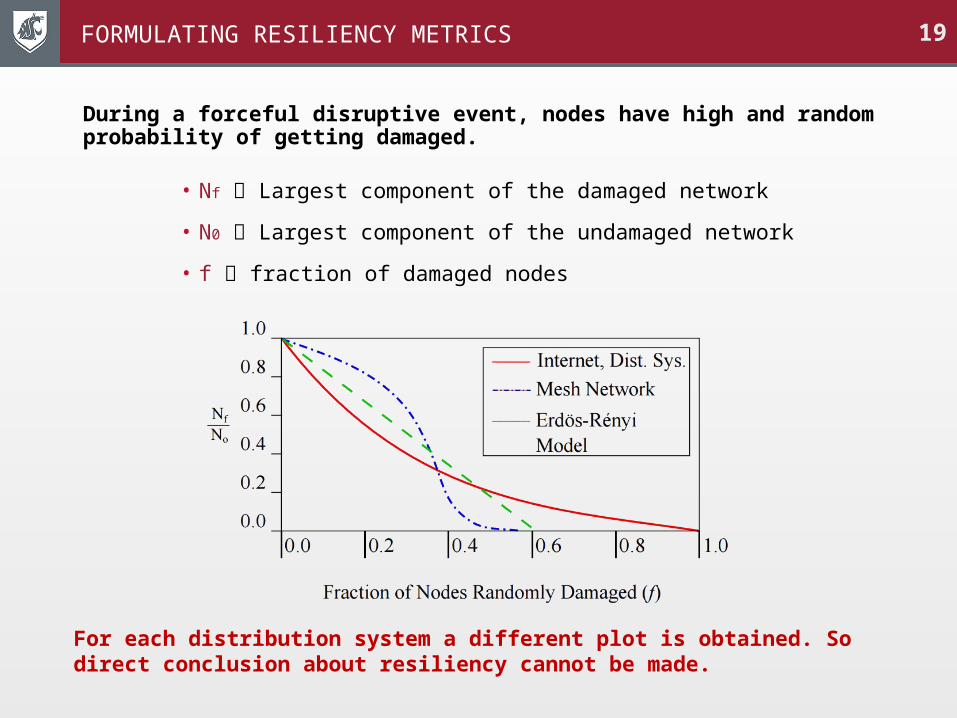
During a forceful disruptive event, nodes have high and random probability of getting damaged.
• Nf Largest component of the damaged network
• N0 Largest component of the undamaged network
• f fraction of damaged nodes
For each distribution system a different plot is obtained. So direct conclusion about resiliency cannot be made.
FORMULATING RESILIENCY METRICS
20
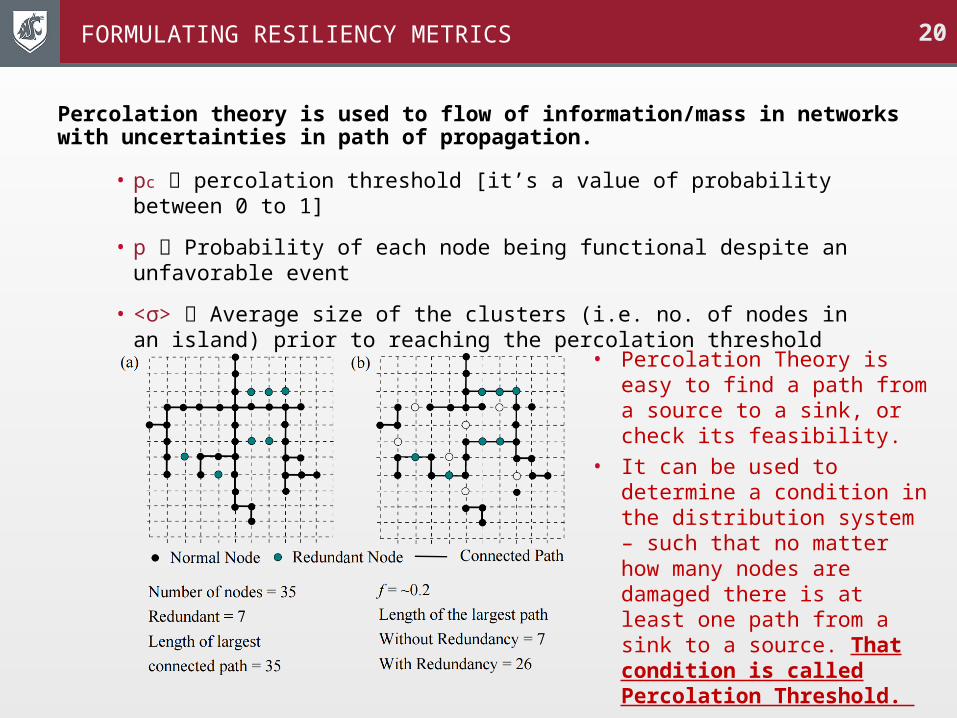
Percolation theory is used to flow of information/mass in networks with uncertainties in path of propagation.
• pc percolation threshold [it’s a value of probability between 0 to 1]
• p Probability of each node being functional despite an unfavorable event
• <σ> Average size of the clusters (i.e. no. of nodes in an island) prior to reaching the percolation threshold
• Percolation Theory is easy to find a path from a source to a sink, or check its feasibility.
• It can be used to determine a condition in the distribution system – such that no matter how many nodes are damaged there is at least one path from a sink to a source. That condition is called Percolation Threshold.
FORMULATING RESILIENCY METRICS
21
Simplistic Study of Percolation Threshold
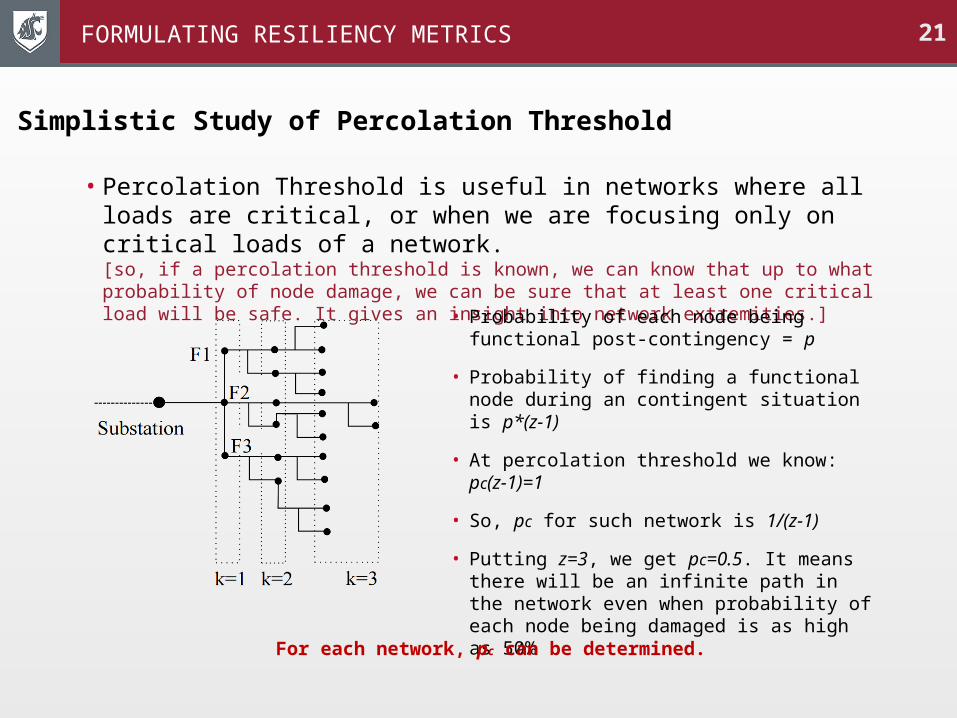
• Percolation Threshold is useful in networks where all loads are critical, or when we are focusing only on critical loads of a network. [so, if a percolation threshold is known, we can know that up to what probability of node damage, we can be sure that at least one critical load will be safe. It gives an insight into network extremities.] • Probability of each node being functional
post-contingency = p
• Probability of finding a functional node during an contingent situation is p*(z-1)
• At percolation threshold we know: pc(z-1)=1
• So, pc for such network is 1/(z-1)
• Putting z=3, we get pc=0.5. It means there will be an infinite path in the network even when probability of each node being damaged is as high as 50%
For each network, pc can be determined.
FORMULATING RESILIENCY METRICS
22
Molloy-Reed Criteria for Percolation Threshold
• In an uncorrelated network with degree distribution P(k), the probability that an undamaged section is connected to an functional node of degree k is given by kP(k)/<k> - Molloy et al(’95), Cohen et al(’00), Arisi(’13).
• The percolation threshold is possible if and only if any two nodes, ni and nj of the infinite path is also connected to another node.
• In a network, percolation threshold can occur only when k2 = 2<k>, where k2 is the second moment of degree distribution, and <k> is the first moment of degree distribution.– The second moment provides the variance measuring the spread in the
degrees. Its square root is the standard deviation.– The first moment is the average degree of the nodes in the distribution
system
By comparing p with pc we can comment on the resiliency of system with respect to the threat. According to work by Essam(‘80), average cluster size can be determined using percolation threshold for each threat. This would enable us to get a preliminary idea about adequacy of redundant resources.
FORMULATING RESILIENCY METRICS
23
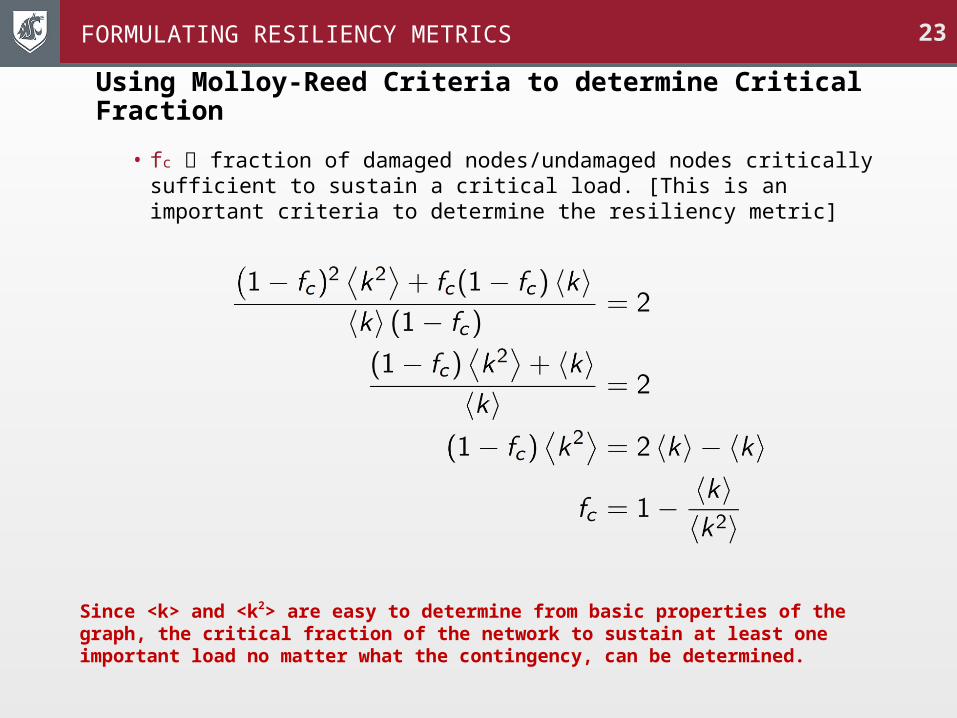
Using Molloy-Reed Criteria to determine Critical Fraction
• fc fraction of damaged nodes/undamaged nodes critically sufficient to sustain a critical load. [This is an important criteria to determine the resiliency metric]
Since <k> and <k2> are easy to determine from basic properties of the graph, the critical fraction of the network to sustain at least one important load no matter what the contingency, can be determined.
FORMULATING RESILIENCY METRICS
24
• The critical ratio of damaged to undamaged nodes in a network that sustained damages, is dependent on the ratio of variance and average degree distribution of the network configuration under configuration.
• Resilience of a distribution system configuration is dependent on the heterogeneity of the network. – In highly heterogeneous networks, <k2> ∞ consequently, fc 1,
which indicates theoretically infinite resiliency of the distribution system network to any sort of damages.
– So, the more resilient design (or re-design) of the distribution system is such that the variance in its degree distribution be maximized.
Since <k> and <k2> are easy to determine from basic properties of the graph, the critical fraction of the network to sustain at least one important load no matter what the contingency, can be determined.
Some insights:
FORMULATING RESILIENCY METRICS
25
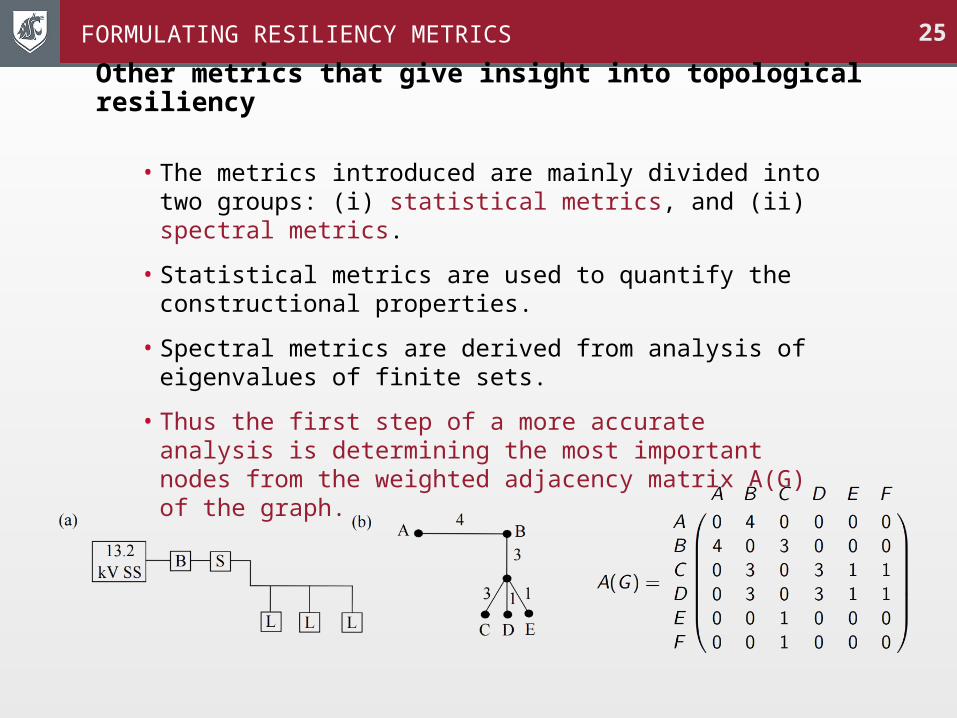
Other metrics that give insight into topological resiliency
• The metrics introduced are mainly divided into two groups: (i) statistical metrics, and (ii) spectral metrics.
• Statistical metrics are used to quantify the constructional properties.
• Spectral metrics are derived from analysis of eigenvalues of finite sets.
• Thus the first step of a more accurate analysis is determining the most important nodes from the weighted adjacency matrix A(G) of the graph.
FORMULATING RESILIENCY METRICS
26
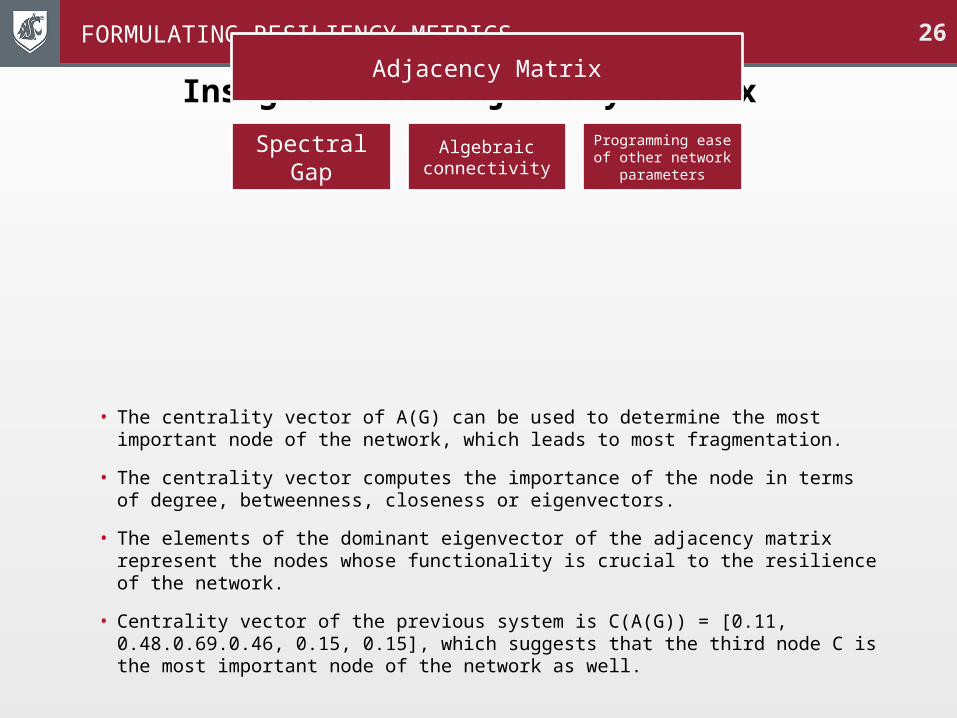
Insights from Adjacency Matrix
• The centrality vector of A(G) can be used to determine the most important node of the network, which leads to most fragmentation.
• The centrality vector computes the importance of the node in terms of degree, betweenness, closeness or eigenvectors.
• The elements of the dominant eigenvector of the adjacency matrix represent the nodes whose functionality is crucial to the resilience of the network.
• Centrality vector of the previous system is C(A(G)) = [0.11, 0.48.0.69.0.46, 0.15, 0.15], which suggests that the third node C is the most important node of the network as well.
FORMULATING RESILIENCY METRICSAdjacency Matrix
Spectral Gap
Algebraic connectivity
Programming ease of other network
parameters
27
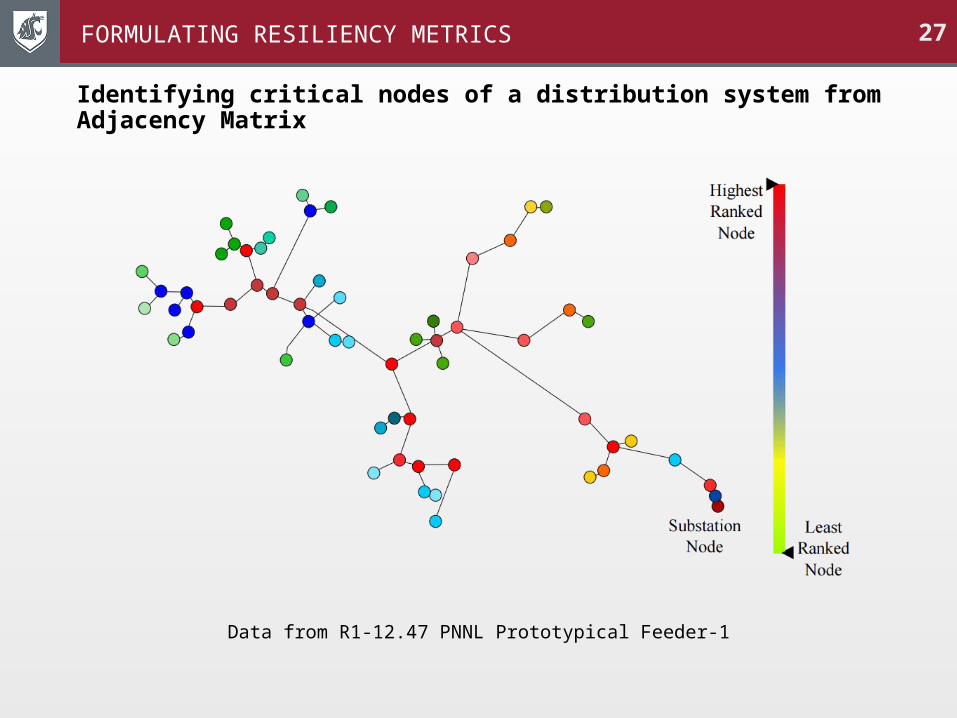
Identifying critical nodes of a distribution system from Adjacency Matrix
Data from R1-12.47 PNNL Prototypical Feeder-1
FORMULATING RESILIENCY METRICS
28
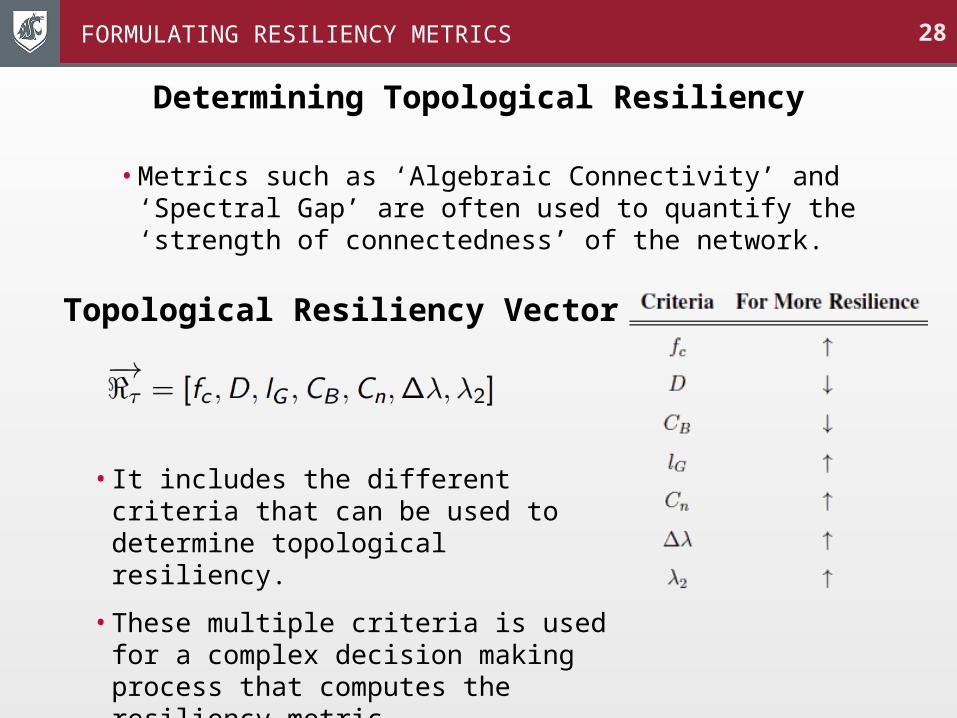
Determining Topological Resiliency
• Metrics such as ‘Algebraic Connectivity’ and ‘Spectral Gap’ are often used to quantify the ‘strength of connectedness’ of the network.
Topological Resiliency Vector
• It includes the different criteria that can be used to determine topological resiliency.
• These multiple criteria is used for a complex decision making process that computes the resiliency metric.
FORMULATING RESILIENCY METRICS
29
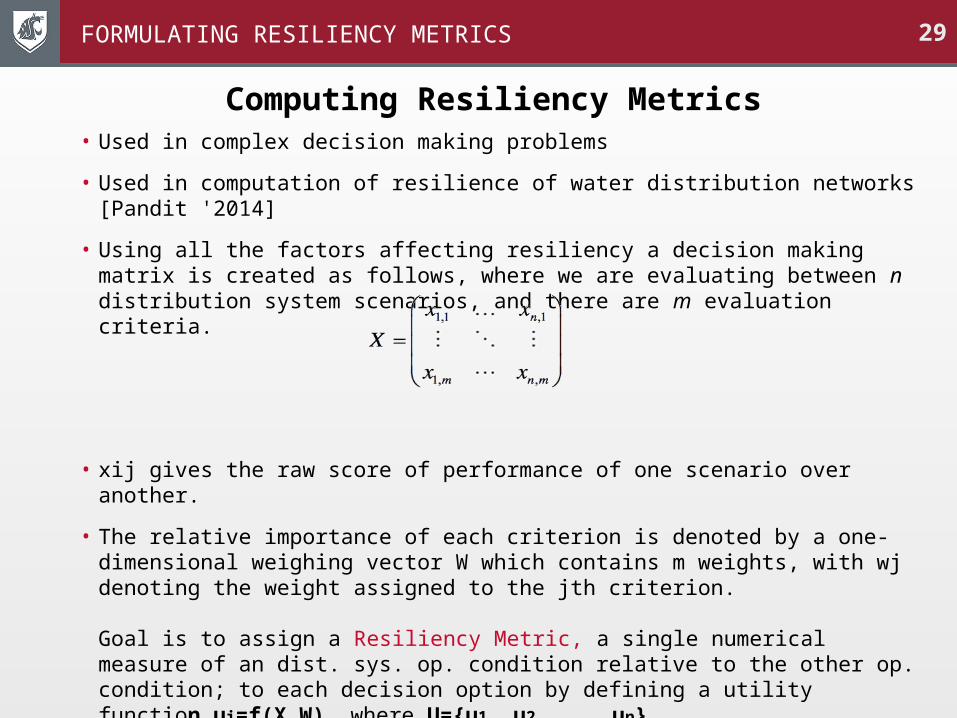
Computing Resiliency Metrics• Used in complex decision making problems
• Used in computation of resilience of water distribution networks [Pandit '2014]
• Using all the factors affecting resiliency a decision making matrix is created as follows, where we are evaluating between n distribution system scenarios, and there are m evaluation criteria.
• xij gives the raw score of performance of one scenario over another.
• The relative importance of each criterion is denoted by a one- dimensional weighing vector W which contains m weights, with wj denoting the weight assigned to the jth criterion.
Goal is to assign a Resiliency Metric, a single numerical measure of an dist. sys. op. condition relative to the other op. condition; to each decision option by defining a utility function ui=f(X,W), where U={u1, u2, ... un}
FORMULATING RESILIENCY METRICS
30
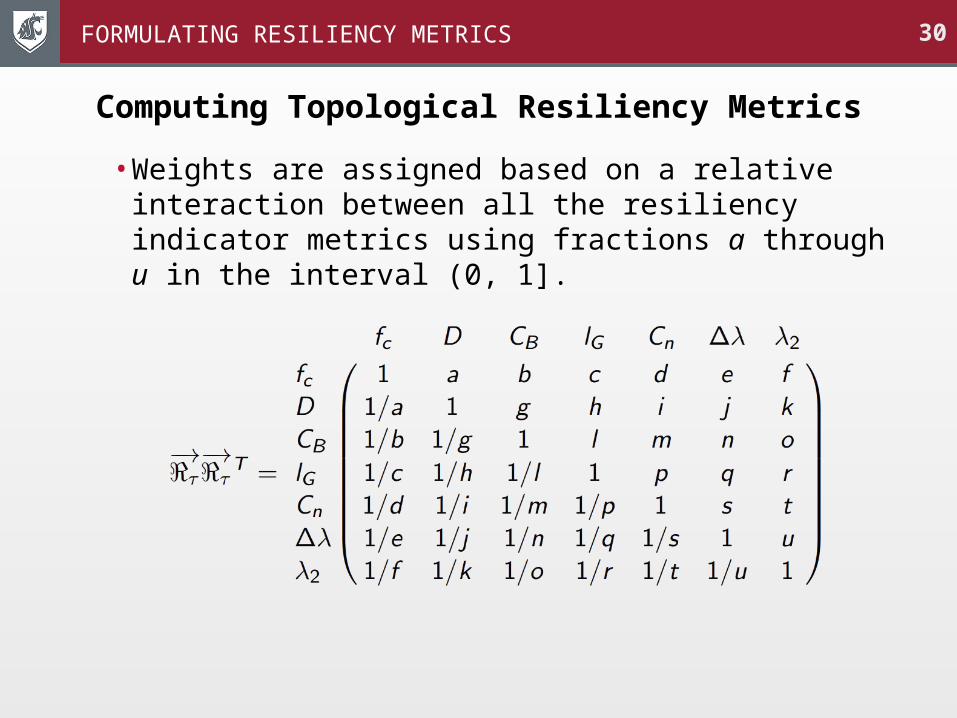
Computing Topological Resiliency Metrics
• Weights are assigned based on a relative interaction between all the resiliency indicator metrics using fractions a through u in the interval (0, 1].
FORMULATING RESILIENCY METRICS
31
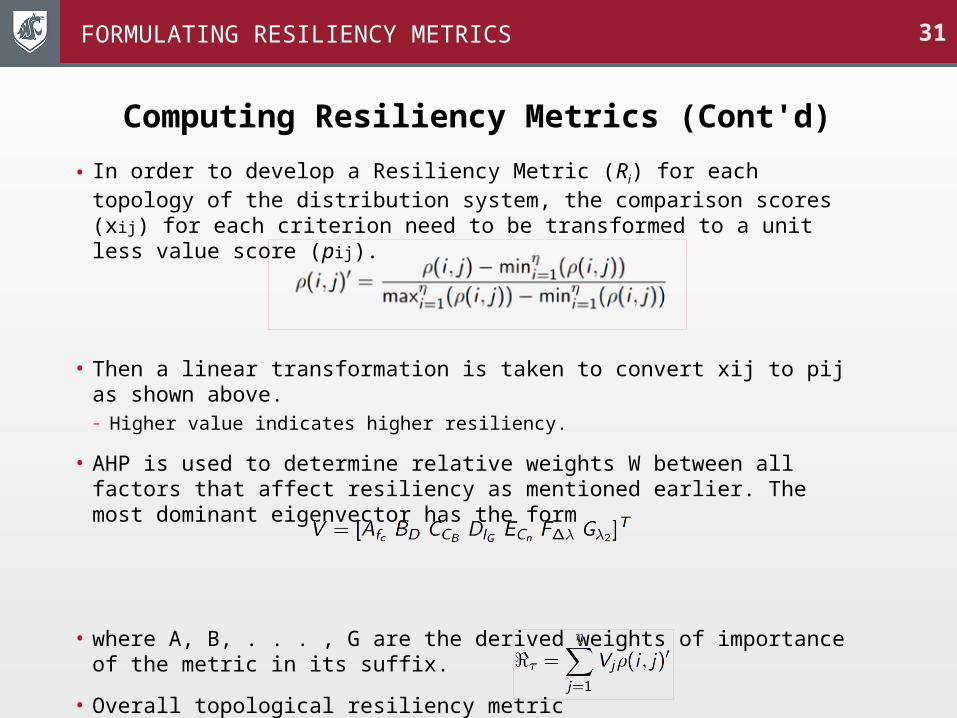
Computing Resiliency Metrics (Cont'd)
• In order to develop a Resiliency Metric (Ri) for each topology of the distribution system, the comparison scores (xij) for each criterion need to be transformed to a unit less value score (pij).
• Then a linear transformation is taken to convert xij to pij as shown above. – Higher value indicates higher resiliency.
• AHP is used to determine relative weights W between all factors that affect resiliency as mentioned earlier. The most dominant eigenvector has the form
• where A, B, . . . , G are the derived weights of importance of the metric in its suffix.
• Overall topological resiliency metric
FORMULATING RESILIENCY METRICS
32
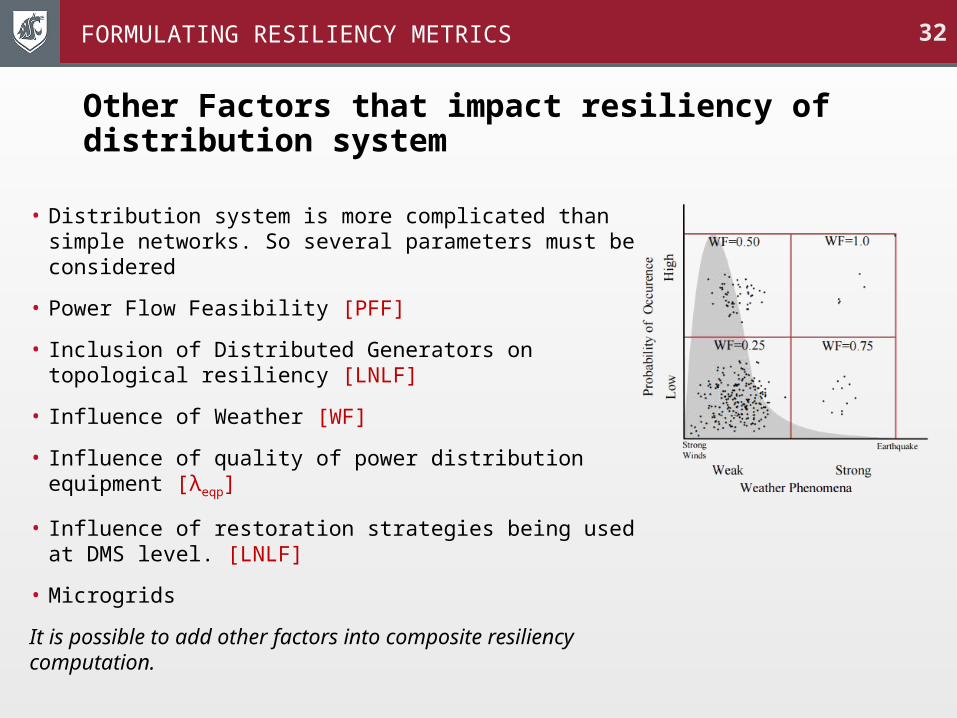
Other Factors that impact resiliency of distribution system
• Distribution system is more complicated than simple networks. So several parameters must be considered
• Power Flow Feasibility [PFF]
• Inclusion of Distributed Generators on topological resiliency [LNLF]
• Influence of Weather [WF]
• Influence of quality of power distribution equipment [λeqp]
• Influence of restoration strategies being used at DMS level. [LNLF]
• Microgrids
It is possible to add other factors into composite resiliency computation.
FORMULATING RESILIENCY METRICS
33
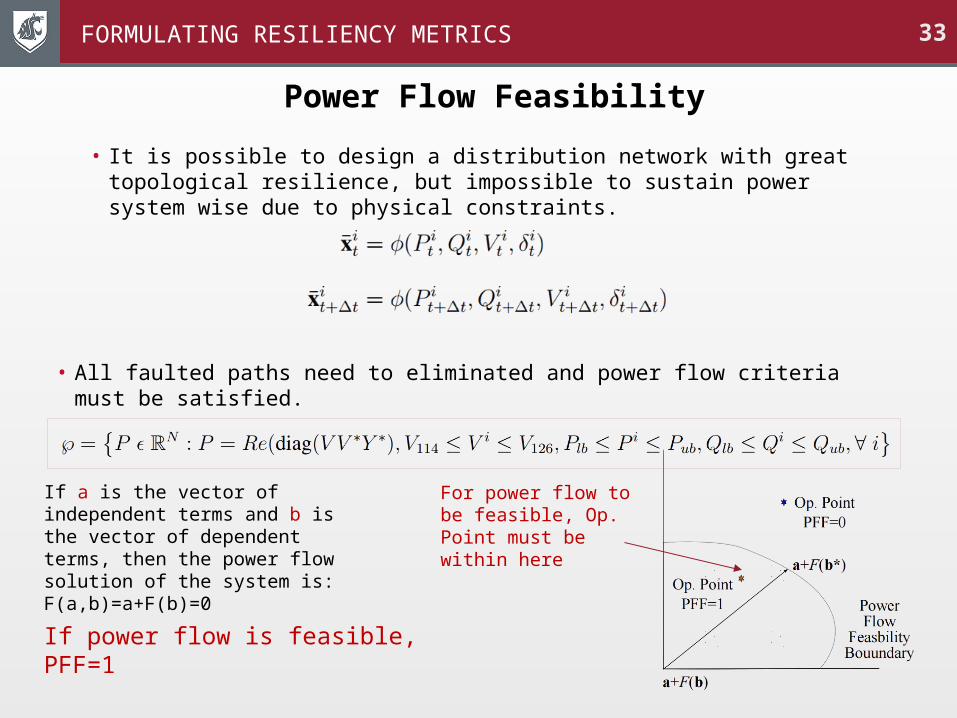
Power Flow Feasibility
• It is possible to design a distribution network with great topological resilience, but impossible to sustain power system wise due to physical constraints.
If a is the vector of independent terms and b is the vector of dependent terms, then the power flow solution of the system is: F(a,b)=a+F(b)=0
For power flow to be feasible, Op. Point must be within here
If power flow is feasible, PFF=1
• All faulted paths need to eliminated and power flow criteria must be satisfied.
FORMULATING RESILIENCY METRICS
34
Presentation Outline
– Problem Statement• Concept of Resiliency applied to power systems
– Literature Review• What has been done so far and what are the research gaps?
– Computation of Resiliency Metrics• mathematical formulation
– Enabling resiliency• Using multiple microgrids
– Simulation and Results• On real and standard test feeders
– Conclusions
35
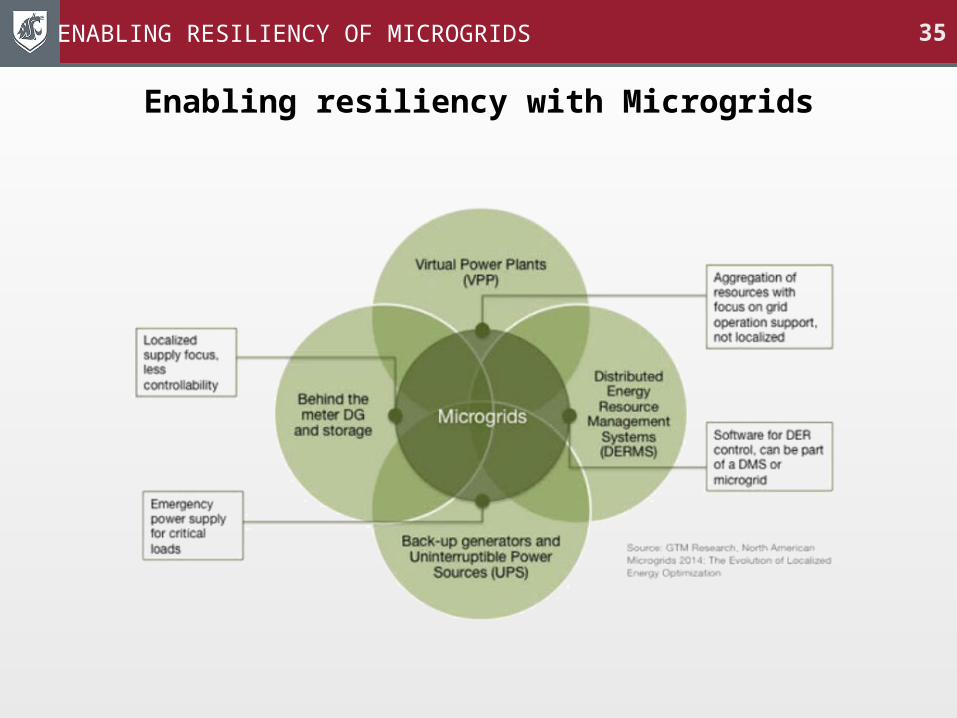
Enabling resiliency with Microgrids
ENABLING RESILIENCY OF MICROGRIDS
36
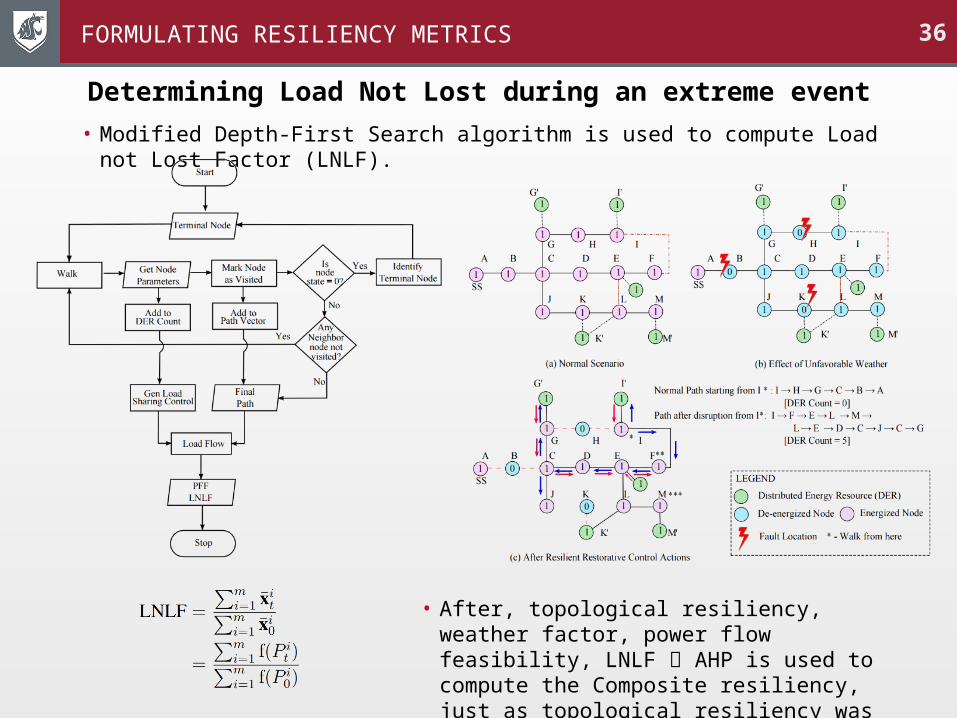
Determining Load Not Lost during an extreme event
• Modified Depth-First Search algorithm is used to compute Load not Lost Factor (LNLF).
• After, topological resiliency, weather factor, power flow feasibility, LNLF AHP is used to compute the Composite resiliency, just as topological resiliency was computed.
FORMULATING RESILIENCY METRICS
37
Summary of steps to compute composite resiliency metrics
FORMULATING RESILIENCY METRICS
38
Presentation Outline
– Problem Statement• Concept of Resiliency applied to power systems
– Literature Review• What has been done so far and what are the research gaps?
– Computation of Resiliency Metrics• mathematical formulation
– Enabling resiliency• Using multiple microgrids
– Simulation and Results• On real and standard test feeders
– Conclusions
39
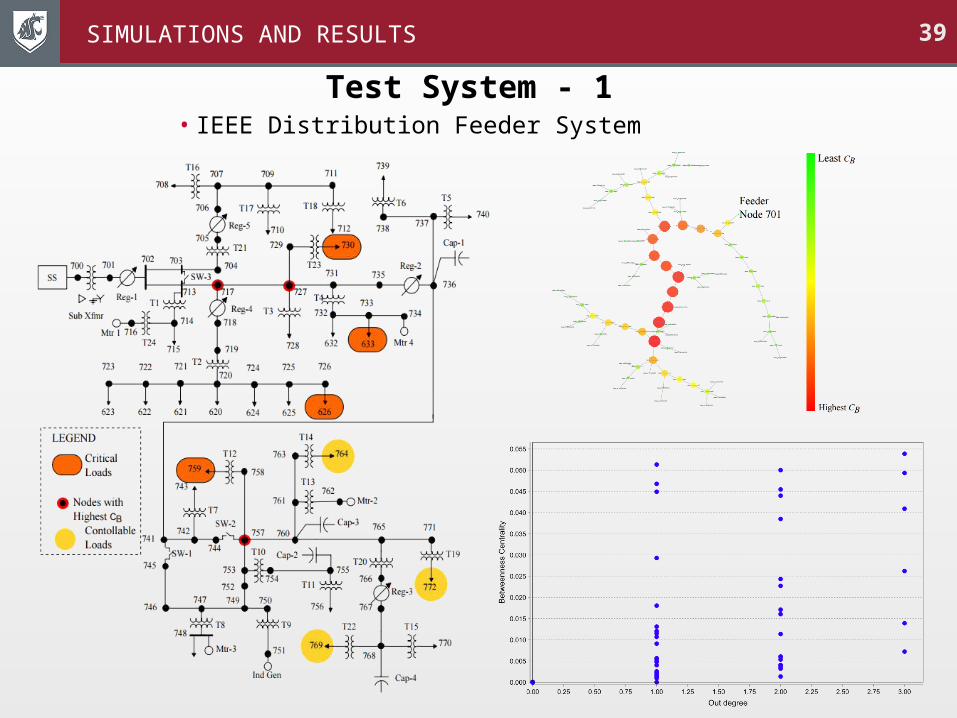
Test System - 1 • IEEE Distribution Feeder System
SIMULATIONS AND RESULTS
40
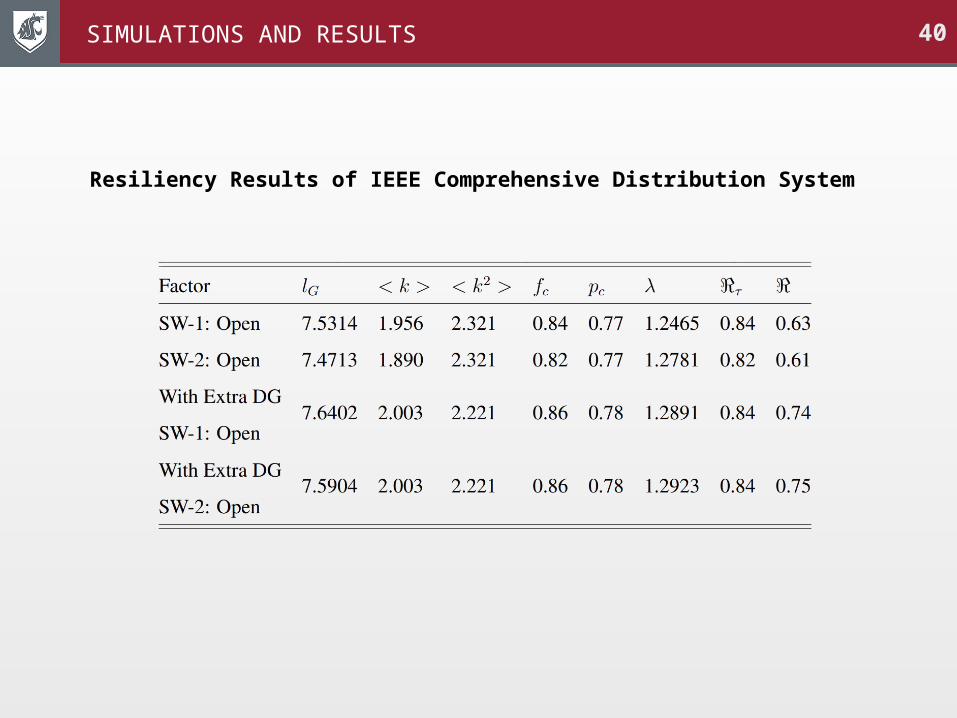
Resiliency Results of IEEE Comprehensive Distribution System
SIMULATIONS AND RESULTS
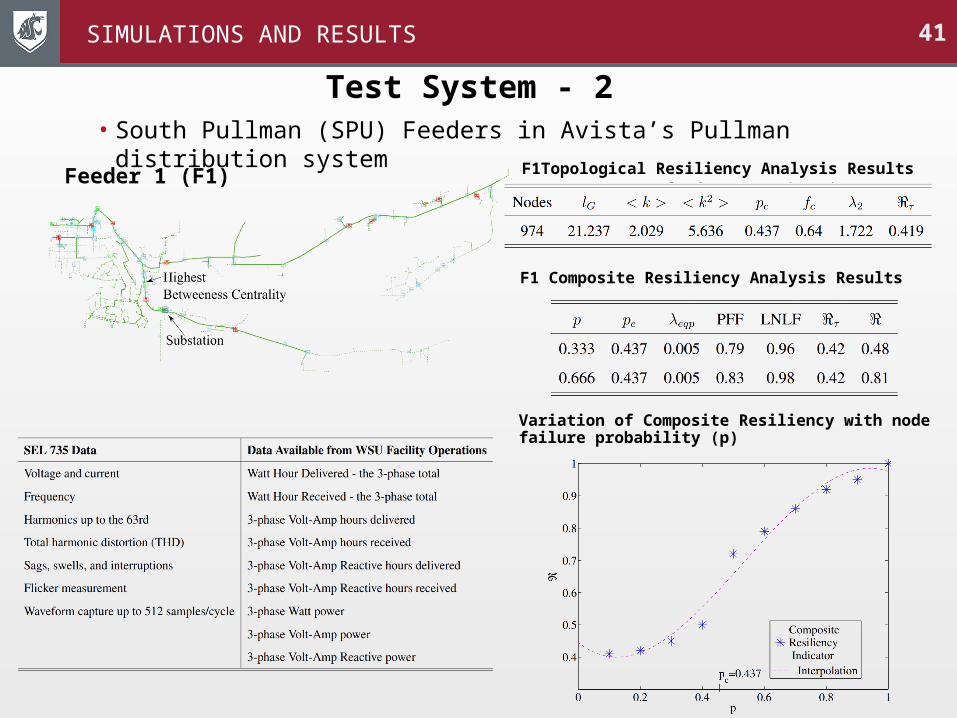
41
Test System - 2 • South Pullman (SPU) Feeders in Avista’s Pullman distribution
systemFeeder 1 (F1) F1Topological Resiliency Analysis Results
F1 Composite Resiliency Analysis Results
Variation of Composite Resiliency with node failure probability (p)
SIMULATIONS AND RESULTS
42
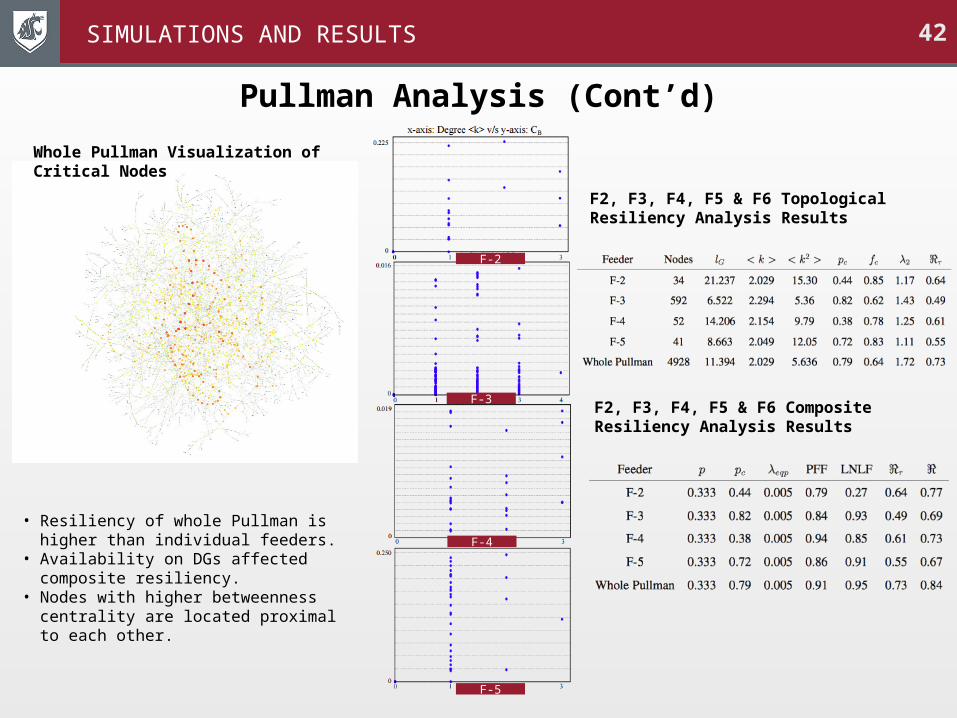
Pullman Analysis (Cont’d)
F2, F3, F4, F5 & F6 Topological Resiliency Analysis Results
F2, F3, F4, F5 & F6 Composite Resiliency Analysis Results
• Resiliency of whole Pullman is higher than individual feeders.
• Availability on DGs affected composite resiliency.
• Nodes with higher betweenness centrality are located proximal to each other.
Whole Pullman Visualization of Critical Nodes
F-2
F-3
F-4
F-5
SIMULATIONS AND RESULTS
43
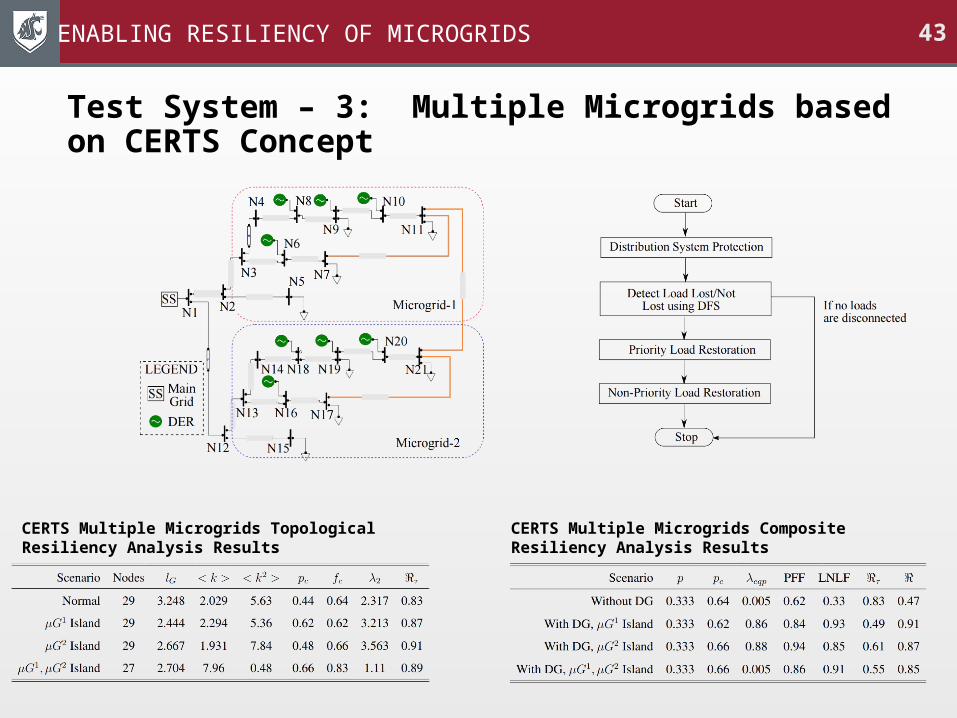
Test System – 3: Multiple Microgrids based on CERTS Concept
CERTS Multiple Microgrids Topological Resiliency Analysis Results
CERTS Multiple Microgrids Composite Resiliency Analysis Results
ENABLING RESILIENCY OF MICROGRIDS
44
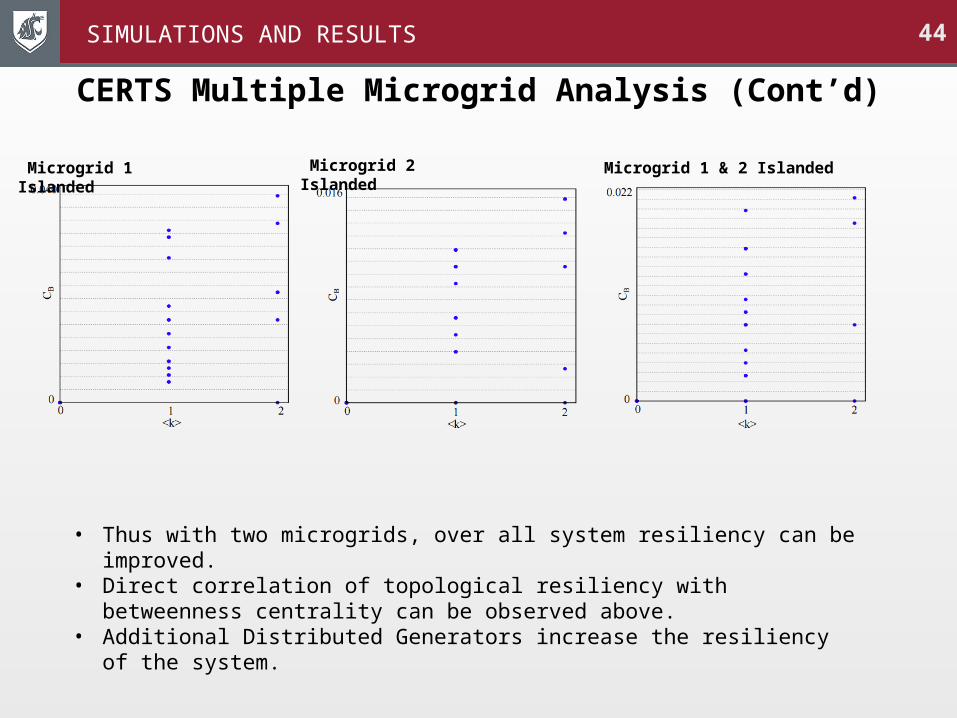
CERTS Multiple Microgrid Analysis (Cont’d)
Microgrid 1 Islanded
Microgrid 1 & 2 Islanded Microgrid 2 Islanded
• Thus with two microgrids, over all system resiliency can be improved. • Direct correlation of topological resiliency with betweenness centrality
can be observed above.• Additional Distributed Generators increase the resiliency of the system.
SIMULATIONS AND RESULTS
45
Presentation Outline
– Problem Statement• Concept of Resiliency applied to power systems
– Literature Review• What has been done so far and what are the research gaps?
– Computation of Resiliency Metrics• mathematical formulation
– Enabling resiliency• Using multiple microgrids
– Simulation and Results• On real and standard test feeders
– Conclusions
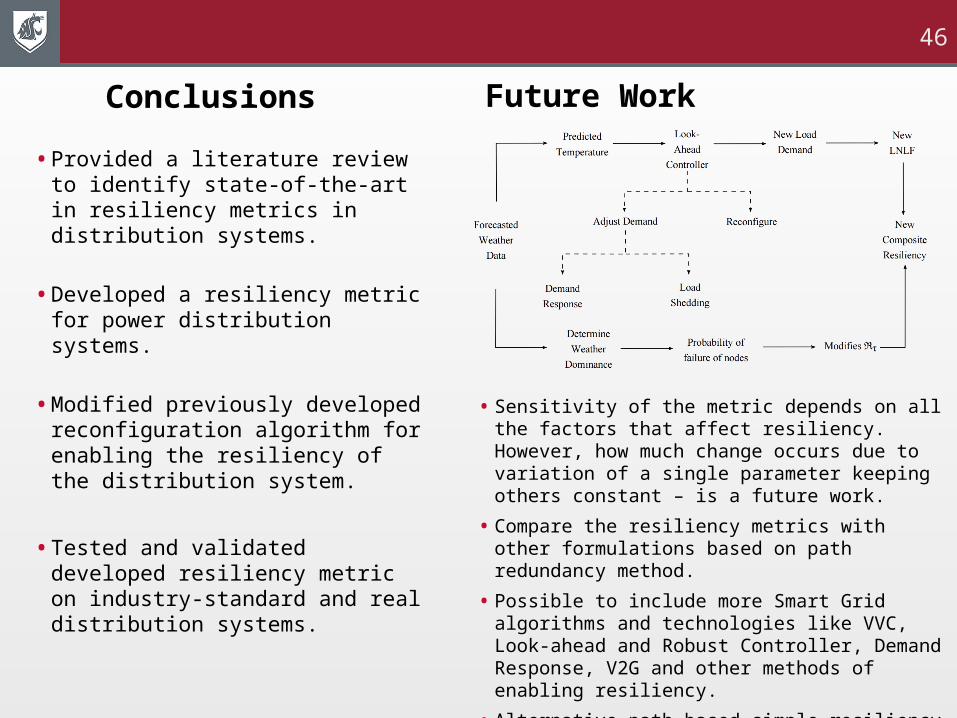
Conclusions
• Provided a literature review to identify state-of-the-art in resiliency metrics in distribution systems.
• Developed a resiliency metric for power distribution systems.
• Modified previously developed reconfiguration algorithm for enabling the resiliency of the distribution system.
• Tested and validated developed resiliency metric on industry-standard and real distribution systems.
• Sensitivity of the metric depends on all the factors that affect resiliency. However, how much change occurs due to variation of a single parameter keeping others constant – is a future work.
• Compare the resiliency metrics with other formulations based on path redundancy method.
• Possible to include more Smart Grid algorithms and technologies like VVC, Look-ahead and Robust Controller, Demand Response, V2G and other methods of enabling resiliency.
• Alternative path based simple resiliency metric
Future Work
46
47
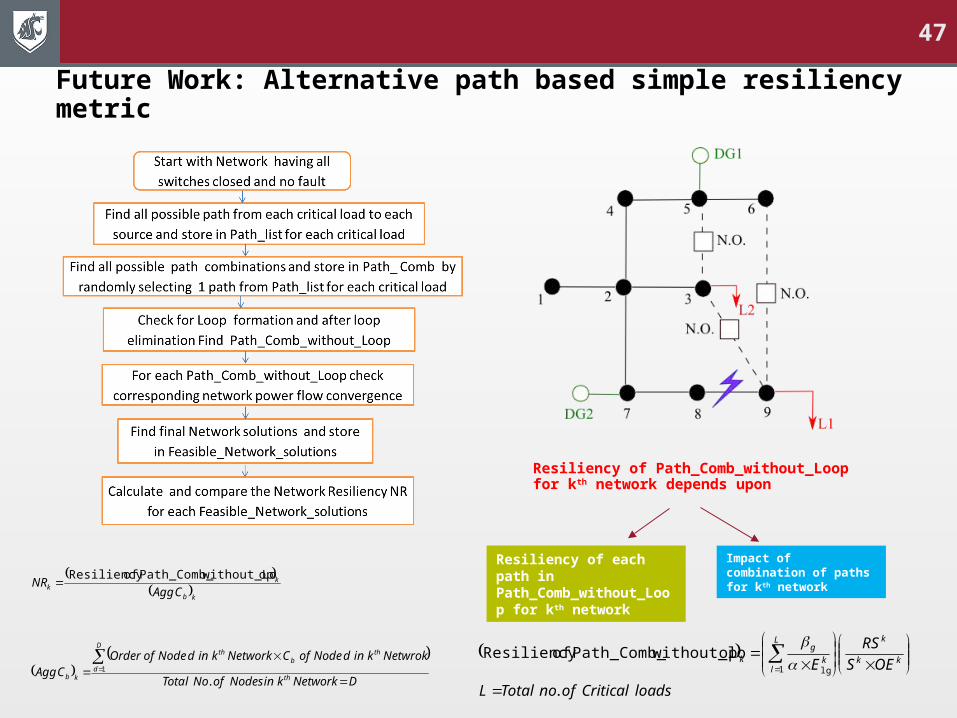
Future Work: Alternative path based simple resiliency metric
DNetworkkinNodesofNoTotal
NetwrokkindNodeofCNetworkkindNodeofOrderCAgg
CAggNR
th
D
d
thb
th
kb
kb
kk
.
opwithout_LoPath_Comb_ofResiliency
1
loadsCriticalofnoTotalL
OES
RS
E kk
kL
lk
gk
.
opwithout_loPath_Comb_ofResiliency1 lg
Resiliency of Path_Comb_without_Loop for kth network depends upon
Resiliency of each path in Path_Comb_without_Loop for kth network
Impact of combination of paths for kth network
Key References• K. H. LaCommare and J. H. Eto, “Cost of power interruptions to electricity
consumers in the United States,” Energy, vol. 31, no. 12, pp. 1845–1855, 2006.
• R. J. Campbell, “Weather-related power outages and electric system resiliency,” Congres- sional Research Service, Library of Congress, 2012.
• A. Kwasinski, “Technology planning for electric power supply in critical events considering a bulk grid, backup power plants, and micro-grids,” IEEE Systems Journal, vol. 4, no. 2, pp. 167–178, 2010.
• D. P. Chassin and C. Posse, “Evaluating North American electric grid reliability using the Barabasi–Albert network model,” Physica A: Statistical Mechanics and its Applications, vol. 355, no. 2, pp. 667–677, 2005.
• E. D. Vugrin, D. E. Warren, M. A. Ehlen, and R. C. Camphouse, “A framework for assessing the resilience of infrastructure and economic systems,” in Sustainable and Resilient Critical Infrastructure Systems, Springer, 2010, pp. 77–116.
• K. Sun, “Complex networks theory: A new method of research in power grid,” in Transmission and Distribution Conference and Exhibition: Asia and Pacific, IEEE/PES, 2005, pp. 1–6.
• Y. Zhang and L. Guo, “Network percolation based on complex network,” Journal of Networks, vol. 8, no. 8, pp. 1874–1881, 2013.
• R. Albert, I. Albert, and G. L. Nakarado, “Structural vulnerability of the North American power grid,” Physical review E, vol. 69, no. 2, p. 025 103, 2004.
Publications1. Chanda, S., Shariatzadeh, F., Srivastava, A., Lee, E., Stone, W., & Ham, J. “Implementation of non-intrusive energy saving estimation for
Volt/VAr control of smart distribution system”. Electric Power Systems Research, vol. 120, (pp. 39-46).
2. Shariatzadeh, F., Chanda, S., Srivastava, A. K., & Bose, A. “Real time benefit computation for electric distribution system automation and control” IEEE Industry Applications Society Annual Meeting, 2014 (pp. 1-8)
3. Chanda, S., & Srivastava, A. K. “Quantifying Resiliency of Smart Power Distribution Systems with Distributed Energy Resources” 24th IEEE International Symposium on Industrial Electronics, 2015
4. Chanda, S., Venkataramanan, V., & Srivastava, A. K. “Real time modeling and simulation of campus microgrid for voltage analysis” Proceedings of the North American Power Systems Conference, 2014
49
Posters presented1. Modeling & Analysis of Campus Microgrid Distribution Systems – IEEE PESGM 2013
2. Real-Time Energy Savings Calculations for Integrated Volt/VAR Control – ESIC Summit 2013
3. Developing Integrated Load Modeling Framework for Campus Microgrids with Large Buildings – IEEE T&D 2014
4. Distribution system resiliency with distributed generation and storage – ESIC Summit 2015
Awards1. Best Graduate Student Poster Award (3rd prize) – IEEE PESGM (2013)
2. Best Graduate Student Poster Award (2nd prize) – IEEE T&D (2014)
3. Team Member of winning team, DOE Hydrogen Design Project (2014)
4. William R. Wiley Research Exposition Scholarship Recipient (2nd Prize for Best Oral presentation) – Washington State University (2015)
1. Chanda, S., & Srivastava, A. K. “Defining and Enabling Resiliency of Electric Distribution Systems with Multiple Microgrids” IEEE Transactions on Smart Grid: Special Issue on Power Grid Resilience [Abstract Accepted]
2. Chanda, S., & Srivastava, A. K. “Application of Complex Network Theory to Evaluate Resiliency of Smart Distribution Systems”, IEEE Power And Energy Technology Systems Journal
3. Shariatzadeh, F., Chanda, S., Srivastava, A. K., & Bose, A. “Real time benefit computation for electric distribution system automation and control” IEEE Transactions on Industry Applications Society [Under Review]
4. Shariatzadeh, F., Chanda, S., & Srivastava, A. K. “Robust Look-Ahead Approach for Heat Ventilation and Air Conditioning Control Systems in Active Distribution Systems” IEEE Transactions on Sustainable Energy.
5. Shariatzadeh, F., Chanda, S., & Srivastava, A. K. “Multilayer Architecture and Control of Active Distribution Systems” IEEE Transactions on Power Delivery
Upcoming Publications

50
Thank You.