Embed Size (px)
Citation preview
Scaling of plate tectonic convection with pseudoplastic rheology
Jun Korenaga1
Received 26 April 2010; revised 19 July 2010; accepted 1 September 2010; published 12 November 2010.
[1] The scaling of plate tectonic convection is investigated by simulating thermalconvection with pseudoplastic rheology and strongly temperature‐dependent viscosity. Theeffect of mantle melting is also explored with additional depth‐dependent viscosity. Heatflow scaling can be constructed with only two parameters, the internal Rayleigh number andthe lithospheric viscosity contrast, the latter of which is determined entirely by rheologicalproperties. The critical viscosity contrast for the transition between plate tectonic andstagnant lid convection is found to be proportional to the square root of the internalRayleigh number. The relation between mantle temperature and surface heat flux on Earthis discussed on the basis of these scaling laws, and the inverse relationship between them, aspreviously suggested from the consideration of global energy balance, is confirmed by thisfully dynamic approach. In the presence of surface water to reduce the effective frictioncoefficient, the operation of plate tectonics is suggested to be plausible throughout the Earthhistory.
Citation: Korenaga, J. (2010), Scaling of plate tectonic convection with pseudoplastic rheology, J. Geophys. Res., 115, B11405,doi:10.1029/2010JB007670.
1. Introduction
[2] Simulating mantle convection with plate tectonics in afully dynamic manner has become popular in the last decadeor so [e.g., Bercovici, 2003], and quite a few studies havebeen published addressing a variety of problems, includingthe significance of 3‐D spherical geometry [Richards et al.,2001; van Heck and Tackley, 2008; Foley and Becker, 2009],the role of history‐dependent rheology [e.g., Tackley, 2000;Ogawa, 2003; Landuyt et al., 2008], the initiation of sub-duction [Solomatov, 2004; Gurnis et al., 2004], and appli-cations to other terrestrial planets [e.g., Lenardic et al., 2004;O’Neill and Lenardic, 2007; Landuyt and Bercovici, 2009].Around the same time, interests in the initiation and evolu-tion of plate tectonics over the Earth history have grownconsiderably [e.g., Mojzsis et al., 2001; Bleeker, 2003;Harrison et al., 2005; Stern, 2005; Korenaga, 2006; VanKranendonk et al., 2007; O’Neill et al., 2007; Condie andPease, 2008; Bradley, 2008; Harrison, 2009; Herzberget al., 2010]. Many of previous numerical studies on platetectonic convection are, however, exploratory in nature, andscaling laws relevant to such geological questions are yetto be established. Given the lack of consensus on why platetectonics can take place on Earth to begin with [e.g., Moresiand Solomatov, 1998; Gurnis et al., 2000; Bercovici andKarato, 2003; Korenaga, 2007], it may be premature todiscuss the scaling of plate tectonic convection, but it is
nonetheless important to seek a strategy to bridge geologyand geodynamics by taking into account peculiar compli-cations associated with plate tectonics.[3] In this study, I attempt to derive the scaling of plate
tectonic convection using the so‐called pseudoplastic rhe-ology [Moresi and Solomatov, 1998], in which the strengthof plates is controlled by temperature‐dependent viscosity aswell as brittle failure. It is known that, for this approach to besuccessful, the friction coefficient for brittle deformation hasto be at least 1 order of magnitude lower than suggested bylaboratory experiments. The presence of pore fluid deep inthe oceanic lithosphere is required to explain such low fric-tion, and because oceanic lithosphere is likely to be very dryupon its formation by melting under mid‐ocean ridges [Hirthand Kohlstedt, 1996; Evans et al., 2005], it may appear to bedifficult to justify the pseudoplastic approach. The upper halfof oceanic lithosphere, however, can be pervasively fracturedby thermal cracking, and in the presence of surface water, thedeep hydration of oceanic lithosphere is possible [Korenaga,2007]. In this mechanism, the strong temperature depen-dency of mantle rheology actually enhances thermal crack-ing. Another concern with the pseudoplastic rheology is thatit is determined only by the instantaneous stress state anddoes not have any memory to simulate preexisting weakness,though this limitation is not as grave as it may appear. Withthe thermal cracking hypothesis, the stiffest part of oceaniclithosphere is continually damaged as it ages, so preexistingweakness is globally distributed. Also, whatever the actualweakening mechanism would be, oceanic lithosphere iseventually subducted (on the timescale of 100 Myr), and itsmemory of weakness would keep being lost in the deepmantle. For the evolution of oceanic lithosphere, therefore,the difference between instantaneous rheology and history‐
1Department of Geology and Geophysics, Yale University, New Haven,Connecticut, USA.
Copyright 2010 by the American Geophysical Union.0148‐0227/10/2010JB007670
JOURNAL OF GEOPHYSICAL RESEARCH, VOL. 115, B11405, doi:10.1029/2010JB007670, 2010
B11405 1 of 24
dependent rheology is not expected to be vital [Tackley,2000]. In plate tectonics, convective heat loss is dominatedby that from oceanic plates, so even with simple pseudo-plastic rheology, we may still hope to capture the grosscharacteristics of mantle convection relevant to the long‐term evolution of Earth.[4] The purpose of this paper is two‐fold. First, I will
investigate the scaling of plate tectonic convection with“standard” pseudoplastic rheology, which is controlled byfriction‐based yield stress and temperature‐dependent vis-cosity. Though there exist a number of numerical studiesusing this rheology, the temperature dependency of mantleviscosity is fairly weak in most of these studies [e.g., Moresiand Solomatov, 1998; Lenardic et al., 2004; Stein et al.,2004; O’Neill and Lenardic, 2007]; the maximum viscos-ity variation due to temperature dependency is usually 106.This may not seem to be low because it is high enough to putconvection in the stagnant lid regime without pseudoplasticrheology. In basally heated convection, which is commonlyadopted by those previous studies, there is an importantdifference regarding thermal structure between stagnant lidconvection and plate tectonic convection. In the stagnant lidregime, most of temperature variations are taken up by thetop thermal boundary layer, so viscosity variation across thetop boundary layer is close to the maximum viscosity vari-ation employed. In the plate tectonic regime with basalheating, the top and bottom thermal boundary layers havesimilar temperature contrasts; that is, the temperature con-trast across the top boundary layer (or plates) is basicallyhalved, with the corresponding viscosity variation of only103. As explained in more detail later (section 2.1), the vis-cosity contrast across oceanic lithosphere due to temperaturedependency is expected to be at least exp(20) ∼ 5 × 10⁸. Itis important to use strongly temperature‐dependent viscosityso that we can discuss the scaling of plate tectonic convectionwith more confidence. The second objective of this paper isto discuss the effects of mantle melting by adding depth‐dependent viscosity to the standard pseudoplastic rheology.How mantle melting could modify the scaling of plate tec-tonics has important implications for the thermal evolutionof Earth [Korenaga, 2003, 2006], but this issue has notbeen quantified by fully dynamic calculations.[5] This paper is organized as follows. After describing the
details of theoretical formulation (section 2), I will presentnumerical results, together with scaling analysis to under-stand the systematics of model behavior (section 3). In thediscussion (section 4), I will briefly explore how new scalinglaws may be used to infer when plate tectonics initiated onEarth and how it evolved subsequently. Critiques on previ-ous attempts to derive the scaling of plate tectonics are alsoprovided.
2. Theoretical Formulation
2.1. Mantle Rheology
[6] For temperature‐dependent viscosity, I employ thefollowing linear exponential form:
�T* ¼ exp � 1� T*ð Þ½ �; ð1Þ
where viscosity is normalized by reference viscosity h0defined at T* = 1. Temperature is normalized as
T* ¼ T � TsDT
; ð2Þ
where Ts is the surface temperature (∼273 K), and DT is the(arbitrary) temperature scale. The degree of temperaturedependency is controlled by the Frank‐Kamenetskii param-eter �, which can be related to the activation energy E as[e.g., Solomatov and Moresi, 2000]
� ¼ EDT
R Ts þDTð Þ2 ; ð3Þ
where R is the universal gas constant. For E of ∼300 kJ mol−1
[e.g., Karato and Wu, 1993] and DT of ∼1300 K, forexample, � is ∼20.[7] The coldest part of the lithosphere would be very stiff
due to this strongly temperature‐dependent viscosity, butit can also deform by brittle failure. In the continuum limit,this brittle behavior can be modeled by nonlinear effec-tive viscosity that is adjusted to ensure the stresses remainbounded by the yield stress envelope [Moresi and Solomatov,1998]. The yield stress criterion for brittle deformationmay be expressed as
�y ¼ c0 þ ��0gz; ð4Þ
where c0 is the cohesive strength, m is the friction coefficient,r0 is reference density, g is gravitational acceleration, and zis depth. Using the length scale D, which is the depth of afluid layer, and the stress scale h0�/D
2, where � is thermaldiffusivity, the criterion may be nondimensionalized as
�y* ¼ �0*þ �1*z*; ð5Þ
where
�0* ¼ c0D2
��0; ð6Þ
and
�1* ¼ ��0gD3
��0: ð7Þ
Using the Rayleigh number defined as
Ra ¼ ��0gDTD3
��0; ð8Þ
where a is thermal expansivity, the criterion can also beexpressed as
�y* ¼ �0*þ Ra z*; ð9Þ
where
¼ �
�DT: ð10Þ
In this study, the cohesive strength is assumed to be negli-gibly small compared to the depth‐dependent component,
KORENAGA: SCALING OF PLATE TECTONICS B11405B11405
2 of 24
and t0* is set to t1* × 10−5. This is a reasonable approximationgiven experimental data on rock friction at low hydrostaticpressure [e.g., Byerlee, 1978] and also allows me to focus onthe single parameter g. Note that a nonzero cohesive strengthterm appearing for experimental data at high confiningpressures could arise from a pressure‐dependent frictioncoefficient with zero cohesive strength.[8] The nonlinear effective viscosity for the plastic defor-
mation is calculated as
�y* ¼ �y*
eII*; ð11Þ
where eII* is the second invariant of the (nondimensionalized)strain rate tensor. The transition between plastic and ductiledeformation is handled by using the harmonic mean ofthe temperature‐dependent viscosity and the above effectiveviscosity as
�* ¼ 1
�T*þ 1
�y*
� ��1
: ð12Þ
The effective viscosity for plastic deformation hy* is calcu-lated for any deformation, but when stresses are smaller thanthe yield stress (i.e., hy* is large), the harmonic mean abovewill be dominated by hT*.[9] The linear exponential form of temperature‐dependent
viscosity (equation (1)) predicts much smaller viscosityvariation across the entire lithosphere than the more realisticArrhenius form, exp(E/RT), but because the above pseudo-plastic rheology effectively eliminates a drastic viscosityincrease in the upper half of the lithosphere, the differencebetween the linear exponential and Arrhenius forms isactually small [Solomatov, 2004]. It is still important to usethe realistic value of � as it controls the strength of the lowerhalf of the lithosphere.[10] When considering the effects of mantle melting, I will
add depth‐dependent viscosity as
�* ¼ 1
�T* Z z*ð Þ þ1
�y*
� ��1
; ð13Þ
where
Z z*ð Þ ¼D� for z* � h*
1 for z* > h*;
8<: ð14Þ
where h* is the thickness of dehydrated mantle and Dh is aviscosity contrast introduced by dehydration.
2.2. Governing Equations and Heating Mode
[11] The nondimensionalized governing equations forthermal convection of an incompressible fluid consist of theconservation of mass,
r � u* ¼ 0; ð15Þ
the conservation of momentum,
�rP*þr � �* ru*þru*T� �� �� RaT*ez ¼ 0; ð16Þ
and the conservation of energy,
@T*
@t*þ u* � rT* ¼ r2T*þ H*: ð17Þ
The unit vector pointing downward is denoted by ez. Thespatial coordinates are normalized by the length scale D, andtime is normalized by the diffusion timescale, D2/�. Velocityu* is thus normalized by �/D. Dynamic pressure P* and heatgeneration H* are normalized by h0�/D
2 and kDT/(r0D2),
respectively, where k is thermal conductivity.[12] In this study, I will focus on thermal convection that is
purely internally heated, by using the insulated bottomboundary condition. There will be no thermal boundary layerat the bottom, simplifying the scaling analysis of numericalresults. This heating mode is also appropriate for the majorityof the Earth history [Korenaga, 2008a, section 5.1]. At thesame time, a temperature contrast across the fluid layer is notknown a priori, so the maximum temperature, Tmax* , is notguaranteed to be unity. Some a posteriori rescaling is thusnecessary. The Frank‐Kamenetskii parameter is recalculatedfrom its original value �0 as
� ¼ �0Tmax* ; ð18Þ
so that exp(�) corresponds to the actual maximum viscosityvariation due to temperature dependency. The internalRayleigh number may also be defined with Tmax* as
Rai ¼ Ra Tmax* exp �0 Tmax* � 1ð Þ½ �; ð19Þ
in which the total temperature contrast is Tmax* DT, and theinternal viscosity, hi, is assumed to be h0exp[�0(1 − Tmax* )].Because of purely internal heating, the surface heat flux q is,at a statistical equilibrium, equal to total heat generation inthe fluid divided by surface area
q ¼ �0DH ; ð20Þ
and the corresponding Nusselt number is calculated as
Nu ¼ q
kTmax* DT=D¼ H*
Tmax*: ð21Þ
[13] The internal heating ratio (IHR), x, is the differencebetween heat flux out of the top boundary and that into thebottom boundary, normalized by the former [e.g., McKenzieet al., 1974], i.e.,
¼ Nutop � NubotNutop
; ð22Þ
and because the bottom boundary is insulated in this study(Nubot = 0), IHR is unity for all runs as long asH* is positive.The internal heat production H* does not directly correspondto the amount of radiogenic heat production in the mantle,which may be referred here as Hrad* . Over the Earth history,the mantle has been (usually) cooling with time [Abbottet al., 1994; Herzberg et al., 2010], and in the study ofmantle convection, this secular cooling is often included aspart of “internal” heating. So H* represents both radiogenicheat production and secular cooling. Secular cooling is atransient phenomenon, and directly simulating it requires us
KORENAGA: SCALING OF PLATE TECTONICS B11405B11405
3 of 24
to assume an initial condition for subsolidus mantle con-vection on Earth, which is hardly known. Numerical modelsfor mantle convection are therefore typically run for anumber of convective overturns to reach a statistical equi-librium so that model results do not strongly depend onemployed initial conditions. This steady state modelingapproach has to include secular cooling as part of internalheating, in order to simulate an Earth‐like IHR. The thermalevolution of Earth can be studied reasonably well byassuming that the mantle is in a quasi steady state at eachtime step [e.g., Daly, 1980].[14] It is important to distinguish IHR from the convective
Urey ratio, Ur, which is the ratio of radiogenic heat pro-duction in the mantle over the mantle heat flux [Christensen,1985], i.e.,
Ur ¼ Hrad*
Nutop: ð23Þ
The Urey ratio is directly related to the chemical compositionof Earth’s mantle, and it is a key parameter to describe thethermal budget of Earth. When Ur is discussed, radiogenicheat production and secular cooling are considered sepa-rately. As noted by Korenaga [2008a], there has been somemisunderstanding in the literature by confusing Ur with IHRor by underestimating the significance of secular cooling,and unfortunately, such confusion still seems to continue[e.g., Deschamps et al., 2010]. IHR can be related to theconvective Urey ratio as [Korenaga, 2008a]
� 1� Cc
Cm þ Cc1� Urð Þ; ð24Þ
where Cm and Cc are the heat capacities of the mantle andthe core, respectively. The present‐day Urey ratio is prob-ably ∼0.2 [Korenaga, 2008a], but because the core heatcapacity is only ∼1/5 of the whole Earth value, the present‐day IHR for Earth’s mantle is estimated to be ∼0.9[Korenaga, 2008a]. Based on thermal history considerations,the Urey ratio may have been higher in the past [Korenaga,2006; Herzberg et al., 2010], so IHR is likely to have beencloser to unity than at present. To first order, therefore, theuse of purely internal heating (x = 1) appears to be a rea-sonable simplification.
2.3. Notes on Modeling Strategy
[15] Besides the use of pseudoplastic rheology, thenumerical model of mantle convection as specified pre-viously is kept simple to facilitate the interpretation ofmodeling results, and the potential significance of realisticcomplications, which are neglected in this study, are dis-cussed in the following.[16] Because of the insulating boundary condition, bottom
heat flux is zero, so there are no upwelling plumes in themodel. The influence of plumes on plate dynamics thuscannot be examined. Because of the nearly unity IHRexpected for Earth’s mantle (section 2.2), however, suchinfluence may not be of first order. The governing equationsemployed are based on the Boussinesq approximation [e.g.,Schubert et al., 2001], so adiabatic gradients are zero (i.e.,the total temperature contrast Tmax* DT is the superadiabatictemperature contrast), and the model temperature corre-
sponds to potential temperature. The effects of compress-ibility on the gross characteristics of thermal convection havebeen known to be rather minor [Jarvis and McKenzie, 1980;Bercovici et al., 1992].[17] For the ductile deformation of the mantle, the
Newtonian rheology with linear exponential temperaturedependency is adopted (equation (1)), but mantle rheology isknown to be much more complex depending on, at least,stress, pressure, grain size, and chemical composition [e.g.,Karato and Wu, 1993]. In case of pseudoplastic rheology,the difference between the Arrhenius rheology and its lin-ear exponential approximation is not important as alreadymentioned, and I choose to use the latter because it is spec-ified by only one nondimensional parameter �, whereas theArrhenius‐type temperature dependency requires three [e.g.,Korenaga, 2009]. Non‐Newtonian, stress‐dependent rheol-ogy can be approximated by Newtonian rheology if theactivation energy is properly scaled [Christensen, 1984]. Theimportance of pressure dependence caused by the activationvolume is not clear at the moment. First of all, activationvolumes for mantle rheology are still poorly known even forupper mantle minerals [Korenaga and Karato, 2008]. Sec-ond, viscosity increase with increasing pressure should be atleast partly cancelled by viscosity decrease with increasingtemperature along the mantle adiabat. With the Boussinesqapproximation employed here, the use of pressure‐independent rheology actually requires nonzero activationvolume, the effect of which is assumed to be cancelledexactly by temperature variations along the adiabat. Grainsize variation can affect mantle dynamics considerably [e.g.,Solomatov, 1996], but how grain size should evolve in theconvecting mantle is still poorly understood, so it appearspremature to consider its effect in this study. The effectof composition on mantle rheology is taken into accountwhen dehydration stiffening is effected by depth‐dependentviscosity (equation (14)). There are of course other com-positional effects [e.g., Karato, 2008], but the effect ofdehydration appears to be most important at least for theupper mantle rheology [e.g., Karato et al., 1986; Mei andKohlstedt, 2000a, 2000b; Faul and Jackson, 2007], andmantle dehydration is always expected whenever mantlemelts [Hirth and Kohlstedt, 1996].[18] Another important rheological aspect for large‐
scale mantle dynamics is a viscosity jump at the base of theupper mantle, which has been estimated to be on the order of∼10–100 primarily through the geodynamical modeling ofEarth’s geoid [e.g., Hager, 1984]. Such inference is, how-ever, also known to suffer from considerable nonuniqueness[e.g., King, 1995; Kido and Cadek, 1997], and the viscositiesof the upper and lower mantle may not be very different if themantle transition zone has a lower viscosity [Soldati et al.,2009]. Furthermore, even if the lower mantle does have ahigher viscosity than the upper mantle, it applies only for thepresent‐day situation. When the mantle was hotter in thepast, the viscosity contrast may be smaller or even reversedif the lower mantle rheology is more temperature depen-dent (i.e., higher activation energy) than the upper mantlecounterpart. Rheological stratification in the mantle is animportant subject, but these uncertainties imply a variety ofsituations to be considered, so it is left for future studies.[19] The mantle transition zone is also characterized by
multiple phase transitions, and in particular, the effects of the
KORENAGA: SCALING OF PLATE TECTONICS B11405B11405
4 of 24
endothermic phase change at the base of the transition zoneon large‐scale mantle circulation was once a popular topic ingeodynamics [e.g., Christensen and Yuen, 1984; Tackleyet al., 1993; Solheim and Peltier, 1994; Yuen et al., 1994].Numerical studies with strong plates exhibit, however, onlya modest influence of endothermic phase change onmantle dynamics [e.g., Zhong and Gurnis, 1994], and recentexperimental studies further suggest that the Clapeyronslope of the endothermic phase change is likely to be only−1.3 MPa K−1 [Katsura et al., 2003; Fei et al., 2004], whichis much less negative than previously thought. Modelingphase transitions, therefore, is not considered to be essential.[20] Finally, the model is 2‐D Cartesian, whereas the use
of a 3‐D spherical shell would be most appropriate. Therestriction to 2‐D modeling is primarily to generate a largenumber of modeling results (with modest computationalresources) so that scaling analysis becomes more robust,though I do not expect scaling laws to change drastically bymoving from 2‐D to 3‐D. The effect of sphericity wouldlikely be of minor nature [Bercovici et al., 2000]. On thebasis of isoviscous convection models using 3‐D sphericalshells, for example,Deschamps et al. [2010] recently derivedthe following heat flow scaling (adapted here for the caseof purely internal heating):
Nu � 0:59f 0:05Ra0:300�0:003f ; ð25Þ
where f is the ratio of the core radius to the total radius of aplanet. The ratio f is 0.55 for Earth and unity for Cartesian, soit can be seen that sphericity has virtually no impact on thisscaling.[21] The convection model of this study is, therefore,
simple but probably not simpler than necessary. In any event,this study should provide a reference point, by which theeffects of any additional complication can be quantified infuture.
3. Numerical Results and Scaling Analysis
[22] The finite element code of Korenaga and Jordan[2003] was used to solve the coupled Stokes flow and ther-mal advection‐diffusion equations (15)–(17). The bench-mark tests of this code can be found in work by Korenagaand Jordan [2003] for Newtonian rheology and Korenaga[2009] for non‐Newtonian rheology. To reduce walleffects, the aspect ratio of the convection model is set to 8,and the model domain is discretized with 400 × 50 uniform2‐D quadrilateral elements. With this mesh resolution, modelparameters are chosen so that Nu does not exceed 20 and thetop thermal boundary layer contains at least a few elementsvertically on average. The nondimensional surface temper-ature is fixed to zero, and the bottom boundary is insulated.The top and bottom boundaries are free slip, and a reflectingboundary condition is applied to the side boundaries. In allcases, Ra is set to 106, but Rai varies greatly because ofdifferent combinations of �0 and H* (and thus Tmax* ).[23] The initial temperature condition is specified as
T* x*; z*ð Þ ¼ z*þ a cos �x*ð Þ sin �z*ð Þ þ �; ð26Þ
where a is usually 0.2, and � is random fluctuation with theamplitude of 10−3. When the assumed mantle rheology is
appropriate for the operation of plate tectonic convection,this initial condition quickly brings the system to that modeof convection. Otherwise, the system gradually migratesinto the mode of stagnant lid convection. If I start with auniformly hot fluid instead, the system always begins withstagnant lid convection, and sublithospheric mantle is heatedup considerably until the onset of plate tectonics. Very lowviscosity (and thus very high convective velocity) beneaththe stagnant lid during this initial period means exceedinglysmall time steps for numerical integration, so this type ofinitial condition is not computationally efficient when aimingat statistically steady states required for scaling analysis.
3.1. Convection Diagnostics
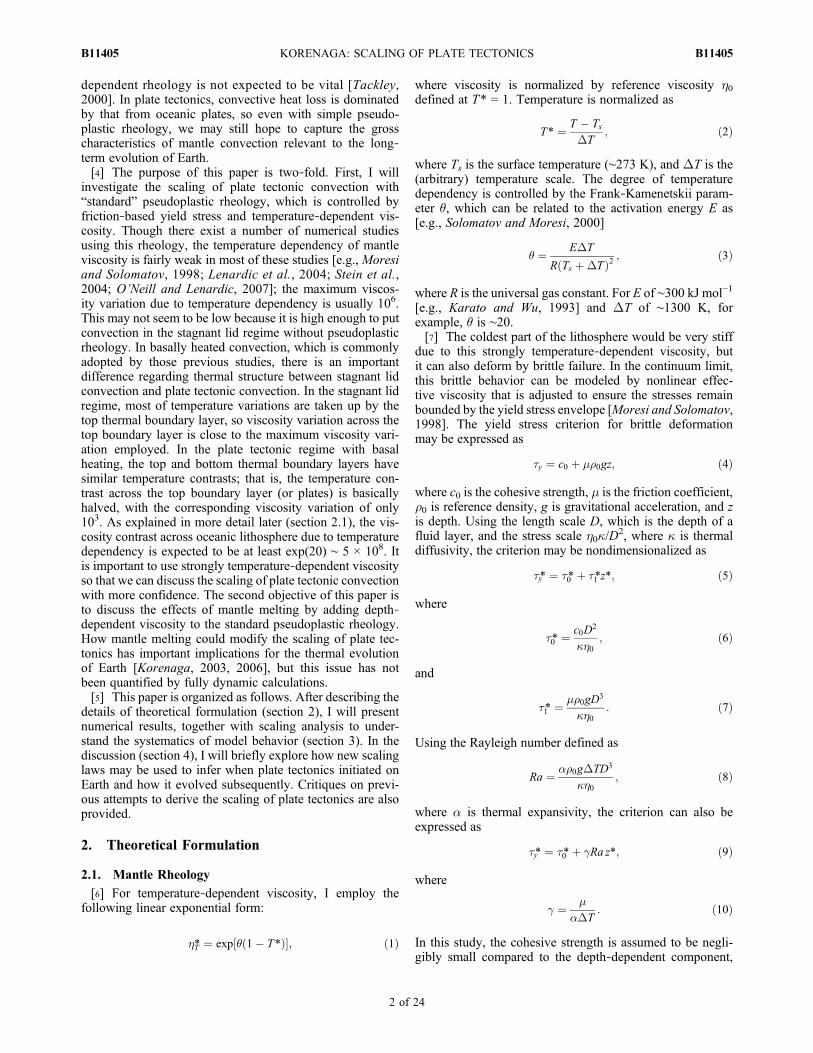
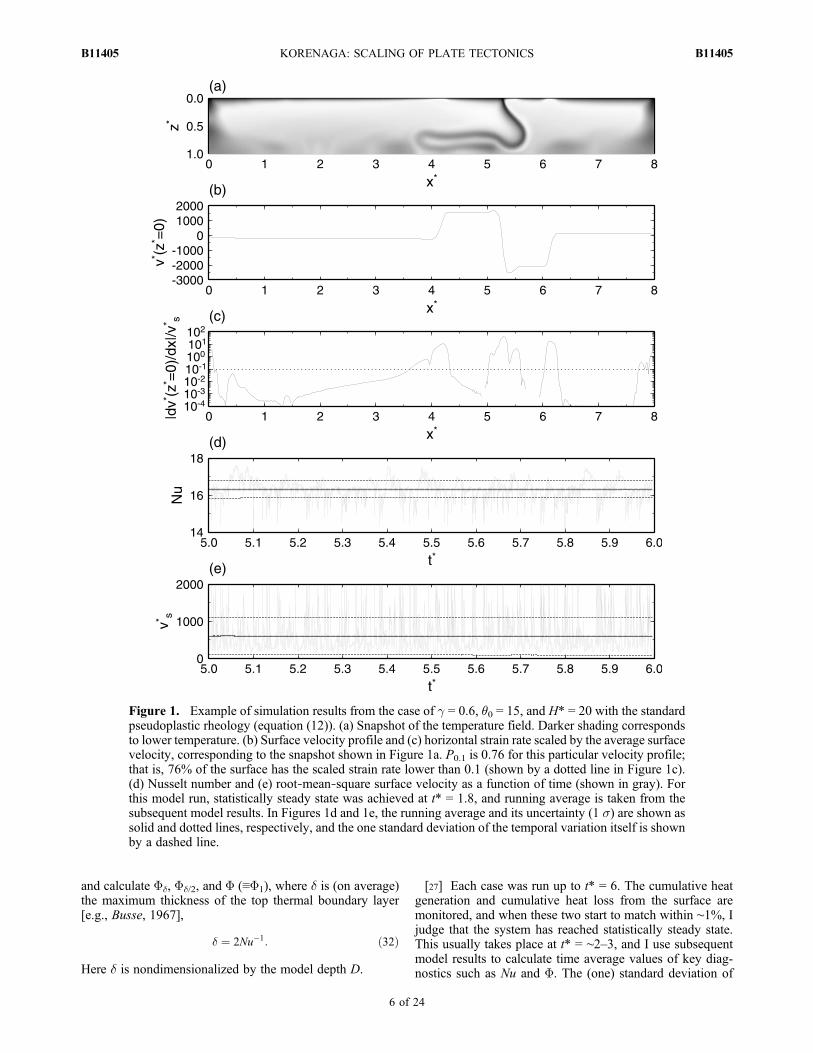
[24] A typical snapshot of model run is shown in Figure 1a.This is the case of g = 0.6, �0 = 15, and H* = 20, with thestandard pseudoplastic rheology (equation (12)). In additionto Tmax* , I calculate two more measures for the temperaturescale. One is the domain average temperature,
T*h i ¼ZZ
T*dx*dz*
�ZZdx*dz*; ð27Þ
and the other is the (self‐consistent) internal temperature[Korenaga, 2009],
Ti* ¼ 1
1� 0
Z 1
0
ZT*dx*
�Zdx*
� �dz*; ð28Þ
where d′ = Ti*/H*.[25] The vigor of convection can be quantified by calcu-
lating the root‐mean‐square velocity vrms* , and a velocitydiagnostic most indicative of the mode of convection is theroot‐mean‐square surface velocity vs*. To quantify howplate‐like the surface velocity field is, Weinstein and Olson[1992] introduced the notion of “plateness,” and for con-vection exhibiting multiple plates with different velocities,I use the definition of plateness
Px ¼Ze 0<x
dx*
�Zdx*; ð29Þ
where
e 0 ¼ 1
vs*
dv* z* ¼ 0ð Þdx*
: ð30Þ
The parameter Px measures the fraction of surface withnormalized strain rate e′ smaller than the given threshold x.The velocity profile shown in Figure 1b, for example, hasP0.1 of 0.76 (Figure 1c). Like other definitions of plateness,Px varies from 0 to 1, with higher values corresponding tomore rigid behavior. For comparison, actual plates on Earthtend to have wide diffuse boundary zones, which occupy∼15% of the surface area at the present day [Gordon andStein, 1992].[26] To understand the spatial distribution of viscous dis-
sipation, I define Fc as the viscous dissipation within theregion above z* = c,
Fc ¼Z c
0
Z�*eij*eij*dx*
� �dz*; ð31Þ
KORENAGA: SCALING OF PLATE TECTONICS B11405B11405
5 of 24
and calculate Fd, Fd/2, and F (≡F1), where d is (on average)the maximum thickness of the top thermal boundary layer[e.g., Busse, 1967],
¼ 2Nu�1: ð32Þ
Here d is nondimensionalized by the model depth D.
[27] Each case was run up to t* = 6. The cumulative heatgeneration and cumulative heat loss from the surface aremonitored, and when these two start to match within ∼1%, Ijudge that the system has reached statistically steady state.This usually takes place at t* = ∼2–3, and I use subsequentmodel results to calculate time average values of key diag-nostics such as Nu and F. The (one) standard deviation of
Figure 1. Example of simulation results from the case of g = 0.6, �0 = 15, and H* = 20 with the standardpseudoplastic rheology (equation (12)). (a) Snapshot of the temperature field. Darker shading correspondsto lower temperature. (b) Surface velocity profile and (c) horizontal strain rate scaled by the average surfacevelocity, corresponding to the snapshot shown in Figure 1a. P0.1 is 0.76 for this particular velocity profile;that is, 76% of the surface has the scaled strain rate lower than 0.1 (shown by a dotted line in Figure 1c).(d) Nusselt number and (e) root‐mean‐square surface velocity as a function of time (shown in gray). Forthis model run, statistically steady state was achieved at t* = 1.8, and running average is taken from thesubsequent model results. In Figures 1d and 1e, the running average and its uncertainty (1 s) are shown assolid and dotted lines, respectively, and the one standard deviation of the temporal variation itself is shownby a dashed line.
KORENAGA: SCALING OF PLATE TECTONICS B11405B11405
6 of 24
time‐averaged Nu is typically less than 1%, whereas thestandard deviation of Nu itself is often greater by 1 orderof magnitude, reflecting the highly time‐dependent natureof convection (Figure 1d). Surface velocity exhibits evengreater time dependency (Figure 1e).
3.2. Reference Scaling
[28] A total of 82 cases were run with the standard pseu-doplastic rheology using different combinations of g (0.1–1),�0 (10–25), and H* (8–20). The summary of convectiondiagnostics is reported in Tables A1 and A2; eight runs
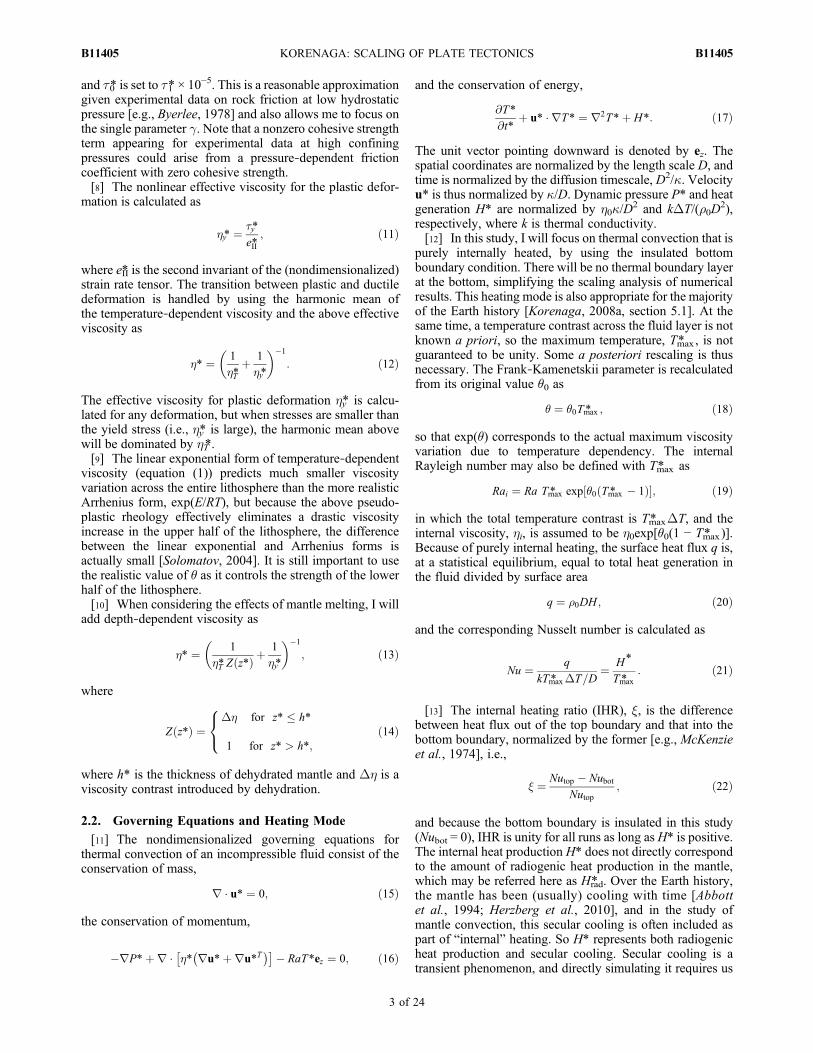
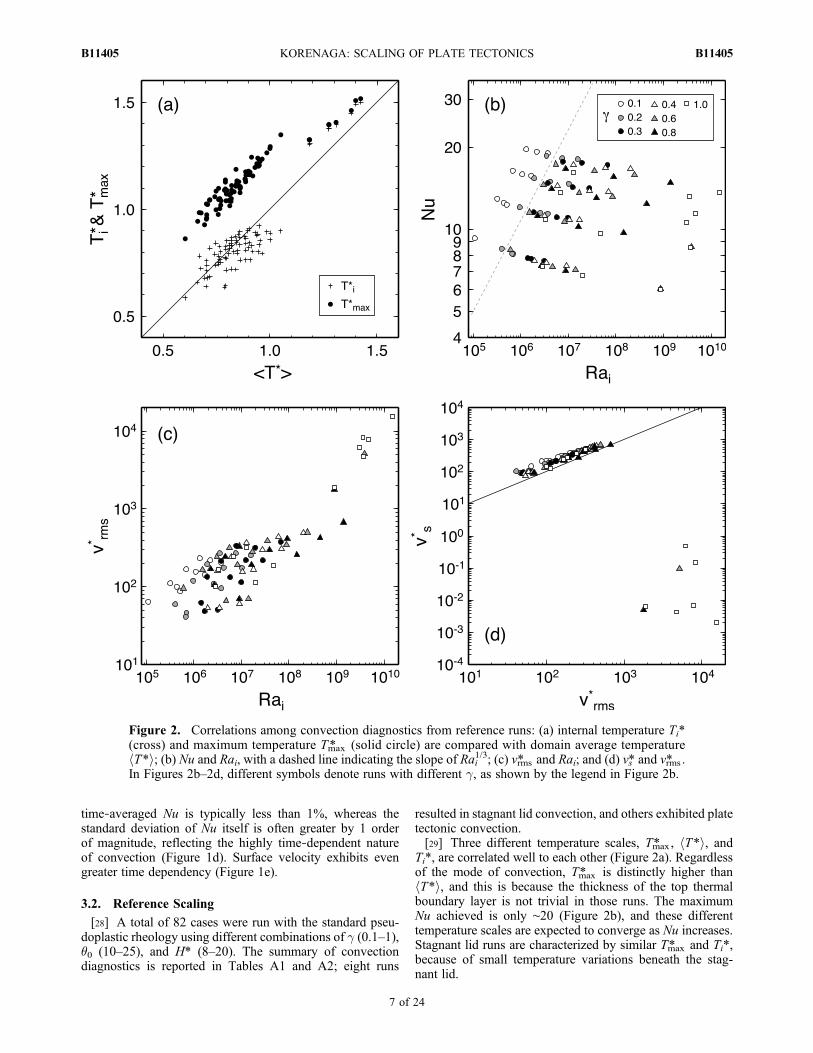
resulted in stagnant lid convection, and others exhibited platetectonic convection.[29] Three different temperature scales, Tmax* , hT*i, and
Ti*, are correlated well to each other (Figure 2a). Regardlessof the mode of convection, Tmax* is distinctly higher thanhT*i, and this is because the thickness of the top thermalboundary layer is not trivial in those runs. The maximumNu achieved is only ∼20 (Figure 2b), and these differenttemperature scales are expected to converge as Nu increases.Stagnant lid runs are characterized by similar Tmax* and Ti*,because of small temperature variations beneath the stag-nant lid.
Figure 2. Correlations among convection diagnostics from reference runs: (a) internal temperature Ti*(cross) and maximum temperature Tmax* (solid circle) are compared with domain average temperaturehT*i; (b) Nu and Rai, with a dashed line indicating the slope of Rai1/3; (c) vrms* and Rai; and (d) vs* and vrms* .In Figures 2b–2d, different symbols denote runs with different g, as shown by the legend in Figure 2b.
KORENAGA: SCALING OF PLATE TECTONICS B11405B11405
7 of 24
[30] The relation between Nu and Rai appears to roughlyfollow the classical scaling of Nu / Rai
1/3 within runswith the same g and similar � (Figure 2b). Varying g hasconsiderable effects on the scaling of Nu as well as vrms*(Figure 2c). The distinction between plate tectonic andstagnant lid runs is very clear in the correlation (or lackthereof) between vrms* and vs* (Figure 2). Average surfacevelocity in these plate tectonic runs is higher than corre-sponding vrms* because the latter involves averaging over theentire domain, the majority of which moves more slowlythan surface plates.[31] My scaling analysis to understand the systematics
of these model results is based on the local stability oftop thermal boundary layer [Howard, 1966]. Because ofpseudoplastic rheology, the effective viscosity of the topboundary layer or the effective lithospheric viscosity, hL, isexpected to be higher than the interior viscosity, and I denotethe viscosity contrast between them as
D�L ¼ �L=�i: ð33Þ
Viscosity in the top thermal boundary layer varies con-siderably as specified by equation (12), and the effectivelithospheric viscosity is an attempt to capture the overallstiffness of the boundary layer by just one viscosity value.For the stiff boundary layer to subduct, it has to becomeconvectively unstable at least, and by assuming that themaximum thickness of the boundary layer dD correspondsto marginal stability, the following relation should hold:
��0g Tmax* DTð Þ Dð Þ3��L
¼ Rac; ð34Þ
where Rac is the critical Rayleigh number. By using therelation between d and Nu (equation (32)), this marginalstability criterion may be rearranged as
Nu ¼ 2RaiRac
� �1=3
D��1=3L ð35Þ
or
D�L ¼ 8RaiRac Nu3
: ð36Þ
Hereinafter Rac is set to 103.[32] Equation (36) may be regarded as a way to extract
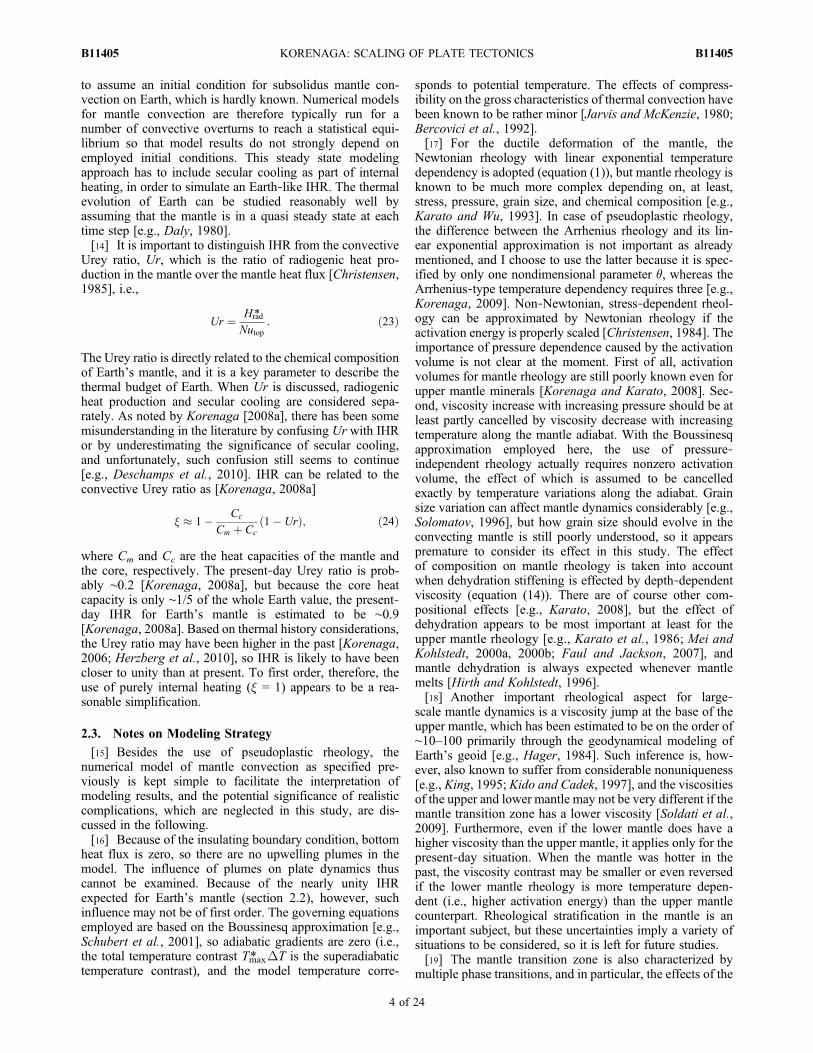
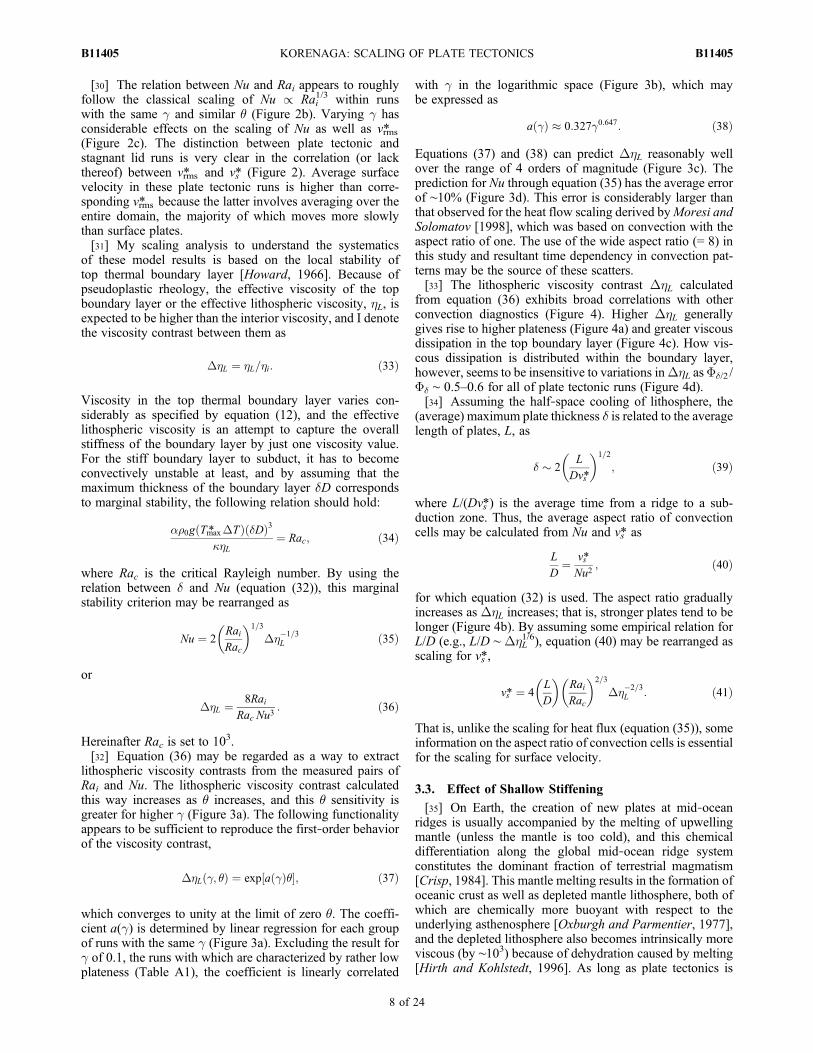
lithospheric viscosity contrasts from the measured pairs ofRai and Nu. The lithospheric viscosity contrast calculatedthis way increases as � increases, and this � sensitivity isgreater for higher g (Figure 3a). The following functionalityappears to be sufficient to reproduce the first‐order behaviorof the viscosity contrast,
D�L ; �ð Þ ¼ exp a ð Þ�½ �; ð37Þ
which converges to unity at the limit of zero �. The coeffi-cient a(g) is determined by linear regression for each groupof runs with the same g (Figure 3a). Excluding the result forg of 0.1, the runs with which are characterized by rather lowplateness (Table A1), the coefficient is linearly correlated
with g in the logarithmic space (Figure 3b), which maybe expressed as
aðÞ � 0:3270:647: ð38Þ
Equations (37) and (38) can predict DhL reasonably wellover the range of 4 orders of magnitude (Figure 3c). Theprediction for Nu through equation (35) has the average errorof ∼10% (Figure 3d). This error is considerably larger thanthat observed for the heat flow scaling derived byMoresi andSolomatov [1998], which was based on convection with theaspect ratio of one. The use of the wide aspect ratio (= 8) inthis study and resultant time dependency in convection pat-terns may be the source of these scatters.[33] The lithospheric viscosity contrast DhL calculated
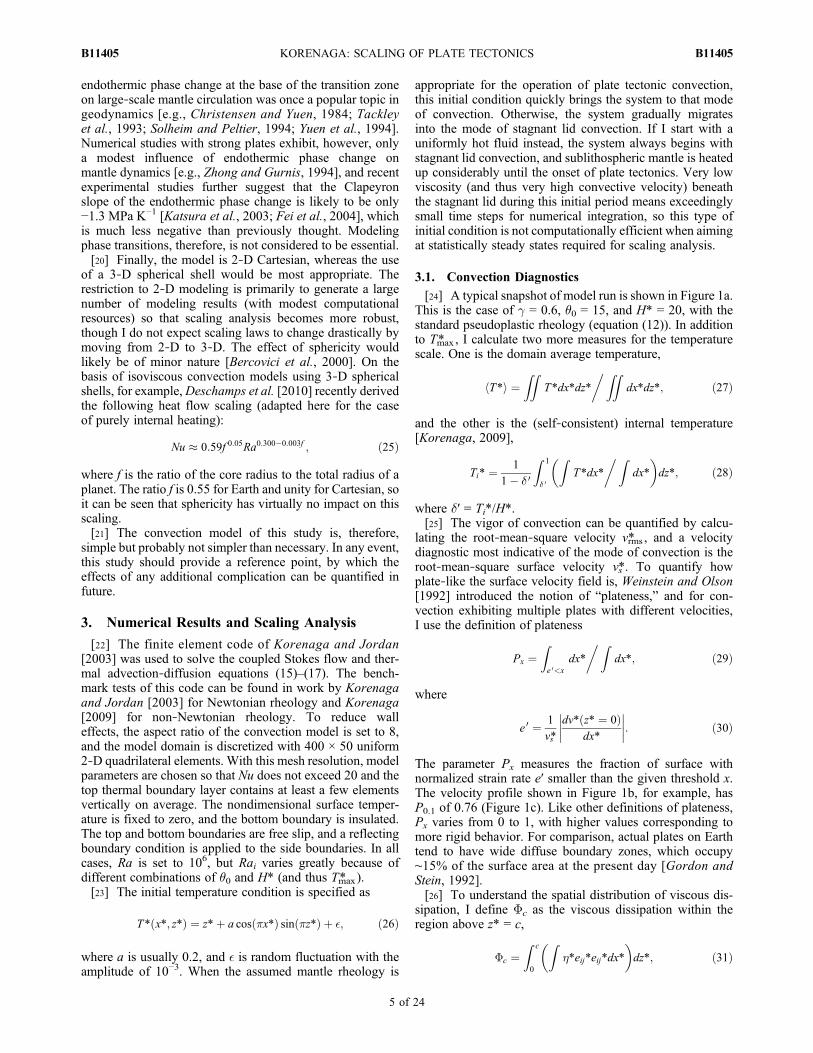
from equation (36) exhibits broad correlations with otherconvection diagnostics (Figure 4). Higher DhL generallygives rise to higher plateness (Figure 4a) and greater viscousdissipation in the top boundary layer (Figure 4c). How vis-cous dissipation is distributed within the boundary layer,however, seems to be insensitive to variations inDhL asFd/2 /Fd ∼ 0.5–0.6 for all of plate tectonic runs (Figure 4d).[34] Assuming the half‐space cooling of lithosphere, the
(average) maximum plate thickness d is related to the averagelength of plates, L, as
� 2L
Dvs*
� �1=2
; ð39Þ
where L/(Dvs*) is the average time from a ridge to a sub-duction zone. Thus, the average aspect ratio of convectioncells may be calculated from Nu and vs* as
L
D¼ vs*
Nu2; ð40Þ
for which equation (32) is used. The aspect ratio graduallyincreases as DhL increases; that is, stronger plates tend to belonger (Figure 4b). By assuming some empirical relation forL/D (e.g., L/D ∼ DhL
1/6), equation (40) may be rearranged asscaling for vs*,
vs* ¼ 4L
D
� �RaiRac
� �2=3
D��2=3L : ð41Þ
That is, unlike the scaling for heat flux (equation (35)), someinformation on the aspect ratio of convection cells is essentialfor the scaling for surface velocity.
3.3. Effect of Shallow Stiffening
[35] On Earth, the creation of new plates at mid‐oceanridges is usually accompanied by the melting of upwellingmantle (unless the mantle is too cold), and this chemicaldifferentiation along the global mid‐ocean ridge systemconstitutes the dominant fraction of terrestrial magmatism[Crisp, 1984]. This mantle melting results in the formation ofoceanic crust as well as depleted mantle lithosphere, both ofwhich are chemically more buoyant with respect to theunderlying asthenosphere [Oxburgh and Parmentier, 1977],and the depleted lithosphere also becomes intrinsically moreviscous (by ∼103) because of dehydration caused by melting[Hirth and Kohlstedt, 1996]. As long as plate tectonics is
KORENAGA: SCALING OF PLATE TECTONICS B11405B11405
8 of 24
taking place, the chemical buoyancy of oceanic lithosphere isinsignificant as resistance to subduction because the basalt‐to‐eclogite transition at relatively shallow depth (<60 km)makes the subducting slab compositionally denser than thesurrounding mantle [e.g., Ringwood and Irifune, 1988]. Inthis study, therefore, I focus on the effect of dehydrationstiffening on the scaling of plate tectonic convection. As inwork by Korenaga [2009], instead of tracing the advection ofthe dehydrated slab through time, I use the depth‐dependentviscosity that is fixed in time (equation (14)). Though thesubducting slab loses the extra viscosity contrast Dh as soon
as it passes the given depth h*, the effect of shallow stiff-ening on slab bending can still be evaluated with this scheme.[36] The scaling of Nu equation (35) indicates that differ-
ent combinations of Rai and DhL can produce the same Nu.Thus, in terms of the efficiency of heat transport, a run withhigh Rai and high DhL may be indistinguishable from thatwith low Rai and low DhL, but shallow stiffening may affectthese cases differently. A wide variety of plate tectonic caseswere thus simulated by varying g (0.4–0.8), �0 (10–25), andH* (2–20), and shallow stiffening was incorporated with h*ranging from 0.1 to 0.3 and Dh ranging from 3 to 103.
Figure 3. The systematics of reference runs can be summarized through effective lithospheric viscositycontrast DhL. (a) DhL as a function of �. Different symbols denote runs with different g, and dashed linesare fitted trends in the form of equation (37) for each g. Data with DhL greater than 104 are stagnant lidruns, which are excluded from linear regression. (b) The fitted coefficient a as a function of g. Dashed linerepresents equation (38). (c) Comparison of measured DhL with predicted values based on equations (37)and (38). (d) Comparison of measured Nu with predicted values based on equation (35).
KORENAGA: SCALING OF PLATE TECTONICS B11405B11405
9 of 24
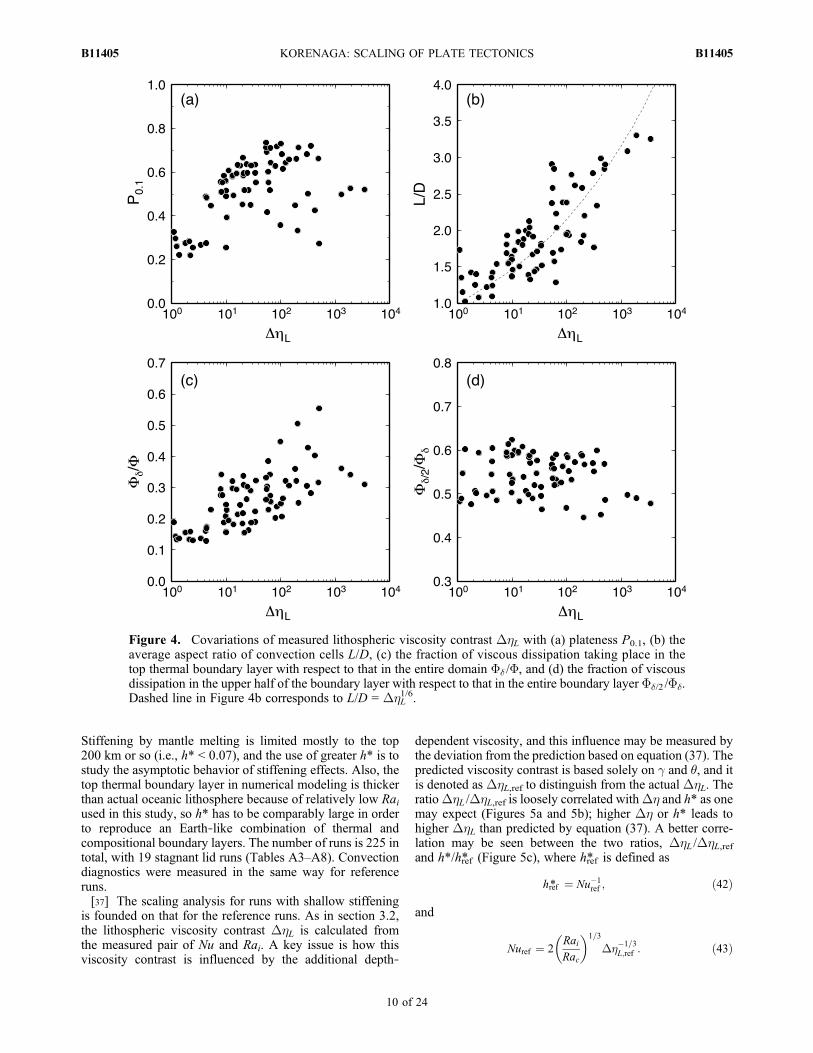
Stiffening by mantle melting is limited mostly to the top200 km or so (i.e., h* < 0.07), and the use of greater h* is tostudy the asymptotic behavior of stiffening effects. Also, thetop thermal boundary layer in numerical modeling is thickerthan actual oceanic lithosphere because of relatively low Raiused in this study, so h* has to be comparably large in orderto reproduce an Earth‐like combination of thermal andcompositional boundary layers. The number of runs is 225 intotal, with 19 stagnant lid runs (Tables A3–A8). Convectiondiagnostics were measured in the same way for referenceruns.[37] The scaling analysis for runs with shallow stiffening
is founded on that for the reference runs. As in section 3.2,the lithospheric viscosity contrast DhL is calculated fromthe measured pair of Nu and Rai. A key issue is how thisviscosity contrast is influenced by the additional depth‐
dependent viscosity, and this influence may be measured bythe deviation from the prediction based on equation (37). Thepredicted viscosity contrast is based solely on g and �, and itis denoted as DhL,ref to distinguish from the actual DhL. TheratioDhL /DhL,ref is loosely correlated withDh and h* as onemay expect (Figures 5a and 5b); higher Dh or h* leads tohigher DhL than predicted by equation (37). A better corre-lation may be seen between the two ratios, DhL /DhL,refand h*/href* (Figure 5c), where href* is defined as
href* ¼ Nu�1ref ; ð42Þ
and
Nuref ¼ 2RaiRac
� �1=3
D��1=3L;ref : ð43Þ
Figure 4. Covariations of measured lithospheric viscosity contrast DhL with (a) plateness P0.1, (b) theaverage aspect ratio of convection cells L/D, (c) the fraction of viscous dissipation taking place in thetop thermal boundary layer with respect to that in the entire domain Fd /F, and (d) the fraction of viscousdissipation in the upper half of the boundary layer with respect to that in the entire boundary layer Fd/2 /Fd.Dashed line in Figure 4b corresponds to L/D = DhL
1/6.
KORENAGA: SCALING OF PLATE TECTONICS B11405B11405
10 of 24
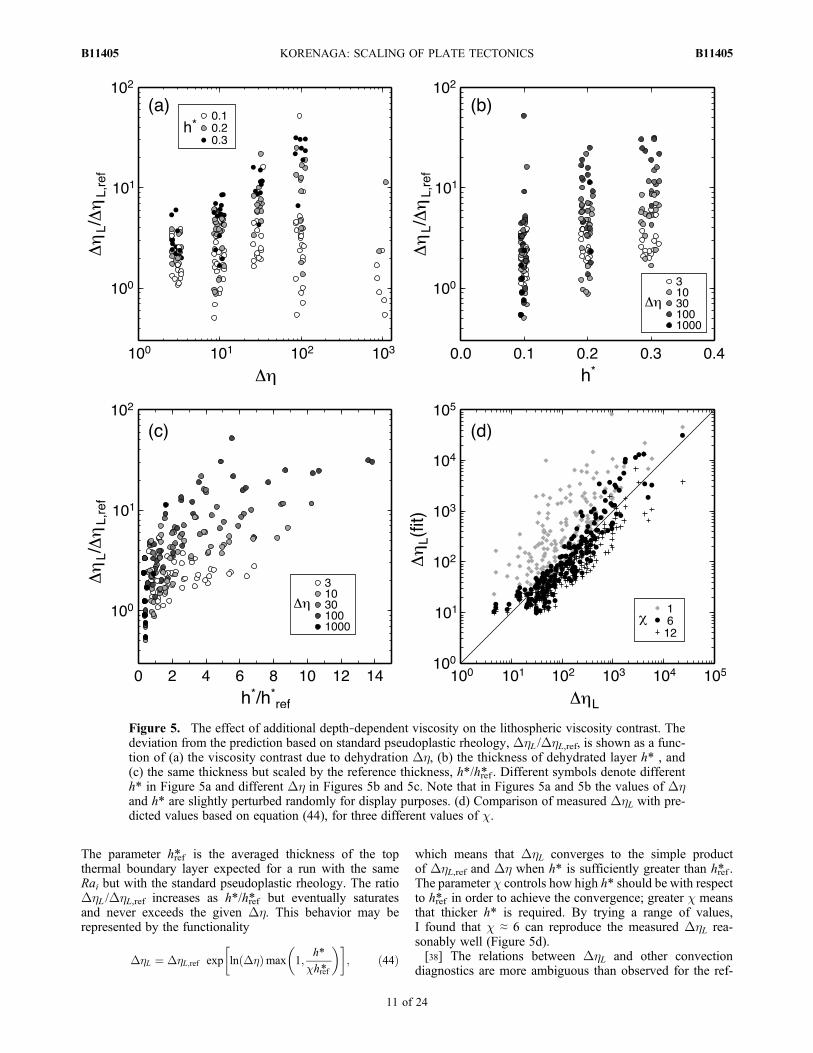
The parameter href* is the averaged thickness of the topthermal boundary layer expected for a run with the sameRai but with the standard pseudoplastic rheology. The ratioDhL /DhL,ref increases as h*/href* but eventually saturatesand never exceeds the given Dh. This behavior may berepresented by the functionality
D�L ¼ D�L;ref exp ln D�ð Þmax 1;h*
�href*
� � �; ð44Þ
which means that DhL converges to the simple productof DhL,ref and Dh when h* is sufficiently greater than href* .The parameter c controls how high h* should be with respectto href* in order to achieve the convergence; greater c meansthat thicker h* is required. By trying a range of values,I found that c ≈ 6 can reproduce the measured DhL rea-sonably well (Figure 5d).[38] The relations between DhL and other convection
diagnostics are more ambiguous than observed for the ref-
Figure 5. The effect of additional depth‐dependent viscosity on the lithospheric viscosity contrast. Thedeviation from the prediction based on standard pseudoplastic rheology, DhL /DhL,ref, is shown as a func-tion of (a) the viscosity contrast due to dehydration Dh, (b) the thickness of dehydrated layer h* , and(c) the same thickness but scaled by the reference thickness, h*/href* . Different symbols denote differenth* in Figure 5a and different Dh in Figures 5b and 5c. Note that in Figures 5a and 5b the values of Dhand h* are slightly perturbed randomly for display purposes. (d) Comparison of measured DhL with pre-dicted values based on equation (44), for three different values of c.
KORENAGA: SCALING OF PLATE TECTONICS B11405B11405
11 of 24
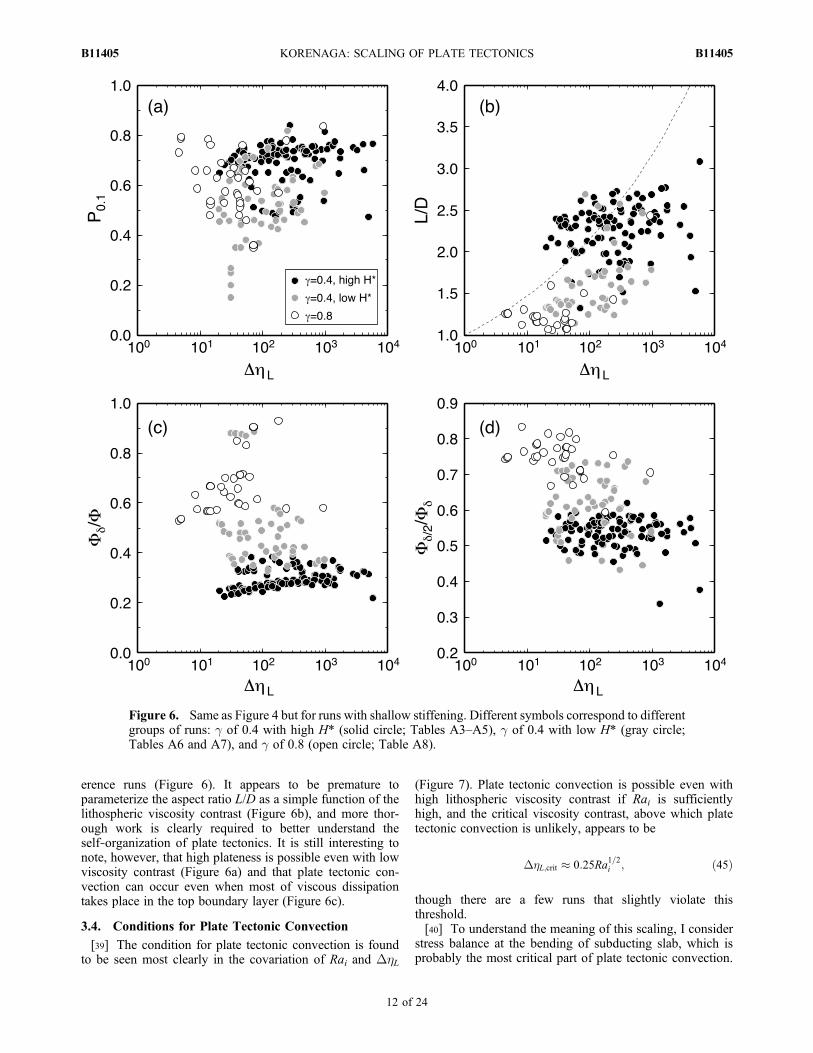
erence runs (Figure 6). It appears to be premature toparameterize the aspect ratio L/D as a simple function of thelithospheric viscosity contrast (Figure 6b), and more thor-ough work is clearly required to better understand theself‐organization of plate tectonics. It is still interesting tonote, however, that high plateness is possible even with lowviscosity contrast (Figure 6a) and that plate tectonic con-vection can occur even when most of viscous dissipationtakes place in the top boundary layer (Figure 6c).
3.4. Conditions for Plate Tectonic Convection
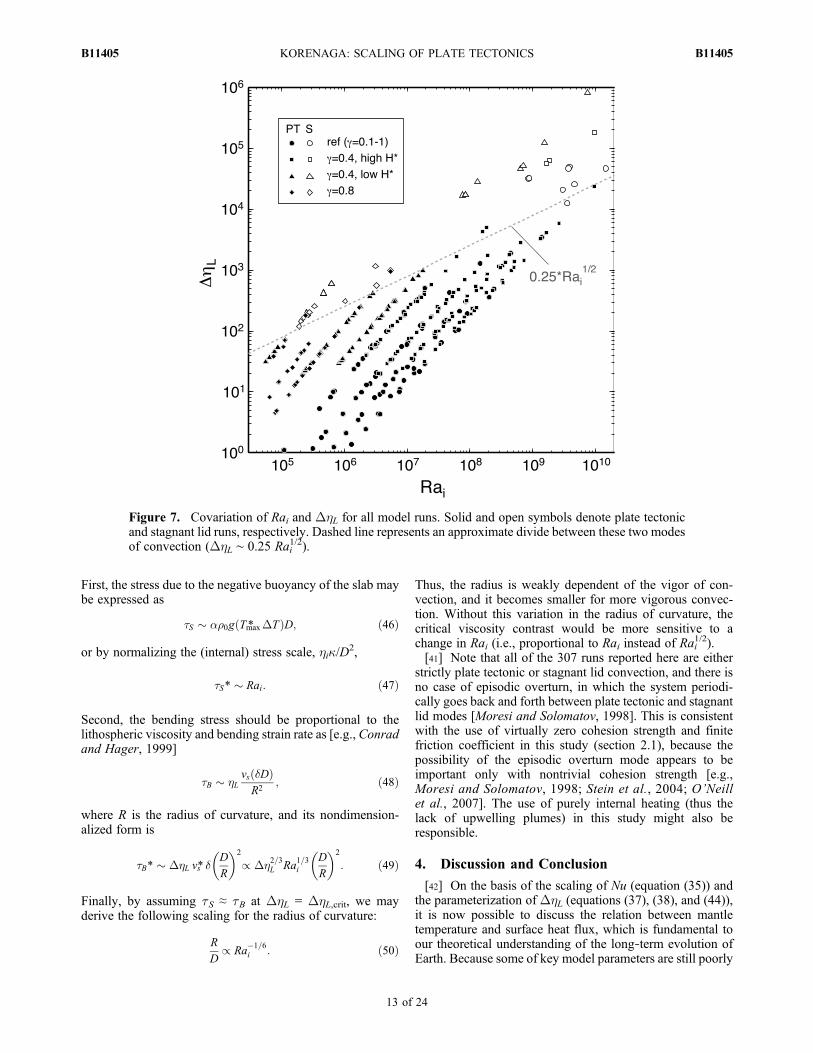
[39] The condition for plate tectonic convection is foundto be seen most clearly in the covariation of Rai and DhL
(Figure 7). Plate tectonic convection is possible even withhigh lithospheric viscosity contrast if Rai is sufficientlyhigh, and the critical viscosity contrast, above which platetectonic convection is unlikely, appears to be
D�L;crit � 0:25Ra1=2i ; ð45Þ
though there are a few runs that slightly violate thisthreshold.[40] To understand the meaning of this scaling, I consider
stress balance at the bending of subducting slab, which isprobably the most critical part of plate tectonic convection.
Figure 6. Same as Figure 4 but for runs with shallow stiffening. Different symbols correspond to differentgroups of runs: g of 0.4 with high H* (solid circle; Tables A3–A5), g of 0.4 with low H* (gray circle;Tables A6 and A7), and g of 0.8 (open circle; Table A8).
KORENAGA: SCALING OF PLATE TECTONICS B11405B11405
12 of 24
First, the stress due to the negative buoyancy of the slab maybe expressed as
�S � ��0g Tmax* DTð ÞD; ð46Þ
or by normalizing the (internal) stress scale, hi�/D2,
�S* � Rai: ð47Þ
Second, the bending stress should be proportional to thelithospheric viscosity and bending strain rate as [e.g., Conradand Hager, 1999]
�B � �Lvs Dð ÞR2
; ð48Þ
where R is the radius of curvature, and its nondimension-alized form is
�B* � D�L vs* D
R
� �2
/ D�2=3L Ra1=3i
D
R
� �2
: ð49Þ
Finally, by assuming tS ≈ tB at DhL = DhL,crit, we mayderive the following scaling for the radius of curvature:
R
D/ Ra�1=6
i : ð50Þ
Thus, the radius is weakly dependent of the vigor of con-vection, and it becomes smaller for more vigorous convec-tion. Without this variation in the radius of curvature, thecritical viscosity contrast would be more sensitive to achange in Rai (i.e., proportional to Rai instead of Rai
1/2).[41] Note that all of the 307 runs reported here are either
strictly plate tectonic or stagnant lid convection, and there isno case of episodic overturn, in which the system periodi-cally goes back and forth between plate tectonic and stagnantlid modes [Moresi and Solomatov, 1998]. This is consistentwith the use of virtually zero cohesion strength and finitefriction coefficient in this study (section 2.1), because thepossibility of the episodic overturn mode appears to beimportant only with nontrivial cohesion strength [e.g.,Moresi and Solomatov, 1998; Stein et al., 2004; O’Neillet al., 2007]. The use of purely internal heating (thus thelack of upwelling plumes) in this study might also beresponsible.
4. Discussion and Conclusion
[42] On the basis of the scaling of Nu (equation (35)) andthe parameterization of DhL (equations (37), (38), and (44)),it is now possible to discuss the relation between mantletemperature and surface heat flux, which is fundamental toour theoretical understanding of the long‐term evolution ofEarth. Because some of key model parameters are still poorly
Figure 7. Covariation of Rai and DhL for all model runs. Solid and open symbols denote plate tectonicand stagnant lid runs, respectively. Dashed line represents an approximate divide between these two modesof convection (DhL ∼ 0.25 Rai
1/2).
KORENAGA: SCALING OF PLATE TECTONICS B11405B11405
13 of 24
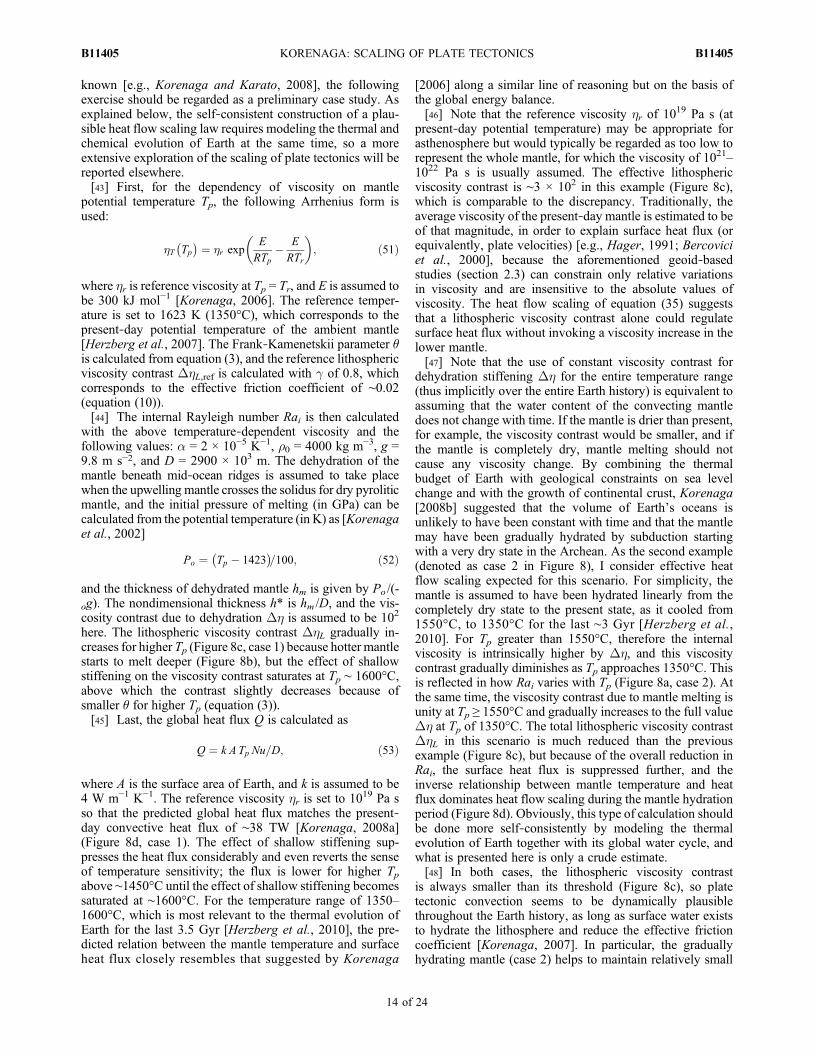
known [e.g., Korenaga and Karato, 2008], the followingexercise should be regarded as a preliminary case study. Asexplained below, the self‐consistent construction of a plau-sible heat flow scaling law requires modeling the thermal andchemical evolution of Earth at the same time, so a moreextensive exploration of the scaling of plate tectonics will bereported elsewhere.[43] First, for the dependency of viscosity on mantle
potential temperature Tp, the following Arrhenius form isused:
�T Tp� � ¼ �r exp
E
RTp� E
RTr
� �; ð51Þ
where hr is reference viscosity at Tp = Tr, and E is assumed tobe 300 kJ mol−1 [Korenaga, 2006]. The reference temper-ature is set to 1623 K (1350°C), which corresponds to thepresent‐day potential temperature of the ambient mantle[Herzberg et al., 2007]. The Frank‐Kamenetskii parameter �is calculated from equation (3), and the reference lithosphericviscosity contrast DhL,ref is calculated with g of 0.8, whichcorresponds to the effective friction coefficient of ∼0.02(equation (10)).[44] The internal Rayleigh number Rai is then calculated
with the above temperature‐dependent viscosity and thefollowing values: a = 2 × 10⁻⁵ K−1, r0 = 4000 kg m−3, g =9.8 m s−2, and D = 2900 × 103 m. The dehydration of themantle beneath mid‐ocean ridges is assumed to take placewhen the upwelling mantle crosses the solidus for dry pyroliticmantle, and the initial pressure of melting (in GPa) can becalculated from the potential temperature (in K) as [Korenagaet al., 2002]
Po ¼ Tp � 1423� �
=100; ð52Þ
and the thickness of dehydrated mantle hm is given by Po /(-og). The nondimensional thickness h* is hm /D, and the vis-cosity contrast due to dehydration Dh is assumed to be 102
here. The lithospheric viscosity contrast DhL gradually in-creases for higher Tp (Figure 8c, case 1) because hotter mantlestarts to melt deeper (Figure 8b), but the effect of shallowstiffening on the viscosity contrast saturates at Tp ∼ 1600°C,above which the contrast slightly decreases because ofsmaller � for higher Tp (equation (3)).[45] Last, the global heat flux Q is calculated as
Q ¼ k A Tp Nu=D; ð53Þ
where A is the surface area of Earth, and k is assumed to be4 W m−1 K−1. The reference viscosity hr is set to 1019 Pa sso that the predicted global heat flux matches the present‐day convective heat flux of ∼38 TW [Korenaga, 2008a](Figure 8d, case 1). The effect of shallow stiffening sup-presses the heat flux considerably and even reverts the senseof temperature sensitivity; the flux is lower for higher Tpabove ∼1450°C until the effect of shallow stiffening becomessaturated at ∼1600°C. For the temperature range of 1350–1600°C, which is most relevant to the thermal evolution ofEarth for the last 3.5 Gyr [Herzberg et al., 2010], the pre-dicted relation between the mantle temperature and surfaceheat flux closely resembles that suggested by Korenaga
[2006] along a similar line of reasoning but on the basis ofthe global energy balance.[46] Note that the reference viscosity hr of 10
19 Pa s (atpresent‐day potential temperature) may be appropriate forasthenosphere but would typically be regarded as too low torepresent the whole mantle, for which the viscosity of 1021–1022 Pa s is usually assumed. The effective lithosphericviscosity contrast is ∼3 × 10² in this example (Figure 8c),which is comparable to the discrepancy. Traditionally, theaverage viscosity of the present‐day mantle is estimated to beof that magnitude, in order to explain surface heat flux (orequivalently, plate velocities) [e.g., Hager, 1991; Bercoviciet al., 2000], because the aforementioned geoid‐basedstudies (section 2.3) can constrain only relative variationsin viscosity and are insensitive to the absolute values ofviscosity. The heat flow scaling of equation (35) suggeststhat a lithospheric viscosity contrast alone could regulatesurface heat flux without invoking a viscosity increase in thelower mantle.[47] Note that the use of constant viscosity contrast for
dehydration stiffening Dh for the entire temperature range(thus implicitly over the entire Earth history) is equivalent toassuming that the water content of the convecting mantledoes not change with time. If the mantle is drier than present,for example, the viscosity contrast would be smaller, and ifthe mantle is completely dry, mantle melting should notcause any viscosity change. By combining the thermalbudget of Earth with geological constraints on sea levelchange and with the growth of continental crust, Korenaga[2008b] suggested that the volume of Earth’s oceans isunlikely to have been constant with time and that the mantlemay have been gradually hydrated by subduction startingwith a very dry state in the Archean. As the second example(denoted as case 2 in Figure 8), I consider effective heatflow scaling expected for this scenario. For simplicity, themantle is assumed to have been hydrated linearly from thecompletely dry state to the present state, as it cooled from1550°C, to 1350°C for the last ∼3 Gyr [Herzberg et al.,2010]. For Tp greater than 1550°C, therefore the internalviscosity is intrinsically higher by Dh, and this viscositycontrast gradually diminishes as Tp approaches 1350°C. Thisis reflected in how Rai varies with Tp (Figure 8a, case 2). Atthe same time, the viscosity contrast due to mantle melting isunity at Tp ≥ 1550°C and gradually increases to the full valueDh at Tp of 1350°C. The total lithospheric viscosity contrastDhL in this scenario is much reduced than the previousexample (Figure 8c), but because of the overall reduction inRai, the surface heat flux is suppressed further, and theinverse relationship between mantle temperature and heatflux dominates heat flow scaling during the mantle hydrationperiod (Figure 8d). Obviously, this type of calculation shouldbe done more self‐consistently by modeling the thermalevolution of Earth together with its global water cycle, andwhat is presented here is only a crude estimate.[48] In both cases, the lithospheric viscosity contrast
is always smaller than its threshold (Figure 8c), so platetectonic convection seems to be dynamically plausiblethroughout the Earth history, as long as surface water existsto hydrate the lithosphere and reduce the effective frictioncoefficient [Korenaga, 2007]. In particular, the graduallyhydrating mantle (case 2) helps to maintain relatively small
KORENAGA: SCALING OF PLATE TECTONICS B11405B11405
14 of 24
Figure 8. A worked example of how the new scaling laws of plate tectonic convection may be used tobuild heat flow scaling for Earth. (a) Internal Rayleigh number Rai as a function of mantle potential tem-perature Tp. (b) Thicknesses of dehydrated lithosphere (hm, dotted line) and reference thermal boundarylayer (href, solid line for case 1 and dashed line for case 2) (equation (42)). (c) Lithospheric viscositycontrast for case 1 (thick solid line), case 2 (thick dashed line), and a reference case with no effect of mantlemelting, i.e., hm* = 0 (thin solid line). Also shown are the critical viscosity contrast for plate tectonicconvection (dashed line for case 1 and dotted line for case 2). (d) Relation between Tp and surface heatflux Q. Legend is the same as in Figure 8c. Star denotes convective heat flux at the present day (38 TW at1350°C). See the main text for details.
KORENAGA: SCALING OF PLATE TECTONICS B11405B11405
15 of 24
DhL even with deeper mantle melting at higher Tp, facili-tating the operation of plate tectonics in the early Earth.[49] Though previous attempts to estimate the heat flow
scaling of plate tectonics [Korenaga, 2003, 2006] havealready predicted the inverse relation between mantle tem-perature and surface heat flux as indicated by Figure 8, thereare a few important differences. First, because the effect ofshallow stiffening eventually saturates (equation (44)), theinverse relation is restricted to a certain temperature range.This subtle behavior is difficult to derive from the globalenergy balance approach adopted by the previous studies.Second, the global energy balance can be exploited to deriveheat flow scaling by assuming the mode of convection, sowhether plate tectonic convection is plausible or not cannotbe addressed. Finally, the energy balance approach has a fewpoorly constrained parameters, such as the radius of curva-ture for plate bending, effective lithospheric viscosity, and
the aspect ratio of convection, and it is possible to obtainwildly different results by varying them independently [e.g.,Davies, 2009]. Though similarly suffering from parameteruncertainty (e.g., g and Dh) and from the very assumptionof the pseudoplastic rheology as well, the present studyprovides a fully dynamic framework in which heat flow,velocity, lithospheric viscosity, aspect ratio, and the radiusof curvature are all connected in a self‐consistent manner.
Appendix A: Numerical Results
[50] Tabulated are selected convection diagnostics forstatistically steady state solutions as described in the maintext. The Rayleigh number Ra is 106 for all cases. Referenceruns refer to calculations with the standard pseudoplasticrheology, and runs with shallow stiffening refers to thosewith additional depth‐dependent viscosity (Tables A1–A8).
Table A1. Numerical Results for Reference Runs for g < 0.5
g �0 H* Tmax* Ti* hT*i Nu � Rai vrms* vs* P0.1 F Fd /F
0.1 15 8 0.86 0.59 0.60 9.27 12.9 1.10 × 10⁵ 6.40 × 101 1.49 × 10² 0.33 2.73 × 10⁷ 0.190.1 15 12 0.93 0.68 0.69 12.93 13.9 3.18 × 10⁵ 1.12 × 10² 2.26 × 10² 0.30 4.25 × 10⁷ 0.140.1 15 16 0.98 0.75 0.76 16.39 14.6 6.85 × 10⁵ 1.68 × 10² 3.10 × 10² 0.26 5.77 × 10⁷ 0.130.1 15 20 1.02 0.82 0.81 19.67 15.3 1.32 × 10⁶ 2.33 × 10² 3.97 × 10² 0.22 7.31 × 10⁷ 0.140.1 20 12 0.96 0.71 0.70 12.50 19.2 4.36 × 10⁵ 1.00 × 10² 2.22 × 10² 0.27 4.22 × 10⁷ 0.160.1 20 16 1.00 0.77 0.77 15.95 20.1 1.08 × 10⁶ 1.57 × 10² 3.18 × 10² 0.28 5.77 × 10⁷ 0.130.1 20 20 1.04 0.84 0.82 19.28 20.8 2.21 × 10⁶ 2.19 × 10² 4.02 × 10² 0.25 7.30 × 10⁷ 0.130.1 25 12 0.97 0.74 0.70 12.32 24.4 5.15 × 10⁵ 8.78 × 101 2.13 × 10² 0.22 4.19 × 10⁷ 0.160.1 25 16 1.02 0.80 0.77 15.69 25.5 1.68 × 10⁶ 1.43 × 10² 3.01 × 10² 0.27 5.73 × 10⁷ 0.140.1 25 20 1.05 0.85 0.82 19.04 26.3 3.74 × 10⁶ 2.06 × 10² 3.97 × 10² 0.28 7.28 × 10⁷ 0.130.2 15 8 0.94 0.66 0.66 8.48 14.2 4.05 × 10⁵ 5.97 × 101 1.11 × 10² 0.45 2.67 × 10⁷ 0.230.2 15 12 1.00 0.74 0.75 12.04 15.0 9.57 × 10⁵ 1.21 × 10² 2.06 × 10² 0.48 4.20 × 10⁷ 0.170.2 15 16 1.04 0.79 0.81 15.37 15.6 1.93 × 10⁶ 1.94 × 10² 3.20 × 10² 0.49 5.75 × 10⁷ 0.160.2 15 20 1.08 0.83 0.86 18.55 16.2 3.49 × 10⁶ 2.72 × 10² 4.26 × 10² 0.48 7.30 × 10⁷ 0.170.2 20 8 0.98 0.72 0.68 8.14 19.7 6.97 × 10⁵ 4.61 × 101 9.66 × 101 0.39 2.62 × 10⁷ 0.230.2 20 12 1.05 0.78 0.76 11.49 20.9 2.58 × 10⁶ 1.08 × 10² 1.99 × 10² 0.49 4.17 × 10⁷ 0.180.2 20 16 1.07 0.83 0.81 14.98 21.4 4.18 × 10⁶ 1.76 × 10² 3.06 × 10² 0.49 5.72 × 10⁷ 0.160.2 20 20 1.10 0.87 0.86 18.24 21.9 7.57 × 10⁶ 2.70 × 10² 4.57 × 10² 0.52 7.28 × 10⁷ 0.160.2 25 8 0.98 0.78 0.67 8.13 24.6 6.69 × 10⁵ 4.13 × 101 1.06 × 10² 0.25 2.58 × 10⁷ 0.250.2 25 12 1.05 0.83 0.77 11.43 26.3 3.73 × 10⁶ 9.51 × 101 1.82 × 10² 0.45 4.11 × 10⁷ 0.180.2 25 16 1.09 0.87 0.82 14.69 27.2 1.02 × 10⁷ 1.76 × 10² 3.10 × 10² 0.52 5.64 × 10⁷ 0.160.2 25 20 1.11 0.90 0.86 18.08 27.7 1.59 × 10⁷ 2.53 × 10² 4.34 × 10² 0.52 7.18 × 10⁷ 0.160.3 15 8 1.02 0.68 0.71 7.83 15.3 1.43 × 10⁶ 6.27 × 101 1.02 × 10² 0.64 2.65 × 10⁷ 0.260.3 15 12 1.04 0.75 0.77 11.54 15.6 1.90 × 10⁶ 1.35 × 10² 2.19 × 10² 0.56 4.20 × 10⁷ 0.210.3 15 16 1.08 0.80 0.83 14.79 16.2 3.70 × 10⁶ 2.15 × 10² 3.44 × 10² 0.58 5.75 × 10⁷ 0.190.3 15 20 1.13 0.84 0.89 17.73 16.9 7.76 × 10⁶ 3.38 × 10² 5.42 × 10² 0.61 7.30 × 10⁷ 0.200.3 20 8 1.02 0.76 0.70 7.81 20.5 1.68 × 10⁶ 4.90 × 101 8.94 × 101 0.45 2.61 × 10⁷ 0.290.3 20 12 1.08 0.81 0.79 11.08 21.7 5.80 × 10⁶ 1.34 × 10² 2.23 × 10² 0.60 4.14 × 10⁷ 0.220.3 20 16 1.12 0.84 0.84 14.29 22.4 1.25 × 10⁷ 2.20 × 10² 3.65 × 10² 0.63 5.71 × 10⁷ 0.190.3 20 20 1.14 0.87 0.88 17.53 22.8 1.94 × 10⁷ 3.20 × 10² 5.26 × 10² 0.63 7.27 × 10⁷ 0.190.3 25 8 1.04 0.82 0.72 7.66 26.1 3.17 × 10⁶ 5.10 × 101 9.93 × 101 0.42 2.54 × 10⁷ 0.300.3 25 12 1.09 0.85 0.80 11.03 27.2 9.97 × 10⁶ 1.15 × 10² 1.91 × 10² 0.55 4.05 × 10⁷ 0.230.3 25 16 1.13 0.88 0.85 14.18 28.2 2.82 × 10⁷ 2.19 × 10² 3.49 × 10² 0.63 5.55 × 10⁷ 0.200.3 25 20 1.16 0.91 0.90 17.22 29.1 6.71 × 10⁷ 3.76 × 10² 5.84 × 10² 0.68 7.08 × 10⁷ 0.210.4 15 8 1.04 0.68 0.72 7.67 15.6 1.99 × 10⁶ 5.32 × 101 8.93 × 101 0.55 2.66 × 10⁷ 0.320.4 15 12 1.07 0.77 0.80 11.20 16.1 3.18 × 10⁶ 1.59 × 10² 2.50 × 10² 0.63 4.19 × 10⁷ 0.240.4 15 16 1.11 0.81 0.85 14.39 16.7 6.03 × 10⁶ 2.43 × 10² 3.89 × 10² 0.63 5.74 × 10⁷ 0.210.4 15 20 1.16 0.84 0.90 17.23 17.4 1.31 × 10⁷ 3.63 × 10² 5.79 × 10² 0.67 7.31 × 10⁷ 0.220.4 20 8 1.06 0.79 0.74 7.56 21.2 3.43 × 10⁶ 5.36 × 101 7.34 × 101 0.52 2.57 × 10⁷ 0.340.4 20 12 1.11 0.83 0.82 10.80 22.2 1.04 × 10⁷ 1.56 × 10² 2.38 × 10² 0.64 4.13 × 10⁷ 0.250.4 20 16 1.16 0.86 0.89 13.81 23.2 2.81 × 10⁷ 3.03 × 10² 4.55 × 10² 0.72 5.71 × 10⁷ 0.240.4 20 20 1.20 0.89 0.93 16.75 23.9 5.92 × 10⁷ 4.43 × 10² 6.68 × 10² 0.73 7.25 × 10⁷ 0.250.4 25 8 1.09 0.84 0.75 7.37 27.1 9.21 × 10⁶ 5.96 × 101 1.00 × 10² 0.45 2.52 × 10⁷ 0.360.4 25 12 1.11 0.87 0.84 10.81 27.8 1.75 × 10⁷ 1.67 × 10² 2.26 × 10² 0.61 3.92 × 10⁷ 0.270.4 25 16 1.16 0.90 0.90 13.76 29.1 6.93 × 10⁷ 3.08 × 10² 4.16 × 10² 0.71 5.44 × 10⁷ 0.250.4 25 20 1.21 0.92 0.95 16.61 30.1 2.05 × 10⁸ 4.94 × 10² 6.45 × 10² 0.72 6.88 × 10⁷ 0.28
KORENAGA: SCALING OF PLATE TECTONICS B11405B11405
16 of 24
Table A2. Numerical Results for Reference Runs for g > 0.5
g �0 H* Tmax* Ti* hT*i Nu � Rai vrms* vs* P0.1 F Fd /F
0.6 10 8 0.95 0.64 0.70 8.39 9.5 6.05 × 10⁵ 9.53 × 101 1.36 × 10² 0.51 2.68 × 10⁷ 0.340.6 10 12 1.04 0.71 0.79 11.55 10.4 1.54 × 10⁶ 1.66 × 10² 2.41 × 10² 0.56 4.23 × 10⁷ 0.290.6 10 16 1.10 0.76 0.86 14.52 11.0 3.07 × 10⁶ 2.42 × 10² 3.56 × 10² 0.56 5.78 × 10⁷ 0.280.6 10 20 1.16 0.80 0.92 17.31 11.6 5.50 × 10⁶ 3.15 × 10² 4.63 × 10² 0.55 7.34 × 10⁷ 0.280.6 15 8 1.10 0.74 0.76 7.29 16.5 4.76 × 10⁶ 6.65 × 101 1.03 × 10² 0.36 2.61 × 10⁷ 0.450.6 15 12 1.13 0.79 0.85 10.60 17.0 8.32 × 10⁶ 1.92 × 10² 2.90 × 10² 0.69 4.17 × 10⁷ 0.300.6 15 16 1.18 0.82 0.90 13.60 17.7 1.69 × 10⁷ 2.84 × 10² 4.39 × 10² 0.71 5.71 × 10⁷ 0.260.6 15 20 1.22 0.85 0.95 16.35 18.4 3.52 × 10⁷ 3.93 × 10² 5.96 × 10² 0.71 7.31 × 10⁷ 0.270.6 20 8 1.13 0.83 0.79 7.10 22.5 1.42 × 10⁷ 6.93 × 101 8.92 × 101 0.50 2.54 × 10⁷ 0.430.6 20 12 1.40 1.38 1.28 8.59 27.9 3.91 × 10⁹ 5.16 × 10³ 9.91 × 10⁻² 0.00 3.41 × 10⁷ 0.350.6 20 16 1.21 0.88 0.94 13.20 24.3 8.69 × 10⁷ 3.52 × 10² 4.85 × 10² 0.68 5.63 × 10⁷ 0.310.6 20 20 1.26 0.89 0.98 15.85 25.3 2.45 × 10⁸ 5.01 × 10² 7.14 × 10² 0.66 7.19 × 10⁷ 0.320.8 10 8 1.09 0.64 0.79 7.34 10.9 2.66 × 10⁶ 1.05 × 10² 1.57 × 10² 0.73 2.69 × 10⁷ 0.330.8 10 12 1.07 0.72 0.82 11.17 10.7 2.28 × 10⁶ 1.70 × 10² 2.48 × 10² 0.58 4.23 × 10⁷ 0.320.8 10 16 1.14 0.76 0.88 14.06 11.4 4.53 × 10⁶ 2.44 × 10² 3.64 × 10² 0.58 5.78 × 10⁷ 0.300.8 10 20 1.20 0.80 0.94 16.66 12.0 8.97 × 10⁶ 3.30 × 10² 5.00 × 10² 0.59 7.36 × 10⁷ 0.290.8 15 8 1.14 0.77 0.79 7.03 17.1 8.92 × 10⁶ 7.00 × 101 9.55 × 101 0.33 2.58 × 10⁷ 0.500.8 15 12 1.18 0.81 0.89 10.22 17.6 1.63 × 10⁷ 1.93 × 10² 2.89 × 10² 0.64 4.13 × 10⁷ 0.320.8 15 16 1.23 0.84 0.95 13.01 18.5 3.90 × 10⁷ 2.98 × 10² 4.43 × 10² 0.66 5.74 × 10⁷ 0.310.8 15 20 1.28 0.86 1.00 15.59 19.3 9.11 × 10⁷ 4.17 × 10² 6.27 × 10² 0.66 7.32 × 10⁷ 0.320.8 20 8 1.32 1.30 1.18 6.04 26.5 8.79 × 10⁸ 1.79 × 10³ 4.93 × 10⁻³ 0.00 2.06 × 10⁷ 0.420.8 20 12 1.24 0.88 0.94 9.69 24.8 1.47 × 10⁸ 2.59 × 10² 2.90 × 10² 0.50 4.04 × 10⁷ 0.360.8 20 16 1.29 0.89 1.00 12.38 25.9 4.51 × 10⁸ 4.25 × 10² 5.07 × 10² 0.53 5.53 × 10⁷ 0.340.8 20 20 1.35 0.90 1.05 14.84 27.0 1.42 × 10⁹ 6.75 × 10² 7.17 × 10² 0.52 7.15 × 10⁷ 0.311.0 10 8 1.10 0.64 0.79 7.30 11.0 2.85 × 10⁶ 1.00 × 10² 1.52 × 10² 0.60 2.69 × 10⁷ 0.391.0 10 12 1.11 0.72 0.84 10.84 11.1 3.29 × 10⁶ 1.67 × 10² 2.50 × 10² 0.58 4.24 × 10⁷ 0.341.0 10 16 1.17 0.76 0.91 13.64 11.7 6.67 × 10⁶ 2.48 × 10² 3.80 × 10² 0.60 5.80 × 10⁷ 0.311.0 10 20 1.23 0.79 0.96 16.21 12.3 1.29 × 10⁷ 3.21 × 10² 5.02 × 10² 0.60 7.38 × 10⁷ 0.301.0 15 8 1.19 0.86 0.84 6.74 17.8 1.94 × 10⁷ 1.13 × 10² 1.32 × 10² 0.27 2.52 × 10⁷ 0.551.0 15 12 1.24 0.83 0.91 9.65 18.7 4.80 × 10⁷ 1.86 × 10² 2.79 × 10² 0.43 4.14 × 10⁷ 0.401.0 15 16 1.51 1.49 1.40 10.61 22.6 3.08 × 10⁹ 6.13 × 10³ 4.93 × 10⁻¹ 0.00 4.89 × 10⁷ 0.301.0 15 20 1.52 1.50 1.42 13.18 22.8 3.58 × 10⁹ 8.31 × 10³ 1.55 × 10⁻¹ 0.00 6.32 × 10⁷ 0.291.0 20 8 1.33 1.31 1.19 6.04 26.5 8.89 × 10⁸ 1.89 × 10³ 6.51 × 10⁻³ 0.00 2.07 × 10⁷ 0.431.0 20 12 1.39 1.38 1.28 8.61 27.9 3.72 × 10⁹ 4.71 × 10³ 4.37 × 10⁻³ 0.00 3.41 × 10⁷ 0.341.0 20 16 1.41 1.40 1.31 11.38 28.1 4.76 × 10⁹ 7.85 × 10³ 7.17 × 10⁻³ 0.00 4.82 × 10⁷ 0.311.0 20 20 1.46 1.45 1.38 13.69 29.2 1.49 × 10¹⁰ 1.57 × 10⁴ 2.07 × 10⁻³ 0.00 6.30 × 10⁷ 0.24
KORENAGA: SCALING OF PLATE TECTONICS B11405B11405
17 of 24
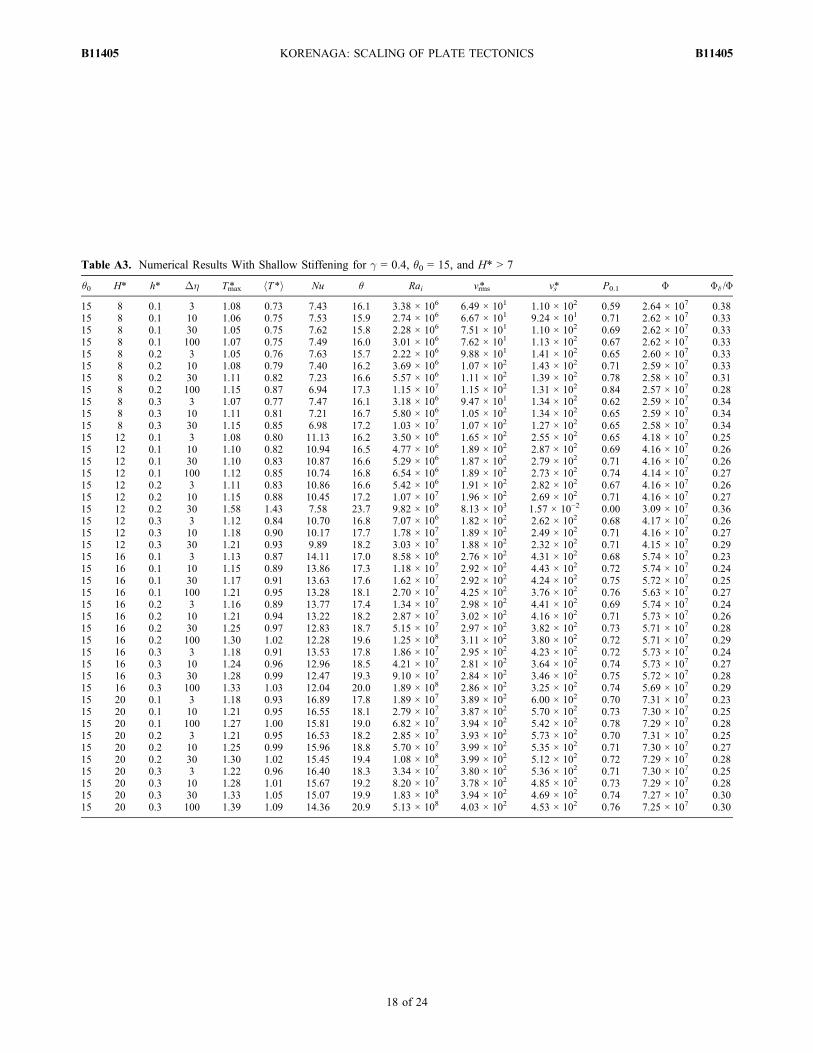
Table A3. Numerical Results With Shallow Stiffening for g = 0.4, �0 = 15, and H* > 7
�0 H* h* Dh Tmax* hT*i Nu � Rai vrms* vs* P0.1 F Fd /F
15 8 0.1 3 1.08 0.73 7.43 16.1 3.38 × 10⁶ 6.49 × 101 1.10 × 10² 0.59 2.64 × 10⁷ 0.3815 8 0.1 10 1.06 0.75 7.53 15.9 2.74 × 10⁶ 6.67 × 101 9.24 × 101 0.71 2.62 × 10⁷ 0.3315 8 0.1 30 1.05 0.75 7.62 15.8 2.28 × 10⁶ 7.51 × 101 1.10 × 10² 0.69 2.62 × 10⁷ 0.3315 8 0.1 100 1.07 0.75 7.49 16.0 3.01 × 10⁶ 7.62 × 101 1.13 × 10² 0.67 2.62 × 10⁷ 0.3315 8 0.2 3 1.05 0.76 7.63 15.7 2.22 × 10⁶ 9.88 × 101 1.41 × 10² 0.65 2.60 × 10⁷ 0.3315 8 0.2 10 1.08 0.79 7.40 16.2 3.69 × 10⁶ 1.07 × 10² 1.43 × 10² 0.71 2.59 × 10⁷ 0.3315 8 0.2 30 1.11 0.82 7.23 16.6 5.57 × 10⁶ 1.11 × 10² 1.39 × 10² 0.78 2.58 × 10⁷ 0.3115 8 0.2 100 1.15 0.87 6.94 17.3 1.15 × 10⁷ 1.15 × 10² 1.31 × 10² 0.84 2.57 × 10⁷ 0.2815 8 0.3 3 1.07 0.77 7.47 16.1 3.18 × 10⁶ 9.47 × 101 1.34 × 10² 0.62 2.59 × 10⁷ 0.3415 8 0.3 10 1.11 0.81 7.21 16.7 5.80 × 10⁶ 1.05 × 10² 1.34 × 10² 0.65 2.59 × 10⁷ 0.3415 8 0.3 30 1.15 0.85 6.98 17.2 1.03 × 10⁷ 1.07 × 10² 1.27 × 10² 0.65 2.58 × 10⁷ 0.3415 12 0.1 3 1.08 0.80 11.13 16.2 3.50 × 10⁶ 1.65 × 10² 2.55 × 10² 0.65 4.18 × 10⁷ 0.2515 12 0.1 10 1.10 0.82 10.94 16.5 4.77 × 10⁶ 1.89 × 10² 2.87 × 10² 0.69 4.16 × 10⁷ 0.2615 12 0.1 30 1.10 0.83 10.87 16.6 5.29 × 10⁶ 1.87 × 10² 2.79 × 10² 0.71 4.16 × 10⁷ 0.2615 12 0.1 100 1.12 0.85 10.74 16.8 6.54 × 10⁶ 1.89 × 10² 2.73 × 10² 0.74 4.14 × 10⁷ 0.2715 12 0.2 3 1.11 0.83 10.86 16.6 5.42 × 10⁶ 1.91 × 10² 2.82 × 10² 0.67 4.16 × 10⁷ 0.2615 12 0.2 10 1.15 0.88 10.45 17.2 1.07 × 10⁷ 1.96 × 10² 2.69 × 10² 0.71 4.16 × 10⁷ 0.2715 12 0.2 30 1.58 1.43 7.58 23.7 9.82 × 10⁹ 8.13 × 10³ 1.57 × 10⁻² 0.00 3.09 × 10⁷ 0.3615 12 0.3 3 1.12 0.84 10.70 16.8 7.07 × 10⁶ 1.82 × 10² 2.62 × 10² 0.68 4.17 × 10⁷ 0.2615 12 0.3 10 1.18 0.90 10.17 17.7 1.78 × 10⁷ 1.89 × 10² 2.49 × 10² 0.71 4.16 × 10⁷ 0.2715 12 0.3 30 1.21 0.93 9.89 18.2 3.03 × 10⁷ 1.88 × 10² 2.32 × 10² 0.71 4.15 × 10⁷ 0.2915 16 0.1 3 1.13 0.87 14.11 17.0 8.58 × 10⁶ 2.76 × 10² 4.31 × 10² 0.68 5.74 × 10⁷ 0.2315 16 0.1 10 1.15 0.89 13.86 17.3 1.18 × 10⁷ 2.92 × 10² 4.43 × 10² 0.72 5.74 × 10⁷ 0.2415 16 0.1 30 1.17 0.91 13.63 17.6 1.62 × 10⁷ 2.92 × 10² 4.24 × 10² 0.75 5.72 × 10⁷ 0.2515 16 0.1 100 1.21 0.95 13.28 18.1 2.70 × 10⁷ 4.25 × 10² 3.76 × 10² 0.76 5.63 × 10⁷ 0.2715 16 0.2 3 1.16 0.89 13.77 17.4 1.34 × 10⁷ 2.98 × 10² 4.41 × 10² 0.69 5.74 × 10⁷ 0.2415 16 0.2 10 1.21 0.94 13.22 18.2 2.87 × 10⁷ 3.02 × 10² 4.16 × 10² 0.71 5.73 × 10⁷ 0.2615 16 0.2 30 1.25 0.97 12.83 18.7 5.15 × 10⁷ 2.97 × 10² 3.82 × 10² 0.73 5.71 × 10⁷ 0.2815 16 0.2 100 1.30 1.02 12.28 19.6 1.25 × 10⁸ 3.11 × 10² 3.80 × 10² 0.72 5.71 × 10⁷ 0.2915 16 0.3 3 1.18 0.91 13.53 17.8 1.86 × 10⁷ 2.95 × 10² 4.23 × 10² 0.72 5.73 × 10⁷ 0.2415 16 0.3 10 1.24 0.96 12.96 18.5 4.21 × 10⁷ 2.81 × 10² 3.64 × 10² 0.74 5.73 × 10⁷ 0.2715 16 0.3 30 1.28 0.99 12.47 19.3 9.10 × 10⁷ 2.84 × 10² 3.46 × 10² 0.75 5.72 × 10⁷ 0.2815 16 0.3 100 1.33 1.03 12.04 20.0 1.89 × 10⁸ 2.86 × 10² 3.25 × 10² 0.74 5.69 × 10⁷ 0.2915 20 0.1 3 1.18 0.93 16.89 17.8 1.89 × 10⁷ 3.89 × 10² 6.00 × 10² 0.70 7.31 × 10⁷ 0.2315 20 0.1 10 1.21 0.95 16.55 18.1 2.79 × 10⁷ 3.87 × 10² 5.70 × 10² 0.73 7.30 × 10⁷ 0.2515 20 0.1 100 1.27 1.00 15.81 19.0 6.82 × 10⁷ 3.94 × 10² 5.42 × 10² 0.78 7.29 × 10⁷ 0.2815 20 0.2 3 1.21 0.95 16.53 18.2 2.85 × 10⁷ 3.93 × 10² 5.73 × 10² 0.70 7.31 × 10⁷ 0.2515 20 0.2 10 1.25 0.99 15.96 18.8 5.70 × 10⁷ 3.99 × 10² 5.35 × 10² 0.71 7.30 × 10⁷ 0.2715 20 0.2 30 1.30 1.02 15.45 19.4 1.08 × 10⁸ 3.99 × 10² 5.12 × 10² 0.72 7.29 × 10⁷ 0.2815 20 0.3 3 1.22 0.96 16.40 18.3 3.34 × 10⁷ 3.80 × 10² 5.36 × 10² 0.71 7.30 × 10⁷ 0.2515 20 0.3 10 1.28 1.01 15.67 19.2 8.20 × 10⁷ 3.78 × 10² 4.85 × 10² 0.73 7.29 × 10⁷ 0.2815 20 0.3 30 1.33 1.05 15.07 19.9 1.83 × 10⁸ 3.94 × 10² 4.69 × 10² 0.74 7.27 × 10⁷ 0.3015 20 0.3 100 1.39 1.09 14.36 20.9 5.13 × 10⁸ 4.03 × 10² 4.53 × 10² 0.76 7.25 × 10⁷ 0.30
KORENAGA: SCALING OF PLATE TECTONICS B11405B11405
18 of 24
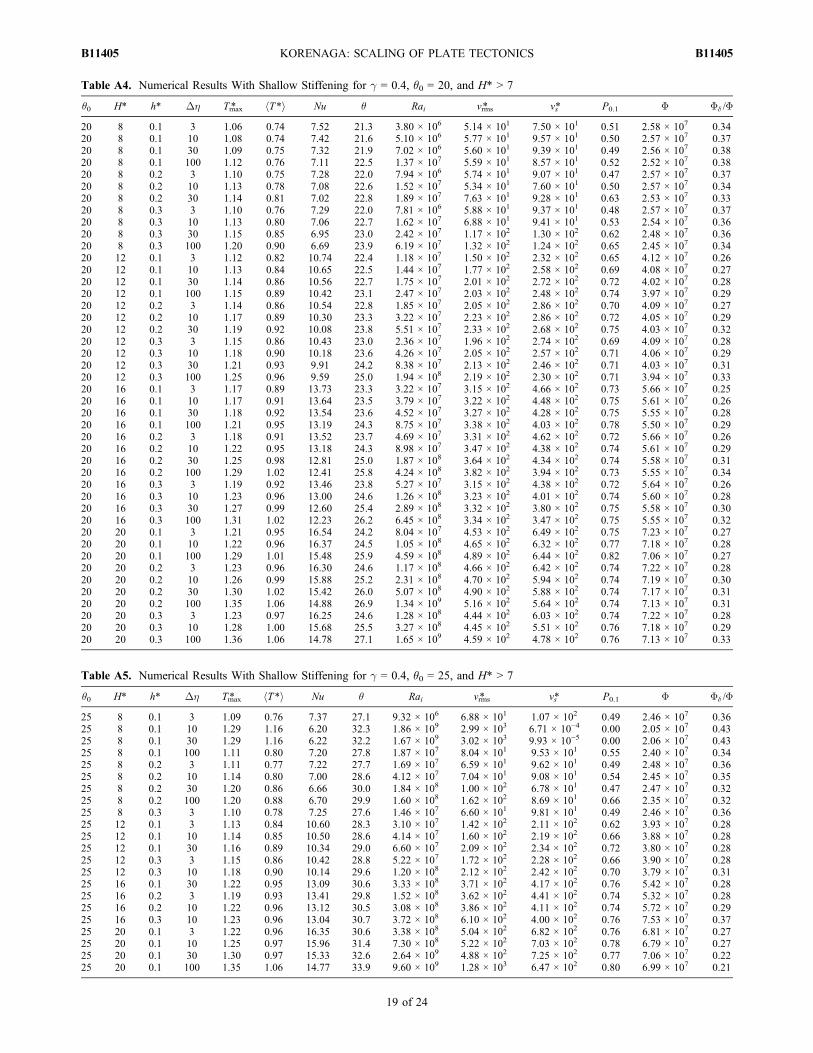
Table A4. Numerical Results With Shallow Stiffening for g = 0.4, �0 = 20, and H* > 7
�0 H* h* Dh Tmax* hT*i Nu � Rai vrms* vs* P0.1 F Fd /F
20 8 0.1 3 1.06 0.74 7.52 21.3 3.80 × 10⁶ 5.14 × 101 7.50 × 101 0.51 2.58 × 10⁷ 0.3420 8 0.1 10 1.08 0.74 7.42 21.6 5.10 × 10⁶ 5.77 × 101 9.57 × 101 0.50 2.57 × 10⁷ 0.3720 8 0.1 30 1.09 0.75 7.32 21.9 7.02 × 10⁶ 5.60 × 101 9.39 × 101 0.49 2.56 × 10⁷ 0.3820 8 0.1 100 1.12 0.76 7.11 22.5 1.37 × 10⁷ 5.59 × 101 8.57 × 101 0.52 2.52 × 10⁷ 0.3820 8 0.2 3 1.10 0.75 7.28 22.0 7.94 × 10⁶ 5.74 × 101 9.07 × 101 0.47 2.57 × 10⁷ 0.3720 8 0.2 10 1.13 0.78 7.08 22.6 1.52 × 10⁷ 5.34 × 101 7.60 × 101 0.50 2.57 × 10⁷ 0.3420 8 0.2 30 1.14 0.81 7.02 22.8 1.89 × 10⁷ 7.63 × 101 9.28 × 101 0.63 2.53 × 10⁷ 0.3320 8 0.3 3 1.10 0.76 7.29 22.0 7.81 × 10⁶ 5.88 × 101 9.37 × 101 0.48 2.57 × 10⁷ 0.3720 8 0.3 10 1.13 0.80 7.06 22.7 1.62 × 10⁷ 6.88 × 101 9.41 × 101 0.53 2.54 × 10⁷ 0.3620 8 0.3 30 1.15 0.85 6.95 23.0 2.42 × 10⁷ 1.17 × 10² 1.30 × 10² 0.62 2.48 × 10⁷ 0.3620 8 0.3 100 1.20 0.90 6.69 23.9 6.19 × 10⁷ 1.32 × 10² 1.24 × 10² 0.65 2.45 × 10⁷ 0.3420 12 0.1 3 1.12 0.82 10.74 22.4 1.18 × 10⁷ 1.50 × 10² 2.32 × 10² 0.65 4.12 × 10⁷ 0.2620 12 0.1 10 1.13 0.84 10.65 22.5 1.44 × 10⁷ 1.77 × 10² 2.58 × 10² 0.69 4.08 × 10⁷ 0.2720 12 0.1 30 1.14 0.86 10.56 22.7 1.75 × 10⁷ 2.01 × 10² 2.72 × 10² 0.72 4.02 × 10⁷ 0.2820 12 0.1 100 1.15 0.89 10.42 23.1 2.47 × 10⁷ 2.03 × 10² 2.48 × 10² 0.74 3.97 × 10⁷ 0.2920 12 0.2 3 1.14 0.86 10.54 22.8 1.85 × 10⁷ 2.05 × 10² 2.86 × 10² 0.70 4.09 × 10⁷ 0.2720 12 0.2 10 1.17 0.89 10.30 23.3 3.22 × 10⁷ 2.23 × 10² 2.86 × 10² 0.72 4.05 × 10⁷ 0.2920 12 0.2 30 1.19 0.92 10.08 23.8 5.51 × 10⁷ 2.33 × 10² 2.68 × 10² 0.75 4.03 × 10⁷ 0.3220 12 0.3 3 1.15 0.86 10.43 23.0 2.36 × 10⁷ 1.96 × 10² 2.74 × 10² 0.69 4.09 × 10⁷ 0.2820 12 0.3 10 1.18 0.90 10.18 23.6 4.26 × 10⁷ 2.05 × 10² 2.57 × 10² 0.71 4.06 × 10⁷ 0.2920 12 0.3 30 1.21 0.93 9.91 24.2 8.38 × 10⁷ 2.13 × 10² 2.46 × 10² 0.71 4.03 × 10⁷ 0.3120 12 0.3 100 1.25 0.96 9.59 25.0 1.94 × 10⁸ 2.19 × 10² 2.30 × 10² 0.71 3.94 × 10⁷ 0.3320 16 0.1 3 1.17 0.89 13.73 23.3 3.22 × 10⁷ 3.15 × 10² 4.66 × 10² 0.73 5.66 × 10⁷ 0.2520 16 0.1 10 1.17 0.91 13.64 23.5 3.79 × 10⁷ 3.22 × 10² 4.48 × 10² 0.75 5.61 × 10⁷ 0.2620 16 0.1 30 1.18 0.92 13.54 23.6 4.52 × 10⁷ 3.27 × 10² 4.28 × 10² 0.75 5.55 × 10⁷ 0.2820 16 0.1 100 1.21 0.95 13.19 24.3 8.75 × 10⁷ 3.38 × 10² 4.03 × 10² 0.78 5.50 × 10⁷ 0.2920 16 0.2 3 1.18 0.91 13.52 23.7 4.69 × 10⁷ 3.31 × 10² 4.62 × 10² 0.72 5.66 × 10⁷ 0.2620 16 0.2 10 1.22 0.95 13.18 24.3 8.98 × 10⁷ 3.47 × 10² 4.38 × 10² 0.74 5.61 × 10⁷ 0.2920 16 0.2 30 1.25 0.98 12.81 25.0 1.87 × 10⁸ 3.64 × 10² 4.34 × 10² 0.74 5.58 × 10⁷ 0.3120 16 0.2 100 1.29 1.02 12.41 25.8 4.24 × 10⁸ 3.82 × 10² 3.94 × 10² 0.73 5.55 × 10⁷ 0.3420 16 0.3 3 1.19 0.92 13.46 23.8 5.27 × 10⁷ 3.15 × 10² 4.38 × 10² 0.72 5.64 × 10⁷ 0.2620 16 0.3 10 1.23 0.96 13.00 24.6 1.26 × 10⁸ 3.23 × 10² 4.01 × 10² 0.74 5.60 × 10⁷ 0.2820 16 0.3 30 1.27 0.99 12.60 25.4 2.89 × 10⁸ 3.32 × 10² 3.80 × 10² 0.75 5.58 × 10⁷ 0.3020 16 0.3 100 1.31 1.02 12.23 26.2 6.45 × 10⁸ 3.34 × 10² 3.47 × 10² 0.75 5.55 × 10⁷ 0.3220 20 0.1 3 1.21 0.95 16.54 24.2 8.04 × 10⁷ 4.53 × 10² 6.49 × 10² 0.75 7.23 × 10⁷ 0.2720 20 0.1 10 1.22 0.96 16.37 24.5 1.05 × 10⁸ 4.65 × 10² 6.32 × 10² 0.77 7.18 × 10⁷ 0.2820 20 0.1 100 1.29 1.01 15.48 25.9 4.59 × 10⁸ 4.89 × 10² 6.44 × 10² 0.82 7.06 × 10⁷ 0.2720 20 0.2 3 1.23 0.96 16.30 24.6 1.17 × 10⁸ 4.66 × 10² 6.42 × 10² 0.74 7.22 × 10⁷ 0.2820 20 0.2 10 1.26 0.99 15.88 25.2 2.31 × 10⁸ 4.70 × 10² 5.94 × 10² 0.74 7.19 × 10⁷ 0.3020 20 0.2 30 1.30 1.02 15.42 26.0 5.07 × 10⁸ 4.90 × 10² 5.88 × 10² 0.74 7.17 × 10⁷ 0.3120 20 0.2 100 1.35 1.06 14.88 26.9 1.34 × 10⁹ 5.16 × 10² 5.64 × 10² 0.74 7.13 × 10⁷ 0.3120 20 0.3 3 1.23 0.97 16.25 24.6 1.28 × 10⁸ 4.44 × 10² 6.03 × 10² 0.74 7.22 × 10⁷ 0.2820 20 0.3 10 1.28 1.00 15.68 25.5 3.27 × 10⁸ 4.45 × 10² 5.51 × 10² 0.76 7.18 × 10⁷ 0.2920 20 0.3 100 1.36 1.06 14.78 27.1 1.65 × 10⁹ 4.59 × 10² 4.78 × 10² 0.76 7.13 × 10⁷ 0.33
Table A5. Numerical Results With Shallow Stiffening for g = 0.4, �0 = 25, and H* > 7
�0 H* h* Dh Tmax* hT*i Nu � Rai vrms* vs* P0.1 F Fd /F
25 8 0.1 3 1.09 0.76 7.37 27.1 9.32 × 10⁶ 6.88 × 101 1.07 × 10² 0.49 2.46 × 10⁷ 0.3625 8 0.1 10 1.29 1.16 6.20 32.3 1.86 × 10⁹ 2.99 × 10³ 6.71 × 10⁻⁴ 0.00 2.05 × 10⁷ 0.4325 8 0.1 30 1.29 1.16 6.22 32.2 1.67 × 10⁹ 3.02 × 10³ 9.93 × 10⁻⁵ 0.00 2.06 × 10⁷ 0.4325 8 0.1 100 1.11 0.80 7.20 27.8 1.87 × 10⁷ 8.04 × 101 9.53 × 101 0.55 2.40 × 10⁷ 0.3425 8 0.2 3 1.11 0.77 7.22 27.7 1.69 × 10⁷ 6.59 × 101 9.62 × 101 0.49 2.48 × 10⁷ 0.3625 8 0.2 10 1.14 0.80 7.00 28.6 4.12 × 10⁷ 7.04 × 101 9.08 × 101 0.54 2.45 × 10⁷ 0.3525 8 0.2 30 1.20 0.86 6.66 30.0 1.84 × 10⁸ 1.00 × 10² 6.78 × 101 0.47 2.47 × 10⁷ 0.3225 8 0.2 100 1.20 0.88 6.70 29.9 1.60 × 10⁸ 1.62 × 10² 8.69 × 101 0.66 2.35 × 10⁷ 0.3225 8 0.3 3 1.10 0.78 7.25 27.6 1.46 × 10⁷ 6.60 × 101 9.81 × 101 0.49 2.46 × 10⁷ 0.3625 12 0.1 3 1.13 0.84 10.60 28.3 3.10 × 10⁷ 1.42 × 10² 2.11 × 10² 0.62 3.93 × 10⁷ 0.2825 12 0.1 10 1.14 0.85 10.50 28.6 4.14 × 10⁷ 1.60 × 10² 2.19 × 10² 0.66 3.88 × 10⁷ 0.2825 12 0.1 30 1.16 0.89 10.34 29.0 6.60 × 10⁷ 2.09 × 10² 2.34 × 10² 0.72 3.80 × 10⁷ 0.2825 12 0.3 3 1.15 0.86 10.42 28.8 5.22 × 10⁷ 1.72 × 10² 2.28 × 10² 0.66 3.90 × 10⁷ 0.2825 12 0.3 10 1.18 0.90 10.14 29.6 1.20 × 10⁸ 2.12 × 10² 2.42 × 10² 0.70 3.79 × 10⁷ 0.3125 16 0.1 30 1.22 0.95 13.09 30.6 3.33 × 10⁸ 3.71 × 10² 4.17 × 10² 0.76 5.42 × 10⁷ 0.2825 16 0.2 3 1.19 0.93 13.41 29.8 1.52 × 10⁸ 3.62 × 10² 4.41 × 10² 0.74 5.32 × 10⁷ 0.2825 16 0.2 10 1.22 0.96 13.12 30.5 3.08 × 10⁸ 3.86 × 10² 4.11 × 10² 0.74 5.72 × 10⁷ 0.2925 16 0.3 10 1.23 0.96 13.04 30.7 3.72 × 10⁸ 6.10 × 10² 4.00 × 10² 0.76 7.53 × 10⁷ 0.3725 20 0.1 3 1.22 0.96 16.35 30.6 3.38 × 10⁸ 5.04 × 10² 6.82 × 10² 0.76 6.81 × 10⁷ 0.2725 20 0.1 10 1.25 0.97 15.96 31.4 7.30 × 10⁸ 5.22 × 10² 7.03 × 10² 0.78 6.79 × 10⁷ 0.2725 20 0.1 30 1.30 0.97 15.33 32.6 2.64 × 10⁹ 4.88 × 10² 7.25 × 10² 0.77 7.06 × 10⁷ 0.2225 20 0.1 100 1.35 1.06 14.77 33.9 9.60 × 10⁹ 1.28 × 10³ 6.47 × 10² 0.80 6.99 × 10⁷ 0.21
KORENAGA: SCALING OF PLATE TECTONICS B11405B11405
19 of 24
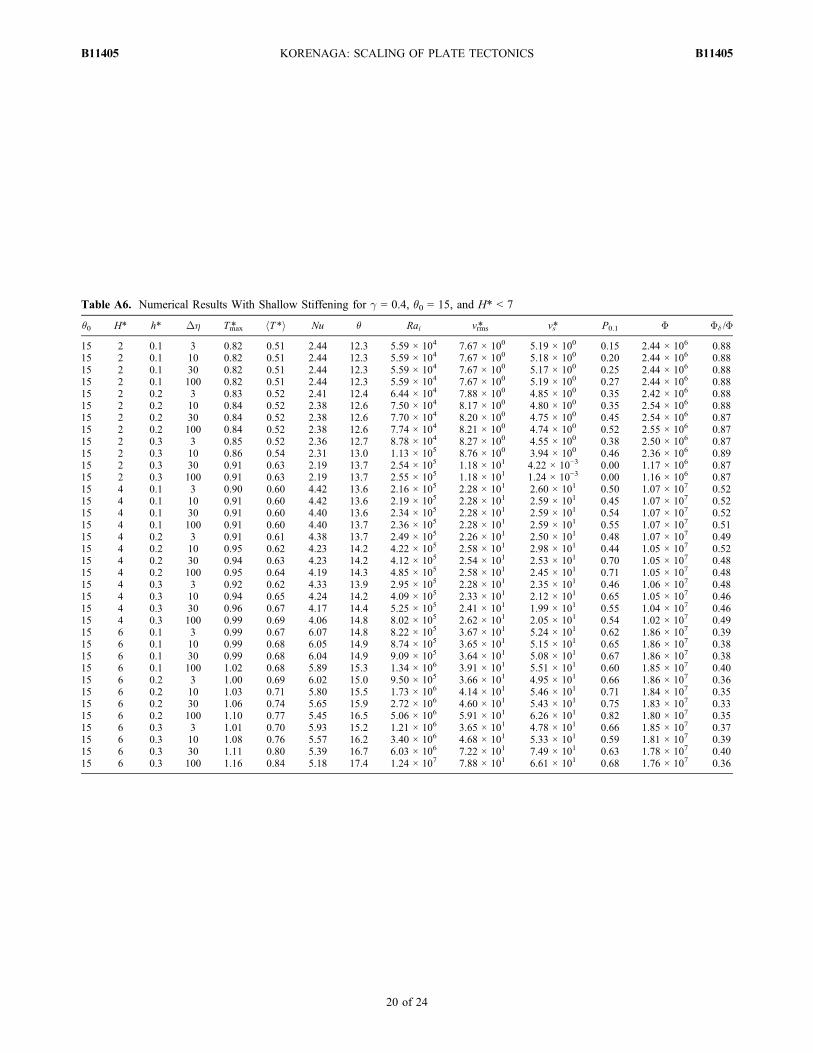
Table A6. Numerical Results With Shallow Stiffening for g = 0.4, �0 = 15, and H* < 7
�0 H* h* Dh Tmax* hT*i Nu � Rai vrms* vs* P0.1 F Fd /F
15 2 0.1 3 0.82 0.51 2.44 12.3 5.59 × 10⁴ 7.67 × 100 5.19 × 100 0.15 2.44 × 10⁶ 0.8815 2 0.1 10 0.82 0.51 2.44 12.3 5.59 × 10⁴ 7.67 × 100 5.18 × 100 0.20 2.44 × 10⁶ 0.8815 2 0.1 30 0.82 0.51 2.44 12.3 5.59 × 10⁴ 7.67 × 100 5.17 × 100 0.25 2.44 × 10⁶ 0.8815 2 0.1 100 0.82 0.51 2.44 12.3 5.59 × 10⁴ 7.67 × 100 5.19 × 100 0.27 2.44 × 10⁶ 0.8815 2 0.2 3 0.83 0.52 2.41 12.4 6.44 × 10⁴ 7.88 × 100 4.85 × 100 0.35 2.42 × 10⁶ 0.8815 2 0.2 10 0.84 0.52 2.38 12.6 7.50 × 10⁴ 8.17 × 100 4.80 × 100 0.35 2.54 × 10⁶ 0.8815 2 0.2 30 0.84 0.52 2.38 12.6 7.70 × 10⁴ 8.20 × 100 4.75 × 100 0.45 2.54 × 10⁶ 0.8715 2 0.2 100 0.84 0.52 2.38 12.6 7.74 × 10⁴ 8.21 × 100 4.74 × 100 0.52 2.55 × 10⁶ 0.8715 2 0.3 3 0.85 0.52 2.36 12.7 8.78 × 10⁴ 8.27 × 100 4.55 × 100 0.38 2.50 × 10⁶ 0.8715 2 0.3 10 0.86 0.54 2.31 13.0 1.13 × 10⁵ 8.76 × 100 3.94 × 100 0.46 2.36 × 10⁶ 0.8915 2 0.3 30 0.91 0.63 2.19 13.7 2.54 × 10⁵ 1.18 × 101 4.22 × 10⁻³ 0.00 1.17 × 10⁶ 0.8715 2 0.3 100 0.91 0.63 2.19 13.7 2.55 × 10⁵ 1.18 × 101 1.24 × 10⁻³ 0.00 1.16 × 10⁶ 0.8715 4 0.1 3 0.90 0.60 4.42 13.6 2.16 × 10⁵ 2.28 × 101 2.60 × 101 0.50 1.07 × 10⁷ 0.5215 4 0.1 10 0.91 0.60 4.42 13.6 2.19 × 10⁵ 2.28 × 101 2.59 × 101 0.45 1.07 × 10⁷ 0.5215 4 0.1 30 0.91 0.60 4.40 13.6 2.34 × 10⁵ 2.28 × 101 2.59 × 101 0.54 1.07 × 10⁷ 0.5215 4 0.1 100 0.91 0.60 4.40 13.7 2.36 × 10⁵ 2.28 × 101 2.59 × 101 0.55 1.07 × 10⁷ 0.5115 4 0.2 3 0.91 0.61 4.38 13.7 2.49 × 10⁵ 2.26 × 101 2.50 × 101 0.48 1.07 × 10⁷ 0.4915 4 0.2 10 0.95 0.62 4.23 14.2 4.22 × 10⁵ 2.58 × 101 2.98 × 101 0.44 1.05 × 10⁷ 0.5215 4 0.2 30 0.94 0.63 4.23 14.2 4.12 × 10⁵ 2.54 × 101 2.53 × 101 0.70 1.05 × 10⁷ 0.4815 4 0.2 100 0.95 0.64 4.19 14.3 4.85 × 10⁵ 2.58 × 101 2.45 × 101 0.71 1.05 × 10⁷ 0.4815 4 0.3 3 0.92 0.62 4.33 13.9 2.95 × 10⁵ 2.28 × 101 2.35 × 101 0.46 1.06 × 10⁷ 0.4815 4 0.3 10 0.94 0.65 4.24 14.2 4.09 × 10⁵ 2.33 × 101 2.12 × 101 0.65 1.05 × 10⁷ 0.4615 4 0.3 30 0.96 0.67 4.17 14.4 5.25 × 10⁵ 2.41 × 101 1.99 × 101 0.55 1.04 × 10⁷ 0.4615 4 0.3 100 0.99 0.69 4.06 14.8 8.02 × 10⁵ 2.62 × 101 2.05 × 101 0.54 1.02 × 10⁷ 0.4915 6 0.1 3 0.99 0.67 6.07 14.8 8.22 × 10⁵ 3.67 × 101 5.24 × 101 0.62 1.86 × 10⁷ 0.3915 6 0.1 10 0.99 0.68 6.05 14.9 8.74 × 10⁵ 3.65 × 101 5.15 × 101 0.65 1.86 × 10⁷ 0.3815 6 0.1 30 0.99 0.68 6.04 14.9 9.09 × 10⁵ 3.64 × 101 5.08 × 101 0.67 1.86 × 10⁷ 0.3815 6 0.1 100 1.02 0.68 5.89 15.3 1.34 × 10⁶ 3.91 × 101 5.51 × 101 0.60 1.85 × 10⁷ 0.4015 6 0.2 3 1.00 0.69 6.02 15.0 9.50 × 10⁵ 3.66 × 101 4.95 × 101 0.66 1.86 × 10⁷ 0.3615 6 0.2 10 1.03 0.71 5.80 15.5 1.73 × 10⁶ 4.14 × 101 5.46 × 101 0.71 1.84 × 10⁷ 0.3515 6 0.2 30 1.06 0.74 5.65 15.9 2.72 × 10⁶ 4.60 × 101 5.43 × 101 0.75 1.83 × 10⁷ 0.3315 6 0.2 100 1.10 0.77 5.45 16.5 5.06 × 10⁶ 5.91 × 101 6.26 × 101 0.82 1.80 × 10⁷ 0.3515 6 0.3 3 1.01 0.70 5.93 15.2 1.21 × 10⁶ 3.65 × 101 4.78 × 101 0.66 1.85 × 10⁷ 0.3715 6 0.3 10 1.08 0.76 5.57 16.2 3.40 × 10⁶ 4.68 × 101 5.33 × 101 0.59 1.81 × 10⁷ 0.3915 6 0.3 30 1.11 0.80 5.39 16.7 6.03 × 10⁶ 7.22 × 101 7.49 × 101 0.63 1.78 × 10⁷ 0.4015 6 0.3 100 1.16 0.84 5.18 17.4 1.24 × 10⁷ 7.88 × 101 6.61 × 101 0.68 1.76 × 10⁷ 0.36
KORENAGA: SCALING OF PLATE TECTONICS B11405B11405
20 of 24
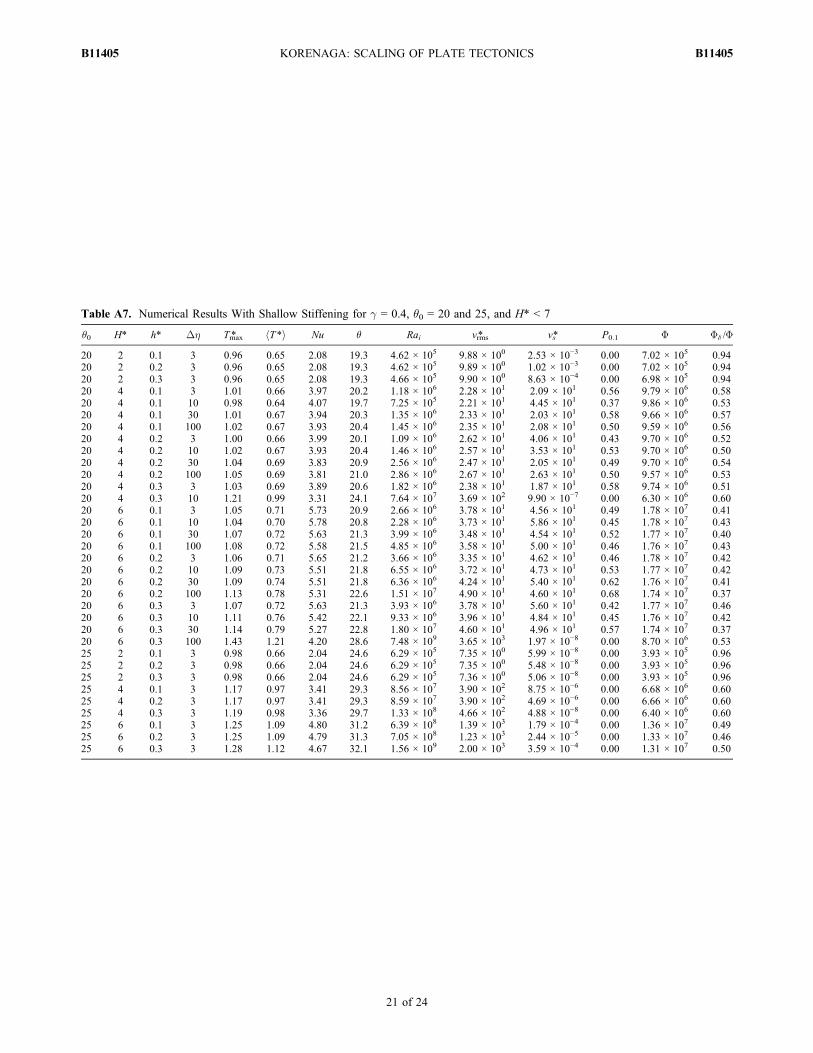
Table A7. Numerical Results With Shallow Stiffening for g = 0.4, �0 = 20 and 25, and H* < 7
�0 H* h* Dh Tmax* hT*i Nu � Rai vrms* vs* P0.1 F Fd /F
20 2 0.1 3 0.96 0.65 2.08 19.3 4.62 × 10⁵ 9.88 × 100 2.53 × 10⁻³ 0.00 7.02 × 10⁵ 0.9420 2 0.2 3 0.96 0.65 2.08 19.3 4.62 × 10⁵ 9.89 × 100 1.02 × 10⁻³ 0.00 7.02 × 10⁵ 0.9420 2 0.3 3 0.96 0.65 2.08 19.3 4.66 × 10⁵ 9.90 × 100 8.63 × 10⁻⁴ 0.00 6.98 × 10⁵ 0.9420 4 0.1 3 1.01 0.66 3.97 20.2 1.18 × 10⁶ 2.28 × 101 2.09 × 101 0.56 9.79 × 10⁶ 0.5820 4 0.1 10 0.98 0.64 4.07 19.7 7.25 × 10⁵ 2.21 × 101 4.45 × 101 0.37 9.86 × 10⁶ 0.5320 4 0.1 30 1.01 0.67 3.94 20.3 1.35 × 10⁶ 2.33 × 101 2.03 × 101 0.58 9.66 × 10⁶ 0.5720 4 0.1 100 1.02 0.67 3.93 20.4 1.45 × 10⁶ 2.35 × 101 2.08 × 101 0.50 9.59 × 10⁶ 0.5620 4 0.2 3 1.00 0.66 3.99 20.1 1.09 × 10⁶ 2.62 × 101 4.06 × 101 0.43 9.70 × 10⁶ 0.5220 4 0.2 10 1.02 0.67 3.93 20.4 1.46 × 10⁶ 2.57 × 101 3.53 × 101 0.53 9.70 × 10⁶ 0.5020 4 0.2 30 1.04 0.69 3.83 20.9 2.56 × 10⁶ 2.47 × 101 2.05 × 101 0.49 9.70 × 10⁶ 0.5420 4 0.2 100 1.05 0.69 3.81 21.0 2.86 × 10⁶ 2.67 × 101 2.63 × 101 0.50 9.57 × 10⁶ 0.5320 4 0.3 3 1.03 0.69 3.89 20.6 1.82 × 10⁶ 2.38 × 101 1.87 × 101 0.58 9.74 × 10⁶ 0.5120 4 0.3 10 1.21 0.99 3.31 24.1 7.64 × 10⁷ 3.69 × 10² 9.90 × 10⁻⁷ 0.00 6.30 × 10⁶ 0.6020 6 0.1 3 1.05 0.71 5.73 20.9 2.66 × 10⁶ 3.78 × 101 4.56 × 101 0.49 1.78 × 10⁷ 0.4120 6 0.1 10 1.04 0.70 5.78 20.8 2.28 × 10⁶ 3.73 × 101 5.86 × 101 0.45 1.78 × 10⁷ 0.4320 6 0.1 30 1.07 0.72 5.63 21.3 3.99 × 10⁶ 3.48 × 101 4.54 × 101 0.52 1.77 × 10⁷ 0.4020 6 0.1 100 1.08 0.72 5.58 21.5 4.85 × 10⁶ 3.58 × 101 5.00 × 101 0.46 1.76 × 10⁷ 0.4320 6 0.2 3 1.06 0.71 5.65 21.2 3.66 × 10⁶ 3.35 × 101 4.62 × 101 0.46 1.78 × 10⁷ 0.4220 6 0.2 10 1.09 0.73 5.51 21.8 6.55 × 10⁶ 3.72 × 101 4.73 × 101 0.53 1.77 × 10⁷ 0.4220 6 0.2 30 1.09 0.74 5.51 21.8 6.36 × 10⁶ 4.24 × 101 5.40 × 101 0.62 1.76 × 10⁷ 0.4120 6 0.2 100 1.13 0.78 5.31 22.6 1.51 × 10⁷ 4.90 × 101 4.60 × 101 0.68 1.74 × 10⁷ 0.3720 6 0.3 3 1.07 0.72 5.63 21.3 3.93 × 10⁶ 3.78 × 101 5.60 × 101 0.42 1.77 × 10⁷ 0.4620 6 0.3 10 1.11 0.76 5.42 22.1 9.33 × 10⁶ 3.96 × 101 4.84 × 101 0.45 1.76 × 10⁷ 0.4220 6 0.3 30 1.14 0.79 5.27 22.8 1.80 × 10⁷ 4.60 × 101 4.96 × 101 0.57 1.74 × 10⁷ 0.3720 6 0.3 100 1.43 1.21 4.20 28.6 7.48 × 10⁹ 3.65 × 10³ 1.97 × 10⁻⁸ 0.00 8.70 × 10⁶ 0.5325 2 0.1 3 0.98 0.66 2.04 24.6 6.29 × 10⁵ 7.35 × 100 5.99 × 10⁻⁸ 0.00 3.93 × 10⁵ 0.9625 2 0.2 3 0.98 0.66 2.04 24.6 6.29 × 10⁵ 7.35 × 100 5.48 × 10⁻⁸ 0.00 3.93 × 10⁵ 0.9625 2 0.3 3 0.98 0.66 2.04 24.6 6.29 × 10⁵ 7.36 × 100 5.06 × 10⁻⁸ 0.00 3.93 × 10⁵ 0.9625 4 0.1 3 1.17 0.97 3.41 29.3 8.56 × 10⁷ 3.90 × 10² 8.75 × 10⁻⁶ 0.00 6.68 × 10⁶ 0.6025 4 0.2 3 1.17 0.97 3.41 29.3 8.59 × 10⁷ 3.90 × 10² 4.69 × 10⁻⁶ 0.00 6.66 × 10⁶ 0.6025 4 0.3 3 1.19 0.98 3.36 29.7 1.33 × 10⁸ 4.66 × 10² 4.88 × 10⁻⁸ 0.00 6.40 × 10⁶ 0.6025 6 0.1 3 1.25 1.09 4.80 31.2 6.39 × 10⁸ 1.39 × 10³ 1.79 × 10⁻⁴ 0.00 1.36 × 10⁷ 0.4925 6 0.2 3 1.25 1.09 4.79 31.3 7.05 × 10⁸ 1.23 × 10³ 2.44 × 10⁻⁵ 0.00 1.33 × 10⁷ 0.4625 6 0.3 3 1.28 1.12 4.67 32.1 1.56 × 10⁹ 2.00 × 10³ 3.59 × 10⁻⁴ 0.00 1.31 × 10⁷ 0.50
KORENAGA: SCALING OF PLATE TECTONICS B11405B11405
21 of 24
[51] Acknowledgments. This work was sponsored by the U.S.National Science Foundation under grant EAR‐0449517 and MicrosoftA. Richard Newton Breakthrough Research Award. The author thanks theAssociate Editor and two anonymous referees for careful reviews.
ReferencesAbbott, D., L. Burgess, J. Longhi, and W. H. F. Smith (1994), An empiricalthermal history of the Earth’s upper mantle, J. Geophys. Res., 99,13,835–13,850.
Bercovici, D. (2003), The generation of plate tectonics from mantle con-vection, Earth Planet. Sci. Lett., 205, 107–121.
Bercovici, D., and S. Karato (2003), Theoretical analysis of shear localiza-tion in the lithosphere, Rev. Mineral. Geochem., 51, 387–421.
Bercovici, D., G. Schubert, and G. A. Glatzmaier (1992), Three‐dimensional, infinite Prandtl number, compressible convection in abasally heated spherical shell, J. Fluid Mech., 239, 683–719.
Bercovici, D., Y. Ricard, and M. A. Richards (2000), The relation betweenmantle dynamics and plate tectonics: A primer, in The History andDynamics of Global Plate Motions, edited by M. A. Richards, R. G.Gordon, and R. D. van der Hilst, pp. 5–46, AGU, Washington, D. C.
Bleeker, W. (2003), The late Archean record: A puzzle in ca. 35 pieces,Lithos, 71, 99–134.
Bradley, D. C. (2008), Passive margins through Earth history, Earth Sci.Rev., 91, 1–26.
Busse, F. H. (1967), On the stability of two‐dimensional convection in alayer heated from below, Z. Angew. Math. Phys., 46, 140–150.
Byerlee, J. (1978), Friction of rocks, Pure Appl. Geophys., 116, 615–626.Christensen, U. (1984), Convection with pressure‐ and temperature‐dependent non‐Newtonian rheology, Geophys. J. R. Astron. Soc., 77,343–384.
Christensen, U. R. (1985), Thermal evolution models for the Earth,J. Geophys. Res., 90, 2995–3007.
Christensen, U. R., and D. A. Yuen (1984), The interaction of a subductinglithospheric slab with a chemical or phase boundary, J. Geophys. Res.,89, 4389–4402.
Condie, K. C., and V. Pease (Eds.) (2008),When Did Plate Tectonics Beginon Planet Earth?, Geol. Soc. of Am., Boulder, Colo.
Conrad, C. P., and B. H. Hager (1999), Effects of plate bending and faultstrength at subduction zones on plate dynamics, J. Geophys. Res., 104,17,551–17,571.
Crisp, J. A. (1984), Rates of magma emplacement and volcanic output,J. Volcanol. Geotherm. Res., 20, 177–211.
Daly, S. F. (1980), Convection with decaying heat sources: Constantviscosity, Geophys. J. R. Astron. Soc., 61, 519–547.
Davies, G. F. (2009), Effect of plate bending on the Urey ratio and the ther-mal evolution of the mantle, Earth Planet. Sci. Lett., 287, 513–518.
Table A8. Numerical Results With Shallow Stiffening for g = 0.8
�0 H* h* Dh Tmax* hT*i Nu � Rai vrms* vs* P0.1 F Fd /F
10 2 0.2 1000 0.85 0.58 2.35 8.5 1.91 × 10⁵ 1.79 × 101 3.66 × 10⁻² 0.00 2.07 × 10⁶ 0.8610 2 0.3 10 0.80 0.53 2.50 8.0 1.07 × 10⁵ 1.37 × 101 3.83 × 100 0.46 2.72 × 10⁶ 0.8310 2 0.3 100 0.88 0.60 2.27 8.8 2.66 × 10⁵ 1.89 × 101 1.23 × 10⁻¹ 0.00 1.75 × 10⁶ 0.8710 3 0.2 10 0.75 0.52 3.98 7.5 6.49 × 10⁴ 2.01 × 101 1.77 × 101 0.66 7.61 × 10⁶ 0.6310 3 0.2 100 1.00 0.78 2.99 10.0 1.03 × 10⁶ 5.80 × 101 4.43 × 10⁻² 0.00 4.41 × 10⁶ 0.6810 3 0.3 10 0.83 0.58 3.62 8.3 1.49 × 10⁵ 2.14 × 101 1.39 × 101 0.57 6.95 × 10⁶ 0.7010 4 0.1 10 0.77 0.55 5.18 7.7 7.89 × 10⁴ 2.89 × 101 3.37 × 101 0.73 1.17 × 10⁷ 0.5310 4 0.1 100 0.78 0.55 5.15 7.8 8.36 × 10⁴ 2.90 × 101 3.34 × 101 0.79 1.17 × 10⁷ 0.5410 4 0.1 1000 0.78 0.55 5.15 7.8 8.38 × 10⁴ 2.90 × 101 3.33 × 101 0.79 1.17 × 10⁷ 0.5410 4 0.2 10 0.82 0.59 4.90 8.2 1.31 × 10⁵ 3.11 × 101 3.14 × 101 0.59 1.14 × 10⁷ 0.5810 4 0.2 100 1.11 0.92 3.61 11.1 3.26 × 10⁶ 1.13 × 10² 7.14 × 10⁻³ 0.00 7.34 × 10⁶ 0.6110 4 0.3 10 0.88 0.63 4.52 8.8 2.80 × 10⁵ 3.55 × 101 3.27 × 101 0.53 1.09 × 10⁷ 0.6412 2 0.2 10 0.80 0.51 2.49 9.6 7.47 × 10⁴ 1.05 × 101 4.58 × 100 0.57 2.80 × 10⁶ 0.8512 2 0.2 100 0.90 0.60 2.23 10.7 2.55 × 10⁵ 1.58 × 101 3.23 × 10⁻¹ 0.00 1.70 × 10⁶ 0.9112 2 0.3 10 0.90 0.61 2.22 10.8 2.79 × 10⁵ 1.59 × 101 6.30 × 10⁻¹ 0.00 1.63 × 10⁶ 0.9112 2 0.3 100 0.92 0.62 2.18 11.0 3.34 × 10⁵ 1.68 × 101 4.51 × 10⁻² 0.00 1.46 × 10⁶ 0.9312 3 0.1 10 0.82 0.54 3.68 9.8 8.91 × 10⁴ 1.79 × 101 1.57 × 101 0.48 7.11 × 10⁶ 0.6712 3 0.1 100 0.82 0.54 3.67 9.8 9.03 × 10⁴ 1.79 × 101 1.56 × 101 0.52 7.12 × 10⁶ 0.6712 3 0.1 1000 0.82 0.54 3.67 9.8 9.04 × 10⁴ 1.79 × 101 1.56 × 101 0.54 7.13 × 10⁶ 0.6712 3 0.2 10 0.84 0.57 3.57 10.1 1.24 × 10⁵ 1.84 × 101 1.36 × 101 0.69 6.95 × 10⁶ 0.6712 3 0.2 100 0.87 0.60 3.46 10.4 1.78 × 10⁵ 2.00 × 101 1.18 × 101 0.67 6.66 × 10⁶ 0.7012 3 0.2 1000 0.89 0.62 3.38 10.6 2.30 × 10⁵ 2.14 × 101 1.08 × 101 0.76 6.48 × 10⁶ 0.7212 4 0.1 10 0.86 0.60 4.65 10.3 1.61 × 10⁵ 2.56 × 101 2.64 × 101 0.66 1.11 × 10⁷ 0.5712 4 0.1 100 0.86 0.60 4.63 10.4 1.67 × 10⁵ 2.56 × 101 2.61 × 101 0.78 1.11 × 10⁷ 0.5712 4 0.1 1000 0.87 0.60 4.61 10.4 1.78 × 10⁵ 2.56 × 101 2.62 × 101 0.76 1.11 × 10⁷ 0.5712 4 0.2 10 0.88 0.63 4.53 10.6 2.15 × 10⁵ 2.61 × 101 2.39 × 101 0.63 1.09 × 10⁷ 0.5712 4 0.2 100 0.91 0.66 4.38 11.0 3.20 × 10⁵ 2.75 × 101 2.14 × 101 0.65 1.06 × 10⁷ 0.6212 4 0.2 1000 1.13 0.93 3.53 13.6 5.50 × 10⁶ 1.33 × 10² 1.59 × 10⁻⁴ 0.00 7.12 × 10⁶ 0.6112 4 0.3 10 0.93 0.67 4.31 11.1 3.96 × 10⁵ 2.72 × 101 2.17 × 101 0.56 1.05 × 10⁷ 0.6614 2 0.1 10 0.86 0.55 2.34 12.0 1.13 × 10⁵ 9.86 × 100 3.49 × 100 0.35 2.23 × 10⁶ 0.9014 2 0.1 100 0.86 0.55 2.34 12.0 1.13 × 10⁵ 9.85 × 100 3.49 × 100 0.36 2.23 × 10⁶ 0.9014 2 0.1 1000 0.86 0.55 2.34 12.0 1.13 × 10⁵ 9.85 × 100 3.49 × 100 0.36 2.23 × 10⁶ 0.9014 2 0.2 10 0.91 0.59 2.21 12.7 2.42 × 10⁵ 1.25 × 101 2.32 × 100 0.57 1.73 × 10⁶ 0.9314 2 0.2 100 0.89 0.62 2.24 12.5 2.02 × 10⁵ 1.20 × 101 1.17 × 10⁻³ 0.00 1.36 × 10⁶ 0.8514 2 0.3 10 0.90 0.62 2.22 12.6 2.26 × 10⁵ 1.24 × 101 7.89 × 10⁻³ 0.00 1.28 × 10⁶ 0.8414 3 0.1 10 0.89 0.60 3.36 12.5 2.03 × 10⁵ 1.79 × 101 1.21 × 101 0.51 6.46 × 10⁶ 0.7114 3 0.1 100 0.89 0.60 3.35 12.5 2.04 × 10⁵ 1.79 × 101 1.21 × 101 0.54 6.46 × 10⁶ 0.7114 3 0.1 1000 0.89 0.60 3.35 12.5 2.05 × 10⁵ 1.80 × 101 1.20 × 101 0.53 6.47 × 10⁶ 0.7114 3 0.2 10 0.91 0.62 3.28 12.8 2.72 × 10⁵ 1.91 × 101 1.07 × 101 0.61 6.29 × 10⁶ 0.7014 3 0.3 100 1.08 0.84 2.79 15.1 3.13 × 10⁶ 7.22 × 101 3.55 × 10⁻⁴ 0.00 3.59 × 10⁶ 0.7014 4 0.1 10 0.94 0.65 4.27 13.1 3.91 × 10⁵ 2.49 × 101 2.17 × 101 0.63 1.05 × 10⁷ 0.6014 4 0.1 100 0.94 0.65 4.26 13.2 4.05 × 10⁵ 2.49 × 101 2.29 × 101 0.48 1.05 × 10⁷ 0.6014 4 0.1 1000 0.98 0.67 4.10 13.7 6.98 × 10⁵ 3.11 × 101 2.52 × 101 0.58 1.02 × 10⁷ 0.6114 4 0.2 10 0.95 0.67 4.20 13.3 4.90 × 10⁵ 2.55 × 101 2.02 × 101 0.66 1.04 × 10⁷ 0.5914 4 0.2 100 1.04 0.74 3.86 14.5 1.74 × 10⁶ 4.71 × 101 2.13 × 101 0.78 9.60 × 10⁶ 0.5814 4 0.2 1000 1.11 0.79 3.59 15.6 5.46 × 10⁶ 8.42 × 101 3.14 × 101 0.84 9.15 × 10⁶ 0.58
KORENAGA: SCALING OF PLATE TECTONICS B11405B11405
22 of 24
Deschamps, F., P. J. Tackley, and T. Nakagawa (2010), Temperatureand heat flux scalings for isoviscous thermal convection in sphericalgeometry, Geophys. J. Int., 182, 137–154.
Evans, R. L., G. Hirth, K. Baba, D. Forsyth, A. Chave, and R. Mackie(2005), Geophysical evidence from the MELT area for compositionalcontrols on oceanic plates, Nature, 437, 249–252.
Faul, U. H., and I. Jackson (2007), Diffusion creep of dry, melt‐free oliv-ine, J. Geophys. Res., 112, B04204, doi:10.1029/2006JB004586.
Fei, Y., J. Van Orman, J. Li, W. van Westrennen, C. Sanloup, W. Minarik,K. Hirose, T. Komabayashi, M. Walter, and K. Funakoshi (2004), Exper-imentally determined postspinel transformation boundary in Mg2SiO4using MgO as an internal pressure standard and its geophysical implica-tions, J. Geophys. Res., 109, B02305, doi:10.1029/2003JB002652.
Foley, B. J., and T. W. Becker (2009), Generation of plate‐like behaviorand mantle heterogeneity from a spherical, viscoplastic convectionmodel, Geochem. Geophys. Geosyst., 10, Q08001, doi:10.1029/2009GC002378.
Gordon, R. G., and S. Stein (1992), Global tectonics and space geodesy,Science, 256, 333–342.
Gurnis, M., S. Zhong, and J. Toth (2000), On the competing roles of faultreactivation and brittle failure in generating plate tectonics from mantleconvection, in The History and Dynamics of Global Plate Motions, editedby M. A. Richards, R. G. Gordon, and R. D. van der Hilst, pp. 73–94,AGU, Washington, D. C.
Gurnis, M., C. Hall, and L. Lavier (2004), Evolving force balance duringincipient subduction, Geochem. Geophys. Geosyst., 5, Q07001,doi:10.1029/2003GC000681.
Hager, B. H. (1984), Subducted slabs and the geoid: Constraints on mantlerheology and flow, J. Geophys. Res., 89, 6003–6015.
Hager, B. H. (1991), Mantle viscosity: A comparison of models from post-glacial rebound and from the geoid, plate driving forces, and advectedheat flux, in Glacial Isostasy, Sea‐Level and Mantle Rheology, editedby R. Sabadini, K. Lambeck, and E. Boschi, pp. 493–513, Kluwer Acad.,Dordrecht, Netherlands.
Harrison, T. M. (2009), The Hadean crust: Evidence from >4 Ga zircon,Annu. Rev. Earth Planet. Sci., 37, 479–505.
Harrison, T. M., J. Blichert‐Toft, W. Müller, F. Albarede, P. Holden, andS. J. Mojzsis (2005), Heterogeneous Hadean hafnium: Evidence of con-tinental crust at 4.4 to 4.5 Ga, Science, 310, 1947–1950.
Herzberg, C., P. D. Asimow, N. Arndt, Y. Niu, C. M. Lesher, J. G. Fitton,M. J. Cheadle, and A. D. Saunders (2007), Temperatures in ambientmantle and plumes: Constraints from basalts, picrites, and komatiites,Geochem. Geophys. Geosyst., 8, Q02206, doi:10.1029/2006GC001390.
Herzberg, C., K. Condie, and J. Korenaga (2010), Thermal evolution ofthe Earth and its petrological expression, Earth Planet. Sci. Lett., 292,79–88.
Hirth, G., and D. L. Kohlstedt (1996), Water in the oceanic mantle: Impli-cations for rheology, melt extraction, and the evolution of the lithosphere,Earth Planet. Sci. Lett., 144, 93–108.
Howard, L. N. (1966), Convection at high Rayleigh number, in Proceed-ings of the Eleventh International Congress of Applied Mechanics, editedby H. Gortler, pp. 1109–1115, Springer, New York.
Jarvis, G. T., and D. P. McKenzie (1980), Convection in a compressiblefluid with infinite Prandtl number, J. Fluid Mech., 96, 515–583.
Karato, S. (2008), Deformation of Earth Materials: Introduction to theRheology of the Solid Earth, Cambridge Univ. Press, Cambridge, U. K.
Karato, S., and P. Wu (1993), Rheology of the upper mantle: A synthesis,Science, 260, 771–778.
Karato, S., M. S. Paterson, and J. D. Fitzgerald (1986), Rheology of syn-thetic olivine aggregates: Influence of grain size and water, J. Geophys.Res., 91, 8151–8176.
Katsura, T., et al. (2003), Post‐spinel transition in Mg2SiO4 determined byhigh P‐T in situ X‐ray deffractometry, Phys. Earth Planet. Inter., 136,11–24.
Kido, M., and O. Cadek (1997), Inferences of viscosity from the oceanicgeoid: Indication of a low viscosity zone below the 660‐km discontinu-ity, Earth Planet. Sci. Lett., 151, 125–137.
King, S. D. (1995), Models of mantle viscosity, in Global Earth Physics:A Handbook of Physical Constants, pp. 227–236, AGU, Washington,D. C.
Korenaga, J. (2003), Energetics of mantle convection and the fate of fossilheat, Geophys. Res. Lett., 30(8), 1437, doi:10.1029/2003GL016982.
Korenaga, J. (2006), Archean geodynamics and the thermal evolution ofEarth, in Archean Geodynamics and Environments, edited by K. Benn,J.‐C. Mareschal, and K. Condie, pp. 7–32, AGU, Washington, D. C.
Korenaga, J. (2007), Thermal cracking and the deep hydration of oceaniclithosphere: A key to the generation of plate tectonics?, J. Geophys.Res., 112, B05408, doi:10.1029/2006JB004502.
Korenaga, J. (2008a), Urey ratio and the structure and evolution of Earth’smantle, Rev. Geophys., 46, RG2007, doi:10.1029/2007RG000241.
Korenaga, J. (2008b), Plate tectonics, flood basalts, and the evolution ofEarth’s oceans, Terra Nova, 20, 419–439.
Korenaga, J. (2009), Scaling of stagnant‐lid convection with Arrhenius rhe-ology and the effects of mantle melting, Geophys. J. Int., 179, 154–170.
Korenaga, J., and T. H. Jordan (2003), Physics of multiscale convection inEarth’s mantle: Onset of sublithospheric convection, J. Geophys. Res.,108(B7), 2333, doi:10.1029/2002JB001760.
Korenaga, J., and S. Karato (2008), A new analysis of experimental dataon olivine rheology, J. Geophys. Res., 113, B02403, doi:10.1029/2007JB005100.
Korenaga, J., P. B. Kelemen, and W. S. Holbrook (2002), Methods forresolving the origin of large igneous provinces from crustal seismology,J. Geophys. Res., 107(B9), 2178, doi:10.1029/2001JB001030.
Landuyt, W., and D. Bercovici (2009), Variations in planetary convectionvia the effect of climate on damage, Earth Planet. Sci. Lett., 277, 29–37.
Landuyt, W., D. Bercovici, and Y. Ricard (2008), Plate generation andtwo‐phase damage theory in a model of mantle convection, Geophys.J. Int., 174, 1065–1080.
Lenardic, A., F. Nimmo, and L. Moresi (2004), Growth of the hemisphericdichotomy and the cessation of plate tectonics on Mars, J. Geophys. Res.,109, E02003, doi:10.1029/2003JE002172.
McKenzie, D. P., J. M. Roberts, and N. O. Weiss (1974), Convection in theEarth’s mantle: Towards a numerical simulation, J. Fluid Mech., 62,465–538.
Mei, S., and D. L. Kohlstedt (2000a), Influence of water on plastic defor-mation of olivine aggregates: 1. Diffusion creep regime, J. Geophys.Res., 105, 21,457–21,469.
Mei, S., and D. L. Kohlstedt (2000b), Influence of water on plastic defor-mation of olivine aggregates: 2. Dislocation creep regime, J. Geophys.Res., 105, 21,471–21,481.
Mojzsis, S. J., T. M. Harrison, and R. T. Pidgeon (2001), Oxygen‐isotopeevidence from ancient zircons for liquid water at the Earth’s surface4,300 Myr ago, Nature, 409, 178–181.
Moresi, L., and V. Solomatov (1998), Mantle convection with a brittle lith-osphere: Thoughts on the global tectonic styles of the Earth and Venus,Geophys. J. Int., 133, 669–682.
Ogawa, M. (2003), Plate‐like regime of a numerically modeled thermalconvection in a fluid with temperature‐, pressure‐, and stress‐history‐dependent viscosity, J. Geophys. Res., 108(B2), 2067, doi:10.1029/2000JB000069.
O’Neill, C., and A. Lenardic (2007), Geological consequences ofsuper‐sized Earths, Geophys. Res. Lett., 34, L19204, doi:10.1029/2007GL030598.
O’Neill, C., A. Lenardic, L. Moresi, T. H. Torsvik, and C.‐T. Lee (2007),Episodic Precambrian subduction, Earth Planet. Sci. Lett., 262, 552–562.
Oxburgh, E. R., and E. M. Parmentier (1977), Compositional and densitystratification in oceanic lithosphere—Causes and consequences, J. Geol.Soc. London, 133, 343–355.
Richards, M. A., W.‐S. Yang, J. R. Baumgardner, and H.‐P. Bunge (2001),Role of a low‐viscosity zone in stabilizing plate tectonics: Implicationsfor comparative terrestrial planetology, Geochem. Geophys. Geosyst.,2(8), doi:10.1029/2000GC000115.
Ringwood, A. E., and T. Irifune (1988), Nature of the 650‐km seismic dis-continuity—Implications for mantle dynamics and differentiation,Nature, 331, 131–136.
Schubert, G., D. L. Turcotte, and P. Olson (2001), Mantle Convection inthe Earth and Planets, Cambridge Univ. Press, Cambridge, U. K.
Soldati, G., L. Boschi, F. Deschamps, and D. Giardini (2009), Inferringradial models of mantle viscosity from gravity (GRACE) data and anevolutionary algorithm, Phys. Earth Planet. Inter., 176, 19–32.
Solheim, L. P., and W. R. Peltier (1994), Avalanche effects in phase tran-sition modulated thermal convection, J. Geophys. Res., 99, 6997–7018.
Solomatov, V. S. (1996), Can hotter mantle have a larger viscosity?,Geophys. Res. Lett., 23, 937–940.
Solomatov, V. S. (2004), Initiation of subduction by small‐scale convec-tion, J. Geophys. Res., 109, B01412, doi:10.1029/2003JB002628.
Solomatov, V. S., and L.‐N. Moresi (2000), Scaling of time‐dependentstagnant lid convection: Application to small‐scale convection on Earthand other terrestrial planets, J. Geophys. Res., 105, 21,795–21,817.
Stein, C., J. Schmalzl, and U. Hansen (2004), The effect of rheologicalparameters on plate behavior in a self‐consistent model of mantle con-vection, Phys. Earth Planet. Inter., 142, 225–255.
Stern, R. J. (2005), Evidence from ophiolites, blueschists, and ultrahigh‐pressure metamorphic terranes that the modern episode of subductiontectonics began in Neoproterozoic time, Geology, 33, 557–560.
Tackley, P. J. (2000), Self‐consistent generation of tectonic plates in time‐dependent, three‐dimensional mantle convection simulations: 2. Strain
KORENAGA: SCALING OF PLATE TECTONICS B11405B11405
23 of 24

weakening and asthenosphere, Geochem. Geophys. Geosyst., 1(8),doi:10.1029/2000GC000043.
Tackley, P. J., D. J. Stevenson, G. A. Glatzmaier, and G. Schubert (1993),Effects of an endothermic phase transition at 670 km depth in a sphericalmodel of convection in the Earth’s mantle, Nature, 361, 699–704.
van Heck, H. J., and P. J. Tackley (2008), Planforms of self‐consistentlygenerated plates in 3D spherical geometry, Geophys. Res. Lett., 35,L19312, doi:10.1029/2008GL035190.
Van Kranendonk, M. J., R. H. Smithies, A. H. Hickman, and D. Champion(2007), Review: Secular tectonic evolution of Archean continental crust:Interplay between horizontal and vertical processes in the formation ofthe Pilbara Craton, Australia, Terra Nova, 19, 1–38.
Weinstein, S. A., and P. L. Olson (1992), Thermal convection withnon‐Newtonian plates, Geophys. J. Int., 111, 515–530.
Yuen, D. A., D. M. Reuteler, S. Balachandar, V. Steinbach, A. V. Malevsky,and J. J. Smedsmo (1994), Various influences on three‐dimensionalmantle convection with phase transitions, Phys. Earth Planet. Inter., 86,185–203.
Zhong, S., and M. Gurnis (1994), Role of plates and temperature‐dependent viscosity in phase change dynamics, J. Geophys. Res., 99,15,903–15,917.
J. Korenaga, Department of Geology and Geophysics, Yale University,PO Box 208109, New Haven, CT 06520‐8109, USA. ([email protected])
KORENAGA: SCALING OF PLATE TECTONICS B11405B11405
24 of 24