Embed Size (px)
Citation preview
Scaling Up Sanitation: Evidence from an RCT in Indonesia∗
Lisa Cameron
Monash University
Manisha Shah
University of California, Los Angeles and NBER
January 2017
Abstract
This paper evaluates the effectiveness of a widely used sanitation intervention,Community-Led Total Sanitation (CLTS), using a randomized controlled trial. Theintervention was implemented at scale across rural East Java in Indonesia. CLTS in-creases toilet construction, reduces roundworm infestations, and decreases communitytolerance of open defecation. Financial constraints faced by poorer households limittheir ability to improve sanitation. We also examine the program’s scale up processwhich included local governments taking over implementation of CLTS from profes-sional resource agencies. The results suggest that all of the sanitation and healthbenefits accrue from villages where resource agencies implemented the program, whilelocal government implementation produced no discernible benefits.
JEL Codes: O12, I15.Key words: Scale up, sanitation, impact evaluation, development, health
∗We are grateful to the Bill and Melinda Gates Foundation for funding the impact evaluation and theAustralian Research Council for supplementary funding (ARC Discovery Project DP0987011).

1 Introduction
It is estimated that about 1.1 billion people worldwide practice open defecation as a result
of lack of access to sanitation facilities. Preventable diseases caused by open defecation
result in a tremendous disease burden which is shouldered mainly by the poor. Millions of
people contract fecal-borne diseases, most commonly diarrhea and intestinal worms, with an
estimated 1.7 million people dying each year because of unsafe water, hygiene and sanitation
practices (WHO/UNICEF, 2010). In Indonesia 110 million people lack access to proper
sanitation and 63 million of them practice open defecation (WHO/UNICEF, 2012). Two of
the four main causes of death for children under five in Indonesia (diarrhea and typhoid)
are fecal-borne illnesses linked directly to inadequate water supply, sanitation, and hygiene
issues (Ministry of Health, 2002). About 11 percent of Indonesian children have diarrhea in
any two-week period and it has been estimated that more than 33,000 die each year from
diarrhea (Curtis, 2004). By reducing normal food consumption and nutrient absorption,
diarrheal diseases and intestinal worms are also a significant cause of malnutrition, leading
to impaired physical growth (Guerrant et al., 1999), reduced resistance to infection (Baqui
et al., 1993), and long-term gastrointestinal disorders (Schneider, Shiffman and Faigenblum,
1978). Inadequate sanitation is associated not only with adverse health effects, but also
with significant economic losses. Inadequate sanitation and poor hygiene in Indonesia is
estimated to cost approximately US$6.3 billion, or more than 2.4 percent of the country’s
gross domestic product (GDP) (Napitupulu and Hutton, 2008).
Community-Led Total Sanitation (CLTS) is a program now being widely implemented
in more than 60 countries throughout Asia, Africa, Latin America, the Pacific and the
Middle East to address the sanitation burden (Wells and Sijbesma, 2012). CLTS aims to
create demand for sanitation by facilitating graphic, shame-inducing community discussions
of the negative health consequences of existing sanitation practices, rather than through the
more traditional approach of providing sanitation hardware or subsidies. The Water and
Sanitation Program (WSP) of the World Bank is implementing CLTS widely. As part of a
1
learning agenda to address the burdens associated with poor sanitation, the Bill and Melinda
Gates Foundation funded randomized controlled trial (RCT) evaluations of sanitation and
hygiene interventions in seven locations around the world.1 This paper presents the results
of the Indonesian evaluation.
An important component of the intervention is that it sought to create a large-scale
sustainable program and so was evaluated at scale while implemented by local governments
under real-world conditions. The evaluation of the project at scale is in contrast to many
evaluations that are carried out on small scale pilot interventions under more controlled
circumstances. Evaluating smaller scale trials, analogous to efficacy trials in the field of
medical research which provide a test of proof of concept, is a seemingly valid approach as it
attempts to avoid large sums of money being spent on implementing programs at scale that
never have a chance of succeeding. However, scaling up development programs is far from
straight forward and so it is not clear that the results achieved in small scale interventions
will be replicable at scale.
In this paper we first present the results of the randomized evaluation of Community-Led
Total Sanitation. We report the impact of CLTS on outcomes of interest along the causal
chain as improvements in sanitation have the potential to lead to a decrease in parasitic
infestations, a decrease in anemia, and an increase in weight and height for young children.
We rely on objective measures of impact—physical inspection of sanitation facilities, blood
and fecal samples, and physical anthropometric measures. We then conduct an explicit
examination of the scale up process. Resource agencies hired by WSP to train local govern-
ment staff implemented the project in approximately half the treatment communities, while
local government staff implemented it in the other half. Although not officially randomly
allocated across implementing teams, discussions with WSP suggest there was no systematic
process of assignment. In addition, tests of household and village baseline characteristics by
implementer status show no significant differences.
1CLTS was implemented in Indonesia, India and Tanzania, and handwashing interventions were imple-mented in Peru, Vietnam, and Tanzania.
2
We are aware of only a small number of studies that conduct rigorous quantitative eval-
uations of the scaling up process, all of which highlight the many unforeseen difficulties
in scaling up projects and the need to carefully evaluate the scale up process. Bold et al.
(2013) find that an educational intervention increased student test scores when implemented
by an NGO in Western Kenya but failed to increase scores when replicated at scale by the
government. Grossman, Humphreys and Sacramont-Lutz (2015) finds that the high take-up
by marginalized populations of new low-cost technology that allows constituents to engage
with their local politicians could not be replicated when scaled to comprehensively cover half
the country. A more promising outcome is reported in Banerjee et al. (2016a) and Banerjee
et al. (2016b) who build on knowledge gained through previous failed attempts to effectively
scale up the “Teaching at the Right Level” program.2
The evaluation results show that CLTS increases the rate of toilet construction, reduces
the prevalence of roundworm infestation, and decreases community tolerance of open defe-
cation. There is no discernible impact on the other health measures. Allowing for hetero-
geneous treatment effects shows that poorer households were constrained in their ability
to build toilets. In terms of scale up, while significant benefits accrue in resource agency
communities, local government implementation produced no discernible benefits.
The findings demonstrate the potential for CLTS to improve access to sanitation and
improve child health. However, these findings also illustrate the difficulty of scale up, even
when industry best-practice is followed and there is little deviation from the prototype (as
will be documented below). A traditional pilot-style evaluation of the professional imple-
mentation of the program would have led to significant overestimates of the benefits arising
2Other studies that examine large scale interventions point to similar scalability problems. For example,Bouguen et al. (2014) examine the impact of a large scale preschool construction program in Cambodia andfind no positive impacts, and some negative impacts, on early childhood cognition, even though smaller scaleprojects proved promising. Duncan and Magnuson (2013), in a review of the impacts of pre-school programs,note that the results from programs implemented for large and representative populations are generally muchsmaller than those found for small-scale pilot programs. A number of studies have highlighted a tendencyfor RCTs to estimate interventions’ abstract efficacy rather than their effectiveness in practice (Barrett andCarter, 2010). Ravallion (2009) also raises concerns about the usefulness of evaluations of NGO-implementedprograms when deciding whether and how to scale up a program. Vivalt (2015) uses 15,021 results from 647impact evaluations and finds that past results have limited ability to predict results of other interventions.
3
from the government-implemented program. The findings also suggest that measures to ad-
dress the challenges poorer households face in terms of the affordability of sanitation deserve
attention.
The paper proceeds as follows. Section 2 provides details on the intervention and the
experimental design. Section 3 explains the data and the estimation strategy. Section 4
presents the main impact evaluation results, and how they vary by poverty status. The scale
up process and results are discussed in Section 5. Section 6 concludes.
2 Intervention and Study Design
CLTS was initially developed in Bangladesh in 1999 by Kamal Kar in partnership with Wat-
erAid Bangladesh. It is now being widely implemented in more than 60 countries throughout
Asia, Africa, Latin America, the Pacific and the Middle East (Wells and Sijbesma, 2012), hav-
ing been adopted by many international NGOs (for example, Plan International, UNICEF,
Care, World Vision) and the World Bank. Governments are increasingly taking the lead
in scaling up CLTS with many having adopted CLTS as national policy. CLTS is viewed
by many in the water and sanitation sector as the most promising approach to improving
sanitation currently available.
The program is a community-led approach that focuses on creating demand for sanitation,
in contrast to the traditional approach of supplying sanitation hardware (Sah and Negussie,
2009). CLTS facilitators are sent to villages to initiate a community analysis of existing
sanitation practices and a discussion of the negative health consequences of such practices.
The community actively participates in the facilitated meeting and is then left to forge its
own plan to improve village sanitation with only limited follow-up support and monitoring
from the program. These discussions, or “triggerings” are held in public places and are open
to all. They involve a “walk of shame,” during which the facilitator helps people analyze
how fecal contamination spreads from exposed excreta to their living environments and food
and drinking water. A map of the village is drawn on the ground and villagers are asked to
4
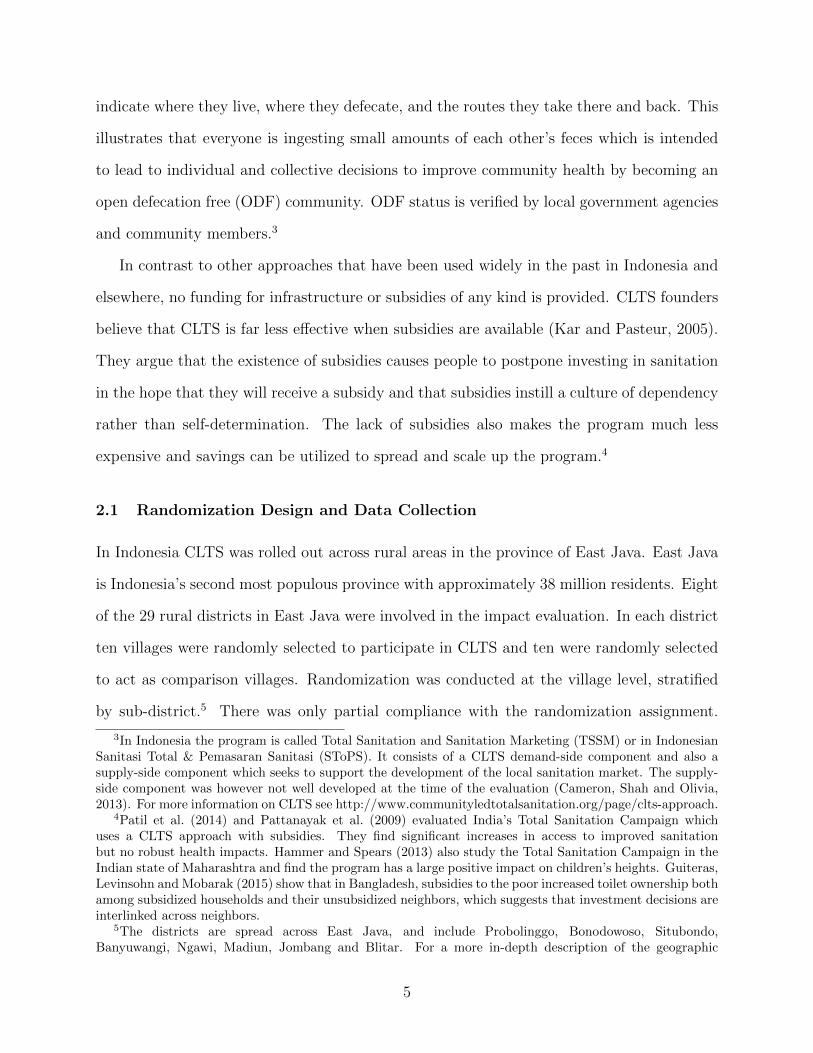
indicate where they live, where they defecate, and the routes they take there and back. This
illustrates that everyone is ingesting small amounts of each other’s feces which is intended
to lead to individual and collective decisions to improve community health by becoming an
open defecation free (ODF) community. ODF status is verified by local government agencies
and community members.3
In contrast to other approaches that have been used widely in the past in Indonesia and
elsewhere, no funding for infrastructure or subsidies of any kind is provided. CLTS founders
believe that CLTS is far less effective when subsidies are available (Kar and Pasteur, 2005).
They argue that the existence of subsidies causes people to postpone investing in sanitation
in the hope that they will receive a subsidy and that subsidies instill a culture of dependency
rather than self-determination. The lack of subsidies also makes the program much less
expensive and savings can be utilized to spread and scale up the program.4
2.1 Randomization Design and Data Collection
In Indonesia CLTS was rolled out across rural areas in the province of East Java. East Java
is Indonesia’s second most populous province with approximately 38 million residents. Eight
of the 29 rural districts in East Java were involved in the impact evaluation. In each district
ten villages were randomly selected to participate in CLTS and ten were randomly selected
to act as comparison villages. Randomization was conducted at the village level, stratified
by sub-district.5 There was only partial compliance with the randomization assignment.
3In Indonesia the program is called Total Sanitation and Sanitation Marketing (TSSM) or in IndonesianSanitasi Total & Pemasaran Sanitasi (SToPS). It consists of a CLTS demand-side component and also asupply-side component which seeks to support the development of the local sanitation market. The supply-side component was however not well developed at the time of the evaluation (Cameron, Shah and Olivia,2013). For more information on CLTS see http://www.communityledtotalsanitation.org/page/clts-approach.
4Patil et al. (2014) and Pattanayak et al. (2009) evaluated India’s Total Sanitation Campaign whichuses a CLTS approach with subsidies. They find significant increases in access to improved sanitationbut no robust health impacts. Hammer and Spears (2013) also study the Total Sanitation Campaign in theIndian state of Maharashtra and find the program has a large positive impact on children’s heights. Guiteras,Levinsohn and Mobarak (2015) show that in Bangladesh, subsidies to the poor increased toilet ownership bothamong subsidized households and their unsubsidized neighbors, which suggests that investment decisions areinterlinked across neighbors.
5The districts are spread across East Java, and include Probolinggo, Bonodowoso, Situbondo,Banyuwangi, Ngawi, Madiun, Jombang and Blitar. For a more in-depth description of the geographic
5
Of the 80 treatment villages, the endline survey data reports that 53 villages (66 percent)
were triggered and 13.8 percent of the control villages were exposed to the program. Non-
compliance was largely a result of district governments changing their target communities
after the randomization plan had been agreed upon. Program administrative data collected
as part of the TSSM program reports a higher percentage of treatment villages (83 percent)
and a smaller percentage of control villages (4%) received the treatment. Below we estimate
the average treatment effect across villages that were assigned to treatment, that is Intention-
to-Treat (ITT) estimates.
Two waves of household data were collected. The baseline survey was conducted just prior
to program implementation in August-September 2008. Within each village, approximately
thirteen households were randomly selected to be surveyed. The endline data collection was
conducted approximately 24 months later, between November 2010 and February 2011. The
surveys collected a wide variety of information on the households including demographic
information, a detailed sanitation module (including physical observations of household san-
itation facilities which are used to verify household reports), and a child health module
(including fecal samples to allow testing for parasitic infestations, blood tests for anemia,
and anthropometric measurements). To enable an examination of impacts on child health,
households with children under the age of two were prioritized, with all surveyed house-
holds required to have at least one child under the age of five at baseline. Community level
demographic data and information on infrastructure were also collected.
Our sample thus consists of approximately 2000 households spread across 160 rural vil-
lages in eight districts.
context, see Cameron and Shah (2015). For further detail on the randomization design and process seeCameron, Shah and Olivia (2013).
6
3 Empirical Strategy
Our empirical approach is to present ITT estimates of program impact on the outcomes of
interest. This is done by estimating equation (1) below:
Yij = α + β1Tj + γXij + δK + εij (1)
where Yij is the outcome measure for household i in village j; Tj is the treatment dummy,
which equals 1 for households in the treatment group, and 0 otherwise; δK is a set of sub-
district (kecamatan) dummy variables which are included because the randomization was
stratified at this level. The sub-district effects also control for any differences in implemen-
tation across the eight districts. In some specifications, we also include a vector of household
and village characteristics (Xij) as additional right-hand side controls. εij is the error term,
and β1 is the main parameter of interest. All specifications cluster the standard errors at
the village level.
The causal average treatment effect is given by β1 if the randomization was effective. We
use the 2008 baseline survey data to compare characteristics of treatment and control groups.
Table 1 compares the means of selected key variables across treatment and control groups.
It shows that the means of the variables are similar in magnitude for the two groups and we
cannot reject that they are equal for most of the variables. For the key outcome variables
(toilet construction, child health outcomes, etc.), balance is achieved. The demographic and
socio-economic characteristics are also similar across treatment and control groups. The
baseline report provides tests of balance on a more extensive set of variables (Cameron and
Shah, 2010).
When examining heterogeneity of impact, we include interactions of Tj with the relevant
variables. For example we will investigate whether treatment has differential impacts by
poverty status of the household. In addition when we investigate the success of scale up we
interact Tj with whether the village was assigned to be treated by a resource agency (RA)
7
or by the local government (LG).
Finally, as we are examining the impact of the program on several outcome measures
across the causal chain, to deal with concerns about over-rejection of the null associated
with multiple inference, we also construct an index of these program outcomes and use it as
a dependent variable following Anderson (2008). This approach is discussed in more detail
below.
4 Empirical Results
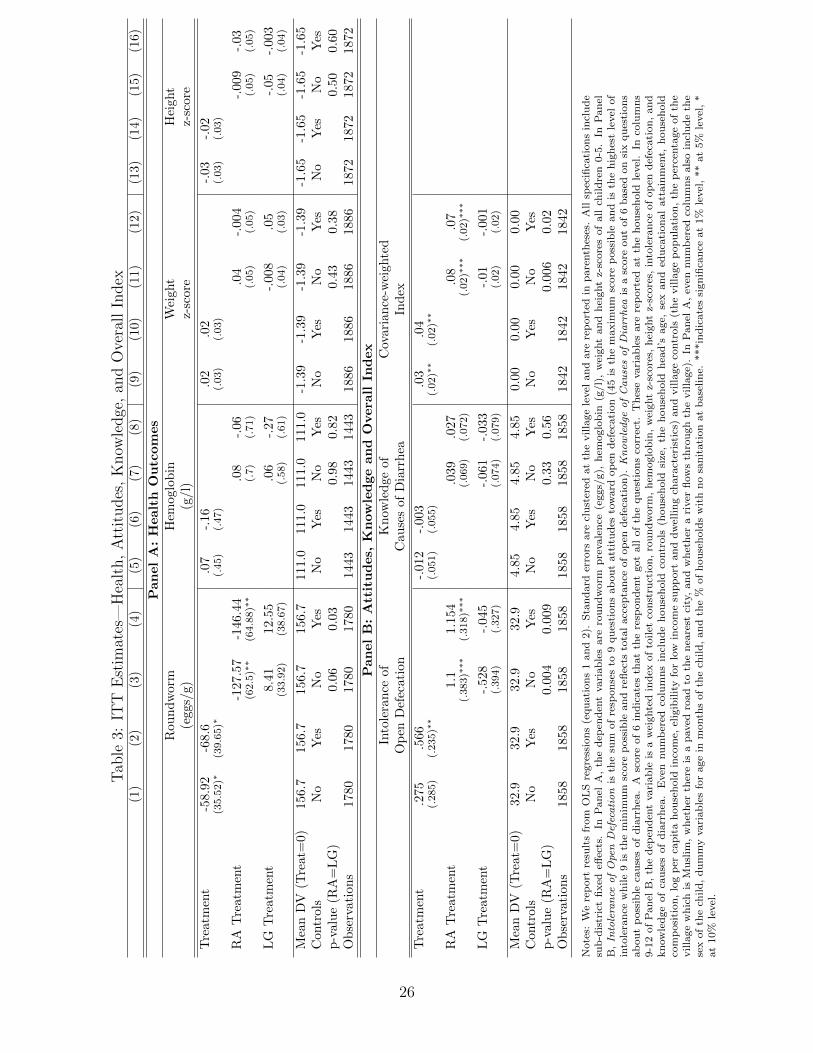
Tables 2 and 3 report the main ITT estimates. In Table 2 we quantify the impact of treatment
on toilet construction. Table 3 examines impacts on child health outcomes, knowledge and
attitudes toward open defecation. Odd-numbered columns report results from regressions
that do not include controls, and the even-numbered columns include additional controls.
We first examine whether CLTS was successful in stimulating demand for sanitation.
Table 2 shows that treatment increases toilet construction by 3.3 percentage points.6 This
coefficient is stable with or without controls (column 1 vs column 2). This is a moderate
sized effect and constitutes a 26 percent increase in toilet construction relative to control
communities.
The ultimate aim of CLTS is to improve sanitation so as to improve community health,
particularly child health. We examine the health impacts along the causal chain to round-
worm infestation, hemoglobin blood concentrations (with low hemoglobin indicating anaemia)
to weight and height.7 The dependent variables in Table 3 are the concentration of round-
worm eggs, concentration of hemoglobin in blood samples, and weight and height z-scores.
While all other regressions are estimated at the household level, the health regressions are
estimated at the child level. The sample of children is those aged 0 to 5 at endline.
6Households report whether they built a toilet. This report is verified at the end of the interview by aninspection of the household’s sanitation facilities.
7The faecal samples were also tested for hookworm and whipworm. Prevalence of these two types of wormwere extremely low in our sample. Less that 1% of the sample had either of these types of worms.
8
Table 3 shows that treatment is associated with an approximately 44% decrease in round-
worm infestation. This is a large decrease with the potential to have significant impacts on
nutritional impacts. However, treatment does not have a significant impact on hemoglobin
concentrations, weight or height z-scores.8 In other work we find that program impacts on
child height operate via village open defecation rates, suggesting that there might be a crit-
ical level of community sanitation that needs to be met before heights increase (see Gertler
et al. (2015); Cameron, Olivia and Shah (2015)).
CLTS is hypothesized to stimulate the demand for sanitation by inducing shame asso-
ciated with lack of access to sanitation. It also imparts information on the negative health
consequences of poor sanitation. Panel B of Table 3 reports the results of tests of an atti-
tudinal index reflecting the degree to which the respondent agrees (disagrees) with negative
(positive) views of open defecation and a score representing the extent of the respondent’s
knowledge about the causes of diarrhea (unclean water, not washing hands, open defecation,
etc.).9 Table 3 shows that there is a decrease in the community’s tolerance of open defeca-
tion in treatment communities relative to control communities (0.2 of a standard deviation).
The program does not impact knowledge of the causes of diarrhea (which may be due to
knowledge being quite high already, with the mean score in control communities being 4.9
out of 6).
To this point we have ignored the problem of multiple inference which leads to over-
8In addition to the biological and anthropometric health indicators, we also collected carer-reporteddiarrhea prevalence in the 7 days prior to the endline survey. Diarrhea prevalence decreased in treatmentvillages by 1 percentage point (26%) relative to control villages. We do not report the diarrhea results inTable 3 as our preference is to rely on objectively measured indicators, rather than those that could reflectreporting bias resulting from exposure to treatment.
9For the knowledge of the causes of diarrhea the caregiver is asked to indicate whether the followingactivities cause diarrhea: drinking dirty water; using dirty latrines; other people defecating in the river;other people defecating in another open space (yard/rice field/beach/etc); not washing hands with water;not washing hands with soap. For the attitudinal index the respondents is asked whether s/he agrees, stronglyagrees, disagrees or strongly disagrees with: Having a toilet of our own will stop my family becoming a targetof gossip; Sanitation facilities in this village improves the community as there is no longer environmentalpollution; Most people that I know defecate in a toilet; It is OK to defecate in the open as our ancestors did;Having our own toilet will reduce the likelihood of family members getting diarrhea; It is OK to defecate inthe river as others do it; It is acceptable for children to defecate in the open; It is acceptable to defecate inthe open if you don’t have a toilet; People who defecate in the open will not be accepted by the community.
9
rejection of the null hypothesis. A way to address this problem is to construct a summary
index of all dependent variables from Tables 2–3 which is then used to conduct a single test
of whether the program has a “general effect” on this set of outcomes. Following Anderson
(2008), we construct the index by orienting all variables so that the positive direction indi-
cates a better outcome; demeaning all re-oriented outcomes and dividing each variable by
the control group standard deviation; and constructing a weighted average of these variables
where the weight is the inverse of the covariance matrix of the transformed outcomes. This
generates an efficient generalized least squares estimator. The procedure uses all available
data and weights outcomes with fewer missing values more heavily (Anderson, 2008). We
then use this variable as the dependent variable. The results presented in Panel B (columns 9
and 10) of Table 3 show that the index of program impact is significantly greater in treatment
communities.
4.1 Results by Poverty Status
To examine the heterogeneity of program impact with poverty status, we generate an indi-
cator to identify poor households. A household is deemed poor if they are in the bottom
quartile of the distribution of non-land assets.10 We include this variable in the regressions
and also its interaction with treatment status. The results in Table 2 column 3-4 indicate
that less poor households are building toilets. None of the toilet construction is coming from
the poorest households. This makes sense given toilet construction requires a significant
outlay of capital. At endline households were asked to estimate how much it would cost to
build their own toilet and also to state the maximum amount they would be willing to pay.
Approximately half of all households that had not built a toilet reported that the amount
they would have to pay is more than the maximum amount they were willing to pay. This
finding is further borne out by the reporting by households that did not build toilets about
the main obstacle to building one. The most frequently reported obstacle (reported by 47%
10Note that most households in our sample are poor in the sense of being below the national poverty line.Here we are defining “poor” to capture the poorer households within our sample.
10
of households) was the high cost of construction (see Figure 1).
Interestingly there is no heterogeneity by poverty status for the health or the attitudinal
and knowledge outcomes examined in Table 3 (results are available upon request). This
heterogeneity only exists only for the initial toilet construction. That poorer households are
no more likely to build toilets in treatment communities than in control communities, and
that the cost of construction is reported as a main obstacle to improving sanitation, calls
into question CLTS’s strategy of not providing subsidies for toilet construction. The reason
for eschewing subsidies is that they create dependence and inhibit household investment in
sanitation. Although these arguments may have some validity, recent empirical evidence
suggests a crucial role for subsidies (Dupas, 2014). In fact, Patil et al. (2014) find much
greater rates of toilet construction in India, which uses an approach similar to CLTS but
paired with subsidies for the poor. Guiteras, Levinsohn and Mobarak (2015) also find the
same in Bangladesh.
5 Scale Up
CLTS forms part of the Indonesian government’s national strategy to improve environmental
and health outcomes in rural areas. Ensuring sustainability of the project by embedding
implementation into district governments was the key element of the scale up strategy. In
terms of scale up methodology, the process was pretty much a textbook example. The World
Health Organization, on the basis of evidence gathered over years of experience in scaling
up public health interventions, recommends several steps for developing a successful scale up
strategy (WHO, 2010). These include identifying, documenting and assessing the nature of
the innovation to be scaled up; increasing the capacity of the implementing agency; assessing
the broader environment in which the project is to be scaled up; supporting the resource
team which will support the scale up; embedding the project within the institutions of the
target country; and documenting the scale up strategy. WSP followed these steps.11
11Owing to it forming part of a Gates Foundation global learning agenda, the program itself and the scaleup strategy are unusually well-documented. For example, see Kar and Chambers (2008); Rosenzweig and
11
The scale up plan involved WSP providing technical assistance to local government offi-
cers during the initial phase. The scale up model used was the widely-employed “Training
of Trainers” (Binswanger and Nguyen, 2004). WSP trained staff at resource agencies (RA)
which had successfully bid for the work and then these resource agencies trained local govern-
ment (LG) officials in CLTS (Rosenzweig and Kopitopoulos, 2010) with the local government
then taking over and scaling up the program to all villages. A portion of this training was
done by demonstration or “learning-by-doing”, as LG officials observed RAs triggering in
some villages.12 This process took place at the time of the RCT. Hence, amongst the treat-
ment villages in our sample, we have 39 villages triggered by the RAs and 41 villages triggered
by the LGs.
Successful scale up rarely involves a mechanical repetition of smaller-scale innovations as
the project normally needs to be adapted to operate at scale and in different environmental
contexts within a country (WHO, 2010). There are thus a number of reasons why program
impacts may differ when conducted at scale:
1. Demographic context. Different characteristics of target populations when operating
at scale.
2. Design effects. Differences in program design that are necessary when operating at
scale.
3. Scale effects. General equilibrium effects associated with the scale of the project.
4. Implementation agent effects. The identity of the implementing agency, which may
Kopitopoulos (2010); Mukherjee (2009, 2011); Pinto (2013); for a global discussion see Chambers (2009).12Two RAs – one responsible for the Eastern districts and another for the Western districts – were con-
tracted to help local governments implement CLTS in at least 30 communities per district (World Bank,2008). The district governments worked in coordination with the sub-district health centers puskesmas andvillage level actors (sanitarians, health cadres etc). The project was governed by a steering committee coor-dinated by the National Ministry of Planning (Bappenas) with a Program Secretariat based in the Ministryof Health supporting program operations. District government Departments of Health Services held primaryresponsibility for implementation. Sub-district coordinating teams led by health centers were involved intraining facilitators and monitoring. Elected village committees also monitored and helped organize trigger-ings. WSP supported the capacity of the local government implementation via the provision of extensivetechnical support. It however did not support local governments financially.
12
alter incentives.13
In our context, many of these effects are not present. For example, as the program was
implemented simultaneously by both RAs and LGs, any general equilibrium effects will be
common to both treatment types. In addition, the geographic and demographic context did
not differ systematically and the project design is identical. Hence, it is a situation where
there is a reasonable likelihood of successful scale up being achieved. The only potential
difference between RA and LG implementation is in the implementation agent effect. That
is the implementing actors and their associated administrative constraints differed, which
could lead to differences in implementation and differential impacts.
5.1 Scale Up Estimation and Results
To examine whether program impacts vary with the identity of the triggering agency we
regress the outcome measures in Tables 2 – 3 on two treatment variables, TRAj which equals
one if the village was assigned to be triggered by an RA and zero otherwise; and TLGj
which equals one if the village was assigned to be triggered by a local government and zero
otherwise. That is, we estimate the following equation:
Yij = α + β1TRAj + β2T
LGj + γXij + δK + εij (2)
The coefficient β1, captures the impact of the village being triggered by the resource agency
and β2 captures the impact of the village being triggered by the local government. A com-
parison of these coefficients reveals the differential impact.
13The categorization here draws from and augments Grossman, Humphreys and Sacramont-Lutz (2015).Grossman, Humphreys and Sacramont-Lutz (2015) attribute the lower uptake in the scaled up version ofthe intervention they study to a design effect—invitations to participate were given over the radio, ratherthan in person during a survey and an implementation agent effect—implementation by parliament andpromoted by politicians which may have altered incentives. The lack of replicability found in the teachingintervention in Bold et al. (2013) is slated to a combination of general equilibrium effects arising from politicaleconomy forces associated with union resistance to the hiring of a large number of contract teachers, andimplementation agent effects. A further related study, Berge et al. (2012), examines implementation agencyeffects but in the context of a small-scale business training program in Tanzania. It finds that the trainingis much more effective when implemented by professional trainers rather than by a local NGO.
13
Program administrative data identifies whether a village was triggered by a RA or by LG.
Villages were not randomized into LG vs RA status, though discussions with WSP suggest
there was nothing systematic about how these decisions were made with the allocations
being largely random. If this is not the case, we could falsely ascribe differences in program
effectiveness to LG versus RA triggering. Tests of whether villages that were triggered
by local governments are otherwise similar to the villages that were triggered by resource
agencies are presented in columns 4-6 of Table 1. Table 1 shows the villages are remarkably
similar. There are are no observable differences in the demographic and socio-economic
composition of the villages. Per capita incomes and household assets also do not differ
significantly, neither does eligibility for Indonesia’s cash transfer program (which reflects
poverty status). Housing is also similar in both cases. There are also no significant differences
in access to sanitation or open defecation rates at baseline. This is important because if local
governments are cherry-picking villages so as to work with communities that are most likely
to become open defecation free then we would expect to see differences in baseline sanitation.
Table 1 shows that there is no difference in the probability of households having a toilet at
baseline. There are similarly no differences in access to piped water and no differences in
baseline sanitation behavior (handwashing).
We also examine differences at the village level which might influence the population’s
interest in sanitation (Table 1, with additional village level characteristics being tested in
Table A1). There is no difference in the accessibility of the villages (having a paved road
to the nearest town and the distance to the city), nor in the percentage of the population
which is Muslim. There is also no difference in whether a river runs through the village.
Defecating in rivers is common practice in Indonesia and CLTS field workers report that mo-
tivating households to build toilets in villages that are on a river is more difficult (Mukherjee,
2011). There is also no difference in the percentage of households in the village that open
defecate at baseline. The only difference we observe is that the RA-assigned villages have a
significantly smaller population than LG-assigned villages. We control for village population
14
in the specifications below. Population is not a significant determinant of the probability of
building a toilet nor of any of the health outcomes. The empirical results reported below are
fairly similar with and without household and village level controls, further suggesting that
differences in characteristics by triggerer identity are unlikely to be driving the results.14
Columns 5-6 in Table 2 present the results for toilet construction. Households in RA
triggered villages are 5.2 percentage points more likely to build a toilet than in control
communities (statistically significant), compared to 1.2 percentage points more likely in LG
triggered villages (and not statistically significant). Although the coefficients on RA trig-
gerings and LG triggerings are different in size, F-tests of the equivalence of the coefficients
are unable to reject the hypothesis of equality (p=0.12). In columns 7-8 we additionally
interact RA/LG with poor/non-poor. The results are interesting in that they suggest that
most of the increase in toilet construction (8.1 percentage points) is occurring in non-poor
households in RA triggered villages. However there is some toilet construction occurring in
non-poor households in LG triggered villages, but a much smaller amount (2-3 percentage
points) and not statistically significant once controls are included. For poorer households,
it does not matter if their village was triggered by the RA or LG—there is no significant
increase in toilet construction.
We now examine whether these differential improvements in sanitation infrastructure by
triggerer identity are also apparent in health improvements. Table 3 shows a very large
(93%) and significant reduction in roundworm concentration in RA villages. In contrast the
coefficient on treatment in LG villages is insignificant (and positive). The difference between
RA and LG villages is significant at the 10% level without controls (5% level with controls).
We continue to find no effect on hemoglobin concentrations, weight and height, regardless of
the implementing agency. We do not further interact LG/RA with poor/non-poor in Table 3
as the treatment impacts did not vary with poverty status, unlike for toilet construction. In
14We also examine differences in social capital and find none. The social capital data were collected ina separate module and are only available for 6 of the 8 districts due to budgetary constraints. The indexreflects participation in community groups, trust amongst community members, perceptions of communitysafety, corruption and crime. For more detail see Cameron, Olivia and Shah (2015).
15
addition, Table 3 shows that RA implementation is significantly associated with a decreased
tolerance of open defecation, whereas LG implementation is not.
Finally, while we find that the coefficient on RA treatment is often significant while
the coefficient on LG treatment is not, we cannot always reject the equality of these two
coefficients. The systematic finding of significance for RA implementation and insignificance
for LG implementation across the range of outcome variables is however strongly suggestive of
RA implementation being superior to that of LG. To test this formally, we regress the index
of program impact on treatment interacted with RA and LG implementation. Columns
11-12 of Table 3 (panel B) show that treatment by RA is associated with a positive and
strongly significant impact on the summary index, whereas the coefficient on treatment by
LG is smaller and not statistically significant. We are able to reject that RA treatment and
LG treatment is equivalent (p-value<0.01 without controls; p-value = 0.02 with controls).
5.2 Mechanisms
CLTS aims to stimulate demand for sanitation via attitudinal change. We saw above that
RAs appear to be more effective at reducing tolerance to open defecation. Table 4 compares
other facets of program implementation across treatment villages triggered by RA and LG—
the way information was disseminated to the community; the extent of program engagement
with village staff; the extent of community participation; the intensity of implementation
and the use of rewards or competitions.
There is no significant difference in the way the RAs and LGs disseminated information
about the project (via TV, radio, print media, notices in shop windows or on village notice
boards). Column 2 indicates however that the RAs are more likely to engage with village
staff. The breakdown in Table A3 in the appendix shows that this is being driven by
greater engagement with village health officers and village office staff. RA implementation
also results in significantly greater community participation (in terms of knowledge of the
program, the triggering event and attendance at the event). Respondents in RA-triggered
16
treatment villages are 9 percentage points more likely to have heard about the program, 10
percentage points more likely to have known about the triggering event, and 6 percentage
points (60%) more likely to have attended the triggering than in LG villages. The intensity
of implementation is also greater in RA villages (driven by facilitators making more visits).15
In the field one hears a lot about the importance of the “quality” of the facilitator. In
order to test whether the RA facilitators are “better” than the LG facilitators, we collected
information from respondents on their perceptions of how charismatic/persuasive the facil-
itators were. Column 4, Panel B in Table A3 shows that there is no significant difference
in the average reported persuasiveness of the facilitators (mean=2.8 on a 4 point scale). In
fact, an examination of various program reports reveals that there was general satisfaction
of WSP staff with the quality of the RA training of the master trainers (Rosenzweig and
Kopitopoulos, 2010).
5.3 Adherence to treatment assignment
Another possible reason for the estimated poor performance of LGs relative to RAs may
reflect less adherence by the local governments to the treatment assignment. Triggerings
were confirmed by village informants as having occurred in only 51% of villages that were
allocated to local governments versus 87% of RA treatment villages.16 Local governments
may hence not be less effective per se, but just appear less effective in our sample as they
did not trigger as many treatment villages as the resource agencies. To investigate this
possibility we estimate two stage least squares regressions where we instrument for whether
a triggering was confirmed to have taken place (by either an RA or LG) with whether the
village was assigned to be a treatment village (Tj), and treatment interacted with whether
the village was assigned to be triggered by an RA (Tj∗assignedRAj ). Triggerings are classified
15Most villages received only one visit from the team, some villages received two visits and a small numberreceived three. RA facilitators made 0.43 (47%) more visits to villages than LG teams (significant at the 5%level).
16Note that absenteeism overall does not seem to be higher amongst local government staff as they alsotriggered more control villages (13 villages or 16% of control villages) so fell only 7 villages short of target,similar to the resource agencies shortfall of 5 villages.
17
as having been confirmed if any respondent to the village questionnaires (the village head,
health cadre and/or another local leader) reports that a triggering occurred. We use two
stage least squares to estimate:
Yij = α + β1triggeredRAj + β2triggered
LGj + γXij + δK + ε1,ij (3)
where we instrument for whether a resource agency triggered a village (triggeredRAj ) or
whether local government triggered a village (triggeredLGj ), as follows:
triggeredRAj = η0 + η1Tj + η2Tj ∗ assignedRA
j + η3Xij + δK + ε2,ij (4)
triggeredLGj = φ0 + φ1Tj + φ2Tj ∗ assignedRAj + φ3Xij + δK + ε3,ij (5)
All other variables are defined as previously. This strategy allows for the differential effect
on the probability of a village actually being triggered depending on whether it was to be
triggered by a resource agency or local government.
Table A2 in the appendix presents the first stage results and shows that the instruments
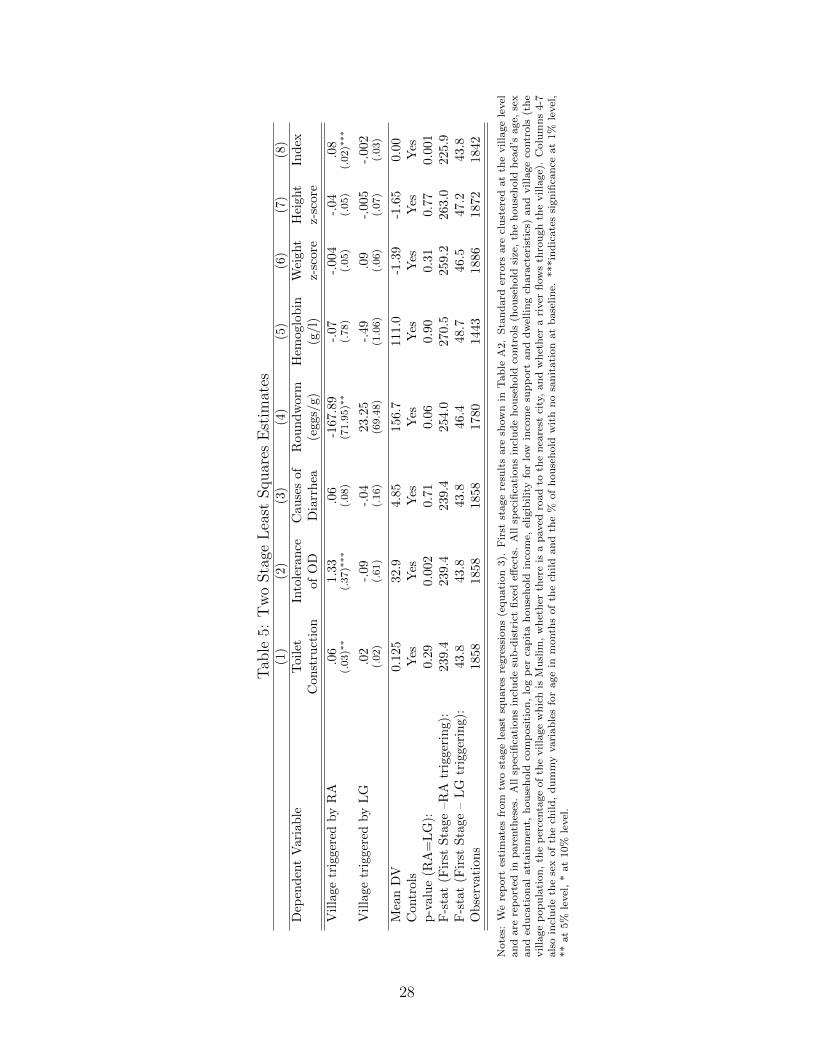
are strongly predictive of both instrumented variables. Table 5 presents the second stage
results. The instrumental variable results are very similar to the previous ITT results. The
results for toilet construction (like the ITT results) show that the RA-triggered villages
are more successful in getting households to build toilets. In RA-triggered villages toilet
construction increases significantly by 6 percentage points, whereas in LG-triggered villages
the increase is not statistically significant. As in Table 2 we cannot reject the hypothesis
that these two coefficients are significantly different from one another. Intolerance of open
defecation increases in RA villages but not in LG villages (p=value<0.01).
Table 5 also reports the two stage least squares results for health impacts. The results for
roundworm infestations confirm the ITT results in Table 3 that there were large and strongly
statistically significant decreases in roundworm infestations in RA-triggered villages, but not
18
in villages triggered by local governments, with the difference being statistically significant at
the 10% level (p=0.06). As was the case for the ITT results, there are no significant impacts
on child hemoglobin levels, weight and height regardless of the implementing agency.
Finally, Column 8 presents the IV results using the index of program outcomes as the
dependent variable. This clearly shows a strongly significant positive effect of the program
when implemented by a RA but no impact (coefficient is very close to zero, negative and
insignificant) when implementation is by LG. We are able to strongly reject that the impact
of RA and LG implementation are equal (p=0.003).
6 Conclusion and Discussion
We find that CLTS significantly increases the rate of toilet construction, reduces worm
infestations, and reduces community tolerance of open defecation. Although the rate of toilet
construction increased by approximately 5 percentage points amongst less poor households,
the poorest households were unable to afford to build toilets. This highlights the potential
for the provision of finance for poor households and/or subsidies for the poor to play an
important role in producing open defecation free communities (and the concomitant health
benefits).
The examination of the scale up process shows that CLTS had relatively large positive
impacts in villages where the program was implemented by RAs. In contrast, with the iden-
tical program design, the same demographic composition of participating households, and
common general equilibrium effects, implementation by local governments failed to produce
any discernible positive impacts.
Understanding what makes for a successful scale up is of prime importance to the de-
velopment sector. Currently there are very few studies that explicitly examine the scale up
process through the lens of a rigorous quantitative evaluation and the studies that exist find
either a lack of replicability at scale or that successful scale up is not straightforward and
involves considerable learning from failure. Studies that examine large scale interventions
19
point to similar scalability problems. However evaluations of scaling up using the regular
array of quantitative tools are not very effective in pinpointing the reasons for a lack of
impact at scale.17 The integration of quantitative evaluation, qualitative research, and high
quality monitoring data is likely to improve researcher and program implementers ability to
identify program impact and understand the causes of success and failure, so as to increase
the likelihood of successful scale up in the future.
17CLTS was subject to both the rigorous causal evaluation and extensive qualitative “action research” butthese were not integrated, and do not allow a conclusive identification of failures in government implementa-tion. In fact, CLTS has on the basis of the qualitative research been put forward as a case study of effectivescale up (Deak, 2008; Perez, 2012). For discussion of data collection efforts to identify implementation andscale up difficulties see Bamberger, Rao and Woolcock (2010); Pritchett, Samji and Hammer (2013); An-drews, Pritchett and Woolcock (2012); Woolcock (2013); Kruk et al. (2016); Brown, Cameron and Wood(2014). Banerjee et al. (2016b) used process data to identify the keys to scale up success.
20
References
Amin, S., A. Rangarajan and E. Borkum. 2011. Improving Sanitation at Scale: Lessons from TSSM Imple-mentation in East Java, Indonesia. Technical Report PR11-59.
Anderson, M. 2008. “Multiple Inference and Gender Differences in the Effects of Early Intervention: AReevaluation of the Abecedarian, Perry Preschool, and Early Training Projects.” Journal of the AmericanStatistical Association 103(4):1481–1495.
Andrews, Matt, Lant Pritchett and Michael Woolcock. 2012. “Capability Traps? The Mechanisms ofPersistent Implementation Failure.” Center for Global Development Working Paper No. 234.
Bamberger, Michael, Vijayendra Rao and Michael Woolcock. 2010. “Using Mixed Methods in Monitoringand Evaluation.” World Bank Policy Research Working Paper No. 5245.
Banerjee, Abhijit, Rukmini Banerji, James Berry, Esther Duflo, Harini Kannan, Shobhini Mukerji, MarcShotland and Michael Walton. 2016a. “From Proof of Concept to Scalable Policies: Challenges andSolutions, with an Application.” MIT Department of Economics Working Paper No. 16-11.
Banerjee, Abhijit, Rukmini Banerji, James Berry, Esther Duflo, Harini Kannan, Shobhini Mukerji, MarcShotland and Michael Walton. 2016b. “Mainstreaming an Effective Intervention: Evidenc from Random-ized Evaluations of “Teaching at the Right Level” in India.” NBER Working Paper No. 22746.
Baqui, A., R. Black, R. Sack, H. Chowdhury, M. Yunus and A. Siddique. 1993. “Malnutrition, cell-mediatedimmune deficiency, and diarrhea: A community based longitudinal study in rural Bangladeshi children.”American Journal of Epidemiology (137):355–365.
Barrett, Christopher and Michael Carter. 2010. “The Power and Pitfalls of Experiments in DevelopmentEconomics: Some Non-random Reflections.” Applied Economic Perspectives and Policy 32(4):515–548.
Berge, Lars, Kjetil Bjorvatn, Kartika Juniwaty and Bertil Tungodden. 2012. “Business Training in Tanzania:From Research-driven Experiment to Local Implementation.” Journal of African Economies pp. 808–827.
Binswanger, Hans P and Tuu-Van Nguyen. 2004. “Scaling up community-driven development for dummies.”World Bank, Washington, DC .
Bold, Tessa, Mwangi Kimenyi, Germano Mwabu, Alice Ng’ang’a and Justin Sandefur. 2013. “Scaling UpWhat Works: Experimental Evidence on External Validity in Kenyan Education.” Center for GlobalDevelopment Working Paper No 321.
Bouguen, Adrien, Deon Filmer, Karen Macours and Sophie Naudeau. 2014. “Preschools and Early ChildhoodDevelopment in a Second Best World: Evidence from a Scaled-up Experiment in Cambodia.” CEPRDiscussion Paper No. 10170.
Brown, Annette, Drew Cameron and Benjamin Wood. 2014. “Quality Evidence for Policymaking: I’ll Believeit when I See the Replications.” Journal of Development Effectiveness 6(3):215–235.
Cameron, Lisa and Manisha Shah. 2010. Scaling Up Rural Sanitation: Findings from the Impact EvaluationBaseline Survey in Indonesia. Technical report Water and Sanitation Program: Technical Paper.
Cameron, Lisa and Manisha Shah. 2015. “Risk-taking in the Wake of Natural Disasters.” The Journal ofHuman Resources 50(2):484–515.
Cameron, Lisa, Manisha Shah and Susan Olivia. 2013. “Impact evaluation of a large-scale rural sanitationproject in Indonesia.” World Bank Policy Research Working Paper No 6360.
21

Cameron, Lisa, Susan Olivia and Manisha Shah. 2015. “Initial Conditions Matter: Social Capital andParticipatory Development.” IZA Discussion Paper No 9563.
Chambers, Robert. 2009. “Going to Scale with Community-Led Total Sanitation: Reflections on Experience,Issues and Ways Forward.” IDS Practice Paper No. 1, Water and Sanitation Program.
Curtis, V. 2004. Handwashing, hygiene and health: Proposals for strengthening WSLIC-2s health componentand a national handwash campaign. Technical report Hygiene Centre, London School of Hygiene andTropical Medicine.
Deak, Andrew. 2008. “Taking Community-Led Total Sanitation to Scale: Movement, Spread and Adapta-tion.” IDS working Paper No. 298.
Duncan, Greg and Katerine Magnuson. 2013. “Investing in Preschool Programs.” Journal of EconomicPerspectives 27(2):109–132.
Dupas, Pascaline. 2014. “Getting essential health products to their end users: Subsidize, but how much?”Science 345(6202):1279–1281.
Gertler, Paul, Manisha Shah, Maria Laura Alzua, Lisa Cameron, Sebastian Martinez and Sumeet Patil.2015. “How Does Health Promotion Work? Evidence From The Dirty Business of Eliminating OpenDefecation.” NBER Working Paper 20997.
Grossman, Guy, Macartan Humphreys and Gabrielle Sacramont-Lutz. 2015. “Information Technology andPolitical Engagement: Mixed Evidence from Uganda.” Columbia University Working Paper.
Guerrant, D., S. Moore, A. Lima, P. Patrick, J. Schorling and R. Guerrant. 1999. “Association of earlychildhood diarrhea and cryptosporidiosis with impaired physical fitness and cognitive function four-sevenyears later in a poor urban community in Northeast Brazil.” American Journal of Tropical Medical andHygiene (61):707–713.
Guiteras, Raymond, James Levinsohn and Ahmed Mushfiq Mobarak. 2015. “Encouraging sanitation invest-ment in the developing world: A cluster-randomized trial.” Science 348(6237):903–906.
Hammer, Jeffrey and Dean Spears. 2013. “Village sanitation and children’s human capital: evidence froma randomized experiment by the Maharashtra government.” World Bank Impact Evaluation Series, no.WPS6580.
Kar, Kamal and Katherine Pasteur. 2005. “Subsidy or self-respect?: Community led total sanitation; anupdate on recent developments.” IDS Working Paper 257.
Kar, Kamal and Robert Chambers. 2008. Handbook on Community-Led Total Sanitation. Sussex, UK:Institute of Development Studies.
Kruk, Margaret, Gavin Yamey, Sonia Angell, Alix Beith, Daniel Cotlear, Frederico Guanais and Lisa Jacobs.2016. “Transforming Global Health by Improving the Science of Scale-Up.” Plos Biology pp. 1–9.
Ministry of Health. 2002. Indonesia Health Profile. Ministry of Health, Jakarta. Technical report Ministryof Health, Jakarta.
Mukherjee, Nila. 2009. “Learning at Scale - Total Sanitation and Sanitation Marketing Project: IndonesianCountry Update.” Field Note, Water and Sanitation Program.
Mukherjee, Nila. 2011. “Factors Associated with Achieving and Sustaining Open Defecation Free Commu-nities: Learning from East Java.” Research Brief, Water and Sanitation Program.
22
Napitupulu, L. and G. Hutton. 2008. Economic Impacts of Sanitation in Indonesia. Technical report Waterand Sanitation Program, World Bank.
Patil, Sumeet, Benjamin Arnold, Alicia Salvatore, Bertha Briceno, Sandipan Ganguly, John Colford andPaul Gertler. 2014. “The Effect of India’s Total Sanitation Campaign on Defecation Behaviors and ChildHealth in Rural Madhya Pradesh: A Cluster Randomized Controlled Trial.” PLosMed (11).
Pattanayak, Subhrendu, Jui-Chen Yang, Katherine Dickinson, Christine Poulos, Sumeet Patil, RanjanMallick, Jonathan Blitstein and Purujit Praharaj. 2009. “Shame or subsidy revisited:social mobiliza-tion for sanitation in Orissa, India.” Bulletin of the World Health Organisation (87):580–587.
Perez, Eduardo. 2012. “What Does it Take to Scale Up Rural Sanitation?” Water and Sanitation ProgramWorking Paper.
Pinto, Rebekah. 2013. “Results, Impacts, and Learning from Improving Sanitation at Scale in East Java,Indonesia.” Field Note, Water and Sanitation Program.
Pritchett, Lant, Salimah Samji and Jeffrey Hammer. 2013. “It’s All About MeE: Using Structured Expe-riential Learning (“e”) to Crawl the Design Space.” Center for Global Development Working Paper No.322.
Ravallion, Martin. 2009. “Evaluation in the Practice of Development.” World Bank Research Observer1(24):29–53.
Rosenzweig, Fred and Derko Kopitopoulos. 2010. Building the Capacity of Local Government to ScaleUp Community-Led Total Sanitation and Sanitation Marketing in Rural Areas. Technical report GlobalScaling Up Sanitation Project, Water and Sanitation Program.
Sah, S. and A. Negussie. 2009. “Community led total sanitation (CLTS): Addressing the challenges of scaleand sustainability in rural Africa.” Desalination 248(15):666–672.
Schneider, R.E., M. Shiffman and J. Faigenblum. 1978. “Potential effect of water on gastrointestinal infectionsprevalent in developing countries.” American Journal of Clinical Nutrition (31):2089–2099.
Vivalt, Eva. 2015. “How Much Can We Generalize from Impact Evaluations? Are They Worthwhile?”Stanford University Working Paper.
Wells, C. D. S. and C. Sijbesma. 2012. “Practical innovations for strengthening Community-Led TotalSanitation: selected experience from Asia.” Development in Practice 22(3):417–426.
WHO. 2010. Nine steps for developing a scaling-up strategy. Technical report.
WHO/UNICEF. 2010. Progress on Sanitation and Drinking Water. Technical report WHO/UNICEF JointMonitoring Programme for Water Supply and Sanitation.
WHO/UNICEF. 2012. Progress on Drinking Water and Sanitation. Technical report WHO/UNICEF JointMonitoring Programme for Water Supply and Sanitation.
Woolcock, Michael. 2013. “Using Case Studies to Explore the External Validity of ‘Complex’ DevelopmentInterventions.” Evaluation 3(19):229–248.
World Bank. 2008. Total Sanitation and Sanitation Marketing Project, Indonesia, Program ImplementationPlan. Technical report.
23
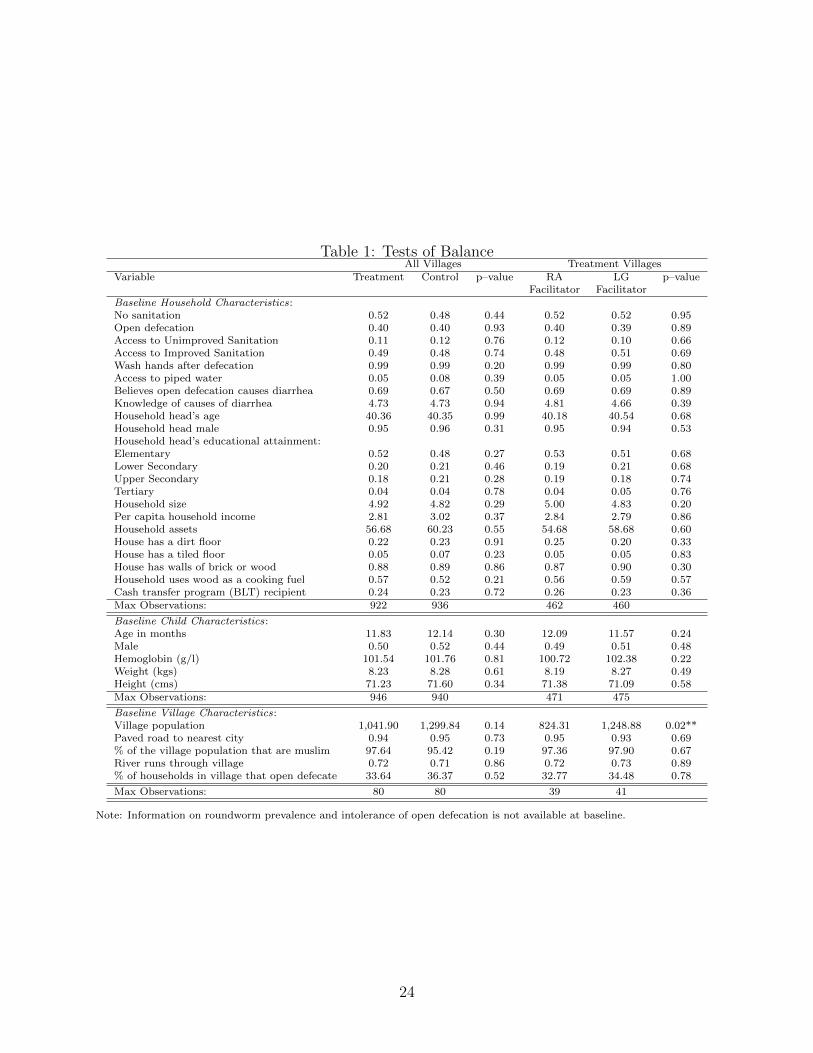
Table 1: Tests of BalanceAll Villages Treatment Villages
Variable Treatment Control p–value RA LG p–valueFacilitator Facilitator
Baseline Household Characteristics:No sanitation 0.52 0.48 0.44 0.52 0.52 0.95Open defecation 0.40 0.40 0.93 0.40 0.39 0.89Access to Unimproved Sanitation 0.11 0.12 0.76 0.12 0.10 0.66Access to Improved Sanitation 0.49 0.48 0.74 0.48 0.51 0.69Wash hands after defecation 0.99 0.99 0.20 0.99 0.99 0.80Access to piped water 0.05 0.08 0.39 0.05 0.05 1.00Believes open defecation causes diarrhea 0.69 0.67 0.50 0.69 0.69 0.89Knowledge of causes of diarrhea 4.73 4.73 0.94 4.81 4.66 0.39Household head’s age 40.36 40.35 0.99 40.18 40.54 0.68Household head male 0.95 0.96 0.31 0.95 0.94 0.53Household head’s educational attainment:Elementary 0.52 0.48 0.27 0.53 0.51 0.68Lower Secondary 0.20 0.21 0.46 0.19 0.21 0.68Upper Secondary 0.18 0.21 0.28 0.19 0.18 0.74Tertiary 0.04 0.04 0.78 0.04 0.05 0.76Household size 4.92 4.82 0.29 5.00 4.83 0.20Per capita household income 2.81 3.02 0.37 2.84 2.79 0.86Household assets 56.68 60.23 0.55 54.68 58.68 0.60House has a dirt floor 0.22 0.23 0.91 0.25 0.20 0.33House has a tiled floor 0.05 0.07 0.23 0.05 0.05 0.83House has walls of brick or wood 0.88 0.89 0.86 0.87 0.90 0.30Household uses wood as a cooking fuel 0.57 0.52 0.21 0.56 0.59 0.57Cash transfer program (BLT) recipient 0.24 0.23 0.72 0.26 0.23 0.36Max Observations: 922 936 462 460
Baseline Child Characteristics:Age in months 11.83 12.14 0.30 12.09 11.57 0.24Male 0.50 0.52 0.44 0.49 0.51 0.48Hemoglobin (g/l) 101.54 101.76 0.81 100.72 102.38 0.22Weight (kgs) 8.23 8.28 0.61 8.19 8.27 0.49Height (cms) 71.23 71.60 0.34 71.38 71.09 0.58Max Observations: 946 940 471 475
Baseline Village Characteristics:Village population 1,041.90 1,299.84 0.14 824.31 1,248.88 0.02**Paved road to nearest city 0.94 0.95 0.73 0.95 0.93 0.69% of the village population that are muslim 97.64 95.42 0.19 97.36 97.90 0.67River runs through village 0.72 0.71 0.86 0.72 0.73 0.89% of households in village that open defecate 33.64 36.37 0.52 32.77 34.48 0.78
Max Observations: 80 80 39 41
Note: Information on roundworm prevalence and intolerance of open defecation is not available at baseline.
24
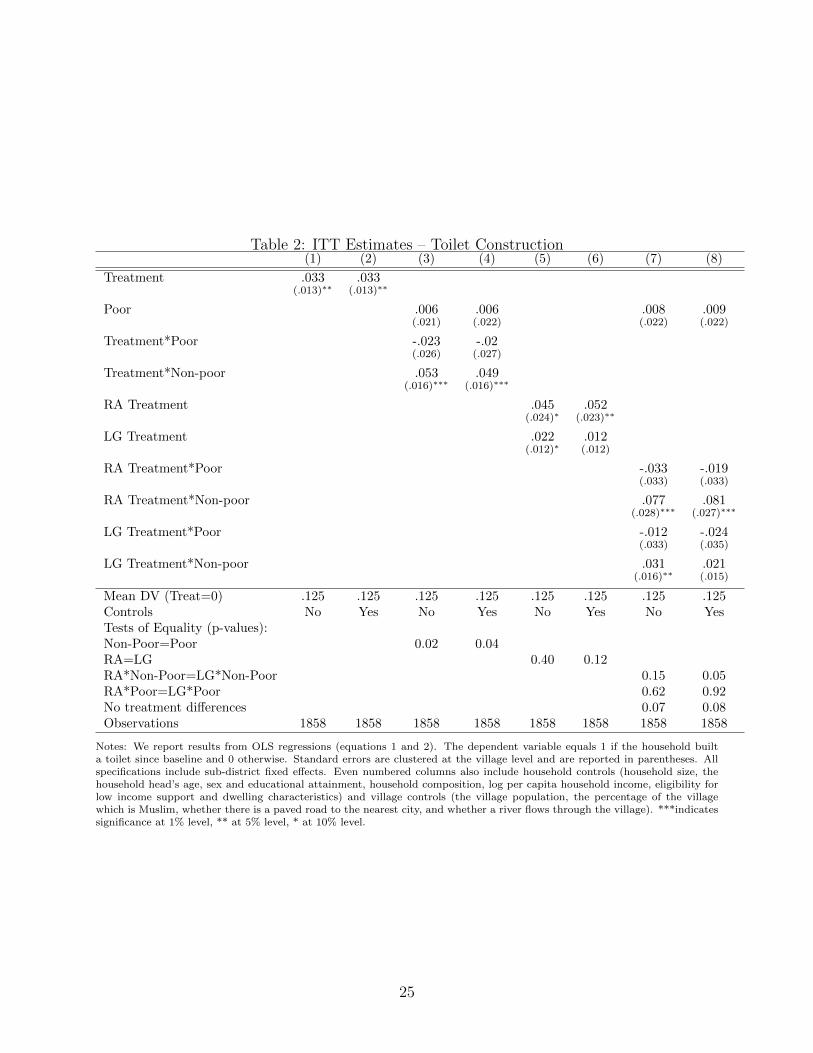
Table 2: ITT Estimates – Toilet Construction(1) (2) (3) (4) (5) (6) (7) (8)
Treatment .033 .033(.013)∗∗ (.013)∗∗
Poor .006 .006 .008 .009(.021) (.022) (.022) (.022)
Treatment*Poor -.023 -.02(.026) (.027)
Treatment*Non-poor .053 .049(.016)∗∗∗ (.016)∗∗∗
RA Treatment .045 .052(.024)∗ (.023)∗∗
LG Treatment .022 .012(.012)∗ (.012)
RA Treatment*Poor -.033 -.019(.033) (.033)
RA Treatment*Non-poor .077 .081(.028)∗∗∗ (.027)∗∗∗
LG Treatment*Poor -.012 -.024(.033) (.035)
LG Treatment*Non-poor .031 .021(.016)∗∗ (.015)
Mean DV (Treat=0) .125 .125 .125 .125 .125 .125 .125 .125Controls No Yes No Yes No Yes No YesTests of Equality (p-values):Non-Poor=Poor 0.02 0.04RA=LG 0.40 0.12RA*Non-Poor=LG*Non-Poor 0.15 0.05RA*Poor=LG*Poor 0.62 0.92No treatment differences 0.07 0.08Observations 1858 1858 1858 1858 1858 1858 1858 1858
Notes: We report results from OLS regressions (equations 1 and 2). The dependent variable equals 1 if the household builta toilet since baseline and 0 otherwise. Standard errors are clustered at the village level and are reported in parentheses. Allspecifications include sub-district fixed effects. Even numbered columns also include household controls (household size, thehousehold head’s age, sex and educational attainment, household composition, log per capita household income, eligibility forlow income support and dwelling characteristics) and village controls (the village population, the percentage of the villagewhich is Muslim, whether there is a paved road to the nearest city, and whether a river flows through the village). ***indicatessignificance at 1% level, ** at 5% level, * at 10% level.
25
Tab
le3:
ITT
Est
imat
es—
Hea
lth,
Att
itudes
,K
now
ledge
,an
dO
vera
llIn
dex
(1)
(2)
(3)
(4)
(5)
(6)
(7)
(8)
(9)
(10)
(11)
(12)
(13)
(14)
(15)
(16)
PanelA:Health
Outcomes
Rou
nd
wor
mH
emoglo
bin
Wei
ght
Hei
ght
(egg
s/g)
(g/l)
z-sc
ore
z-sc
ore
Tre
atm
ent
-58.
92-6
8.6
.07
-.16
.02
.02
-.03
-.02
(35.5
2)∗
(39.6
5)∗
(.45)
(.47)
(.03)
(.03)
(.03)
(.03)
RA
Tre
atm
ent
-127
.57
-146.4
4.0
8-.
06
.04
-.004
-.009
-.03
(62.5
)∗∗
(64.8
8)∗
∗(.
7)
(.71)
(.05)
(.05)
(.05)
(.05)
LG
Tre
atm
ent
8.41
12.5
5.0
6-.
27
-.008
.05
-.05
-.003
(33.9
2)
(38.6
7)
(.58)
(.61)
(.04)
(.03)
(.04)
(.04)
Mea
nD
V(T
reat
=0)
156.
715
6.7
156.7
156.7
111.0
111.0
111.0
111.0
-1.3
9-1
.39
-1.3
9-1
.39
-1.6
5-1
.65
-1.6
5-1
.65
Con
trol
sN
oY
esN
oY
esN
oY
esN
oY
esN
oY
esN
oY
esN
oY
esN
oY
esp
-val
ue
(RA
=L
G)
0.06
0.0
30.9
80.8
20.4
30.3
80.5
00.6
0O
bse
rvat
ion
s17
8017
8017
80
1780
1443
1443
1443
1443
1886
1886
1886
1886
1872
1872
1872
1872
PanelB:Attitudes,
Knowledgeand
Overa
llIn
dex
Into
lera
nce
of
Kn
owle
dge
of
Cov
ari
an
ce-w
eighte
dO
pen
Def
ecati
on
Cau
ses
of
Dia
rrh
eaIn
dex
Tre
atm
ent
.275
.566
-.012
-.003
.03
.04
(.285)
(.235)∗
∗(.
051)
(.055)
(.02)∗
∗(.
02)∗
∗
RA
Tre
atm
ent
1.1
1.1
54
.039
.027
.08
.07
(.383)∗
∗∗(.
318)∗
∗∗(.
069)
(.072)
(.02)∗
∗∗(.
02)∗
∗∗
LG
Tre
atm
ent
-.528
-.045
-.061
-.033
-.01
-.001
(.394)
(.327)
(.074)
(.079)
(.02)
(.02)
Mea
nD
V(T
reat
=0)
32.9
32.9
32.9
32.9
4.8
54.8
54.8
54.8
50.0
00.0
00.0
00.0
0C
ontr
ols
No
Yes
No
Yes
No
Yes
No
Yes
No
Yes
No
Yes
p-v
alu
e(R
A=
LG
)0.
004
0.0
09
0.3
30.5
60.0
06
0.0
2O
bse
rvat
ion
s18
5818
5818
58
1858
1858
1858
1858
1858
1842
1842
1842
1842
Note
s:W
ere
port
resu
lts
from
OL
Sre
gre
ssio
ns
(equ
ati
on
s1
an
d2).
Sta
nd
ard
erro
rsare
clu
ster
edat
the
villa
ge
level
an
dare
rep
ort
edin
pare
nth
eses
.A
llsp
ecifi
cati
on
sin
clu
de
sub
-dis
tric
tfi
xed
effec
ts.
InP
an
elA
,th
ed
epen
den
tvari
ab
les
are
rou
nd
worm
pre
vale
nce
(eggs/
g),
hem
oglo
bin
(g/l)
,w
eight
an
dh
eight
z-sc
ore
sof
all
child
ren
0-5
.In
Pan
elB
,In
tolerance
ofOpenDefecation
isth
esu
mof
resp
on
ses
to9
qu
esti
on
sab
ou
tatt
itu
des
tow
ard
op
end
efec
ati
on
(45
isth
em
axim
um
score
poss
ible
an
dis
the
hig
hes
tle
vel
of
into
lera
nce
wh
ile
9is
the
min
imu
msc
ore
poss
ible
an
dre
flec
tsto
tal
acc
epta
nce
of
op
end
efec
ati
on
).Knowledge
ofCausesofDiarrhea
isa
score
ou
tof
6b
ase
don
six
qu
esti
on
sab
ou
tp
oss
ible
cau
ses
of
dia
rrh
ea.
Asc
ore
of
6in
dic
ate
sth
at
the
resp
on
den
tgot
all
of
the
qu
esti
on
sco
rrec
t.T
hes
evari
ab
les
are
rep
ort
edat
the
hou
seh
old
level
.In
colu
mn
s9-1
2of
Pan
elB
,th
ed
epen
den
tvari
ab
leis
aw
eighte
din
dex
of
toilet
con
stru
ctio
n,
rou
nd
worm
,h
emoglo
bin
,w
eight
z-sc
ore
s,h
eight
z-sc
ore
s,in
tole
ran
ceof
op
end
efec
ati
on
,an
dkn
ow
led
ge
of
cau
ses
of
dia
rrh
ea.
Even
nu
mb
ered
colu
mn
sin
clu
de
hou
seh
old
contr
ols
(hou
seh
old
size
,th
eh
ou
seh
old
hea
d’s
age,
sex
an
ded
uca
tional
att
ain
men
t,h
ou
seh
old
com
posi
tion
,lo
gp
erca
pit
ah
ou
seh
old
inco
me,
elig
ibilit
yfo
rlo
win
com
esu
pp
ort
an
dd
wel
lin
gch
ara
cter
isti
cs)
an
dvilla
ge
contr
ols
(th
evilla
ge
pop
ula
tion
,th
ep
erce
nta
ge
of
the
villa
ge
wh
ich
isM
usl
im,
wh
eth
erth
ere
isa
paved
road
toth
en
eare
stci
ty,
an
dw
het
her
ari
ver
flow
sth
rou
gh
the
villa
ge)
.In
Pan
elA
,ev
ennu
mb
ered
colu
mn
sals
oin
clu
de
the
sex
of
the
child
,d
um
my
vari
ab
les
for
age
inm
onth
sof
the
child
,an
dth
e%
of
hou
seh
old
sw
ith
no
san
itati
on
at
base
lin
e.***in
dic
ate
ssi
gn
ifica
nce
at
1%
level
,**
at
5%
level
,*
at
10%
level
.
26
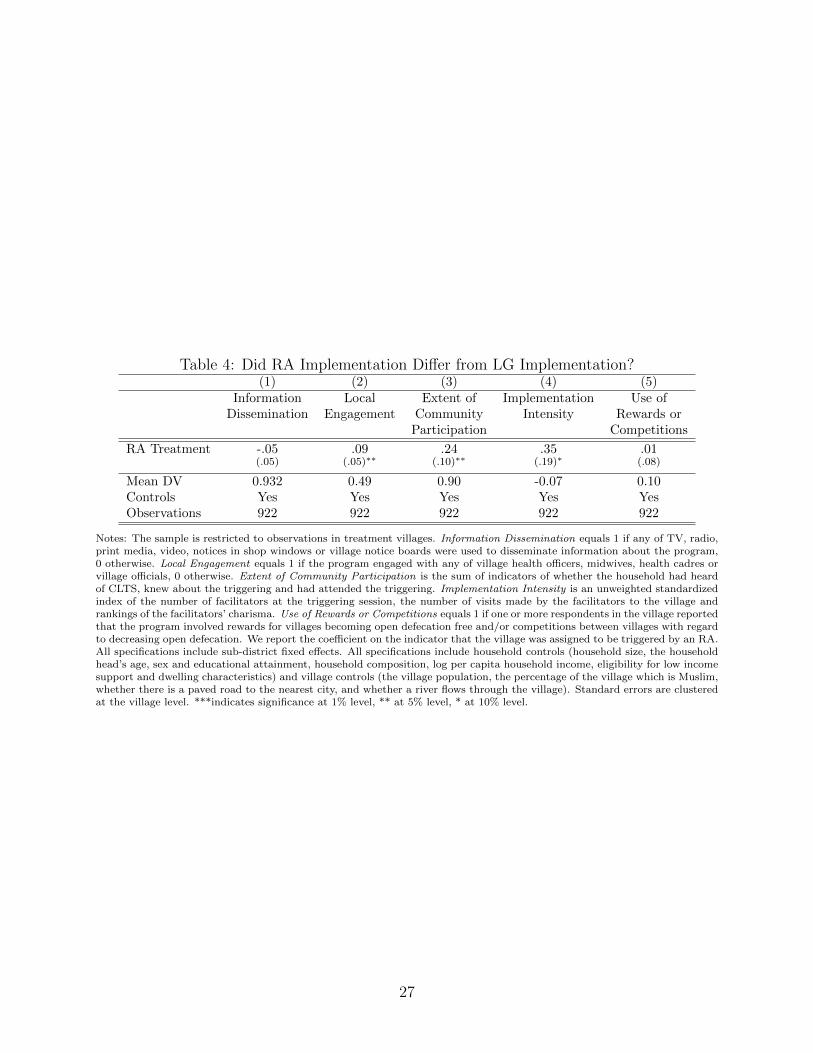
Table 4: Did RA Implementation Differ from LG Implementation?(1) (2) (3) (4) (5)
Information Local Extent of Implementation Use ofDissemination Engagement Community Intensity Rewards or
Participation Competitions
RA Treatment -.05 .09 .24 .35 .01(.05) (.05)∗∗ (.10)∗∗ (.19)∗ (.08)
Mean DV 0.932 0.49 0.90 -0.07 0.10Controls Yes Yes Yes Yes YesObservations 922 922 922 922 922
Notes: The sample is restricted to observations in treatment villages. Information Dissemination equals 1 if any of TV, radio,print media, video, notices in shop windows or village notice boards were used to disseminate information about the program,0 otherwise. Local Engagement equals 1 if the program engaged with any of village health officers, midwives, health cadres orvillage officials, 0 otherwise. Extent of Community Participation is the sum of indicators of whether the household had heardof CLTS, knew about the triggering and had attended the triggering. Implementation Intensity is an unweighted standardizedindex of the number of facilitators at the triggering session, the number of visits made by the facilitators to the village andrankings of the facilitators’ charisma. Use of Rewards or Competitions equals 1 if one or more respondents in the village reportedthat the program involved rewards for villages becoming open defecation free and/or competitions between villages with regardto decreasing open defecation. We report the coefficient on the indicator that the village was assigned to be triggered by an RA.All specifications include sub-district fixed effects. All specifications include household controls (household size, the householdhead’s age, sex and educational attainment, household composition, log per capita household income, eligibility for low incomesupport and dwelling characteristics) and village controls (the village population, the percentage of the village which is Muslim,whether there is a paved road to the nearest city, and whether a river flows through the village). Standard errors are clusteredat the village level. ***indicates significance at 1% level, ** at 5% level, * at 10% level.
27
Tab
le5:
Tw
oSta
geL
east
Squar
esE
stim
ates
(1)
(2)
(3)
(4)
(5)
(6)
(7)
(8)
Dep
end
ent
Var
iab
leT
oil
etIn
tole
ran
ceC
au
ses
of
Rou
nd
worm
Hem
oglo
bin
Wei
ght
Hei
ght
Ind
exC
on
stru
ctio
nof
OD
Dia
rrh
ea(e
ggs/
g)
(g/l)
z-sc
ore
z-sc
ore
Vil
lage
trig
gere
dby
RA
.06
1.3
3.0
6-1
67.8
9-.
07
-.004
-.04
.08
(.03)∗
∗(.
37)∗
∗∗(.
08)
(71.9
5)∗
∗(.
78)
(.05)
(.05)
(.02)∗
∗∗
Vil
lage
trig
gere
dby
LG
.02
-.09
-.04
23.2
5-.
49
.09
-.005
-.002
(.02)
(.61)
(.16)
(69.4
8)
(1.0
6)
(.06)
(.07)
(.03)
Mea
nD
V0.1
25
32.9
4.8
5156.7
111.0
-1.3
9-1
.65
0.0
0C
ontr
ols
Yes
Yes
Yes
Yes
Yes
Yes
Yes
Yes
p-v
alu
e(R
A=
LG
):0.2
90.0
02
0.7
10.0
60.9
00.3
10.7
70.0
01
F-s
tat
(Fir
stS
tage
–RA
trig
geri
ng)
:239.4
239.4
239.4
254.0
270.5
259.2
263.0
225.9
F-s
tat
(Fir
stS
tage
–L
Gtr
igge
rin
g):
43.8
43.8
43.8
46.4
48.7
46.5
47.2
43.8
Ob
serv
atio
ns
1858
1858
1858
1780
1443
1886
1872
1842
Note
s:W
ere
port
esti
mate
sfr
om
two
stage
least
squ
are
sre
gre
ssio
ns
(equ
ati
on
3).
Fir
stst
age
resu
lts
are
show
nin
Tab
leA
2.
Sta
nd
ard
erro
rsare
clu
ster
edat
the
villa
ge
level
an
dare
rep
ort
edin
pare
nth
eses
.A
llsp
ecifi
cati
on
sin
clu
de
sub
-dis
tric
tfi
xed
effec
ts.
All
spec
ifica
tion
sin
clu
de
hou
seh
old
contr
ols
(hou
seh
old
size
,th
eh
ou
seh
old
hea
d’s
age,
sex
an
ded
uca
tion
al
att
ain
men
t,h
ou
seh
old
com
posi
tion
,lo
gp
erca
pit
ah
ou
seh
old
inco
me,
elig
ibilit
yfo
rlo
win
com
esu
pp
ort
an
dd
wel
lin
gch
ara
cter
isti
cs)
an
dvilla
ge
contr
ols
(th
evilla
ge
popu
lati
on
,th
ep
erce
nta
ge
of
the
villa
ge
wh
ich
isM
usl
im,
wh
eth
erth
ere
isa
paved
road
toth
en
eare
stci
ty,
an
dw
het
her
ari
ver
flow
sth
rou
gh
the
villa
ge)
.C
olu
mn
s4-7
als
oin
clu
de
the
sex
of
the
child
,d
um
my
vari
ab
les
for
age
inm
onth
sof
the
child
an
dth
e%
of
hou
seh
old
wit
hn
osa
nit
ati
on
at
base
lin
e.***in
dic
ate
ssi
gn
ifica
nce
at
1%
level
,**
at
5%
level
,*
at
10%
level
.
28
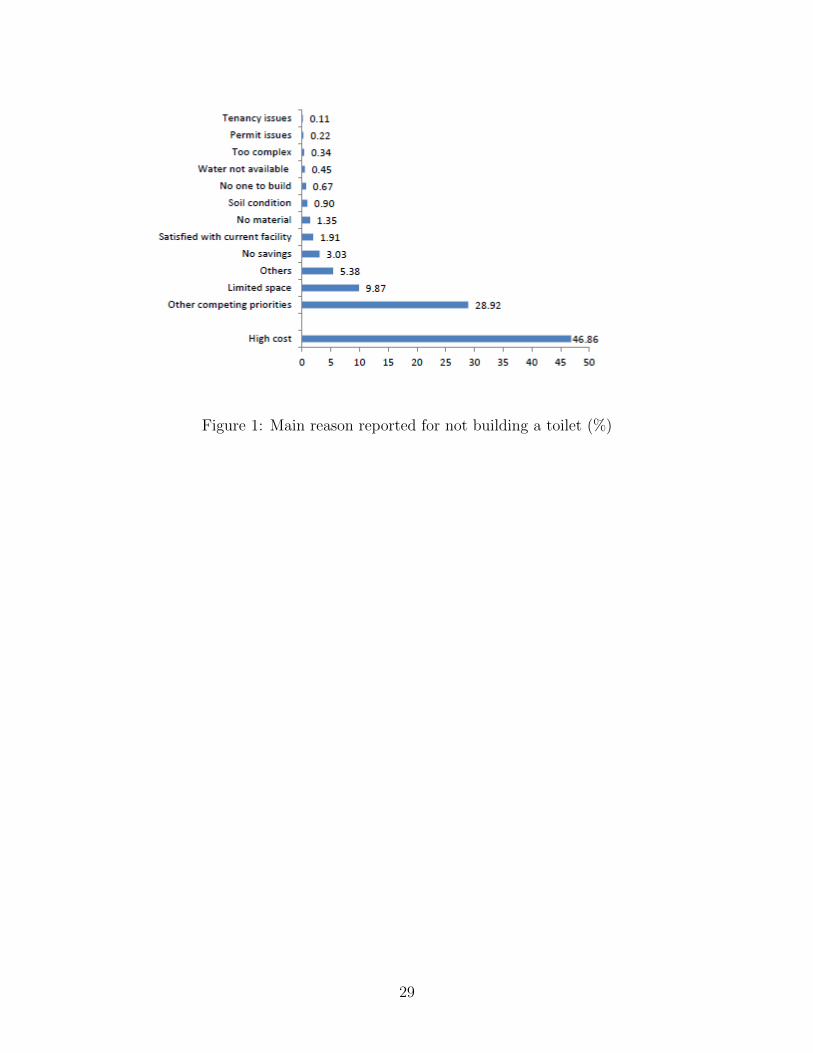
Figure 1: Main reason reported for not building a toilet (%)
29

A Appendix Tables
30
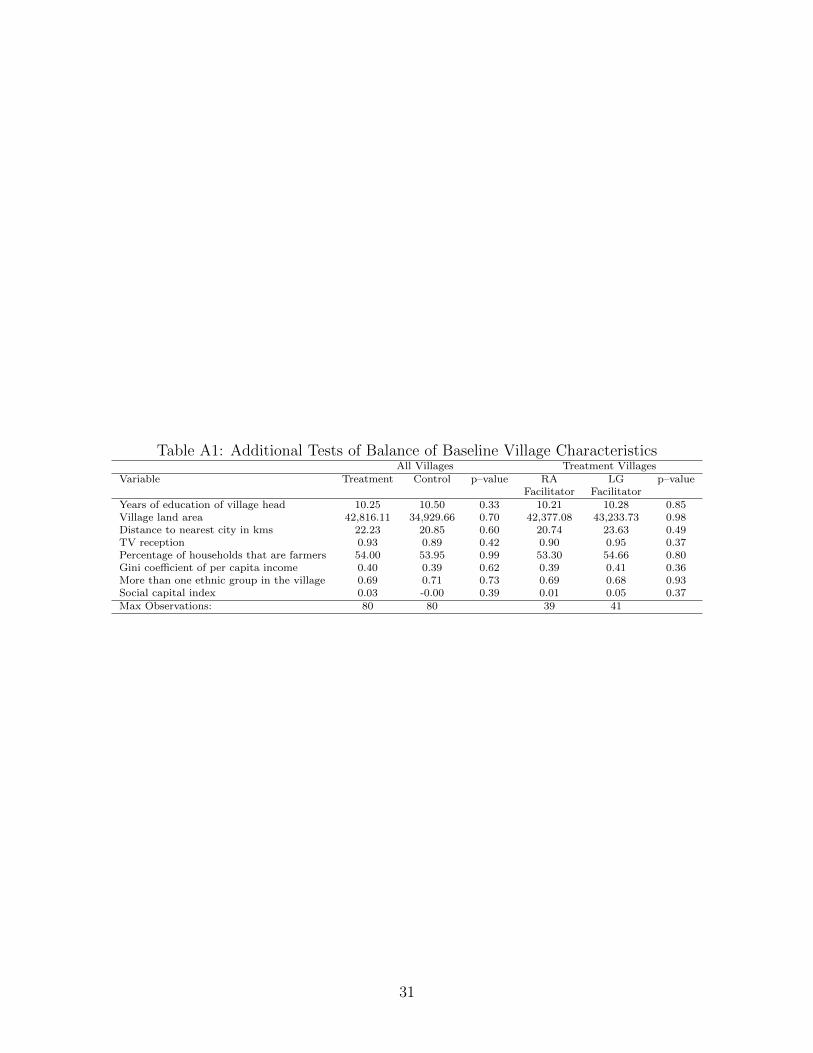
Table A1: Additional Tests of Balance of Baseline Village CharacteristicsAll Villages Treatment Villages
Variable Treatment Control p–value RA LG p–valueFacilitator Facilitator
Years of education of village head 10.25 10.50 0.33 10.21 10.28 0.85Village land area 42,816.11 34,929.66 0.70 42,377.08 43,233.73 0.98Distance to nearest city in kms 22.23 20.85 0.60 20.74 23.63 0.49TV reception 0.93 0.89 0.42 0.90 0.95 0.37Percentage of households that are farmers 54.00 53.95 0.99 53.30 54.66 0.80Gini coefficient of per capita income 0.40 0.39 0.62 0.39 0.41 0.36More than one ethnic group in the village 0.69 0.71 0.73 0.69 0.68 0.93Social capital index 0.03 -0.00 0.39 0.01 0.05 0.37Max Observations: 80 80 39 41
31
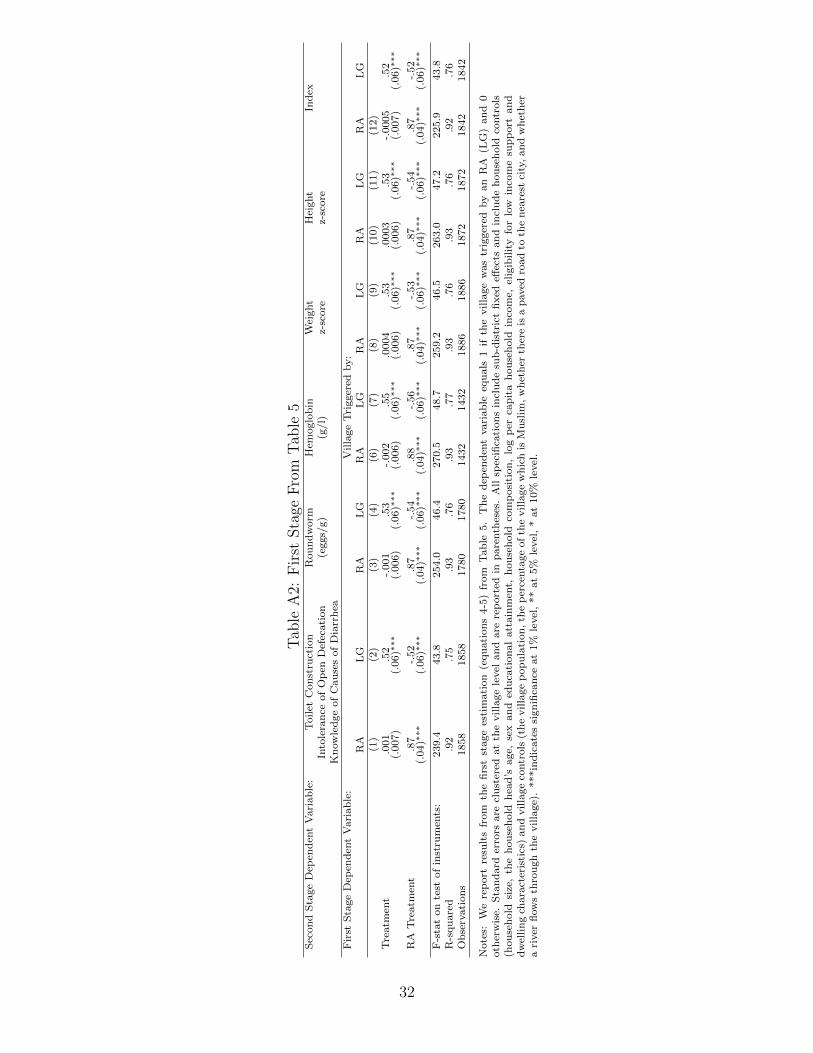
Tab
leA
2:F
irst
Sta
geF
rom
Tab
le5
Sec
on
dS
tage
Dep
end
ent
Vari
ab
le:
Toilet
Con
stru
ctio
nR
ou
nd
worm
Hem
oglo
bin
Wei
ght
Hei
ght
Ind
exIn
tole
ran
ceof
Op
enD
efec
ati
on
(eggs/
g)
(g/l)
z-sc
ore
z-sc
ore
Kn
ow
led
ge
of
Cau
ses
of
Dia
rrh
eaF
irst
Sta
ge
Dep
end
ent
Vari
ab
le:
Villa
ge
Tri
gger
edby:
RA
LG
RA
LG
RA
LG
RA
LG
RA
LG
RA
LG
(1)
(2)
(3)
(4)
(6)
(7)
(8)
(9)
(10)
(11)
(12)
Tre
atm
ent
.001
.52
-.001
.53
-.002
.55
.0004
.53
.0003
.53
-.0005
.52
(.007)
(.06)∗
∗∗(.
006)
(.06)∗
∗∗(.
006)
(.06)∗
∗∗(.
006)
(.06)∗
∗∗(.
006)
(.06)∗
∗∗(.
007)
(.06)∗
∗∗
RA
Tre
atm
ent
.87
-.52
.87
-.54
.88
-.56
.87
-.53
.87
-.54
.87
-.52
(.04)∗
∗∗(.
06)∗
∗∗(.
04)∗
∗∗(.
06)∗
∗∗(.
04)∗
∗∗(.
06)∗
∗∗(.
04)∗
∗∗(.
06)∗
∗∗(.
04)∗
∗∗(.
06)∗
∗∗(.
04)∗
∗∗(.
06)∗
∗∗
F-s
tat
on
test
of
inst
rum
ents
:239.4
43.8
254.0
46.4
270.5
48.7
259.2
46.5
263.0
47.2
225.9
43.8
R-s
qu
are
d.9
2.7
5.9
3.7
6.9
3.7
7.9
3.7
6.9
3.7
6.9
2.7
6O
bse
rvati
on
s1858
1858
1780
1780
1432
1432
1886
1886
1872
1872
1842
1842
Note
s:W
ere
port
resu
lts
from
the
firs
tst
age
esti
mati
on
(equ
ati
on
s4-5
)fr
om
Tab
le5.
Th
ed
epen
den
tvari
ab
leeq
uals
1if
the
vil
lage
was
trig
ger
edby
an
RA
(LG
)an
d0
oth
erw
ise.
Sta
nd
ard
erro
rsare
clu
ster
edat
the
villa
ge
level
an
dare
rep
ort
edin
pare
nth
eses
.A
llsp
ecifi
cati
on
sin
clu
de
sub
-dis
tric
tfi
xed
effec
tsan
din
clu
de
hou
seh
old
contr
ols
(hou
seh
old
size
,th
eh
ou
seh
old
hea
d’s
age,
sex
an
ded
uca
tion
al
att
ain
men
t,h
ou
seh
old
com
posi
tion
,lo
gp
erca
pit
ah
ou
seh
old
inco
me,
elig
ibilit
yfo
rlo
win
com
esu
pp
ort
an
dd
wel
lin
gch
ara
cter
isti
cs)
an
dvilla
ge
contr
ols
(th
evilla
ge
popu
lati
on
,th
ep
erce
nta
ge
of
the
villa
ge
wh
ich
isM
usl
im,
wh
eth
erth
ere
isa
paved
road
toth
en
eare
stci
ty,
an
dw
het
her
ari
ver
flow
sth
rou
gh
the
villa
ge)
.***in
dic
ate
ssi
gn
ifica
nce
at
1%
level
,**
at
5%
level
,*
at
10%
level
.
32
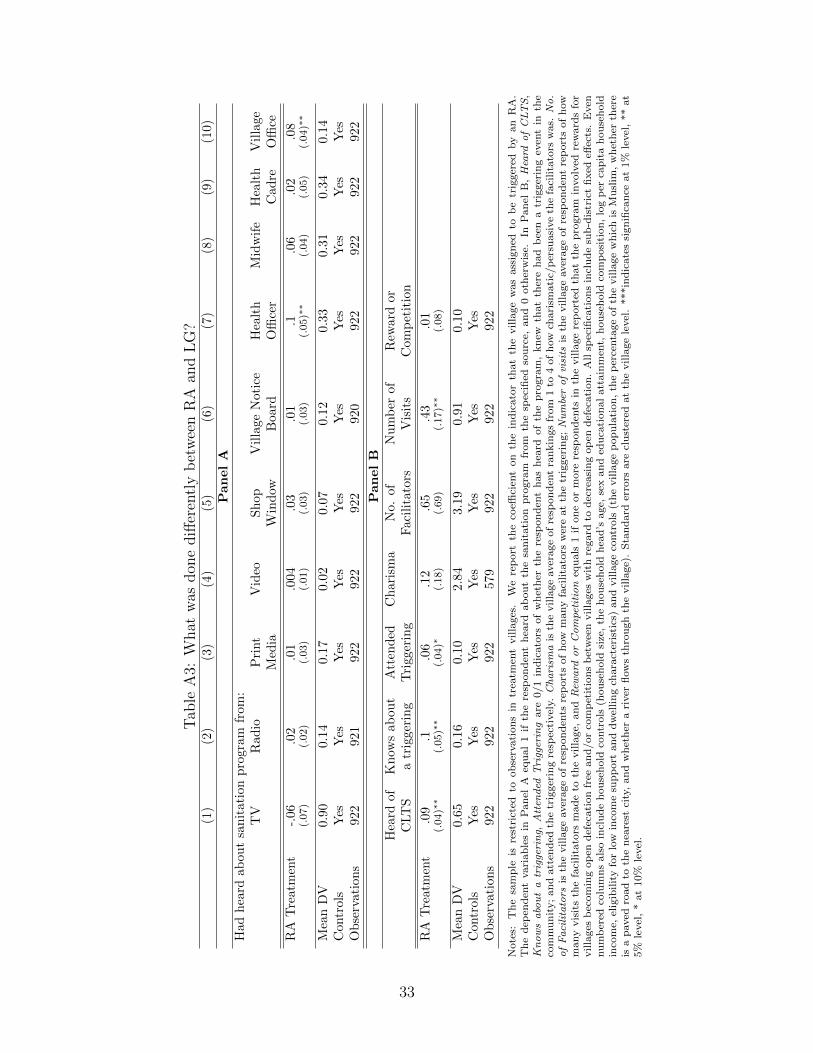
Tab
leA
3:W
hat
was
don
ediff
eren
tly
bet
wee
nR
Aan
dL
G?
(1)
(2)
(3)
(4)
(5)
(6)
(7)
(8)
(9)
(10)
PanelA
Had
hea
rdab
out
san
itat
ion
pro
gram
from
:T
VR
adio
Pri
nt
Vid
eoS
hop
Vil
lage
Noti
ceH
ealt
hM
idw
ife
Hea
lth
Vil
lage
Med
iaW
ind
owB
oard
Offi
cer
Cad
reO
ffice
RA
Tre
atm
ent
-.06
.02
.01
.004
.03
.01
.1.0
6.0
2.0
8(.
07)
(.02)
(.03)
(.01)
(.03)
(.03)
(.05)∗
∗(.
04)
(.05)
(.04)∗
∗
Mea
nD
V0.
900.
140.1
70.0
20.0
70.1
20.3
30.3
10.3
40.1
4C
ontr
ols
Yes
Yes
Yes
Yes
Yes
Yes
Yes
Yes
Yes
Yes
Ob
serv
atio
ns
922
921
922
922
922
920
922
922
922
922
PanelB
Hea
rdof
Kn
ows
abou
tA
tten
ded
Ch
ari
sma
No.
of
Nu
mb
erof
Rew
ard
or
CLT
Sa
trig
geri
ng
Tri
gger
ing
Faci
lita
tors
Vis
its
Com
pet
itio
n
RA
Tre
atm
ent
.09
.1.0
6.1
2.6
5.4
3.0
1(.
04)∗
∗(.
05)∗
∗(.
04)∗
(.18)
(.69)
(.17)∗
∗(.
08)
Mea
nD
V0.
650.
160.1
02.8
43.1
90.9
10.1
0C
ontr
ols
Yes
Yes
Yes
Yes
Yes
Yes
Yes
Ob
serv
atio
ns
922
922
922
579
922
922
922
Note
s:T
he
sam
ple
isre
stri
cted
toob
serv
ati
on
sin
trea
tmen
tvilla
ges
.W
ere
port
the
coeffi
cien
ton
the
ind
icato
rth
at
the
villa
ge
was
ass
ign
edto
be
trig
ger
edby
an
RA
.T
he
dep
end
ent
vari
ab
les
inP
an
elA
equ
al
1if
the
resp
on
den
th
eard
ab
ou
tth
esa
nit
ati
on
pro
gra
mfr
om
the
spec
ified
sou
rce,
an
d0
oth
erw
ise.
InP
an
elB
,Heard
ofCLTS
,Knowsaboutatriggering,
Atten
ded
Triggering
are
0/1
ind
icato
rsof
wh
eth
erth
ere
spon
den
th
as
hea
rdof
the
pro
gra
m,
kn
ewth
at
ther
eh
ad
bee
na
trig
ger
ing
even
tin
the
com
mu
nit
y;
an
datt
end
edth
etr
igger
ing
resp
ecti
vel
y.Charism
ais
the
villa
ge
aver
age
of
resp
on
den
tra
nkin
gs
from
1to
4of
how
chari
smati
c/p
ersu
asi
ve
the
faci
lita
tors
was.
No.
ofFacilitators
isth
evilla
ge
aver
age
of
resp
on
den
tsre
port
sof
how
many
faci
lita
tors
wer
eat
the
trig
ger
ing;Numberofvisits
isth
evilla
ge
aver
age
of
resp
on
den
tre
port
sof
how
many
vis
its
the
faci
lita
tors
mad
eto
the
villa
ge,
an
dRew
ard
orCompetition
equ
als
1if
on
eor
more
resp
on
den
tsin
the
villa
ge
rep
ort
edth
at
the
pro
gra
min
volv
edre
ward
sfo
rvilla
ges
bec
om
ing
op
end
efec
ati
on
free
an
d/or
com
pet
itio
ns
bet
wee
nvilla
ges
wit
hre
gard
tod
ecre
asi
ng
op
end
efec
ati
on
.A
llsp
ecifi
cati
on
sin
clu
de
sub
-dis
tric
tfi
xed
effec
ts.
Even
nu
mb
ered
colu
mn
sals
oin
clu
de
hou
seh
old
contr
ols
(hou
seh
old
size
,th
eh
ou
seh
old
hea
d’s
age,
sex
an
ded
uca
tion
al
att
ain
men
t,h
ou
seh
old
com
posi
tion
,lo
gp
erca
pit
ah
ou
seh
old
inco
me,
elig
ibil
ity
for
low
inco
me
sup
port
an
dd
wel
lin
gch
ara
cter
isti
cs)
an
dvilla
ge
contr
ols
(th
evilla
ge
pop
ula
tion
,th
ep
erce
nta
ge
of
the
villa
ge
wh
ich
isM
usl
im,
wh
eth
erth
ere
isa
paved
road
toth
en
eare
stci
ty,
an
dw
het
her
ari
ver
flow
sth
rou
gh
the
villa
ge)
.S
tan
dard
erro
rsare
clu
ster
edat
the
villa
ge
level
.***in
dic
ate
ssi
gn
ifica
nce
at
1%
level
,**
at
5%
level
,*
at
10%
level
.
33