Embed Size (px)
Citation preview

SCANIA 1999ANNUAL REPORT

In 1897 came the first Swedish-made automobile with a com-bustion engine.
In 1909, only five trucks weremade. Of these, the one shownabove is the oldest preserved Scania truck.
During the 1920s, Scania-Vabis began making buses. In 1923, it produced 20.
In 1925, an entirely newtruck chassis and a newtype of engine with an integral gearbox were introduced.
In the 1930s, the “BulldogBus” arrived. Developed froma Leyland Tiger design, it waspath-breaking owing to itssimple design and efficientuse of space and weight.
In 1949, Scania took a significant stepforward by unveiling its new 40- and60-series trucks, featuring a direct-injection diesel engine that con-sumed 20–25 percent less fuel. Itwas soon called the 400,000 km engine, a tribute to its great durability.
In 1958, Scania began building the 75 series, its most long-lived model series.The model remained in production until1980, when Scania introduced morecomfortable, stronger, heavier truckswith largely the same appearance.
Scania through the decadesScania was founded in 1891. Since then, the companyhas manufactured and delivered nearly one milliontrucks, buses and bus chassis.
Scania is one of the world’s leading manufacturersof heavy trucks and buses as well as industrial and marine engines. With 25,800 employees and produc-tion units in Europe and Latin America, Scania is oneof the most profitable manufacturers in its industry.During 1999, sales reached SEK 47.1 billion. Incomeafter financial items was SEK 4.5 billion. Scania prod-ucts are sold in some 100 markets and about 95 per-cent of Scania vehicles are sold outside Sweden.
In 1945, at the end of the war, a“unitary” bus range was ready for production.The various busmodels, built according to thesame principles, were suitable forcity, intercity and tourist coachservice.
During the 1980s, the 2- and 3-seriesemerged, a range of models based onthe modular philosophy that Scania hadworked with for years.The 3-series wasnamed Truck of the Year in 1989.
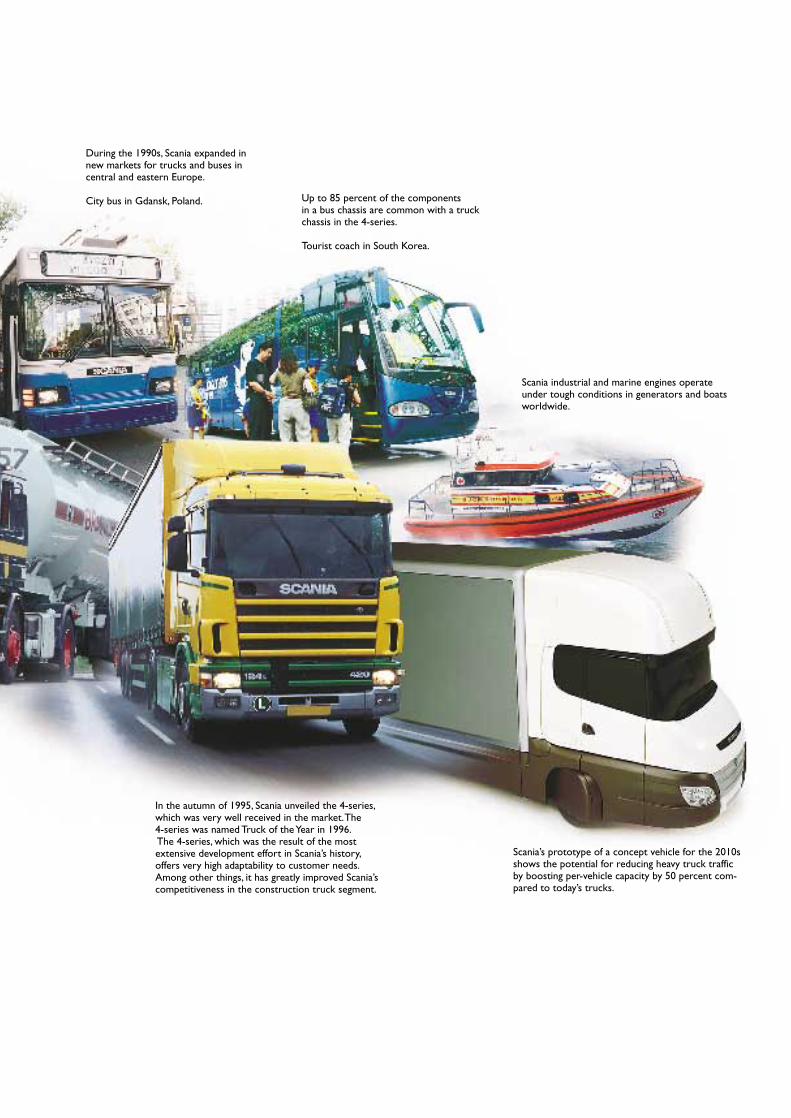
During the 1990s, Scania expanded innew markets for trucks and buses incentral and eastern Europe.
City bus in Gdansk, Poland. Up to 85 percent of the components in a bus chassis are common with a truck chassis in the 4-series.
Tourist coach in South Korea.
Scania industrial and marine engines operate under tough conditions in generators and boatsworldwide.
Scania’s prototype of a concept vehicle for the 2010sshows the potential for reducing heavy truck trafficby boosting per-vehicle capacity by 50 percent com-pared to today’s trucks.
In the autumn of 1995, Scania unveiled the 4-series,which was very well received in the market.The 4-series was named Truck of the Year in 1996.The 4-series, which was the result of the most extensive development effort in Scania’s history,offers very high adaptability to customer needs.Among other things, it has greatly improved Scania’s competitiveness in the construction truck segment.

2
CONTENTS
Important events in 1999 and 2000 2
Highlights 3
Statement of the President and CEO 4
Statement of the Chairman 6
Scania share data 8
Mission and strategy 10
Scania’s identity and behaviour 11
Scania during the 1990s 14
Review of operations 16
Vehicles 16
Service-related products 28
Customer financing 30
Our employees 32
Scania and the environment 34
Financial review 38
Consolidated income statement 42
Consolidated balance sheet 43
Consolidated statement of cash flows 44
Parent Company financial statements 45
Accounting principles 46
Notes to the consolidated financial statements 48
Financial information in accordance with U.S. GAAP 56
Proposed distribution of earnings 57
Auditors’ report 58
Value-added 59
Quarterly data, financial ratios, definitions 60
Multi-year statistical review 62
Board of Directors 64
Group Management 66
Addresses 68
The Report of the Directors encompasses pages 2–57.
Swedish corporate identity number:Scania AB (publ)556184-8564
IMPORTANT EVENTS1999January: • Scania and American engine manufacturer Cummins started
a jointly owned company to produce advanced fuel injectionsystems.
• Distribution of trucks in the South Korean market resumed, viathe newly established wholly-owned subsidiary Scania Korea Ltd.
• Scania acquired its truck distributor in the Italian market, Ital-scandia Autocarri S.p.A.
• Volvo announced it had bought shares equivalent to 13.5 percentof the voting power and 12.9 percent of share capital in Scania.
March: • A new cutting-edge vehicle electronics company, Scania Info-
tronics AB, was established in partnership with the researchcompany Mecel AB.
April: • All Scania facilities in Sweden received ISO 14001 environ-
mental management accreditation.• Volvo gradually enlarged its shareholding in Scania. By the
end of April, it held 21.5 percent of the votes and 20.3 percentof the capital.
July:
• Scania acquired its distributor in the Norwegian market, NorskScania AS.
• Scania decided to invest in a new finishing paintshop and cabassembly facility in Oskarshamn, Sweden.
August: • Volvo signed an agreement with Investor to acquire all of In-
vestor’s shares in Scania. At the same time, Volvo announced apublic offer for the other Scania shares outstanding.
September: • Scania’s new concept truck for the 2010s was unveiled at a
road safety seminar in Brussels.
October: • Scania acquired the remaining 50 percent of its Finnish distrib-
utor, Oy Scan-Auto Ab.• Scania’s frame component production unit in Luleå, Sweden
was reorganised into an autonomous limited company, Ferru-form AB.
November: • Mecel and Scania Infotronics unveiled the first WAP browser
for a truck environment.
• Scania signed an agreement to sell 340 intercity buses to SouthAfrica.
2000March: • The European Commission decided not to approve Volvo’s
proposed acquisition of Scania. Volvo withdrew its offer toScania’s shareholders.
• Investor announces an agreement with Volkswagen AG on thesale of 34.0 percent of voting rights and 18.7 percent of capitalin Scania.

3
HIGHLIGHTS
0
10,000
20,000
30,000
40,000
50,000
1998 19991997
SEK m.
Sales 1997 1998 1999
Sales, units
Trucks 42,392 45,553 46,651
Buses 4,584 4,117 3,763
Total 46,976 49,670 50,414
Sales, SEK m.
Scania products 35,087 39,675 41,728
Svenska Volkswagen products 4,632 5,637 5,382
Total 39,719 45,312 47,110
Operating income, SEK m.
Scania products 2,789 3,342 4,795
Svenska Volkswagen products 258 250 250
Total 3,047 3,592 5,045
Operating margin, %
Scania products 7.9 8.4 11.5
Svenska Volkswagen products 5.6 4.4 4.6
Total 7.7 7.9 10.7
Income after financial items, SEK m. 2,751 3,214 4,500
Net income, SEK m. 1,943 2,250 3,146
Earnings per share, SEK 9.70 11.25 15.75
Earnings per share accordingto U.S. GAAP, SEK 11.10 11.20 16.40
Operating cash flows excludingcustomer finance operations, SEK m. –55 1,797 476
Return, %
on shareholders’ equity 20.2 20.7 25.1
on capital employed1 16.2 17.4 21.4
Net debt/equity ratio1 0.69 0.55 0.61
Equity/assets ratio, % 27.0 26.5 26.0
Capital expenditures for property, plant and equipment, SEK m. 2,566 2,026 1,876
Research and development expenses, SEK m. 1,248 1,168 1,267
Number of employees at year-end 23,763 23,537 25,814
1 With customer finance operations reported according to the equity method.1997 1998 1999
%
Operating margin
0
2
4
6
8
10
0
1,000
2,000
3,000
4,000
1997 1998 1999
SEK m.
Operating income
5,000

4
A number of circumstances contributedto the fine growth in earnings. One was avery strong western European market.But the main explanation is that the com-pany has now completed the changeoverto new product ranges and its transitionto a partly new production system.
Bolstering the distribution networkIn recent years, European haulage compa-nies have increasingly demanded vehiclesthat carry maintenance, repair and financ-ing packages for a period of four to fiveyears. The trend towards focusing on their
STATEMENT OF THE PRESIDENT AND CEO
Leif Östling
Scania had a very good year in 1999. Sales volume rosesomewhat and earnings jumped by 40 percent.The op-erating margin on Scania products, at 11.5 percent, isback at a traditionally high Scania level.
actual transport operations and outsourc-ing other activities has become clearerand clearer.
This trend began in the late 1980s inGreat Britain and the Benelux countriesbut is also becoming more common in other countries. It will become even morepronounced in the future, both in Europeand elsewhere.
In light of this, we have systematicallystrengthened and expanded our distribu-tion and service organisation in all west-ern European markets over the past fiveyears. During 1999, Scania acquired itsdistributors in Italy, Norway and Finland.
We are also continuing to expand ourdistributor organisations in the importantgrowth markets of central and easternEurope, despite temporarily weak demand

5
Broader product conceptDelivering the best total solutions in themarket is the key to achieving Scania’sgrowth targets. During 1999, efforts tofurther refine Scania’s service, maintenanceand finance packages thus continued.
Investments in Scania-specific electron-ic and information systems intensified. Asone step in this effort, Scania Infotro-nics AB, a cutting-edge company in infor-mation technology (IT) based vehicle electronics, was established. Scania iscommitted to assuming a leading role intransforming IT developments into prac-tical vehicle applications that benefit ourcustomers.
Continued strong demandDuring 1999, demand for heavy trucks inwestern Europe was larger than most ob-servers had expected. The EU is showinggood economic growth, and there is prob-ably still a large need to replace the ve-hicles sold during the previous demandpeak around 1990. Another reinforcingfactor is environmentally related demand,due to new regulations as well as the factthat customers see it as a competitive ad-vantage to have the best environmentallyadapted vehicles.
Markets in Asia were weak during1999, but there was some recovery dur-ing the second half. In the long term, theregion offers major potential to Scania,and we are continuing to strengthen ourdistribution and service network there.
Latin America had a difficult year.Early in 1999, Brazil devalued its currency,driving demand throughout the regiondown to a very low level. We have imple-mented vigorous action programmes toadapt our cost level to the prevailing de-mand. Given these actions, in our judge-ment we will achieve at least break-evenduring 2000.
This year is certain to be exciting.Western European markets seem to becontinuing at a high level. Central andeastern Europe are bouncing back, as arethe markets of Asia. I also see certainsigns that Latin America will be able torecover from the current low demand.
Focus on qualityDespite the prevailing uncertainty duringthe past 14 months, in my judgement Scania has not suffered any serious harmin the short term. We are working at fullspeed to develop new products. Scania’sproduction system will be further stream-lined by a number of development pro-grammes. The distribution and service organisation will continue to undergochanges in response to customer demandfor fast, high-quality service. All workwill focus on quality – in the development,production and distribution/servicing ofour products.
I would like to close by thanking allour employees for their solid dedication,outstanding contributions and very fineearnings performance during the tumul-tuous year we have now completed.
Leif ÖstlingPresident and CEO

6
The European truck market remained vigorous during 1999. Despite continuedvery weak demand in important Scaniamarkets – South America, eastern Europeand South East Asia – and mounting pricecompetition, Scania increased its earnings.
In January 1999, when Scania an-nounced its preliminary results for 1998,we issued a forecast stating that operatingincome would improve by about SEK 1.5billion during 1999. I am now pleased tonote that this was achieved.
Highest profitability in the industryWith an operating margin of 11.5 per-cent, Scania has again shown the highestprofitability in its industry. The operatingmargin of Scania’s European operationswas 13 percent, which must be describedas very strong.
This is the result of Scania’s invest-ments over the past several years in anew, attractive range of vehicles, service-related products and customer financing,as well as a largely new and more efficientproduction system.
Focus on ownershipVolvo’s purchase in January 1999 of ashareholding in Scania, and Volvo’s ex-press desire to purchase all shares, accen-tuated the issue of Scania’s future andownership structure.
STATEMENT OF THE CHAIRMAN
Anders Scharp
For Scania, 1999 was a year of upheaval.The issue ofthe company’s future ownership structure was in focusand we were forced to work in uncertainty regardingour future ownership. Meanwhile Scania showed itsstrength in the form of earnings at a historically highScania level.

We are convinced that Scania has verygood potential to remain an independentplayer in the heavy vehicle market. Scaniais one of the world’s five largest makes of both heavy trucks and buses. The com-pany has successfully implemented itsproduct renewal and production change-over and thus stands well equipped forthe future.
In August, Volvo agreed to purchaseInvestor’s shareholding in Scania and announced a public offer for all sharesoutstanding in Scania.
The Competition Directorate of theEuropean Union then carried out its ex-amination of Volvo’s acquisition – fromSeptember 1999 to March 2000. The European Commission’s decision on 14March signified a rejection of Volvo’sproposed acquisition of Scania. As a re-sult, Volvo withdrew its offer to the share-holders of Scania.
A strong ScaniaDespite the uncertainty of the past year,Scania has continued to show strength.The unique Scania spirit has enabled ouremployees to focus successfully on theirrespective assignments without being dis-tracted by everything that has been hap-pening on the ownership issue. Scania’svery strong 1999 earnings consolidated its leading global position in the industry.
Late in March 2000, it was announcedthat Volkswagen had agreed with Investorto acquire 34 percent of the voting power and18.7 percent of the share capital in Scania.
7
The intention is that Scania, in accor-dance with statements in conjunction tothe deal between Volkswagen and Investor,continues to be a listed company and willalso continue to follow Swedish practiceregarding obligations towards share-holders, corporate governance, auditingand disclosure.
In closing, I would like to express thegratitude of the Board to the managementand all employees of Scania for their finecontributions during a year of turbulencebut of very good results for our company.
Anders ScharpChairman

8
SCANIA SHARE DATA
Since 1 April 1996, both types of Scaniashares – Series A and Series B – have beenquoted on what is now called the OMStockholm Stock Exchange (SSE) and onthe New York Stock Exchange (NYSE).In Stockholm, both A shares and B sharesare quoted on the SSE’s A list. A roundlot consists of 100 shares. Since 1 January2000, the B share is no longer included in the Swedish OMX Index. On theNYSE, Scania shares are traded in theform of American Depositary Receipts(ADRs), consisting of 10 shares. Citibankis the depositary bank. Scania shares arealso traded on the London Stock ExchangeAutomated Quotations system for non-UK equities (SEAQ International).
Share prices and tradingB shares – the more heavily traded of Scania’s two series – rose by 104 percentduring 1999. During the same period, theindex of Swedish engineering companies
rose by 117 percent and the SSE GeneralIndex by 66 percent. At year-end, B shareswere quoted at a market value of SEK306.50 apiece. This was equivalent to amarket capitalisation of SEK 61,100 m.The highest closing price for B shares during the year was SEK 312.50 apieceon 27 August. The lowest, SEK 157.50,was paid on 4 January.
The beta coefficient shows the fluctua-tions of a specific share in relation to anentire stock exchange. According to cal-culations by the OM Stockholm StockExchange, the beta coefficient of Scania Bshares was 1.04 at the end of 1999. Thismeans that on average, Scania shares fluc-tuated 4 percent more than the Exchangeon average. The explanatory value forScania shares was 0.55, which means the55 percent of share price changes can beexplained by overall changes on the SSE.
On average, about 1,082,000 shareschanged hands each trading day in Stock-holm, for a turnover rate of 137 (86) per-cent, compared to 94 (76) percent on theSSE as a whole. The heavy trading is ex-plained by Volvo’s purchases of Scaniashares during the year as well as other heavy trading due to changes in owner-ship structure.
Scania’s share capital is distributed among 100 millionA shares and 100 million B shares. Each A share rep-resents one vote and each B share one tenth of a vote.Otherwise there are no differences between these typesof shares.The nominal (par) value per share is SEK 10.
B shares
Affärsvärlden General Index
(c) SIX
4/96
5/96
6/96
7/96
8/96
9/96
10/9
611
/96
12/9
61/
972/
973/
974/
975/
976/
977/
978/
979/
9710
/97
11/9
712
/97
1/98
2/98
3/98
4/98
5/98
6/98
7/98
8/98
9/98
10/9
811
/98
12/9
81/
992/
993/
994/
995/
996/
997/
998/
99 9/99
10/9
911
/99
12/9
91/
002/
00
Share price, OM Stockholm Stock Exchange, Scania B shares
Trading volumein thousands(incl. after-market)
6,50013,00019,50026,00032,50039,00045,50052,000 58,50065,000
100
150
200
250
300
350
400
450500550600650

9
In NewYork, an average of about 1,100Scania ADRs were traded per day, downby about 400 from the year before. Atyear-end there were 86,000 ADRs out-standing, compared to 77,000 at the be-ginning of 1999.
Ownership structureOn 15 January 1999, AB Volvo acquired13.5 percent of the voting power and 12.9percent of the share capital in Scania. Volvo gradually increased its stake, hold-ing 21.5 percent of the votes and 20.3 percent of the capital at the end of April.On 6 August 1999, Volvo signed an agree-ment to purchase Investor AB’s shareholdingin Scania, equivalent to 49.3 percent of thevotes and 27.8 percent of the capital. Atthe same time, it presented a conditionalpublic offer for the remaining shares out-standing. After a decision by the EuropeanCommission not to approve the proposedacquisition, on 14 March 2000, Volvowithdrew its offer. On 27 March 2000, Investor agreed with Volkswagen AG tosell 34.0 percent of the voting power and18.7 percent of share capital in Scania. On 29 February 2000, Volvo’s holdingamounted to 30.8 percent of the votes and46.9 percent of the capital. Apart from Volvoand Investor, SPP remained as a major share-holder on 29 February, with 3.1 percent ofthe capital and 4.6 percent of the votes.
On 29 February 2000, the number ofshareholders in Scania was about 43,000,an increase of 4,000 since the beginning of 1999.
Scania on the InternetScania’s website includes informationabout the company and provides a wayto contact Scania’s Investor Relations de-partment. The address is www.scania.com
Per share data
SEK (unless otherwise stated) 1999 1998 1997
Earnings 15.75 11.25 9.70
Shareholders’ equity 67.75 59.30 51.80
Dividend (1999 proposed) 7.00 6.50 5.50
Market prices, B-shares(closing price)
Highest for the year 312.50 230.00 240.00Lowest for the year 157.50 132.50 166.50Year-end 306.50 150.00 179.00
Price/earnings ratio, B-shares 19.5 13.3 18.5
Dividend payout ratio, % 44.4 57.8 56.6
Dividend yield, % (B-shares) 1 2.3 4.3 3.1
Annual turnover rate, % 136 86 60
Number of shareholders 43,0002 39,0003 45,000
Average daily number of shares traded 1999:
– OM Stockholm Stock Exchange A 232,000B 850,000
Total 1,082,000
– New York Stock Exchange A-ADRs 575B-ADRs 543
Total 1,1181 Dividend divided by the market price of a
B share at year-end.2 As of 29 February 2000.3 As of 29 January 1999.
Ownership structure29 February 2000
% of % ofNumber of shares shareholders shares
1– 500 91.1 2.7501– 2,000 6.9 1.52,001– 10,000 1.4 1.310,001– 50,000 0.3 1.650,001–100,000 0.1 1.1
> 100,000 0.2 91.8
Total 100.0 100.0
The ten largest shareholders29 February 2000
% of voting % ofpower shares
Investor 49.3 27.8Volvo 30.8 46.0SPP 4.6 3.1Svenska Handelsbanken (SHB) sphere 1.5 0.9Nordbanken mutual funds 1.1 1.1SEB sphere 0.9 1.2Wallenberg sphere 0.8 3.9AMF Pension 0.5 0.6Hagströmer-Qviberg sphere 0.3 0.2SHB mutual funds 0.3 0.3Total 90.1 85.1

10
MISSION AND STRATEGY
Mission statementScania’s mission is to supply its customers with vehicles and servicesrelated to the transport of goods and passengers by road. By focusingon customer needs, Scania shall create value-added for the customerand grow with sustained profitability. Scania thereby generates share-holder value.
Scania’s industrial operations specialise in developing and manufac-turing vehicles, which shall lead the market in terms of performance,life-cycle cost, quality and environmental characteristics.
Scania’s commercial operations, which include distributors, dealersand service points, shall supply customers with optimal equipment andaftersales support, thereby providing maximum operating time at mini-mum cost over the service life of their vehicles.
Strategy• Focus on heavy transport vehicles:
Scania’s operations concentrate on heavy transport vehicles. In maturemarkets, demand for heavy trucks andbuses increases with GDP growth. Indeveloping countries, it also increasesas infrastructure expands.
Heavy vehicles are specialised prod-ucts that are used as working tools.Scania’s trucks, buses and industrialand marine engines have an establishedreputation as quality products, both interms of performance and price.
• Modular product system and globalproduction system:Buyers of heavy transport vehicles de-mand customer-specific solutions. Themore closely a vehicle is adapted to itstransport task, the more economically itwill operate.
Scania’s modular system is based onthe use of common components in anumber of different specifications. Thiscreates customer benefit by making itpossible to specify vehicles individually.It also leads to improved quality, sim-
plified parts management and a higherdegree of service.
The modular system limits the totalnumber of components in Scania’s prod-uct range. It thereby allows consider-ably longer production runs for thesecomponents than a conventional prod-uct system. Scania’s global productrange, featuring standardised compo-nents and global quality standards, makesit possible to use the same process technology at all Scania facilities.
• Complete range of vehicles, servicesand financing:Offering the best package solutions in the market is the key to achievingScania’s growth targets. Scania’s cus-tomers demand round-the-clock access to their vehicles. This presupposes rapidaccess to service and repairs. In addi-tion to its vehicle development work,Scania is continuously improving itsdistribution and service network.
Scania is working actively to expandits range of services and financing in order to achieve more rapid profitabilitygrowth.
• Focus on growth markets:Scania’s main markets – Europe, LatinAmerica and Asia – have good potentialfor long-term growth.
A borderless Europe of growingeconomies is offering major opportuni-ties to manufacturers that have a well-developed distribution and service net-work.
In Latin America, an increasing shareof both goods and passenger traffic uti-lises heavy vehicles. The demand for ve-hicles, services and financing is increasing.
Asia is a long-term growth market.As the infrastructure improves, a stream-lining of the transport sector will becomepossible.

11
Scania’s identityScania has a strong corporate culture thathas laid the groundwork for the company’ssuccess. Scania’s identity is shaped bothby its products – vehicles, services andcustomer financing – and by the valuesand behaviour of the company.
Scania’s product identityThe Scania brand name has a strong iden-tity, and Scania’s products stand for pres-tige and high performance. The promisesmade by this brand name must constantlybe fulfilled in the company’s encounterswith its customers.
Only high performance and qualitycan satisfy customers’ expectations ofScania. Scania offers prestige products inwhich customers must feel total confidence.These products must also help their own-ers and drivers to feel proud of their choiceof professional working tools.
Behaviour/way of workingThe principles that have governed thecompany’s past work have laid the ground-work for Scania’s public image and success.In modernised form, these principles mustalso characterise its future efforts.
Forward-looking integrityClose and lasting relationships with de-manding customers have laid the ground-work for Scania’s development of productsand services. Scania has based its work onthe customer’s business and has peeked around the corner. By thinking independ-ently, Scania has developed forward-lookingtransport solutions that are competitivethroughout the life cycle of its products.
Scania takes responsibility for a holis-tic approach to customer transport solu-tions by expanding its service offeringand adapting it to a customer’s overallbusiness.
SCANIA’S IDENTITY AND BEHAVIOUR
Scania offers prestigeproducts in whichcustomers must feeltotal confidence.These productsmust also help theirowners and driversto feel proud oftheir choice of pro-fessional workingtools.
Systematised simplicityModularisation is one cornerstone in thedevelopment of Scania’s products and services, making it possible to combinespecialised, customer-adapted solutionswith the economies of long productionruns. It also ensures quality, simple partsmanagement and a high level of service.
Scania uses advanced technology butavoids fads and unnecessary complexity.Its technical solutions must generate value
12
by providing robust and reliable productsas well as simple, comprehensible, demand-controlled work flows.
Coordinated independenceScania takes advantage of economies ofscale, striving for uniformity that willcontribute to higher quality, productivityand flexibility. Otherwise general guide-lines are responsible for the necessarycoordination.
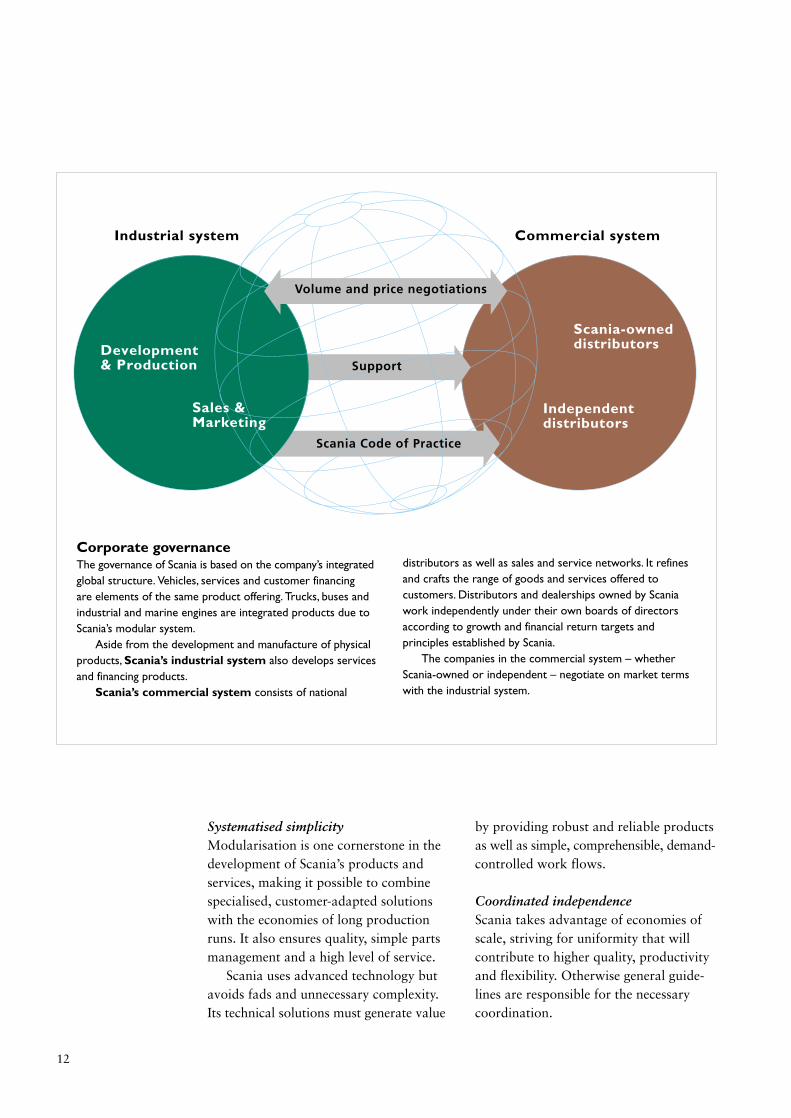
Corporate governanceThe governance of Scania is based on the company’s integratedglobal structure. Vehicles, services and customer financing are elements of the same product offering. Trucks, buses andindustrial and marine engines are integrated products due toScania’s modular system.
Aside from the development and manufacture of physicalproducts, Scania’s industrial system also develops servicesand financing products.
Scania’s commercial system consists of national
distributors as well as sales and service networks. It refines and crafts the range of goods and services offered tocustomers. Distributors and dealerships owned by Scaniawork independently under their own boards of directorsaccording to growth and financial return targets andprinciples established by Scania.
The companies in the commercial system – whetherScania-owned or independent – negotiate on market termswith the industrial system.
Industrial system Commercial system
Development & Production
Scania-owneddistributors
Sales & Marketing
Independent distributors
Volume and price negotiations
Support
Scania Code of Practice
13
Within the limits of existing rules andguidelines, Scania managers independent-ly develop the operations they manage.They set targets for their operations andrely on the willingness and ability of em-ployees to take responsibility for resultsand development.
Continuous improvementScania has a tradition of working econo-mically with limited resources. Every ac-
tivity must create value-added for its re-cipients and every cost must be related to a corresponding benefit.
In Scania’s day-to-day work, the qualityand efficiency of a unit’s own efforts mustbe systematically compared to the bestpractices in each field. Continuous im-provement efforts generate higher valueand lower the consumption of resources.
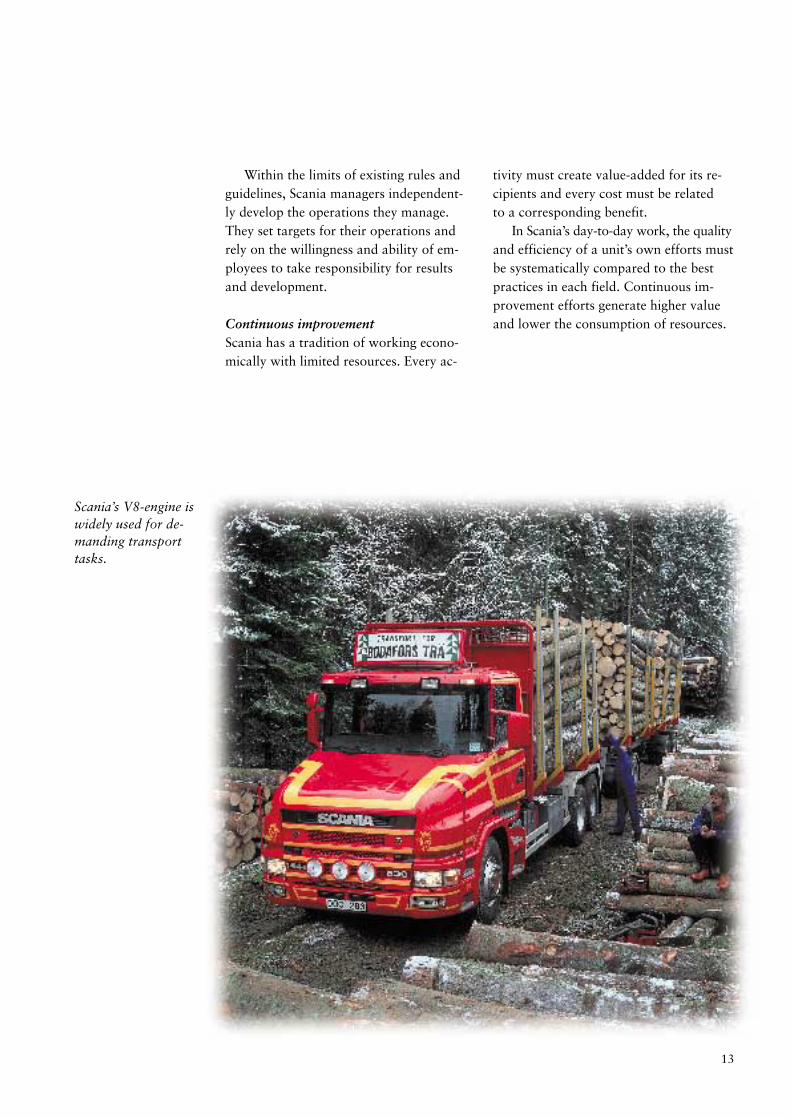
Scania’s V8-engine iswidely used for de-manding transporttasks.

Scania’s sales of heavy vehicles rose fromjust above 30,000 to approximately 50,000during the 1990s. This expansion is theresult of deliberate investments in higherproduction capacity. Scania has capturedmarket share in both western Europe andthe growth markets of Latin America,central and eastern Europe and Asia. Dur-ing the 1990s, growth in the service sec-tor was even higher than for vehicles.
Scania’s owners1991: Investor bought Saab-Scania, de-listing it from the stock market.
1994: Scania again became an indepen-dent company when Saab-Scania was de-merged into two separate companies.
1996: Scania gained a listing on theStockholm Stock Exchange and – as thefirst Swedish company – on the NewYork Stock Exchange.
1999: Scania’s main owner, Investor, signed an agreement to sell all its shares to Volvo, which made a public offer for the remaining shares in Scania.
14
2000: The European Commission decidednot to approve Volvo’s proposed acquisi-tion of Scania. Volvo withdrew its offerto Scania’s shareholders.
Investor signed an agreement withVolkswagen AG on the sale of 34.0 per-cent of voting rights and 18.7 percent ofcapital in Scania.
Evolution into a global player1989: Scania’s new management, headedby Leif Östling, established as its objec-tives that Scania would increase sales volume and work in an even more inte-grated way, in order to preserve the bestprofitability in its industry.
1990: Scania began the split into an industrial system (development, manu-facturing and marketing) and a commer-cial system (Scania-owned and independ-ent distributors). The aim was to create aclearer structure in the Group and greaterfocus on growth and profitability.
1991: Scania introduced a new produc-tion system adapted to its plans for a glo-bal production structure. It began to con-centrate European component productionto fewer units, a process that continuedthroughout the 1990s. Scania began toinvest in future capacity.
SCANIA DURING THE 1990s
During the 1990s, Scania was affected by the deregula-tion of transport markets in Europe.The growing use of heavy vehicles in both the industrialised world anddeveloping countries also played a major role in thecompany’s development.
The new corporate symbol, designed whenScania again became an independent com-pany, has ties to historical Scania symbols.
The new assembly plantin Angers, France, wascompleted and fully op-erative when demandtook off in 1994.

15
1992: Scania built a new assembly plantin Angers, France, as a consequence of itsdecision to increase capacity.
1995: Scania introduced the 4-series. The4-series took Scania’s modular philosophy astep further, reducing the number of com-ponents while increasing the integrationbetween trucks, buses and industrial andmarine engines. The restructuring of op-erations into an industrial and a commer-cial system began in Latin America.
1995/1996: The changeover in the Euro-pean production system took place anddeliveries of 4-series vehicles began.
1997: Scania created a global productionstructure. After the changeover in Latin
America, it became the first heavy vehiclemanufacturer with a global product range.In other words, Scania manufactures anddelivers products with interchangeablecomponents and the same quality andperformance in all markets where thecompany is active.
Late 1990s: During the second half of the1990s, Scania intensified its forward inte-gration by acquiring several of its distrib-utors, especially in European markets.
The company expanded and strength-ened its service organisation in Europeand in other markets, by improving em-ployee expertise and establishing commonstandards. In this way, Scania guaranteesits customers a high level of vehicle avail-ability.
The 4-series, unveiledin 1995, has consoli-dated Scania’s positionas a leading truck andbus make.
In 1996 Scania becamea listed company, quotedon the Stockholm StockExchange and, as thefirst Swedish company,on the New York StockExchange.
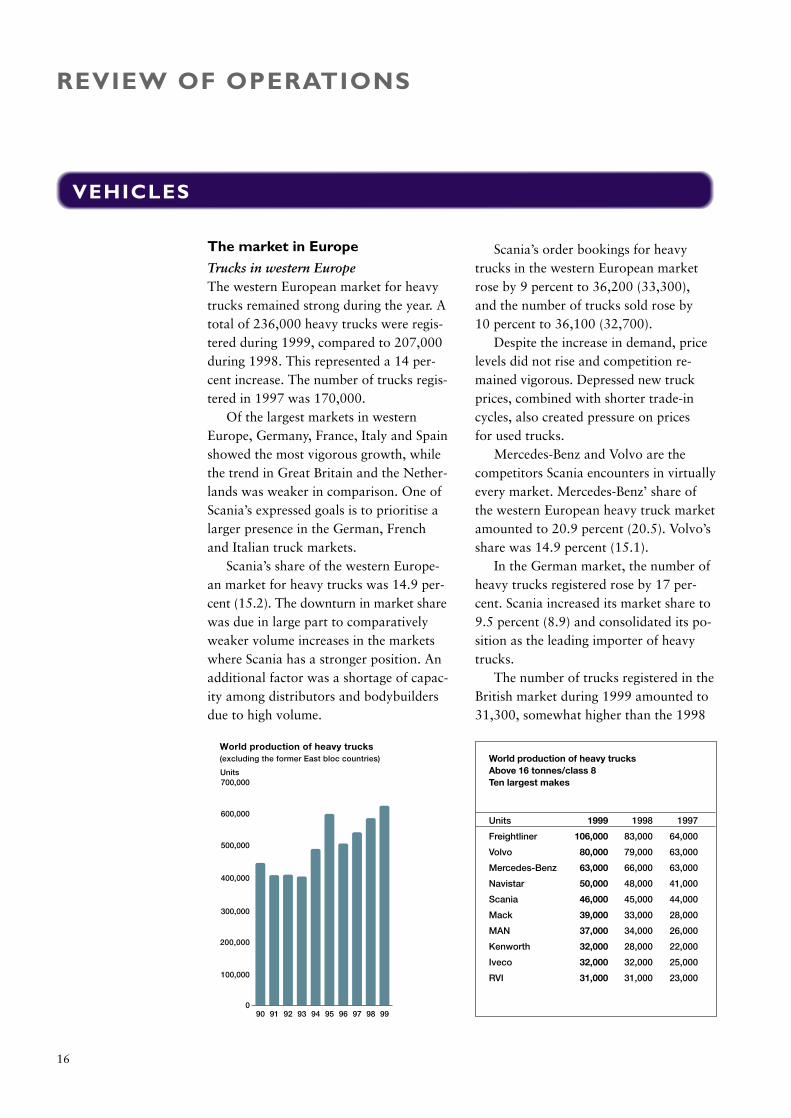
The market in EuropeTrucks in western EuropeThe western European market for heavytrucks remained strong during the year. Atotal of 236,000 heavy trucks were regis-tered during 1999, compared to 207,000during 1998. This represented a 14 per-cent increase. The number of trucks regis-tered in 1997 was 170,000.
Of the largest markets in western Europe, Germany, France, Italy and Spainshowed the most vigorous growth, whilethe trend in Great Britain and the Nether-lands was weaker in comparison. One ofScania’s expressed goals is to prioritise alarger presence in the German, Frenchand Italian truck markets.
Scania’s share of the western Europe-an market for heavy trucks was 14.9 per-cent (15.2). The downturn in market sharewas due in large part to comparativelyweaker volume increases in the marketswhere Scania has a stronger position. Anadditional factor was a shortage of capac-ity among distributors and bodybuildersdue to high volume.
Scania’s order bookings for heavytrucks in the western European marketrose by 9 percent to 36,200 (33,300), and the number of trucks sold rose by 10 percent to 36,100 (32,700).
Despite the increase in demand, pricelevels did not rise and competition re-mained vigorous. Depressed new truckprices, combined with shorter trade-in cycles, also created pressure on prices for used trucks.
Mercedes-Benz and Volvo are thecompetitors Scania encounters in virtuallyevery market. Mercedes-Benz’ share ofthe western European heavy truck marketamounted to 20.9 percent (20.5). Volvo’sshare was 14.9 percent (15.1).
In the German market, the number ofheavy trucks registered rose by 17 per-cent. Scania increased its market share to9.5 percent (8.9) and consolidated its po-sition as the leading importer of heavytrucks.
The number of trucks registered in theBritish market during 1999 amounted to31,300, somewhat higher than the 1998
16
REVIEW OF OPERATIONS
VEHICLES
0
100,000
200,000
300,000
400,000
500,000
600,000
700,000
97 98 9990 91 92 93 94 95 96
Units
World production of heavy trucks(excluding the former East bloc countries) World production of heavy trucks
Above 16 tonnes/class 8Ten largest makes
Units 1999 1998 1997
Freightliner 106,000 83,000 64,000
Volvo 80,000 79,000 63,000
Mercedes-Benz 63,000 66,000 63,000
Navistar 50,000 48,000 41,000
Scania 46,000 45,000 44,000
Mack 39,000 33,000 28,000
MAN 37,000 34,000 26,000
Kenworth 32,000 28,000 22,000
Iveco 32,000 32,000 25,000
RVI 31,000 31,000 23,000

17
level. Scania’s market share amounted to18.1 percent (18.8).
In the French market, rapid growthcontinued and the peak achieved in 1998was exceeded. Scania’s share of the mar-ket rose to 10.7 percent (9.4).
The Italian market was characterisedby the continued impact of deregula-tion, and sales increased sharply. Scania’s market share rose to 12.8 percent (12.5).Early in 1999, Scania acquired its Italiandistributor as part of its expansion in Italy.During October, it also acquired the Italianfinance company Fiscar S.p.A.
In the Netherlands the total number ofregistrations decreased somewhat, follow-ing strong growth in the preceding year.Scania’s share of the market decreased to19.4 percent (22.7).
The demand in the Nordic market waslargely unchanged during the year. Scaniastrengthened its market position, primarilyin Sweden. Its total market share in theNordic countries amounted to 35.5 per-cent (34.9).
Market shares, heavy trucks in western Europe
5
10
15
20
25
30
VolvoScania
RVI
Mercedes
MAN Iveco
DAF
%
89 90 91 92 93 94 95 96 97 98 99
0
50,000
100,000
150,000
200,000
250,000
90 91 92 93 94 95 96 97 98 99
Units
Registrations, heavy trucksin western Europe
With the 4-series,Scania has strength-ened its position inthe construction segment.

Trucks in central and eastern EuropeThe downturn in the markets of centraland eastern Europe that began during thesecond half of 1998 continued during1999. The recession, caused by Russia’seconomic slump, led to lower volume andsharp price reductions, especially for inter-national transport services. This resultedin diminished buying power among hauli-ers, which in turn decreased the room fornew truck sales.
The number of newly registered heavytrucks of western European origin de-creased by 30 percent to 11,600 (16,600).During the year, Scania delivered about1,600 trucks (2,200), down more than 25percent. However, Scania noted increaseddemand during the latter part of the year.
Despite temporarily difficult marketconditions, Scania views the region as animportant growth market. During the
year, efforts to strengthen the distributionand service network continued, with newfacilities being added in most countries inthe region.
Gradually improved transport volumeplus a general improvement in the credit-worthiness of hauliers indicate a strongermarket ahead.
Buses in EuropeThe total market for heavy buses in west-ern Europe remained at the same level asduring 1998. The number of bus registra-tions rose somewhat to 21,800 (21,000).
The markets in Austria, Sweden andGreat Britain grew the most during the year.
The deregulation of city and intercitybus services in western Europe continued.This improves the opportunities for Scaniato enter markets, such as Germany, Franceand Italy, previously dominated by do-mestic makes.
Scania’s transition to the new genera-tion of buses, which are manufactured ac-cording to the same modular concept astrucks, was fully implemented.
Scania has decided to establish twocentral distribution units for its bus salesin 15 European markets, independent ofthe truck distribution organisation. This
“A dense network of service points
with professional mechanics and the
availability of vehicle service essentialy
round the clock is very important to
our business. Our customers are de-
pendent on punctual deliveries.”
Hans Adam Schanz,
Managing Director and owner of Spedition Schanz,
Ober-Ramstadt, Frankfurt, Germany.
18
0
5,000
10,000
15,000
20,000
25,000
90 91 92 93 94 95 96 97 98 99
Units
Registrations of heavy busesin western Europe
0
20,000
10,000
30,000
50,000
40,000
60,000
70,000
90 91 92 93 94 95 96 97 98 99
80,000
Units
World production of heavy buses(excluding the former East bloc countries)

new structure enables an increased focuson sales and services of buses. The needsof bus companies that operate across na-tional boundaries can also be better satis-fied. The two units, Scania Bus Europe andScania Bus Nordic, will have a resourcecentre in Belgium and one in Sweden.
Scania’s bus sales grew more than thetotal market. This was due, among otherthings, to a broader product range as wellas more efficient production of buses andbus chassis.
Sales in Europe rose by 9 percent to2,000 buses and bus chassis (1,840) andmarket share rose to 8.3 percent (7.6).
Scania’s order bookings in Europe to-talled 1,700 buses and bus chassis(1,840), a decrease of 8 percent.
Spain was again Scania’s foremost busmarket in Europe, with 560 Scania busesregistered (370). Last year’s downturn inmarket share, due to delivery problems,was recouped and surpassed.
Scania’s share of the Nordic marketstrengthened substantially to 28.7 percent(24.4), due to large sales volume, espe-cially of city buses.
Industrial and marine enginesTotal deliveries of industrial and marineengines showed good growth. Scania’soverall sales amounted to 3,280 engines
(2,840), of which 70 percent industrialengines and 30 percent marine engines. Onecontributing reason behind the increasewas strong demand for generator sets.
The 12-litre engine for industrial useshowed continued sales successes duringthe year.
In Europe, the number of engines soldincreased to 2,080 (1,910).
19
Scania engines are used in the prestigesegment of pleasure craft.
The OmniCity is Scania’s new city bus.It is available eitherwith a body by Scaniaor as a chassis (N94)on which independentbodywork companiesbuild a customised superstructure.

The market in Latin AmericaTrucksThe Latin American markets showedweakness during 1999. Scania’s sales fellby 17 percent to 6,300 trucks (7,600).Order bookings decreased by 25 percentto 6,100 trucks (8,100).
During the year, the Latin Americanplants had full delivery capacity after theproduction changeover to the 4-series,which could nevertheless not be utiliseddue to limited demand.
“Salt is a good business, but global
competition is tough and the margins
are shrinking.To lower our transport
costs, we use new Scania trucks.”
Brothers Carlos, Francisco and Benedito
de Lima, owners of Sal Maranata in Mossoró,
Rio Grande do Norte, Brazil.
The Brazilian economy performed weakly during the year, and GDP grewinsignificantly. Even though the currencyfell by nearly 60 percent against the USdollar, trade balance problems persisted.Financing costs for hauliers remainedhigh, although interest rates improved to-ward year-end.
The Brazilian market for heavy trucksdecreased by 15 percent to 13,500 vehi-cles, compared to 15,800 vehicles in1998.
The market was characterised by ex-tremely tough competition, among otherthings due to the sharp depreciation inthe currency as well as the entry of Ivecoand Navistar in the heavy truck market.Scania’s market share amounted to 31.7percent (33.4).
The market trend in Argentina wasweak during the year. GDP declined byabout 3 percent in 1999 and the country’strade balance and central governmentbudget showed a weak trend. Despite gov-ernment subsidies to buyers of domesti-cally made vehicles, heavy truck registra-tions decreased by 25 percent andamounted to 4,200.
Scania consolidated its position as themarket leader in Argentina, increasing itsmarket share to 32.5 percent (28.6).
The Mexican truck market grew by 12percent to 14,800 during 1999. Scania’ssales in Mexico are comparatively low,
Sales of Scania trucks in Latin America
0
2,000
4,000
6,000
8,000
10,000
999796959493929190 98
Units
20
0% 20% 40% 60% 80% 100%
Argentina
Brazil
Scania Iveco Mercedes Ford Others
Scania Mercedes Volvo Ford Others
Market shares in Argentina and Brazil

21
but there are long-term prospects forgood market growth. During the year,Scania established four wholly-owneddistributors.
BusesThe demand for buses in Latin Americawas weak. Scania’s deliveries of bus chas-sis totalled 1,200 (1,700), a decrease of29 percent.
In the Brazilian bus market, demandwas very weak. The total market shrankby 40 percent, from 13,400 to 8,100 ve-hicles. Scania’s deliveries decreased byabout 40 percent to 700 bus chassis
(1,200) and its market share was un-changed at 9.0 percent. Scania’s positionin the intercity and long-distance segmentstrengthened.
In Argentina, Scania increased its mar-ket share to 14.9 percent (7.0) in a weaktotal market. Scania dominates the long-distance bus segment, but also had somesuccess in the city bus segment.
Sales in other Latin American marketsdeclined.
Industrial and marine enginesDeliveries of industrial and marine en-gines in Latin America rose to 740 units(700), due to higher demand for dieselengine-driven generators during the latterpart of the year.
Paolo Silveira,Managing Director, City Rio Project.
Sales of Scania buses in Latin America
0
500
1,000
1,500
2,000
2,500
3,000
98 999796959493929190
Units
“With new low-floor buses from Scania, we have given Rio de Janeiro’s tourists the chance to seeone of the world’s most beautiful cities in a morepleasant and convenient way.”
During 1999, Scania’sbreakthrough into thecity bus segment inBuenos Aires, Argen-tina, continued.
22
Markets in Asia, Africa and AustraliaTrucksDemand for heavy trucks was weak inmost of Scania’s other markets during1999. Scania’s order bookings decreasedto 2,600 vehicles, compared to 2,800 dur-ing 1998. In most Asian markets, pricesremained depressed due to weak demand,both for new and second-hand trucks.Asian markets, in particular, were still af-fected by the aggressive marketing andpricing of Japanese truck manufacturers.
Towards the end of 1999, however, animprovement was discernible in most ma-cro-economic indicators, and inventoriesof new trucks in most markets had fallensharply since the beginning of the year.
Sales in Asia rose by 5 percent to1,480 vehicles (1,410) and decreased inother markets to 1,300 vehicles (1,600).
In East Asia, Taiwan and Hong Kongaccounted for the heaviest demand forScania products. Strong competition, es-
pecially from Japanese manufacturers, ledto falling price levels, however, as well aslower market shares for European makes.The South Korean market remainedweak. During the year, Scania inaugurat-ed a new superstructure factory in Koreaand further expanded the distribution andservice network under its own auspices.
Demand varied between the variousmarkets in the Middle East. In Iraq, Scaniadelivered vehicles to the United Nations“Oil for Food” project, as part of the easingof sanctions approved by the UN. TheTurkish market remained weak. Scania’sdeliveries to the Israeli market increasedsharply.
The market in Australia was character-ised by new sales tax rules, which contrib-uted to a wait-and-see attitude by haul-iers on new investments in trucks. Earlyin the year, a new Scania facility was in-augurated in Melbourne.
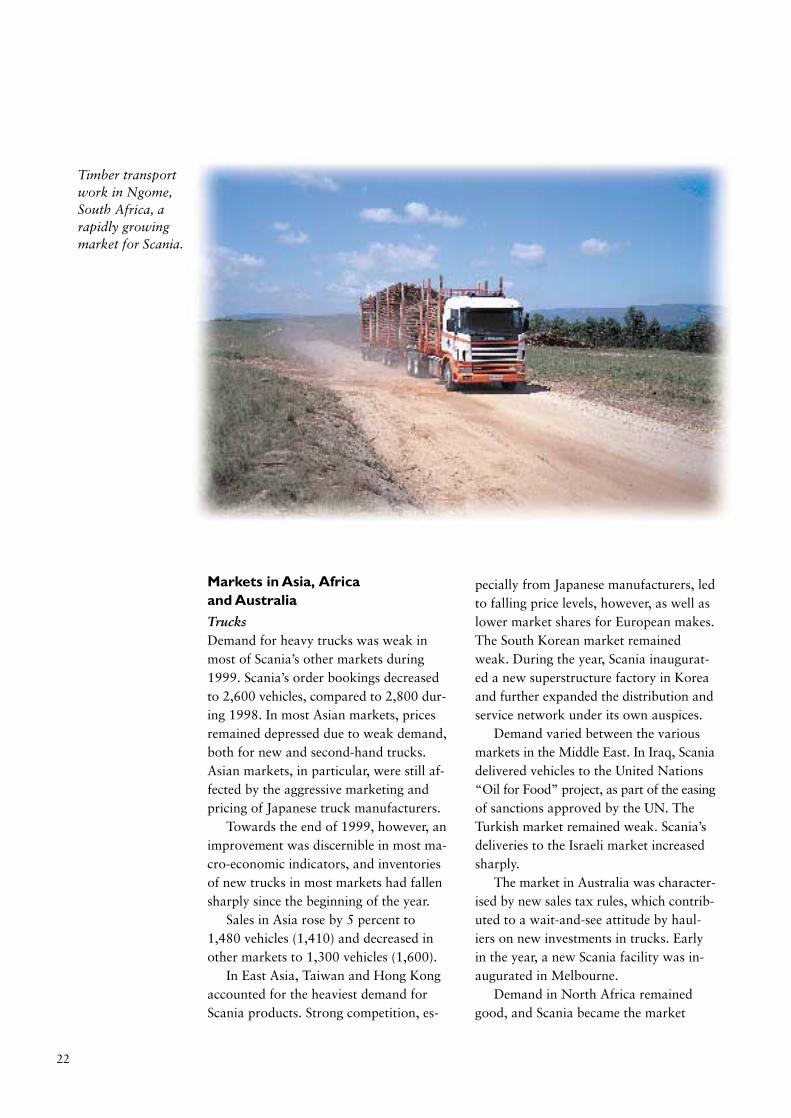
Demand in North Africa remainedgood, and Scania became the market
Timber transportwork in Ngome,South Africa, a rapidly growingmarket for Scania.

23
leader in Morocco. The South African mar-ket was weak, but showed signs of recov-ery by year-end. Scania increased its mar-ket share to 12.1 percent (7.9) during 1999.
BusesThe demand for heavy buses varied be-tween markets. Total sales amounted to520 bus chassis (580).
Taiwan and Australia were importantbus markets for Scania during 1999. InTaiwan, sales rose during the year after aperiod of weak demand.
Demand in Australia remained strong,and during 1999 Scania received an orderfor up to 120 gaspowered buses fromBrisbane.
Demand was also strong in Morocco
and Egypt. Scania made a breakthroughin the city bus market in Morocco, re-ceiving an order for 70 buses from Marr-akesh. A new service facility was also built in Morocco.
In South Africa, Scania signed agree-ments to sell 340 buses for intercity ser-vice. This is the company’s largest-everbus deal in southern Africa.
Industrial and marine enginesDeliveries of industrial and marine enginesto markets in Asia, Africa and Australiarose to 380 units (170). This change waslargely explained by the recovery of themarket in Saudi Arabia. In addition, mar-ket conditions improved somewhat in theAsian region.
Tourist coaches areScania’s largest bussegment. For the mostpart, Scania deliverschassis to which localbodywork manufac-turers add superstruc-tures, as here in NewZealand.

The pay level in Sweden rose by about5 percent, compared to about 3 percentin the Netherlands and France, calculatedin local currency. Of all production em-ployees in Europe, 75 percent are in Swe-den, 19 percent in the Netherlands and 4percent in France.
Material costs per truck produced, ex-pressed in local currency and with an un-changed specification level, declined byabout 4 percent during the year as a re-sult of component redesign and lowerpurchasing costs. Due to a changed mar-ket mix and a higher specification level,total material costs per truck increased.
Warranty costs for trucks at the factorylevel decreased, but remained at a some-what higher level than for the previousproduct range. Delivery assurance wasvery high during the year.
Depreciation was largely unchangedfrom 1998. The capital expenditure levelcontinued to fall, amounting to SEK 780 m.
Steps toward greater specialisationand production coordination continued,in response to demands for greater effi-
Production in EuropeThe pace of production remained highduring the year, as a result of strong de-mand for heavy trucks in western Europe.In all, European operations produced42,300 vehicles (41,700), of which 39,800trucks (38,900) and 2,500 buses (2,800).
Productivity, measured on a rolling12-month basis as the number of vehiclesmanufactured divided by hours worked,rose by 3 percent.
The workforce was largely unchangedduring the year. A significant proportion of Scania’s production personnel are em-ployed on time-limited contracts. This increases Scania’s ability to respond tofluctuating demand in a cost-effective,flexible way.
One important production-related goalhas been to increase volume flexibility infinal assembly. In the existing productionsystem, today it is possible within onemonth to change production volume by±10 percent in relation to the approved bas-ic production rate and change the basicrate by ±15 percent within three months.
24
Scania is a global manufacturer
Södertälje Head Office, research anddevelopment, component and enginemanufacture, truck assembly.
Falun Axle manufacture.
Silkeborg Bus assembly.
San Luís Potosí Truck andbus assembly.
Tucumán Gearbox and axle manu- facture, truck assembly.
São Paulo Engine and cab manufacture,truck and bus assembly.
Angers Truck assembly.
Zwolle/Meppel Engine and cab manufacture, truck assembly.
Katrineholm Bus and bus chassis de-velopment and manufacture.
Sibbhult Gearbox manufacture.
Slupsk Truck and bus assembly.
Luleå (Ferruform AB) Manufacture ofside and crossmembers as well as rearaxle housings.
Oskarshamn Cab manufacture.
Mexico
Sweden
Sweden
Poland
Denmark
The Netherlands
France
Argentina
Brazil

25
ciency. During the year, Scania decided on a gradual transfer of remaining cabproduction in Meppel, the Netherlands,to Oskarshamn, Sweden. The transfer ofengine and axle assembly from Zwolle,the Netherlands to Södertälje and Falun,Sweden, respectively, continued. In Octo-ber, the frame, crossmember and rear axle housing production unit in Luleå,Sweden, was turned into a limited com-pany under the name Ferruform AB. Thiscompany will compete in the market andbe able to have other customers besidesScania. In addition, the production unitfor special-purpose vehicles in Laxå, Sweden, was sold to its management.
In truck assembly, projects aimed atdeveloping standardised working meth-ods for all of Scania’s assembly plantscontinued. During 1999, among otherthings these projects focused on increasingthe proportion of trucks that go directlyfrom the assembly line to the customer, aswell as on reducing inventory costs. In ad-dition, Scania continued its streamliningof final assembly in order to achieve evenhigher delivery assurance and quality.
Production in Latin AmericaDue to the weakness of Latin Americanmarkets, the pace of production was low.
During the year, 7,200 vehicles (8,400)were produced, of which 6,000 trucks(6,700) and 1,200 buses (1,700).
An extensive action programme wasimplemented in order to adapt the costsituation to the prevailing demand andreduce manufacturing cost per vehicle.This included a continued reduction inthe workforce. During 1998–1999, thenumber of production employees declinedby nearly 23 percent.
The changeover to the 4-series at bothtruck and bus production units was com-pleted by the beginning of 1999, makingpossible a substantial improvement inproductivity.
Other elements of the programme area sharp decrease in indirect costs, inven-tory reductions and a slower pace of in-vestments.
Domestic component content in ve-hicles was increased, among other thingsto offset the effects of the Brazilian currencydevaluation. In addition, deliveries fromLatin American production units to othermarkets increased. This included the de-livery of 150 complete trucks from Brazilto western Europe.
In Mexico, Scania began assembly ofbus chassis.
Axle manufacturing inthe European produc-tion system has beenconcentrated at Scania’splant in Falun, Sweden.

Research and developmentScania’s research and development expensesduring 1999 rose to SEK 1,267 m. (1,168).R&D operations are concentrated at theScania Technical Centre in Södertälje,Sweden.
Scania’s review of its product develop-ment process, which has been under wayfor three years, entered its final phase in1999. The main purpose of the projecthas been to standardise working methodsand introduce a multidisciplinary approachto the pursuit of product development.The result is increased opportunities tosatisfy the needs of customers for cutting-edge products in a shorter time, throughoptimal utilisation of development re-sources. By year-end, 85 percent of currentprojects were being run according to thenew product development model, com-pared to 20 percent at the beginning ofthe year.
During 1999, Scania started a newproject aimed at making further develop-ment and customer-adaptation of the 4-series more efficient.
In September, Scania unveiled a proto-type concept vehicle for the decade begin-ning in 2010. This concept shows the po-tential for reducing heavy truck traffic byincreasing the capacity of each vehicle by50 percent compared to the trucks of to-day. The concept vehicle features advancedaerodynamics and other forward-lookingsolutions representing substantial environ-mental improvements due to enhanced fuelconsumption and safety improvements dueto reduced stopping distances, for example.
During 1999, there were intensifiedinvestments in Scania-specific electronicand information systems. Scania’s focuson service and maintenance is behind size-able development work on analytic anddiagnostic tools. The purpose of thesetools is to inform drivers and hauliers con-
ProcurementThe programme that Scania began during1997 to streamline its procurement op-erations was largely completed during theyear. This has included reorganising theinternal purchasing process and optimis-ing supplier structure. Regular activitiesto streamline Scania’s procurement workwill continue, however.
The goal of the restructuring pro-gramme has been to lower the long-termcosts of materials, components and com-ponent systems. Scania is working togetherwith its suppliers to lower its costs andcreate room to improve profitability forboth parties. The ambition is to allowsuppliers to assume greater responsibilityfor the components or systems that theydeliver and to concentrate Scania’s ownproduct development work on areas unique to Scania’s products and brandname. Suppliers should preferably be ableto furnish Scania’s production units withlocally manufactured components.
A total of 13 different product groups– including steel and pipes, wiring, forgedcomponents and lighting – have beenidentified and are or will be subject to areview. One example is Scania’s collabo-ration with a Finnish cable supplier,which will be responsible for delivery ofwiring to all Scania assembly plants world-wide and take an active part in productdevelopment.
Since the programme started, the num-ber of sub-contractors has been morethan halved.
During 1999, the Procurement and Industrial Development unit also workedwith an IT project aimed at integrationbetween the control systems at Scania’sproduction plants and those of the mostimportant sub-contractors. A commonnetwork is expected to go into operationduring 2000.
26

engines is focusing on additional improve-ments in environmental characteristicsand performance, in preparation for futureenvironmental standards. During 1999,Scania launched a broad range of low-emission engines for distribution and con-struction vehicles as well as for long haul-age. All engines fulfil the new Euro 3standard, which will be legally requiredfor new vehicles from 2001 onward. Scaniaalso unveiled a gas-powered engine thatcomplements its range of engines for al-ternative fuels.
During 1999, Scania introduced thesecond generation of electronically con-trolled disc brake systems, which allowautomatic adjustment of braking powerbetween the various truck axles and be-tween the tractor unit and the trailer. Thisachieves more uniform and safer brakingfor the entire vehicle and a longer servicelife for brake components.
tinuously and in good time of a vehicle’smaintenance and repair needs. This allowsmore efficient servicing procedures and ahigh degree of utilisation. Unplanned stop-pages can be avoided and service inputcan take place along the ordinary route of the vehicle.
As one element in this effort, in March1999 Scania established Scania Infotro-nics AB, a cutting-edge company in vehi-cle electronics. This company, operated inpartnership with Mecel AB, will designIT-based systems and functions where theycan create genuine customer benefit. Im-proved operating economy and logisticsas well as reduced environmental impactand greater road safety are prioritised de-velopment areas. Scania Infotronics alsostarted collaboration with the Ericsson tele-communications group to develop Internet-based solutions for the transport sector.
The task of further refining Scania’s
27
Scania’s conceptvehicle for the2010s shows thepotential for in-creased transportcapacity for heavytrucks in futuretraffic.
vehicles more intensively. This creates agreater need for service, despite the im-proved quality of the vehicles. Meanwhilehauliers are focusing to a greater extenton their core business, logistics.
The service-related market is morehighly developed in Europe than in Scania’sother markets. Owing to economic growth,deregulation of transport markets and theemergence of international transportcompanies, other markets are moving inthe same direction as European ones interms of customer and market structure.This also increases the demand for services.
Expanding the range of servicesDuring 1999, Scania continued to expandits range of services. The development ofnew services is strategically important toScania and takes place at Group level in
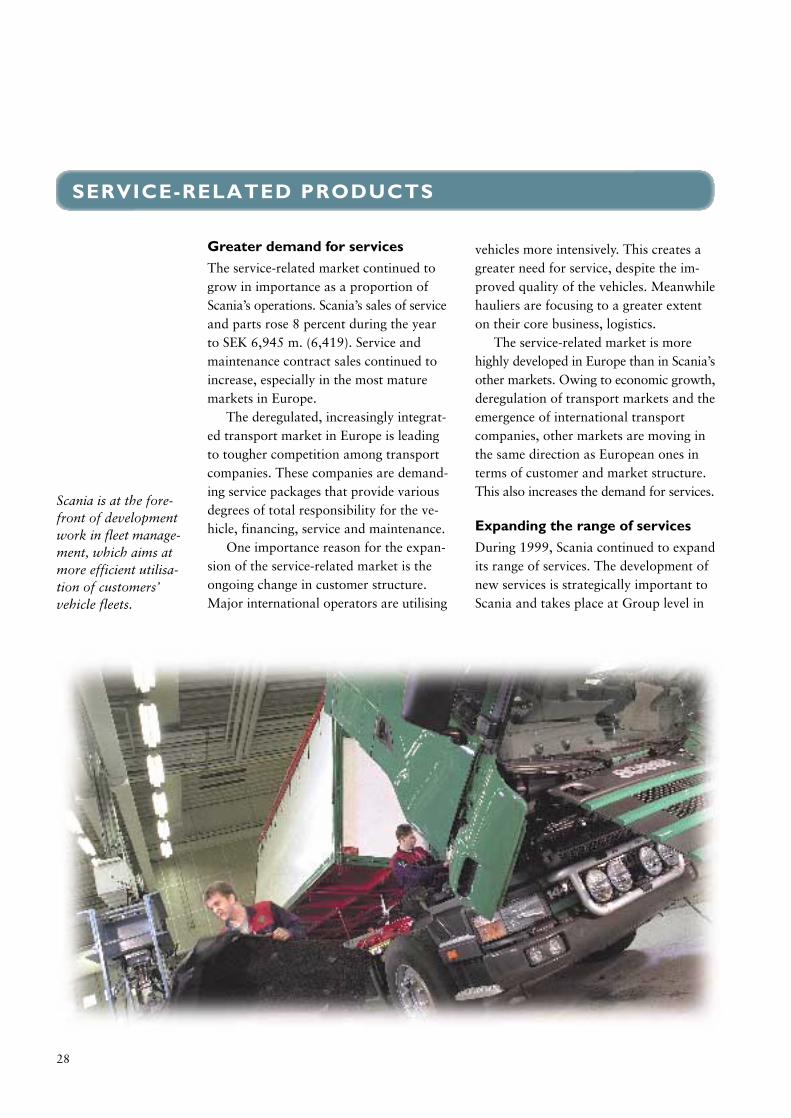
Greater demand for servicesThe service-related market continued togrow in importance as a proportion ofScania’s operations. Scania’s sales of serviceand parts rose 8 percent during the yearto SEK 6,945 m. (6,419). Service andmaintenance contract sales continued toincrease, especially in the most maturemarkets in Europe.
The deregulated, increasingly integrat-ed transport market in Europe is leadingto tougher competition among transportcompanies. These companies are demand-ing service packages that provide variousdegrees of total responsibility for the ve-hicle, financing, service and maintenance.
One importance reason for the expan-sion of the service-related market is theongoing change in customer structure.Major international operators are utilising
28
SERVICE-RELATED PRODUCTS
Scania is at the fore-front of developmentwork in fleet manage-ment, which aims atmore efficient utilisa-tion of customers’ vehicle fleets.

29
collaboration with local markets. Servicesare packaged by marketing companies tofit specific customer needs.
Scania’s service offering has shown verygood growth. An average of 25 percent ofnew truck sales in Europe include a serviceand maintenance and/or financing package.
As one element in its strategy of satis-fying the customer’s total transport needs,Scania initiated its Dealer OperatingStandards (DOS) project. The purpose ofthe project is to create a high common level of knowledge, quality and productivi-ty in Scania’s European service and distrib-ution network. The project includes 18markets, 1,000 local distributors and15,000 people. For example, it encom-passes uniform working methods andelapsed times for specified tasks. Custom-ers must receive the same high level ofservice from Scania no matter where theyare. During 1999, the project continuedand some fifty local distributors wereDOS certified. The target is to have eval-uated most dealerships according to DOSstandards by mid-2000.
One of Scania’s priority service areasis fleet management, which aims at makingcustomer utilisation of vehicle fleets moreefficient. During 1999, Scania launchedan innovative, flexible interface that ena-
bles existing fleet management systems inthe market to retrieve and process infor-mation from a Scania vehicle’s computernetwork, such as its fuel consumption.
In the future, an expanded range ofservices available via Internet and webtechnology will increase the availabilityof services for drivers on the road.
To assure customers the availability oftheir vehicle, for some years Scania hasoffered Scania Assistance. This service ena-bles customers to get help round the clock,every day of the year, in their own language.By means of regional call centres in a num-ber of locations around Europe, the Scaniaorganisation’s overall efforts are efficientlycoordinated in case of unplanned stoppages.
During the 1990s, Scania developed abusiness concept in which it assumes re-sponsibility for the customer’s access totransport capacity. Scania owns the ve-hicle and makes it available according tothe requirements of the transport assign-ment. Scania thus sells financing, mainte-nance and repairs as well as other servicessuch as administration and insurance.
Scania is successfully engaged in thetruck rental business. Used vehicles in itsinventory are also used for short-termrentals, thereby yielding revenues to Scaniawhile enabling the customer to handle peaks in transport demand.
Expanded organisationThe expansion of Scania’s sales and ser-vice organisation continued during 1999.In addition to acquiring its distributors inItaly, Norway, Finland and Latvia, Scaniainaugurated a new distribution and ser-vice unit in Poland, for example. Totalnet capital expenditures (acquisitions andnew facilities) in the European marketingorganisation amounted to SEK 1,600 m.during 1999.
Scania also expanded its independentdistribution and service network.
Scania Assistanceenables customers tominimise downtimeand get help roundthe clock, all yearround.

30
Lending volume continued to increase during 1999. This volume growth resultedfrom continued strong demand for Scania’sproducts and integrated financing services,combined with expansion in operationsduring 1999 due to acquisition of the Italian finance company.
Year-end 1999 financing volume amounted to SEK 15,300 m. (12,300). In unit terms, during the year 8,560 newtrucks, 220 new buses and 2,010 usedScania vehicles were financed.
Of the total loan portfolio, 40 percentconsisted of operating leases and 21 per-cent financial leases. The remaining 39percent represented loan financing. Thenumber of contracts in the portfolio atyear-end totalled about 33,000 (27,700).
The income of customer finance oper-ations totalled SEK 140 m. (91). This wasequivalent to an operating income of 1.01percent of the portfolio and represents asubstantial improvement from 0.89 per-cent in 1998.
The improved profit margin was main-ly due to a decline in overhead from 1.11percent to 0.94 percent of the portfolio.This was the result of economies of scaledue to increased lending volume.
The effect of credit losses on earningswas SEK –57 m (–44). Actual credit lossesduring 1999 amounted to SEK 53 m. (14).
The increase in actual credit losses du-ring 1999 was largely a direct consequence
of the write-offs for possible losses in eas-tern Europe during the year. At year-end,the total reserve for possible credit lossesamounted to SEK 212 m.
Total year-end receivables outstandingin central and eastern Europe (excludingPoland and the Czech Republic) was SEK560 m., of which 12 percent consisted ofreserved funds. Total reserved fundsamounted to 1.4 percent (1.7) of totallending volume.
Given its increased customer financeexposure, Scania must devote efforts tocontinuous credit evaluations and moni-toring of financed contracts. Scania’s totalcommitments are monitored at Group leveland risks are limited by establishing ceilingson exposure per country and customer.During 1999, Scania continued to strength-en its resources for credit evaluation.
During the year, human resource devel-opment efforts intensified. There werecontinuous exchanges of personnel, bothbetween finance companies and betweendifferent disciplines in Scania finance op-erations.
EuropeIn Europe, customer financing mainly takesplace through nine Scania-owned financecompanies that cover Great Britain, France,Germany, Italy, Belgium, Poland, the CzechRepublic and the Nordic region plus thecountries in central and eastern Europe.
In those markets where Scania pursuesfinance company operations, the propor-tion of trucks financed via its own financecompanies averaged 33 percent (36).
Scania’s strategy for its customer fi-nance operations is to work in local mar-kets around Europe, and thus close tocustomers. Working in an integrated way
CUSTOMER FINANCING
Customer financing provides an important contributionto Scania’s earnings and growth, both as a form of mar-keting and sales support for the company’s productsand owing to the profitability of the actual financingoperations. It also creates industrial synergies by in-creasing the sales of service-related products for thevehicles provided with financing contracts.

31
together with distributors results in localknow-how and proximity to the customer,which is a prerequisite for the decentralisedcredit management process that is applied.This system also creates opportunities fora high degree of customer adaptation andcustomer-oriented product development.
To a great extent, customer financingunder Scania’s own auspices is a prerequi-site for sales in central and eastern Europe.
Latin AmericaScania offers financing in Latin Americaprimarily on the basis of collaborationwith international lenders. Finance opera-tions under Scania’s own auspices grewduring 1999 but do not yet represent alarge enough volume to be separately re-ported.
0
3,000
6,000
9,000
12,000
15,000
SEK m.
9998979695
Total assets, finance companies
18,000
In the Brazilian market, Scania alsooffers a customer-financed savings pro-gramme, in which customers are organisedinto consortia. Through regular savingsin consortia, the customer is guaranteedthe allocation of a vehicle within a certainpredetermined period. During 1999, 42percent of sales in Brazil occurred viasuch financing. This form of financingstabilises vehicle sales during recessions.
Other marketsDuring the year, customer finance opera-tions under Scania’s own auspices wereestablished in South Korea. In 2000,continued expansion is planned, both viaan increased range of financial servicesand through efforts in new markets.
100
0
200
300
400
500
600
700
800
900
1,000
95 96 97 98 99
SEK m. Revenues
Revenues/Operating income,finance companies
Operating income
Scania offers the customer a package solution in which financing is often animportant component.

32
OUR EMPLOYEES
Trust – a prerequisite for“coordinated independence”Scania’s future success will depend on having skilled, motivated, responsible em-ployees who all pull in the same direction.
Coordinated independence is a guid-ing principle at Scania. Overall principlesand rules are drafted by all departments.This will enable the company to take ad-vantage of quality, productivity and flexi-bility in an effective way. Meanwhile it isimportant to delegate responsibility andauthority far down in the organisation.Scania relies on its employees to be will-ing and able to take responsibility for re-sults and growth.
Scania managers must motivateand develop other employeesNew conditions in the world around Scania are putting heavier demands onboth managers and other employees.Smoothly functioning leadership focusedon motivating, developing and rewardingScania’s employees is critical if Scania is
to remain competitive. This is why con-tinuous management development is needed.
Management development occurs in anumber of different ways at Scania. Projectwork, training and mobility of employeesbetween different operations and units areexamples of steps to improve the leadershipskills of executives and other managers.
During 1999, Scania invested heavilyin management training. A new internalprogramme in this field was developedand introduced. The focus of the pro-gramme is that personal leadership is based on self-awareness, communication,stress management and group develop-ment. During the year, about 250 man-agers and executives participated in va-rious activities in this programme, calledthe “basic management developmentblock”. In 1999, the programme was im-plemented in Swedish. The ambition is to internationalise it during 2000.
The Scania Marketing Academy is anacademically accredited training pro-gramme developed and implemented incollaboration with the Stockholm Schoolof Economics among others. Its purposeis to strengthen the business skills of Sca-nia’s marketing organisation, develop theleadership talents of individuals and en-hance Scania’s corporate culture. Twenty-five future and established managers in keypositions received certificates of comple-tion from the Scania Marketing Academyduring 1999.
Continuous human resource development is essential ifScania is to remain a competitive and profitable com-pany in the future.To make this possible, Scania mustoffer an attractive and effective workplace for demand-ing people.
Managers at Scania must motivate,develop and reward other employees.

33
In addition to the above-mentionedmanagement development activities, whichare initiated and coordinated at Group level,a large number of development activitiesoperate locally in different units.
Encouraging employees totake greater responsibilityScania’s employees are encouraged toseek new, future-oriented solutions totasks, take responsibility and make deci-sions on their own. Human resource de-velopment is supported by a number ofmethods, among them job enrichment,job rotation, training, project work andproject management.
The Scania Professional programmetrains employees from the distribution organisation in marketing, parts manage-ment and workshop services. This pro-gramme includes courses on Dealer Op-erating Standards (DOS) and in Scania’sservice offering. During 1999, 180 peoplewere trained at Scania Professional.
The internal Personnel Exchange Pro-gramme (PEP), in which employees workin another country within the Scania or-ganisation for up to one year, is an exam-ple of a programme designed to increasemobility between different operations andcountries. The scale of the programme in-creased during the year.
In 1999, employees at Scania partici-pated in an average of 14 days of trainingactivities. Internal mobility during theyear was about 15 percent.
Recruitment for continuedleadershipRecruitment is an essential element ofScania’s growth strategy and of its ambi-tion to be a technical development leaderin its product areas. During the year, Sca-nia continued its collaboration with edu-cational institutions in various countriesin research and development, recruitment
and trainee work. The industrial researchprogramme enables graduate engineers tocombine jobs at Scania with research atthe doctoral level.
Since 1941, Scania has operated atechnical upper secondary school next toits facility in Södertälje, Sweden. Scania-affiliated industrial schools are also foundin the Netherlands and Brazil.
Employee surveys:a key management toolDuring 1999, Scania conducted employeesurveys among employees of its develop-ment and procurement departments andelsewhere. These surveys covered suchmatters as working conditions, personaljob situation, job assignments and termsof employment.
Those employees who were involvedin newly started projects stated that theywere strongly positive to their job situa-tion. In areas where there is room for im-provement, processes of change havebeen started.
Bonus systems that motivateAs a result of the introduction of flexibleworking hours in 1996, there are variousearnings-based bonus systems at Scania.The amounts paid depend on predeter-mined delivery assurance and productivitytargets. In Sweden, funds are transferredto a foundation in which employees holda share. The foundation owned at year-end 0.3 percent of Scania’s shares.
Scania pays varying forms of earnings-based bonuses in different countries. InSweden and France, they measure deliveryassurance and productivity. In Latin America, they measure production, absen-teeism, market leadership, establishmentof teamwork and improvement efforts.
Number of employees(right-hand scale)
Number of vehicles produced (left-hand scale)
98 999796959493929190
Number of vehicles produced and employees, Latin American operations
0
1,000
2,000
3,000
4,000
5,000
0
5,000
10,000
15,000
Vehicles Employees
0
10,000
20,000
30,000
40,000
98 999796959493929190
Number of production employees (right-hand scale)
Number of vehicles produced (left-hand scale)
Number of vehicles produced andproduction employees, European operations
0
3,000
6,000
9,000
12,000
15,000
Vehicles Employees
34
SCANIA AND THE ENVIRONMENT
Environmental strategyEnvironmental work is integrated intoScania’s operations in the same way asquality, training and economic issues, forexample. The Scania Environmental Board,Environmental Committee and local envi-ronmental coordinators have advisoryand supportive roles throughout the Scaniaorganisation. The Environmental Board isthe highest decision-making body in its field and deals with issues of strategic im-portance to Scania. These then becomepart of Group decisions, regardless ofwhether they concern marketing, produc-tion or communications issues.
Management systemsScania’s entire industrial system works un-der an environmental management systemthat is certified according to ISO 14001international standards. Efforts have alsobegun to integrate the distribution sys-tem, in compliance with both ISO 9002
quality management and ISO 14001 en-vironmental management standards.
Reporting Since 1996, Scania has worked with Group-wide environmental objectives and tar-gets. During 1999, on the basis of Scania’senvironmental targets, environmental andfinancial managers have drafted commondefinitions and reporting procedures toimprove the reporting of environmentaleconomics. The first step was to focus oncosts and revenues in manufacturing op-erations. This work will continue, alsoembracing clearer definitions of environ-mentally related investments and R&D,as well as how large a proportion of totalsales can be related to products with thehighest level of environmental performance.
Research and developmentMost of a vehicle’s environmental impactoccurs during its service life. This is whyScania’s development and design work isdevoted to functional characteristics thatresult in improved fuel consumption andreduced exhaust emissions. More efficientengines and a reduction of weight as wellas rolling and air resistance are factors ofgreat importance to the final outcome.Aside from this, there is obviously room
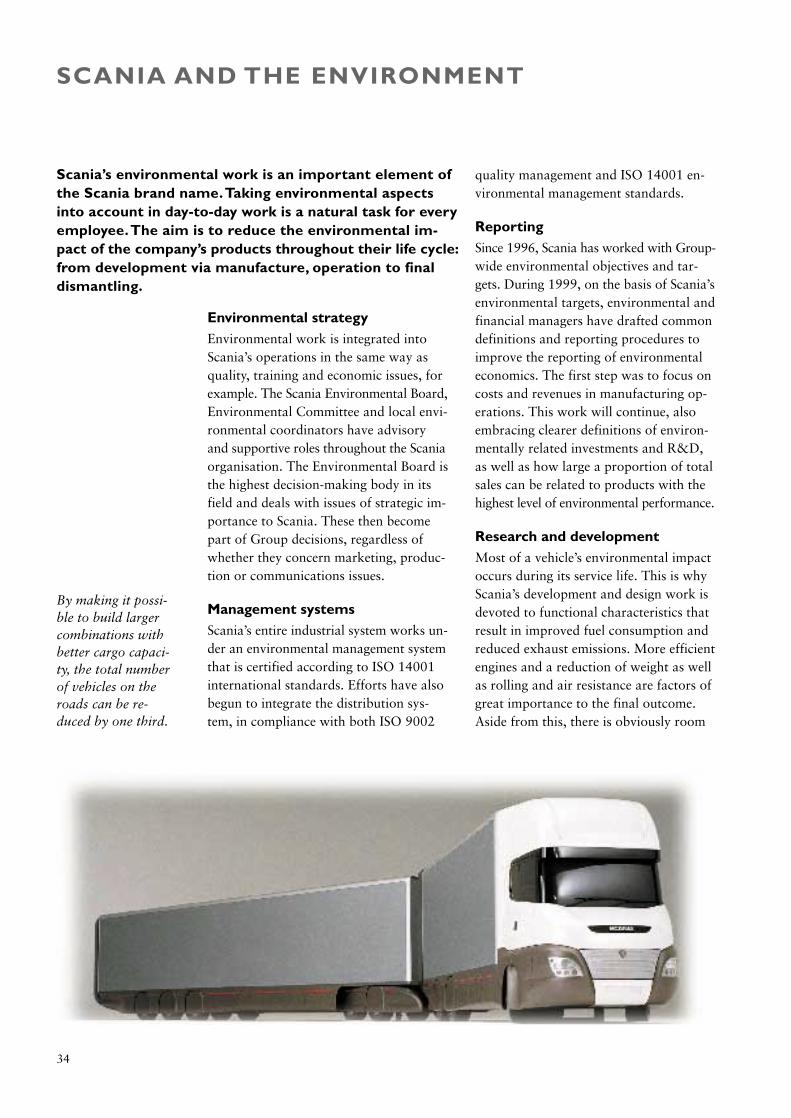
Scania’s environmental work is an important element ofthe Scania brand name.Taking environmental aspectsinto account in day-to-day work is a natural task for everyemployee.The aim is to reduce the environmental im-pact of the company’s products throughout their life cycle:from development via manufacture, operation to finaldismantling.
By making it possi-ble to build largercombinations withbetter cargo capaci-ty, the total numberof vehicles on theroads can be re-duced by one third.
35
for environmental improvements throughcareful choice of materials and improve-ments in production processes.
Alternative fuelsThe main area of Scania’s developmentwork on alternative-fuel vehicles is buses,where there is already clear and stable demand today. The focus is primarily on ethanol and gaseous fuels.
One sixth of the city buses sold during1999 were powered by alternative fuels.This was equivalent to about 0.5 percentof Scania’s total sales.
Scania Busser in Silkeborg, Denmark,is equipping a Scania MidiCity bus tooperate on fuel cells. According to plans,it will be ready for test driving during thesecond half of 2000. This work is part ofan EU-financed project, with Scania asone of four companies participating. Theaim is to increase our knowledge of thepotential of fuel cells.
New productsScania offers a complete range of enginesthat meet the EU’s Euro 3 emissions stan-dards. All the new engines can be com-
bined with Opticruise, Scania’s automatedgearchanging system, which is designedto optimise fuel economy and minimiseexhaust emissions.
Environmental declarationSince late 1999, Scania has provided adeclaration that gives the owner informationabout the environmental characteristicsof trucks, such as resource consumptionduring production, exhaust emissions andnoise levels as well as information aboutrecycling. The declaration also providesadvice and instructions for service andmaintenance as well as information on howthe truck should be used in order to havethe least possible environmental impact.
Operating permitsThe production system has an impact onthe external environment, mainly in theform of emissions into the air, dischargesinto the water and the creation of solidwastes and noise. Most of Scania’s facilitiesaround the world are required to haveoperating permits. This is true in Sweden,France, Denmark, the Netherlands, Braziland to some extent Poland. The plants inArgentina and Mexico operate accordingto the respective environmental legislationof these countries.
During 1999, no incidents were report-ed which caused any significant environ-mental impact and thereby higher operat-ing expenses.
In Sweden, Scania’s operations at allsix of its production units require permitsunder the Environmental Code. Opera-tions requiring permits employ 9,900 people. In recent years, all productionunits have been examined under the pro-visions of the Swedish EnvironmentalProtection Act in order to receive newpermits.
During 1999, Scania’s plant in Sibb-hult was granted permission to increaseits production volume. In addition, Scania’s
Environmental PolicyAs a global manufacturer and distributor of heavy commercial vehicles,engines and related services, Scania is committed to develop productsthat pollute less and consume less energy, raw materials and chemicalsduring their life cycle.
In order to achieve this:• we strive to maintain a lead in commercially applicable technologies
• we work well within legal demands and promote internationallyharmonised, effective environmental requirements
• we prevent and continuously reduce the environmental impactthrough development of products, services and production processes
• we take the environmental aspects and objectives into account in ourdaily work
• we have an open and regular communication with our interest groupsregarding our environmental work
By this we contribute to economical and ecological advantages for ourcustomers and for society. Proactive environmental work is therefore ofvital importance to Scania.

36
plants in Oskarshamn and Luleå havebeen notified of decisions related to loweremissions of organic solvents and emis-sions into waterways, respectively. Theformer decision was connected to theconstruction of a new finishing paint-shop for cabs.
At Scania’s production units in Söder-tälje, a report was submitted according toa permit decision concerning such mattersas reduced nitrogen oxide emissions fromengine testing labs and improved finaltreatment of wastewater. In Södertälje,
Raw material use
Other 10%
Steel 67%
Cast iron 23%
97 98 99 04
200,000
100,000
0
300,000
500,000
700,000
900,000
400,000
600,000
800,000
1,000,000
Water use
Cubic metres Cubic metres
2
0
4
6
8
10
12
14
16
18
20
24
22
Cubic metresper vehicle (left-hand scale)
Total, cubic metres(right-hand scale)
Target for 2004
96
During 1999, water use was about 600,000cubic metres, equivalent to 13 cubic metresor a cost of SEK 290 per vehicle.
Kgper vehicle(left-hand scale)
Total, tonnes (right-hand scale)
Target for 2001
0
2
4
6
8
10
12
14
16
Kg Tonnes
Emissions of organic solvents
989796 99 010
100
200
300
400
500
600
During 1999, organic solvent emissions to-talled about 460 tonnes, or 9 kg per vehicle.
0
50
100
150
200
250
Wastes sent to landfills
97 98 99 040
1,000
2,000
3,000
4,000
5,000
6,000
7,000
8,000
9,000
10,000Kg Tonnes
96
Kgper vehicle(left-hand scale)
Total, tonnes(right-hand scale)
Target for 2004
During 1999, waste quantities amounted to83,000 tonnes, equivalent to a total cost ofSEK 17 m. Most of this waste is recycled,which means revenues of SEK 18 m. Theamount of wastes sent to landfills totalledabout 4,700 tonnes, or 95 kg per vehicle.
Carbon dioxide emissions related to energy use
Energy use, Carbon dioxide GWh emissions, Ktonnes
1999 1996 1999 1996
Electricity 350 360 22 23
District heat 60 130 4 9
Fossil fuels 190 200 49 51
Total 600 690 75 83
Per vehicle 12 MWh 1.5 tonnes
In 1999, carbon dioxide emissions from Scania’s production amounted to 1.5 tonnesper vehicle, or a total of 75,000 tonnes.
MWhper vehicle(left-hand scale)
Total, GWh (right-hand scale)
Target for 200410
0 0
20
Energy use
12
14
16
18
8
6
4
2
400
500
600
800
300
200
100
700
9796 98 99 04
MWh GWh
During 1999, energy use totalled about600,000 GWh, or some 12 MWh per vehicle.The total cost amounted to SEK 160 m.
and Zwolle/Meppel (the Netherlands), stepsare under way to reduce noise and there-by fulfil stricter regulatory requirements.
Production in figuresDuring 1999, total costs for raw material,chemical, energy and water use were aboutSEK 1,620 m., which is equivalent to 3percent of Scania’s total sales.
During 1999, Scania invested SEK1,880 m. in property plant and equip-ment, of which SEK 45 m. are classifiedas environmental investments.
In 1999, total raw material use (excludingpurchased components) was about 170,000tonnes, or 3.4 tonnes per vehicle. The totalcost amounted to SEK 1,330 m.

37
Environmental targets Fullfilmentfor 1999 (Base year 1996) of targets
• All Scania operations in the industrial system shall complete the implementation of environ-mental management systems and obtain ISO 14001 certification.
• All Scania employees in the industrial system shall have received environmental training relevant to their work.
• At least 75 percent of Scania employees andcustomers shall be satisfied with the company’swork related to environmental issues.
• The ongoing evaluation of the degree of material and component recyclability in Scania trucks and buses shall be completed.
• A method known as “design for environment” shall be available and implemented in a pilot project.
• Current efforts to create guidelines for intro-ducing environmental management systems at Scania repair and service workshops shall be completed.
• Phase-out plans shall be devised for black-listed substances used in production process-es (supplies).
• Energy consumption per manufactured unit shall be reduced by 10 percent.
• Water consumption per manufactured unit shall be reduced by 10 percent.
• The quantity of wastes sent to landfills shall be reduced by 20 percent per manufactured unit.
• A procedure shall be developed for preventing and reducing the consequences of accidents, operational disruptions and soil contamination.
Environmental targets for 2000–2004
• Guidelines shall be established during 2000 for handling the environmental aspects of Scania’s knocked-down (KD) kit assembly plants.
• A procedure shall be drafted during 2000 for investiga-tions of land and groundwater in order to identify possibleenvironmental burden by 2001.
• The total flow of packaging materials in and out of Scania shall be analysed during 2000.
• Dismantling instructions for Scania trucks and buses shall be available during 2000.
• A purchase structuring project shall be conducted during 2000 in order to reduce the amount and range of chemicals.
• A chemicals “whitelist” to facilitate the choice of chemicals shall be introduced during 2000.
• Phase-out plans shall be established during 2000 for blacklisted substances in purchased components and materials.
• The use of energy shall be reduced to 10 MWh per vehicleproduced by 2004.
• The use of water shall be reduced to 10 cubic metresper vehicle produced by 2004.
• The amount of waste deposited at landfills shall be reduced to 50 kg per vehicle produced by 2004.
• A procedure shall be developed during 2000 for control and follow-up of accidents and abnormal operations, including classification systems and reporting procedures.

38
SalesThe Scania Group sold 50,414 (49,670)trucks and buses, an increase of 1 per-cent. In monetary terms, sales rose by 4percent to SEK 47,110 m. (45,312). Salesof Scania products rose by 5 percent.
Operating incomeThe Scania Group’s operating incomeamounted to SEK 5,045 m. (3,592), anincrease of 40 percent.
Operating income in European opera-tions rose by 27 percent to SEK 4,983 m.(3,913). Earnings were favourably influ-enced by 6 percent higher unit sales oftrucks and buses and positive currencyrate effects of about SEK 250 m. Higherproductivity, together with lower warran-ty expenses, also contributed to the earn-ings improvement. Sales of service-relatedproducts rose by 11 percent.
During 1999, the costs of activities related to changes in Scania’s ownershipstructure lowered earnings by more thanSEK 100 m.
Investments in the sales and distribu-tion network continued during 1999. The net amount of acquired and divestedcompanies accounted for SEK 715 m. ofScania’s revenues and SEK 221 m. of op-erating income during the year.
Operating income in Latin Americanoperations amounted to SEK –328 m. (–622). During 1998, non-recurring itemshad a negative impact of about SEK 500m. on operating income. The deteriora-tion in underlying earnings is explainedby lower unit sales and lower vehiclemargins, largely due to the Brazilian de-valuation. This was offset by an improvedcost situation during the latter part of theyear, due to the cost adjustment program-me implemented to date, and to some ex-tent due to a non-recurring effect relatedto the Brazilian devaluation.
Operating income in European cus-
FINANCIAL REVIEW
Number of vehicles soldby market area
Units 1999 1998 1997
Trucks
Western Europe 36,106 32,686 26,756
Central and eastern Europe 1,551 2,237 1,833
Europe 37,657 34,923 28,589
Latin America 6,253 7,621 9,649
Asia 1,481 1,410 3,096
Other markets 1,260 1,599 1,058
Total trucks 46,651 45,553 42,392
Buses
Western Europe 1,935 1,731 1,595
Central and eastern Europe 67 106 95
Europe 2,002 1,837 1,690
Latin America 1,237 1,697 1,829
Asia 160 78 308
Other markets 364 505 757
Total buses 3,763 4,117 4,584
Total vehicles 50,414 49,670 46,976
Sales by product
SEK m. 1999 1998 1997
Trucks 27,888 27,092 24,005
Buses 3,601 3,548 3,251
Engines 444 398 392
Service-related products 6,945 6,419 5,799
Used vehicles etc 2,850 2,218 1,640
Scania products 41,728 39,675 35,087
SvenskaVolkswagen products 5,382 5,637 4,632
Total 47,110 45,312 39,719
Sales by market area
SEK m. 1999 1998 1997
Western Europe 33,249 28,962 23,102
Central andeastern Europe 1,330 1,814 1,398
Europe total 34,579 30,776 24,500
Latin America 4,247 5,974 6,798
Asia 1,118 1,018 1,932
Other markets 1,784 1,907 1,857
Total Scania products 41,728 39,675 35,087

39
tomer finance operations rose to SEK 140m. (91) as a consequence of higher financ-ing volume and thereby lower administra-tive cost per contract. Operating incomefor Svenska Volkswagen products amount-ed to SEK 250 m. (250).
Financial income and expensesNet financial items totalled SEK –545 m.(–378). This deterioration was attributa-ble to Latin American operations, due tonegative cash flows, higher interest ratesand translation effects of interest-bearingitems in the balance sheet connected tothe devaluation in Brazil.
TaxesThe Scania Group’s tax expenses wereequivalent to 30 (30) percent of incomeafter financial items.
Cash flowsScania’s cash flows from operating activi-ties, excluding customer finance opera-tions, amounted to SEK 476 m. (1,797).Excluding acquisitions of companies, theScania Group’s cash flows during 1999totalled SEK 1.6 billion. Higher volume,especially during the fourth quarter, to-gether with vertical integration, led tosubstantially higher tied-up working capital. This was partly offset by a lowerunderlying rate of capital expenditurescompared to 1998.
Customer finance operations expand-ed by SEK 2,708 m. Financing volume,including acquisitions and currency ratechanges, increased by about SEK 3 billion.
Net indebtedness and refinancingNet indebtedness, excluding net borrow-ings of customer finance operations, in-creased by SEK 1,710 m. to SEK 8,232 m.(6,522). Net indebtedness as a ratio ofshareholders’ equity rose to 0.61 (0.55).Net indebtedness including customer
Operating margin
% 1999 1998 1997
Europeanoperations 13.0 11.2 7.9
Latin Americanoperations –7.2 –10.8 5.8
Scania products 11.5 8.4 7.9
Svenska Volkswagenproducts 4.6 4.4 5.6
Total 10.7 7.9 7.7
Sales
Number of vehicles 1999 1998 1997
Europeanoperations 42,919 40,375 35,521
Latin Americanoperations 7,495 9,295 11,455
Total Scaniavehicles sold 50,414 49,670 46,976
Sales value
SEK m. 1999 1998 1997
Europeanoperations 38,210 35,072 29,061
Latin Americanoperations 4,560 6,151 6,973
Internal sales –1,042 –1,548 –947
Scania products 41,728 39,675 35,087
Svenska Volkswagenproducts 5,382 5,637 4,632
Total 47,110 45,312 39,719
Operating income
SEK m. 1999 1998 1997
Europeanoperations 4,983 3,913 2,309
Latin Americanoperations –328 –662 407
Customer financingoperations 140 91 73
Scania products 4,795 3,342 2,789
Svenska Volkswagenproducts 250 250 258
Total 5,045 3,592 3,047
Sales and earnings by area of operations

40
finance operations totalled SEK 21,677m. (17,505).
Scania has a committed revolving cred-it facility of USD 1,850 m. from an inter-national banking syndicate that expires inDecember 2004. At year-end 1999, USD570 m. (340) of this facility was being ut-ilised.
The Group has a medium-term noteprogramme, under which Scania can issuenotes and bonds with maturities rangingfrom one to ten years. At year-end, themaximum amount was SEK 7,000 m. andSEK 4,580 m. worth of such debt securi-ties had been issued under the programme.
Interest and credit riskScania’s policy concerning interest raterisk is that the duration of its loan port-folio should normally be 6 months butthat maturities may be allowed to varyfrom 0 to 24 months. One exception isScania’s finance companies, in which thefixed interest period on loans is matchedwith the fixed interest period on assets.
During 1999, the average funding costwas 5.8 percent (5.5). The average fixedinterest period on Scania’s loan portfolio(excluding finance companies) was be-tween 3 and 5 months. At year-end, theaverage fixed interest period was 3 months.
Derivative instruments are used to manage interest rate risks within theGroup. All the above information includesthe effects of these derivatives. Manage-ment of credit risks that arise in Scania’streasury unit, among other things wheninvesting liquid assets and engaging inderivatives trading, is regulated in Scania’s financial policy. Transactions take placeonly within established limits and withcarefully selected, creditworthy counter-parties.
CurrenciesNet currency transaction exposure during1999 was SEK 14.7 billion. The largestinflow currencies were EUR along withUSD and GBP. Based on the 1999 geo-graphic breakdown of revenues and ex-penses, a one percent change in the Swed-ish krona would change operating incomeby about SEK 147 m. on a full-year basis.Currency exposure in operating incomeby region is presented in Note 26 on page 54.
Scania’s policy is to hedge its net cur-rency transaction exposure during a peri-od of time equivalent to the projected orderbook until the date of payment.This normally means a hedging period of 3 to 4 months. However, the hedging period is allowed to vary between 0 and12 months.
Hedging of currency flows
GBP/SEK USD/SEK AUD/SEKQuarter Volume Rate* Volume Rate* Volume Rate*
Q1** 2000 26.0 13.22 40.0 8.11 10.0 5.35
Q2 2000 30.0 13.18 30.0 8.03 9.0 5.40
Q3 2000 20.0 13.31 – – – –
Q4 2000 – – – – – –
Total 76.0 70.0 19.0
Rate on balance sheet date 31 Dec. 99 13.80 8.53 5.56
Unrealised gain/loss31 Dec. 99 (SEK m.) –11 –10 –4
* Average forward price and lowest redemption price for currency options.** January volumes are not included, since the unrealised gain/loss effect was
reported in December.
0
5,000
10,000
15,000
96 97 98 99
Currency transaction exposure
SEK m.
EMU* currencies/EUR
USD and AUD
Other currencies
GBP
*) ATS, BEF/LUF, FIM, FRF, DEM, ESP, IEP, ITL, NLG and PTE
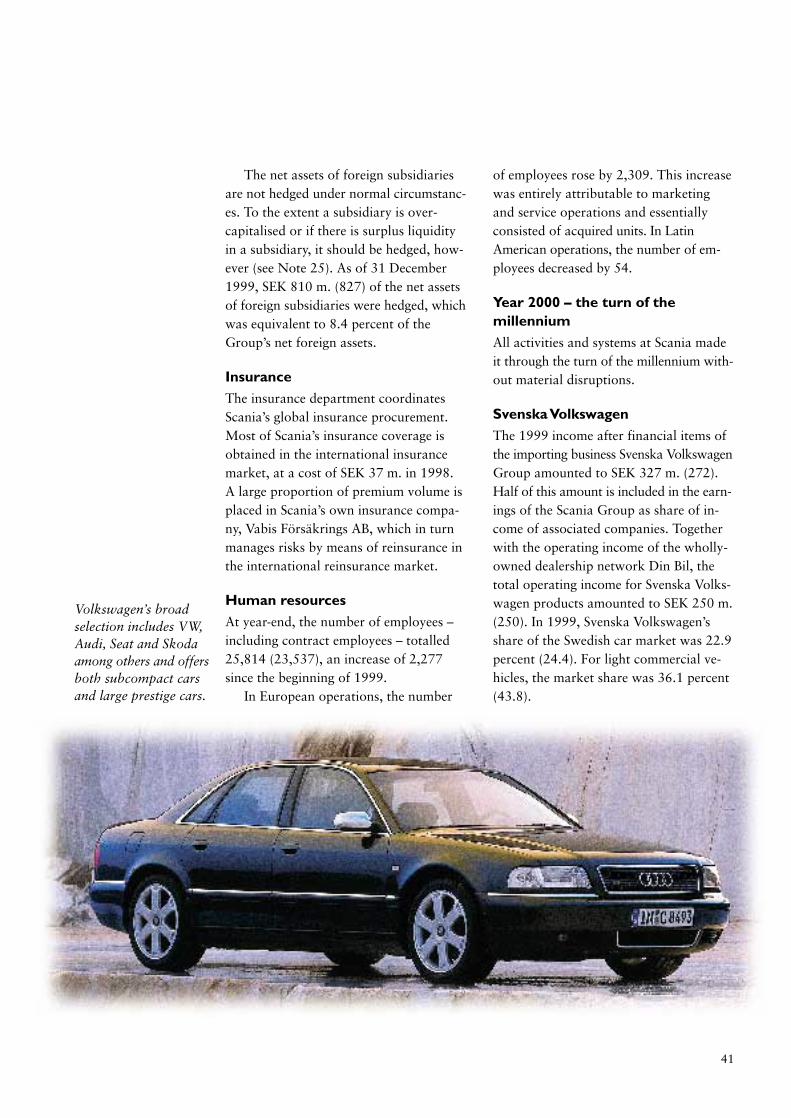
41
The net assets of foreign subsidiariesare not hedged under normal circumstanc-es. To the extent a subsidiary is over-capitalised or if there is surplus liquidityin a subsidiary, it should be hedged, how-ever (see Note 25). As of 31 December1999, SEK 810 m. (827) of the net assetsof foreign subsidiaries were hedged, whichwas equivalent to 8.4 percent of theGroup’s net foreign assets.
InsuranceThe insurance department coordinatesScania’s global insurance procurement.Most of Scania’s insurance coverage isobtained in the international insurancemarket, at a cost of SEK 37 m. in 1998.A large proportion of premium volume isplaced in Scania’s own insurance compa-ny, Vabis Försäkrings AB, which in turnmanages risks by means of reinsurance inthe international reinsurance market.
Human resourcesAt year-end, the number of employees –including contract employees – totalled25,814 (23,537), an increase of 2,277since the beginning of 1999.
In European operations, the number
of employees rose by 2,309. This increasewas entirely attributable to marketingand service operations and essentiallyconsisted of acquired units. In LatinAmerican operations, the number of em-ployees decreased by 54.
Year 2000 – the turn of themillenniumAll activities and systems at Scania madeit through the turn of the millennium with-out material disruptions.
Svenska VolkswagenThe 1999 income after financial items ofthe importing business Svenska VolkswagenGroup amounted to SEK 327 m. (272).Half of this amount is included in the earn-ings of the Scania Group as share of in-come of associated companies. Togetherwith the operating income of the wholly-owned dealership network Din Bil, thetotal operating income for Svenska Volks-wagen products amounted to SEK 250 m.(250). In 1999, Svenska Volkswagen’sshare of the Swedish car market was 22.9percent (24.4). For light commercial ve-hicles, the market share was 36.1 percent(43.8).
Volkswagen’s broad selection includes VW,Audi, Seat and Skodaamong others and offersboth subcompact carsand large prestige cars.

42
CONSOLIDATED INCOME STATEMENT
January–December, MSEK Note 1999 1998 1997
Sales 1 47,110 45,312 39,719
Cost of goods sold –34,351 –34,547 –30,328Gross income 12,759 10,765 9,391
Research and development expenses –1,267 –1,168 –1,248Selling expenses –6,047 –5,730 –4,786Administrative expenses –866 –679 –668
Income from customer finance operations 2 140 91 73
Share of income of associated companies 3 326 313 285Operating income 5,045 3,592 3,047
Financial income and expenses 4Interest income 381 259 416Interest expenses –909 –627 –689Other financial income and expenses –17 –10 –23Net financial items –545 –378 –296Income after financial items 4,500 3,214 2,751
Taxes 5 –1,353 –959 –806
Minority interests –1 –5 –2Net income 3,146 2,250 1,943
Depreciation included in operating income 6 –1,948 –1,883 –1,672

43
CONSOLIDATED BALANCE SHEET
31 December, SEK m. Note 1999 1998 1997 1999 1998 1997
ASSETS
Fixed assetsIntangible fixed assets 7 555 113 134 555 113 134Tangible fixed assets 8 18,860 17,445 16,258 12,681 12,824 13,012
Financial fixed assetsShares in associated companies etc 9 1,388 1,411 1,230 2,616 2,258 1,952Interest-bearing receivables 10 6,356 5,527 3,160 711 474 469Deferred tax assets 16 502 288 164 499 268 164Other long-term receivables 525 356 267 525 356 267Total fixed assets 28,186 25,140 21,213 17,587 16,293 15,998
Current assetsInventories 11 7,437 7,571 6,902 7,279 7,456 6,803Receivables 12Interest-bearing trade receivables 4,180 3,480 2,950 650 796 817Trade receivables 7,560 5,004 3,715 7,519 4,894 3,691Other receivables 2,116 1,833 1,483 1,934 1,577 1,285Total receivables 13,856 10,317 8,148 10,103 7,267 5,793Short-term investment 13 1,713 929 1,429 1,713 929 1,420Cash and bank balances 997 845 704 830 781 644Total current assets 24,003 19,662 17,183 19,925 16,433 14,660Total assets 52,189 44,802 38,396 37,512 32,726 30,658
SHAREHOLDERS’ EQUITY AND LIABILITIESShareholders’ equityShare capital 2,000 2,000 2,000 2,000 2,000 2,000Restricted reserves 4,353 3,677 2,800 4,353 3,677 2,800Total restricted reserves 6,353 5,677 4,800 6,353 5,677 4,800Unrestricted reserves 4,049 3,924 3,610 4,049 3,924 3,610Net income 3,146 2,250 1,943 3,146 2,250 1,943Total unrestricted capital 7,195 6,174 5,553 7,195 6,174 5,553Total shareholders’ equity 14 13,548 11,851 10,353 13,548 11,851 10,353
Minority interests in subsidiaries 23 21 15 23 21 15
ProvisionsProvisions for pensions 15 1,842 1,913 1,889 1,839 1,910 1,887Provisions for deferred taxes 16 2,044 1,735 1,567 1,515 1,295 1,281Other provisions 17 2,115 1,933 1,667 2,108 1,926 1,662Total provisions 6,001 5,581 5,123 5,462 5,131 4,830
LiabilitiesLong-term borrowings 18 11,268 6,620 7,003 5,366 2,667 4,073Short-term borrowings 18 13,119 12,659 9,184 5,409 5,572 5,134Advance payments from customers 563 618 466 446 515 408Trade accounts payable 2,801 2,767 2,375 2,661 2,550 2,262Tax liabilities 872 1,047 598 871 1,047 592Other liabilities 1,695 1,186 1,022 1,609 1,039 854Accrued expenses and prepaid income 19 2,299 2,452 2,257 2,117 2,333 2,137Total liabilities 32,617 27,349 22,905 18,479 15,723 15,460Total shareholders’ equity and liabilities 52,189 44,802 38,396 37,512 32,726 30,658
Assets pledged andcontingent liabilitiesAssets pledged 20 231 187 223Contingent liabilities 21 645 529 522
Including customer finance companiesaccording to the equity method of accounting, pro forma

44
CONSOLIDATED STATEMENT OF CASH FLOWS
January–December, SEK m. Note 1999 1998 1997
Cash flows from operating activitiesNet income, excluding customer finance operations 3,034 2,194 1,880Items not affecting cash flows 22 2,322 2,140 1,597Cash from operating activities 5,356 4,334 3,477
Change in working capital etcInventories 693 – 611 –549Receivables –2,746 –1,284 –1,016Provisions for pensions –95 41 97Non-interest bearing liabilities and provisions 43 1,129 726Total change in working capital etc 22 –2,105 –725 –742Total cash flows from operating activities 3,251 3,609 2,735
Net investment excluding acquisitions/divestments of companies 22 –1,654 –1,817 –2,307
Operating cash flows before acquisitions/divestments of companies 1,597 1,792 428
Net investment through acquisitions/divestments of companies 22 –1,121 5 –483
Operating cash flows excluding customer finance operations 476 1,797 –55
Expansion in customer finance operations 2 –2,708 –3,692 –2,319
Change in financial position including customer finance operations –2,232 –1,895 –2,374
Change in net indebtedness from financing activities 22 4,431 2,586 2,527Dividend to shareholders –1,300 –1,100 –1,100Net change in liquid assets and short-term investments 899 –409 –947
Effect of exchange rate fluctuations on liquid assets and short-term investments 37 50 243Cash, bank balances and short-term investments at beginning of year 1,774 2,133 2,837Cash, bank balances and short-term investments at end of year 2,710 1,774 2,133

45
PARENT COMPANY FINANCIAL STATEMENTS
Income statementJanuary–December, SEK m. Note 1999 1998 1997Operating income – – –Financial income and expenses 1 – 42 –81 –180Dividends and group contributions received 1 3,619 3,320 1,650Provision to tax allocation reserve –706 –637 –284Taxes –790 –697 –335Net income 2,081 1,905 851
Balance sheet31 December, SEK m. Note 1999 1998 1997ASSETS
Financial fixed assetsShares 2 10,971 11,269 11,269Current assetsDue from subsidiaries 3,427 1,581 –Other receivables 13 – –Total assets 14,411 12,850 11,269
SHAREHOLDERS’ EQUITY AND LIABILITIESShareholders’ equity 3 11,144 10,363 9,558Untaxed reserves 4 2,477 1,771 1,134
Current liabilitiesDue to subsidiaries – – 234Tax liabilities 790 714 335Accrued expenses and prepaid income 0 2 8Total current liabilities 790 716 577Total shareholders’ equity and liabilities 14,411 12,850 11,269
Assets pledged and contingent liabilitiesAssets pledged None None NoneContingent liabilities 5 18,139 11,960 8,816
Statement of cash flowsJanuary–December, SEK m. 1999 1998 1997
Cash flows from operating activitiesNet income 2,081 1,905 851Items not affecting cash flowsGroup contributions received –3,569 –3,268 –1,600Provision to untaxed reserves 706 637 284Cash from operating activities –782 –726 – 465
Change in working capitalReceivables –13 – –Current liabilities 74 373 131Total cash flows from operating activities –721 –353 –334Investment activitiesShares 298 – –
Change in net indebtedness from financing activitiesChange in liabilities to subsidiaries 1,723 1,453 1,434Dividend to shareholders –1,300 –1,100 –1,100
Net cash provided by financing activities 423 353 334Liquid assets and short-term investments at end of year – – –

46
ACCOUNTING PRINCIPLES
Consolidated accountsThe Scania Group follows the rec-ommendations issued by the SwedishFinancial Accounting StandardsCouncil. These recommendationscomply in all material respects withthe principles of the InternationalAccounting Standards Committee(IASC). In the case of the ScaniaGroup, there are limited differencescompared to U.S. generally acceptedaccounting principles (GAAP). Adescription can be found on page 56.
The consolidated financial state-ments encompass Scania AB and allsubsidiaries and associated compa-nies in Sweden and abroad. Subsidi-aries are companies in which Scaniadirectly or indirectly owns morethan 50 percent of the voting rightsof the shares or in which Scaniaotherwise has a decisive influence.Associated companies are companiesin which Scania has a long-termownership interest and voting rightsof between 20 and 50 percent.
Associated companies are report-ed in accordance with the equity ac-counting method. This means thatthe shares and participations in as-sociated companies are reported inthe consolidated balance sheet asthe Group’s share of their equity after adjusting for the Group’s shareof surplus or deficit value, respec-tively. Thus, consolidated incomeincludes Scania’s share of the incomeof associated companies.
The consolidated accounts areprepared in accordance with the rec-ommendation of the Swedish Finan-cial Accounting Standards Council(RR1:96) and in accordance withthe purchase accounting method.This means that an acquired subsi-diary’s assets and liabilities are ac-
counted for at fair market value ac-cording to an analysis of the acqui-sition. If the acquisition cost of theshares in the subsidiary exceeds theestimated fair market value of thecompany’s net assets according tothe analysis, the difference is reportedas goodwill. The goodwill deprecia-tion period is decided from case tocase and was 10 years during 1999.Only income that arises after thedate of acquisition is included inconsolidated shareholders’ equity.
The minority interests’ share ofnet income and shareholders’ equityof partially owned subsidiaries is re-ported separately in the calculationof net income and shareholders’equity.
Foreign subsidiaries andassociated companiesEuropean production companies,Latin American operations and cer-tain holding companies are integralto Scania and their financial state-ments are thus translated to Swedishkronor using the monetary/non-monetary method of accounting.Latin American operations, whichare predominantly industrial in na-ture, are an integral part of Scania’sindustrial system, with commonproduct development, common products and a common productionstructure. The financial statements ofScania’s other foreign subsidiaries aretranslated using the current method.
Under the current method, assetsand liabilities are translated at theyear-end exchange rate, while in-come and expenses are translated atthe average exchange rate for theyear. The translation difference,which arises in part from translat-ing net assets of foreign companies
at a different rate at the beginningof the year than at year-end, and inpart from translating net income atother than the year-end rate, is re-ported directly in shareholders’ eq-uity in the balance sheet.
Under the monetary/non-mone-tary method, monetary items aretranslated at the year-end rate, whilenon-monetary items are translatedat the rate in effect on the acquisi-tion date. Inventories, property,plant and equipment and sharehold-ers’ equity are translated at the ac-quisition date rate and other assetsand liabilities at the year-end rate.With the exception of consumptionof goods and depreciation of prop-erty, plant and equipment, whichare translated at the acquisitiondate rate, income and expenses aretranslated at a weighted average ex-change rate for the year.
The translation difference onmonetary assets and liabilities is in-cluded in net income for the yearand is reported in the income state-ment as follows. The portion of thetranslation difference attributable tooperating items, primarily trade ac-counts receivable and payable, is in-cluded in operating income. Theportion of the translation differenceattributable to interest-bearing itemsis included in financial income andexpenses.
Receivables and liabilities inforeign currencyReceivables and liabilities in foreigncurrency are valued at the year-endexchange rate. Unrealised exchangerate gains and losses are included inincome. Receivables and liabilitieshedged by forward contracts are val-ued at the agreed forward rate.

47
Short-term investmentsShort-term investments are valuedat the lower of acquisition cost ormarket value.
InventoriesInventories are valued at the lowerof cost according to the first in, firstout principle (FIFO) or market value.An allocable portion of indirect ex-penses is included in the value ofthe inventories.
Property, plant and equipment Property, plant and equipment arereported at acquisition cost less ac-cumulated depreciation.
Leasing contractsLeasing contracts with customersare reported as financial leases incases where substantially all risksand benefits associated with owner-ship have been transferred to thelessee. Other leasing contracts areaccounted for as operating leases.
Profit recognitionProfits are recognised upon deliveryof the products and services, on thedate when substantially all the risksand rights of ownership pass to thebuyer. In the case of “operating leases”, Scania recognises income as it receives principal paymentsover the life of the lease. A profit reserve equivalent to a fair valua-tion of residual value risk remainsat the end of the contract period.
DepreciationDepreciation is based on an asset’shistorical cost and estimated econo-mic life. The estimated economiclife of machinery and equipment is5–15 years. Industrial buildings aredepreciated over 25 years.
Research and developmentexpensesThe cost of research and develop-ment is charged to operating incomeas it arises.
Warranty expensesEstimated costs for product warran-ties are charged to operating incomewhen the product is sold.
Selling expensesSelling expenses are defined as costsof central marketing resources, dis-tribution costs for parts as well asall overhead in marketing companies,including goodwill and warrantyprovisions.
Administrative expensesAdministrative expenses are definedas Group-wide costs of corporatemanagement plus corporate staffunits in European and Latin Ameri-can operations.
Exchange rate differencesExchange rate differences pertaining toborrowings and financial investmentsare reported as financial income orexpenses, while other exchange ratedifferences are reported under oper-ating income.
Exchange rate differences at-tributable to loans and forward ex-change contracts in foreign curren-cies that are designated as a hedgeof the net assets of foreign subsidia-ries are reported, with considerationgiven to tax effects, directly in share-holders’ equity in the consolidatedbalance sheet together with the corre-sponding translation difference. Theportion of these forward exchangecontracts that pertains to interest isamortised over the life of the con-
tract and is reported among financialincome and expenses.
TaxesTaxes are reported mainly accord-ing to the recommendation of theSwedish Financial Accounting Stan-dards Council concerning the report-ing of income taxes. The Group’stotal tax consists of current tax anddeferred tax. Deferred tax is the taxon the difference between the bookvalue of assets and liabilities andtheir tax value. Deferred tax assetsare recognised to the extent they areconsidered likely to be realised inthe future.

48
NOTES TO THE CONSOLIDATED FINANCIAL STATEMENTSAll amounts are stated in millions of Swedish kronor (SEK m.) unless otherwise indicated.
Note 1 Sales1999 1998 1997
Trucks 27 ,888 27,092 24,005Buses 3,601 3,548 3,251Engines 444 398 392Service-related products 6,945 6,419 5,799Used vehicles and other products 2,850 2,218 1,640Total Scania products 41,728 39,675 35,087Svenska Volkswagen products 1 5,382 5,637 4,632Total 47,110 45,312 39,719
1 Refers to Scania’s sales through the Group’s wholly-owned dealer-ship companies.
Note 2 Customer finance operationsThe Group’s customer finance operations are conducted primarily byseparate subsidiaries. Their financial statements are summarised be-low.
Income statement 1999 1998 1997Interest income 559 480 308Leasing income 1,287 942 628Interest expenses –581 –486 –318Depreciation –921 –668 –436Bad debts –57 –44 –25Other expenses –147 –133 –84Income from customer finance operations 140 91 73
Balance sheet 1999 1998 1997
ASSETSLeasing assets 6,164 4,605 3,230Financial receivables 9,175 7,737 4,870Other assets 835 690 437Total 16,174 13,032 8,537
SHAREHOLDERS’ EQUITY AND LIABILITIESShareholders’ equity 1,229 848 722Borrowings 13,612 11,047 7,022Other liabilities 1,333 1,137 793Total 16,174 13,032 8,537
The statement of cash flows below describes the expansion in cus-tomer finance operations.
Statement of cash flows 1999 1998 1997
Net income 112 56 63Items not affecting cash flows 133 156 145Cash from operating activities 245 212 208Increase in leasing assets –1,606 –1,211 –1,031Increase in financial receivables –1,304 –2,668 –1,418Change in other assetsand liabilities 38 –25 –78Acquisition of subsidiary 2 –81 – –Expansion in customer financeoperations –2,708 –3,692 –2,319
Leasing assets 1999 1998 1997Cost 7,804 5,868 4,043Accumulated depreciation –1,640 –1,263 –813Residual value at year-end 3 6,164 4,605 3,2302 Acquisition of the Italian finance company Fiscar. The company’s
assets amounted to SEK 541 m. and liabilities SEK 427 m. Thepurchase price amounted to SEK 114 m. and liquid assets SEK 33m. The effect on cash flows amounted to SEK –81 m.
3 Included in the consolidated accounts under “Machinery and equipment” after subtracting deferred profit recognition.
Net investments in financial leases 1999 1998 1997Minimum lease payments receivable 7,176 5,431 2,905Less:Executory costs and reserve for doubtful receivables –194 –138 –68Imputed interest –860 –658 –299
Net investment 4 6,122 4,635 2,538
4 Included in “Interest-bearing trade accounts receivable” and“Long-term interest-bearing receivables.”
Operating FinancialFuture payments leases leases2000 1,510 2,7072001 1,165 1,9172002 796 1,4292003 445 7812004 223 2982005 and thereafter 141 44Total 4,280 7,176
Note 3 Share of income of associated companies
The Group’s share of income before taxes of associated companiesconsisted of the following:
1999 1998 1997Scania products 162 183 146Svenska Volkswagen products 164 130 139Total 326 313 285
Note 4 Financial income and expenses1999 1998 1997
Interest incomeShort-term investments 242 122 221Long-term receivables 96 93 66Interest portion of forward exchange contracts used to hedge net assets 13 13 –6Other 30 31 135Total interest income 381 259 416
Interest expensesBorrowings –865 –559 –637Interest on pension liability (PRI) –44 –68 –52Total interest expenses –909 –627 –689Other –17 –10 –23Net financial items –545 –378 –296
Note 5 Taxes1999 1998 1997
Income tax –1,138 –811 –794Withholding taxes on dividends and interest – – 2Taxes paid –1,138 –811 –792Deferred tax –112 –39 78Share of tax of associated companies –103 –109 –92Total –1,353 –959 –806
Geographic distribution of income before taxes and minority interests:Sweden 3,903 3,168 1,820Rest of the world 597 46 931Total 4,500 3,214 2,751

49
Geographic distribution of tax expense:Income tax 1999 1998 1997Sweden –869 –766 –571Rest of the world –269 –45 –221Total –1,138 –811 –792
Deferred tax
Sweden –194 –56 93Rest of the world 82 17 –15Total –112 –39 78Tax of associated companies –103 –109 –92Total –1,353 –959 –806
The main reasons behind the difference between the statutory taxrate in Sweden and the effective tax rate in relation to income beforetaxes are indicated in the table below:
1999 1998 1997% % %
Swedish statutory income tax rate 28 28 28Valuation of tax loss carry-forwards 1 1 1Difference between Swedish and foreign tax rates 2 1 1Tax-exempt income –2 –1 –2Non-deductible expenses including goodwill depreciation 2 2 2Adjustment for taxes pertaining to previous year 1 –1 –Other –2 0 –1
Effective income tax rate 30 30 29
Note 6 DepreciationDistribution of depreciation by function, excluding depreciation incustomer finance operations. See Note 2. “Selling expenses” includeSEK 62 m. in depreciation of goodwill.
1999 1998 1997Cost of goods sold –1,477 –1,474 –1,356Research and development expenses –70 –85 –80Selling expenses –360 –284 –212Administrative expenses –41 –40 –24Total –1,948 –1,883 –1,672
Note 7 Intangible fixed assets
Goodwill 1999 1998 1997Accumulated costOpening balance 173 161 60Additions during the year 494 5 102Acquisitions of subsidiaries 20 – –Translation differences for the year –6 7 –1Total 681 173 161
Accumulated depreciationOpening balance 60 27 7Depreciation for the year 62 30 20Acquisitions of subsidiaries 7 – –Translation differences for the year –3 3 –Total 126 60 27
Book value at year-end 555 113 134
Note 8 Tangible fixed assetsConstruction
Machinery in progressBuildings and and advanceand land equipment payments
Book value, 1 January 1997 5,163 8,148 597Change in accumulated cost, 1997 799 2,508 685Change in accumulateddepreciation, 1997 –378 –1,264 –
Book value, 31 December 1997 5,584 9,392 1,282Change in accumulated cost, 1998 246 3,335 –498Change in accumulated depreciation, 1998 –177 –1,719 –Book value, 31 December 1998 5,653 11,008 784
1999Accumulated costOpening balance 7,946 20,869 784Additions during the year 325 4,114 649Acquisition/divestments of subsidiaries 504 335 93Disposals –143 –2,324 –Reclassifications 232 289 –545Translation differences for the year –99 22 10Total 8,765 23,305 991
Accumulated depreciationOpening balance 2,327 9,831 –Acquisition/divestment of subsidiaries 197 214 –Disposals –24 –1,088 –Reclassifications 7 –25 –Depreciation for the year on cost: –– industrial and sales operations 309 1,577 –– customer finance operations – 928 –Translation differences for the year –38 7 –Total 2,778 11,444 –
Accumulated revaluationsOpening balance 34 – –Acquisitions of subsidiaries 18 – –
Total 52 – –
Accumulated write-downsOpening balance – 30 –Write-downs for the year – 1 –
Total – 31 –
Book value at year-end 6,039 11,830 991of which “Machinery” 5,942of which “Equipment” 886of which “Leasing assets”1 5,002
Tax assessment value, buildings(in Sweden) 1,216equivalent book value 2,752
Tax assessment value, land (Sweden) 354equivalent book value 431
Firm obligations pertaining to leasing of premises are distributed asfollows:
1999 2000 2001 2002 2003 2004 2005 andlater
Rentpayment 53 54 55 49 48 44 188
1 After subtracting deferred profit recognition.

50
Note 9 Shares in associated companies, etc
Shares in associated companies 1999 1998 1997Accumulated cost 739 796 796Accumulated share of income 639 605 425Book value 1,378 1,401 1,221
Specification of the Group’s holdings of shares and participationsin associated companies etc
Value of Scania’sAssociated company/ %- Book value in share in consoli-corporate ID number/ owner- Parent company dated accountscountry of registration ship accounts 1999 1998 1997Beers N.V.,NL003779439B01,the Netherlands 1 50 483 711 730 601Oy Scan-Auto Ab, FI0202014-4, Finland 2 – – 114 107Svenska Volkswagen AB, 556084-0968, Sweden 50 21 593 524 490Cummins-Scania High Pressure Injection L.L.C043650113, United States 30 25 40 – –WM-Data Scania AB, 556084-1206, Sweden 50 7 34 33 23Shares in associated companies 1,378 1,401 1,221
Shares in other companies 10 10 9Total 1,388 1,411 1,230
1 The shares in Beers N.V. are publicly listed and the market value ofthe investment was SEK 943 m. (1,286 and 824, respectively) atyear-end.
2 During 1999, the remaining 50 percent of the shares in Oy Scan-Auto Ab were acquired, thus changing the company into a subsidi-ary.
The difference between the value of Scania’s share in the consolidat-ed financial statements using the equity method of accounting (SEK1,378 m.) and the Group’s ownership stake in the shareholders’ eq-uity of associated companies (SEK 1,423 m.) amounted to SEK 45 m.
The Group’s share of undistributed accumulated profit in associat-ed companies comprised part of restricted reserves in the consolidat-ed accounts. It amounted to SEK 639 m. (605 and 425, respectively).
Note 10 Interest-bearing receivables (long-term)1999 1998 1997
Receivables in customer finance operations 5,645 5,053 2,691Other receivables 711 474 469Total 6,356 5,527 3,160
Included in “Other receivables” were deposits of SEK 151 m. (206and 136, respectively) with financial institutions which were restrictedin their use by agreement with third-party lenders.
Note 11 Inventories1999 1998 1997
Raw materials 987 1,183 1,241Work in progress 458 452 648Finished goods 5,992 5,936 5, 013Total 7,437 7,571 6,902
Note 12 Receivables1999 1998 1997
Interest-bearing trade accounts receivable 650 796 817Receivables in customer finance operations 3,530 2,684 2,133
Sub-total, interest bearing trade accounts receivable 4,180 3,480 2,950Trade accounts receivable 7,560 5,004 3,715
Other receivables 1,559 1,388 1,128Pre-paid expenses and accrued income 557 445 355
Sub-total, other receivables 2,116 1,833 1,483
Total 13,856 10,317 8,148
As of 31 December 1999, receivables from associated companiespertaining to products and services delivered were SEK 105 m. Tradeaccounts payable to associated companies pertaining to services andproducts purchased were SEK 74 m. and receivables pertaining tointerest-bearing financing SEK 25 m.
Note 13 Short term investments1999 1998 1997
Cash equivalents(maturities of less than 90 days) 1,395 468 571Short-term investments 318 461 858Total 1,713 929 1,429
Half of the Group’s short-term investments are found in the LatinAmerican subsidiaries. The remainder was related to cash equiva-lents deposited in Swedish banks as payment reserves in the run-upto the millennium change.
Investments totalling SEK 653 m. (557 and 502, respectively) in val-ue were restricted by agreement with outside parties. See also Note 10.
Note 14 Shareholders’ equityThe Shareholders’ equity of the Group has changed as follows:
Unrestrict- Acc.ed share- translation
Share- Restricted holders’ differ-1998 capital reserves equity ences TotalOpening balance 2,000 2,800 5,301 252 10,353Dividend to shareholders – – –1,100 – –1,100Net income for 1998 – – 2,250 – 2,250Translation differences for the year – – – 350 350Transfer between restricted and unrestricted equity 1 – 877 –877 – –Other – – –2 – –2Closing balance, 31 December 1998 2,000 3, 677 5,572 602 11,851
1999
Opening balance 2, 000 3,677 5,572 602 11,851Dividend to sharholders – – –1,300 – –1,300Net income for 1999 – – 3,146 – 3,146Translation differencesfor the year – – – –150 –150Transfer between restrictedand unrestricted equity 1 – 676 –676 – –Other – – 1 – 1Closing balance31 December 1999 2,000 4,353 6,743 452 13,548
Scania AB has 100,000,000 A shares outstanding with voting rightsof one per share and 100,000,000 B shares outstanding with votingrights of 1/10 per share. No provisions to restricted reserves are re-quired.1 Transfers to restricted equity are explained mainly by increased
deferred tax assets and tax allocations.

51
Note 15 Provisions for pensions and similar commitments
1999 1998 1997Provisions for FPG/PRI pensions 1,273 1,213 1,168Provisions for other pensions, vested 290 316 342Special pension allocation 74 116 119Provisions for medical care benefits 205 268 260Total 1,842 1,913 1,889
The amount under “Provisions for pensions” corresponds to the ac-tuarial projections of all mandatory and voluntary pension obligations.
The Swedish plan for salaried employees is administered by a Swed-ish multi-employer pension institution, the Pension Registration Insti-tute (PRI). The level of benefits and actuarial assumptions are esta-blished by PRI. Scania’s pension liability consists of the sum of thediscounted current value of the company’s estimated future pensionpayments. Pension liability is based on current wages and salaries.
“Provisions for pensions” include foreign subsidiaries, whose pen-sion commitments are reported in accordance with the principlesthat apply in each country, provided that they permit earned pensionbenefits to be reported as an expense.
For obligations related to medical care benefits, which are attribu-table to its operations in Brazil, Scania applies SFAS 106, “Employers’Accounting for Postretirement Benefits”. This means that medicalcare benefits, etc that are earned by the employees but not utiliseduntil after retirement are expensed as they arise.
Note 16 Deferred tax assets/liabilities
1999 1998 1997Deferred tax assetsProvisions 329 298 234Property, plant and equipment 312 295 160Inventories 251 233 152Tax loss carry-forwards 398 198 76Other 148 93 114Offset within tax units –936 –829 –572Total 502 288 164
Deferred tax liabilitiesProperty, plant and equipment 2,109 1,908 1,783Tax allocation reserve 702 524 326Other 169 132 30Offset within tax units –936 –829 –572Total 2,044 1,735 1,567
Net deferred tax liabilities 1,542 1,447 1,403
Tax loss carry-forwards mainly stem from Latin America, Franceand England. In Latin American operations, deferred tax assets re-lated to tax loss carry-forwards amounting to SEK 206 m. were notreported due to a limit on annual future utilisation. Of the deferredtax assets attributable to tax loss carry-forwards, SEK 360 m. maybe utilised without time constraints.
In Sweden, tax laws permit provisions to an untaxed reserve calleda “tax allocation reserve”. Deductions for provisions to this reserveare allowed up to a maximum of 20 percent of the company’s taxa-ble profits. Each provision to this reserve may be freely withdrawnand face taxation, but must be withdrawn no later than the sixthyear following the year the provision was made.
Note 17 Other provisions1999 1998 1997
Warranty provisions 1,267 1,312 1,259Other 848 621 408Total 2,115 1,933 1,667
Note 18 BorrowingsBorrowings for customer finance operations are effectively matchedagainst contracted payment flows with regard to currency and fixed-interest periods. Financing of industrial operations in Europe ismainly converted to Swedish currency, normally with a fixed-interestperiod of 6 months.Short- and long-term borrowingdistributed by currency 1 1999 1998 1997SEK 8, 168 7,366 5,189EUR 7,405 – –GBP 2,540 2,249 2,412USD 2,245 4,600 5,042Other currencies 4,029 5,064 3,544Total 2 24,387 19,279 16,187
1 Does not take into account any currency hedging.2 These amounts include SEK 13,612 m. (11,047 and 7,022, respec-
tively) in borrowings for customer finance operations. The averageinterest rate on borrowings, including borrowings for customer finance operations, was 5.8 percent (5.5 and 5.5, respectively) atyear-end.
The above loans fall due for repayment as follows:2000 13,1192001 1,0742002 7262003 1,6642004 6,8412005 and later 963Total 24,387
Scania has a committed credit facility of USD 1,850 m. from an in-ternational banking syndicate, which expires in December 2004. Atyear-end 1999, the equivalent of USD 573 m. of this facility wasbeing utilised. This means that USD 1,277 m., equivalent to SEK10,883 m. translated at the year-end exchange rate, was availableunder this credit facility on 31 December 1999.
Scania’s medium term note programme enables the Group to issuenotes and bonds with maturities of 1 to 10 years. At year-end, themaximum amount was SEK 7,000 m., and SEK 4,583 m. worth ofsuch debt securities had been issued under the programme.
Scania also has commercial paper programmes in Sweden and Bel-gium, with ceilings of SEK 4,000 m. and EUR 400 m., respectively.At year-end, SEK 2,131 m. and EUR 182 m., respectively, werebeing utilised.
Net indebtedness 1999 1998 1997Cash, bank balances and short-term investments 2,710 1,774 2,133Short-term borrowings –13,119 –12,659 –9,184Long-term borrowings –11,268 –6,620 –7,003Total –21,677 –17,505 –14,054Of which attributable tocustomer finance operations –13,445 –10,983 –6,911Net indebtedness –8,232 –6,522 –7,143

52
Note 19 Accrued expenses and prepaid income
This item consisted mainly of the customary accrual items, of whichabout SEK 200 m. (200) were financial items.
Note 20 Assets pledged1999 1998 1997
Real estate mortgages 214 47 166Chattel mortgages – – 16Receivables 17 140 41Total 231 187 223
All assets pledged consisted of collateral for the Group’s own liabili-ties. In 1999, all collateral was pledged to credit institutions andamounted to SEK 81 m. for short-term borrowings and SEK 150 m.for long-term borrowings.
Note 21 Contingent liabilities1999 1998 1997
FPG/PRI, pension guarantee obligationson behalf of Group companies 25 23 25FPG/PRI, pension guarantee obligations on behalf of associated companies 138 125 113Loan guarantees 106 89 41Discounted bills and contracts 112 94 75Other guarantees 264 198 268Total 645 529 522In addition to the above contingent liabilities, the Group has issuedvehicle repurchase guarantees worth SEK 737 m. (650 and 546, re-spectively) to customers’ creditors. Furthermore, the Group issuedSEK 1,039 m. (510 and 345, respectively) worth of pledges direct tocustomers to buy back vehicles after their period of possession at apre-determined price. Repurchase obligations related to guaranteedresidual values in operating leases under Scania’s own auspicesamounted to SEK 3,460 m. (3,047 and 2,218, respectively). TheGroup has given repurchase commitments without risks related tofuture prices to Svenska Volkswagen Finans AB in an amount esti-mated at SEK 610 m. (500 and 450, respectively).
The Group is party to legal proceedings and related claims arisingin the normal course of business. Management believes, however –based on its assessments of these claims – that the ultimate resolu-tion of these proceedings will not have a material impact on theGroup’s financial position.
Note 22 Consolidated statement of cash flows
Items not affecting cash flows 1999 1998 1997Depreciation 1,948 1,883 1,672Unrealised exchange rate differences –13 14 –84Doubtful receivables 100 72 73Share of income of associated companies –326 –313 –285Share of taxes of associated companies 103 109 92Dividends from associated companies 114 100 85Deferred tax 47 –50 –155Deferred profit recognition, operating leases 315 309 173Other 34 16 26Total 2,322 2,140 1,597
Change in working capitalInterest-bearing long-term receivables 50 –112 –140Other receivables –2,796 –1,172 –876Inventories 693 –611 –549Provisions for pensions –95 41 97Advance payments from customers –84 94 1Trade accounts payable 131 246 223Other liabilities and provisions –4 789 502Total –2,105 –725 –742
Net investments excluding acquisition/divestments of companies 1999 1998 1997Investment intangible fixed assets –1,965 –2,104 –2,615Divestments of tangible fixed assets 311 287 308Total –1,654 –1,817 –2,307Net Investment through acquisitions/divestments of companiesProceeds from sale of shares (after sub- tracting liquid assets in divested companies) –7 12 5Acqusition of subsidiaries1 –1,114 –7 – 488Total –1,121 5 – 483Change in net indebtednessthrough financing activitiesNet change in short-term borrowings –134 3 051 3 655Repayment of long-term borrowings –536 –457 –1 271Increase in long-term borrowings 5,033 61 147Net change in restricted deposits 68 –69 –4Total 4,431 2,586 2,527Interest and taxes paidInterest received during the year 382 262 416Interest paid during the year 909 565 514Taxes paid during the year 1,320 479 7111 During 1999, Scania acquired its distributors in Italy (100 per-
cent), Norway (100 percent) and Finland (the remaining 50 per-cent) as well as a stake (30 percent) in a development company inthe United States. According to the acquisition analyses, the valueof the assets and liabilities acquired was as follows:Tangible and intangible fixed assets 1,041Shares and participations 39Inventories 547Receivables 811Liquid assets 72Borrowings –717Other liabilities and provisions –561Recovery of share in associated companies and exchange rate adjustment – 46Purchase price paid 1,186Liquid assets in acquired companies –72Impact on consolidated liquid assets and short-term investments 1,114
Note 23 Wages, salaries and other remunera-tion, average number of employees and number of employees
Wages, salaries and other remuneration 1999 1998 1997
Operations in Sweden:Boards of Directors, Presidentand Executive Vice Presidents 35 30 33– Of which, bonuses 6 5 4Other employees 3,000 2,884 2,840Operations outside Sweden:Boards of Directors, Presidents and Executive Vice Presidents 124 107 104– Of which, bonuses 19 8 5Other employees 2,490 2,554 2,474Total 5,649 5,575 5,451Pension costs and mandatorypayroll fees 2,148 2,213 1,919– of which, pension costs 1 365 390 326Total wages, salaries and remuneration,pension costs and mandatory payroll fees 7,797 7,788 7,3701 Of the pension cost in the consolidated financial statements, SEK
34 m. (36 and 38, respectively) was for Boards of Directors andPresidents in the Scania Group. At year-end, the total pensioncommitment for them was SEK 82 m.

53
Wages, salaries and other remuneration, pension costs andmandatory payroll fees by country 1999 1998 1997
Operations in Sweden: 4,477 4,296 4,077
Number of employees on 31 December 1999 1998 1997European operationsProduction operations and corporatestaff units 13,233 13,364 13,020Marketing companies 8,755 6,315 6,337Total, European operations 21,988 19,679 1,357Latin American operations 3,660 3,714 4,299Customer finance operations 166 144 107Total 25,814 23,537 23,763– of whom, contract employees 953 795 807
Not 24 Information regarding compensation to executive officers and auditors
According to the decision of the Annual Meeting, the 1999 compen-sation to the members of the Board of Directors elected by the Annual Meeting amounted to SEK 2,625,000. The Chairman re-ceived compensation of SEK 700,000. The President and CEO re-ceived a salary of SEK 4,107,000. In addition, bonuses of SEK3,703,000 were paid to him, which were allocated for future pensions.
Scania’s incentive programme for executive officers, among themthe President and CEO, includes a bonus based on operating return,defined as Scania Group net income after subtracting expenses forshareholders’ equity. Certain executive officers were also included inan extra bonus programme for 1999.
The pension plan (in addition to the ITP occupational pension)for executive officers is a defined-contribution plan. Benefits accrueby means of annual payment of premiums by the company, totalling15–20 percent of fixed salary in the 20–30 base amount interval(base amount = basbelopp as defined by Swedish social insurance legislation) and 25–30 percent of fixed salary above 30 baseamounts. Added to this is the value of annual employee co-pay-ments, amounting to 2–5 percent of fixed salary.
Certain high-level executive officers are entitled, or may be obliged,to retire with a pension at age 62. The President and the other mem-bers of the Executive Board are entitled – or if the company so de-mands, obliged – to retire with a pension upon reaching the age of 60.
The President is entitled to a defined-contribution pension pro-gramme based on the ITP plan. The pension cost to Scania AB con-sists of pension premiums amounting to 35 percent of fixed salaryfor as long as the President remains an employee of the company.
Since the beginning of 1999, the President has held a non-transfer-able employee stock option without market value, entitling him, after five years but no later than after seven years, to purchase amaximum of 220,285 shares in Scania AB at a price of SEK 196 pershare. The employee stock option has been secured financially in themarket, so that Scania’s costs for this programme are known. Theoption carries an entitlement to purchase existing Series B shares andthus will not lead to dilution for Scania’s shareholders.
If he resigns of his own volition, or his employment is terminatedby the company, the President is entitled to his salary for a sixmonth notice period. If terminated by the company, in addition he isentitled to severance pay equivalent to a maximum of two years’ sal-ary, including the average annual value of his bonus over the latestthree-year period. Income from another employer during these pe-riods shall be subtracted from his notice period salary and his sev-erance pay, respectively. If the company is transferred to another own-er, the President – for one year after the take-over – is entitled to twoyears’ severance pay as described earlier.
The other members of the Executive Board, if terminated by thecompany, are entitled to severance pay equivalent to a maximum oftwo years’ salary, in addition to their salary during the six monthnotice period. If they obtain new employment within 18 months,counting from their termination date, their severance pay ceases. Incase of a substantial change in the ownership structure of Scania, themembers of the Executive Board are entitled to resign of their ownvolition with severance pay amounting to two years’ salary.
Operations outside Sweden:Brazil 518 924 1,012The Netherlands 450 471 465Great Britain 361 334 222France 360 354 310Argentina 286 302 290Denmark 244 242 224Germany 239 218 185Belgium 152 145 121Austria 123 110 96Switzerland 117 111 13835 countries with < 100 SEK m.2 470 281 230Total 3,320 3,492 3,293Group total 7,797 7,788 7,370
2 In 1998, 33 countries had less than SEK 100 m. in wages, salariesand other remuneration. In 1997 the figure was 32 countries.
Average number of employees 1999 1998 1997
Operations in Sweden:Average number of employees 11,440 10,380 10,519Operations outside Sweden:Number of countries 45 43 40Average number of employees 11,544 11,456 11,759Average total number of employees 22,984 21,836 22,278
Average number of employees 1999 1998 1997
Operations in Sweden: 11,440 10,380 10,519– of whom men 9,965 9,189 9,055– of whom women 1,475 1,191 1,464
Operations outside Sweden:Brazil 1,932 2,489 3,092The Netherlands 1,614 1,668 1,773Great Britain 1,467 1,240 1,247Argentina 1,040 1,112 1,104France 918 954 927Denmark 680 724 737Germany 591 530 493Belgium 534 438 419Austria 349 342 305Poland 332 332 249Australia 303 295 306Switzerland 255 244 262Norway 217 – –Italy 174 – –South Africa 169 133 117Tanzania 102 121 17728 countries with < 100 employees 3 867 834 551Total 11,544 11,456 11,759
– of whom men 10,267 10,261 10,379– of whom women 1 ,277 1,195 1,380Average total number of employees 22 ,984 21,836 22,278
3) In 1998, 29 countries had fewer than 100 Scania employees. In1997, the figure was 26 countries.

54
Fees and other compensation to external auditors for the financialyear 1999 are shown in the following table:
Auditing assignments Other assignmentsKPMG 12 2Ernst & Young AB 3 0Other auditors 9 5Total 24 7
Note 25 Net assets outside Sweden
Currency 1999 1998 1997EuropeEUR 4,236 2,601 1,998GBP 54 465 111Other European currencies 1,006 702 643Latin AmericaUSD 1,262 1,092 1,249Real, Peso and otherlocal currencies 2,600 2,878 2,589Other countriesUSD 72 117 27Other currencies 344 258 308Total 9,574 8,113 6,925
Net assets in Real, Peso and other local currencies in Latin Americaconsist primarily of fixed assets, which are translated at the ex-change rate on the acquisition date.
Note 26 Currency exposure inoperating income, by region
The table shows the net amount of the Group’s operating revenuesand operating expenses exposed to foreign currencies, byregion/country.
1999 1998 1997EuropeEMU countries (local currencies) 7,218 5,463 3,429Great Britain (local currency) 3,049 2,996 2,864Denmark/Norway (local currencies) 1,325 1,510 1,345Switzerland (local currency) 492 424 270Central and eastern Europe (local currencies, DEM) 1,190 1,669 985Total, Europe 13,274 12,062 8,893Asia/Oceania (USD, AUD, DEM) 883 1,026 1,820Africa (USD, ZAR, FRF, DEM) 555 670 629Latin America (USD) 15 486 1,180Total 14,727 14,244 12,522
Note 27 Impact of “Exchange rate differences” on net income
The impact of exchange rate differences on net income for 1999 isshown in the following table:Sales –105Cost of goods sold –5Financial income and expenses –72Taxes –3Impact on net income –185
The amounts concern exchange rate profits minus exchange rate los-ses on the difference between the involved exchange rate on the in-voice date and the exchange rate on the payment date, for receivablesand liabilities. These constitute only a fraction of the total exchangerates impact.

55
All amounts are stated in millions of Swedish kronor (SEK m.) un-less otherwise indicated.
Note 1 Financial income and expenses
1999 1998 1997Interest incomeFrom subsidiaries 6 – –Sub-total 6 – –
Interest expensesTo subsidiaries –17 –67 –64Interest portion of forward exchangecontracts used for hedging net assets –8 –7 –13Sub-total –25 –74 –77
Exchange rate differences on forwardexchange contracts for hedgingnet assets of foreign subsidiaries –23 –7 –103Total financial income andexpenses –42 –81 –180
Dividends and group contributions etcGroup contributions etc 3,569 3,268 1,600Dividends from associated companies 50 52 50Sub-total 3,619 3,320 1,650Total 3,577 3,239 1,470
Note 2 Shares
1999 1998 1997Subsidiary %corporate ID number/ owner- Book Book Bookcountry of registration ship value value valueScania CV AB, 556084-0976, Sweden 100 8,401 8,401 8,401Scania Latin America Ltda, 635,010,727,112, Brazil 100 2,257 2,257 2,257Scania Argentina S.A1
30-51742430-3, Argentina 73,6 298 298 298Scania del Peru S.A1
101, 36300, Peru 54,7 15 15 15Associated companySvenska Volkswagen AB 2
556084-0968, Sweden – 298 298Total 3 10,971 11,269 11,269
1 The Group’s ownership interest is 100 percent.2 During the year, the shares in Svenska Volkswagen AB were trans-
ferred to another company in the Group.3 The acquisition value of these shares for tax purposes is
significantly lower than their book value.
Scania CV AB, in turn, directly or indirectly owns a number of salescompanies, of which the largest are located in Australia, Austria,Belgium, Denmark, France, Germany, Great Britain, Italy, Norway,Spain and Sweden. It also owns production facilities in Denmark,France, the Netherlands and Poland.
A complete list of associated companies and other companies wasincluded in the annual report filed with the Swedish Patent and Reg-istration Office and may be obtained from Scania’s Head Office inSödertälje, Group Financial Reporting.
Note 3 Shareholders’ equity
Unrestrict-ed share-
Share Statutory holders’capital reserve equity Total
Balance on 1 January 1998 2,000 1,120 6,438 9,558Dividend to shareholders –1,100 –1,100Net income 1,905 1,905Balance on 31 December 1998 2,000 1,120 7,243 10,363
Dividend to shareholders –1,300 –1,300Net income for 1999 2,081 2,081Balance on 31 December 1999 2,000 1,120 8,024 11,144
Note 4 Untaxed reserves
1999 1998 1997Tax allocation reserve 2,477 1,771 1,134Total 2,477 1,771 1,134SEK 693 m. (496 and 318, respectively) of “Untaxed reserves” con-sists of deferred taxes. Deferred taxes are not included in the ParentCompany balance sheet, but are included in the consolidated balancesheet.
Note 5 Contingent liabilities
1999 1998 1997FPG/PRI pension guarantees on behalf of Group companies 1,298 1,239 1,192FPG/PRI pension guarantees on behalf of associated companies 138 125 113Loan guarantees on behalfof Group companies 3 16,703 10,596 7,511Total 18,139 11,960 8,816
3 Most of this item is related to loan guarantees on behalf of bor-rowings by Scania CV AB.
Note 6 Information regarding compensation to executive officers and auditors
The President of Scania AB and the other members of the ExecutiveBoard hold identical positions in Scania CV AB. Wages, salaries andother remuneration are paid by Scania CV AB. The reader is there-fore referred to Notes 23 and 24 in the consolidated financial state-ments.
No compensation to outside auditors was paid for the financialyear 1999 with respect to the Parent Company.
NOTES TO THE PARENT COMPANY FINANCIAL STATEMENTS
56
Swedish accounting principles differ in certain respectsfrom U.S. GAAP. The differences that have a materialeffect on the net income and shareholders’ equity of theScania Group are as follows:
(a) Goodwill In June 1991, Saab-Scania AB became a wholly ownedsubsidiary of Investor AB through an acquisition of alloutstanding shares in the market. In January 1994, thenet assets of Scania’s operations were transferred to aseparate company. According to U.S. GAAP, push-down accounting is applied in such instances, whichmeans that a goodwill value plus the tax effects of pre-1995 equity hedges is assigned to the Scania operations.Goodwill is amortised over 40 years.
(b) Pension costsThe pension commitments reported in the consolidatedfinancial statements have been based on actuarial calcu-lations in accordance with Swedish accounting principles.
For U.S. GAAP, the Group applies SFAS No. 87“Employers’ Accounting for Pensions” for the most sig-nificant stipulated pension plans. SFAS No. 87 is morecontrolled in particular as to the use of actuarial as-sumptions and requires that the projected unit creditmethod be used.
(c) Transactions in foreign currenciesThe Group uses forward contracts to hedge certain fu-ture transactions. Unrealised gains and losses on for-ward contracts are accrued and recognised as incomeduring the same period in which the hedged flow is re-ported.
According to U.S. GAAP, gains and losses on forwardcontracts are only accrued to the extent the future con-tract is intended for a specific purpose and effectivelyhedges a firm commitment. Forward contracts that donot meet these criteria are reported at fair market valueand unrealised gains and losses are reported as income.
Latin American operations are an integral part ofScania, and translation of their financial statements toSwedish kronor occurs according to the monetary/non-monetary method of accounting. According to U.S.GAAP, from 1998 onward, translation of Latin Americanoperations must occur according to the current method.
The Group utilises forward contracts in U.S. dollars
to hedge the net capital expenditures of the Latin Ameri-can companies, since their assets consist primarily ofU.S. dollars. In the Swedish consolidated accounts,translation differences are transferred directly to share-holders’ equity. Up to and including 1997, according toU.S. GAAP, these translation differences and the fairmarket value of these forward contracts should havebeen reported in the income statement.
(d) Capitalisation of expensesIn accordance with Swedish accounting principles, thecompany has capitalised pre-operating expenses pertain-ing to production facilities. According to U.S. GAAP,such expenses are charged to income in the period theyactually arise.Swedish accounting principles differ in certain respectsfrom U.S. GAAP. The differences that have a materialeffect on the net income and shareholders’ equity of theScania Group are as follows:
FINANCIAL INFORMATION IN ACCORDANCEWITH U.S. GENERALLY ACCEPTEDACCOUNTING PRINCIPLES (U.S. GAAP)
Net income 1999 1998 1997
Net income according to Swedish GAAP 3,146 2,250 1,943
Goodwill (a) –12 –12 –12
Pension costs (b) – 43 –2 12
Transactions in foreign currency (c) 175 –17 338
Capitalisation of expenses (d) 10 12 12
Tax effect of U.S. GAAP adjustments –2 11 –78
Change in net income 128 –8 272
Net income according to U.S. GAAP 3,274 2,242 2,215
Earnings per share according to U.S. GAAP 16.40 11.20 11.10
Shareholders’ equity 1999 1998 1997
Shareholders’ equityaccording to Swedish GAAP 13,548 11,851 10,353
Reporting of goodwill etc (a) 324 336 348
Pension costs (b) 200 243 245
Transaction in foreign currency (c) –769 –220 –
Capitalisation of expenses (d) – –10 –22
Tax effect of U.S. GAAP adjustments –52 –50 –60
Change in shareholders’ equity –297 299 511
Shareholders’ equity according to U.S. GAAP 13,251 12,150 10,864

57
PROPOSED DISTRIBUTION OF EARNINGS
The Scania Group’s unrestricted shareholders’ equity according to the consolidated balance sheet amounts to SEK7,195 m., of which net income for the year is SEK 3,146 m. The Board of Directors and the President propose thatthe following amounts at the disposal of the Annual Meeting:
SEK m.
Retained earnings 5,943
Net income for the year 2,081
Total 8,024
be distributed as follows:
To the shareholders, a dividend of SEK 7.00 per share 1,400
To be carried forward 6,624
Total 8,024
After implementing the proposed distribution of earnings,the shareholders’ equity of the Parent Company is as follows:
SEK m.
Share capital 2,000
Statutory reserve 1,120
Retained earnings 6,624
Total 9,744
Södertälje, 5 April 2000
Anders ScharpChairman
Peggy Bruzelius Clas Åke Hedström Rolf Stomberg
Mauritz Sahlin Kjell Wallin Marcus Wallenberg
Björn Svedberg Cees J.A. van Lede Jan Westberg
Leif ÖstlingPresidentand CEO
Our auditors’ report was submitted on 5 April 2000
Caj Nackstad Gunnar WidhagenAuthorised Public Accountant Authorised Public Accountant
58
AUDITORS ’ REPORT
To the Annual General Meeting of the shareholders of Scania AB (publ)
Corporate ID number: 556184-8564
We have audited the annual accounts, the consolidated accounts, the accounting records and the administration of the board of directors and the managing directorof Scania AB for the financial year 1999. These accounts and the administration ofthe company are the responsibility of the board of directors and the managing director.Our responsibility is to express an opinion on the annual accounts, the consolidatedaccounts and the administration based on our audit.
We conducted our audit in accordance with generally accepted auditing standardsin Sweden. Those standards require that we plan and perform the audit to obtain reasonable assurance that the annual accounts and the consolidated accounts arefree of material misstatement. An audit includes examining, on a test basis, evidencesupporting the amounts and disclosures in the accounts. An audit also includesassessing the accounting principles used and their application by the board of directorsand the managing director, as well as evaluating the overall presentation of informa-tion in the annual accounts and the consolidated accounts. As a basis for our opinionconcerning discharge from liability, we examined significant decisions, actions takenand circumstances of the company in order to be able to determine the liability, if any,to the company of any board member or the managing director. We also examinedwhether any board member or the managing director has, in any other way, acted incontravention of the Companies Act, the Annual Accounts Act or the Articles ofAssociation. We believe that our audit provides a reasonable basis for our opinionset out below.
The annual accounts and the consolidated accounts have been prepared in accord-ance with the Annual Accounts Act and, thereby, give a true and fair view of the com-pany’s and the group’s financial position and results of operations in accordancewith generally accepted accounting principles in Sweden.
We recommend to the general meeting of shareholders that the income statementsand balance sheets of the parent company and the group be adopted, that the profitfor the parent company be dealt with in accordance with the proposal in the adminis-tration report and that the members of the board of directors and the managing director be discharged from liability for the financial year.
Södertälje, 5 April 2000
Caj Nackstad Gunnar WidhagenAuthorised Public Accountant Authorised Public Accountant
KPMG Ernst & Young AB

59
VALUE-ADDED
Per Per Per Amounts in SEK m. Total employee Total employee Total employeeper employee in SEK thousands 1999 1999 1998 1998 1997 1997Sales including income fromcustomer finance operations 47,250 2,056 45,403 2,079 39,792 1,786Cost of purchased goods and services –32,786 –1,427 –32,448 –1,486 –27,986 –1, 256Value-added 14,464 629 12,955 593 11,806 530
BREAKDOWN OF VALUE-ADDEDEmployeesWages and salaries 5,649 39% 246 5,575 43% 255 5,451 46% 245Pensions and mandatory payroll fees 2,148 15% 93 2,213 17% 101 1,919 16% 86Total 7,797 54% 339 7,788 60% 356 7,370 62% 331
National and local governmentsCorporate income taxes 1,250 9% 54 850 7% 39 672 6% 30
LendersCost of net borrowing 545 4% 24 378 3% 18 296 3% 13
ShareholdersDividend paid 1,300 9% 57 1,100 8% 50 1,100 9% 49
Returned to operationsFor wear and tear to fixed assets (depreciation) 1,886 13% 82 1,860 14% 85 1,654 14% 75For continued expansion 1,686 11% 73 979 8% 45 714 6% 32
Total retained in operations 3,572 24% 155 2,839 22% 130 2,368 20% 107
Value-added 14,464 100% 629 12,955 100% 593 11,806 100% 530

60
SALES AND INCOME BY QUARTER
Quarter 1, January–March Quarter 2, April–June1999 1998 1997 1996 1999 1998 1997 1996
Sales, unitsTrucks 12,013 10,679 9,190 10,658 11,039 11,881 11,023 10,028Buses 897 990 969 1,033 920 1,160 1,251 1,293Total 12,910 11,669 10,159 11,691 11,959 13,041 12,274 11,321
Sales, SEK m.European operations 9,767 8,195 6,412 6,927 9,218 8,839 7,403 6,557Latin American operations 962 1,404 1,400 1,067 1,139 1,658 1,831 1,176Less intra-Group sales –183 – 498 –95 –121 –249 – 431 –313 –139Total Scania products 10,546 9,101 7,717 7,873 10,108 10,066 8,921 7,594Svenska Volkswagen products 1,233 1,322 1,087 853 1,532 1,538 1,216 1,056Total 11,779 10,423 8,804 8,726 11,640 11,604 10,137 8,650
Operating income, SEK m.European operations 1,244 761 554 1,155 1,313 978 513 973Latin American operations –96 –216 13 19 –158 –55 194 18Customer finance operations 30 23 18 15 39 15 15 15Total Scania products 1,178 568 585 1,189 1,194 938 722 1,006Svenska Volkswagen products 62 61 57 40 69 72 59 58Total 1,240 629 642 1,229 1,263 1,010 781 1,064
Income after financial items, SEK m. 1,110 552 577 1,113 1,130 937 771 989Net income, SEK m. 770 390 409 792 784 664 571 720Earnings per share, SEK 3.85 1.95 2.05 3.95 3.90 3.30 2.85 3.60
Operating margin, percentEuropean operations 12.7 9.3 8.6 16.7 14.2 11.1 6.9 14.8Latin American operations –10.0 –15.4 0.9 1.8 –13.9 –3.3 10.6 1.5Scania products 11.2 6.2 7.6 15.1 11.8 9.3 8.1 13.2Svenska Volkswagen products 5.0 4.6 5.2 4.7 4.5 4.7 4.9 5.5Total 10.5 6.0 7.3 14.1 10.9 8.7 7.7 12.3
KEY FINANCIAL RATIOS* AND DEFINITIONS1999 1998 1997 1996
Earnings per share, SEK 15.75 11.25 9.70 9.90Earnings per share according to U.S GAAP, SEK 16.40 11.20 11.10 10.30Return on shareholders’ equity, % 25.1 20.7 20.2 22.7Profit margin, % 11.2 8.3 8.6 10.5Capital turnover rate, times 1.90 2.09 1.89 1.76Return of capital employed, % 21.4 17.4 16.2 18.5Debt/equity ratio 0.61 0.55 0.69 0.64Interest coverage, times 5.9 6.1 4.8 4.1Equity/assets ratio, % 26.0 26.5 27.0 28.1
* Unless otherwise indicated, calculations are based on an average for five measurement points (quarters).

61
Quarter 3, July–September Quarter 4, October–December1999 1998 1997 1996 1999 1998 1997 1996
10,223 10,080 9,441 8,113 13,376 12,913 12,738 10,229957 958 1,160 747 989 1,009 1,204 890
11,180 11,038 10,601 8,860 14,365 13,922 13,942 11,119
8,561 7,686 6,470 5,155 10,664 10,352 8,776 7,0171,193 1,709 1,950 1,307 1,266 1,380 1,792 1,204–292 –404 –252 –90 –318 –215 –287 –106
9,462 8,991 8,168 6,372 11,612 11,517 10,281 8,1151,185 1,394 1,079 818 1,432 1,383 1,250 1,049
10,647 10,385 9,247 7,190 13,044 12,900 11,531 9,164
1,123 860 404 55 1,303 1,314 838 93– 68 –96 132 10 – 6 –295 68 464
32 25 17 12 39 28 23 131,087 789 553 77 1,336 1,047 929 570
52 62 67 59 67 55 75 581,139 851 620 136 1,403 1,102 1,004 628
984 753 503 40 1,276 972 900 564709 526 339 18 883 670 624 4443.55 2.65 1.70 0.10 4.40 3.35 3.10 2.20
13.1 11.2 6.2 1.1 12.2 12.7 9.5 1.3–5.7 –5.6 6.8 0.8 –0.5 –21.4 3.8 38.511.5 8.8 6.8 1.2 11.5 9.1 9.0 7.04.4 4.4 6.2 7.2 4.7 4.0 6.0 5.5
10.7 8.2 6.7 1.9 10.8 8.5 8.7 6.9
Earnings per shareNet income divided by the number of shares.
Return on shareholders’ equityNet income as a percentage of shareholders’ equity.
Profit marginOperating income excluding customer finance operations plusfinancial income as a percentage of sales.
Capital turnover rateSales divided by capital employed (total assets less non-interest-bearing liabilities), with customer finance operations reportedaccording to the equity method.
Return on capital employedOperating income excluding customer finance operations plusfinancial income as a percentage of capital employed, with cus-tomer finance operations reported according to the equity method.
Debt/equity ratioShort- and long-term borrowings (excluding pension liabili-ties and net indebtedness in customer finance operations)less liquid assets, divided by shareholders’ equity.
Interest coverageOperating income plus financial income divided by finan-cial expenses.
Equity/assets ratioShareholders’ equity as a percentage of total assets, includ-ing customer finance operations, on each respective balancesheet date.

62
SEK m. unless otherwise indicated 1999 1998 1997 1996 1995 1994 1993 1992 1991 1990 1989
Sales by market area
Western Europe 33,249 28,962 23,102 21,009 21,715 14,880 10,920 11,424 12,218 12,838 12,612
Central and eastern Europe 1,330 1,814 1,398 827 732 266 195 289 133 114 34
Europe 34,579 30,776 24,500 21,836 22,447 15,146 11,115 11,713 12,351 12,952 12,646
Latin America 4,247 5,974 6,798 4,800 5,742 6,109 4,619 3,040 2,566 2,920 2,982
Asia 1,118 1,018 1,932 1,740 1,904 1,504 1,171 1,084 2,286 863 1,257
Other markets 1,784 1,907 1,857 1,578 1,623 1,329 1,062 715 787 936 1,046
Total, Scania products 41,728 39,675 35,087 29,954 31,716 24,088 17,967 16,552 17,990 17,671 17,931
Sales by area of operation
European operations 38,210 35,072 29,061 25,656 26,547 18,542 13,651 13,682 15,626 14,914 15,088
Latin American operations 4,560 6,151 6,973 4,754 5,933 6,108 4,619 3,040 2,566 2,920 2,982
Less intra-Group sales –1,042 –1,548 –947 – 456 –764 –562 –303 –170 –202 –163 –139
Total, Scania products 41,728 39,675 35,087 29,954 31,716 24,088 17,967 16,552 17,990 17,671 17,931
Svenska Volkswagen products 5,382 5,637 4,632 3,776 3,124 2,560 2,222 1,470 1,399 1,377 1,602
Total 47,110 45,312 39,719 33,730 34,840 26,648 20,189 18,022 19,389 19,048 19,533
Operating income
European operations 4,983 3,913 2,309 2,276 4,598 2,816 488 1,069 1,452 2,072 2,526
Latin American operations –328 –662 407 511 413 915 483 242 136 441 501
Customer finance operations 140 91 73 55 98 5 –91 –38 –23 – –
Total, Scania products 4,795 3,342 2,789 2,842 5,109 3,736 880 1,273 1,565 2,513 3,027
Svenska Volkswagen products 250 250 258 215 243 173 121 33 86 17 155
Total 5,045 3,592 3,047 3,057 5,352 3,909 1,001 1,306 1,651 2,530 3,182
Operating margin, %
European operations 13.0 11.2 7.9 8.9 17.3 15.2 3.6 7.8 9.3 13.9 16.7
Latin American operations –7.2 –10.8 5.8 10.7 7.0 15.0 10.5 8.0 5.3 15.1 16.8
Total, Scania products 11.5 8.4 7.9 9.5 16.1 15.5 4.9 7.7 8.7 14.2 16.9
Svenska Volkswagen products 4.6 4.4 5.6 5.7 7.8 6.8 5.4 2.2 6.1 1.2 9.7
Total 10.7 7.9 7.7 9.1 15.4 14.7 5.0 7.2 8.5 13.3 16.3
Gross capital expenditures for property, plant and equipment, excluding leasing assets
European operations 1,522 1,582 1,592 1,908 1,727 1,851 1,209 1,319 1,201 1,380 967
Latin American operations 354 444 974 671 455 298 276 182 107 154 157
Total 1,876 2,026 2,566 2,579 2,182 2,149 1,485 1,501 1,308 1,534 1,124
Research and development expenses
Research and development 1,267 1,168 1,248 1,084 923 805 783 738 761 619 466
Inventory turnover rate, times1
6.5 6.3 6.3 5.7 6.7 6.5 4.9 4.3 4.4 4.2 4.6
1 Calculated as sales divided by average inventory.
MULTI-YEAR STATISTICAL REVIEW

63
1999 1998 1997 1996 1995 1994 1993 1992 1991 1990 1989
Vehicles produced, units
European operations
Trucks 39,794 38,886 33,092 31,316 33,459 23,367 16,014 19,893 23,721 23,853 26,616
Buses 2,528 2,818 2,817 2,326 2,373 1,542 1,176 1,557 1,321 1,462 2,119
Latin American operations
Trucks 5,985 6,660 10,463 7,139 8,515 8,570 6,610 4,587 4,234 4,765 5,744
Buses 1,175 1,697 1,769 1,575 2,091 1,303 1,393 2,533 2,626 1,688 1,771
Total 49,482 50,061 48,141 42,356 46,438 34,782 25,193 28,570 31,902 31,768 36,250
Trucks sold by market area, units
Western Europe 36,106 32,686 26,756 26,249 26,596 17,814 13,052 16,366 18,463 20,749 22,912
Central and eastern Europe 1,551 2,237 1,833 1,030 951 312 248 507 260 254 80
Latin America 6,253 7,621 9,649 7,377 7,964 8,713 6,678 4,734 4,293 4,558 5,067
Asia 1,481 1,410 3,096 2,997 3,329 2,818 2,256 2,440 5,530 1,731 2,549
Other markets 1,260 1,599 1,058 1,375 1,627 1,178 851 611 587 991 1,110
Total 46,651 45,553 42,392 39,028 40,467 30,835 23,085 24,658 29,133 28,283 31,718
Buses and coaches sold by market area, units
Western Europe 1,935 1,731 1,595 1,655 1,642 983 835 879 1,067 1,199 1,448
Central and eastern Europe 67 106 95 83 45 40 35 16 2 2 0
Latin America 1,237 1,697 1,829 1,641 1,878 1,287 1,459 2,677 2,493 1,645 1,676
Asia 160 78 308 309 304 140 133 249 144 224 499
Other markets 364 505 757 275 301 237 215 355 276 233 261
Total 3,763 4,117 4,584 3,963 4,170 2,687 2,677 4,176 3,982 3,303 3,884
Total market for heavy trucks and buses, units
Western Europe
Trucks 235,900 207,300 170,300 172,000 173,300 133,300 114,100 149,000 170,000 176,000 189,000
Buses 21,800 21,000 18,300 17,800 15,900 13,600 15,600 16,500 17,200 19,000 19,000
Brazil
Trucks 13,456 15,763 17,861 13,682 19,299 18,931 13,938 8,402 9,389 9,524 9,606
Buses 8,057 13,438 13,424 15,087 16,969 12,266 11,073 13,222 16,220 9,730 8,994
Employees , number2
European operations
Production companies 13,233 13,485 13,197 13,004 14,364 12,374 10,493 11,417 12,736 13,218 13,830
Marketing companies 8,755 6,194 6,160 4,877 4,050 3,694 3,823 4,278 4,043 4,219 4,332
Total, European operations 21,988 19,679 19,357 17,881 18,414 16,068 14,316 15,695 16,779 17,437 18,162
Latin American operations 3,660 3,714 4,299 4,250 4,520 4,285 4,217 4,433 4,941 4,767 4,713
Customer finance companies 166 144 107 75 90 72 60 65 52 34 33
Total 25,814 23,537 23,763 22,206 23,024 20,425 18,593 20,193 21,772 22,238 22,908
2 Including contract employees.

64
BOARD OF DIRECTORS
Leif Östling Anders Scharp Clas Åke Hedström Marcus Wallenberg Rolf Stomberg
Leif ÖstlingBorn 1945. Member since 1994.President and CEO of Scania AB.Other directorships in BT Industries ABand Beers N.V.Shares in Scania: 50,000
Anders ScharpBorn 1934. Chairman since 1994.Chairman of Atlas Copco AB, Saab AB,AB SKF and the Swedish Employers’Confedaration. Other directorships: Investor AB and the Federation of Swedish Industries, among others. Shares in Scania: 17,779
Clas Åke HedströmBorn 1939. Member since 1995.President and CEO of Sandvik AB.Other directorships: Association ofSwedish Engineering Industries and Federation of Swedish Industries.Shares in Scania: 1,000
Marcus WallenbergBorn 1956. Member since 1994.President and CEO of Investor AB. Vice Chairman of Telefon AB L M Ericsson and Saab AB. Other director-ships: AstraZeneca AB, AstraZenecaUK, Skandinaviska Enskilda Banken,SAS Assembly of Representatives, StoraEnso Oy and the Knut and Alice Wallen-berg Foundation. Shares in Scania: 51,000
Rolf StombergBorn 1940. Member since 1998.Chairman of John Mowlem & Co PLC,United Kingdom and Unipoly SA, Lux-emburg. Other directorships: ProudfootPlc, United Kingdom, Reed InternationalPlc, United Kingdom, Smith & Nephewplc, United Kingdom, Cordiant Com-munications plc and Cordiant Commu-nications Group Trustees Ltd, UnitedKingdom, TPG Group, Netherlands,Stinnes AG, Germany, Dresdner BankAG, Germany and Gerling-Konzern,Germany.Shares in Scania: 1,000
Mauritz SahlinBorn 1935. Member since 1996.Chairman of Novare Kapital AB, Flex-link AB, Air Liquide AB, Champs(Chalmers), Imego AB, IRO AB, WestSweden Chamber of Commerce and In-dustry and Korsvägen AB. Other direc-torships: Investor AB, Sandvik AB, Fed-eration of Swedish Industries, BillesTryckeri and Chalmers University ofTechnology.Shares in Scania: 0

65
Mauritz Sahlin Peggy Bruzelius Cees J.A. van Lede Björn Svedberg Sören Westerholm Kjell Wallin Monica Torgrip Jan Westberg
The work of the BoardAccording to the work scheduleadopted by the Board of Direc-tors, it holds seven regular meet-ings per year. Beyond this, the Board may meet when circum-stances so warrant. During 1999,a number of extra meetings wereheld as a consequence of Volvo’sacquisitions of shares in, andpublic offer for, Scania.
The February, April, Augustand October/November meetingsare devoted primarily to financialreporting. The statutory meetingafter the Annual General Meetingfocuses chiefly on the Board’s workschedule, instructions to the Presi-dent and compensation issues.
In June, the Board discussescapital expenditure issues. TheDecember meeting focuses espe-cially on operational planning andfuture-oriented issues. Beyondthis, all meetings deal with mattersof a more current nature as wellas capital expenditures.
The Board’s instructions to thePresident specify his duties andpowers. Board policy documentson capital expenditures, financing,communication and reporting arealso appended to the instructions.
With one exception, the Boardhas refrained from appointingsub-committees. Compensationissues for the President and cer-tain other senior executives arehandled by a committee consist-ing of Anders Scharp, Rolf Stom-berg and Marcus Wallenberg.
Owing to its limited number ofmembers, the Board achieves effi-ciency, while all members receivecomplete information on all mattersthat are dealt with by the Board.
Peggy BruzeliusBorn 1949. Member since 1998.Chairman of Grand Hotel Holdings AB,Lancelot Asset Management AB. Other di-rectorships: Electrolux AB, Swedish TradeCouncil, Industry and Commerce StockExchange Committee, Securities Council,Axel Johnson AB, Förvaltnings AB Ratos,Drott AB, Celsius AB and D&D Daglig-varor AB.Shares in Scania: 2,000
Cees J. A. van LedeBorn 1942. Member since 1999.Chairman of Akzo Nobel N.V., The Netherlands.Shares in Scania: 0
Björn SvedbergBorn 1937. Member since 1999.Chairman of Chalmers University ofTechnology. Other directorships GambroAB, Investor AB and Saab AB, among others.Shares in Scania: 800
Sören WesterholmBorn 1953. Deputy Member since 1994.Employee representative and Chairman ofthe Metal Workers’ Union at Scania,Oskarshamn.Shares in Scania: 0
Kjell WallinBorn 1943. Member since 1998.Employee Representative and Chairmanof the Metal Workers’ Union at Scania,Södertälje.Shares in Scania: 0
Monica TorgripBorn 1966. Deputy Member since 1998.Employee Representative and Chairmanof the Swedish Union of Professionals.Shares in Scania: 0
Jan WestbergBorn 1944. Member since 1996.Employee Representative for the Federationof Salaried Employees in Industri and Ser-vices.Shares in Scania: 0
AuditorsCaj NackstadAuthorised Public Accountant, KPMG
Gunnar WidhagenAuthorised Public Accountant, Ernst & Young AB
Deputy Auditors
Thomas ThielAuthorised Public Accountant, KPMG
Björn FernströmAuthorised Public Accountant,Ernst & Young AB

66
GROUP MANAGEMENT
1 Left the company on 11 February 2000. Until further notice, Leif Östling is responsible for Development and Production.
Executive Board
Leif ÖstlingBorn 1945. Joined Scania in 1972.President and CEO Shares in Scania: 50,000
Reporting to Leif Östling: Buses & CoachesIndustrial & Marine Engines
Arne KarlssonBorn 1944. Joined Scania in 1978.Executive Vice President Finance and Business ControlShares in Scania: 166
Reporting to Arne Karlsson: Corporate ControlFinanceLatin American OperationsAnd certain corporate staff units
Håkan Samuelsson 1
Born 1951. Joined Scania in 1977.Executive Vice President Development and ProductionShares in Scania: 5,350
Reported to Håkan Samuelsson: Industrial BenchmarkingResearch & Truck DevelopmentTruck ManufacturingPowertrainProcurement & Industrial Development
Kaj LindgrenBorn 1945. Joined Scania in 1977, employed until 1984. Rejoined Scania in 1989.Group Vice President Corporate DevelopmentShares in Scania: 0
Reporting to Kaj Lindgren: Corporate CommunicationsCorporate Human ResourcesGeneral CounselAnd certain corporate staff units
Urban ErdtmanBorn 1945. Joined Scania in 1981.Group Vice President Sales and MarketingShares in Scania: 3,226
Reporting to Urban Erdtman: Sales and Marketing EuropeSales and Marketing OverseasAnd certain corporate staff units
Leif Östling Arne Karlsson Kaj Lindgren Urban Erdtman

67
Corporate Units
Ulf Egestrand 2
Born 1956. Joined Scania in 1998.Senior Vice President FinanceShares in Scania: 0
Jan Gurander 3
Born 1961. Joined Scania in 1995.Senior Vice President Finance Shares in Scania: 0
Magnus HahnBorn 1955. Joined Scania in 1985.Acting Head of Corporate CommunicationsShares in Scania: 0
Kaj HolmeliusBorn 1940. Joined Scania in 1966.Senior Vice President Industrial BenchmarkingShares in Scania: 1,116
Peter HärnwallBorn 1955. Joined Scania in 1983.Senior Vice President Corporate ControlShares in Scania: 166
Louise Jarn MelanderOn leave of absence.Born 1954. Joined Scania in 1998.Senior Vice President Corporate CommunicationsShares in Scania: 100
Margareta LewinBorn 1951. Joined Scania in 1999.Senior Vice President Corporate Human ResourcesShares in Scania: 0
Carl RibenBorn 1950. Joined Scania in 1986.Senior Vice President General CounselShares in Scania: 400
Corporate Sectors
Per HallbergBorn 1952. Joined Scania in 1977.Senior Vice PresidentPowertrainShares in Scania: 0
Lars OrehallBorn 1947. Joined Scania in 1974.Senior Vice President Research & Truck DevelopmentShares in Scania: 2,000
P O SvedlundBorn 1955. Joined Scania in 1976.Senior Vice President Procurement & IndustrialDevelopmentShares in Scania: 166
Kjell SvenssonBorn 1938. Joined Scania in 1972.Senior Vice President Truck ManufacturingShares in Scania: 25
Claes TorénBorn 1939. Joined Scania in 1962.Senior Vice President Sales & Marketing OverseasShares in Scania: 875
Business Units
Håkan EricssonBorn 1947. Joined Scania in 1975.Senior Vice President Buses & CoachesShares in Scania: 166
Jorma HalonenBorn 1948. Joined Scania in 1996.Senior Vice President Latin American OperationsShares in Scania: 0
Lennart HjelteBorn 1945. Joined Scania in 1966.Senior Vice President Industrial & Marine EnginesShares in Scania: 4,125
2 Assumed this position on 1 January 2000.3 Employed at Scania until 31 December 1999.
1. Lars Orehall, 2. P O Svedlund, 3. Kjell Svensson, 4. Lennart Hjelte, 5. Kaj Holmelius, 6. Håkan Ericsson, 7. Claes Torén, 8. Per Hallberg,9. Carl Riben, 10. Jorma Halonen, 11. Peter Härnwall, 12. Jan Gurander. 13. Ulf Egestrand, 14. Magnus Hahn, 15. Margareta Lewin
1.
2.
3.
4.
5.
6.
7.
8.
9.
10.
11.
12.
13.
14. 15.

68
ADDRESSES
Head Officeand Technical CentreScania ABSE-151 87 SödertäljeSwedenTel: +46 8 553 810 00Fax: +46 8 553 810 37
Production unitsScania ChassisStaffan GaråsSE-151 87 SödertäljeSwedenTel: +46 8 553 810 00Fax: +46 8 553 810 37
Scania TransmissionThomas KarlssonSE-151 87 SödertäljeSwedenTel: +46 8 553 810 00Fax: +46 8 553 810 37
Scania EngineJan HillerströmSE-151 87 SödertäljeSwedenTel: +46 8 553 810 00Fax: +46 8 553 810 37
Scania AxleStefan PalmgrenBox 1906SE-791 19 FalunSwedenTel: +46 23 477 00Fax: +46 23 71 13 79
Scania CabAnders NielsenBox 903SE-572 29 OskarshamnSwedenTel: +46 491 76 50 00Fax +46 491 76 54 30
Scania TransmissionAnders HolmbergSE-280 63 SibbhultSwedenTel: +46 44 495 00Fax: +46 44 481 08
Scania Buses & CoachesHåkan EricssonSE-641 81 KatrineholmSwedenTel: +46 150585 00Fax: +46 150 532 30
Ferruform AB Chassikomponenter Peter NormanBox 815SE-971 25 LuleåSwedenTel: +46 920 766 00Fax +46 920 896 10
Scania Busser Silkeborg A/S Curt ÅbergPostboks 309DK-8600 SilkeborgDenmarkTel: +45 87 22 32 00Fax: +45 87 22 32 90
Scania Production Angers S.A.Lars WreboB.P. 846FR-49008 Angers Cedex 01FranceTel: +33 2 41 41 20 00Fax: +33 2 41 41 20 48
Scania Nederland B.V.Production ZwolleStefan PalskogP.O. Box 618NL-8000 AP ZwolleThe NetherlandsTel: +31 38 497 76 11Fax: +31 38 497 79 11
Scania Kapena S.A.Kjell RosenlundGrunwaldzka 12PL-76-200 SlupskPolandTel: +48 59 844 06 87Fax: +48 59 843 66 01
Scania Argentina Production TucumánLars BjörkCasilla de Correo No. 3 Correo Central AR-4000 San Miguel deTucumánArgentinaTel: +54 3 814 509 000Fax: +54 3 814 509 001
Scania Latin America Production São PauloArne CarlssonCaixa Postal 188BR-09810-902 São Bernardo doCampo-SPBrazilTel: +55 11 752 9333Fax: +55 11 451 2659
Scania de México S.A. DE C.V.Production San Luís de PotosíStig ÖsteliusProlongación Avenida Industrias, 4640Esquina Eje 134 MX-C P 78395 Zona IndustrialSan Luís de PotosíMexicoTel: +52 48 240 505Fax: +52 48 240 504
DistributorsScania Argentina S.A. Elmar AxelssonPiedrabuena 5400 (1615) Gran Bourg Partido Malvinas ArgentinasAR-Buenos AiresArgentinaTel: +54 3 327 451 000Fax: +54 3 327 451 001
Scania Australia Pty Ltd Harry PostemaPrivate Mail Bag 11 Campbellfield, AU-Victoria 3061AustraliaTel: +61 392 173 300Fax: +61 393 053 898
Scania Österreich GmbHHåkan SundströmPostfach 50AT-2345 Brunn am GebirgeAustriaTel: +43 223 639 020Fax: +43 223 639 0286
Scania Belgium SA-NVPer-Erik LindquistJ.F. Kennedylaan 4BE-1831 DiegemBelgiumTel: +32 2 722 8411Fax: +32 2 722 8400
Scania Latin America LtdaJorma HalonenCaixa Postal 188BR-09810-902 São Bernardo do Campo-SPBrazilTel: +55 11 752 9333Fax: +55 11 451 2659
Scania Bulgaria EOODMilcho MilchevMilin Kamak str. 25, 1st floorBG-Sofia 1421BulgariaTel: +359 265 90 09Fax: +359 265 84 60
Scania Chile S.A.Richard KönigPanamericana Norte 9850QuilicuraCL-SantiagoChileTel: +56 2 738 60 00Fax: +56 2 738 60 60
Scania Hrvatska D O O(Scania Croatia)Kjell ÖrtengrenRadnicka 1910437 Rakitje-BestovjeHR-Zagreb-ZapadCroatiaTel: +385 133 230 53Fax: +385 133 230 54
Scania Czech Republic s.r.o.Anders GrundströmerChrástany 186CZ-252 19 Rudná u PrahyCzech RepublicTel: +420 2 579 507 00Fax: +420 2 579 512 24
Scania Danmark A/SJörgen DamkjaerPostbox 580DK-2730 Herlev (Copenhagen)DenmarkTel: +45 4454 2200Fax: +45 4454 2209
Scania Eesti AS Janno KaruPeterburi tee 72EE-11415 TallinnEstoniaTel: +372 6 651 200Fax: +372 6 651 208
Oy Scan-Auto Ab Kaj FärmPB 59FI-00391 HelsinkiFinlandTel: +358 10 555 010Fax: +358 10 555 5361
Scania France S.A.Patrick MoscaB.P. 106 FR-49001 Angers Cedex 01FranceTel: +33 2 414 133 33Fax: +33 2 413 476 25
Scania Deutschland GmbHGunnar RustadPostfach 10 04 26DE-56034 KoblenzGermanyTel: +49 261 8970Fax: +49 261 897 203
Scania (Great Britain) LtdUlf BundellTongwellGB-Milton Keynes MK15 8HB(Buckinghamshire)United KingdomTel: +44 1908 210 210Fax: +44 1908 215 040
Scania Hungaria Kft.Tibor CsászárRozália Park 1 HU-2051. BiatorbágyHungaryTel: +36 23 531 000Fax: +36 23 531 012
Italscania S.p.A Dieter MerzCasella Postale 646IT-38014 TrentoItalyTel: +39 046 199 6111Fax: +39 046 199 6198
Scania Korea LimitedStaffan Sjögren18th Floor, ConstructionBuilding71-2, Nonhyun-dongKangnam-ku, KR-Seoul (135-010)South KoreaTel: +82 2 511 7434Fax: +82 2 511 7439
Vilskana UABHåkan JydeLentvario g. 14BLT-2028 VILNIUSLithuaniaTel: +370 2 640 161Fax: +370 2 642 570
Scania Luxembourg S.A.Mats GunnarssonParc d’activitésLU-5365 MünsbachLuxembourgTel: +352 34 18 11 1Fax: +352 34 18 12
Scania de México S.A. de C.V.Ulf GrevesmühlBlvd Manuel Avila Camacho No 2900Oficina 601, Fracc los Pirules TlalnepantlaMX-Edo de MéxicoC P 54040 MexicoTel: +52 5 379 73 61Fax: +52 5 379 74 29
Scania Maroc S.A.Marc Haezenberghe97, Bd AbdelmoumenMA-CasablancaMoroccoTel: +212 2 262 924Fax: +212 2 262 915
Beers Bedrijfsauto B.V.Ruud van YperenPostbus 460NL-2260 MH Leid-schendamThe NetherlandsTel: +31 704 182 418Fax: +31 704 182 510
Norsk Scania ASJaap BergemaPostboks 143, Sköyen NO-0212 OSLO 2 NorwayTel: +47 220 645 00Fax: +47 220 645 99
Scania del Perú S.A.Per HolmströmApartado 3190PE-LIMA 34PeruTel: +51 1 241 3016Fax: +51 1 241 6391
Scania Polska S.A. Christoffer LjungnerAl. Katowicka 316Stara Wies k/WarszawyPL-05-830 Nadarzyn PolandTel: +48 22 739 9339Fax: +48 22 739 9344
Scania RussiaP G NilssonOdintsovsky district, GolitsynoMinskoje shosse 43 kmRU-143040 Moscow RegionRussiaTel: +7 095 787 5000Fax: +7 095 787 5002
Scania Slovenija d.o.oKjell ÖrtengrenCesta v Mestni log, 90SI-1000 LjubljanaSloveniaTel: +386 61 339 511Fax: +386 61 339 562
Scania South Africa (Pty) LtdJan JarlhageP.O. 587ZA-Mondeor 2110South AfricaTel: +27 11 494 52 04Fax: +27 11 494 15 24
Scania Hispania S.A. José BadíaApartado de Correos 304ES-28850 Torrejón de Ardoz-MadridSpainTel: +34 91 678 80 00Fax: +34 91 675 74 50
Scania Sverige ABChrister SkogsborgSE-151 87 Södertälje SwedenTel: +46 8 553 864 00Fax: +46 8 553 864 33
Scania Truck AGStein IngvoldstadSteinackerstrasse 55 CH-8302 KlotenSwitzerlandTel: +41 1 800 13 00Fax: +41 1 800 13 01
Scania UkraineBerth Carreman2, Trublaini Str.UA-252134 KievUkraineTel: +380 44 490 74 90Fax: +380 44 490 77 71
Scania USA Inc.Claes Sundberg121 Interpark Blvd, Suite 601US-San Antonio, TX 78216USATel: +1 210 403 00 07Fax: +1 210 403 02 11
Finance companiesScania Finans ABAndreas FlognfeldtSE-151 87 SödertäljeSwedenTel: +46 8 553 837 50 Fax: +46 8 553 837 66
Scania Finance Belgium N.V.Bert PeetersMinervastraat 8BE-1930 ZaventemBelgiumTel: +32 271 56500Fax: +32 272 19442
Scania Finance Deutschland GmbHKoen KnoopsAugust Horch Strasse 10DE-5400 KoblenzGermanyTel: +49 261 897 303Fax: +49 261 897 313
Scania Finance France S.A.Pierre de BantelB P 928FR-49009 Angers Cedex 01 FranceTel: +33 241 41 33 33Fax: +33 241 34 70 46
Scania Finance Great Britain LtdPeter TaylorTongwellGB-Milton KeynesMK15 8HB,Buckinghamshire United KingdomTel: +44 1 908 210 210Fax: +44 1 908 216 675
FISCAR S.p.ASven AntonssonVia dei Giardini n. 10IT-20121 MilanoItalyTel: +39 02 6592314Fax: +39 02 6592316
Scania Finance Czech RepublicZuzana TomeckovaChrastany 186CZ-252 19 Posta Rudná u PrahyCzech RepublicTel: +420 2 57950700Fax: +420 2 57950731
Scania Finance Polska Sp.z.o.o.Aleja Katowicka 31bStara Wies gm NadarzynPL-05-830 Nadarzyn PolandTel: +48 22 739 93 40Fax: +48 22 739 97 20
Scania Credit ABFerike PasthySE-151 87 SödertäljeSwedenTel: +46 8 553 836 60Fax: +46 8 553 837 24

Scania AB (publ) SE-151 87 Södertälje, Sweden
Tel: +46 8 55 38 10 00, www.scania.com


![Analyse de l’efficacité et de la variation de la …...les assureurs [Cummins et Weiss (1993) et Cummins (1999)], surtout en contexte américain. Dans cet essai, nous entendons](https://img.pdfslide.net/doc/110x75/5fc7d18a4cd5077cfa33c373/analyse-de-laefficacit-et-de-la-variation-de-la-les-assureurs-cummins-et.jpg)