Embed Size (px)
Citation preview
14 March 2019
Scania AB (publ) Corporate identity number 556184-8564
151 87 Södertälje Sweden www.scania.com
Tel: +46 8 553 810 00 Fax +46 8 553 810 37
Scania Year-end Report January–December 2018
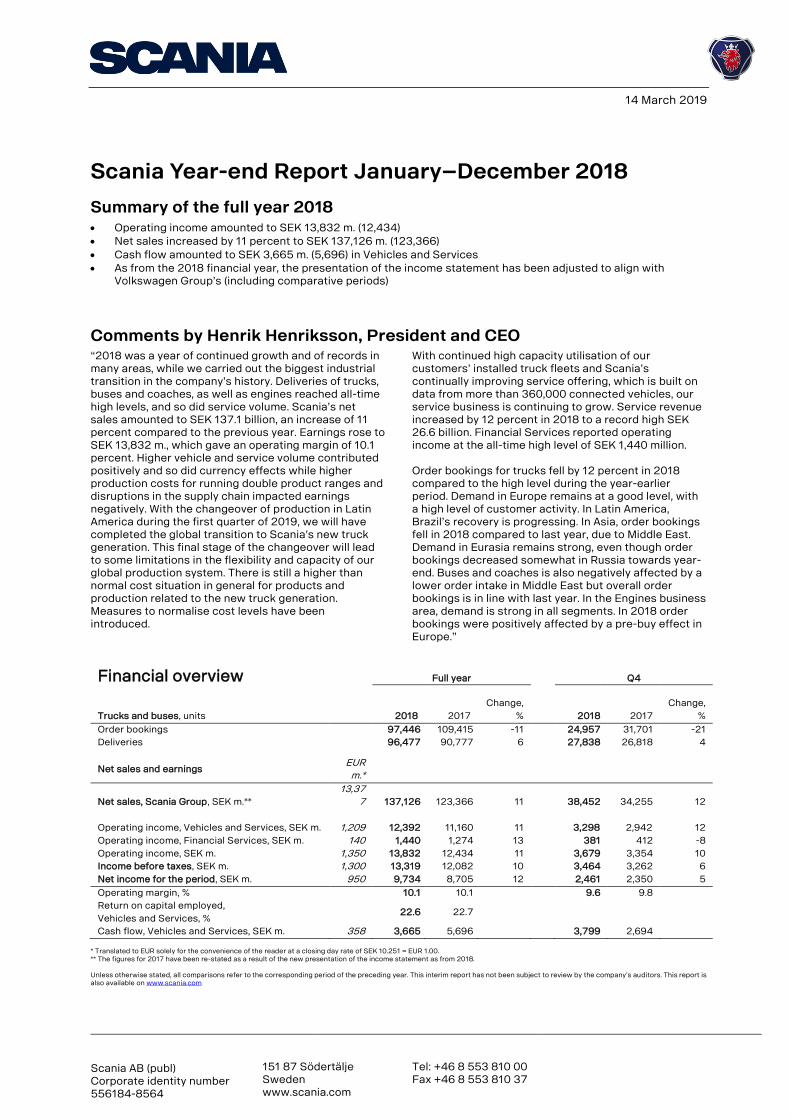
Summary of the full year 2018 • Operating income amounted to SEK 13,832 m. (12,434)
• Net sales increased by 11 percent to SEK 137,126 m. (123,366)
• Cash flow amounted to SEK 3,665 m. (5,696) in Vehicles and Services
• As from the 2018 financial year, the presentation of the income statement has been adjusted to align with Volkswagen Group’s (including comparative periods)
Comments by Henrik Henriksson, President and CEO “2018 was a year of continued growth and of records in many areas, while we carried out the biggest industrial transition in the company’s history. Deliveries of trucks, buses and coaches, as well as engines reached all-time high levels, and so did service volume. Scania’s net sales amounted to SEK 137.1 billion, an increase of 11 percent compared to the previous year. Earnings rose to SEK 13,832 m., which gave an operating margin of 10.1 percent. Higher vehicle and service volume contributed positively and so did currency effects while higher production costs for running double product ranges and disruptions in the supply chain impacted earnings negatively. With the changeover of production in Latin America during the first quarter of 2019, we will have completed the global transition to Scania’s new truck generation. This final stage of the changeover will lead to some limitations in the flexibility and capacity of our global production system. There is still a higher than normal cost situation in general for products and production related to the new truck generation. Measures to normalise cost levels have been introduced.
With continued high capacity utilisation of our customers’ installed truck fleets and Scania’s continually improving service offering, which is built on data from more than 360,000 connected vehicles, our service business is continuing to grow. Service revenue increased by 12 percent in 2018 to a record high SEK 26.6 billion. Financial Services reported operating income at the all-time high level of SEK 1,440 million. Order bookings for trucks fell by 12 percent in 2018 compared to the high level during the year-earlier period. Demand in Europe remains at a good level, with a high level of customer activity. In Latin America, Brazil’s recovery is progressing. In Asia, order bookings fell in 2018 compared to last year, due to Middle East. Demand in Eurasia remains strong, even though order bookings decreased somewhat in Russia towards year-end. Buses and coaches is also negatively affected by a lower order intake in Middle East but overall order bookings is in line with last year. In the Engines business area, demand is strong in all segments. In 2018 order bookings were positively affected by a pre-buy effect in Europe.”
Financial overview Full year Q4
Trucks and buses, units 2018 2017
Change,
% 2018 2017
Change,
%
Order bookings 97,446 109,415 -11 24,957 31,701 -21
Deliveries 96,477 90,777 6 27,838 26,818 4
Net sales and earnings EUR
m.*
Net sales, Scania Group, SEK m.**
13,37
7 137,126 123,366 11 38,452 34,255 12
Operating income, Vehicles and Services, SEK m. 1,209 12,392 11,160 11 3,298 2,942 12
Operating income, Financial Services, SEK m. 140 1,440 1,274 13 381 412 -8
Operating income, SEK m. 1,350 13,832 12,434 11 3,679 3,354 10
Income before taxes, SEK m. 1,300 13,319 12,082 10 3,464 3,262 6
Net income for the period, SEK m. 950 9,734 8,705 12 2,461 2,350 5
Operating margin, % 10.1 10.1 9.6 9.8
Return on capital employed,
Vehicles and Services, % 22.6 22.7
Cash flow, Vehicles and Services, SEK m. 358 3,665 5,696 3,799 2,694 * Translated to EUR solely for the convenience of the reader at a closing day rate of SEK 10.251 = EUR 1.00. ** The figures for 2017 have been re-stated as a result of the new presentation of the income statement as from 2018. Unless otherwise stated, all comparisons refer to the corresponding period of the preceding year. This interim report has not been subject to review by the company’s auditors. This report is also available on www.scania.com
Scania Year-end Report January-December 2018
Business overview
Sales performance
Total vehicle deliveries increased by 6 percent during 2018 to a record high 96,477 (90,777) units, compared to 2017. Group net sales rose by 11 percent to SEK 137,126 m. (123,366), also an all-time high for Scania. Currency effects had a positive impact on sales of 3 percent. Continued strong demand Order bookings for trucks and buses and coaches in 2018 fell by 11 percent to 97,446 (109,415) vehicles, compared to 2017. During the fourth quarter, Scania’s total order bookings for vehicles fell by 21 percent compared to the year-earlier period. Demand for trucks in Europe remains strong due to the positive economic situation combined with an expansion need and attractive financing levels. Transport growth is continuing, driven by basic industries such as forestry, agriculture and industrial goods. The shortage of drivers is currently hampering even stronger growth with European customers. In Latin America, demand is driven by the recovery in Brazil which is continuing. However, there is a long way to get back to the previous top levels. In Russia, there is a modernisation need and demand is still high, although political instability is affecting it somewhat negatively. In the region Asia, demand in Middle East fell drastically. In China, the European truck segment is growing in line with the development of the logistics systems, along with stricter emission legislation levels. Scania at IAA 2018 At IAA in Hannover 2018, Scania’s full new generation truck range was presented, including trucks for long-haulage, construction and urban applications –all of which run on alternative fuels. Scania further broadened its offering which includes all available alternative fuels in the market, by introducing a new generation hybrid truck. In buses and coaches, Scania displayed the battery electric Scania Citywide and the Scania Interlink Medium Decker – the first coach with a liquified natural gas (LNG) powertrain. Scania Zone was also introduced at IAA, a new service to assist transport companies and their drivers in adhering to local regulations by linking policies such as speed limits, emission restrictions and noise limitations to geo-fencing zones.
The truck market
Order bookings
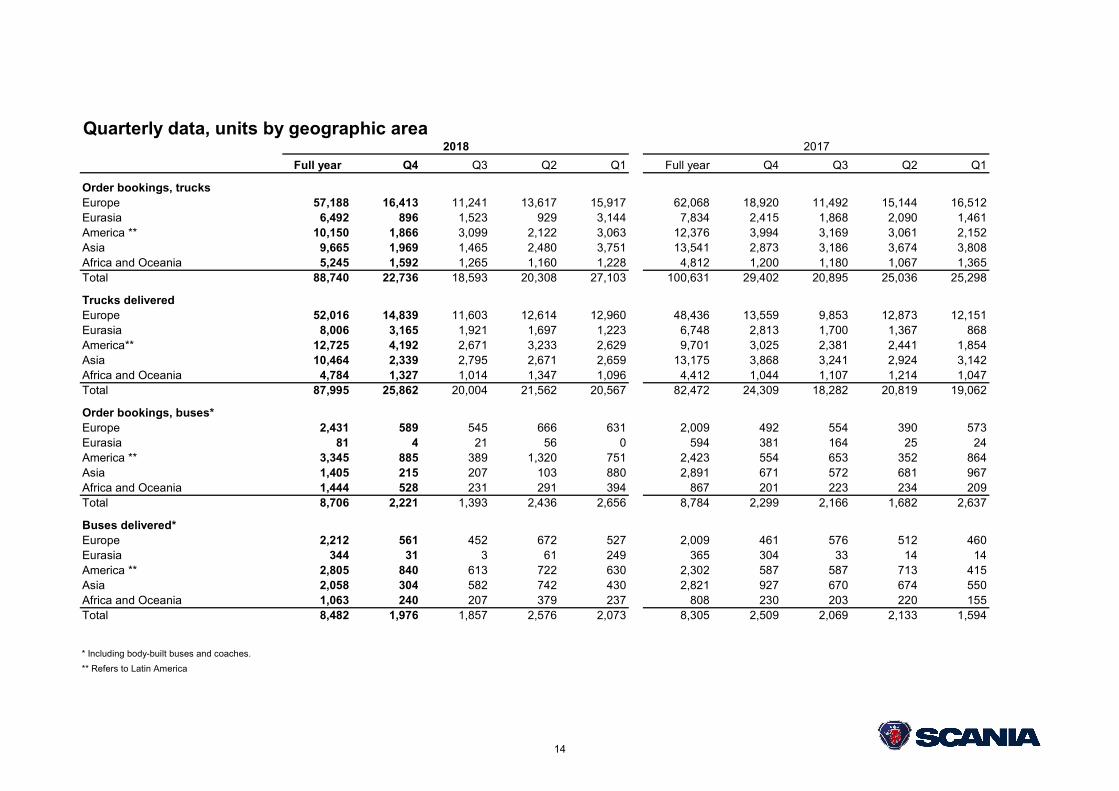
Scania’s order bookings fell during the fourth quarter of 2018 and totalled 22,736 (29,402) trucks. Order bookings in Europe fell by 13 percent to 16,413 (18,920) units, compared to the fourth quarter of 2017. Demand decreased in France, the Netherlands, Belgium and Denmark, which was partly offset by an increase in Great Britain.
Order bookings in Latin America fell during the fourth quarter of 2018 by 53 percent to 1,866 (3,994) trucks, mainly related to lower order bookings in Brazil and Argentina, which was partly offset by an increase in Chile. Order bookings in Latin America were hampered by the industrial changeover to Scania’s new truck generation.
In Eurasia, total order bookings fell during the fourth quarter and amounted to 896 (2,415) trucks, a decrease that was primarily related to Russia. In Asia, total order bookings fell during the fourth quarter and amounted to 1,969 (2,837) trucks. The decrease was mainly related to Turkey, Iran, Indonesia, South Korea and Malaysia, which was partly offset by an upturn in China. In Africa and Oceania, order bookings were higher compared to the fourth quarter of 2017, mainly related to South Africa, but this was offset somewhat by a decrease in Kenya and Tanzania. Order bookings amounted to 1,592 (1,200) units.
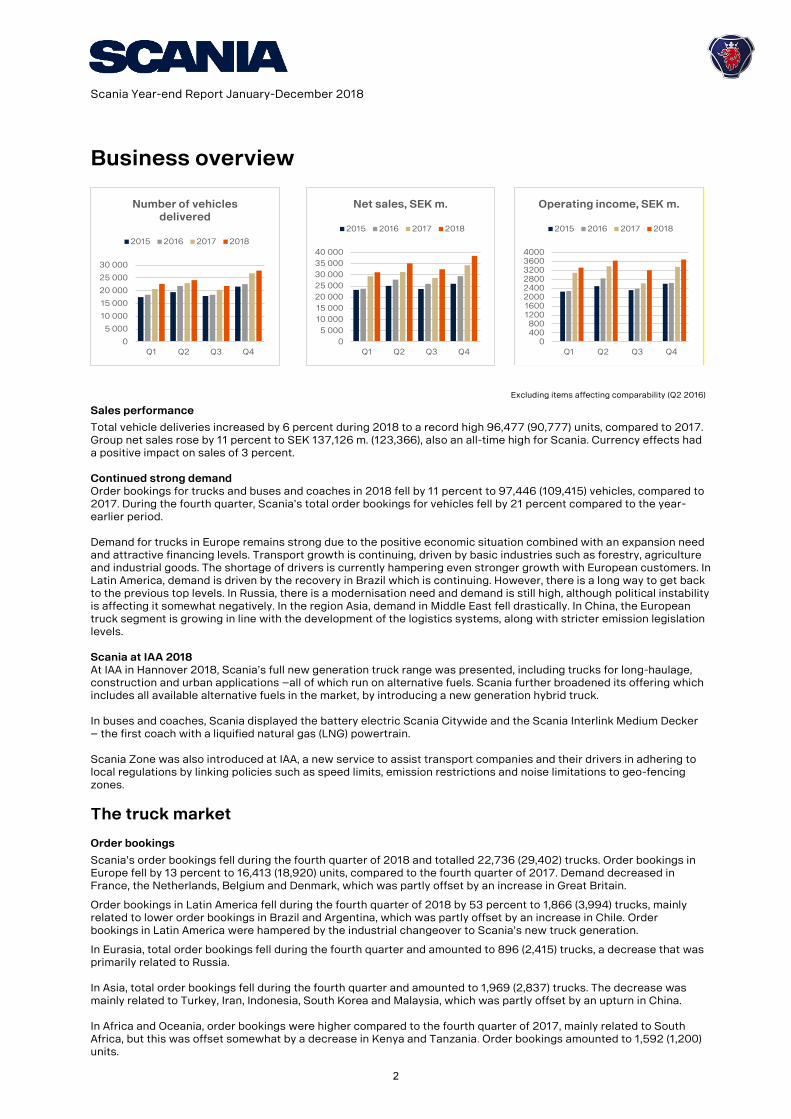
0400800
12001600200024002800320036004000
Q1 Q2 Q3 Q4
Operating income, SEK m.
2015 2016 2017 2018
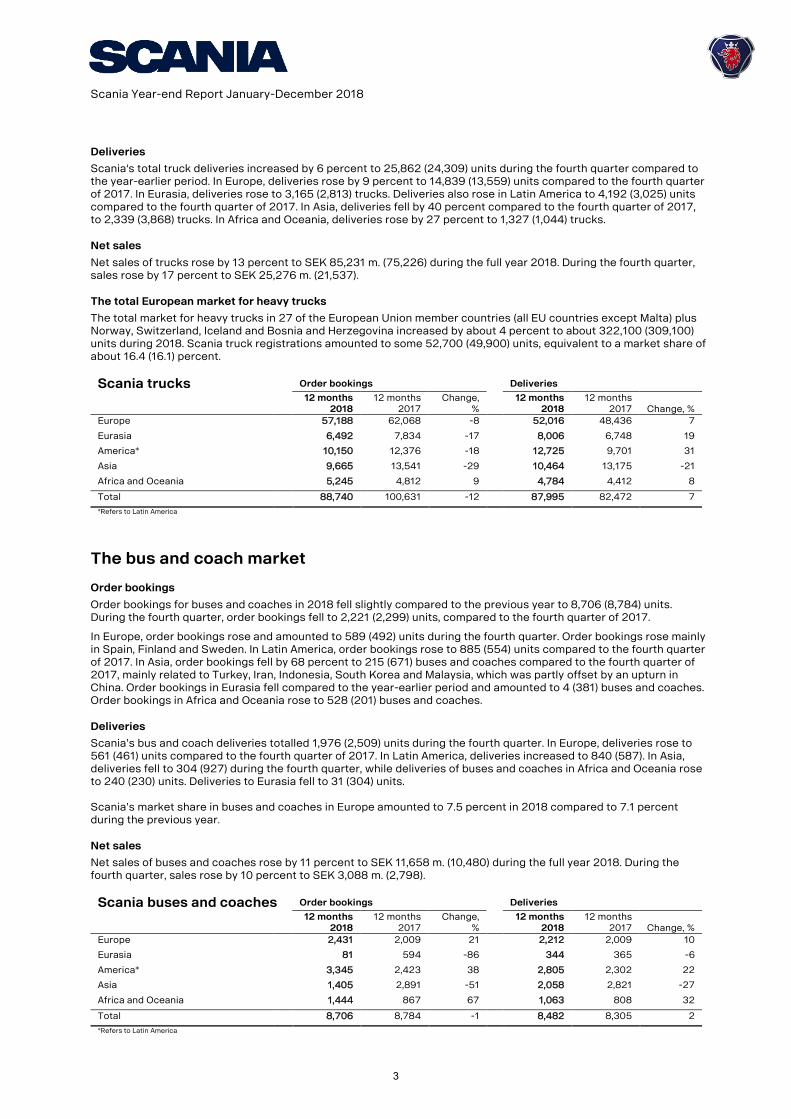
0
5 000
10 000
15 000
20 000
25 000
30 000
Q1 Q2 Q3 Q4
Number of vehicles delivered
2015 2016 2017 2018
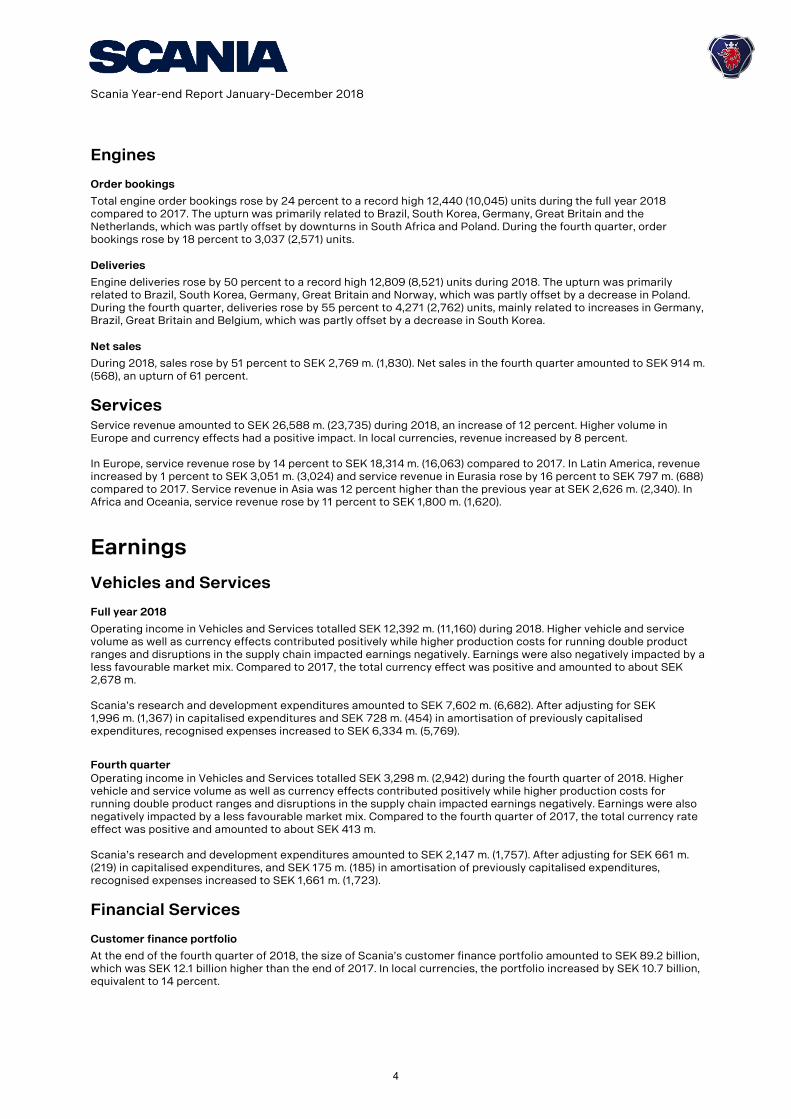
0
5 000
10 000
15 000
20 000
25 000
30 000
35 000
40 000
Q1 Q2 Q3 Q4
Net sales, SEK m.
2015 2016 2017 2018
Excluding items affecting comparability (Q2 2016)
2
Scania Year-end Report January-December 2018
Deliveries
Scania's total truck deliveries increased by 6 percent to 25,862 (24,309) units during the fourth quarter compared to the year-earlier period. In Europe, deliveries rose by 9 percent to 14,839 (13,559) units compared to the fourth quarter of 2017. In Eurasia, deliveries rose to 3,165 (2,813) trucks. Deliveries also rose in Latin America to 4,192 (3,025) units compared to the fourth quarter of 2017. In Asia, deliveries fell by 40 percent compared to the fourth quarter of 2017, to 2,339 (3,868) trucks. In Africa and Oceania, deliveries rose by 27 percent to 1,327 (1,044) trucks.
Net sales
Net sales of trucks rose by 13 percent to SEK 85,231 m. (75,226) during the full year 2018. During the fourth quarter, sales rose by 17 percent to SEK 25,276 m. (21,537).
The total European market for heavy trucks
The total market for heavy trucks in 27 of the European Union member countries (all EU countries except Malta) plus Norway, Switzerland, Iceland and Bosnia and Herzegovina increased by about 4 percent to about 322,100 (309,100) units during 2018. Scania truck registrations amounted to some 52,700 (49,900) units, equivalent to a market share of about 16.4 (16.1) percent.
Scania trucks Order bookings Deliveries
12 months
2018 12 months
2017 Change,
% 12 months
2018 12 months
2017 Change, %
Europe 57,188 62,068 -8 52,016 48,436 7
Eurasia 6,492 7,834 -17 8,006 6,748 19
America* 10,150 12,376 -18 12,725 9,701 31
Asia 9,665 13,541 -29 10,464 13,175 -21
Africa and Oceania 5,245 4,812 9 4,784 4,412 8
Total 88,740 100,631 -12 87,995 82,472 7
*Refers to Latin America
The bus and coach market
Order bookings
Order bookings for buses and coaches in 2018 fell slightly compared to the previous year to 8,706 (8,784) units. During the fourth quarter, order bookings fell to 2,221 (2,299) units, compared to the fourth quarter of 2017.
In Europe, order bookings rose and amounted to 589 (492) units during the fourth quarter. Order bookings rose mainly in Spain, Finland and Sweden. In Latin America, order bookings rose to 885 (554) units compared to the fourth quarter of 2017. In Asia, order bookings fell by 68 percent to 215 (671) buses and coaches compared to the fourth quarter of 2017, mainly related to Turkey, Iran, Indonesia, South Korea and Malaysia, which was partly offset by an upturn in China. Order bookings in Eurasia fell compared to the year-earlier period and amounted to 4 (381) buses and coaches. Order bookings in Africa and Oceania rose to 528 (201) buses and coaches.
Deliveries
Scania’s bus and coach deliveries totalled 1,976 (2,509) units during the fourth quarter. In Europe, deliveries rose to 561 (461) units compared to the fourth quarter of 2017. In Latin America, deliveries increased to 840 (587). In Asia, deliveries fell to 304 (927) during the fourth quarter, while deliveries of buses and coaches in Africa and Oceania rose to 240 (230) units. Deliveries to Eurasia fell to 31 (304) units. Scania’s market share in buses and coaches in Europe amounted to 7.5 percent in 2018 compared to 7.1 percent during the previous year.
Net sales
Net sales of buses and coaches rose by 11 percent to SEK 11,658 m. (10,480) during the full year 2018. During the fourth quarter, sales rose by 10 percent to SEK 3,088 m. (2,798).
Scania buses and coaches Order bookings Deliveries
12 months 2018
12 months 2017
Change, %
12 months 2018
12 months 2017 Change, %
Europe 2,431 2,009 21 2,212 2,009 10
Eurasia 81 594 -86 344 365 -6
America* 3,345 2,423 38 2,805 2,302 22
Asia 1,405 2,891 -51 2,058 2,821 -27
Africa and Oceania 1,444 867 67 1,063 808 32
Total 8,706 8,784 -1 8,482 8,305 2
*Refers to Latin America
3
Scania Year-end Report January-December 2018
Engines
Order bookings
Total engine order bookings rose by 24 percent to a record high 12,440 (10,045) units during the full year 2018 compared to 2017. The upturn was primarily related to Brazil, South Korea, Germany, Great Britain and the Netherlands, which was partly offset by downturns in South Africa and Poland. During the fourth quarter, order bookings rose by 18 percent to 3,037 (2,571) units.
Deliveries
Engine deliveries rose by 50 percent to a record high 12,809 (8,521) units during 2018. The upturn was primarily related to Brazil, South Korea, Germany, Great Britain and Norway, which was partly offset by a decrease in Poland. During the fourth quarter, deliveries rose by 55 percent to 4,271 (2,762) units, mainly related to increases in Germany, Brazil, Great Britain and Belgium, which was partly offset by a decrease in South Korea.
Net sales
During 2018, sales rose by 51 percent to SEK 2,769 m. (1,830). Net sales in the fourth quarter amounted to SEK 914 m. (568), an upturn of 61 percent.
Services Service revenue amounted to SEK 26,588 m. (23,735) during 2018, an increase of 12 percent. Higher volume in Europe and currency effects had a positive impact. In local currencies, revenue increased by 8 percent. In Europe, service revenue rose by 14 percent to SEK 18,314 m. (16,063) compared to 2017. In Latin America, revenue increased by 1 percent to SEK 3,051 m. (3,024) and service revenue in Eurasia rose by 16 percent to SEK 797 m. (688) compared to 2017. Service revenue in Asia was 12 percent higher than the previous year at SEK 2,626 m. (2,340). In Africa and Oceania, service revenue rose by 11 percent to SEK 1,800 m. (1,620).
Earnings
Vehicles and Services
Full year 2018
Operating income in Vehicles and Services totalled SEK 12,392 m. (11,160) during 2018. Higher vehicle and service volume as well as currency effects contributed positively while higher production costs for running double product ranges and disruptions in the supply chain impacted earnings negatively. Earnings were also negatively impacted by a less favourable market mix. Compared to 2017, the total currency effect was positive and amounted to about SEK 2,678 m. Scania’s research and development expenditures amounted to SEK 7,602 m. (6,682). After adjusting for SEK 1,996 m. (1,367) in capitalised expenditures and SEK 728 m. (454) in amortisation of previously capitalised expenditures, recognised expenses increased to SEK 6,334 m. (5,769).
Fourth quarter
Operating income in Vehicles and Services totalled SEK 3,298 m. (2,942) during the fourth quarter of 2018. Higher vehicle and service volume as well as currency effects contributed positively while higher production costs for running double product ranges and disruptions in the supply chain impacted earnings negatively. Earnings were also negatively impacted by a less favourable market mix. Compared to the fourth quarter of 2017, the total currency rate effect was positive and amounted to about SEK 413 m. Scania’s research and development expenditures amounted to SEK 2,147 m. (1,757). After adjusting for SEK 661 m. (219) in capitalised expenditures, and SEK 175 m. (185) in amortisation of previously capitalised expenditures, recognised expenses increased to SEK 1,661 m. (1,723).
Financial Services
Customer finance portfolio
At the end of the fourth quarter of 2018, the size of Scania’s customer finance portfolio amounted to SEK 89.2 billion, which was SEK 12.1 billion higher than the end of 2017. In local currencies, the portfolio increased by SEK 10.7 billion, equivalent to 14 percent.
4
Scania Year-end Report January-December 2018
Penetration rate
The penetration rate was 43 (46) percent in 2018 in those markets where Scania has its own financing operations.
Operating income
Operating income in Financial Services increased to SEK 1,440 m. (1,274) during 2018, compared to the same period in 2017. A larger portfolio and currency effects had a positive impact on earnings, while smaller margins and increased operating cost had a negative impact.
Scania Group During 2018, Scania’s operating income amounted to SEK 13,832 m. (12,434). Operating margin amounted to 10.1 (10.1) percent. Scania’s net financial items amounted to SEK -513 m. (-352). The Scania Group’s tax expense amounted to SEK 3,585 m. (3,377), equivalent to 26.9 (28.0) percent of income before taxes. Net income for the period totalled SEK 9,734 m. (8,705), equivalent to a net margin of 7.1 (7.1) percent.
Cash flow
Vehicles and Services Scania’s cash flow in Vehicles and Services amounted to SEK 3,665 m. (5,696) during 2018. Tied-up working capital increased by SEK 1,511 m. Net investments amounted to SEK 7,234 m. (5,904), including SEK 1,996 m. (1,367) in capitalisation of development expenses. At the end of the fourth quarter of 2018, the net cash position in Vehicles and Services amounted to SEK 16,420 m. compared to a net cash position of SEK 17,058 m. at the end of 2017.
Scania Group Scania’s cash flow in Financial Services amounted to SEK -11,073 m. (-7,210) during 2018 due to a growing customer finance portfolio. Together with the positive cash flow in Vehicles and Services, the Group’s net debt increased by about SEK 1.3 billion compared to the end of 2017.
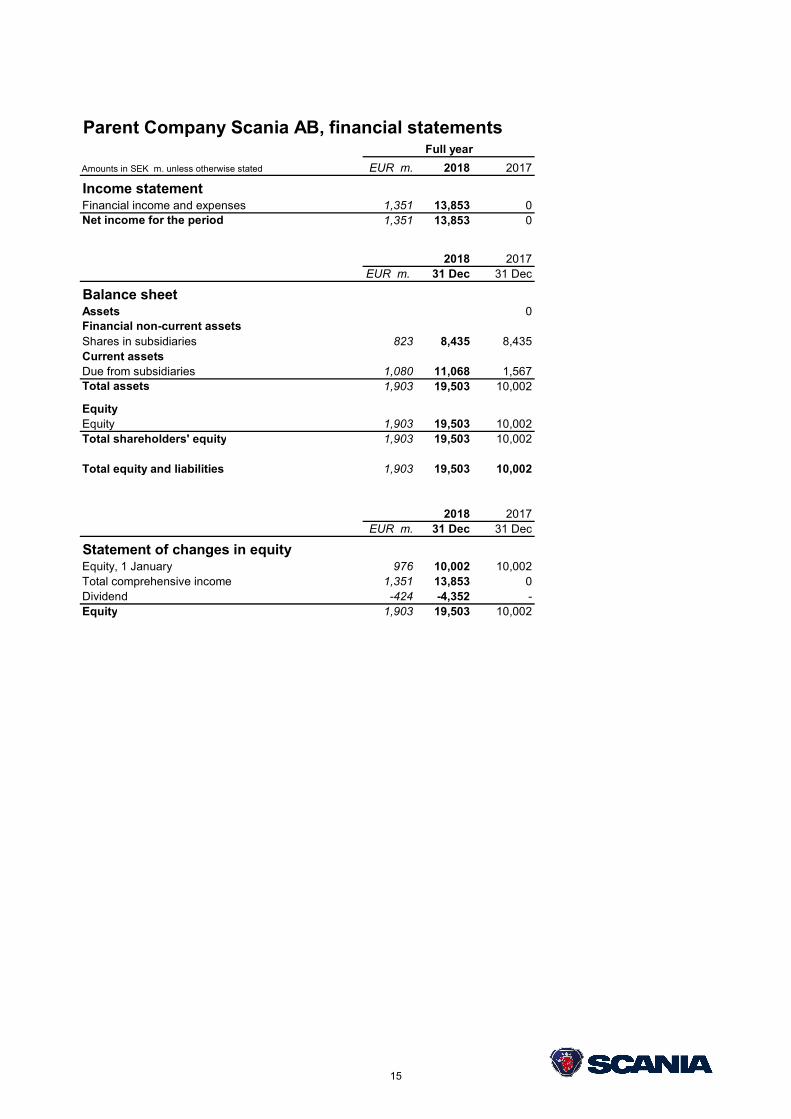
Parent Company The assets of the Parent Company, Scania AB, consist of shares in Scania CV AB. Scania CV AB is the Parent Company of the Group that comprises all production and sales and service companies as well as other companies. Income before taxes of Scania AB totalled SEK 13,853 m. (0) during 2018.
Miscellaneous
Number of employees At the end of 2018, the number of employees totalled 52,103 compared to 49,263 on the same date in 2017.
Material risks and uncertainties
The section entitled “Risks and risk management” in Scania’s Annual and Sustainability Report for 2017 describes Scania’s strategic, operational, legal and financial risks. Note 2 of the same report provides a detailed account of key judgements and estimates. Note 27 of the same report describes the financial risks, such as currency risk and interest rate risk. The risks that have the greatest impact on financial performance and on reporting for the Group and the Parent Company are summarised as follows:
a) Sales with repurchase obligations
About 13 percent of the vehicles Scania sells are delivered with residual value obligations or repurchase obligations. These are recognised as operating lease contracts, with the consequence that recognition of revenue and earnings is allocated over the life of the obligation (contract).
b) Credit risks
In its Financial Service operations, Scania has an exposure in the form of contractual future payments. This exposure is reduced by the collateral Scania has in the form of the right to repossess the underlying vehicle. In case the market value of the collateral does not cover the exposure to the customer, Scania runs a credit risk. Reserves for probable losses in Financial Service operations are set aside in the estimated amounts required.
5
Scania Year-end Report January-December 2018
c) Legal risks In 2011, Scania became subject of an investigation by the European Commission (EC) into allegedly inappropriate cooperation with other European truck manufacturers. A Statement of Objections was served on Scania by the EC in November 2014. In light of such statement and other developments in the investigation and in accordance with relevant accounting principles, Scania made a provision with an amount of SEK 3,800 m. in the interim financial statements ending in June 2016. Scania always cooperated fully with the EC, while all through the investigation contesting the EC’s view that Scania would have participated in a pan-European cartel during 1997-2011 on pricing and delayed introductions of emissions related technology. Scania were served with a final decision by the EC in October 2017, holding Scania liable for such scope of a cartel in the amount of around SEK 8.4 bn. (EUR 881 m.) in fines. Scania have appealed against this decision in its entirety, and has in January 2018 provided a guarantee as security for the fines pending the outcome of such appeal. Scania is also the subject of related civil claims by direct and indirect customers of Scania, and may face additional similar claims.
Accounting principles Scania applies International Financial Reporting Standards (IFRSs) as adopted by the EU. This Interim Report for the Scania Group has been prepared in accordance with IAS 34, “Interim Financial Reporting” and the Annual Accounts Act.
New accounting principles from 2018
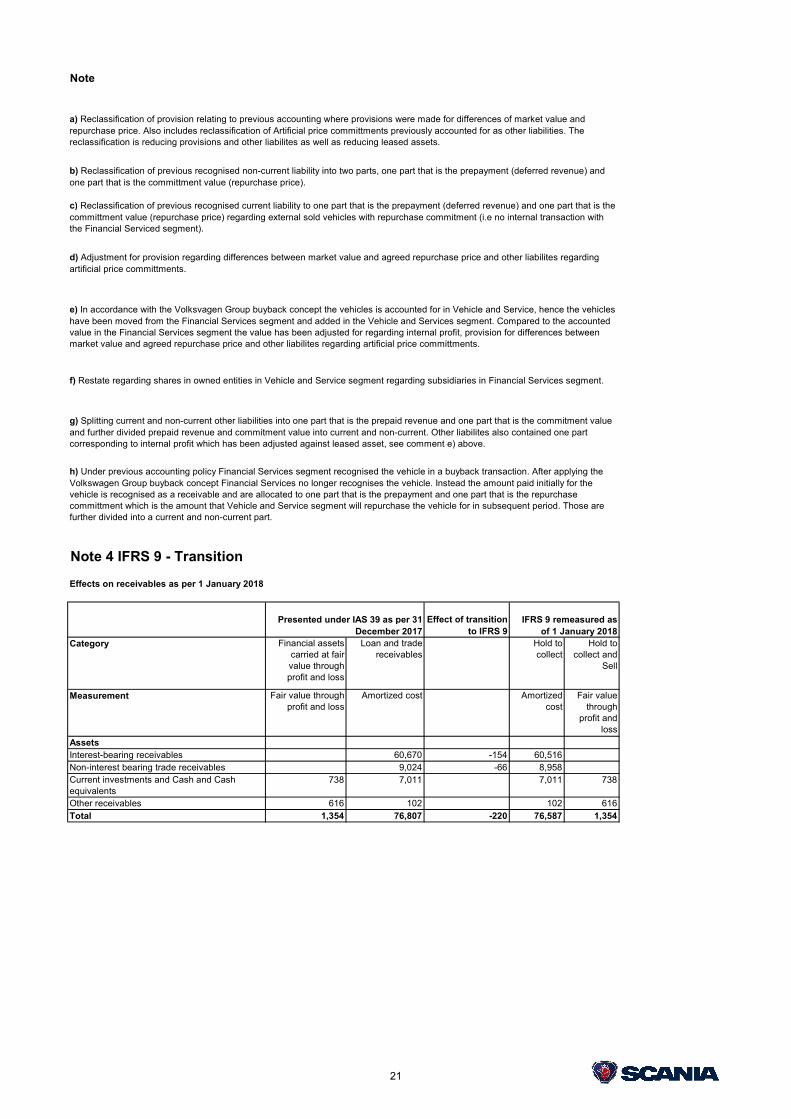
As from 1 January 2018 the Group applies IFRS 9, “Financial Instruments” and IFRS 15, “Revenue from Contracts with Customers”. IFRS 9 has from 1 January 2018 replaced IAS 39, “Financial Instruments: Recognition and Measurement”. IFRS 9 contains different rules for classification and measurement of financial assets and liabilities, impairment of financial instruments and hedge accounting compared to IAS 39. For Scania the impact of the new standard refers to the impairment model and the requirement to consider expected credit losses when calculating loss allowances. Scania has chosen to apply IFRS 9 retrospectively without adjusting comparative figures. The impact of the transition on 1 January 2018 refers to the impairment model and amounts to SEK 150 m. net after tax recognised in equity. See Note 4. IFRS 15 “Revenue from Contracts with Customers” has replaced IAS 18 Revenue and related interpretations. The core principle of IFRS 15 is that an entity shall recognise revenue to depict the transfer of promised goods or services to customers in an amount that reflects the consideration to which the entity expects to be entitled in exchange for those goods or services. The transition to IFRS 15 has been made based on the modified approach meaning that the comparative figures are not adjusted. Scania’s previously applied accounting principles regarding revenue, as described in the Annual report, were in line with the requirements in IFRS 15 and therefore Scania has no effect in equity on transition to IFRS 15. Other new and revised standards and interpretations that have been applied from 1 January 2018 have not had any significant impact on Scania’s financial statements.
Sales with repurchase obligations
As from 2018 the Group has adopted the presentation of sales transactions with repurchase obligations to the Volkswagen Group’s accounting principles of such transactions. The change has only resulted in reclassifications in the balance sheet. The effect on the Group is not significant while the effect regarding internal sales transactions with repurchase obligations between the segments Vehicle and Services and Financial Services in the segments is greater. The new accounting principle have been applied retrospectively which means that comparative figures have been recalculated. See Note 3.
Reclassifications 2018
As from 2018 some reclassifications regarding the presentation in the income statement have been made. The reclassifications have been made as a result of adoption to the presentation of different costs in the Volkswagen Group. The reclassification has been made retrospectively which means that comparative figures have been recalculated. See Note 2.
Presentation of the income statement
As from 2018 the presentation of the income statement has changed due to an adjustment of how the income statement is presented in the Volkswagen Group. See Note 2.
Parent Company
The Interim Report for the Parent Company, Scania AB, has been prepared in accordance with the Annual Accounts Act and recommendation RFR 2, “Accounting for Legal Entities” of the Swedish Financial Reporting Board.
6
Scania Year-end Report January-December 2018
Dividend and Annual General Meeting Scania’s Annual General Meeting for the financial year 2018 was held in Södertälje, Sweden on 14 March 2019. The Board of Directors proposed to the 2019 Annual General Meeting that a total amount of SEK 14,611 m., consisting of SEK 4,867 m. as ordinary dividend which represents 50 percent of the net income SEK 9,734 m. for 2018 and an extraordinary dividend of SEK 9,744 m., to be distributed to the shareholders as a cash dividend. The extraordinary dividend will immediately be returned as capital injection. The extraordinary dividend and re-capitalisation should be done at the same time, meaning no actual payments will be done, and with no net effects on Scania capitalisation.
Contact persons
Susanna Berlin Investor Relations Tel. +46 8 553 861 12 Mobile tel. +46 70 086 05 02
Erik Ljungberg Communications, Brand and Marketing Tel. +46 8 553 835 57 Mobile tel. +46 73 988 35 57
7
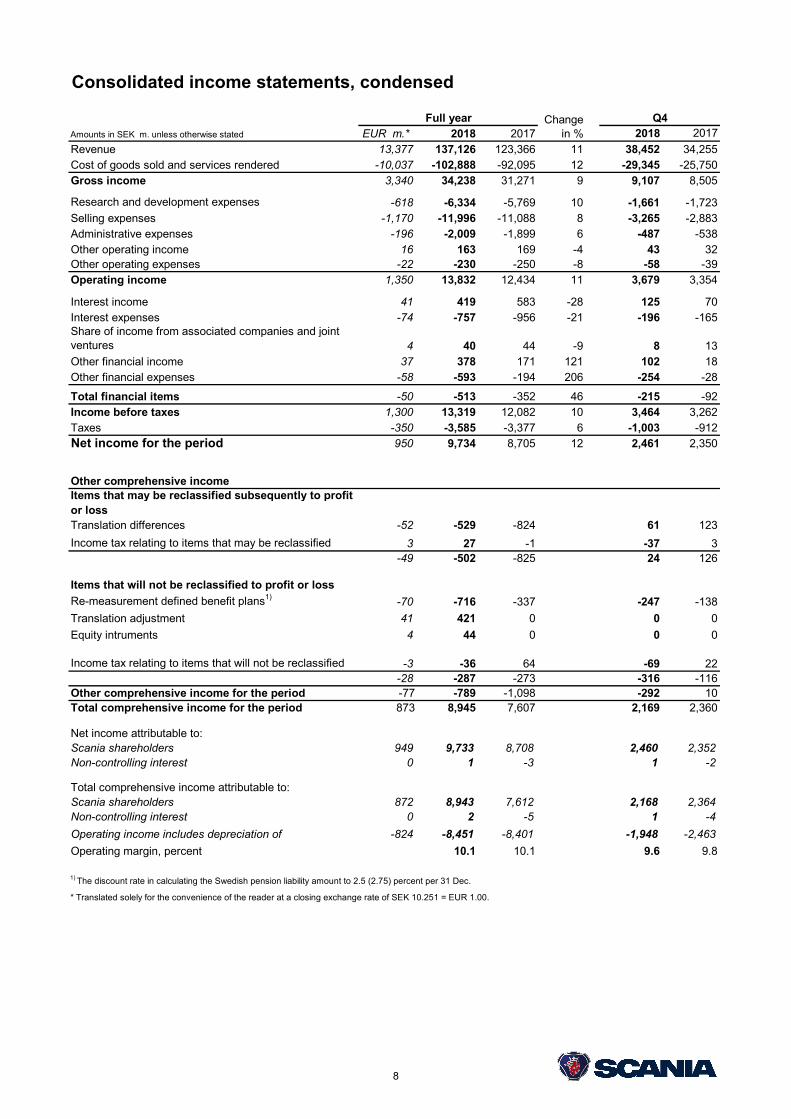
Consolidated income statements, condensed
EUR m.* 2018 2017 2018 2017
Revenue 13,377 137,126 123,366 11 38,452 34,255Cost of goods sold and services rendered -10,037 -102,888 -92,095 12 -29,345 -25,750Gross income 3,340 34,238 31,271 9 9,107 8,505
Research and development expenses -618 -6,334 -5,769 10 -1,661 -1,723Selling expenses -1,170 -11,996 -11,088 8 -3,265 -2,883Administrative expenses -196 -2,009 -1,899 6 -487 -538Other operating income 16 163 169 -4 43 32Other operating expenses -22 -230 -250 -8 -58 -39Operating income 1,350 13,832 12,434 11 3,679 3,354
Interest income 41 419 583 -28 125 70Interest expenses -74 -757 -956 -21 -196 -165Share of income from associated companies and joint ventures 4 40 44 -9 8 13Other financial income 37 378 171 121 102 18Other financial expenses -58 -593 -194 206 -254 -28
Total financial items -50 -513 -352 46 -215 -92Income before taxes 1,300 13,319 12,082 10 3,464 3,262Taxes -350 -3,585 -3,377 6 -1,003 -912Net income for the period 950 9,734 8,705 12 2,461 2,350
Other comprehensive incomeItems that may be reclassified subsequently to profit or lossTranslation differences -52 -529 -824 61 123
Income tax relating to items that may be reclassified 3 27 -1 -37 3-49 -502 -825 24 126
Items that will not be reclassified to profit or loss
Re-measurement defined benefit plans1) -70 -716 -337 -247 -138
Translation adjustment 41 421 0 0 0
Equity intruments 4 44 0 0 0
Income tax relating to items that will not be reclassified -3 -36 64 -69 22-28 -287 -273 -316 -116
Other comprehensive income for the period -77 -789 -1,098 -292 10Total comprehensive income for the period 873 8,945 7,607 2,169 2,360
Net income attributable to:Scania shareholders 949 9,733 8,708 2,460 2,352Non-controlling interest 0 1 -3 1 -2
Total comprehensive income attributable to:Scania shareholders 872 8,943 7,612 2,168 2,364Non-controlling interest 0 2 -5 1 -40Operating income includes depreciation of -824 -8,451 -8,401 -1,948 -2,463
Operating margin, percent 10.1 10.1 9.6 9.8
1) The discount rate in calculating the Swedish pension liability amount to 2.5 (2.75) percent per 31 Dec.
* Translated solely for the convenience of the reader at a closing exchange rate of SEK 10.251 = EUR 1.00.
Amounts in SEK m. unless otherwise stated
Full year Change in %
Q4
8
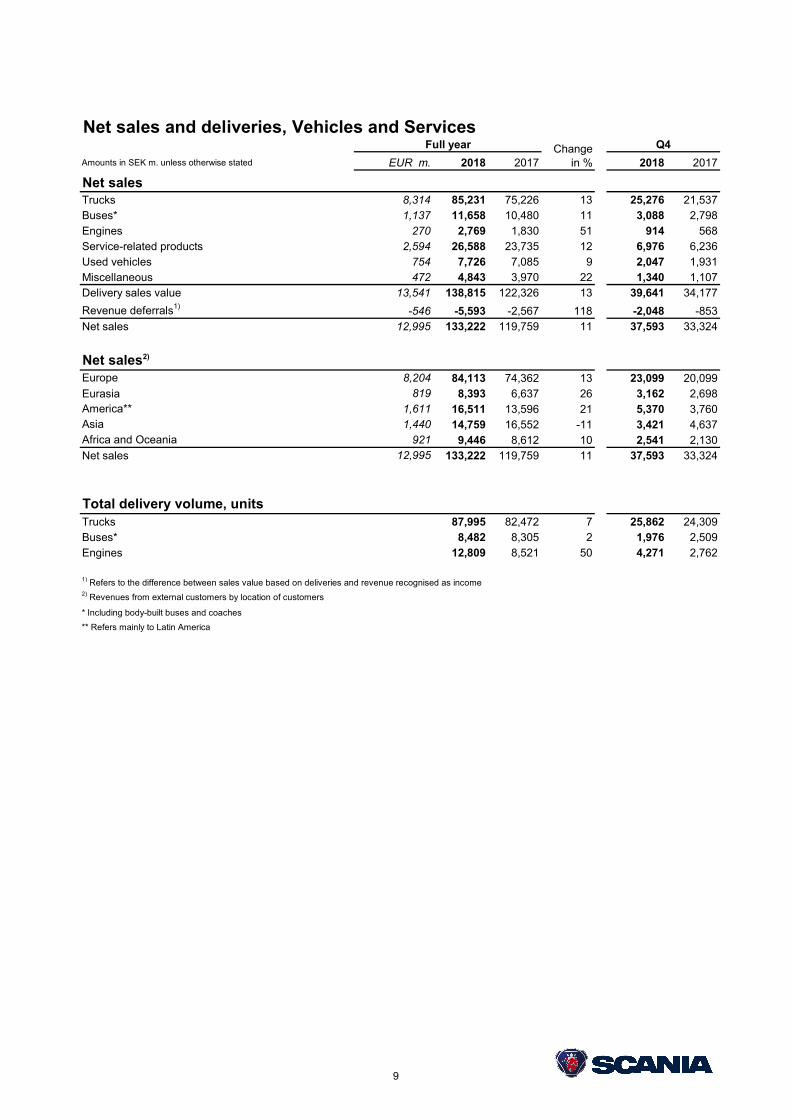
Net sales and deliveries, Vehicles and Services
Amounts in SEK m. unless otherwise stated EUR m. 2018 2017 2018 2017
Net salesTrucks 8,314 85,231 75,226 13 25,276 21,537Buses* 1,137 11,658 10,480 11 3,088 2,798Engines 270 2,769 1,830 51 914 568Service-related products 2,594 26,588 23,735 12 6,976 6,236Used vehicles 754 7,726 7,085 9 2,047 1,931Miscellaneous 472 4,843 3,970 22 1,340 1,107Delivery sales value 13,541 138,815 122,326 13 39,641 34,177
Revenue deferrals1) -546 -5,593 -2,567 118 -2,048 -853Net sales 12,995 133,222 119,759 11 37,593 33,324
Net sales2)
Europe 8,204 84,113 74,362 13 23,099 20,099Eurasia 819 8,393 6,637 26 3,162 2,698America** 1,611 16,511 13,596 21 5,370 3,760Asia 1,440 14,759 16,552 -11 3,421 4,637Africa and Oceania 921 9,446 8,612 10 2,541 2,130Net sales 12,995 133,222 119,759 11 37,593 33,324
Total delivery volume, unitsTrucks 87,995 82,472 7 25,862 24,309Buses* 8,482 8,305 2 1,976 2,509Engines 12,809 8,521 50 4,271 2,762
1) Refers to the difference between sales value based on deliveries and revenue recognised as income2) Revenues from external customers by location of customers
* Including body-built buses and coaches
** Refers mainly to Latin America
Full year Change in %
Q4
9
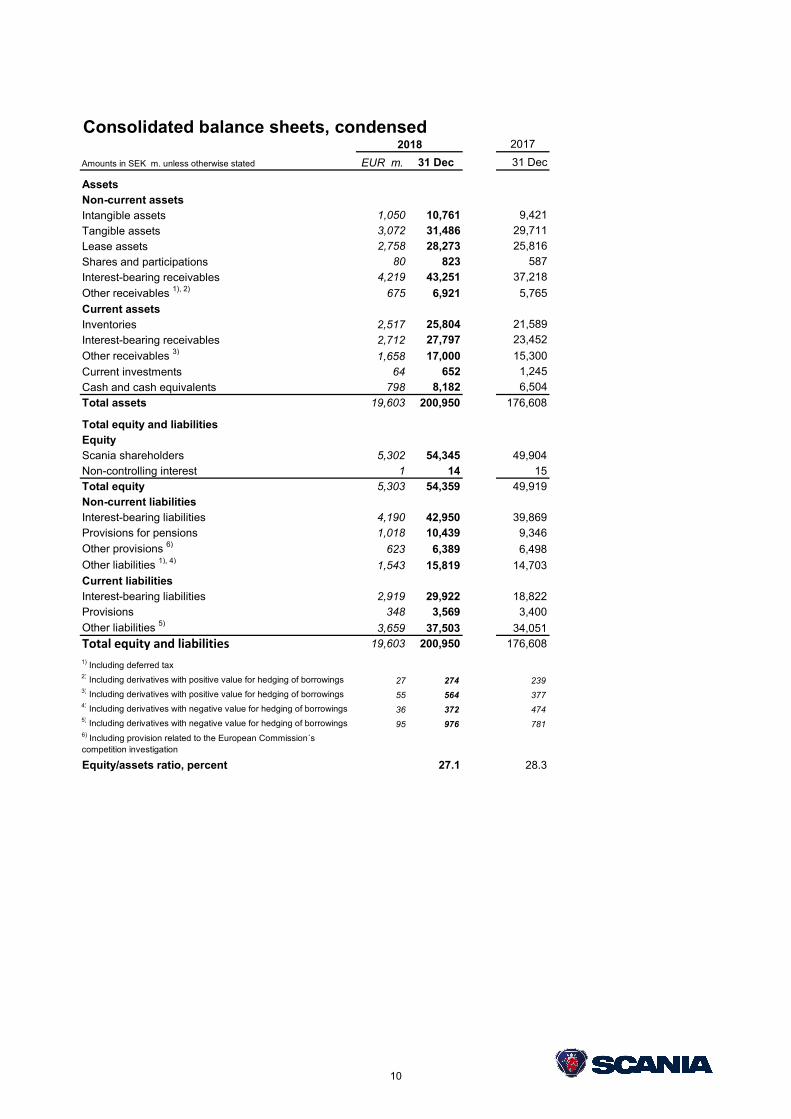
Consolidated balance sheets, condensed2017
EUR m. 31 Dec 31 Dec
AssetsNon-current assetsIntangible assets 1,050 10,761 9,421
Tangible assets 3,072 31,486 29,711
Lease assets 2,758 28,273 25,816
Shares and participations 80 823 587
Interest-bearing receivables 4,219 43,251 37,218
Other receivables 1), 2) 675 6,921 5,765
Current assetsInventories 2,517 25,804 21,589
Interest-bearing receivables 2,712 27,797 23,452
Other receivables 3) 1,658 17,000 15,300
Current investments 64 652 1,245
Cash and cash equivalents 798 8,182 6,504
Total assets 19,603 200,950 176,608
Total equity and liabilitiesEquityScania shareholders 5,302 54,345 49,904Non-controlling interest 1 14 15Total equity 5,303 54,359 49,919Non-current liabilitiesInterest-bearing liabilities 4,190 42,950 39,869Provisions for pensions 1,018 10,439 9,346
Other provisions 6) 623 6,389 6,498
Other liabilities 1), 4) 1,543 15,819 14,703Current liabilitiesInterest-bearing liabilities 2,919 29,922 18,822Provisions 348 3,569 3,400
Other liabilities 5) 3,659 37,503 34,051
Total equity and liabilities 19,603 200,950 176,608
1) Including deferred tax2) Including derivatives with positive value for hedging of borrowings 27 274 2393) Including derivatives with positive value for hedging of borrowings 55 564 3774) Including derivatives with negative value for hedging of borrowings 36 372 4745) Including derivatives with negative value for hedging of borrowings 95 976 7816) Including provision related to the European Commission´s competition investigation
Equity/assets ratio, percent 27.1 28.3
2018
Amounts in SEK m. unless otherwise stated
10
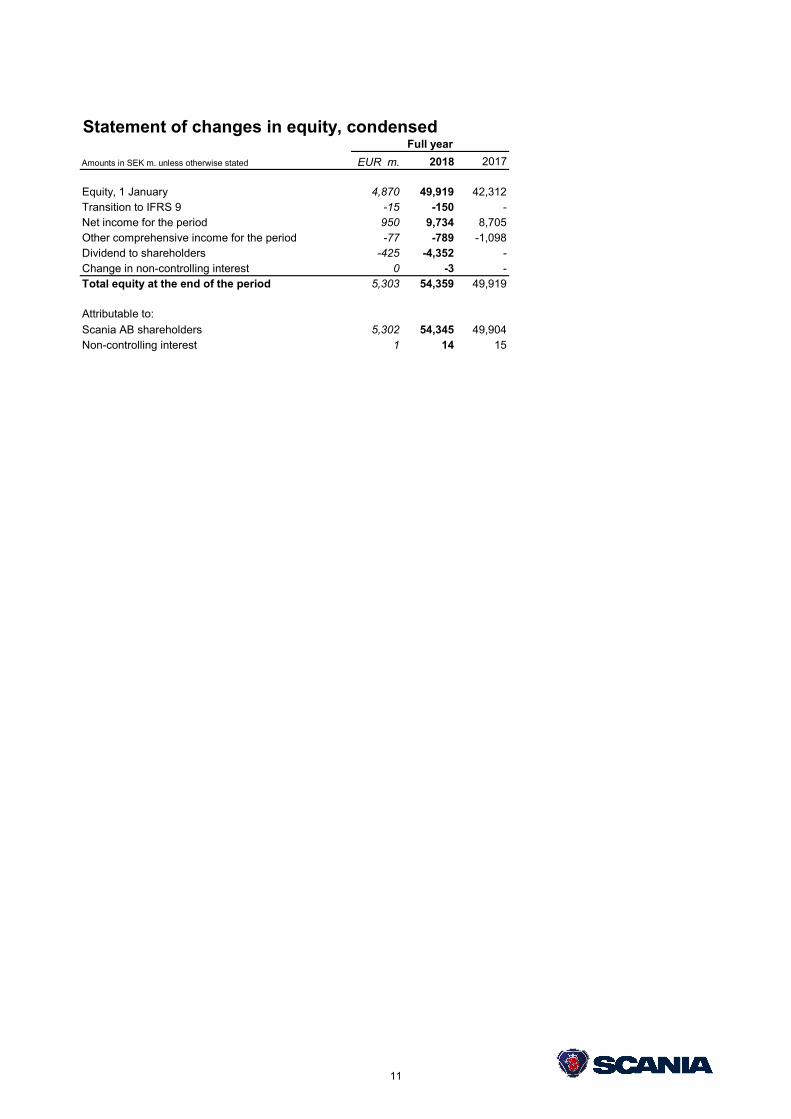
Statement of changes in equity, condensed
Amounts in SEK m. unless otherwise stated EUR m. 2018 2017
Equity, 1 January 4,870 49,919 42,312Transition to IFRS 9 -15 -150 -Net income for the period 950 9,734 8,705Other comprehensive income for the period -77 -789 -1,098Dividend to shareholders -425 -4,352 -Change in non-controlling interest 0 -3 -Total equity at the end of the period 5,303 54,359 49,919
Attributable to:
Scania AB shareholders 5,302 54,345 49,904Non-controlling interest 1 14 15
Full year
11
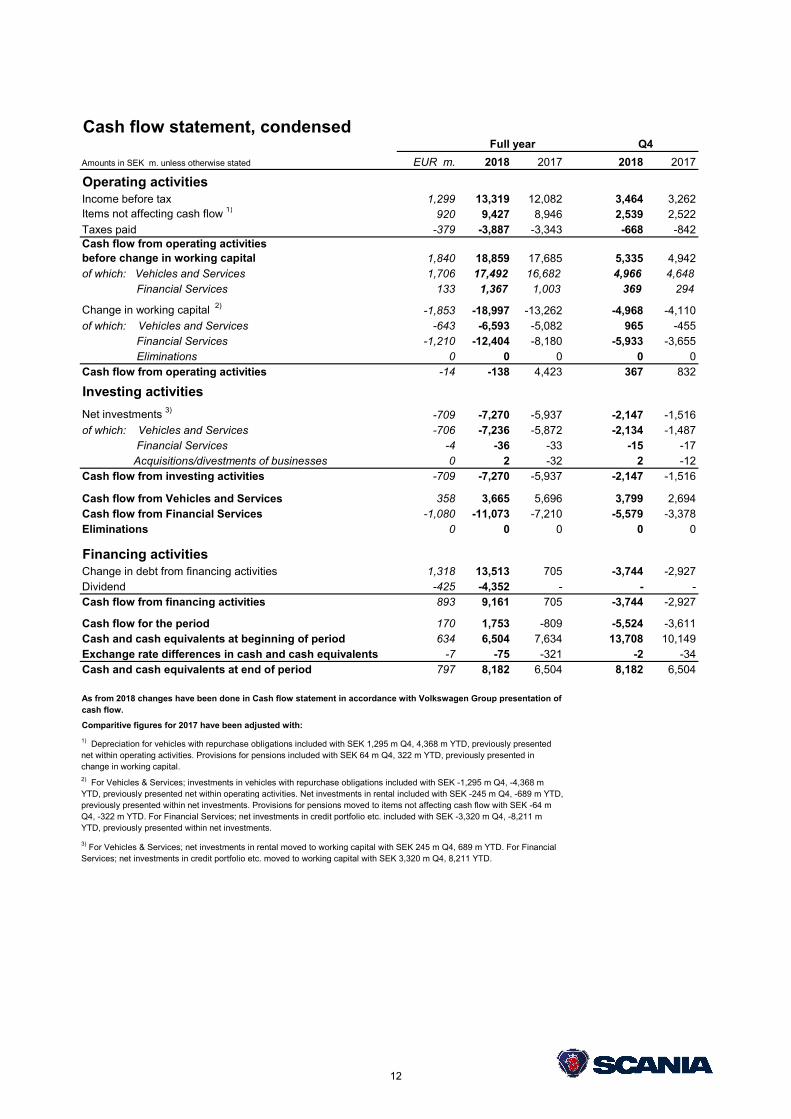
Cash flow statement, condensed
EUR m. 2018 2017 2018 2017
Operating activitiesIncome before tax 1,299 13,319 12,082 3,464 3,262Items not affecting cash flow 1) 920 9,427 8,946 2,539 2,522Taxes paid -379 -3,887 -3,343 -668 -842Cash flow from operating activitiesbefore change in working capital 1,840 18,859 17,685 5,335 4,942of which: Vehicles and Services 1,706 17,492 16,682 4,966 4,648 Financial Services 133 1,367 1,003 369 294
Change in working capital 2) -1,853 -18,997 -13,262 -4,968 -4,110of which: Vehicles and Services -643 -6,593 -5,082 965 -455 Financial Services -1,210 -12,404 -8,180 -5,933 -3,655 Eliminations 0 0 0 0 0Cash flow from operating activities -14 -138 4,423 367 832
Investing activities
Net investments 3) -709 -7,270 -5,937 -2,147 -1,516of which: Vehicles and Services -706 -7,236 -5,872 -2,134 -1,487 Financial Services -4 -36 -33 -15 -17 Acquisitions/divestments of businesses 0 2 -32 2 -12Cash flow from investing activities -709 -7,270 -5,937 -2,147 -1,516
Cash flow from Vehicles and Services 358 3,665 5,696 3,799 2,694Cash flow from Financial Services -1,080 -11,073 -7,210 -5,579 -3,378Eliminations 0 0 0 0 0
Financing activitiesChange in debt from financing activities 1,318 13,513 705 -3,744 -2,927Dividend -425 -4,352 - - -Cash flow from financing activities 893 9,161 705 -3,744 -2,927
Cash flow for the period 170 1,753 -809 -5,524 -3,611Cash and cash equivalents at beginning of period 634 6,504 7,634 13,708 10,149Exchange rate differences in cash and cash equivalents -7 -75 -321 -2 -34Cash and cash equivalents at end of period 797 8,182 6,504 8,182 6,504
Comparitive figures for 2017 have been adjusted with:
3) For Vehicles & Services; net investments in rental moved to working capital with SEK 245 m Q4, 689 m YTD. For Financial Services; net investments in credit portfolio etc. moved to working capital with SEK 3,320 m Q4, 8,211 YTD.
Amounts in SEK m. unless otherwise stated
Full year Q4
As from 2018 changes have been done in Cash flow statement in accordance with Volkswagen Group presentation of cash flow.
1) Depreciation for vehicles with repurchase obligations included with SEK 1,295 m Q4, 4,368 m YTD, previously presented net within operating activities. Provisions for pensions included with SEK 64 m Q4, 322 m YTD, previously presented in change in working capital.2) For Vehicles & Services; investments in vehicles with repurchase obligations included with SEK -1,295 m Q4, -4,368 m YTD, previously presented net within operating activities. Net investments in rental included with SEK -245 m Q4, -689 m YTD, previously presented within net investments. Provisions for pensions moved to items not affecting cash flow with SEK -64 m Q4, -322 m YTD. For Financial Services; net investments in credit portfolio etc. included with SEK -3,320 m Q4, -8,211 m YTD, previously presented within net investments.
12
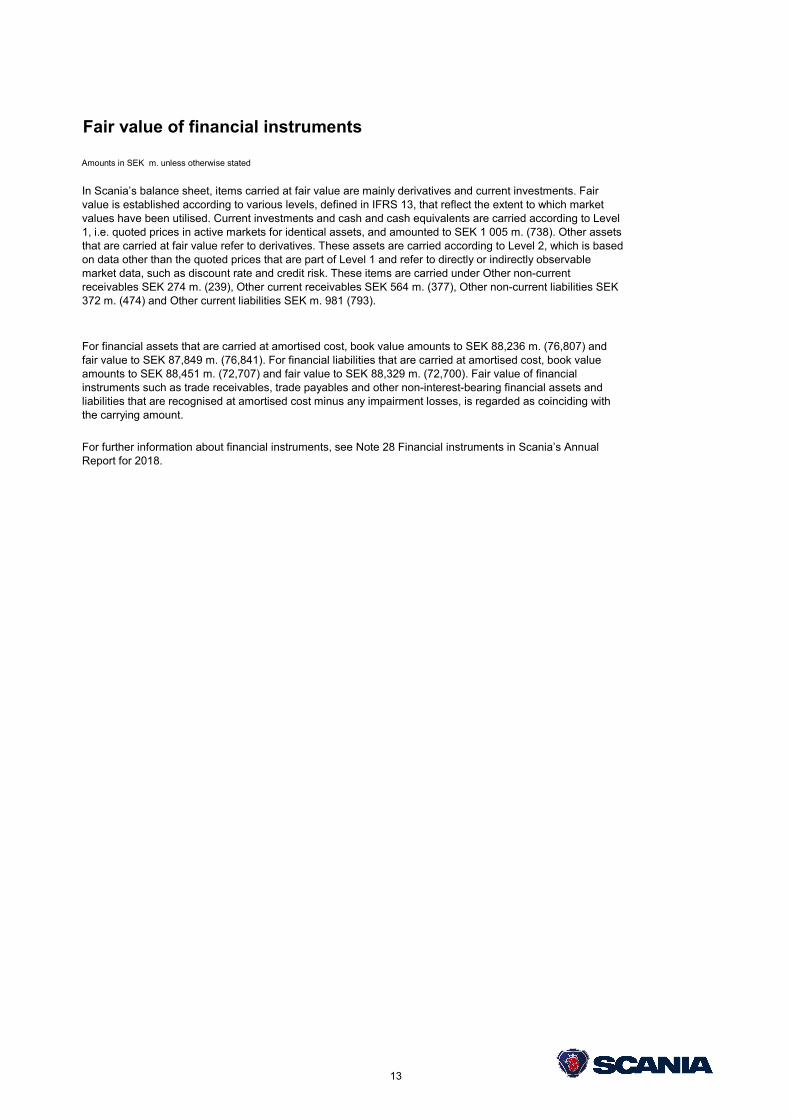
Fair value of financial instruments
Amounts in SEK m. unless otherwise stated
For further information about financial instruments, see Note 28 Financial instruments in Scania’s Annual Report for 2018.
In Scania’s balance sheet, items carried at fair value are mainly derivatives and current investments. Fair value is established according to various levels, defined in IFRS 13, that reflect the extent to which market values have been utilised. Current investments and cash and cash equivalents are carried according to Level 1, i.e. quoted prices in active markets for identical assets, and amounted to SEK 1 005 m. (738). Other assets that are carried at fair value refer to derivatives. These assets are carried according to Level 2, which is based on data other than the quoted prices that are part of Level 1 and refer to directly or indirectly observable market data, such as discount rate and credit risk. These items are carried under Other non-current receivables SEK 274 m. (239), Other current receivables SEK 564 m. (377), Other non-current liabilities SEK 372 m. (474) and Other current liabilities SEK m. 981 (793).
For financial assets that are carried at amortised cost, book value amounts to SEK 88,236 m. (76,807) and fair value to SEK 87,849 m. (76,841). For financial liabilities that are carried at amortised cost, book value amounts to SEK 88,451 m. (72,707) and fair value to SEK 88,329 m. (72,700). Fair value of financial instruments such as trade receivables, trade payables and other non-interest-bearing financial assets and liabilities that are recognised at amortised cost minus any impairment losses, is regarded as coinciding with the carrying amount.
13
Quarterly data, units by geographic area
Full year Q4 Q3 Q2 Q1 Full year Q4 Q3 Q2 Q1
Order bookings, trucksEurope 57,188 16,413 11,241 13,617 15,917 62,068 18,920 11,492 15,144 16,512Eurasia 6,492 896 1,523 929 3,144 7,834 2,415 1,868 2,090 1,461America ** 10,150 1,866 3,099 2,122 3,063 12,376 3,994 3,169 3,061 2,152Asia 9,665 1,969 1,465 2,480 3,751 13,541 2,873 3,186 3,674 3,808Africa and Oceania 5,245 1,592 1,265 1,160 1,228 4,812 1,200 1,180 1,067 1,365Total 88,740 22,736 18,593 20,308 27,103 100,631 29,402 20,895 25,036 25,298
Trucks deliveredEurope 52,016 14,839 11,603 12,614 12,960 48,436 13,559 9,853 12,873 12,151Eurasia 8,006 3,165 1,921 1,697 1,223 6,748 2,813 1,700 1,367 868America** 12,725 4,192 2,671 3,233 2,629 9,701 3,025 2,381 2,441 1,854Asia 10,464 2,339 2,795 2,671 2,659 13,175 3,868 3,241 2,924 3,142Africa and Oceania 4,784 1,327 1,014 1,347 1,096 4,412 1,044 1,107 1,214 1,047Total 87,995 25,862 20,004 21,562 20,567 82,472 24,309 18,282 20,819 19,062
Order bookings, buses*Europe 2,431 589 545 666 631 2,009 492 554 390 573Eurasia 81 4 21 56 0 594 381 164 25 24America ** 3,345 885 389 1,320 751 2,423 554 653 352 864Asia 1,405 215 207 103 880 2,891 671 572 681 967Africa and Oceania 1,444 528 231 291 394 867 201 223 234 209Total 8,706 2,221 1,393 2,436 2,656 8,784 2,299 2,166 1,682 2,637
Buses delivered*Europe 2,212 561 452 672 527 2,009 461 576 512 460Eurasia 344 31 3 61 249 365 304 33 14 14America ** 2,805 840 613 722 630 2,302 587 587 713 415Asia 2,058 304 582 742 430 2,821 927 670 674 550Africa and Oceania 1,063 240 207 379 237 808 230 203 220 155Total 8,482 1,976 1,857 2,576 2,073 8,305 2,509 2,069 2,133 1,594
* Including body-built buses and coaches.
** Refers to Latin America
20172018
14
Parent Company Scania AB, financial statements
EUR m. 2018 2017
Income statementFinancial income and expenses 1,351 13,853 0Net income for the period 1,351 13,853 0
2018 2017EUR m. 31 Dec 31 Dec
Balance sheetAssets 0Financial non-current assetsShares in subsidiaries 823 8,435 8,435Current assetsDue from subsidiaries 1,080 11,068 1,567Total assets 1,903 19,503 10,002
EquityEquity 1,903 19,503 10,002Total shareholders' equity 1,903 19,503 10,002
Total equity and liabilities 1,903 19,503 10,002
2018 2017EUR m. 31 Dec 31 Dec
Statement of changes in equityEquity, 1 January 976 10,002 10,002Total comprehensive income 1,351 13,853 0Dividend -424 -4,352 -Equity 1,903 19,503 10,002
Amounts in SEK m. unless otherwise stated
Full year
15
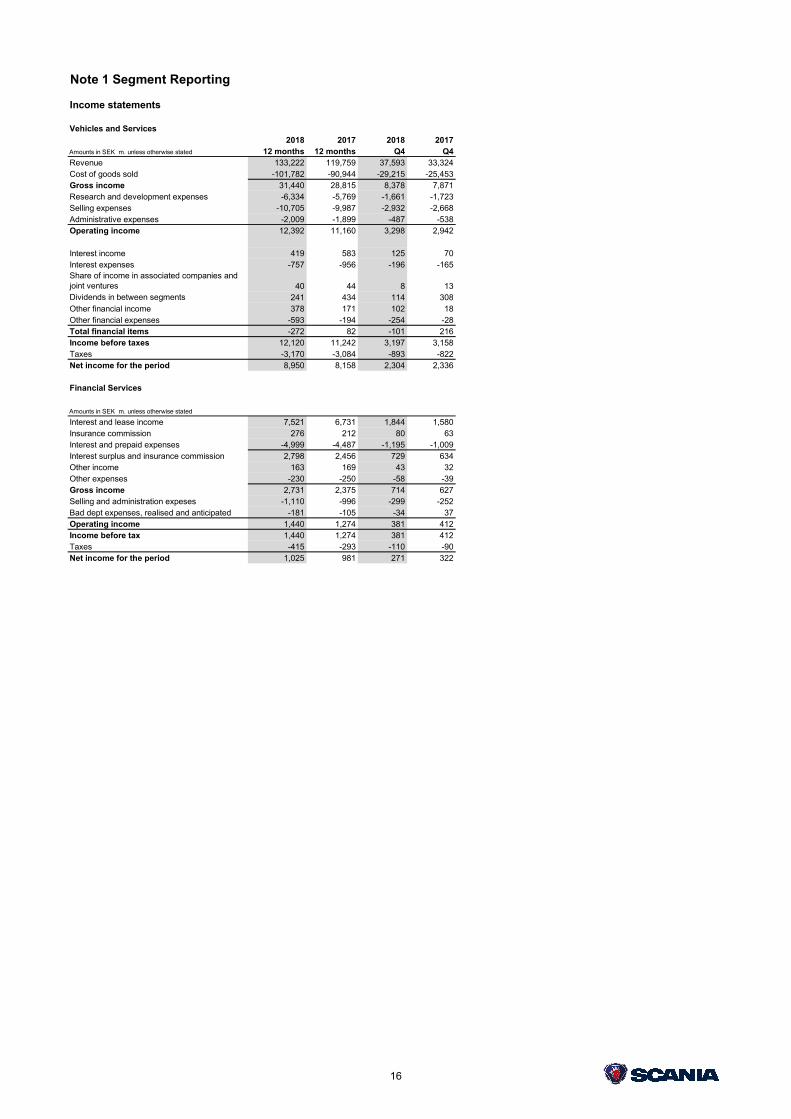
Note 1 Segment Reporting
Income statements
Vehicles and Services2018 2017 2018 2017
Amounts in SEK m. unless otherwise stated 12 months 12 months Q4 Q4Revenue 133,222 119,759 37,593 33,324Cost of goods sold -101,782 -90,944 -29,215 -25,453Gross income 31,440 28,815 8,378 7,871Research and development expenses -6,334 -5,769 -1,661 -1,723Selling expenses -10,705 -9,987 -2,932 -2,668Administrative expenses -2,009 -1,899 -487 -538Operating income 12,392 11,160 3,298 2,942
Interest income 419 583 125 70Interest expenses -757 -956 -196 -165Share of income in associated companies and joint ventures 40 44 8 13Dividends in between segments 241 434 114 308Other financial income 378 171 102 18Other financial expenses -593 -194 -254 -28Total financial items -272 82 -101 216Income before taxes 12,120 11,242 3,197 3,158Taxes -3,170 -3,084 -893 -822Net income for the period 8,950 8,158 2,304 2,336
Financial Services
Amounts in SEK m. unless otherwise stated
Interest and lease income 7,521 6,731 1,844 1,580Insurance commission 276 212 80 63Interest and prepaid expenses -4,999 -4,487 -1,195 -1,009Interest surplus and insurance commission 2,798 2,456 729 634Other income 163 169 43 32Other expenses -230 -250 -58 -39Gross income 2,731 2,375 714 627Selling and administration expeses -1,110 -996 -299 -252Bad dept expenses, realised and anticipated -181 -105 -34 37Operating income 1,440 1,274 381 412Income before tax 1,440 1,274 381 412Taxes -415 -293 -110 -90Net income for the period 1,025 981 271 322
16
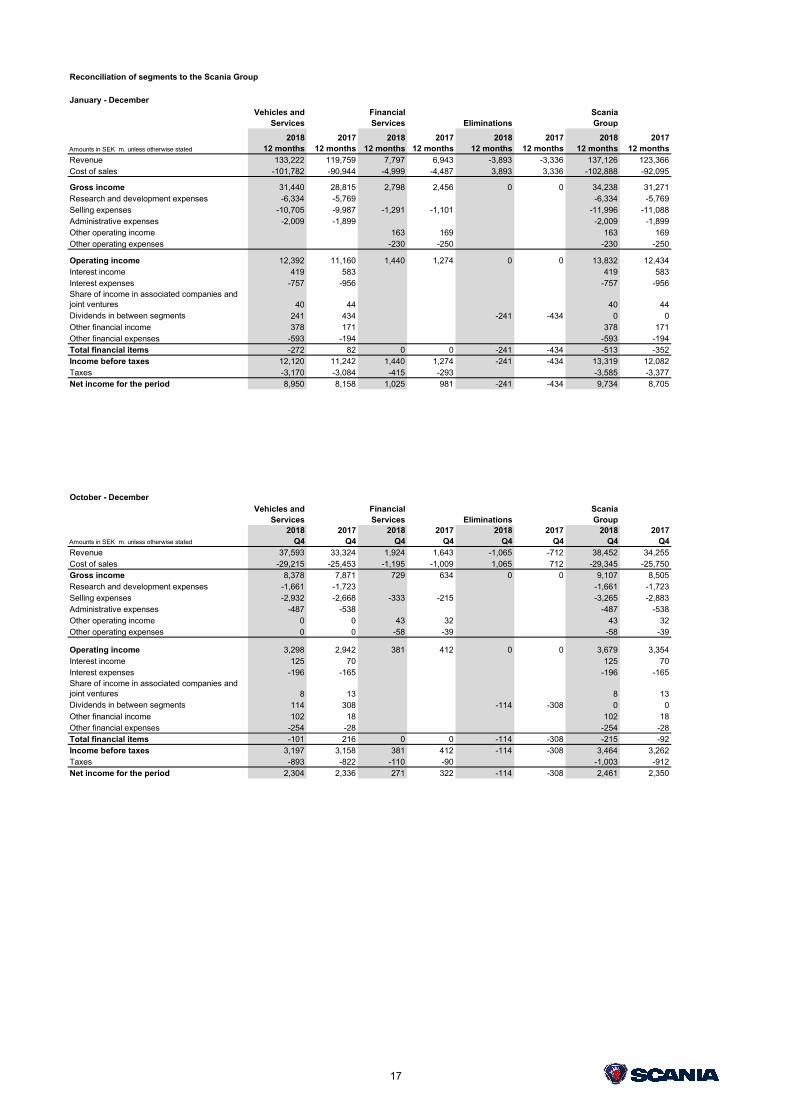
January - December
Vehicles and Services
Financial Services Eliminations
Scania Group
Amounts in SEK m. unless otherwise stated
201812 months
201712 months
201812 months
201712 months
201812 months
201712 months
201812 months
201712 months
Revenue 133,222 119,759 7,797 6,943 -3,893 -3,336 137,126 123,366Cost of sales -101,782 -90,944 -4,999 -4,487 3,893 3,336 -102,888 -92,095
Gross income 31,440 28,815 2,798 2,456 0 0 34,238 31,271Research and development expenses -6,334 -5,769 -6,334 -5,769Selling expenses -10,705 -9,987 -1,291 -1,101 -11,996 -11,088Administrative expenses -2,009 -1,899 -2,009 -1,899Other operating income 163 169 163 169Other operating expenses -230 -250 -230 -250
Operating income 12,392 11,160 1,440 1,274 0 0 13,832 12,434Interest income 419 583 419 583Interest expenses -757 -956 -757 -956Share of income in associated companies and joint ventures 40 44 40 44Dividends in between segments 241 434 -241 -434 0 0Other financial income 378 171 378 171Other financial expenses -593 -194 -593 -194Total financial items -272 82 0 0 -241 -434 -513 -352Income before taxes 12,120 11,242 1,440 1,274 -241 -434 13,319 12,082Taxes -3,170 -3,084 -415 -293 -3,585 -3,377Net income for the period 8,950 8,158 1,025 981 -241 -434 9,734 8,705
October - December
Vehicles and Services
Financial Services Eliminations
Scania Group
Amounts in SEK m. unless otherwise stated
2018Q4
2017Q4
2018Q4
2017Q4
2018Q4
2017Q4
2018Q4
2017Q4
Revenue 37,593 33,324 1,924 1,643 -1,065 -712 38,452 34,255Cost of sales -29,215 -25,453 -1,195 -1,009 1,065 712 -29,345 -25,750Gross income 8,378 7,871 729 634 0 0 9,107 8,505Research and development expenses -1,661 -1,723 -1,661 -1,723Selling expenses -2,932 -2,668 -333 -215 -3,265 -2,883Administrative expenses -487 -538 -487 -538Other operating income 0 0 43 32 43 32Other operating expenses 0 0 -58 -39 -58 -39
Operating income 3,298 2,942 381 412 0 0 3,679 3,354Interest income 125 70 125 70Interest expenses -196 -165 -196 -165Share of income in associated companies and joint ventures 8 13 8 13Dividends in between segments 114 308 -114 -308 0 0Other financial income 102 18 102 18Other financial expenses -254 -28 -254 -28Total financial items -101 216 0 0 -114 -308 -215 -92Income before taxes 3,197 3,158 381 412 -114 -308 3,464 3,262Taxes -893 -822 -110 -90 -1,003 -912Net income for the period 2,304 2,336 271 322 -114 -308 2,461 2,350
Reconciliation of segments to the Scania Group
17
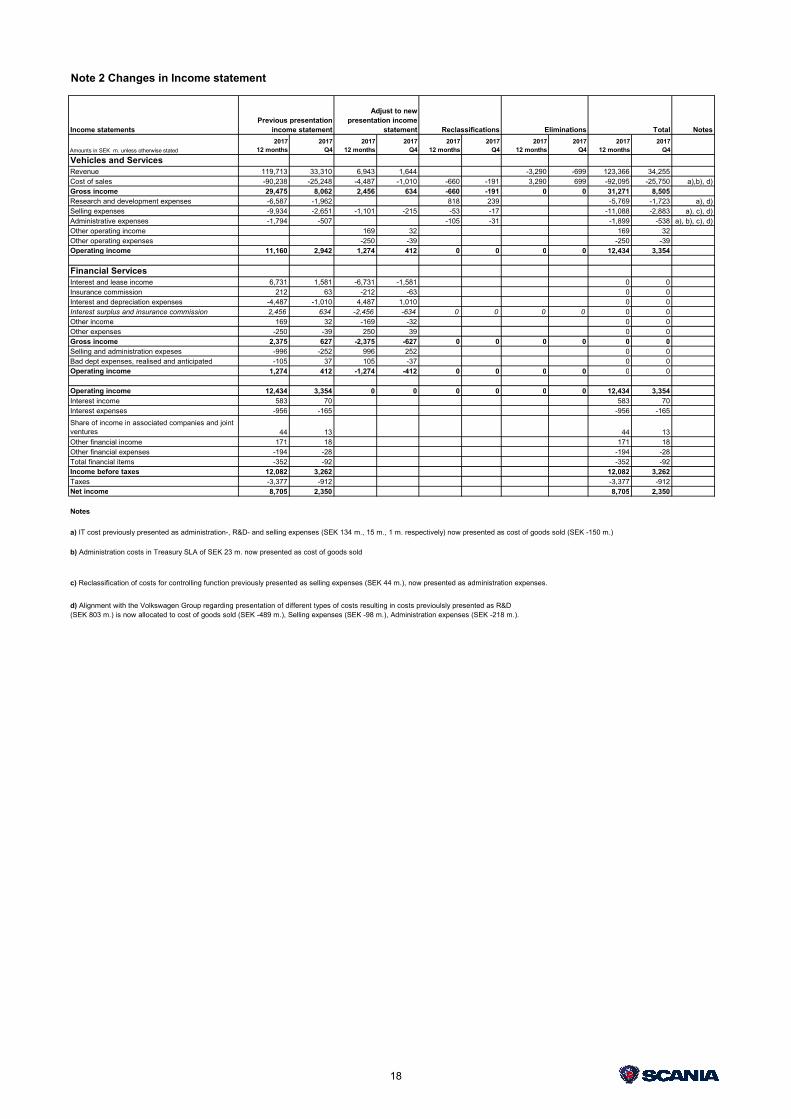
Note 2 Changes in Income statement
Income statements Notes
Amounts in SEK m. unless otherwise stated
201712 months
2017Q4
201712 months
2017Q4
201712 months
2017Q4
201712 months
2017Q4
201712 months
2017Q4
Vehicles and ServicesRevenue 119,713 33,310 6,943 1,644 -3,290 -699 123,366 34,255Cost of sales -90,238 -25,248 -4,487 -1,010 -660 -191 3,290 699 -92,095 -25,750 a),b), d)Gross income 29,475 8,062 2,456 634 -660 -191 0 0 31,271 8,505Research and development expenses -6,587 -1,962 818 239 -5,769 -1,723 a), d)Selling expenses -9,934 -2,651 -1,101 -215 -53 -17 -11,088 -2,883 a), c), d)Administrative expenses -1,794 -507 -105 -31 -1,899 -538 a), b), c), d)Other operating income 169 32 169 32Other operating expenses -250 -39 -250 -39Operating income 11,160 2,942 1,274 412 0 0 0 0 12,434 3,354
Financial ServicesInterest and lease income 6,731 1,581 -6,731 -1,581 0 0Insurance commission 212 63 -212 -63 0 0Interest and depreciation expenses -4,487 -1,010 4,487 1,010 0 0Interest surplus and insurance commission 2,456 634 -2,456 -634 0 0 0 0 0 0Other income 169 32 -169 -32 0 0Other expenses -250 -39 250 39 0 0Gross income 2,375 627 -2,375 -627 0 0 0 0 0 0Selling and administration expeses -996 -252 996 252 0 0Bad dept expenses, realised and anticipated -105 37 105 -37 0 0Operating income 1,274 412 -1,274 -412 0 0 0 0 0 0
Operating income 12,434 3,354 0 0 0 0 0 0 12,434 3,354Interest income 583 70 583 70Interest expenses -956 -165 -956 -165
Share of income in associated companies and joint ventures 44 13 44 13Other financial income 171 18 171 18Other financial expenses -194 -28 -194 -28Total financial items -352 -92 -352 -92Income before taxes 12,082 3,262 12,082 3,262Taxes -3,377 -912 -3,377 -912Net income 8,705 2,350 8,705 2,350
Notes
Previous presentation income statement
Adjust to new presentation income
statement Reclassifications Eliminations Total
d) Alignment with the Volkswagen Group regarding presentation of different types of costs resulting in costs previoulsly presented as R&D (SEK 803 m.) is now allocated to cost of goods sold (SEK -489 m.), Selling expenses (SEK -98 m.), Administration expenses (SEK -218 m.).
c) Reclassification of costs for controlling function previously presented as selling expenses (SEK 44 m.), now presented as administration expenses.
a) IT cost previously presented as administration-, R&D- and selling expenses (SEK 134 m., 15 m., 1 m. respectively) now presented as cost of goods sold (SEK -150 m.)
b) Administration costs in Treasury SLA of SEK 23 m. now presented as cost of goods sold
18
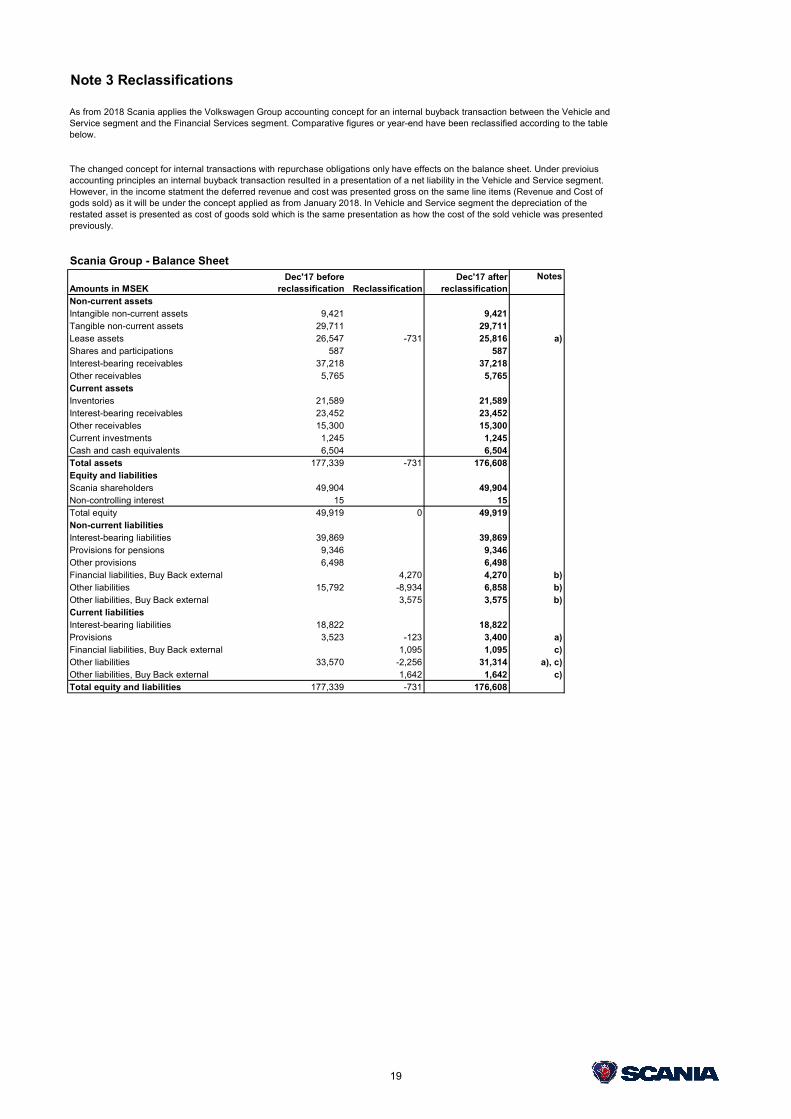
Note 3 Reclassifications
Scania Group - Balance SheetNotes
Amounts in MSEKNon-current assetsIntangible non-current assets 9,421 9,421Tangible non-current assets 29,711 29,711Lease assets 26,547 -731 25,816 a)Shares and participations 587 587Interest-bearing receivables 37,218 37,218Other receivables 5,765 5,765Current assetsInventories 21,589 21,589Interest-bearing receivables 23,452 23,452Other receivables 15,300 15,300Current investments 1,245 1,245Cash and cash equivalents 6,504 6,504Total assets 177,339 -731 176,608Equity and liabilitiesScania shareholders 49,904 49,904Non-controlling interest 15 15Total equity 49,919 0 49,919Non-current liabilitiesInterest-bearing liabilities 39,869 39,869Provisions for pensions 9,346 9,346Other provisions 6,498 6,498Financial liabilities, Buy Back external 4,270 4,270 b)Other liabilities 15,792 -8,934 6,858 b)Other liabilities, Buy Back external 3,575 3,575 b)Current liabilitiesInterest-bearing liabilities 18,822 18,822Provisions 3,523 -123 3,400 a)Financial liabilities, Buy Back external 1,095 1,095 c)Other liabilities 33,570 -2,256 31,314 a), c)Other liabilities, Buy Back external 1,642 1,642 c)Total equity and liabilities 177,339 -731 176,608
Dec'17 before reclassification
Dec'17 after reclassification
The changed concept for internal transactions with repurchase obligations only have effects on the balance sheet. Under previoius accounting principles an internal buyback transaction resulted in a presentation of a net liability in the Vehicle and Service segment. However, in the income statment the deferred revenue and cost was presented gross on the same line items (Revenue and Cost of gods sold) as it will be under the concept applied as from January 2018. In Vehicle and Service segment the depreciation of the restated asset is presented as cost of goods sold which is the same presentation as how the cost of the sold vehicle was presented previously.
As from 2018 Scania applies the Volkswagen Group accounting concept for an internal buyback transaction between the Vehicle and Service segment and the Financial Services segment. Comparative figures or year-end have been reclassified according to the table below.
Reclassification
19
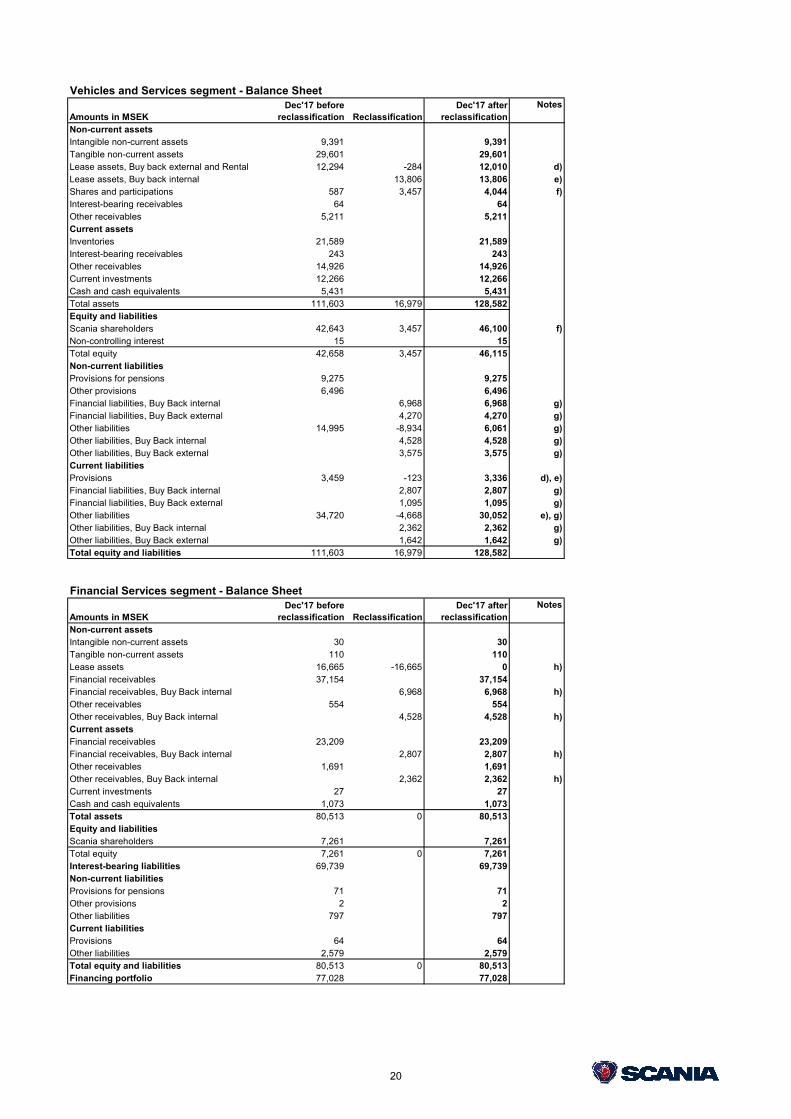
Vehicles and Services segment - Balance SheetNotes
Amounts in MSEKNon-current assetsIntangible non-current assets 9,391 9,391Tangible non-current assets 29,601 29,601Lease assets, Buy back external and Rental 12,294 -284 12,010 d)Lease assets, Buy back internal 13,806 13,806 e)Shares and participations 587 3,457 4,044 f)Interest-bearing receivables 64 64Other receivables 5,211 5,211Current assetsInventories 21,589 21,589Interest-bearing receivables 243 243Other receivables 14,926 14,926Current investments 12,266 12,266Cash and cash equivalents 5,431 5,431Total assets 111,603 16,979 128,582Equity and liabilitiesScania shareholders 42,643 3,457 46,100 f)Non-controlling interest 15 15Total equity 42,658 3,457 46,115Non-current liabilitiesProvisions for pensions 9,275 9,275Other provisions 6,496 6,496Financial liabilities, Buy Back internal 6,968 6,968 g)Financial liabilities, Buy Back external 4,270 4,270 g)Other liabilities 14,995 -8,934 6,061 g)Other liabilities, Buy Back internal 4,528 4,528 g)Other liabilities, Buy Back external 3,575 3,575 g)Current liabilitiesProvisions 3,459 -123 3,336 d), e)Financial liabilities, Buy Back internal 2,807 2,807 g)Financial liabilities, Buy Back external 1,095 1,095 g)Other liabilities 34,720 -4,668 30,052 e), g)Other liabilities, Buy Back internal 2,362 2,362 g)Other liabilities, Buy Back external 1,642 1,642 g)Total equity and liabilities 111,603 16,979 128,582
Financial Services segment - Balance SheetNotes
Amounts in MSEKNon-current assetsIntangible non-current assets 30 30Tangible non-current assets 110 110Lease assets 16,665 -16,665 0 h)Financial receivables 37,154 37,154Financial receivables, Buy Back internal 6,968 6,968 h)Other receivables 554 554Other receivables, Buy Back internal 4,528 4,528 h)Current assetsFinancial receivables 23,209 23,209Financial receivables, Buy Back internal 2,807 2,807 h)Other receivables 1,691 1,691Other receivables, Buy Back internal 2,362 2,362 h)Current investments 27 27Cash and cash equivalents 1,073 1,073Total assets 80,513 0 80,513Equity and liabilitiesScania shareholders 7,261 7,261Total equity 7,261 0 7,261Interest-bearing liabilities 69,739 69,739Non-current liabilitiesProvisions for pensions 71 71Other provisions 2 2Other liabilities 797 797Current liabilitiesProvisions 64 64Other liabilities 2,579 2,579Total equity and liabilities 80,513 0 80,513Financing portfolio 77,028 77,028
Dec'17 before reclassification
Dec'17 after reclassification
Dec'17 before reclassification
Dec'17 after reclassification
Reclassification
Reclassification
20
Note
Note 4 IFRS 9 - Transition
Effect of transition to IFRS 9
Category Financial assets carried at fair value through profit and loss
Loan and trade receivables
Hold to collect
Hold to collect and
Sell
Measurement Fair value through profit and loss
Amortized cost Amortized cost
Fair value through
profit and loss
AssetsInterest-bearing receivables 60,670 -154 60,516Non-interest bearing trade receivables 9,024 -66 8,958Current investments and Cash and Cash equivalents
738 7,011 7,011 738
Other receivables 616 102 102 616Total 1,354 76,807 -220 76,587 1,354
a) Reclassification of provision relating to previous accounting where provisions were made for differences of market value and repurchase price. Also includes reclassification of Artificial price committments previously accounted for as other liabilities. The reclassification is reducing provisions and other liabilites as well as reducing leased assets.
b) Reclassification of previous recognised non-current liability into two parts, one part that is the prepayment (deferred revenue) and one part that is the committment value (repurchase price).
Presented under IAS 39 as per 31 December 2017
IFRS 9 remeasured as of 1 January 2018
Effects on receivables as per 1 January 2018
h) Under previous accounting policy Financial Services segment recognised the vehicle in a buyback transaction. After applying the Volkswagen Group buyback concept Financial Services no longer recognises the vehicle. Instead the amount paid initially for the vehicle is recognised as a receivable and are allocated to one part that is the prepayment and one part that is the repurchase committment which is the amount that Vehicle and Service segment will repurchase the vehicle for in subsequent period. Those are further divided into a current and non-current part.
c) Reclassification of previous recognised current liability to one part that is the prepayment (deferred revenue) and one part that is the committment value (repurchase price) regarding external sold vehicles with repurchase commitment (i.e no internal transaction with the Financial Serviced segment).
d) Adjustment for provision regarding differences between market value and agreed repurchase price and other liabilites regarding artificial price committments.
e) In accordance with the Volksvagen Group buyback concept the vehicles is accounted for in Vehicle and Service, hence the vehicles have been moved from the Financial Services segment and added in the Vehicle and Services segment. Compared to the accounted value in the Financial Services segment the value has been adjusted for regarding internal profit, provision for differences between market value and agreed repurchase price and other liabilites regarding artificial price committments.
f) Restate regarding shares in owned entities in Vehicle and Service segment regarding subsidiaries in Financial Services segment.
g) Splitting current and non-current other liabilities into one part that is the prepaid revenue and one part that is the commitment value and further divided prepaid revenue and commitment value into current and non-current. Other liabilites also contained one part corresponding to internal profit which has been adjusted against leased asset, see comment e) above.
21
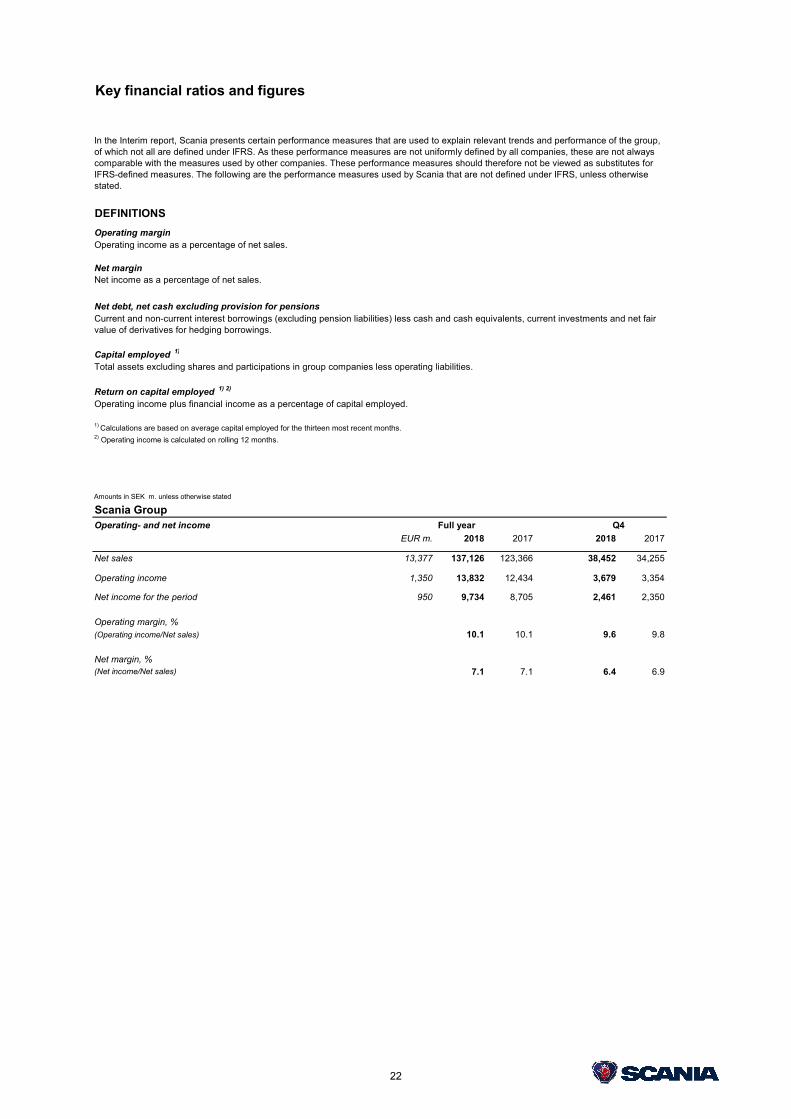
Key financial ratios and figures
DEFINITIONS
Operating margin
Net marginNet income as a percentage of net sales.
Capital employed 1)
Return on capital employed 1) 2)
Amounts in SEK m. unless otherwise stated
Scania GroupOperating- and net income Full year
EUR m. 2018 2017 2018 2017
Net sales 13,377 137,126 123,366 38,452 34,255
Operating income 1,350 13,832 12,434 3,679 3,354
Net income for the period 950 9,734 8,705 2,461 2,350
Operating margin, %(Operating income/Net sales) 10.1 10.1 9.6 9.8
Net margin, % (Net income/Net sales) 7.1 7.1 6.4 6.9
1) Calculations are based on average capital employed for the thirteen most recent months.2) Operating income is calculated on rolling 12 months.
Operating income plus financial income as a percentage of capital employed.
Q4
In the Interim report, Scania presents certain performance measures that are used to explain relevant trends and performance of the group, of which not all are defined under IFRS. As these performance measures are not uniformly defined by all companies, these are not always comparable with the measures used by other companies. These performance measures should therefore not be viewed as substitutes for IFRS-defined measures. The following are the performance measures used by Scania that are not defined under IFRS, unless otherwise stated.
Operating income as a percentage of net sales.
Current and non-current interest borrowings (excluding pension liabilities) less cash and cash equivalents, current investments and net fair value of derivatives for hedging borrowings.
Net debt, net cash excluding provision for pensions
Total assets excluding shares and participations in group companies less operating liabilities.
22
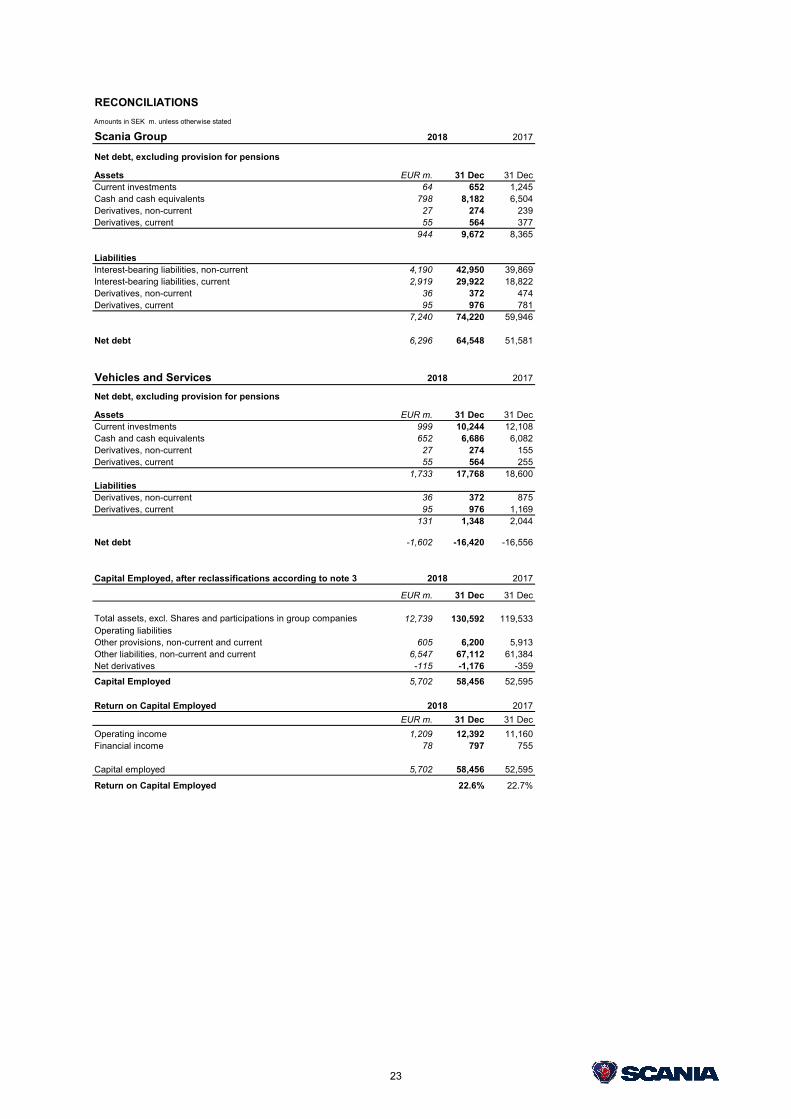
RECONCILIATIONS
Amounts in SEK m. unless otherwise stated
Scania Group 2017
Net debt, excluding provision for pensions
Assets EUR m. 31 Dec 31 DecCurrent investments 64 652 1,245Cash and cash equivalents 798 8,182 6,504Derivatives, non-current 27 274 239Derivatives, current 55 564 377
944 9,672 8,365
LiabilitiesInterest-bearing liabilities, non-current 4,190 42,950 39,869Interest-bearing liabilities, current 2,919 29,922 18,822Derivatives, non-current 36 372 474Derivatives, current 95 976 781
7,240 74,220 59,946
Net debt 6,296 64,548 51,581
Vehicles and Services 2017
Net debt, excluding provision for pensions
Assets EUR m. 31 Dec 31 DecCurrent investments 999 10,244 12,108Cash and cash equivalents 652 6,686 6,082Derivatives, non-current 27 274 155Derivatives, current 55 564 255
1,733 17,768 18,600LiabilitiesDerivatives, non-current 36 372 875Derivatives, current 95 976 1,169
131 1,348 2,044
Net debt -1,602 -16,420 -16,556
Capital Employed, after reclassifications according to note 3 2017
EUR m. 31 Dec 31 Dec
Total assets, excl. Shares and participations in group companies 12,739 130,592 119,533Operating liabilitiesOther provisions, non-current and current 605 6,200 5,913Other liabilities, non-current and current 6,547 67,112 61,384Net derivatives -115 -1,176 -359
Capital Employed 5,702 58,456 52,595
Return on Capital Employed 2017
EUR m. 31 Dec 31 Dec
Operating income 1,209 12,392 11,160Financial income 78 797 755
Capital employed 5,702 58,456 52,595
Return on Capital Employed 22.6% 22.7%
2018
2018
2018
2018
23