Embed Size (px)
Citation preview
Design & Engineering Services
ICE RINK WATER TREATMENT SYSTEM ASSESSMENT
ET09SCE1070 Report
Prepared by:
Design & Engineering Services
Customer Service Business Unit
Southern California Edison
December 22, 2010
Ice Rink Water Treatment System Assessment ET09SCE1070
Southern California Edison
Design & Engineering Services December 2010
Acknowledgements
Southern California Edison’s Design & Engineering Services (DES) group is responsible for
this project. It was developed as part of Southern California Edison’s Emerging Technologies
Program under internal project number ET09SCE1070. DES’ Charles Kim conducted this
technology evaluation with overall guidance and management from Paul Delaney. This
project was executed by Cypress, LTD. For more information on this project, contact
Disclaimer
This report was prepared by Southern California Edison (SCE) and funded by California
utility customers under the auspices of the California Public Utilities Commission.
Reproduction or distribution of the whole or any part of the contents of this document
without the express written permission of SCE is prohibited. This work was performed with
reasonable care and in accordance with professional standards. However, neither SCE nor
any entity performing the work pursuant to SCE’s authority make any warranty or
representation, expressed or implied, with regard to this report, the merchantability or
fitness for a particular purpose of the results of the work, or any analyses, or conclusions
contained in this report. The results reflected in the work are generally representative of
operating conditions; however, the results in any other situation may vary depending upon
particular operating conditions.
Ice Rink Water Treatment System Assessment ET09SCE1070
Southern California Edison Page i Design & Engineering Services December 2010
ABBREVIATIONS AND ACRONYMS
° Degree
Btu British thermal unit
DES Design and Engineering Services
F Fahrenheit
Hr or hr hour
IHL Internal Heat Load
kW Kilo-Watt
kWh Kilo-Watt hour
MBtu 1,000 Btu
psi Pound per square inch
SCE Southern California Edison
T or Temp Temperature
Ice Rink Water Treatment System Assessment ET09SCE1070
Southern California Edison Page ii Design & Engineering Services December 2010
FIGURES Figure 1. Configuration of an Ice Rink .......................................... 2
Figure 2. Realice Retrofit Device ................................................. 7
Figure 3. Installed Realice System .............................................. 9
Figure 4. Pre Condition: Ambient Temperature vs Total
Chiller/Compressor Power ........................................... 15
Figure 5. Post Condition: Ambient Temperature vs Total
Chiller/Compressor Power ........................................... 15
Figure 6. Pre and Post Compressors/Deg F Comparison ................ 18
Figure 7. Ice Quality Testing Results for San Miguel Ice Rink of
the Testing Site ......................................................... 22
Figure 8. Ice Quality Testing Results for Anacapa Rink of the
Testing Site ............................................................... 23
TABLES Table 1. Summary of kW per Compressor .................................. 16
Table 2. Example of kW per Compressor for One Day .................. 17
Table 3. Example of Calculating Hourly kWh .............................. 19
Table 4. Summary of Field Assessment Results .......................... 19
Table 5. Gas Saving Results ..................................................... 21
Ice Rink Water Treatment System Assessment ET09SCE1070
Southern California Edison Page iii Design & Engineering Services December 2010
CONTENTS
EXECUTIVE SUMMARY _______________________________________________ 1
INTRODUCTION ____________________________________________________ 2
BACKGROUND ____________________________________________________ 4
The Ice .................................................................................. 4
Temperature: Good Ice vs. Bad Ice ........................................... 5
Maintaining the Rink ................................................................ 5
Ice-Resurfacing Machines .................................................... 5
Emerging Technology/Product ................................................... 6
ASSESSMENT OBJECTIVES ____________________________________________ 8
TECHNOLOGY/PRODUCT EVALUATION __________________________________ 9
Baseline Technology ................................................................ 9
New Technology: Treated Water for Ice ..................................... 9
FACILITY OVERVIEW ............................................................... 9
TEST METHODOLOGY ______________________________________________ 11
Field Testing of Technology .................................................... 11
Test Plan ......................................................................... 11 Instrumentation Plan ........................................................ 13
Error Analysis ....................................................................... 13
RESULTS_________________________________________________________ 14
Data Analysis ........................................................................ 14
Determining the kW per Compressor to use .............................. 16
Determining the number of Compressors on Line ...................... 17
Establishing a daily Load Profile .............................................. 18
Establish an Annual Projection ................................................ 18
Gas Energy Savings ............................................................... 20
Ice Quality Testing ................................................................ 21
EVALUATIONS ____________________________________________________ 24
RECOMMENDATIONS ______________________________________________ 25
Ice Rink Water Treatment System Assessment ET09SCE1070
Southern California Edison Page iv
Design & Engineering Services December 2010
REFERENCES _____________________________________________________ 26
Ice Rink Water Treatment System Assessment ET09SCE1070
Southern California Edison Page 1
Design & Engineering Services December 2010
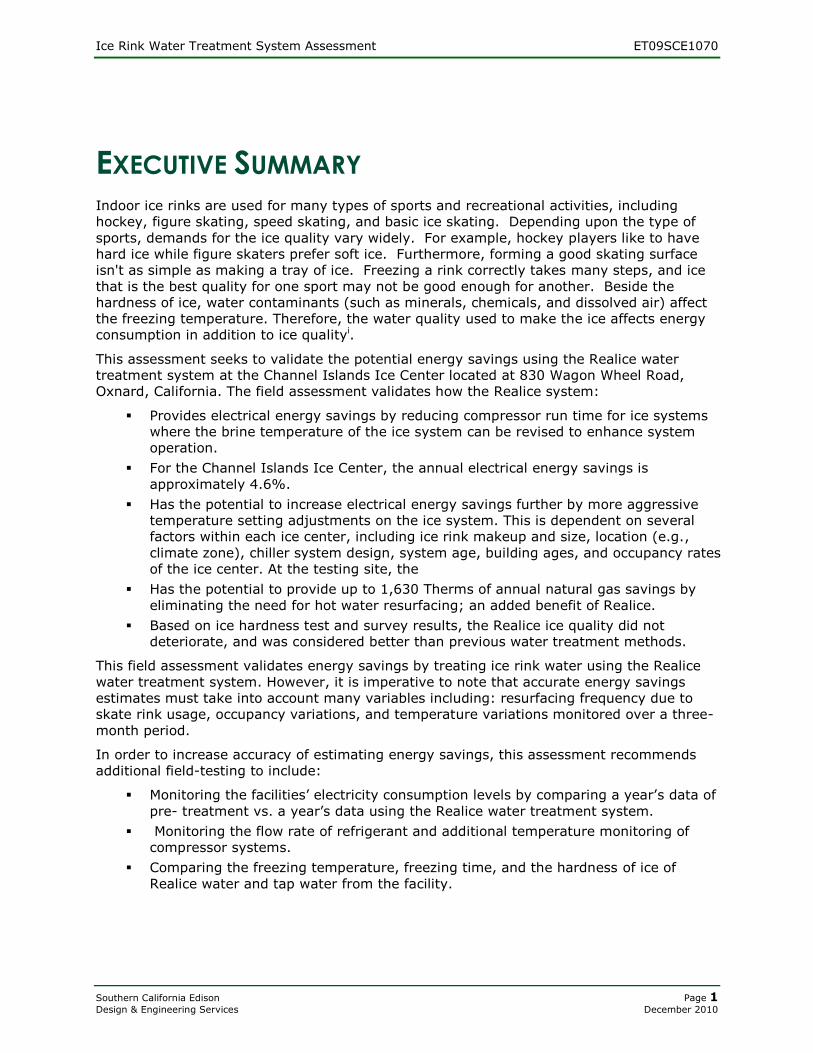
EXECUTIVE SUMMARY Indoor ice rinks are used for many types of sports and recreational activities, including
hockey, figure skating, speed skating, and basic ice skating. Depending upon the type of
sports, demands for the ice quality vary widely. For example, hockey players like to have
hard ice while figure skaters prefer soft ice. Furthermore, forming a good skating surface
isn't as simple as making a tray of ice. Freezing a rink correctly takes many steps, and ice
that is the best quality for one sport may not be good enough for another. Beside the
hardness of ice, water contaminants (such as minerals, chemicals, and dissolved air) affect
the freezing temperature. Therefore, the water quality used to make the ice affects energy
consumption in addition to ice qualityi.
This assessment seeks to validate the potential energy savings using the Realice water
treatment system at the Channel Islands Ice Center located at 830 Wagon Wheel Road,
Oxnard, California. The field assessment validates how the Realice system:
Provides electrical energy savings by reducing compressor run time for ice systems
where the brine temperature of the ice system can be revised to enhance system
operation.
For the Channel Islands Ice Center, the annual electrical energy savings is
approximately 4.6%.
Has the potential to increase electrical energy savings further by more aggressive
temperature setting adjustments on the ice system. This is dependent on several
factors within each ice center, including ice rink makeup and size, location (e.g.,
climate zone), chiller system design, system age, building ages, and occupancy rates
of the ice center. At the testing site, the
Has the potential to provide up to 1,630 Therms of annual natural gas savings by
eliminating the need for hot water resurfacing; an added benefit of Realice.
Based on ice hardness test and survey results, the Realice ice quality did not
deteriorate, and was considered better than previous water treatment methods.
This field assessment validates energy savings by treating ice rink water using the Realice
water treatment system. However, it is imperative to note that accurate energy savings
estimates must take into account many variables including: resurfacing frequency due to
skate rink usage, occupancy variations, and temperature variations monitored over a three-
month period.
In order to increase accuracy of estimating energy savings, this assessment recommends
additional field-testing to include:
Monitoring the facilities’ electricity consumption levels by comparing a year’s data of
pre- treatment vs. a year’s data using the Realice water treatment system.
Monitoring the flow rate of refrigerant and additional temperature monitoring of
compressor systems.
Comparing the freezing temperature, freezing time, and the hardness of ice of
Realice water and tap water from the facility.
Ice Rink Water Treatment System Assessment ET09SCE1070
Southern California Edison Page 2
Design & Engineering Services December 2010
INTRODUCTION The underlying technology behind indoor ice rinks is the same technology at work in
refrigerators and air conditioners. The main difference in an ice rink, other than sheer size,
is that the refrigerant does not cool the ice directly. Instead, it cools brine, a calcium-
chloride solution that is pumped through an intricate system of pipes underneath the ice.
The brine’s chemical makeup keeps it from freezing. In most rinks, the pipes are embedded
in a concrete or sand base.
This field assessment demonstrates energy savings by treating ice rink water using the
Realice water treatment system. However, it is imperative to note that accurate energy
savings estimates must take into account many variables including: resurfacing frequency
due to skate rink usage, occupancy variations, and temperature variations monitored over a
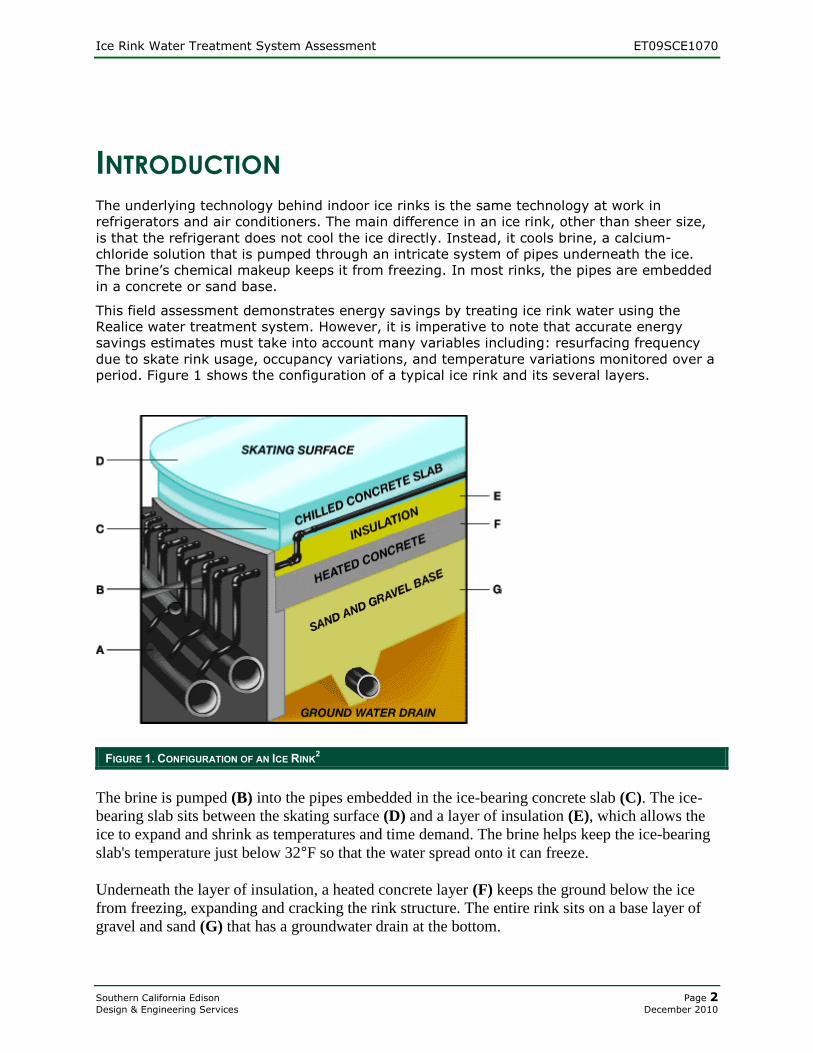
period. Figure 1 shows the configuration of a typical ice rink and its several layers.
FIGURE 1. CONFIGURATION OF AN ICE RINK2
The brine is pumped (B) into the pipes embedded in the ice-bearing concrete slab (C). The ice-
bearing slab sits between the skating surface (D) and a layer of insulation (E), which allows the
ice to expand and shrink as temperatures and time demand. The brine helps keep the ice-bearing
slab's temperature just below 32°F so that the water spread onto it can freeze.
Underneath the layer of insulation, a heated concrete layer (F) keeps the ground below the ice
from freezing, expanding and cracking the rink structure. The entire rink sits on a base layer of
gravel and sand (G) that has a groundwater drain at the bottom.

Ice Rink Water Treatment System Assessment ET09SCE1070
Southern California Edison Page 3
Design & Engineering Services December 2010
To defrost the skating surface, the brine is heated and pumped through the ice-bearing concrete
slab. This process heats the under layer of the ice - making it easier to break up and remove with
front-end loaders.
Ice Rink Water Treatment System Assessment ET09SCE1070
Southern California Edison Page 4
Design & Engineering Services December 2010
BACKGROUND Years before hockey or the Winter Olympics, ice skating was a means of getting across the
frozen waterways in northern Europe. It was only when ice became available year-round
that sports such as hockey and figure skating took off.
The success of modern ice rinks owes a lot to Lester and Joe Patrick, two brothers who
created hockey leagues in Canada in the early 1900s. On Christmas Day 1912, the brothers
opened Canada's first indoor ice rink in Victoria, Canada. The arena cost $110,000 to build
and seated 4,000 people. Three days later, the Patrick brothers opened another arena in
Vancouver, Canada. This was a more expensive arena -- $210,000 to build -- and it could
hold more than 10,000 people. Underneath the ice was the world's then-largest refrigeration
and ice-making system.
Over the next few decades, the Patricks were responsible for creating arenas all across the
northwest United States and throughout western Canada. Today, the United States has
more than 1,700 ice rinks and new ones can cost hundreds of millions of dollars to build.
While the strength and skill of great ice skaters is immediately obvious, it's easy to overlook
the remarkable surface that makes it all possible. But as it turns out, varying the
characteristics of indoor ice just a little bit can make the difference between a gold-medal
performance and an embarrassing spill.
Indoor ice rinks are used for all sorts of sports and recreational activities, including hockey,
figure skating and speed skating. In all of these sports the quality of the ice makes a big
difference.
Forming a good skating surface isn't as simple as making a tray of ice cubes. Freezing a rink
correctly takes no less than a dozen stages, with some stages laying ice that may be as thin
as 1/32 of an inch (0.8 millimeters). Some layers require paint to create an attractive
background and, in the case of hockey, provide clear markings. And ice that's best for one
sport may be completely unacceptable for another.
THE ICE Making an ice rink is not as simple as flooding the floor with gallons of water. Water
must be applied carefully and slowly, in order to ensure ideal thickness. An ice
surface that is too thick requires more energy to keep frozen and is prone to getting
soft on the top. A surface that is too thin is also dangerous because skaters risk
cutting straight through the ice.
Ice Rink Water Treatment System Assessment ET09SCE1070
Southern California Edison Page 5
Design & Engineering Services December 2010
TEMPERATURE: GOOD ICE VS. BAD ICE
When creating a new ice surface, indoor conditions are very important. The
outdoor temperature can also affect the ice conditions. The arena and ice
temperatures must change to compensate for the heat and humidity that will come
in when the arena doors are opened to skaters. Ice conditions can vary greatly with
a temperature change as small as one degree. The type of water also can change
conditions. For example, ice made with water that contains dissolved alkaline salts
may have a sticky feel to it and will dull skate blades. To counteract these problems,
many rinks use water purifiers or add chemical conditioners to tap water.
MAINTAINING THE RINK No matter how well-groomed the ice rink, the ice will eventually be cut and pitted,
and dust and bugs will dull it. The ability to quickly and effectively resurface the ice
is as important to skating as the development of indoor ice itself.
ICE-RESURFACING MACHINES
Before ice-resurfacing machines, ice rinks were resurfaced manually, using scrapers,
towels, a water hose and squeegees. Resurfacing a regulation-size rink was time-
consuming and labor-intensive. In the 1940s, Frank Zamboni began to experiment
with building machines that would shave, scrape, wash and squeegee the ice surface
all at once before putting down a fresh layer of water.
Early ice-resurfacing machines cost about $5,000 and were built by hand on war-
surplus jeeps. Today, ice-resurfacing machines cost significantly more (about
$55,000), are mass-produced, and every rink has at least one.
The underlying technology behind indoor ice rinks is the same technology at work in
refrigerators and air conditioners. The main difference in an ice rink, other than sheer size,
is that the refrigerant does not cool the ice directly. Instead, it cools brine, a calcium-
chloride solution, which is pumped through an intricate system of pipes underneath the ice.
In most rinks, the pipes are embedded in a concrete or sand base.
Typical ice rinks simply use domestic water to build the ice. As a result, impurities and
dissolved air are in the water that demand higher energy to freeze and makes ice less
denser (e.g., There are micro bubbles inside of ice, therefore, it can be broken easily; more
shaved ice on the surface after the use). Thus, removing impurities and dissolved air from
the domestic water can save energy by allowing the water to change its phase into ice at a
higher temperature. This concept could allow a chiller system to be operated at higher brine
temperatures, which can reduce the overall compressor run time, and thus save energy.
Ice Rink Water Treatment System Assessment ET09SCE1070
Southern California Edison Page 6
Design & Engineering Services December 2010
According to ASHRAE’s 2006 Refrigeration Handbook, it states:
Water quality affects energy consumption and ice quality. Water contaminants, such
as minerals, organic matter, and dissolved air, can affect both the freezing
temperature and the ice thickness necessary to provide satisfactory ice conditions.
Proprietary treatment systems for arena flood water are available. When these
treatments are properly applied, they reduce or eliminate the effects of contaminants
and improve ice conditions.3
There is a wide range of technologies that can control compressor systems for building ice,
however, a typical practice among ice rinks is simply deploying domestic water to build the
ice. Therefore, using the domestic water serves as the baseline4. The Channel Islands Ice
Center’s main driver for participating in this field assessment is reducing the energy usage
without jeopardizing the quality of ice. Therefore, this project focuses on the feasibility of
reducing energy consumption by removing impurities and dissolved air from the domestic
water that builds ice without changing its quality.
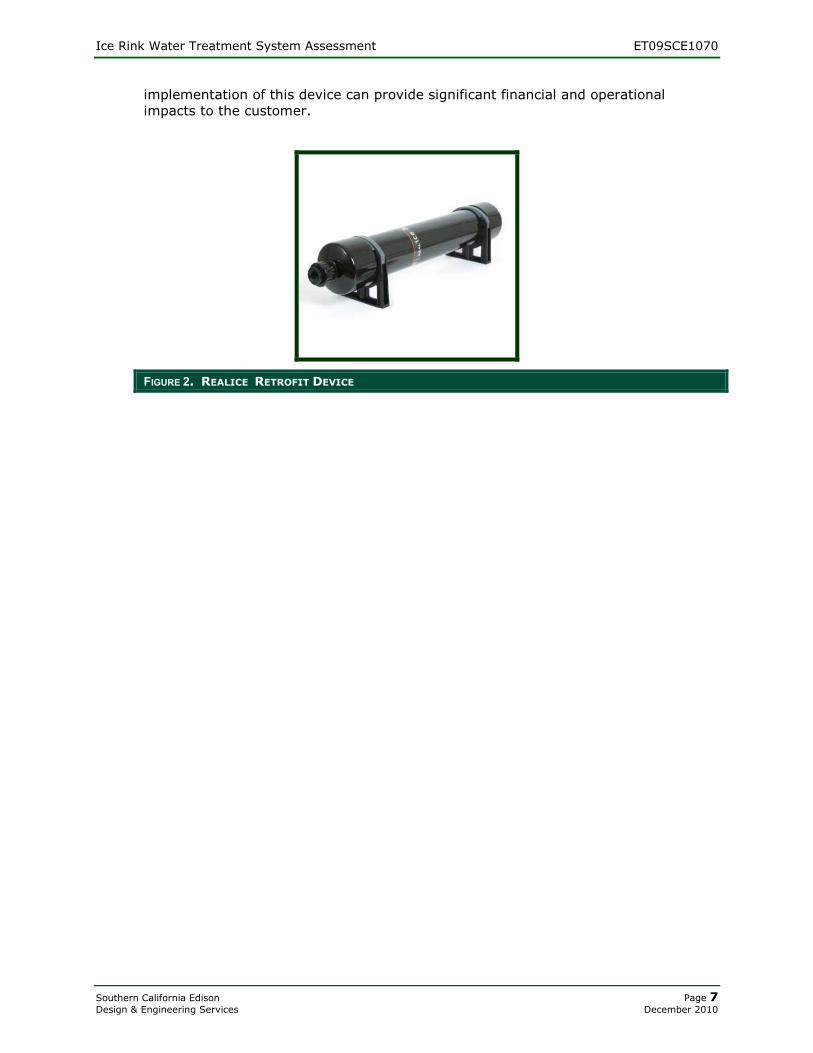
EMERGING TECHNOLOGY/PRODUCT The Realice device, shown in Figure 2, is intended to create a vortex as the water
enters the device. The vortex increases the velocity of the water to promote the
separation of dissolved air and impurities from the water source. This separation
allows the water to be “air free”. One of the benefits that this “air free” water
provides is that it can be frozen at higher temperatures. This is possible because
impurities and dissolved air acts like an insulator when the water changes to ice.
Thus, removing impurities and dissolved air from the domestic water can save
energy by allowing the water to change to ice at a higher temperature. This concept
allows the chiller system to operate at a higher brine temperature that can reduce
the overall compressor run time, and save energy. The manufacturer has indicated
that the device may be able to allow the facility to raise the brine temperature by up
to 4° Fahrenheit (F). The potential temperature rise is dependent on a number of
variables such as ice rink makeup and size, location (e.g., climate zone), chiller
system design, system age, building age, and occupancy rates of the ice center. The
following are additional benefits, indicated by the manufacturer:
Using the device allows the facility to use ambient temperature domestic water
for resurfacing and to build new ice. The typical resurfacing, for example,
requires the water to be heated.
The device lowers the viscosity of the water thereby making the water out flow
easy despite using ambient temperature of added water.
The device changes the lime scale crystals from calcite to aragonite, which
changes the overall shape of the crystals in the water supply. This affect avoids
the formation of lime scale deposits in the ice.
The device improves the ice quality to be denser, more even, and more durable
under usage conditions.
Currently, the Realice system is new to U.S. customers. Like any new product, it
needs “early adaptors” in order to transform the market. The early adaptors will
likely face two financial barriers. The first barrier is the equipment cost
(approximately $29,000 per system). The second barrier is in the implementation
phase. The implementation phase requires closing the ice rink from anywhere
between a few days to two weeks to remove the existing ice. Then the creation of
new ice is applied in several layers, over time. Therefore, the installation and
Ice Rink Water Treatment System Assessment ET09SCE1070
Southern California Edison Page 7
Design & Engineering Services December 2010
implementation of this device can provide significant financial and operational
impacts to the customer.
FIGURE 2. REALICE RETROFIT DEVICE
Ice Rink Water Treatment System Assessment ET09SCE1070
Southern California Edison Page 8
Design & Engineering Services December 2010
ASSESSMENT OBJECTIVES This project seeks to find a viable way to improve energy savings by retrofitting a water
treatment device used to build and resurface ice. Water contaminants such as minerals,
chemicals, and dissolved air can affect the freezing temperature. The treated water,
therefore, can save energy by allowing water to be frozen at a higher temperature over a
shorter period of time. The goal of this field evaluation is to:
Address the feasibility of this technology for ice rinks
Assess the possibility of energy savings by increasing the brine temperature with treated
water that creates the ice
Validate if the system can allow the facility to use treated water at room temperature for
resurfacing, and
Check the quality of ice (e.g., hardness test).
Ice Rink Water Treatment System Assessment ET09SCE1070
Southern California Edison Page 9
Design & Engineering Services December 2010
TECHNOLOGY/PRODUCT EVALUATION
BASELINE TECHNOLOGY Typically, an ice rink uses domestic water supplied by the local utility. The baseline
technology for this field evaluation is the use of domestic water to build ice using the
existing chiller system. The Channel Islands Ice Center used domestic water to make
their ice prior to installing the Realice system..
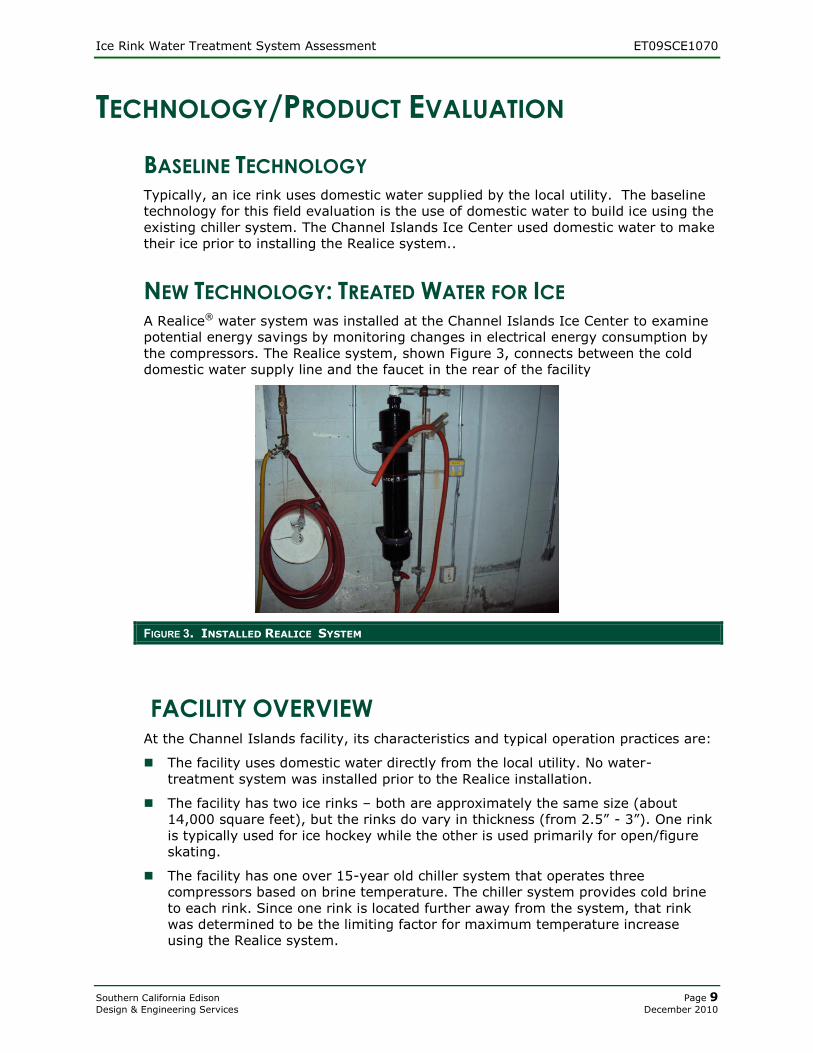
NEW TECHNOLOGY: TREATED WATER FOR ICE A Realice® water system was installed at the Channel Islands Ice Center to examine
potential energy savings by monitoring changes in electrical energy consumption by
the compressors. The Realice system, shown Figure 3, connects between the cold
domestic water supply line and the faucet in the rear of the facility
FIGURE 3. INSTALLED REALICE SYSTEM
FACILITY OVERVIEW At the Channel Islands facility, its characteristics and typical operation practices are:
The facility uses domestic water directly from the local utility. No water-
treatment system was installed prior to the Realice installation.
The facility has two ice rinks – both are approximately the same size (about
14,000 square feet), but the rinks do vary in thickness (from 2.5” - 3”). One rink
is typically used for ice hockey while the other is used primarily for open/figure
skating.
The facility has one over 15-year old chiller system that operates three
compressors based on brine temperature. The chiller system provides cold brine
to each rink. Since one rink is located further away from the system, that rink
was determined to be the limiting factor for maximum temperature increase
using the Realice system.
Ice Rink Water Treatment System Assessment ET09SCE1070
Southern California Edison Page 10
Design & Engineering Services December 2010
There is no automated control system for the facility. The operation is strictly
manual for controlling the brine temperature.
There is no data collection available at the facility for the flow of brine, the supply
temperature, and the only indication of return temperature is a digital display. At
the time of the pre measurements, the brine temperature was set at 19°F.
While there is an occupancy schedule produced weekly, the schedule is not
consistent, and open times allow for substantial variation in occupancy between
the two rinks depending upon various programs (such as little league hockey
practice schedules and games).
The facility has a tankless water heater. From discussions with facility personnel,
hot water resurfacing has been used sporadically, but typically, the facility
already resurfaces the ice rinks with ambient temperature domestic water.

Ice Rink Water Treatment System Assessment ET09SCE1070
Southern California Edison Page 11
Design & Engineering Services December 2010
TEST METHODOLOGY
By reducing ice-freezing time, or raising the brine temperature to maintain the same quality
of ice, energy savings are achieved because of reduced compressor/chiller system run time.
If the brine temperature is increased, the result is a reduction in overall compressor run
time to freeze the same quantity of ice.
In general, the overall actual run time and energy consumption are very dependent on a
number of variables such as climate zones, frequency of ice resurfacing, occupancy, rink air
temperature and humidity, ceiling radiation, lighting radiation and ground heat.. Given
consistent variable input, however, the overall result of the device is to reduce the
compressor run time in hours thus reducing energy. On the other hand, the peak demand
cannot be reduced with the installation of the Realice system as the compress run time will
be longer than 15 minutes regardless of Realice.
Reduced hot water energy, if applicable, is due to ambient temperature domestic water
resurfacing instead of using heated water. This energy is typically comes from gas
consumption using a traditional boiler or water heater.
FIELD TESTING OF TECHNOLOGY
TEST PLAN
The project entailed a number of steps that were necessary to establish the baseline
and post installation conditions for estimating an overall energy savings. These steps
are outlined below:
Step 1: Physical assessment of the facility - A physical assessment of the facility and
operation is completed. This provides the basis for establishing the overall method
that can be used for determining the best method of reasonable savings calculations.
The test-site ice rinks produced the following observations:
The facility has no automated control for the chiller/compressor system.
The only indicator at the chiller/compressor system is the brine temperature.
The chiller/compressor system is 15 years old.
Step 2: Establish methodology for savings assessment and monitoring variables –
Step 1 is the bases for the following test methodology, since the Channel Island
facility only has manual controls:
Service entrance and chiller/compressor energy consumption is monitored for the
pre and post periods.
Outdoor air temperature at the cooling tower is monitored for both the pre and
post periods. Since the cooling tower heat rejection is proportional to outdoor air
Ice Rink Water Treatment System Assessment ET09SCE1070
Southern California Edison Page 12
Design & Engineering Services December 2010
temperature this can be used for a regression analysis, relating temperature
variations to the energy usage.
To eliminate any anomalies, monitoring of the indoor temperature at each rink
occurred. Temperature monitoring validates whether internal heat loads varied
significantly between the pre and post conditions and any failures of ice rink
system.
Step 3: Monitor baseline data – This step establishes the baseline (or pre condition)
monitoring. The brine temperature is maintained manually (setting only, the actual
temperature of the brine varies over time depending on load) at 19°F. The
monitoring period is between March 5, 2010 and April 14, 2010. The ice rink opens
at 9:00 a.m. The closing time is different on each day of the week; however, it
remained constant during the evaluation period.
Step 4: Test ice quality parameters for baseline conditions – Using a Schmidt
hammer, the ice quality of pre condition is measured by testing the ice’s surface
strength. Although not designed to measure the lower surface strength of ice
accurately, this device allows a comparative test between pre and post.
Step 5: Install Realice system – Installed the Realice system between the faucet and
the water pipeline in the Zamboni room. This is the area where domestic water is
injected into the Zamboni for resurfacing.
Step 6: De-ice rinks and lay new ice with treated water - The owner supports
replacing the existing ice with Realice-treated water to conduct the post condition
measurements. The existing ice was removed (shaved down using the Zamboni),
and rebuilt several layers of new ice using Realice-treated water. The ice rink is
closed during this process, about two weeks.
Step 7: Stabilize ice conditions with treated water - The facility management team
tested the quality of the new ice over a 24-hour period and accepted the results and
reopened the rink.
Step 8: Raise brine temperature on established schedule by set amounts, and
establish maximum increase in brine settings - The facility management team
increased the brine temperature by 1°F every two to three days until the ice started
to deteriorate. The temperature setting was returned to the previous setting where
the ice condition was deemed acceptable. The new brine temperature was 21°F; a
2°F increase from the previous condition.
Step 9: Monitor post condition data - With the new ice (i.e., ice with treated water)
in place, post monitoring of the same inputs were conducted between June and
August of 2010. The operating hours remained the same.
Step 10: Test ice quality parameters for post conditions - The ice quality of pre
condition was measured by testing surface strength on contact using a Schmidt
hammer at the same locations as the pre condition.
Step 11: Complete data analysis - In addition to the test plan described above, this
assessment followed the International Performance Measurement & Verification
Protocol.
Ice Rink Water Treatment System Assessment ET09SCE1070
Southern California Edison Page 13
Design & Engineering Services December 2010
INSTRUMENTATION PLAN
PowerSight PS2500 is a power-quality measurement device that complies with IEC
61010-1 (2000). Its accuracy level is ±0.5% margin of error. The probe selected is
an eFX6000 that complies with EMC EN61326-2-2:2006. Its accuracy level is less
than a 3% margin of error. Temperature measurements were taken using the OnSet
U10 data logger. All measurements were taken in 15-minute intervals.
The instrumentation calibrations are up to date.
ERROR ANALYSIS Error analysis for such accurate meters and probes are not necessary when the
collected data is from a few number of independent variables. For example, if a
variable kW is dependant upon two independent variables (V and I), then calculating
the error in kW is simply:
22
I
I
V
V
kW
kW
Therefore, the error in kW is driven by the most inaccurate sensors. In this case, it
is the current probe. Its accuracy level is 3%, which implies that the kW error is less
than 3.1%.

Ice Rink Water Treatment System Assessment ET09SCE1070
Southern California Edison Page 14
Design & Engineering Services December 2010
RESULTS
DATA ANALYSIS Due to the nature of random variables (i.e., daily occupancy use in and out of the ice
rink) and monitoring, controllable variables cannot be measured cost effectively.
The following assumptions are made prior to run analysis.
Internal Heat Load (IHL) is assumed to be consistent between the pre and post
data-collection periods. In other words, it is assumed that the variation in heat
load that can affect chiller efficiency is constant from pre to post conditions. The
chiller/compressor system loading is also assumed to be consistent between pre
and post periods for internal heat load and serves no load other than the
refrigerant.
Ice Thickness – variations in ice thickness are assumed negligible.
Changes in refrigerant flow – it is also assumed to be consistent and therefore
not included in the assessment in chiller/compressor power calculations.
Changes in temperatures – This is assumed consistent with the changes in
outside air temperature. While other factors affect the overall temperature
variations and therefore no real direct correlation can be calculated between
inside air temperature vs. outside air temperature.
Changes in outside air temperature – As noted this was assumed as the swing
variable in the analysis to determine the chiller energy usage for specific outside
temperature readings.
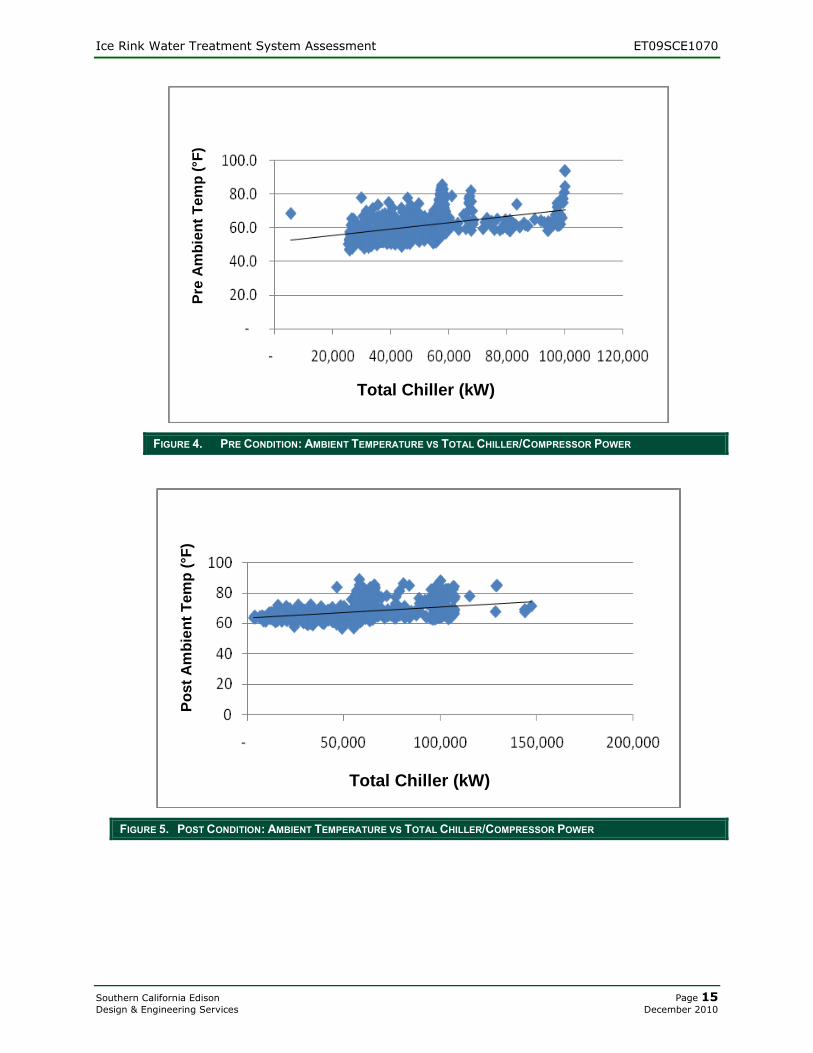
Other variables not monitored can affect the performance of the compressor run time as
well. In general, however, there is a relationship between the ambient temperature and
the total power of the chiller/compressor system that is monitored, see Figure 4 and
Figure 5.
Ice Rink Water Treatment System Assessment ET09SCE1070
Southern California Edison Page 15
Design & Engineering Services December 2010
Total Chiller (kW)
Pre
Am
bie
nt
Tem
p (
°F)
Total Chiller (kW)
Pre
Am
bie
nt
Tem
p (
°F)
FIGURE 4. PRE CONDITION: AMBIENT TEMPERATURE VS TOTAL CHILLER/COMPRESSOR POWER
Total Chiller (kW)
Po
st
Am
bie
nt
Tem
p (
°F)
Total Chiller (kW)
Po
st
Am
bie
nt
Tem
p (
°F)
FIGURE 5. POST CONDITION: AMBIENT TEMPERATURE VS TOTAL CHILLER/COMPRESSOR POWER
Ice Rink Water Treatment System Assessment ET09SCE1070
Southern California Edison Page 16
Design & Engineering Services December 2010
It is important to note:
While the chart shows a different slope in terms of the total kW measured versus
the outside air temperature (trend lines), this does not tell how many
compressors are on line at each point collected. In other words, the other
variables would certainly affect the conditions on the “total” kW measured. For
example, at a given temperature two compressors can be running while only one
compressor runs on the other day(s). This variation is taken into account by
assessing how many compressors are on at any one particular hour.
The chart does illustrate a general trend in terms of total kW and outside air
temperature – this implies that higher outside air temperatures require more kW
per compressor or chiller.
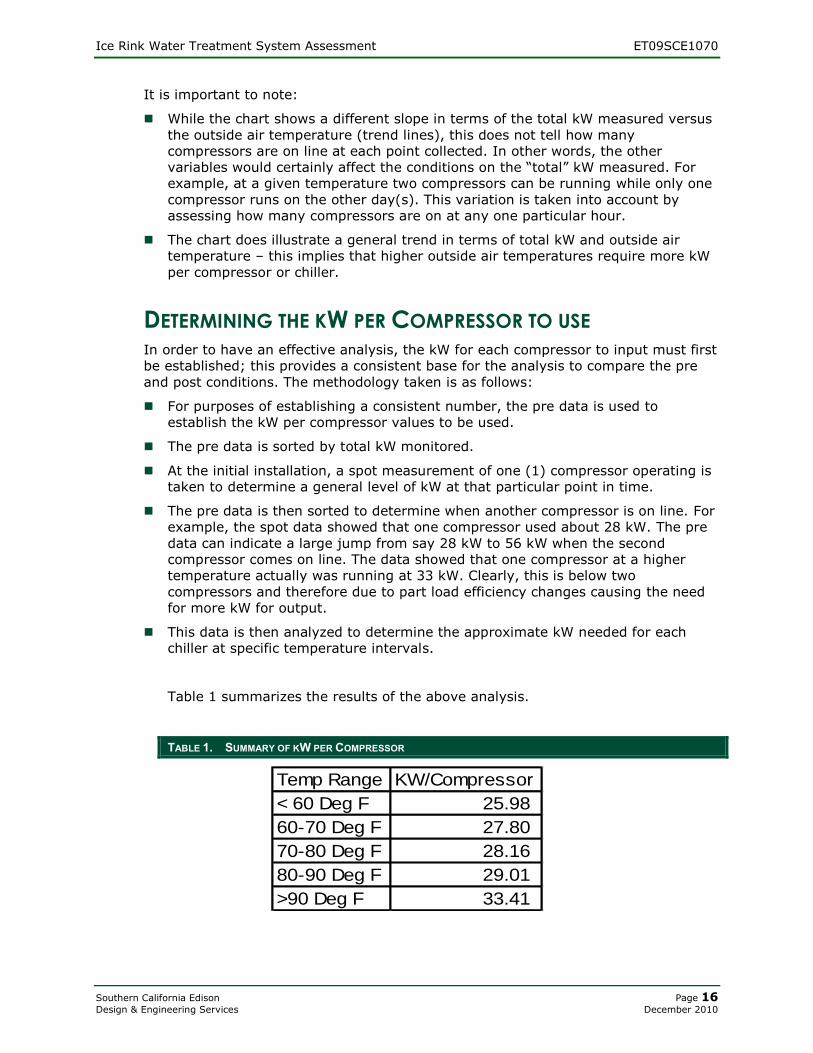
DETERMINING THE KW PER COMPRESSOR TO USE In order to have an effective analysis, the kW for each compressor to input must first
be established; this provides a consistent base for the analysis to compare the pre
and post conditions. The methodology taken is as follows:
For purposes of establishing a consistent number, the pre data is used to
establish the kW per compressor values to be used.
The pre data is sorted by total kW monitored.
At the initial installation, a spot measurement of one (1) compressor operating is
taken to determine a general level of kW at that particular point in time.
The pre data is then sorted to determine when another compressor is on line. For
example, the spot data showed that one compressor used about 28 kW. The pre
data can indicate a large jump from say 28 kW to 56 kW when the second
compressor comes on line. The data showed that one compressor at a higher
temperature actually was running at 33 kW. Clearly, this is below two
compressors and therefore due to part load efficiency changes causing the need
for more kW for output.
This data is then analyzed to determine the approximate kW needed for each
chiller at specific temperature intervals.
Table 1 summarizes the results of the above analysis.
TABLE 1. SUMMARY OF KW PER COMPRESSOR
Temp Range KW/Compressor
< 60 Deg F 25.98
60-70 Deg F 27.80
70-80 Deg F 28.16
80-90 Deg F 29.01
>90 Deg F 33.41
Ice Rink Water Treatment System Assessment ET09SCE1070
Southern California Edison Page 17
Design & Engineering Services December 2010
This is the relationship between outside air temperature and the overall kW per
compressor based on collected data used for analysis. This overall relationship takes
into account that the other variables are not measured. It should be noted that the
kW/compressor is the average over the range of temperatures indicated. This type of
analysis is known as BIN analysis where temperatures are grouped into “bins” of
specific temperature ranges and averaged for purposes of savings calculations. This
method is accepted in the energy field as appropriate for this type of application.
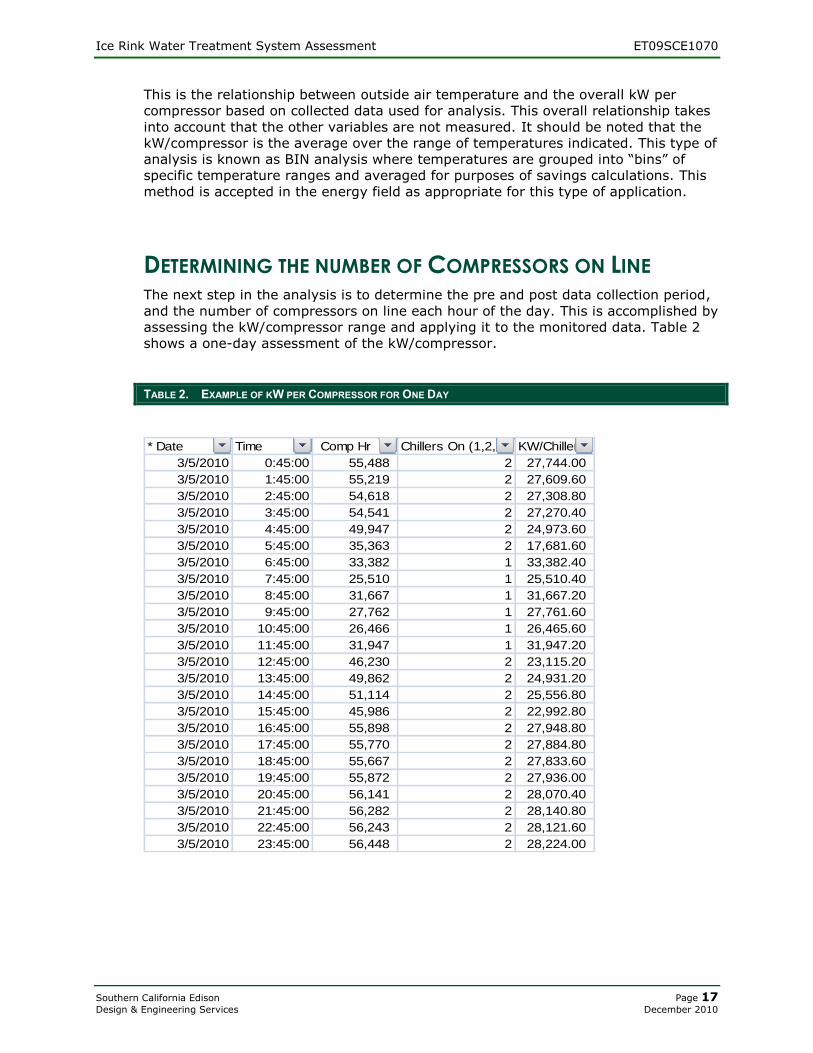
DETERMINING THE NUMBER OF COMPRESSORS ON LINE The next step in the analysis is to determine the pre and post data collection period,
and the number of compressors on line each hour of the day. This is accomplished by
assessing the kW/compressor range and applying it to the monitored data. Table 2
shows a one-day assessment of the kW/compressor.
TABLE 2. EXAMPLE OF KW PER COMPRESSOR FOR ONE DAY
* Date Time Comp Hr Chillers On (1,2,3) KW/Chiller
3/5/2010 0:45:00 55,488 2 27,744.00
3/5/2010 1:45:00 55,219 2 27,609.60
3/5/2010 2:45:00 54,618 2 27,308.80
3/5/2010 3:45:00 54,541 2 27,270.40
3/5/2010 4:45:00 49,947 2 24,973.60
3/5/2010 5:45:00 35,363 2 17,681.60
3/5/2010 6:45:00 33,382 1 33,382.40
3/5/2010 7:45:00 25,510 1 25,510.40
3/5/2010 8:45:00 31,667 1 31,667.20
3/5/2010 9:45:00 27,762 1 27,761.60
3/5/2010 10:45:00 26,466 1 26,465.60
3/5/2010 11:45:00 31,947 1 31,947.20
3/5/2010 12:45:00 46,230 2 23,115.20
3/5/2010 13:45:00 49,862 2 24,931.20
3/5/2010 14:45:00 51,114 2 25,556.80
3/5/2010 15:45:00 45,986 2 22,992.80
3/5/2010 16:45:00 55,898 2 27,948.80
3/5/2010 17:45:00 55,770 2 27,884.80
3/5/2010 18:45:00 55,667 2 27,833.60
3/5/2010 19:45:00 55,872 2 27,936.00
3/5/2010 20:45:00 56,141 2 28,070.40
3/5/2010 21:45:00 56,282 2 28,140.80
3/5/2010 22:45:00 56,243 2 28,121.60
3/5/2010 23:45:00 56,448 2 28,224.00
Ice Rink Water Treatment System Assessment ET09SCE1070
Southern California Edison Page 18
Design & Engineering Services December 2010
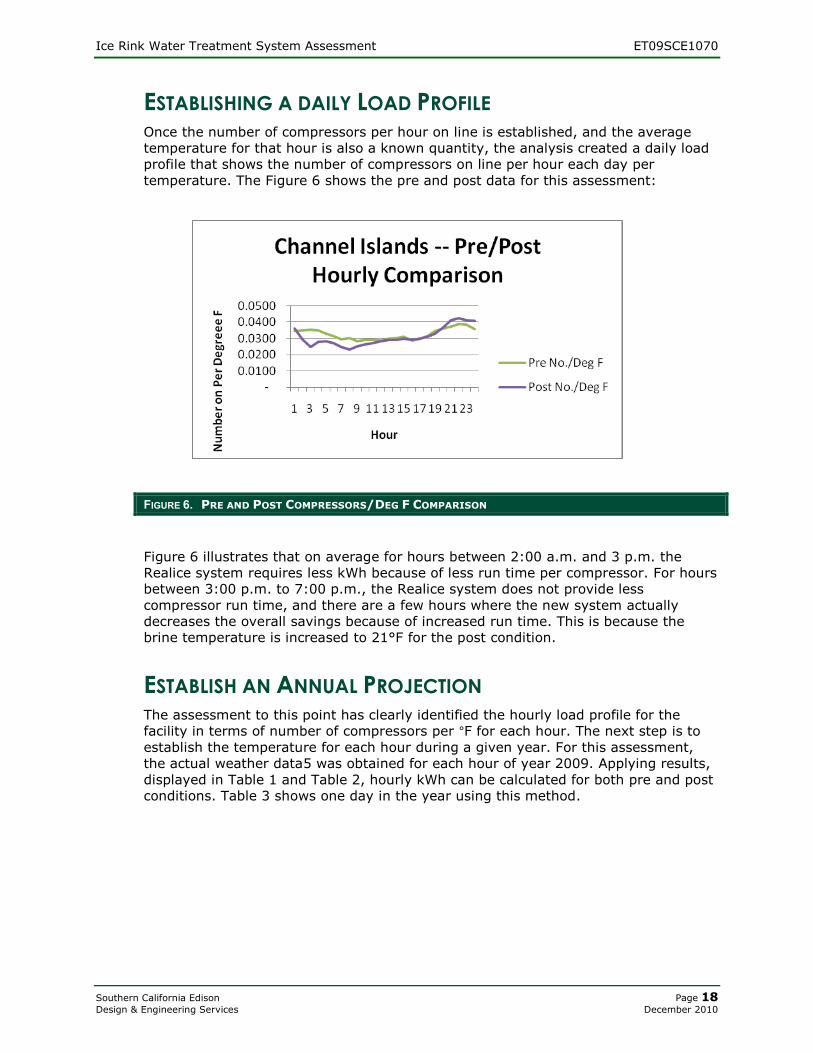
ESTABLISHING A DAILY LOAD PROFILE Once the number of compressors per hour on line is established, and the average
temperature for that hour is also a known quantity, the analysis created a daily load
profile that shows the number of compressors on line per hour each day per
temperature. The Figure 6 shows the pre and post data for this assessment:
FIGURE 6. PRE AND POST COMPRESSORS/DEG F COMPARISON
Figure 6 illustrates that on average for hours between 2:00 a.m. and 3 p.m. the
Realice system requires less kWh because of less run time per compressor. For hours
between 3:00 p.m. to 7:00 p.m., the Realice system does not provide less
compressor run time, and there are a few hours where the new system actually
decreases the overall savings because of increased run time. This is because the
brine temperature is increased to 21°F for the post condition.
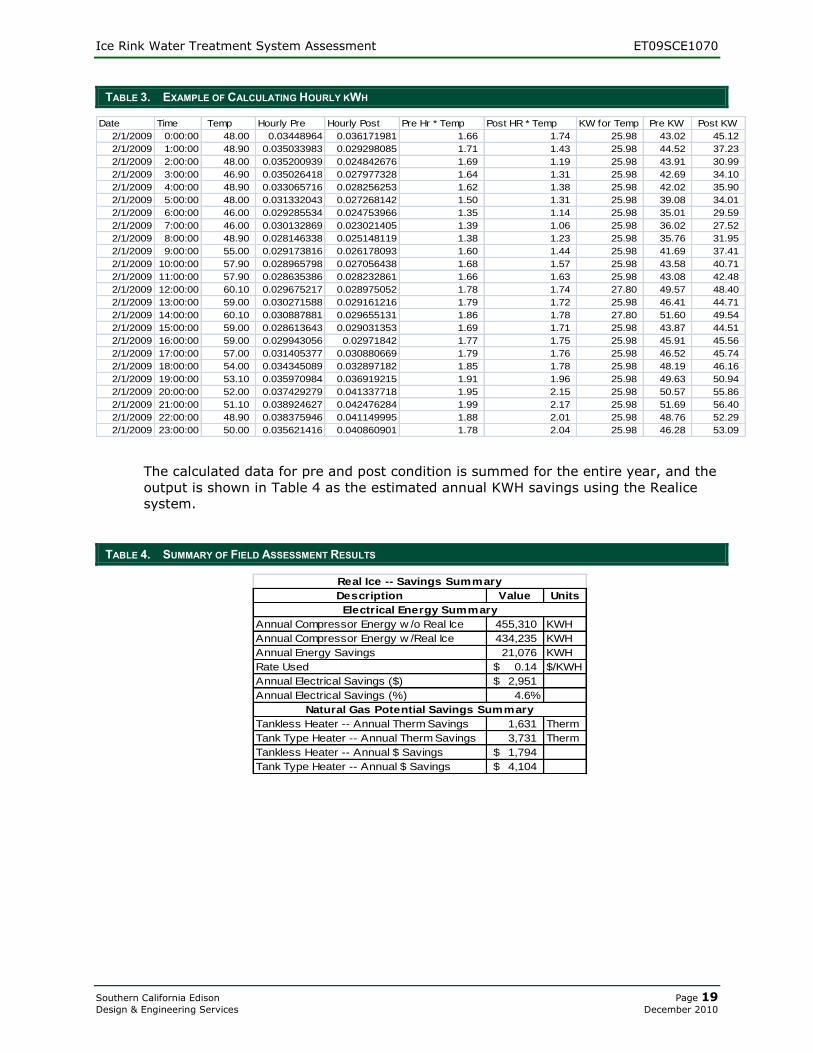
ESTABLISH AN ANNUAL PROJECTION The assessment to this point has clearly identified the hourly load profile for the
facility in terms of number of compressors per °F for each hour. The next step is to
establish the temperature for each hour during a given year. For this assessment,
the actual weather data5 was obtained for each hour of year 2009. Applying results,
displayed in Table 1 and Table 2, hourly kWh can be calculated for both pre and post
conditions. Table 3 shows one day in the year using this method.
Ice Rink Water Treatment System Assessment ET09SCE1070
Southern California Edison Page 19
Design & Engineering Services December 2010
TABLE 3. EXAMPLE OF CALCULATING HOURLY KWH
Date Time Temp Hourly Pre Hourly Post Pre Hr * Temp Post HR * Temp KW for Temp Pre KW Post KW
2/1/2009 0:00:00 48.00 0.03448964 0.036171981 1.66 1.74 25.98 43.02 45.12
2/1/2009 1:00:00 48.90 0.035033983 0.029298085 1.71 1.43 25.98 44.52 37.23
2/1/2009 2:00:00 48.00 0.035200939 0.024842676 1.69 1.19 25.98 43.91 30.99
2/1/2009 3:00:00 46.90 0.035026418 0.027977328 1.64 1.31 25.98 42.69 34.10
2/1/2009 4:00:00 48.90 0.033065716 0.028256253 1.62 1.38 25.98 42.02 35.90
2/1/2009 5:00:00 48.00 0.031332043 0.027268142 1.50 1.31 25.98 39.08 34.01
2/1/2009 6:00:00 46.00 0.029285534 0.024753966 1.35 1.14 25.98 35.01 29.59
2/1/2009 7:00:00 46.00 0.030132869 0.023021405 1.39 1.06 25.98 36.02 27.52
2/1/2009 8:00:00 48.90 0.028146338 0.025148119 1.38 1.23 25.98 35.76 31.95
2/1/2009 9:00:00 55.00 0.029173816 0.026178093 1.60 1.44 25.98 41.69 37.41
2/1/2009 10:00:00 57.90 0.028965798 0.027056438 1.68 1.57 25.98 43.58 40.71
2/1/2009 11:00:00 57.90 0.028635386 0.028232861 1.66 1.63 25.98 43.08 42.48
2/1/2009 12:00:00 60.10 0.029675217 0.028975052 1.78 1.74 27.80 49.57 48.40
2/1/2009 13:00:00 59.00 0.030271588 0.029161216 1.79 1.72 25.98 46.41 44.71
2/1/2009 14:00:00 60.10 0.030887881 0.029655131 1.86 1.78 27.80 51.60 49.54
2/1/2009 15:00:00 59.00 0.028613643 0.029031353 1.69 1.71 25.98 43.87 44.51
2/1/2009 16:00:00 59.00 0.029943056 0.02971842 1.77 1.75 25.98 45.91 45.56
2/1/2009 17:00:00 57.00 0.031405377 0.030880669 1.79 1.76 25.98 46.52 45.74
2/1/2009 18:00:00 54.00 0.034345089 0.032897182 1.85 1.78 25.98 48.19 46.16
2/1/2009 19:00:00 53.10 0.035970984 0.036919215 1.91 1.96 25.98 49.63 50.94
2/1/2009 20:00:00 52.00 0.037429279 0.041337718 1.95 2.15 25.98 50.57 55.86
2/1/2009 21:00:00 51.10 0.038924627 0.042476284 1.99 2.17 25.98 51.69 56.40
2/1/2009 22:00:00 48.90 0.038375946 0.041149995 1.88 2.01 25.98 48.76 52.29
2/1/2009 23:00:00 50.00 0.035621416 0.040860901 1.78 2.04 25.98 46.28 53.09
The calculated data for pre and post condition is summed for the entire year, and the
output is shown in Table 4 as the estimated annual KWH savings using the Realice
system.
TABLE 4. SUMMARY OF FIELD ASSESSMENT RESULTS
Description Value Units
Annual Compressor Energy w /o Real Ice 455,310 KWH
Annual Compressor Energy w /Real Ice 434,235 KWH
Annual Energy Savings 21,076 KWH
Rate Used 0.14$ $/KWH
Annual Electrical Savings ($) 2,951$
Annual Electrical Savings (%) 4.6%
Tankless Heater -- Annual Therm Savings 1,631 Therm
Tank Type Heater -- Annual Therm Savings 3,731 Therm
Tankless Heater -- Annual $ Savings 1,794$
Tank Type Heater -- Annual $ Savings 4,104$
Electrical Energy Summary
Natural Gas Potential Savings Summary
Real Ice -- Savings Summary
Ice Rink Water Treatment System Assessment ET09SCE1070
Southern California Edison Page 20
Design & Engineering Services December 2010
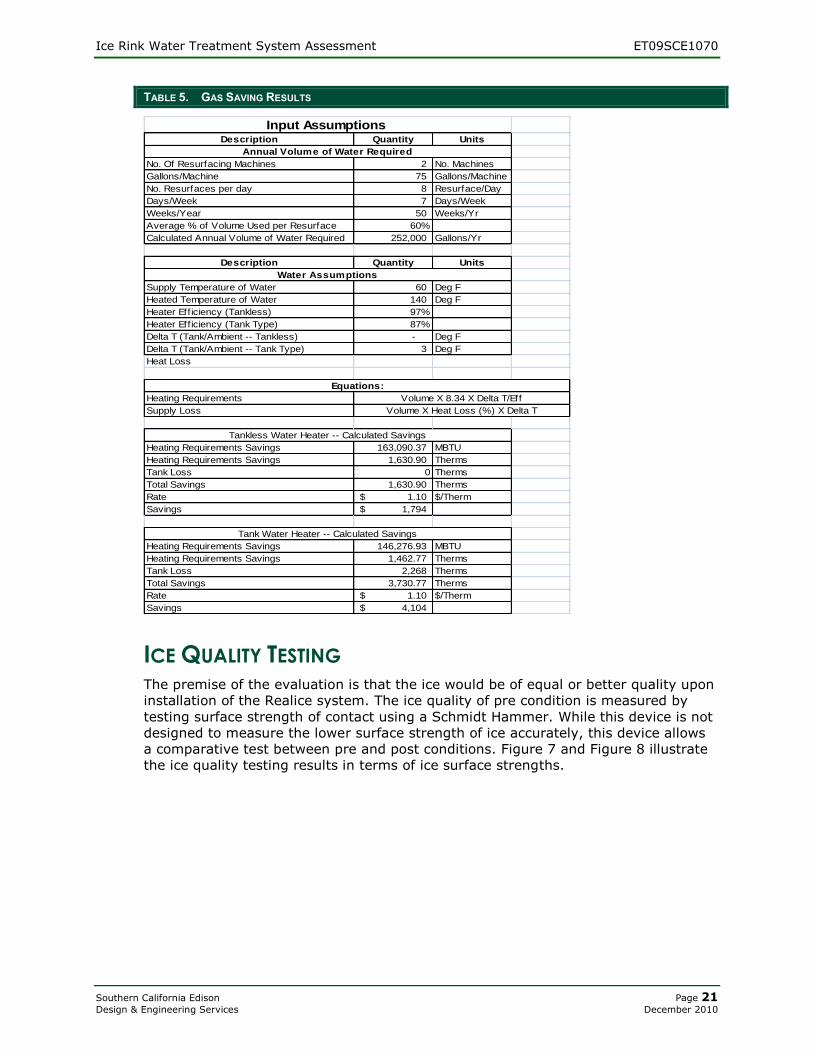
GAS ENERGY SAVINGS The gas energy savings (i.e., using ambient temperature water instead of heated
water) is based upon the following conditions:
Two resurfacing machines (Zamboni)
Each resurfacing machine holds 75 gallons of hot water
The rinks are resurfaced eight times per day, on average
The rinks are resurfaced 7 days per week
The resurfacing is completed for 50 weeks a year (2 weeks downtime per rink).
The machines use 60% of the holding capacity on average for each resurface.
The remaining 40% is either used for the next resurfacing or discharged
The supply temperature in Oxnard is 60°F.
The needed hot water temperature is 140°F
The heater efficiency is 87% if a tank type is used and 97% if a tankless heater is
used.
Tank losses are assumed to be based on a 3°F temperature change between the
tank and the ambient air temperature
The rate is assumed to be $1.10 per therm.
Using the tankless water heart, approximately, 1,630 Therms of gas energy can be
saved, see Table 5.
Ice Rink Water Treatment System Assessment ET09SCE1070
Southern California Edison Page 21
Design & Engineering Services December 2010
TABLE 5. GAS SAVING RESULTS
Description Quantity Units
No. Of Resurfacing Machines 2 No. Machines
Gallons/Machine 75 Gallons/Machine
No. Resurfaces per day 8 Resurface/Day
Days/Week 7 Days/Week
Weeks/Year 50 Weeks/Yr
Average % of Volume Used per Resurface 60%
Calculated Annual Volume of Water Required 252,000 Gallons/Yr
Description Quantity Units
Supply Temperature of Water 60 Deg F
Heated Temperature of Water 140 Deg F
Heater Eff iciency (Tankless) 97%
Heater Eff iciency (Tank Type) 87%
Delta T (Tank/Ambient -- Tankless) - Deg F
Delta T (Tank/Ambient -- Tank Type) 3 Deg F
Heat Loss
Heating Requirements
Supply Loss
Heating Requirements Savings 163,090.37 MBTU
Heating Requirements Savings 1,630.90 Therms
Tank Loss 0 Therms
Total Savings 1,630.90 Therms
Rate 1.10$ $/Therm
Savings 1,794$
Heating Requirements Savings 146,276.93 MBTU
Heating Requirements Savings 1,462.77 Therms
Tank Loss 2,268 Therms
Total Savings 3,730.77 Therms
Rate 1.10$ $/Therm
Savings 4,104$
Tankless Water Heater -- Calculated Savings
Tank Water Heater -- Calculated Savings
Input Assumptions
Annual Volume of Water Required
Water Assumptions
Volume X 8.34 X Delta T/Eff
Volume X Heat Loss (%) X Delta T
Equations:
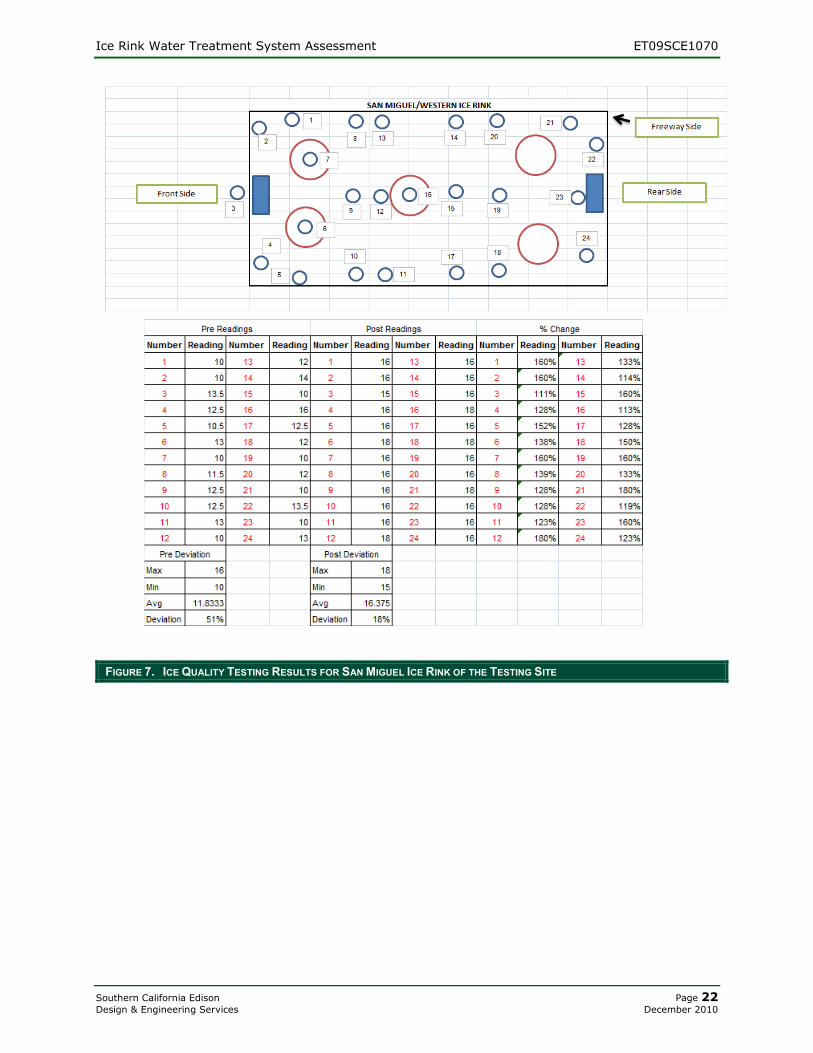
ICE QUALITY TESTING The premise of the evaluation is that the ice would be of equal or better quality upon
installation of the Realice system. The ice quality of pre condition is measured by
testing surface strength of contact using a Schmidt Hammer. While this device is not
designed to measure the lower surface strength of ice accurately, this device allows
a comparative test between pre and post conditions. Figure 7 and Figure 8 illustrate
the ice quality testing results in terms of ice surface strengths.
Ice Rink Water Treatment System Assessment ET09SCE1070
Southern California Edison Page 22
Design & Engineering Services December 2010
FIGURE 7. ICE QUALITY TESTING RESULTS FOR SAN MIGUEL ICE RINK OF THE TESTING SITE
Ice Rink Water Treatment System Assessment ET09SCE1070
Southern California Edison Page 23
Design & Engineering Services December 2010
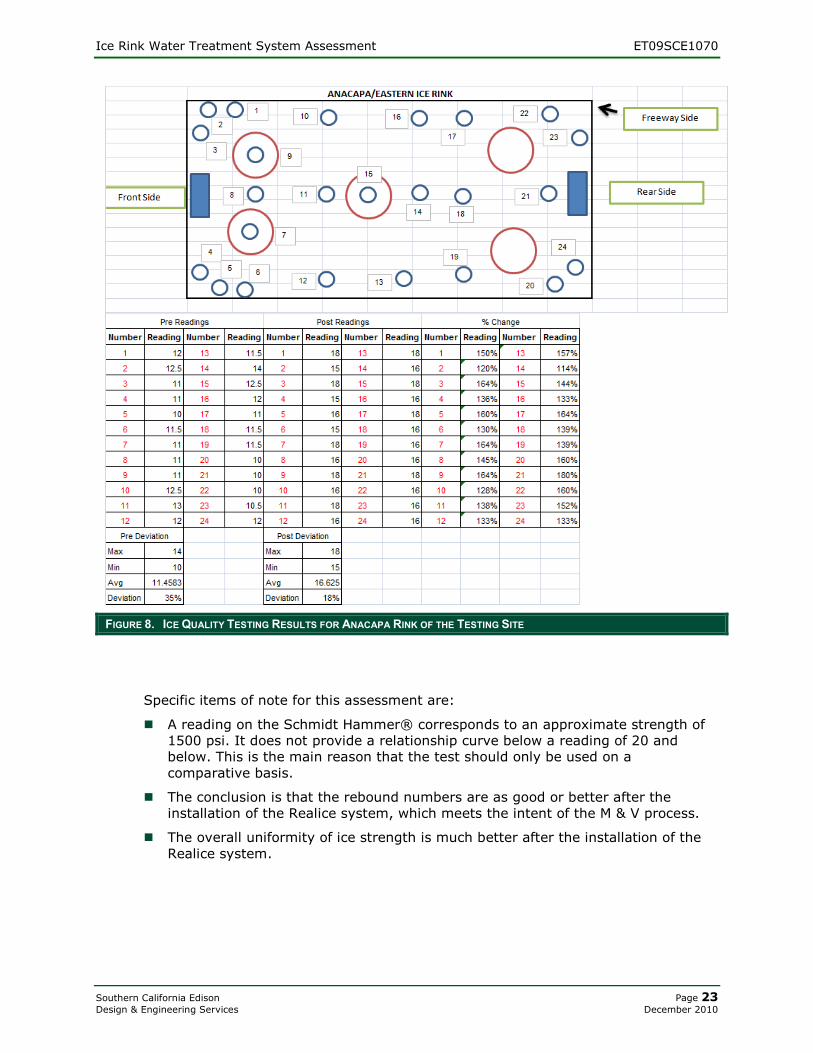
FIGURE 8. ICE QUALITY TESTING RESULTS FOR ANACAPA RINK OF THE TESTING SITE
Specific items of note for this assessment are:
A reading on the Schmidt Hammer® corresponds to an approximate strength of
1500 psi. It does not provide a relationship curve below a reading of 20 and
below. This is the main reason that the test should only be used on a
comparative basis.
The conclusion is that the rebound numbers are as good or better after the
installation of the Realice system, which meets the intent of the M & V process.
The overall uniformity of ice strength is much better after the installation of the
Realice system.

Ice Rink Water Treatment System Assessment ET09SCE1070
Southern California Edison Page 24
Design & Engineering Services December 2010
EVALUATIONS The field assessment demonstrated that it is feasible to save energy by treating water (e.g.,
removing resolved air) which allows the water to be frozen at a higher temperature. Overall,
the estimated energy saving is 4.6% or 21,076 kWh for the testing site. To take a full
advantage of increased brine temperature of 2 °F, the ice rink needs to have automated
compressor controls. The advanced automated controller can provide consistent ice
conditions and can controlled the compressor time in a way that the compressor can run
harder during the off peak periods.
In addition to the electrical energy savings, there are also gas energy savings. This occurs
in cases where the Realice system allows the rink to use ambient temperature domestic
water for resurfacing. Lastly, there also seems to be an increase in the quality of ice (or
increase ice surface strength) produced.
Currently, the Realice system is new to the U.S. customers. Like any new products, it needs
“early adaptors.6” in order to transform the market. The early adaptors will face financial
barriers. The first barrier is the equipment cost (approximately $29,000 per system). The
second barrier is coming from the implementation phase. The implementation of this system
requires closing the ice rink for anywhere between a few days to two weeks, in order to
remove the existing ice. The new ice then needs to be created in several layers. Therefore,
the installation of this device can provide significant financial and operational impacts to the
customer.
Ice Rink Water Treatment System Assessment ET09SCE1070
Southern California Edison Page 25
Design & Engineering Services December 2010
RECOMMENDATIONS
The field assessment demonstrated the feasibility of energy savings through the use of this
technology. However, the accurate measurement and attribution of energy savings were
challenging due to the number of variables involved in this assessment. Further testing,
both field and lab are highly recommended in order to establish better energy savings
estimates:
More field tests should be conducted and the flow rate of refrigerant and additional
brine temperature monitoring of compressor systems (e.g., refrigerant temperature
before and after the condenser)
Historical (one year) customer billing data, showing the customer’s electricity
consumptions at the facility level, will allow a better comparison for pre and post
treatment energy usage, which can give an indication of energy savings.
A laboratory test can be conducted to compare the freezing temperature, freezing time,
and the hardness of ice of Realice water and tap water from the facility.
Because the device appears to reduce contaminants and reduce air within the water stream,
there is a potential for the Realice system to be applied to other applications such as
preventing hard water scales build up from water heaters, dishwasher, cloth washer,
various water pipelines that could yield energy savings by reducing flow resistance.
Ice Rink Water Treatment System Assessment ET09SCE1070
Southern California Edison Page 26
Design & Engineering Services December 2010
REFERENCES
i ASHRAE, 2006 ASHRAE Handbook—Refrigeration, p. 35.10
2 HowStuffWorks.com – Ice Rinks
3 id, p. 35.10
4 A “pre-condition” word is be used interchangeably thought out the document
5 Weather Underground data www.weatherunderground.com, 2009 Oxnard Airport
6 A group in the “diffusion” business model. Diffusion is the process by which a new idea or new product is accepted by the market