Embed Size (px)
Citation preview
S. Kmenta 1/22/2002 1 of 32
Scenario-based FMEAUsing Expected Cost
A New Perspective onEvaluating Risk in FMEA
IIE WorkshopJanuary 22, 2002
Steven [email protected]
S. Kmenta 1/22/2002 2 of 32
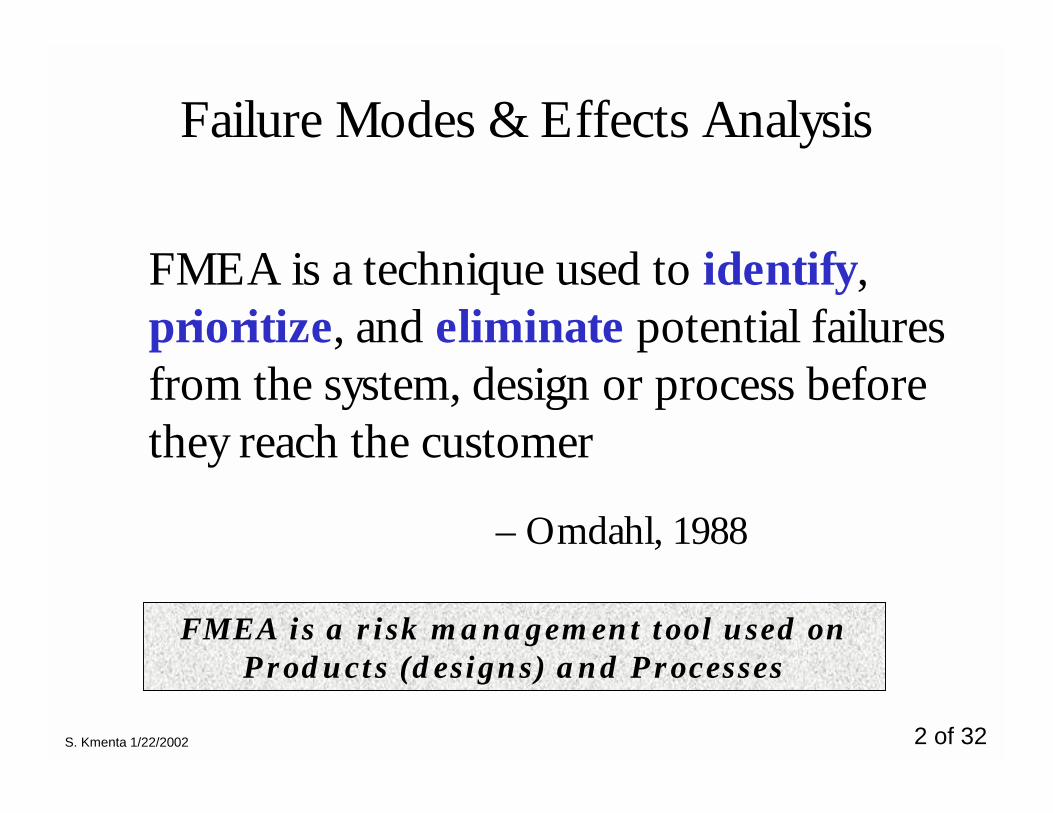
Failure Modes & Effects Analysis
FMEA is a technique used to identify,prioritize, and eliminate potential failuresfrom the system, design or process beforethey reach the customer
– Omdahl, 1988
FMEA is a risk management tool used onProducts (designs) and Processes
S. Kmenta 1/22/2002 3 of 32
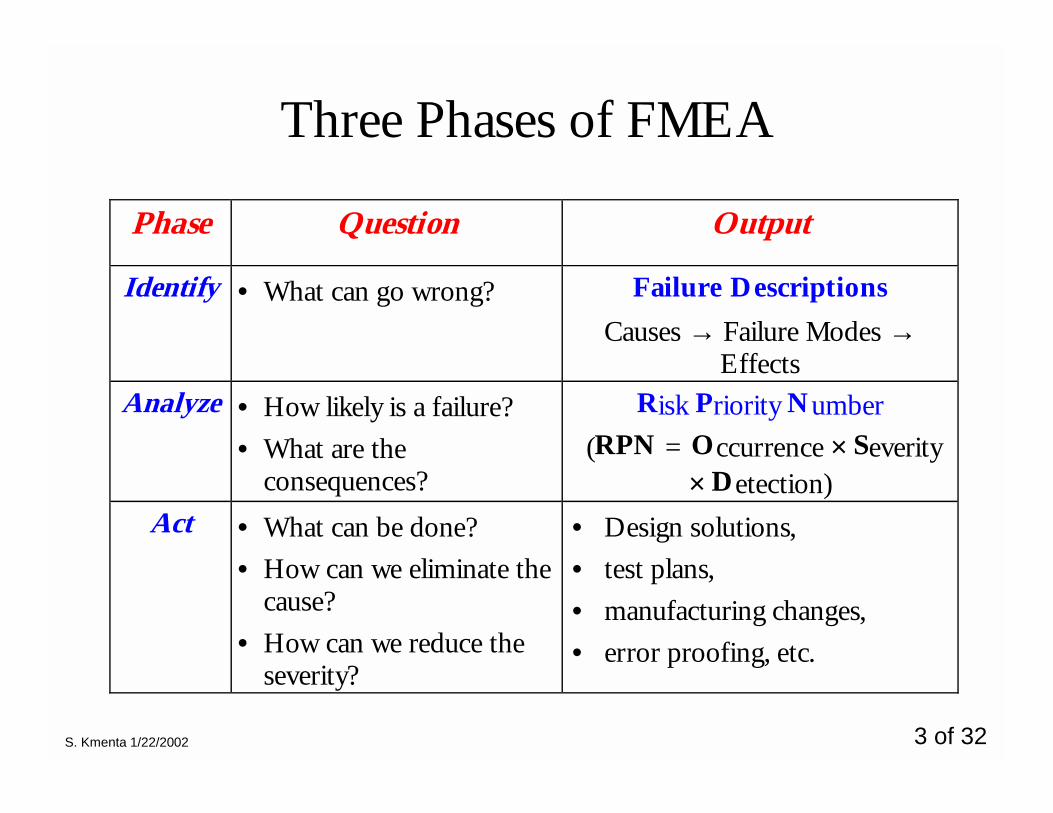
Three Phases of FMEA
Phase Question Output
Identify • What can go wrong? Failure DescriptionsCauses → Failure Modes →
EffectsAnalyze • How likely is a failure?
• What are theconsequences?
Risk Priority Number (RPN = Occurrence × Severity
× Detection)Act • What can be done?
• How can we eliminate thecause?
• How can we reduce theseverity?
• Design solutions,• test plans,• manufacturing changes,• error proofing, etc.
S. Kmenta 1/22/2002 4 of 32
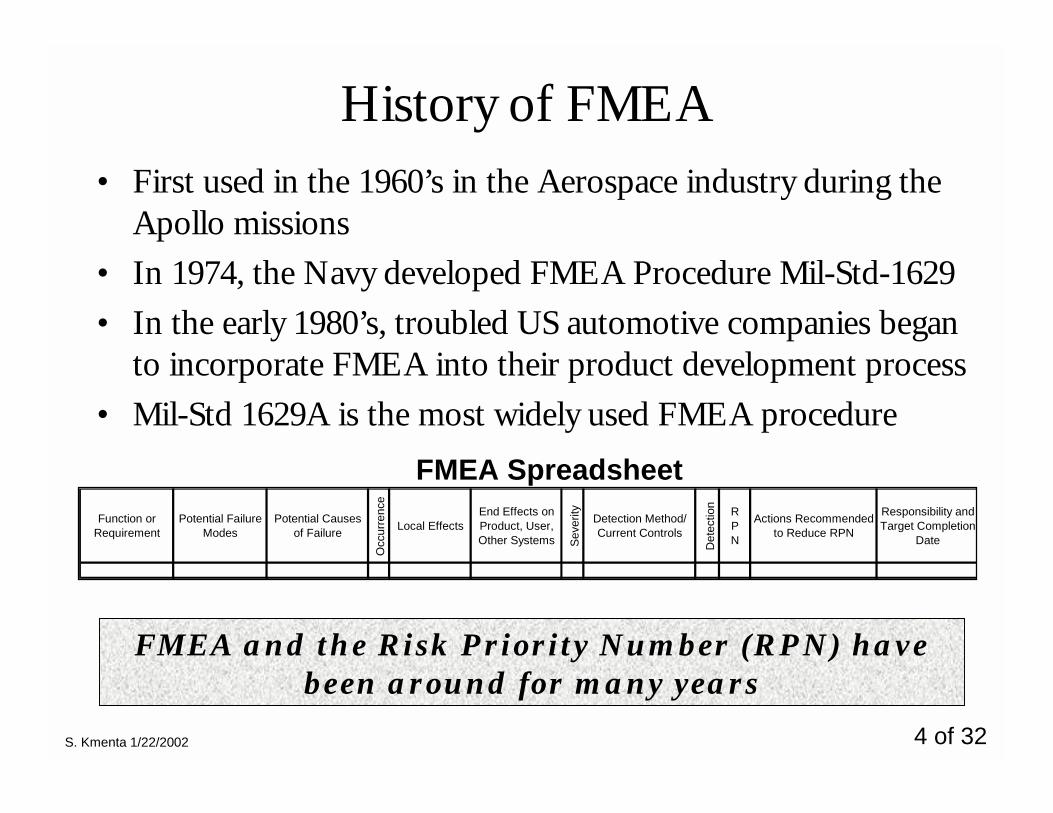
History of FMEA• First used in the 1960’s in the Aerospace industry during the
Apollo missions• In 1974, the Navy developed FMEA Procedure Mil-Std-1629• In the early 1980’s, troubled US automotive companies began
to incorporate FMEA into their product development process• Mil-Std 1629A is the most widely used FMEA procedure
FMEA and the Risk Priority Number (RPN) havebeen around for many years
Function or Requirement
Potential Failure Modes
Potential Causes of Failure
Occ
urre
nce
Local EffectsEnd Effects on Product, User, Other Systems Se
verit
y
Detection Method/ Current Controls
Det
ectio
n RPN
Actions Recommended to Reduce RPN
Responsibility and Target Completion
Date
FMEA Spreadsheet
S. Kmenta 1/22/2002 5 of 32
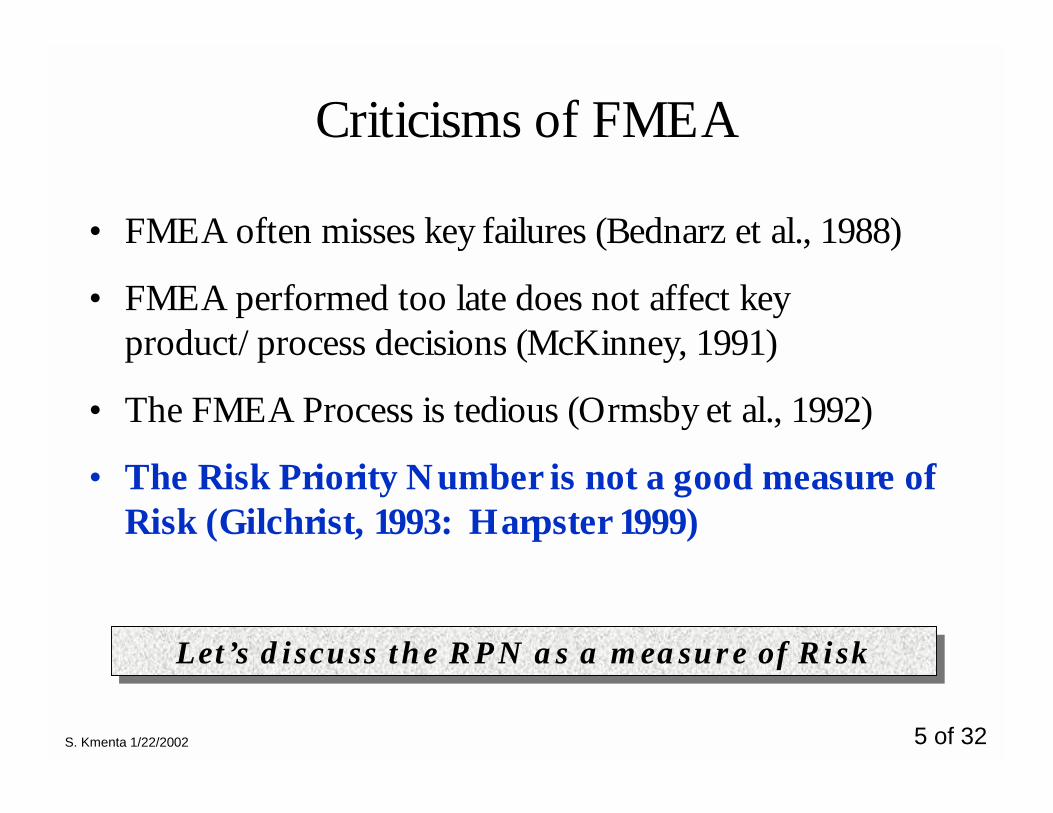
Criticisms of FMEA
• FMEA often misses key failures (Bednarz et al., 1988)
• FMEA performed too late does not affect keyproduct/process decisions (McKinney, 1991)
• The FMEA Process is tedious (Ormsby et al., 1992)
• The Risk Priority Number is not a good measure ofRisk (Gilchrist, 1993: Harpster 1999)
Let’s discuss the RPN as a measure of RiskLet’s discuss the RPN as a measure of Risk
S. Kmenta 1/22/2002 6 of 32
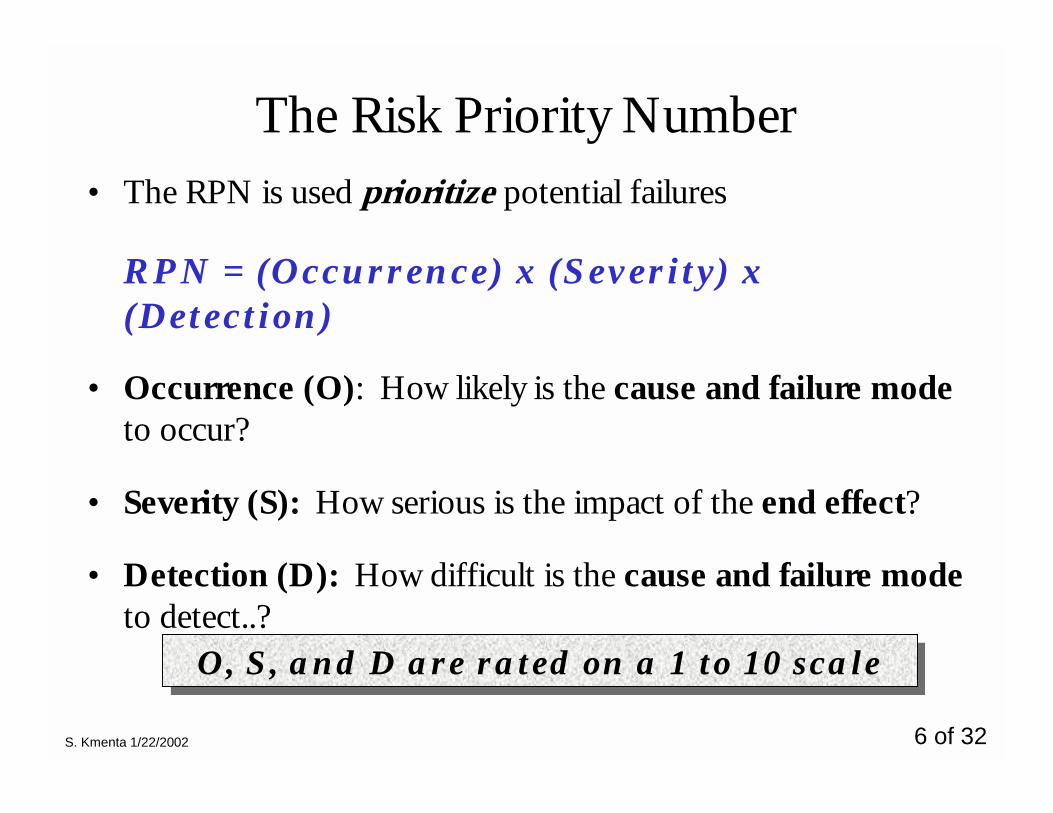
The Risk Priority Number• The RPN is used prioritize potential failures
RPN = (Occurrence) x (Severity) x(Detection)
• Occurrence (O): How likely is the cause and failure modeto occur?
• Severity (S): How serious is the impact of the end effect?
• Detection (D): How difficult is the cause and failure modeto detect..?
O, S, and D are rated on a 1 to 10 scaleO, S, and D are rated on a 1 to 10 scale
S. Kmenta 1/22/2002 7 of 32
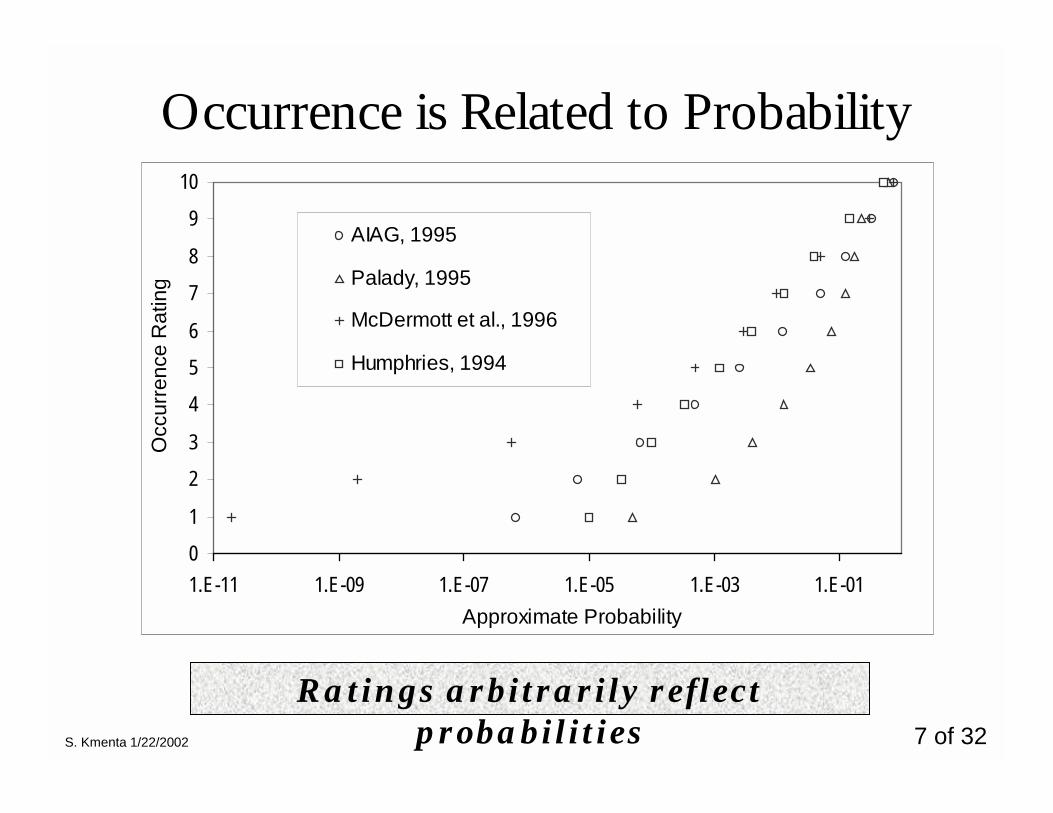
Occurrence is Related to Probability
0
1
2
3
4
5
6
7
8
9
10
1.E-11 1.E-09 1.E-07 1.E-05 1.E-03 1.E-01
Approximate Probability
Occ
urre
nce
Rat
ing
AIAG, 1995
Palady, 1995
McDermott et al., 1996
Humphries, 1994
Ratings arbitrarily reflectprobabilities
S. Kmenta 1/22/2002 8 of 32
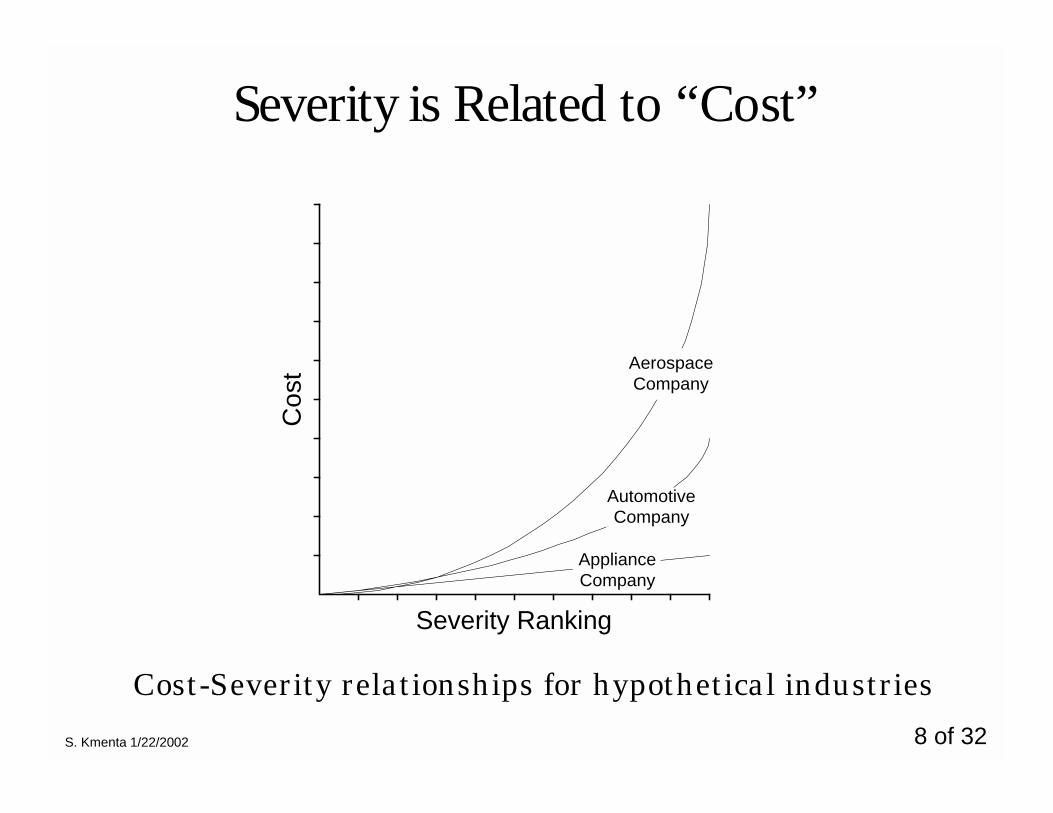
Severity is Related to “Cost”
Cost-Severity relationships for hypothetical industries
Cos
t
Severity Ranking
ApplianceCompany
AutomotiveCompany
AerospaceCompany
S. Kmenta 1/22/2002 9 of 32
Criticisms of Detection• “Detection” has many definitions
• Most definitions are confusing since they address:– design review process (an organizational issue)
– manufacturing inspection (a QC issue)
– the diagnosibility of a failure (a Severity issue)
• High cost (time), for low benefit
• Some standards ignore Detection (SAE J1739)
Our ultimate interest: How likely is the failure tooccur?
S. Kmenta 1/22/2002 10 of 32
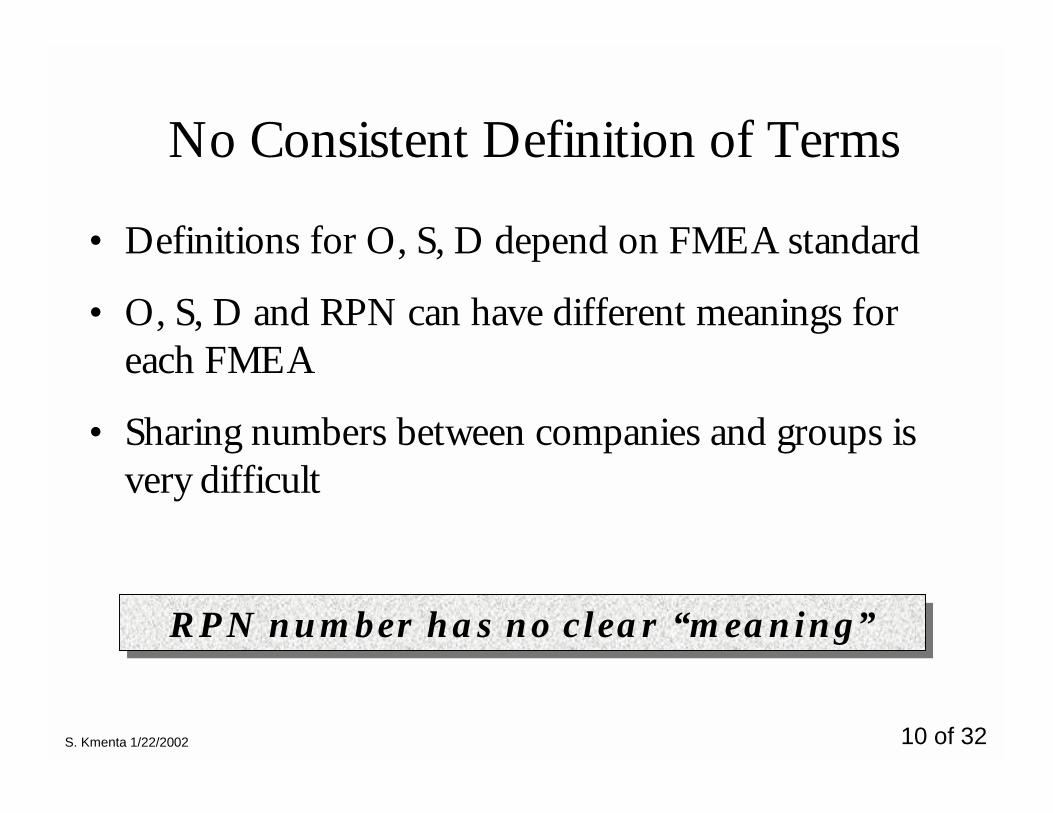
No Consistent Definition of Terms
• Definitions for O, S, D depend on FMEA standard
• O, S, D and RPN can have different meanings foreach FMEA
• Sharing numbers between companies and groups isvery difficult
RPN number has no clear “meaning”RPN number has no clear “meaning”
S. Kmenta 1/22/2002 11 of 32
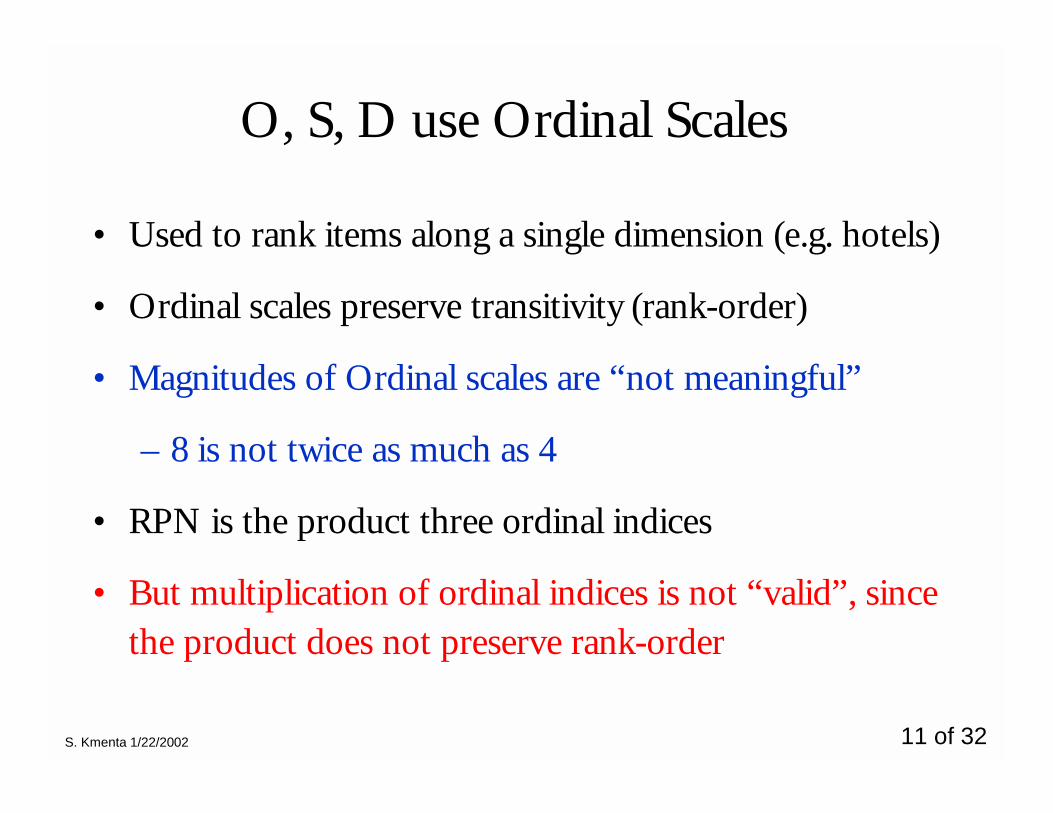
O, S, D use Ordinal Scales
• Used to rank items along a single dimension (e.g. hotels)
• Ordinal scales preserve transitivity (rank-order)
• Magnitudes of Ordinal scales are “not meaningful”
– 8 is not twice as much as 4
• RPN is the product three ordinal indices
• But multiplication of ordinal indices is not “valid”, sincethe product does not preserve rank-order
S. Kmenta 1/22/2002 12 of 32
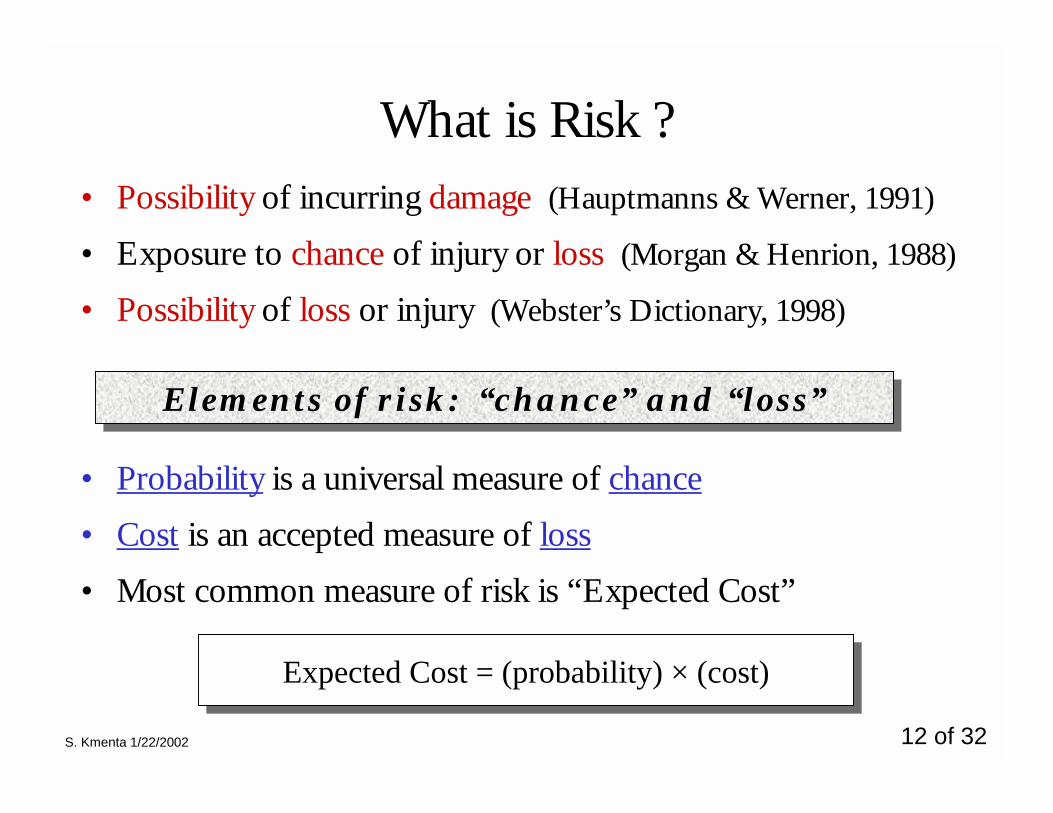
What is Risk ?• Possibility of incurring damage (Hauptmanns & Werner, 1991)
• Exposure to chance of injury or loss (Morgan & Henrion, 1988)
• Possibility of loss or injury (Webster’s Dictionary, 1998)
• Probability is a universal measure of chance
• Cost is an accepted measure of loss
• Most common measure of risk is “Expected Cost”
Elements of risk: “chance” and “loss”Elements of risk: “chance” and “loss”
Expected Cost = (probability) × (cost)Expected Cost = (probability) × (cost)
S. Kmenta 1/22/2002 13 of 32
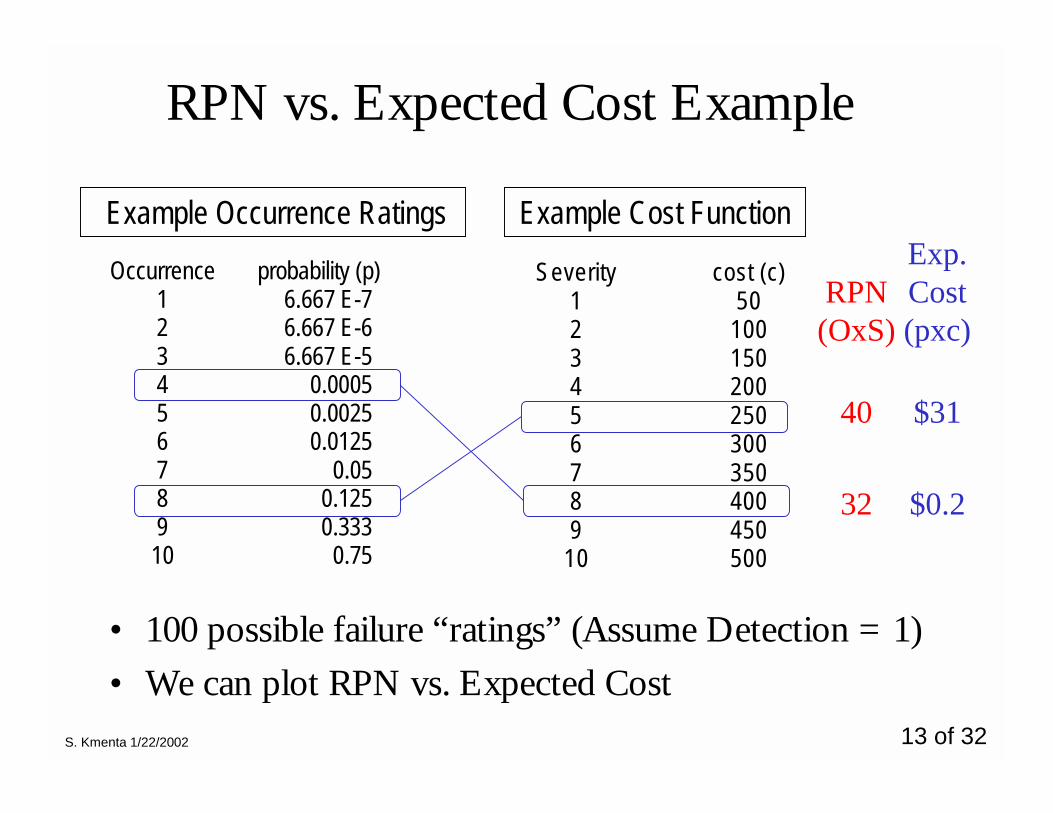
RPN vs. Expected Cost Example
• 100 possible failure “ratings” (Assume Detection = 1)• We can plot RPN vs. Expected Cost
Example Cost Function Example Occurrence Ratings
Severity cost (c)1 502 1003 1504 2005 2506 3007 3508 4009 450
10 500
Occurrence probability (p)1 6.667 E-72 6.667 E-63 6.667 E-54 0.00055 0.00256 0.01257 0.058 0.1259 0.33310 0.75
RPN(OxS)
Exp.Cost(pxc)
40 $31
32 $0.2
S. Kmenta 1/22/2002 14 of 32
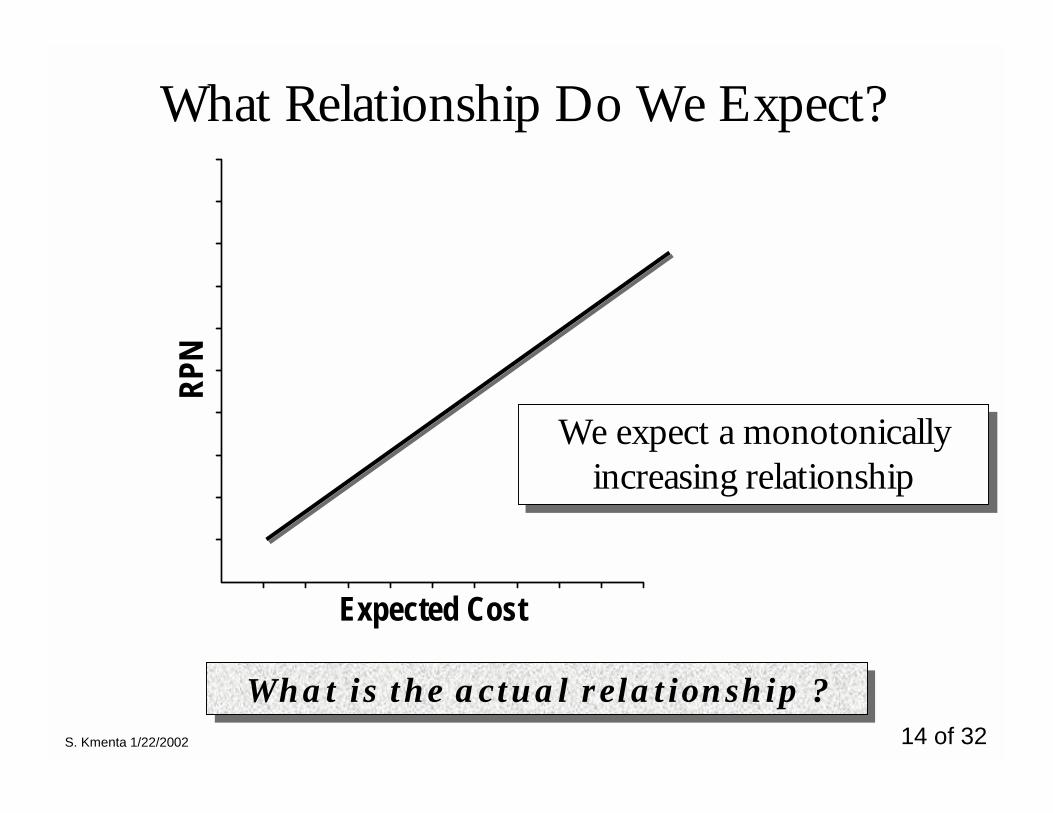
What Relationship Do We Expect?
What is the actual relationship ?What is the actual relationship ?
RPN
Expected Cost
We expect a monotonicallyincreasing relationship
We expect a monotonicallyincreasing relationship
S. Kmenta 1/22/2002 15 of 32
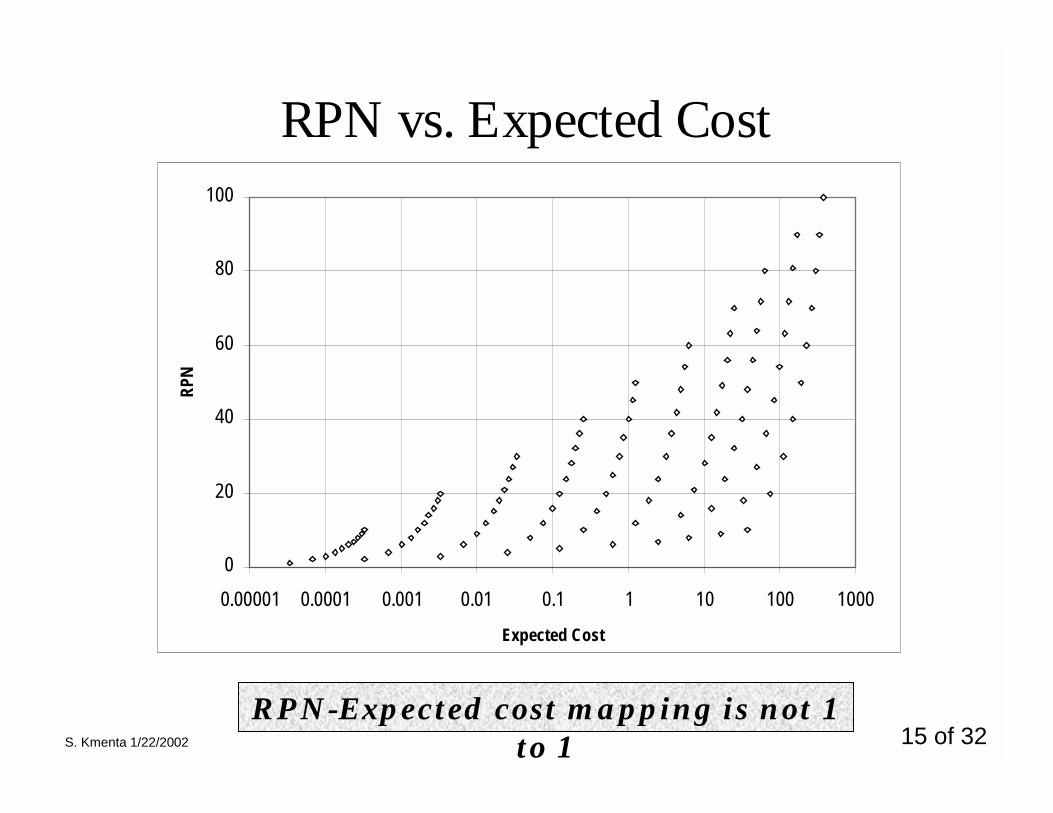
RPN vs. Expected Cost
0
20
40
60
80
100
0.00001 0.0001 0.001 0.01 0.1 1 10 100 1000
Expected Cost
RPN
RPN-Expected cost mapping is not 1to 1
S. Kmenta 1/22/2002 16 of 32
P ro b a b ili ty C o s t E x p e c te dc o s t
O c c u rre n c eR a n k , L
S e v e r ityR a n k , S
R P N *(O x S x D )
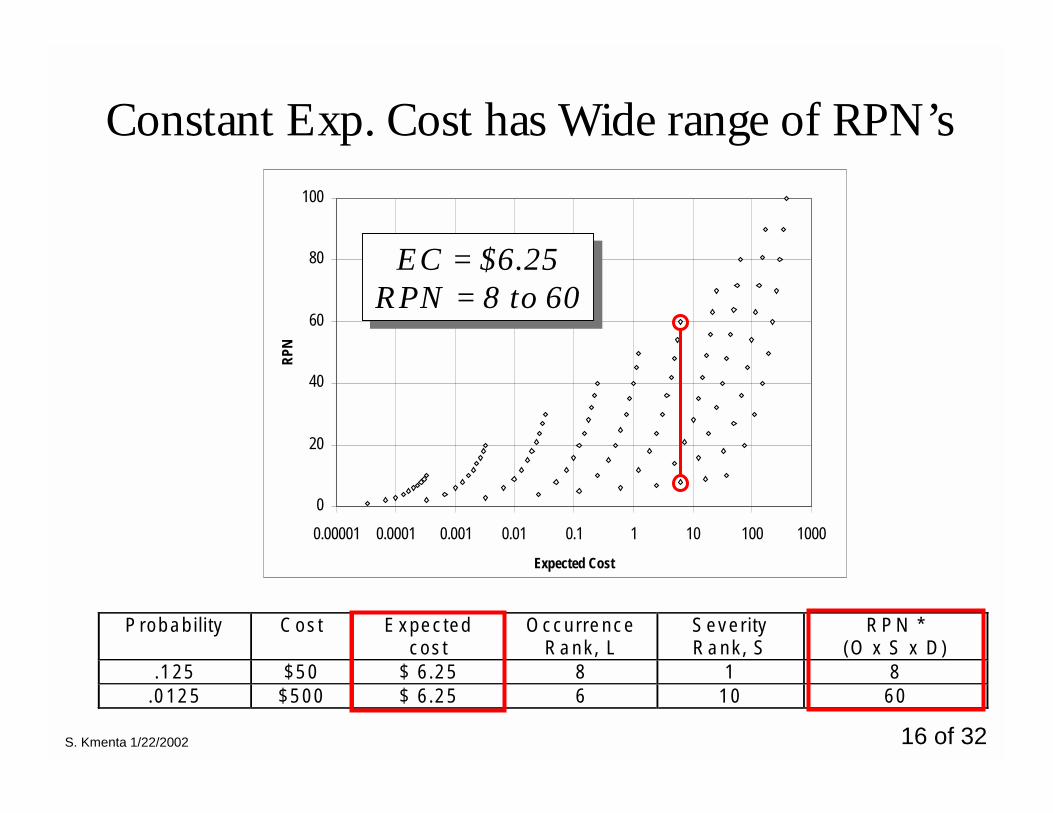
.1 2 5 $ 5 0 $ 6 .2 5 8 1 8.0 1 2 5 $ 5 0 0 $ 6 .2 5 6 1 0 6 0
Constant Exp. Cost has Wide range of RPN’s
0
20
40
60
80
100
0.00001 0.0001 0.001 0.01 0.1 1 10 100 1000
Expected Cost
RPN
EC = $6.25RPN = 8 to 60EC = $6.25
RPN = 8 to 60
S. Kmenta 1/22/2002 17 of 32
0
20
40
60
80
100
0.00001 0.0001 0.001 0.01 0.1 1 10 100 1000
Expected Cost
RPN
P rob ab ility C os t E xpec tedcos t
O ccu rre nceR a nk , L
S eve rityR a nk , S
R P N *(O x S x D )
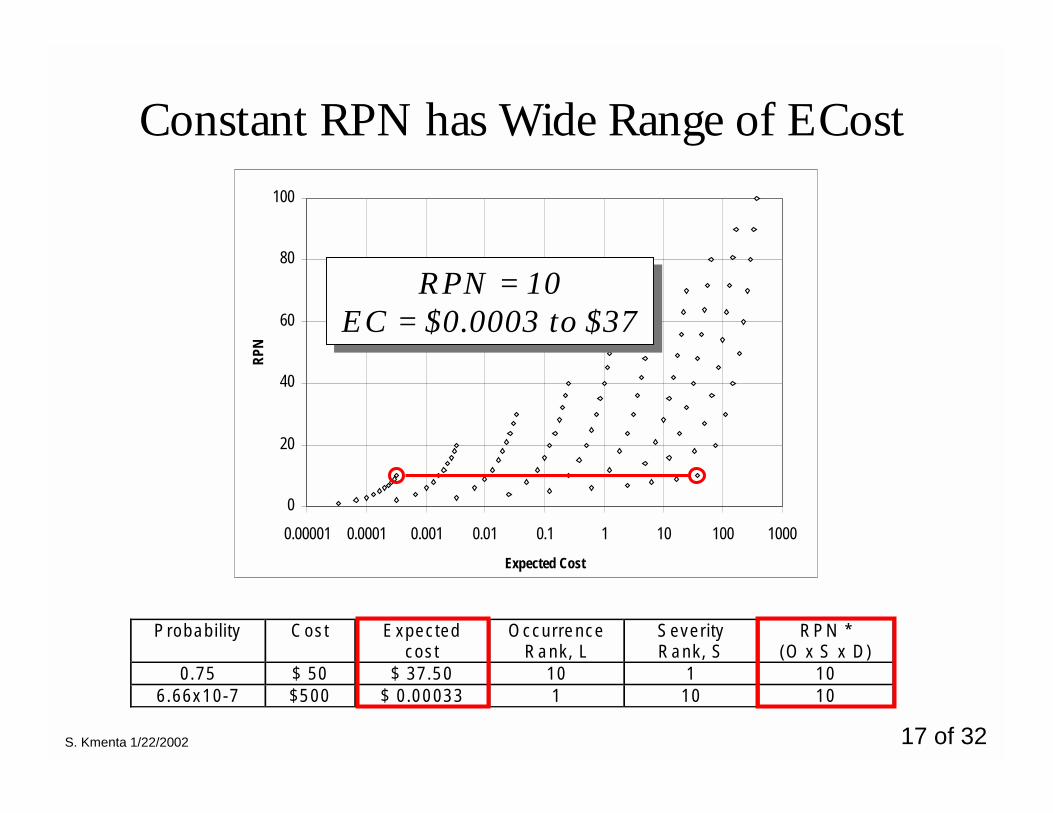
0 .75 $ 50 $ 37 .5 0 10 1 106 .66x 1 0 -7 $5 00 $ 0 .0 0 03 3 1 10 10
RPN = 10EC = $0.0003 to $37
RPN = 10EC = $0.0003 to $37
Constant RPN has Wide Range of ECost
S. Kmenta 1/22/2002 18 of 32
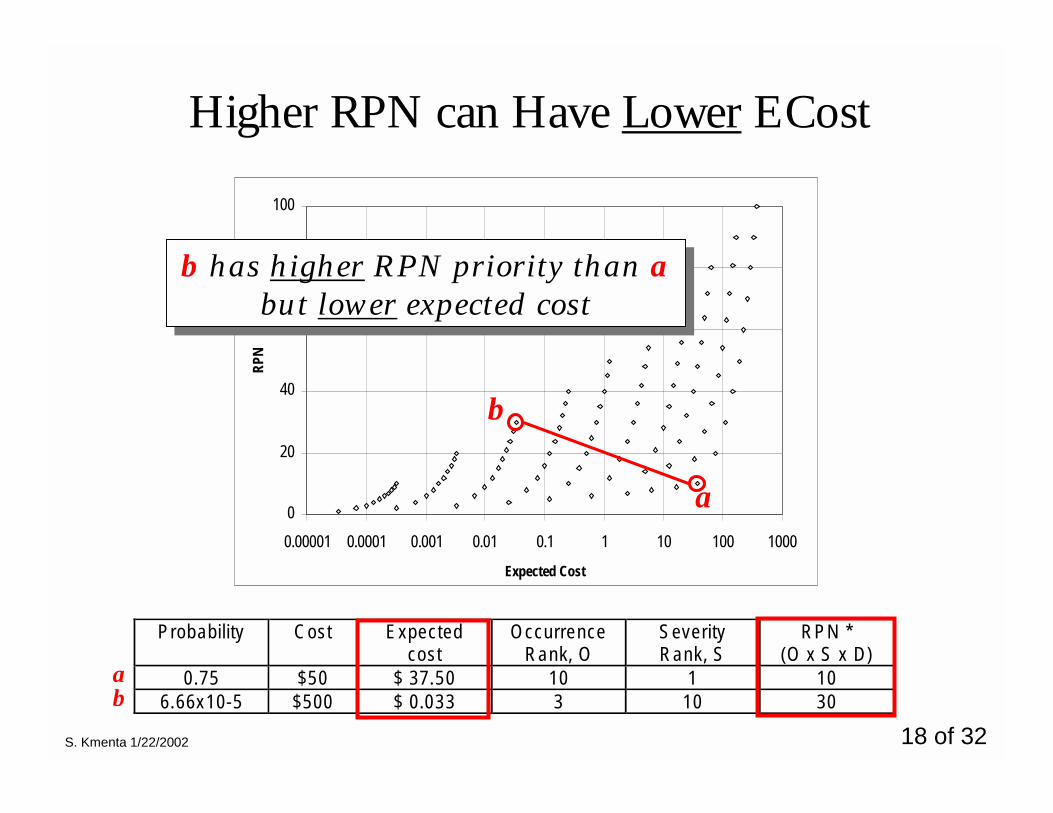
Probability Cost Expectedcost
OccurrenceRank, O
SeverityRank, S
RPN *(O x S x D)
0.75 $50 $ 37.50 10 1 106.66x10⁻⁵ $500 $ 0.033 3 10 30
a0
20
40
60
80
100
0.00001 0.0001 0.001 0.01 0.1 1 10 100 1000
Expected Cost
RPN
b
b has higher RPN priority than abut lower expected cost
b has higher RPN priority than abut lower expected cost
ab
Higher RPN can Have Lower ECost
S. Kmenta 1/22/2002 19 of 32
0
2
4
6
8
10
12
14
16
18
1 5 9 13 17 21 25 29 33 37 41 45 49 53 57 61 65
failures sorted by descending Ex pected Cost
Log(
Expe
cted
Cos
t)Ex
pect
ed C
ost
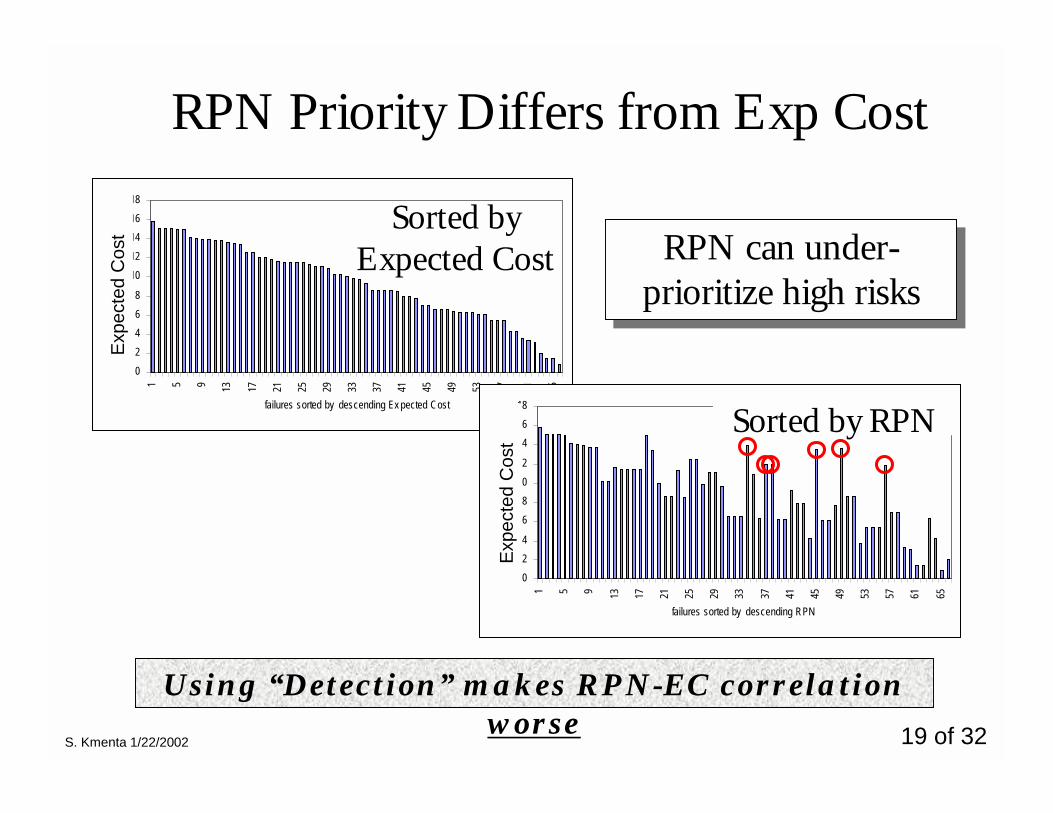
RPN Priority Differs from Exp Cost
Sorted byExpected Cost
Using “Detection” makes RPN-EC correlationworse
0
2
4
6
8
10
12
14
16
18
1 5 9 13 17 21 25 29 33 37 41 45 49 53 57 61 65
failures sorted by descending RPN
Log(
Expe
cted
Cos
t)
Sorted by RPN
Expe
cted
Cos
t
RPN can under-prioritize high risksRPN can under-
prioritize high risks
S. Kmenta 1/22/2002 20 of 32
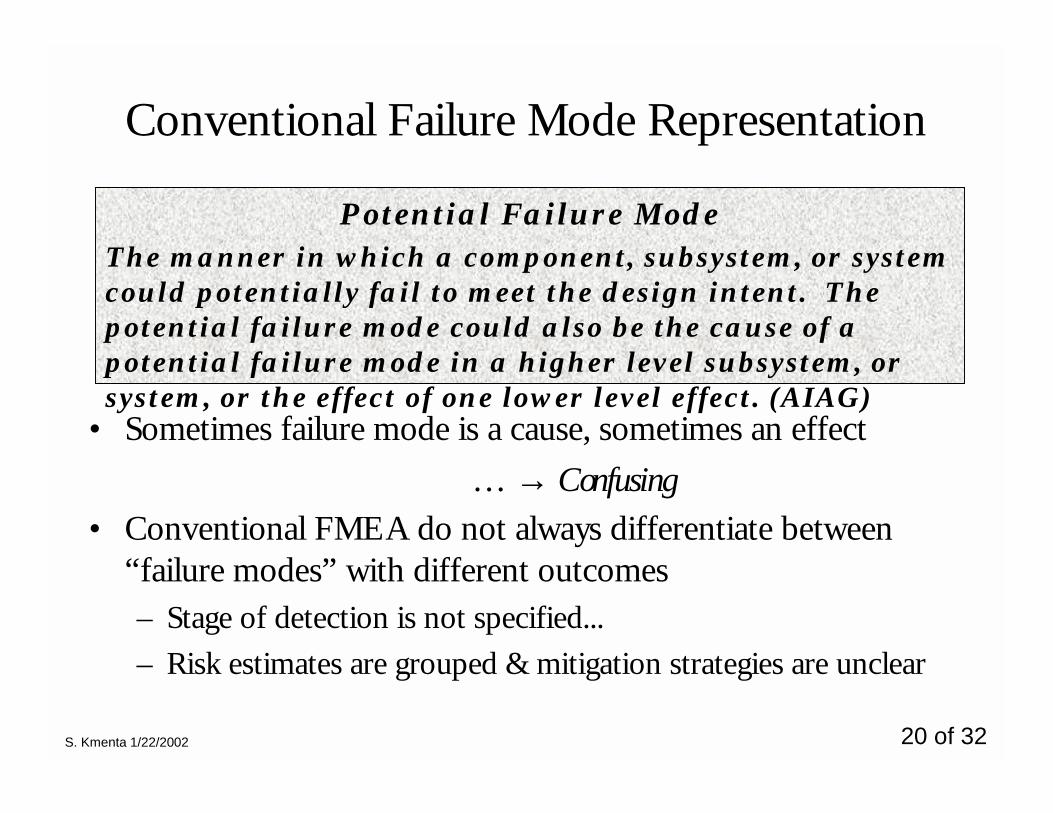
Conventional Failure Mode Representation
• Sometimes failure mode is a cause, sometimes an effect… → Confusing
• Conventional FMEA do not always differentiate between“failure modes” with different outcomes– Stage of detection is not specified...– Risk estimates are grouped & mitigation strategies are unclear
Potential Failure ModeThe manner in which a component, subsystem, or systemcould potentially fail to meet the design intent. Thepotential failure mode could also be the cause of apotential failure mode in a higher level subsystem, orsystem, or the effect of one lower level effect. (AIAG)
S. Kmenta 1/22/2002 21 of 32
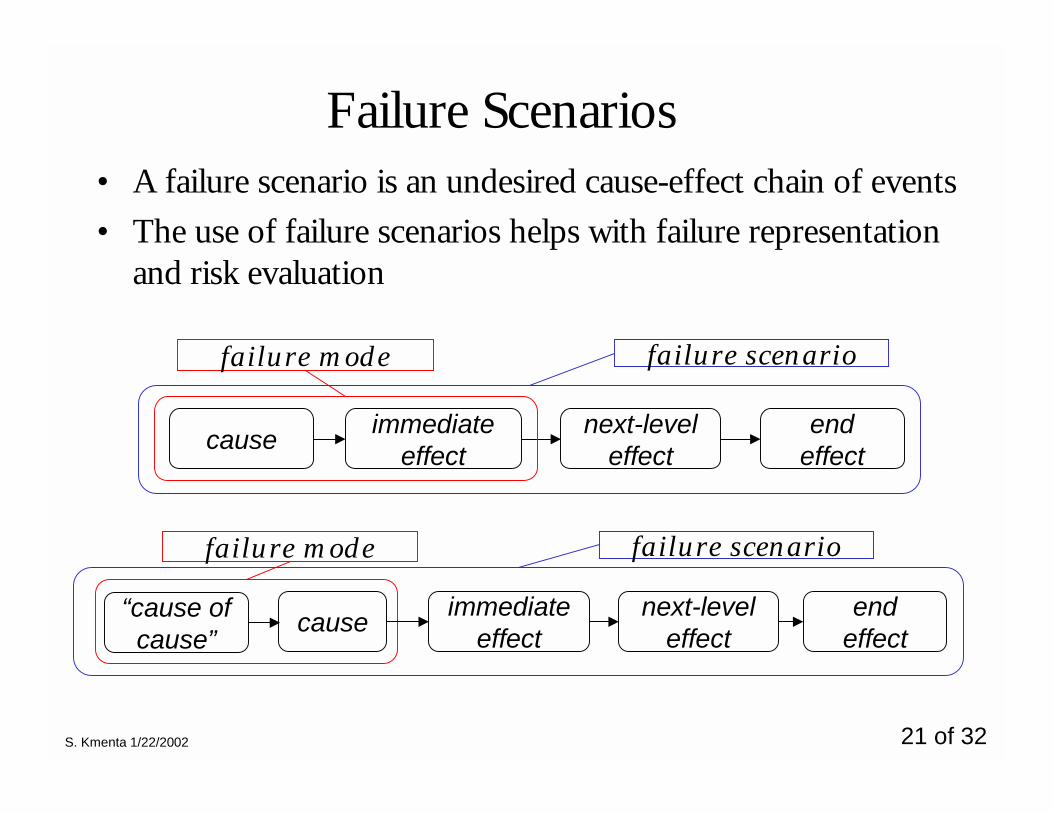
Failure Scenarios• A failure scenario is an undesired cause-effect chain of events• The use of failure scenarios helps with failure representation
and risk evaluation
immediateeffectcause next-level
effectend
effect
failure mode failure scenario
failure mode failure scenario
immediateeffectcause next-level
effectend
effect“cause of
cause”
S. Kmenta 1/22/2002 22 of 32
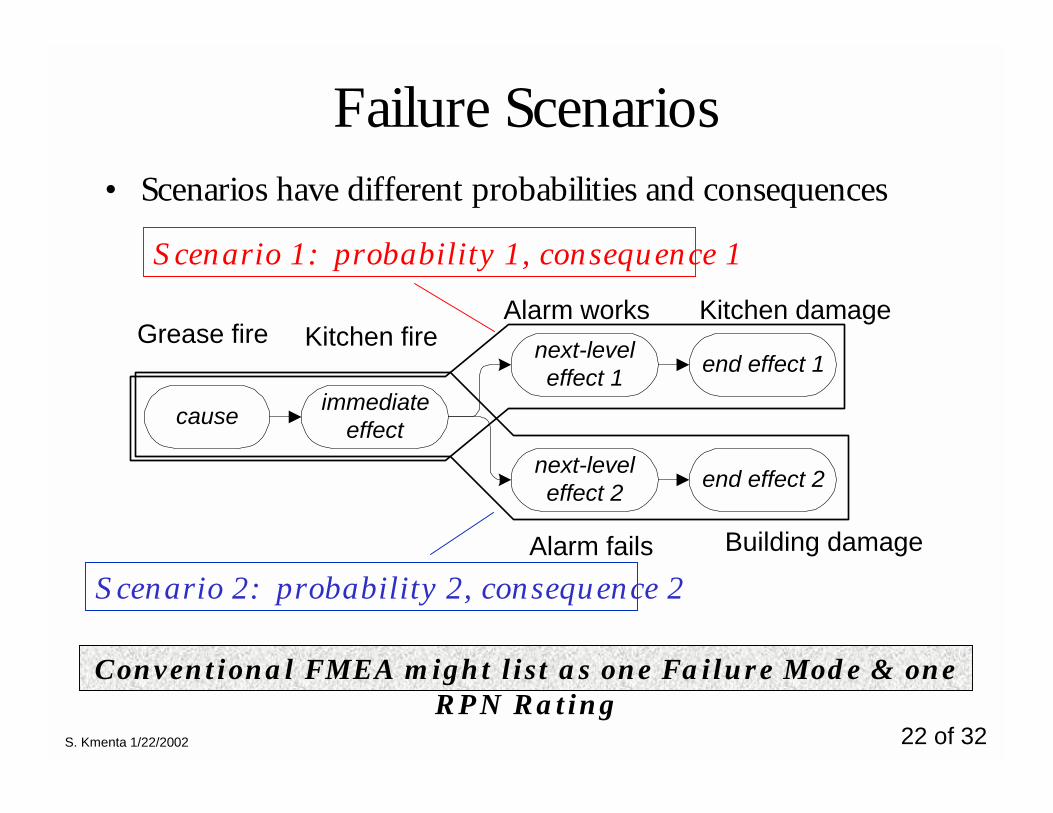
Failure Scenarios• Scenarios have different probabilities and consequences
cause immediateeffect
next-leveleffect 1 end effect 1
next-leveleffect 2 end effect 2
Scenario 1: probability 1, consequence 1
Scenario 2: probability 2, consequence 2
Grease fire Kitchen fireAlarm works Kitchen damage
Alarm fails Building damage
Conventional FMEA might list as one Failure Mode & oneRPN Rating
S. Kmenta 1/22/2002 23 of 32
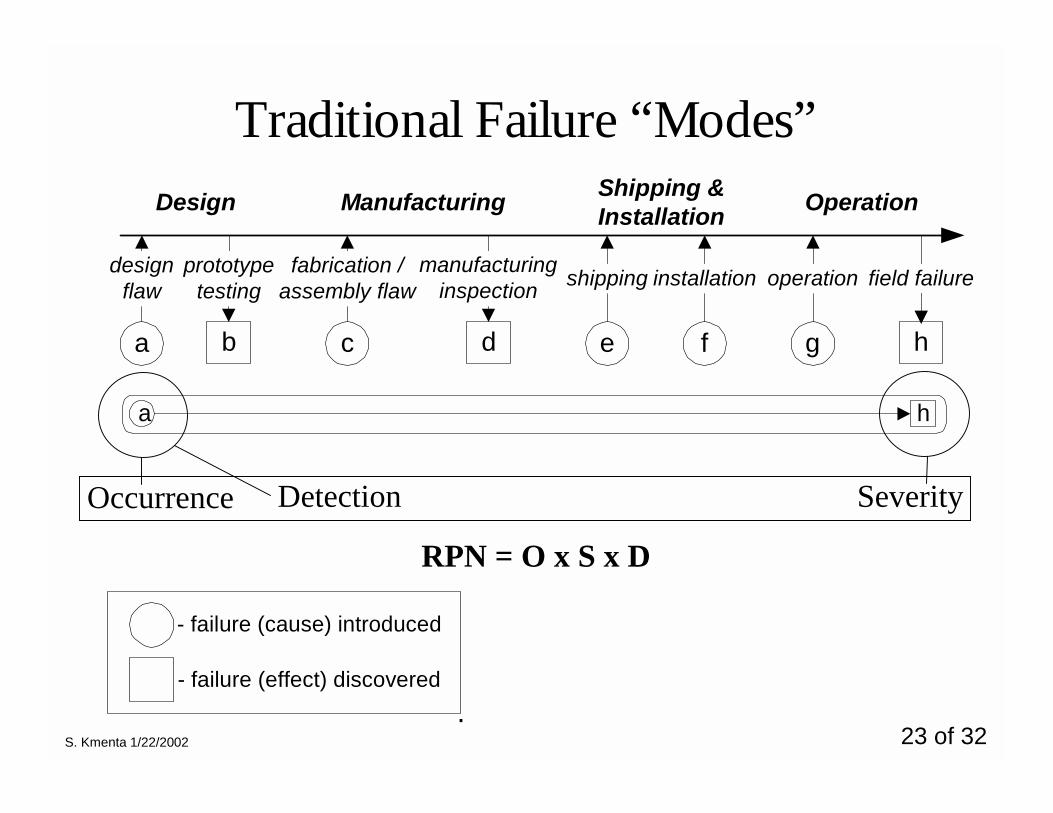
Traditional Failure “Modes”
a c eb d f
designflaw
prototypetesting
fabrication /assembly flaw
manufacturinginspection shipping installation
g
operation
h
field failure
Design Manufacturing Shipping &Installation Operation
RPN = O x S x D
a h
Occurrence SeverityDetection
- failure (cause) introduced
- failure (effect) discovered.
S. Kmenta 1/22/2002 24 of 32
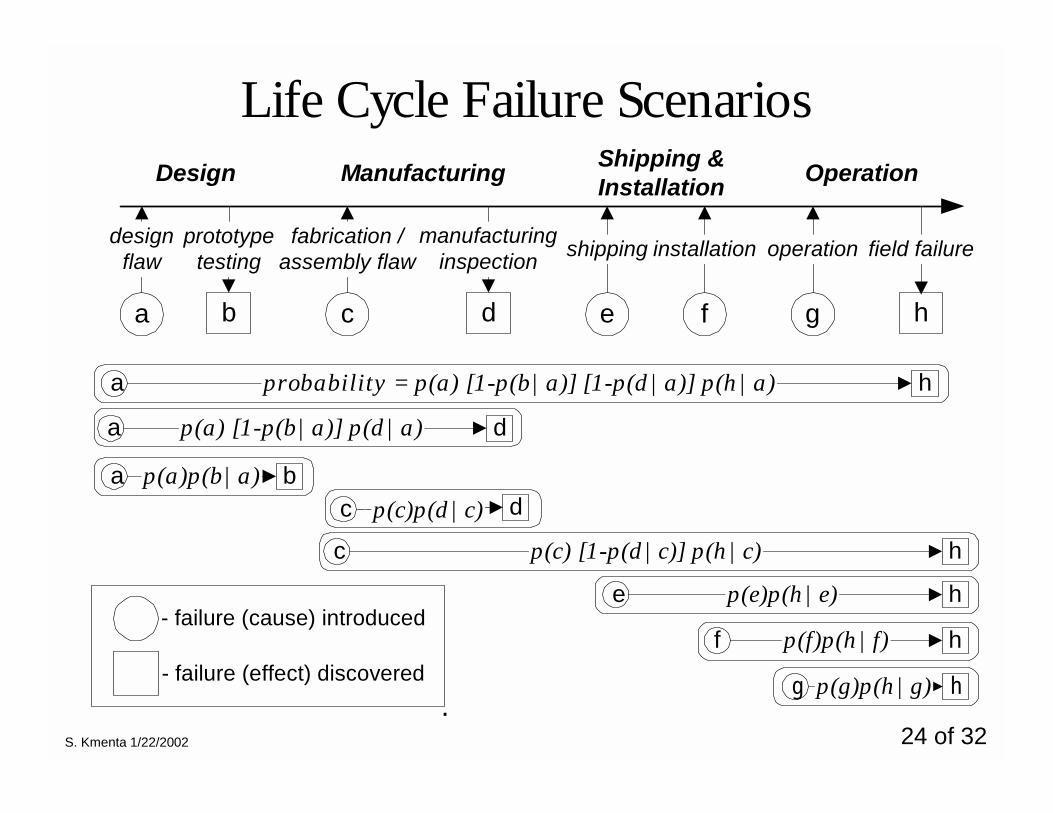
Life Cycle Failure Scenarios
a c eb d f
designflaw
prototypetesting
fabrication /assembly flaw
manufacturinginspection shipping installation
g
operation
h
field failure
Design Manufacturing Shipping &Installation Operation
c dp(c)p(d|c)
c hp(c) [1-p(d|c)] p(h|c)
e hp(e)p(h|e)
f hp(f)p(h|f)
g hp(g)p(h|g)
a hprobability = p(a) [1-p(b|a)] [1-p(d|a)] p(h|a)
a dp(a) [1-p(b|a)] p(d|a)
a bp(a)p(b|a)
- failure (cause) introduced
- failure (effect) discovered.
S. Kmenta 1/22/2002 25 of 32
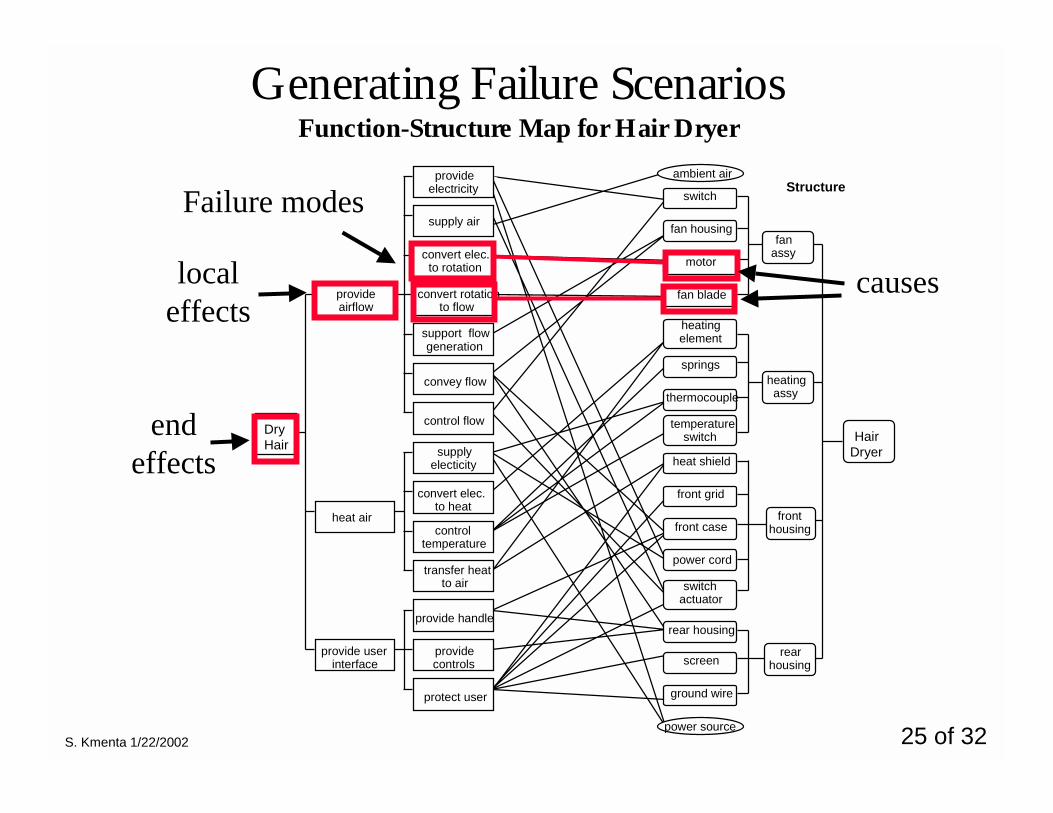
Generating Failure ScenariosFunction-Structure Map for Hair Dryer
Dry Hair
convert rotation
convert elec.
provide handle
screen
temperature switch
front case
front grid
heat shield
switch actuator
heating element
thermocouple
springs
fan blade
fan housing
motor
power cord
switch
ground wire
rear housing
heating assy
rear housing
front housing
heat air
provide user interface
provide airflow
fan assy
Hair Dryer
Function Structure
convey flow
supply air
convert elec. to rotation
to flow
support flow generation
supply electicity
to heat
control temperature
transfer heat to air
provide controls
protect user
control flow
provide electricity
ambient air
power source
causes
Failure modes
localeffects
endeffects
S. Kmenta 1/22/2002 26 of 32
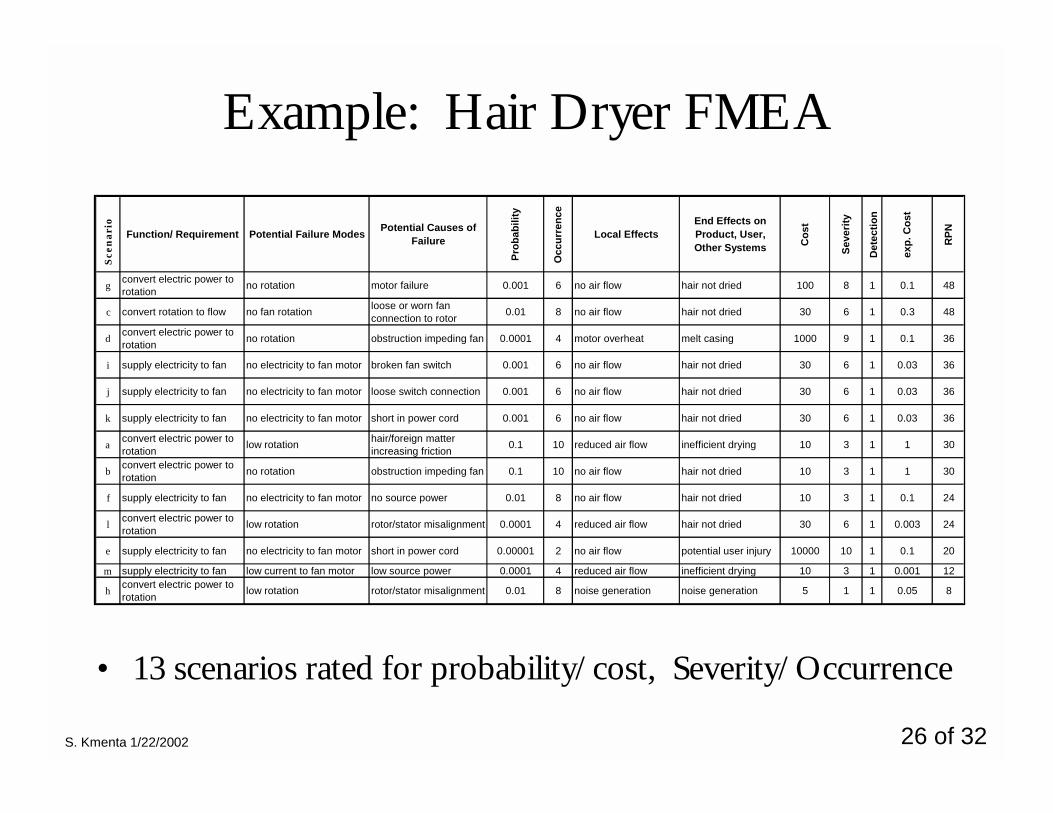
Example: Hair Dryer FMEA S
cen
ari
o
Function/ Requirement Potential Failure Modes Potential Causes of Failure
Prob
abili
ty
Occ
urre
nce
Local EffectsEnd Effects on Product, User, Other Systems C
ost
Seve
rity
Det
ectio
n
exp.
Cos
t
RPN
gconvert electric power to rotation no rotation motor failure 0.001 6 no air flow hair not dried 100 8 1 0.1 48
c convert rotation to flow no fan rotation loose or worn fan connection to rotor 0.01 8 no air flow hair not dried 30 6 1 0.3 48
dconvert electric power to rotation no rotation obstruction impeding fan 0.0001 4 motor overheat melt casing 1000 9 1 0.1 36
i supply electricity to fan no electricity to fan motor broken fan switch 0.001 6 no air flow hair not dried 30 6 1 0.03 36
j supply electricity to fan no electricity to fan motor loose switch connection 0.001 6 no air flow hair not dried 30 6 1 0.03 36
k supply electricity to fan no electricity to fan motor short in power cord 0.001 6 no air flow hair not dried 30 6 1 0.03 36
aconvert electric power to rotation low rotation hair/foreign matter
increasing friction 0.1 10 reduced air flow inefficient drying 10 3 1 1 30
bconvert electric power to rotation no rotation obstruction impeding fan 0.1 10 no air flow hair not dried 10 3 1 1 30
f supply electricity to fan no electricity to fan motor no source power 0.01 8 no air flow hair not dried 10 3 1 0.1 24
lconvert electric power to rotation low rotation rotor/stator misalignment 0.0001 4 reduced air flow hair not dried 30 6 1 0.003 24
e supply electricity to fan no electricity to fan motor short in power cord 0.00001 2 no air flow potential user injury 10000 10 1 0.1 20
m supply electricity to fan low current to fan motor low source power 0.0001 4 reduced air flow inefficient drying 10 3 1 0.001 12
hconvert electric power to rotation low rotation rotor/stator misalignment 0.01 8 noise generation noise generation 5 1 1 0.05 8
• 13 scenarios rated for probability/cost, Severity/Occurrence
S. Kmenta 1/22/2002 27 of 32
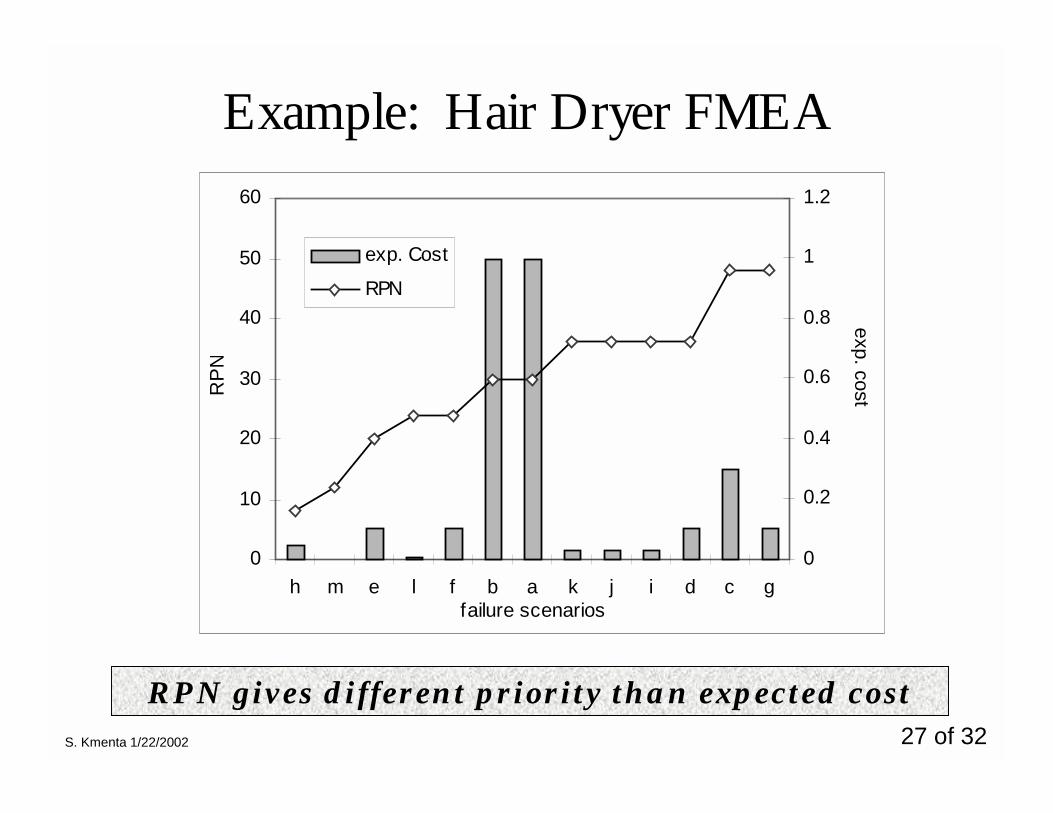
Example: Hair Dryer FMEA
0
0.2
0.4
0.6
0.8
1
1.2
gcdijkabflemhfailure scenarios
exp. cost
0
10
20
30
40
50
60R
PN
exp. Cost
RPN
RPN gives different priority than expected cost
S. Kmenta 1/22/2002 28 of 32
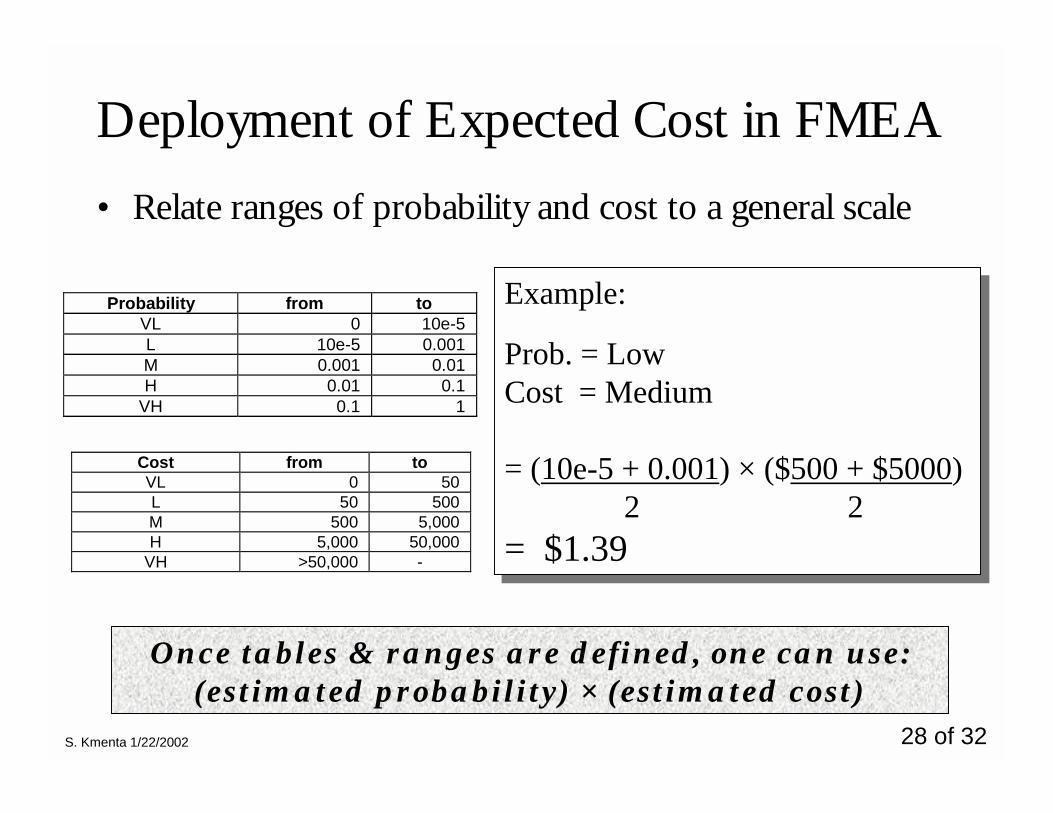
Deployment of Expected Cost in FMEA• Relate ranges of probability and cost to a general scale
Probability from toVL 0 10e-5L 10e-5 0.001M 0.001 0.01H 0.01 0.1
VH 0.1 1
Cost from toVL 0 50L 50 500M 500 5,000H 5,000 50,000
VH >50,000 -
Once tables & ranges are defined, one can use:(estimated probability) × (estimated cost)
Example:
Prob. = LowCost = Medium
= (10e-5 + 0.001) × ($500 + $5000) 2 2= $1.39
Example:
Prob. = LowCost = Medium
= (10e-5 + 0.001) × ($500 + $5000) 2 2= $1.39
S. Kmenta 1/22/2002 29 of 32
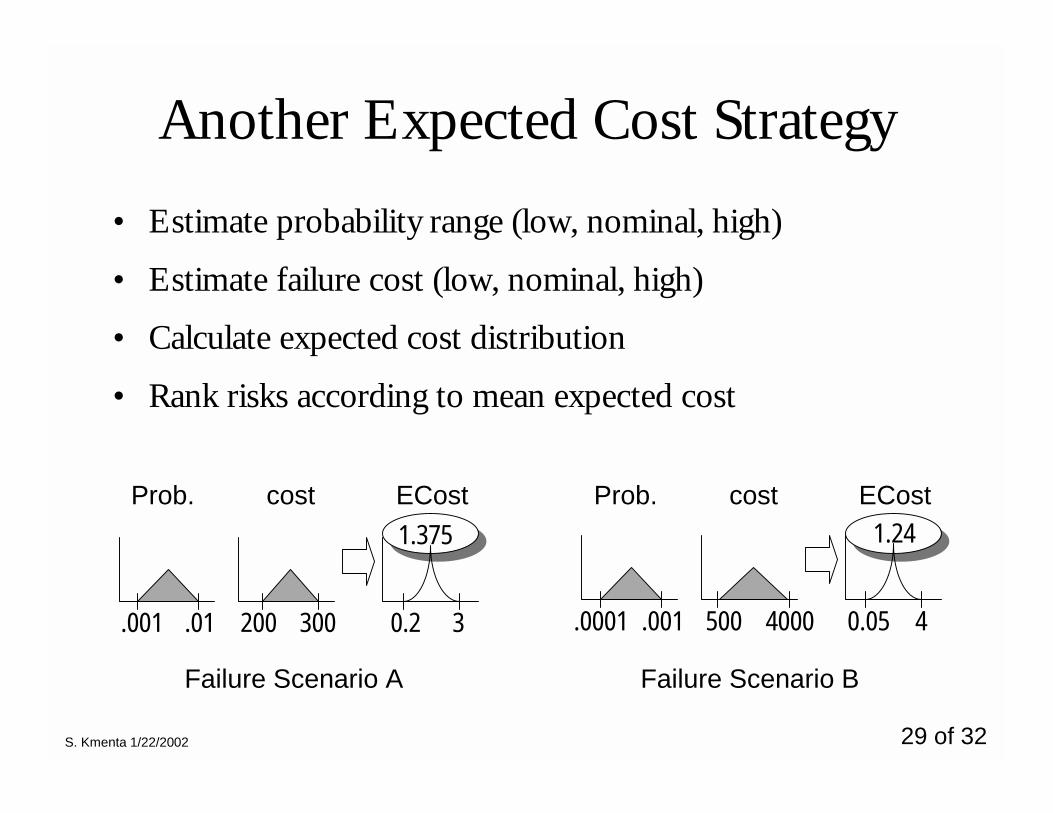
Another Expected Cost Strategy• Estimate probability range (low, nominal, high)
• Estimate failure cost (low, nominal, high)
• Calculate expected cost distribution
• Rank risks according to mean expected cost
Prob. cost ECost
.001 .01 200 300 0.2 3
Prob. cost ECost
.0001 .001 500 4000 0.05 4
1.375 1.24
Failure Scenario A Failure Scenario B
S. Kmenta 1/22/2002 30 of 32
RPN is the industry standard forFMEA
Challenges
• Cost & probability data is difficult to estimate w/o data
• There is some aversion to using probability and costestimates
• 1-10 scales for Occurrence, Detection, & Severity isfamiliar and “quick”
• Many FMEA standards and software use RPN
S. Kmenta 1/22/2002 31 of 32
Using Expected cost in scenario-based FMEApresents a more useful representation &
evaluation of “risk”
Using Expected cost in scenario-based FMEApresents a more useful representation &
evaluation of “risk”
Advantages• Analyze Failure Modes by Life-cycle “Scenarios”
– Clarifies the cause / end-effect relationship– Takes the ambiguous “Detection” out of the picture
• Expected cost is an accepted measure of risk– Cost and probability terms are consistent– Expected cost ties FMEA to $$
• Engineers can compare failure costs to solution cost tominimize life cycle costs– Reliability vs. serviceability vs. better diagnostics
S. Kmenta 1/22/2002 32 of 32
Concluding RemarksApplications & Workshops• Training Workshops given at GE CR&D, Toshiba 6 sigma• Integral part of Stanford’s graduate dfM curriculum
(me217.stanford.edu)• On-going research project: Design & costing of next linear
collider (Stanford/SLAC project)
Acknowledgments• Prof. Kos Ishii, Stanford University ([email protected])• GE Aircraft Engines, especially Gene Wiggs• Department of Energy, Integrated Manufacturing Fellowship
Questions??Questions??