Embed Size (px)
Citation preview
School Accountability Report Card, 2014–15
Stars High School 545 Estudillo Ave
San Leandro, CA 94577 (510) 352-9200
Kassoria Scales, Principal
Grades 7-12
Page 2 of 28
About This School Stars High School
District Contact Information – Most Recent Year District Name San Leandro Unified School District
Phone Number (510) 667-3500 Superintendent Mike McLaughlin, Ed.D.
E-mail Address [email protected]
Web Site http://www.sanleandro.k12.ca.us
School Contact Information – Most Recent Year School Name Stars High School Street 545 Estudillo Ave City, State, Zip San Leandro, CA 94577 Phone Number (510) 352-9200 Principal Kassoria Scales E-mail Address [email protected] Web Site http://www.starsinc.com/ST_school.php
County-District-School (CDS) Code 01612916201172
Page 3 of 28
School Description and Mission Statement – Most Recent Year
Stars High School is accredited by The Western Association of Schools and Colleges (WASC), which granted Stars High School a three (3) year term of accreditation in Spring 2013. Stars High School offers each student a high quality, standards-based, and individually tailored high school academic program. Stars High School is part of an integrated treatment program that includes special day class instruction, mental health services and school counseling services. Stars High School has the capacity to serve forty-eight students ages 13-22.
Stars High School is equipped to provide Special Education and Related Services to the following primary disabling conditions: Emotional Disturbance, Specific Learning Disability and/or Other Health Impairment. Services are determined by student need as reflected in their Individualized Education Plan (IEP). Goals and objectives address both academic and social-emotional needs. Available program components include: academic instruction, independent living skills, transition activities, behavior management, behavior modification, group counseling, individual counseling, family counseling and electives. Intake and discharge from the program is determined by the Individualized Education Plan (IEP) team. In order to be considered for placement, students must meet criteria for one of the above-mentioned primary disabling conditions and have a current IEP The mission of Stars High School is to provide each student with an individualized array of academic, emotional, behavioral, and vocational support to achieve that student’s educational goals. In order to meet this mission, staff focus on the primary goal of fostering the skills, resources, and behavior necessary to achieve a successful transition to a less restrictive program. Whenever deemed possible by the IEP team, this will include successful transition back to a main-stream educational setting and/or a high school diploma. School-Wide Learning Results Stars High School’s vision is reflected in the expected school-wide learning results (SLOs), which state that all graduates will be prepared for College, Career, Citizenship and Lifelong Learning: Productive Citizens
Demonstrate positive decision making
Display positive and ethical behaviors, attitudes, and respect for themselves and others
Exhibit skills in resolving conflicts through positive non violence Critical and Creative Thinkers
Overcome obstacles and adapt to changing conditions
Problem solve by exploring different solutions
Demonstrate logical thinking skills Be Life Long Learners
Establish and identify personal and future goals
Demonstrate positive social skills
Exhibit the ability to evaluate and analyze information
Utilize technology for research, occupational goals and continued education Community Builders
Shows empathy for others and respect for all
Collaborate and advocate improvement in the community
Actively participate by influencing positive change
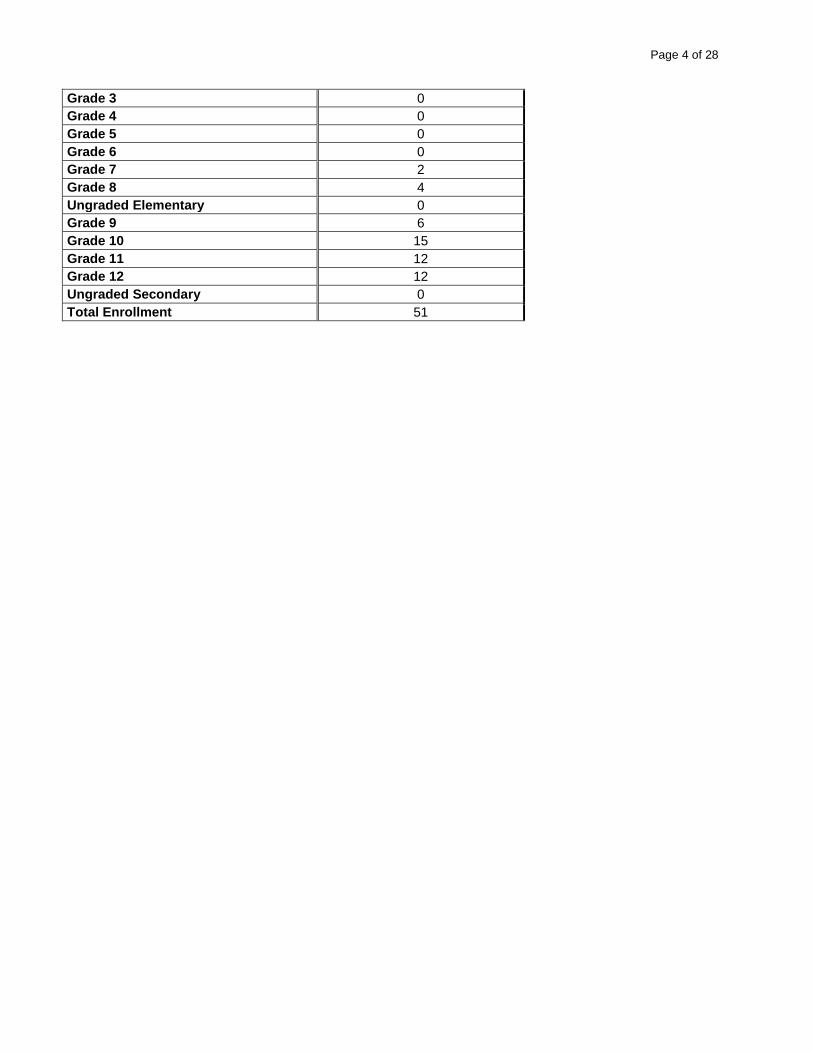
Student Enrollment by Grade Level (School Year 2014–15)
Grade Level Number of Students
Kindergarten 0
Grade 1 0
Grade 2 0
Page 4 of 28
Grade 3 0
Grade 4 0
Grade 5 0
Grade 6 0
Grade 7 2
Grade 8 4
Ungraded Elementary 0
Grade 9 6
Grade 10 15
Grade 11 12
Grade 12 12
Ungraded Secondary 0
Total Enrollment 51
Page 5 of 28
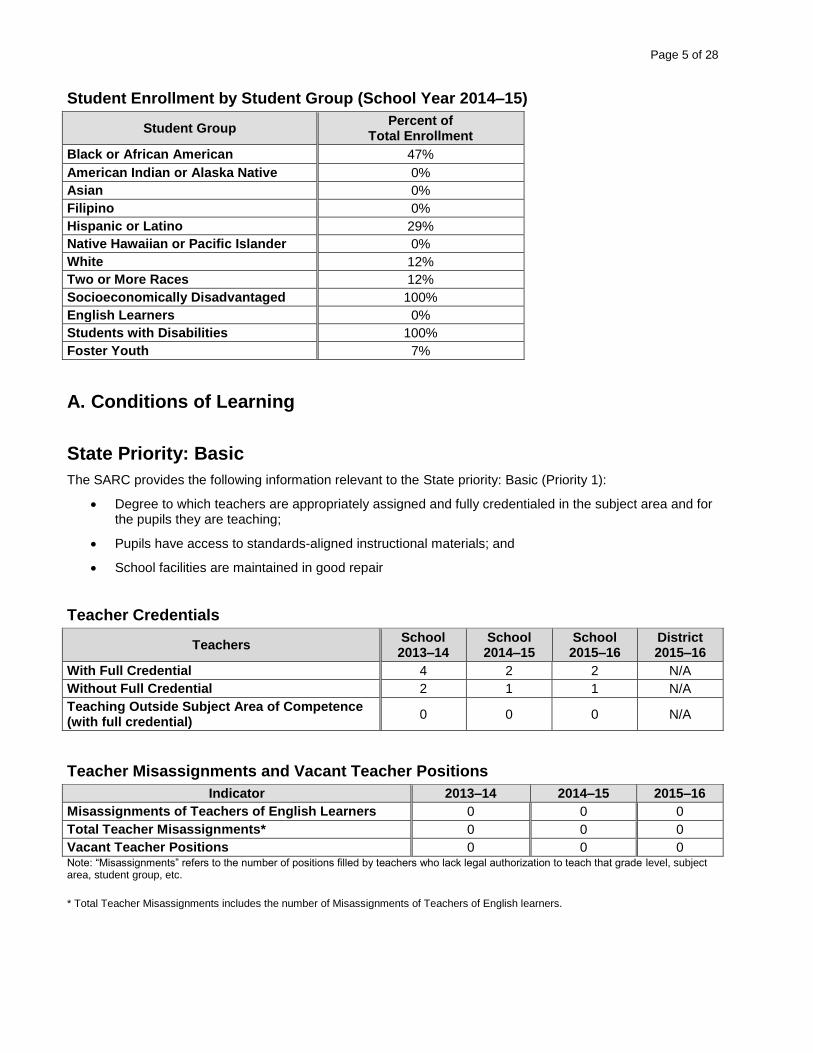
Student Enrollment by Student Group (School Year 2014–15)
Student Group Percent of
Total Enrollment
Black or African American 47%
American Indian or Alaska Native 0%
Asian 0%
Filipino 0%
Hispanic or Latino 29%
Native Hawaiian or Pacific Islander 0%
White 12%
Two or More Races 12%
Socioeconomically Disadvantaged 100%
English Learners 0%
Students with Disabilities 100%
Foster Youth 7%
A. Conditions of Learning
State Priority: Basic
The SARC provides the following information relevant to the State priority: Basic (Priority 1):
Degree to which teachers are appropriately assigned and fully credentialed in the subject area and for the pupils they are teaching;
Pupils have access to standards-aligned instructional materials; and
School facilities are maintained in good repair
Teacher Credentials
Teachers School 2013–14
School 2014–15
School 2015–16
District 2015–16
With Full Credential 4 2 2 N/A
Without Full Credential 2 1 1 N/A
Teaching Outside Subject Area of Competence (with full credential)
0 0 0 N/A
Teacher Misassignments and Vacant Teacher Positions
Indicator 2013–14 2014–15 2015–16
Misassignments of Teachers of English Learners 0 0 0
Total Teacher Misassignments* 0 0 0
Vacant Teacher Positions 0 0 0 Note: “Misassignments” refers to the number of positions filled by teachers who lack legal authorization to teach that grade level, subject area, student group, etc.
* Total Teacher Misassignments includes the number of Misassignments of Teachers of English learners.
Page 6 of 28
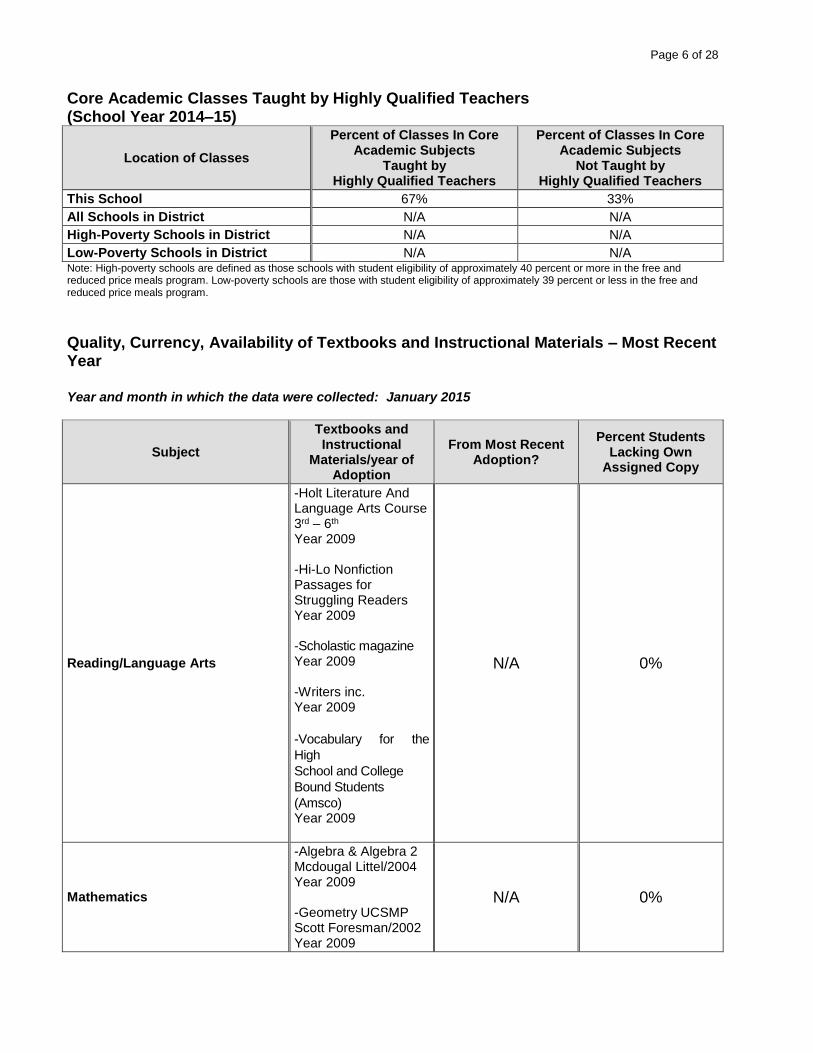
Core Academic Classes Taught by Highly Qualified Teachers (School Year 2014–15)
Location of Classes
Percent of Classes In Core Academic Subjects
Taught by Highly Qualified Teachers
Percent of Classes In Core Academic Subjects
Not Taught by Highly Qualified Teachers
This School 67% 33% All Schools in District N/A N/A High-Poverty Schools in District N/A N/A Low-Poverty Schools in District N/A N/A Note: High-poverty schools are defined as those schools with student eligibility of approximately 40 percent or more in the free and reduced price meals program. Low-poverty schools are those with student eligibility of approximately 39 percent or less in the free and reduced price meals program.
Quality, Currency, Availability of Textbooks and Instructional Materials – Most Recent Year
Year and month in which the data were collected: January 2015
Subject
Textbooks and Instructional
Materials/year of Adoption
From Most Recent Adoption?
Percent Students Lacking Own
Assigned Copy
Reading/Language Arts
-Holt Literature And Language Arts Course 3rd – 6th Year 2009 -Hi-Lo Nonfiction Passages for Struggling Readers Year 2009 -Scholastic magazine Year 2009 -Writers inc. Year 2009
-Vocabulary for the
High
School and College
Bound Students
(Amsco) Year 2009
N/A 0%
Mathematics
-Algebra & Algebra 2 Mcdougal Littel/2004 Year 2009 -Geometry UCSMP Scott Foresman/2002 Year 2009
N/A 0%
Page 7 of 28
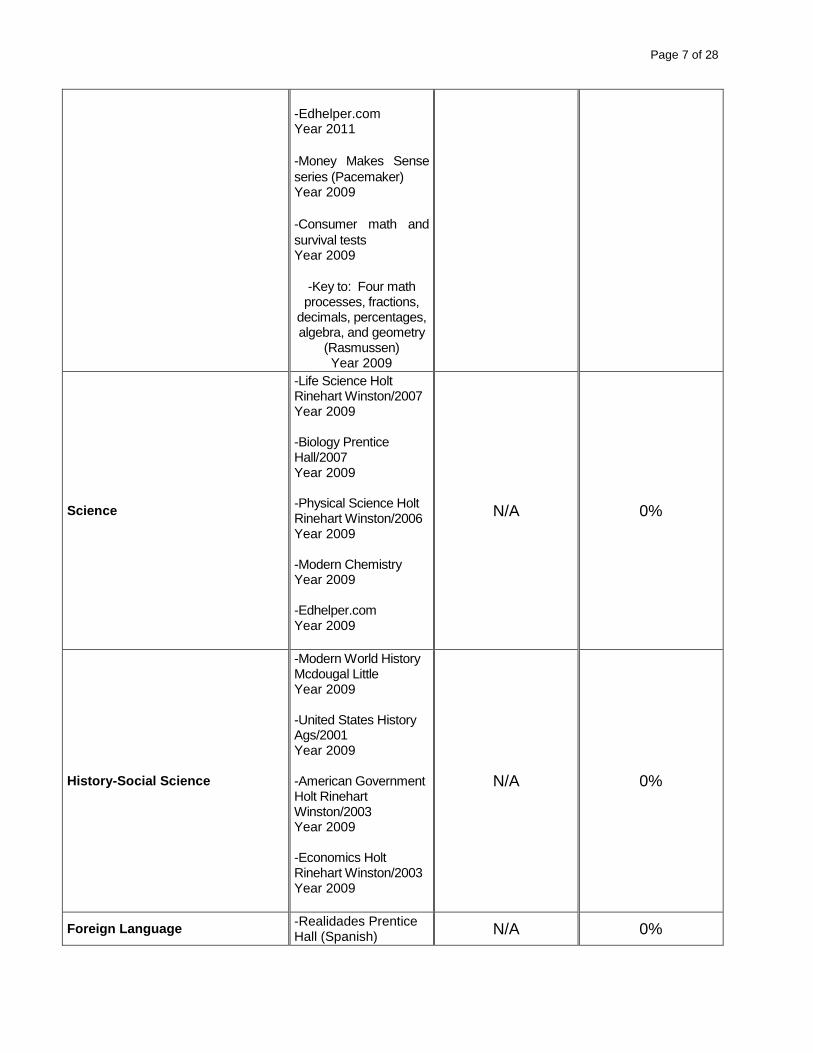
-Edhelper.com Year 2011
-Money Makes Sense
series (Pacemaker) Year 2009
-Consumer math and
survival tests Year 2009
-Key to: Four math
processes, fractions, decimals, percentages, algebra, and geometry
(Rasmussen) Year 2009
Science
-Life Science Holt Rinehart Winston/2007 Year 2009 -Biology Prentice Hall/2007 Year 2009 -Physical Science Holt Rinehart Winston/2006 Year 2009 -Modern Chemistry Year 2009 -Edhelper.com Year 2009
N/A 0%
History-Social Science
-Modern World History Mcdougal Little Year 2009 -United States History Ags/2001 Year 2009 -American Government Holt Rinehart Winston/2003 Year 2009 -Economics Holt Rinehart Winston/2003 Year 2009
N/A 0%
Foreign Language -Realidades Prentice Hall (Spanish)
N/A 0%
Page 8 of 28
Year 2009
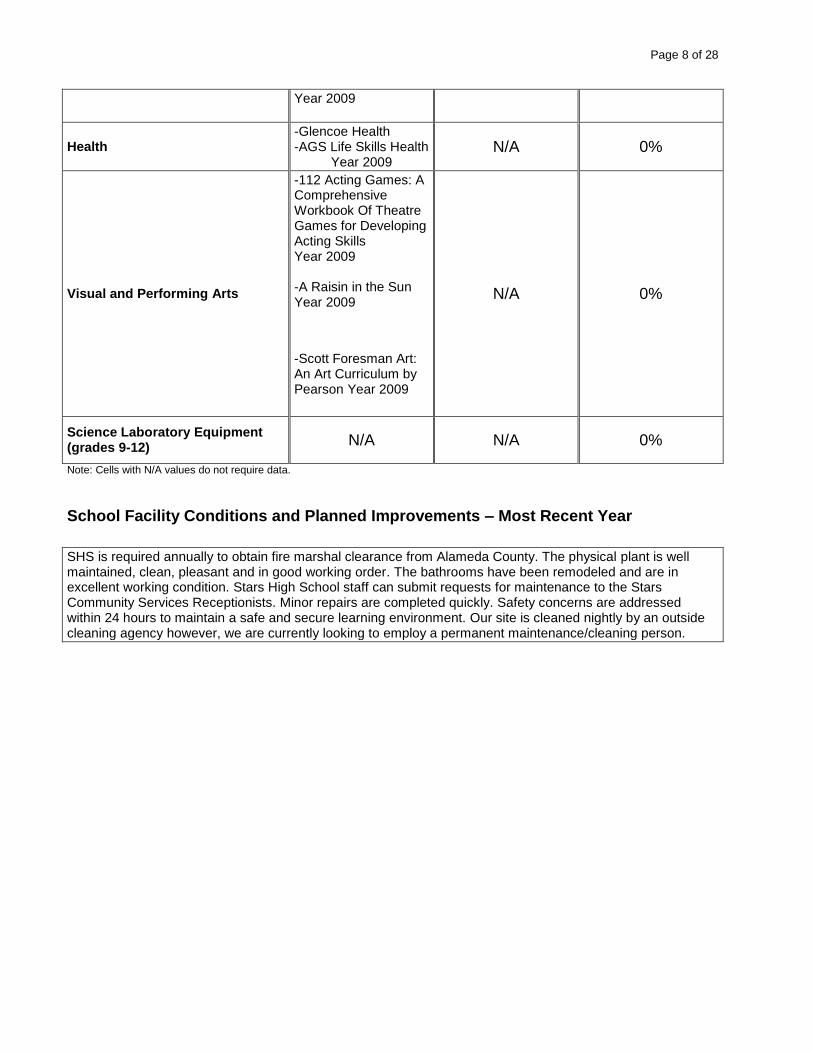
Health -Glencoe Health -AGS Life Skills Health
Year 2009 N/A 0%
Visual and Performing Arts
-112 Acting Games: A Comprehensive Workbook Of Theatre Games for Developing Acting Skills Year 2009 -A Raisin in the Sun Year 2009
-Scott Foresman Art: An Art Curriculum by Pearson Year 2009
N/A 0%
Science Laboratory Equipment (grades 9-12)
N/A N/A 0%
Note: Cells with N/A values do not require data.
School Facility Conditions and Planned Improvements – Most Recent Year
SHS is required annually to obtain fire marshal clearance from Alameda County. The physical plant is well maintained, clean, pleasant and in good working order. The bathrooms have been remodeled and are in excellent working condition. Stars High School staff can submit requests for maintenance to the Stars Community Services Receptionists. Minor repairs are completed quickly. Safety concerns are addressed within 24 hours to maintain a safe and secure learning environment. Our site is cleaned nightly by an outside cleaning agency however, we are currently looking to employ a permanent maintenance/cleaning person.
Page 9 of 28
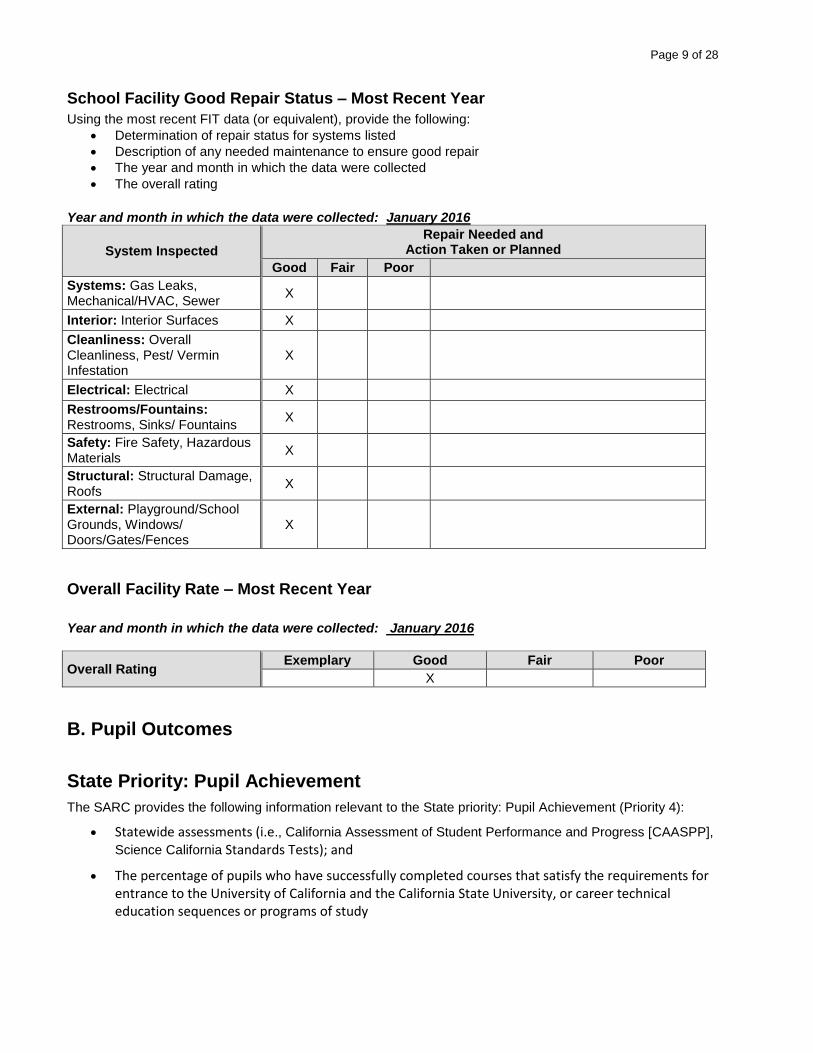
School Facility Good Repair Status – Most Recent Year
Using the most recent FIT data (or equivalent), provide the following:
Determination of repair status for systems listed
Description of any needed maintenance to ensure good repair
The year and month in which the data were collected
The overall rating
Year and month in which the data were collected: January 2016
System Inspected
Repair Needed and Action Taken or Planned
Good Fair Poor
Systems: Gas Leaks, Mechanical/HVAC, Sewer
X
Interior: Interior Surfaces X Cleanliness: Overall Cleanliness, Pest/ Vermin Infestation
X
Electrical: Electrical X Restrooms/Fountains: Restrooms, Sinks/ Fountains
X
Safety: Fire Safety, Hazardous Materials
X
Structural: Structural Damage, Roofs
X
External: Playground/School Grounds, Windows/ Doors/Gates/Fences
X
Overall Facility Rate – Most Recent Year
Year and month in which the data were collected: January 2016.
Overall Rating Exemplary Good Fair Poor
X
B. Pupil Outcomes
State Priority: Pupil Achievement
The SARC provides the following information relevant to the State priority: Pupil Achievement (Priority 4):
Statewide assessments (i.e., California Assessment of Student Performance and Progress [CAASPP],
Science California Standards Tests); and
The percentage of pupils who have successfully completed courses that satisfy the requirements for entrance to the University of California and the California State University, or career technical education sequences or programs of study
Page 10 of 28
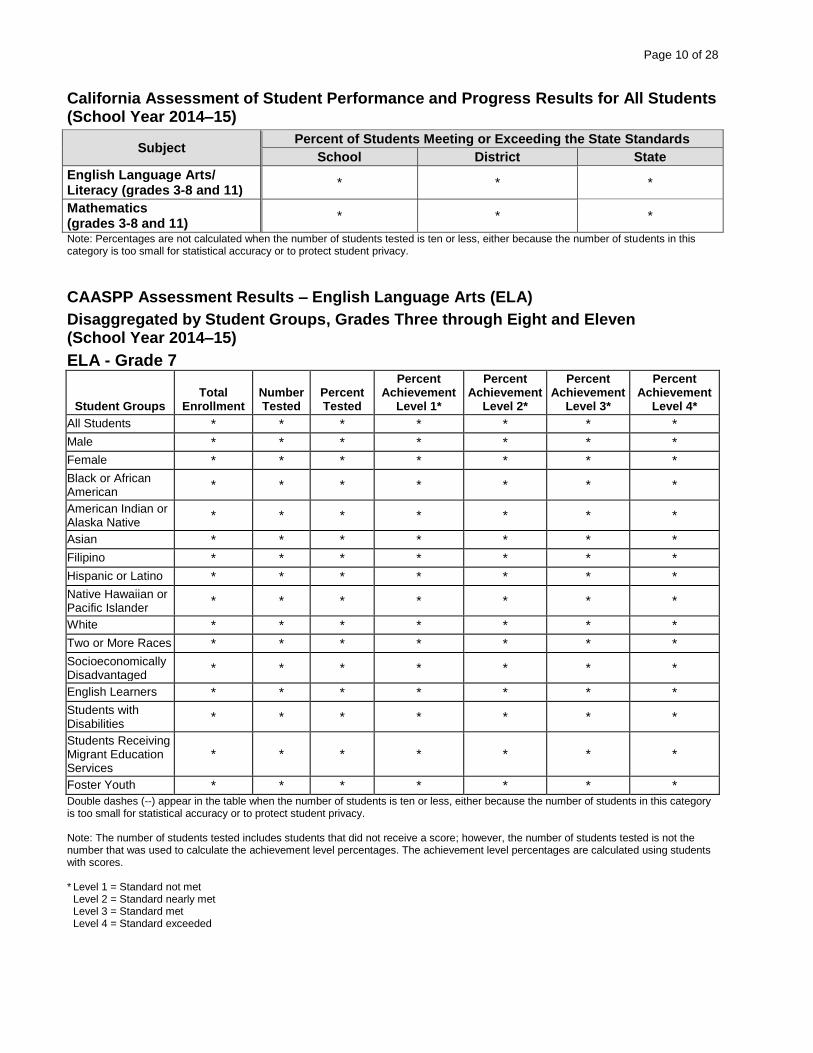
California Assessment of Student Performance and Progress Results for All Students (School Year 2014–15)
Subject Percent of Students Meeting or Exceeding the State Standards
School District State
English Language Arts/ Literacy (grades 3-8 and 11)
* * *
Mathematics (grades 3-8 and 11)
* * *
Note: Percentages are not calculated when the number of students tested is ten or less, either because the number of students in this category is too small for statistical accuracy or to protect student privacy.
CAASPP Assessment Results – English Language Arts (ELA)
Disaggregated by Student Groups, Grades Three through Eight and Eleven (School Year 2014–15)
ELA - Grade 7
Student Groups Total
Enrollment Number Tested
Percent Tested
Percent Achievement
Level 1*
Percent Achievement
Level 2*
Percent Achievement
Level 3*
Percent Achievement
Level 4*
All Students * * * * * * *
Male * * * * * * * Female * * * * * * * Black or African American
* * * * * * *
American Indian or Alaska Native
* * * * * * *
Asian * * * * * * * Filipino * * * * * * * Hispanic or Latino * * * * * * * Native Hawaiian or Pacific Islander
* * * * * * *
White * * * * * * * Two or More Races * * * * * * * Socioeconomically Disadvantaged
* * * * * * *
English Learners * * * * * * * Students with Disabilities
* * * * * * *
Students Receiving Migrant Education Services
* * * * * * *
Foster Youth * * * * * * *
Double dashes (--) appear in the table when the number of students is ten or less, either because the number of students in this category is too small for statistical accuracy or to protect student privacy. Note: The number of students tested includes students that did not receive a score; however, the number of students tested is not the number that was used to calculate the achievement level percentages. The achievement level percentages are calculated using students with scores. * Level 1 = Standard not met Level 2 = Standard nearly met Level 3 = Standard met Level 4 = Standard exceeded
Page 11 of 28
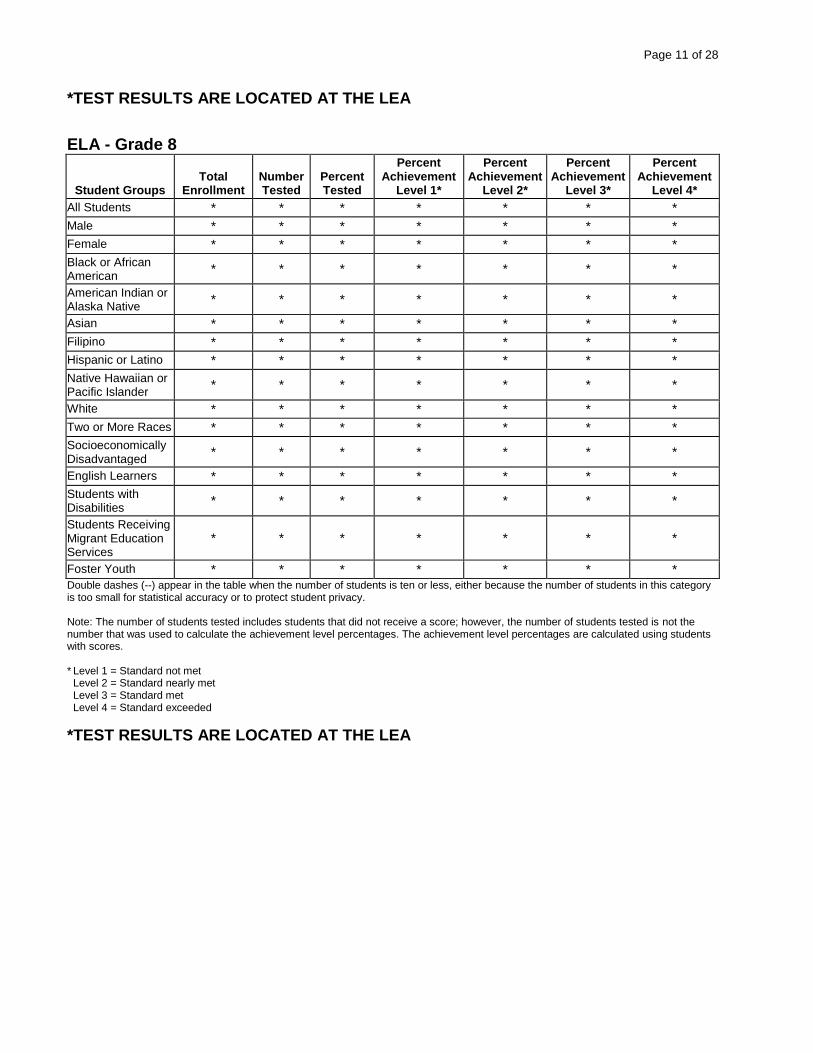
*TEST RESULTS ARE LOCATED AT THE LEA
ELA - Grade 8
Student Groups Total
Enrollment Number Tested
Percent Tested
Percent Achievement
Level 1*
Percent Achievement
Level 2*
Percent Achievement
Level 3*
Percent Achievement
Level 4*
All Students * * * * * * *
Male * * * * * * * Female * * * * * * * Black or African American
* * * * * * *
American Indian or Alaska Native
* * * * * * *
Asian * * * * * * * Filipino * * * * * * * Hispanic or Latino * * * * * * * Native Hawaiian or Pacific Islander
* * * * * * *
White * * * * * * * Two or More Races * * * * * * * Socioeconomically Disadvantaged
* * * * * * *
English Learners * * * * * * * Students with Disabilities
* * * * * * *
Students Receiving Migrant Education Services
* * * * * * *
Foster Youth * * * * * * *
Double dashes (--) appear in the table when the number of students is ten or less, either because the number of students in this category is too small for statistical accuracy or to protect student privacy. Note: The number of students tested includes students that did not receive a score; however, the number of students tested is not the number that was used to calculate the achievement level percentages. The achievement level percentages are calculated using students with scores. * Level 1 = Standard not met Level 2 = Standard nearly met Level 3 = Standard met Level 4 = Standard exceeded
*TEST RESULTS ARE LOCATED AT THE LEA
Page 12 of 28
ELA - Grade 11
Student Groups Total
Enrollment Number Tested
Percent Tested
Percent Achievement
Level 1*
Percent Achievement
Level 2*
Percent Achievement
Level 3*
Percent Achievement
Level 4*
All Students * * * * * * *
Male * * * * * * * Female * * * * * * * Black or African American
* * * * * * *
American Indian or Alaska Native
* * * * * * *
Asian * * * * * * * Filipino * * * * * * * Hispanic or Latino * * * * * * * Native Hawaiian or Pacific Islander
* * * * * * *
White * * * * * * * Two or More Races * * * * * * * Socioeconomically Disadvantaged
* * * * * * *
English Learners * * * * * * * Students with Disabilities
* * * * * * *
Students Receiving Migrant Education Services
* * * * * * *
Foster Youth * * * * * * *
Double dashes (--) appear in the table when the number of students is ten or less, either because the number of students in this category is too small for statistical accuracy or to protect student privacy. Note: The number of students tested includes students that did not receive a score; however, the number of students tested is not the number that was used to calculate the achievement level percentages. The achievement level percentages are calculated using students with scores. * Level 1 = Standard not met Level 2 = Standard nearly met Level 3 = Standard met Level 4 = Standard exceeded
*TEST RESULTS ARE LOCATED AT THE LEA
Page 13 of 28
CAASPP Assessment Results – Mathematics
Disaggregated by Student Groups, Grades Three through Eight and Eleven (School Year 2014–15)
Mathematics - Grade 7
Student Groups Total
Enrollment Number Tested
Percent Tested
Percent Achievement
Level 1*
Percent Achievement
Level 2*
Percent Achievement
Level 3*
Percent Achievement
Level 4*
All Students * * * * * * *
Male * * * * * * * Female * * * * * * * Black or African American
* * * * * * *
American Indian or Alaska Native
* * * * * * *
Asian * * * * * * * Filipino * * * * * * * Hispanic or Latino * * * * * * * Native Hawaiian or Pacific Islander
* * * * * * *
White * * * * * * * Two or More Races * * * * * * * Socioeconomically Disadvantaged
* * * * * * *
English Learners * * * * * * * Students with Disabilities
* * * * * * *
Students Receiving Migrant Education Services
* * * * * * *
Foster Youth * * * * * * *
Double dashes (--) appear in the table when the number of students is ten or less, either because the number of students in this category is too small for statistical accuracy or to protect student privacy. Note: The number of students tested includes students that did not receive a score; however, the number of students tested is not the number that was used to calculate the achievement level percentages. The achievement level percentages are calculated using students with scores. * Level 1 = Standard not met Level 2 = Standard nearly met Level 3 = Standard met Level 4 = Standard exceeded
*TEST RESULTS ARE LOCATED AT THE LEA
Page 14 of 28
Mathematics - Grade 8
Student Groups Total
Enrollment Number Tested
Percent Tested
Percent Achievement
Level 1*
Percent Achievement
Level 2*
Percent Achievement
Level 3*
Percent Achievement
Level 4*
All Students * * * * * * *
Male * * * * * * * Female * * * * * * * Black or African American
* * * * * * *
American Indian or Alaska Native
* * * * * * *
Asian * * * * * * * Filipino * * * * * * * Hispanic or Latino * * * * * * * Native Hawaiian or Pacific Islander
* * * * * * *
White * * * * * * * Two or More Races * * * * * * * Socioeconomically Disadvantaged
* * * * * * *
English Learners * * * * * * * Students with Disabilities
* * * * * * *
Students Receiving Migrant Education Services
* * * * * * *
Foster Youth * * * * * * *
Double dashes (--) appear in the table when the number of students is ten or less, either because the number of students in this category is too small for statistical accuracy or to protect student privacy. Note: The number of students tested includes students that did not receive a score; however, the number of students tested is not the number that was used to calculate the achievement level percentages. The achievement level percentages are calculated using students with scores. * Level 1 = Standard not met Level 2 = Standard nearly met Level 3 = Standard met Level 4 = Standard exceeded
*TEST RESULTS ARE LOCATED AT THE LEA
Page 15 of 28
Mathematics - Grade 11
Student Groups Total
Enrollment Number Tested
Percent Tested
Percent Achievement
Level 1*
Percent Achievement
Level 2*
Percent Achievement
Level 3*
Percent Achievement
Level 4*
All Students * * * * * * *
Male * * * * * * * Female * * * * * * * Black or African American
* * * * * * *
American Indian or Alaska Native
* * * * * * *
Asian * * * * * * * Filipino * * * * * * * Hispanic or Latino * * * * * * * Native Hawaiian or Pacific Islander
* * * * * * *
White * * * * * * * Two or More Races * * * * * * * Socioeconomically Disadvantaged
* * * * * * *
English Learners * * * * * * * Students with Disabilities
* * * * * * *
Students Receiving Migrant Education Services
* * * * * * *
Foster Youth * * * * * * *
Double dashes (--) appear in the table when the number of students is ten or less, either because the number of students in this category is too small for statistical accuracy or to protect student privacy. Note: The number of students tested includes students that did not receive a score; however, the number of students tested is not the number that was used to calculate the achievement level percentages. The achievement level percentages are calculated using students with scores. * Level 1 = Standard not met Level 2 = Standard nearly met Level 3 = Standard met Level 4 = Standard exceeded
*TEST RESULTS ARE LOCATED AT THE LEA

Page 16 of 28
California Standards Tests for All Students in Science – Three-Year Comparison
Subject
Percent of Students Scoring at Proficient or Advanced (meeting or exceeding the state standards)
School District State
2012–13 2013–14 2014–15 2012–13 2013–14 2014–15 2012–13 2013–14 2014–15
Science (grades 5, 8, and 10)
* * * * * * * * *
Note: Scores are not shown when the number of students tested is ten or less, either because the number of students in this category is too small for statistical accuracy or to protect student privacy.
California Standards Tests Results by Student Group in Science (School Year 2014–15)
Student Group Percent of Students Scoring at
Proficient or Advanced
All Students in the LEA * All Students at the School * Male * Female * Black or African American * American Indian or Alaska Native * Asian * Filipino * Hispanic or Latino * Native Hawaiian or Pacific Islander * White * Two or More Races * Socioeconomically Disadvantaged * English Learners * Students with Disabilities * Students Receiving Migrant Education Services * Foster Youth * Note: Scores are not shown when the number of students tested is ten or less, either because the number of students in this category is too small for statistical accuracy or to protect student privacy.
*TEST RESULTS ARE LOCATED AT THE LEA
Page 17 of 28
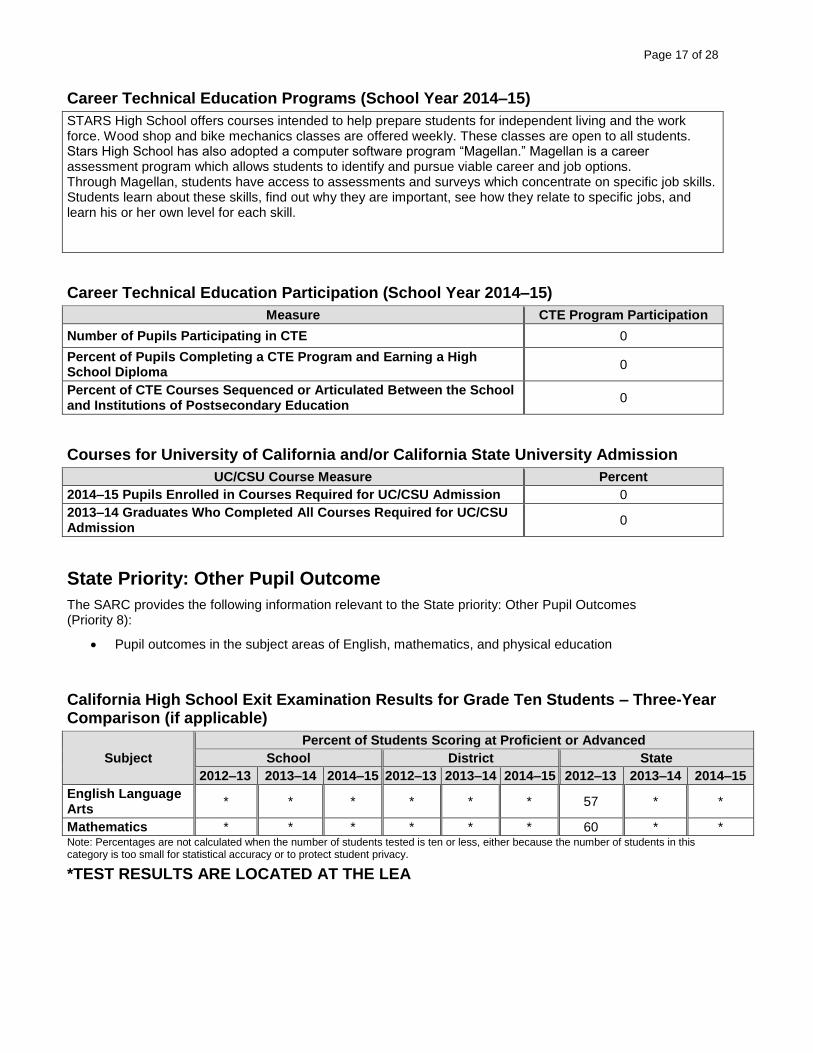
Career Technical Education Programs (School Year 2014–15)
STARS High School offers courses intended to help prepare students for independent living and the work force. Wood shop and bike mechanics classes are offered weekly. These classes are open to all students. Stars High School has also adopted a computer software program “Magellan.” Magellan is a career assessment program which allows students to identify and pursue viable career and job options. Through Magellan, students have access to assessments and surveys which concentrate on specific job skills. Students learn about these skills, find out why they are important, see how they relate to specific jobs, and learn his or her own level for each skill.
Career Technical Education Participation (School Year 2014–15)
Measure CTE Program Participation
Number of Pupils Participating in CTE 0
Percent of Pupils Completing a CTE Program and Earning a High School Diploma
0
Percent of CTE Courses Sequenced or Articulated Between the School and Institutions of Postsecondary Education
0
Courses for University of California and/or California State University Admission
UC/CSU Course Measure Percent
2014–15 Pupils Enrolled in Courses Required for UC/CSU Admission 0
2013–14 Graduates Who Completed All Courses Required for UC/CSU Admission
0
State Priority: Other Pupil Outcome
The SARC provides the following information relevant to the State priority: Other Pupil Outcomes (Priority 8):
Pupil outcomes in the subject areas of English, mathematics, and physical education
California High School Exit Examination Results for Grade Ten Students – Three-Year Comparison (if applicable)
Subject
Percent of Students Scoring at Proficient or Advanced
School District State
2012–13 2013–14 2014–15 2012–13 2013–14 2014–15 2012–13 2013–14 2014–15
English Language Arts
* * * * * * 57 * *
Mathematics * * * * * * 60 * * Note: Percentages are not calculated when the number of students tested is ten or less, either because the number of students in this category is too small for statistical accuracy or to protect student privacy.
*TEST RESULTS ARE LOCATED AT THE LEA
Page 18 of 28
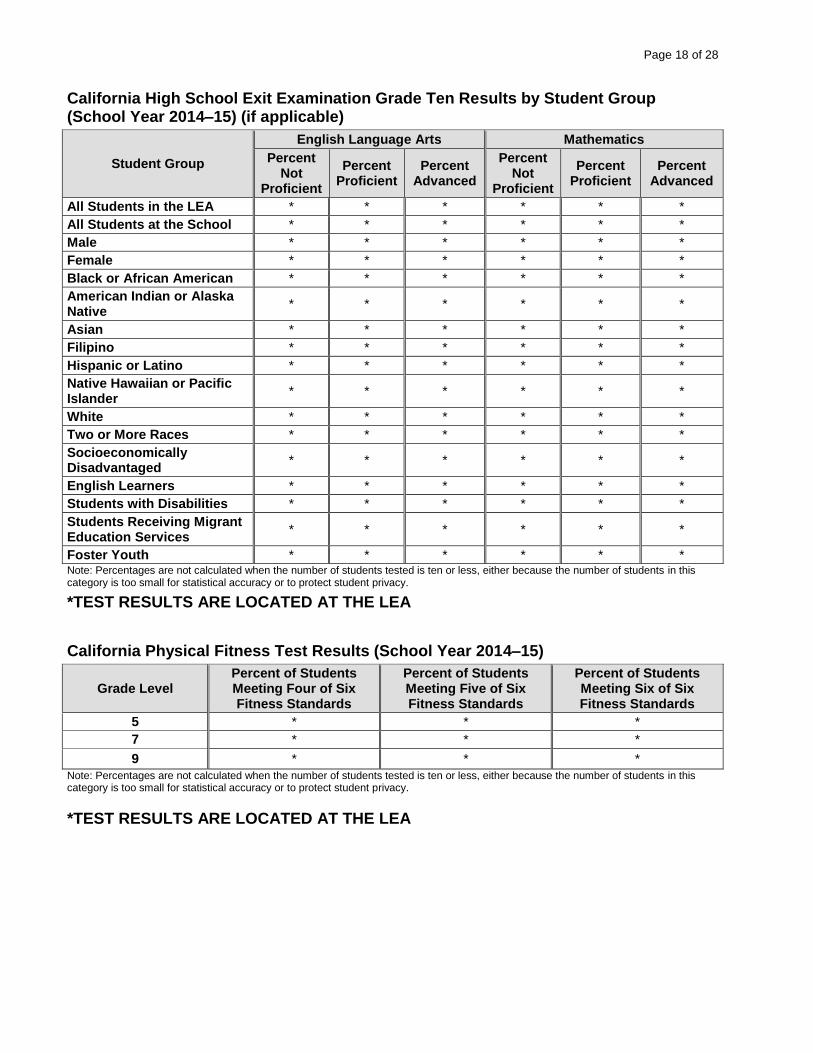
California High School Exit Examination Grade Ten Results by Student Group (School Year 2014–15) (if applicable)
Student Group
English Language Arts Mathematics
Percent Not
Proficient
Percent Proficient
Percent Advanced
Percent Not
Proficient
Percent Proficient
Percent Advanced
All Students in the LEA * * * * * * All Students at the School * * * * * * Male * * * * * * Female * * * * * * Black or African American * * * * * * American Indian or Alaska Native
* * * * * *
Asian * * * * * * Filipino * * * * * * Hispanic or Latino * * * * * * Native Hawaiian or Pacific Islander
* * * * * *
White * * * * * * Two or More Races * * * * * * Socioeconomically Disadvantaged
* * * * * *
English Learners * * * * * * Students with Disabilities * * * * * * Students Receiving Migrant Education Services
* * * * * *
Foster Youth * * * * * * Note: Percentages are not calculated when the number of students tested is ten or less, either because the number of students in this category is too small for statistical accuracy or to protect student privacy.
*TEST RESULTS ARE LOCATED AT THE LEA
California Physical Fitness Test Results (School Year 2014–15)
Grade Level Percent of Students Meeting Four of Six Fitness Standards
Percent of Students Meeting Five of Six Fitness Standards
Percent of Students Meeting Six of Six Fitness Standards
5 * * * 7 * * *
9 * * * Note: Percentages are not calculated when the number of students tested is ten or less, either because the number of students in this category is too small for statistical accuracy or to protect student privacy.
*TEST RESULTS ARE LOCATED AT THE LEA

Page 19 of 28
C. Engagement
State Priority: Parental Involvement
The SARC provides the following information relevant to the State priority: Parental Involvement (Priority 3):
Efforts the school district makes to seek parent input in making decisions for the school district and each schoolsite
Opportunities for Parental Involvement – Most Recent Year
The Stars High School administration and staff encourage parental involvement in all aspects of the high school program. Stars High School offers parents the opportunity to participate in a variety of school-related curricular activities. We encourage and promote parental support in meeting the needs of all students. Stars High School has developed a family engagement night to form partnerships with families. Families and Stars staff meet monthly. The purpose of these meetings is to inform families about our program at Stars, share concerns and generate resources in order to better support our students and their families. Parents also have full access to school staff to discuss any issues or concerns they may have. Our teachers and therapist make concerted efforts to keep in constant contact with parents through phone calls, visits home, and treatment team meetings. General opportunities for parent involvement include: 1. Participation in 30-day placement meetings 2. Annual IEP meetings 3. Open Houses and Graduation ceremonies 4. Treatment team meetings 5. Monthly family therapy sessions
State Priority: Pupil Engagement
The SARC provides the following information relevant to the State priority: Pupil Engagement (Priority 5):
High school dropout rates; and
High school graduation rates
Dropout Rate and Graduation Rate (Four-Year Cohort Rate)
Indicator School District State
2011–12 2012–13 2013–14 2011–12 2012–13 2013–14 2011–12 2012–13 2013–14
Dropout Rate 0 0 0 N/A N/A N/A 13.1% 11.4% N/A
Graduation Rate 10% 45% 50% N/A N/A N/A 78.73% 80.44% N/A
Completion of High School Graduation Requirements – Graduating Class of 2014
Group School District State
All Students 6 N/A N/A
Black or African American 33% N/A N/A
American Indian or Alaska Native 0 N/A N/A
Asian 0 N/A N/A
Filipino 0 N/A N/A

Page 20 of 28
Hispanic or Latino 50% N/A N/A
Native Hawaiian or Pacific Islander 0% N/A N/A
White 17% N/A N/A
Two or More Races 17% N/A N/A
Socioeconomically Disadvantaged 100% N/A N/A
English Learners 0% N/A N/A
Students with Disabilities 100% N/A N/A
Foster Youth 16% N/A N/A
State Priority: School Climate
The SARC provides the following information relevant to the State priority: School Climate (Priority 6):
Pupil suspension rates;
Pupil expulsion rates; and
Other local measures on the sense of safety
Suspensions and Expulsions
Rate School District State
2012–13 2013–14 2014–15 2012–13 2013–14 2014–15 2012–13 2013–14 2014–15
Suspensions 22% 30% 21% N/A N/A N/A 5.10% 4.40% N/A Expulsions 0 0 0 N/A N/A N/A 0.10% 0.10% N/A
School Safety Plan – Most Recent Year Stars High School students are supervised 100% of the time. Designated school staff monitor students at least 20 minutes before school starts, during all school activities including lunch and breaks, and for at least 15 minutes after the school day ends. A School Safety Plan covers the actions school personnel should take in emergency situations. All classrooms and the office are connected by telephone intercom. Stars High School utilizes an efficient fire and disaster protection program that requires long-range planning; a program has been developed to protect our students, staff and visitors from such emergency situations. The conduct and action of trained personnel during the first few minutes of an emergency may not only save lives and property, but will also ensure the security of our livelihood. In instituting this program, administration and supervisors will be responsible to ensure that all employees are completely informed and trained and that each employee knows his/her duties or responsibilities in the event of a fire, disaster, or other emergency. Fire drills occur quarterly The following drills occur bi-annually: earthquake, dangerous person on campus, and disaster drills. Key Elements of the School Safety Plan: 1.A Safe and Orderly environment conducive to learning 2.Disaster procedures 3.Procedures to notify teachers of dangerous persons on campus 4.Sexual Harassment policy 5.Child Abuse reporting procedures
Page 21 of 28
D. Other SARC Information The information in this section is required to be in the SARC but is not included in the state priorities for LCFF.
Adequate Yearly Progress Overall and by Criteria (School Year 2014–15)
AYP Criteria School District State
Made AYP Overall * * * Met Participation Rate – English Language Arts * * * Met Participation Rate – Mathematics * * * Met Percent Proficient – English Language Arts * * * Met Percent Proficient – Mathematics * * * Met Attendance Rate * * * Met Graduation Rate * * *
*TEST RESULTS ARE LOCATED AT THE LEA
Federal Intervention Program (School Year 2015–16)
Indicator School District
Program Improvement Status N/A N/A
First Year of Program Improvement N/A N/A
Year in Program Improvement N/A N/A
Number of Schools Currently in Program Improvement N/A N/A
Percent of Schools Currently in Program Improvement N/A N/A Note: Cells with N/A values do not require data.
Average Class Size and Class Size Distribution (Elementary)
Grade Level
Avg. Class Size
2012–13 Number of Classes*
Avg. Class Size
2013–14 Number of Classes*
Avg. Class Size
2014–15 Number of Classes*
1-20 21-32 33+ 1-20 21-32 33+ 1-20 21-32 33+
K N/A N/A N/A N/A N/A N/A N/A N/A N/A N/A N/A N/A
1 N/A N/A N/A N/A N/A N/A N/A N/A N/A N/A N/A N/A
2 N/A N/A N/A N/A N/A N/A N/A N/A N/A N/A N/A N/A
3 N/A N/A N/A N/A N/A N/A N/A N/A N/A N/A N/A N/A
4 N/A N/A N/A N/A N/A N/A N/A N/A N/A N/A N/A N/A
5 N/A N/A N/A N/A N/A N/A N/A N/A N/A N/A N/A N/A
6 N/A N/A N/A N/A N/A N/A N/A N/A N/A N/A N/A N/A
Other N/A N/A N/A N/A N/A N/A N/A N/A N/A N/A N/A N/A * Number of classes indicates how many classes fall into each size category (a range of total students per class).
Average Class Size and Class Size Distribution (Secondary)
Subject Avg. Class Size
2012–13 Number of Classes*
Avg. Class Size
2013–14 Number of Classes*
Avg. Class Size
2014–15 Number of Classes*
1-22 23-32 33+ 1-22 23-32 33+ 1-22 23-32 33+
English 12 4 N/A N/A 12 4 N/A N/A 12 3 N/A N/A
Mathematics 12 4 N/A N/A 12 4 N/A N/A 12 3 N/A N/A
Page 22 of 28
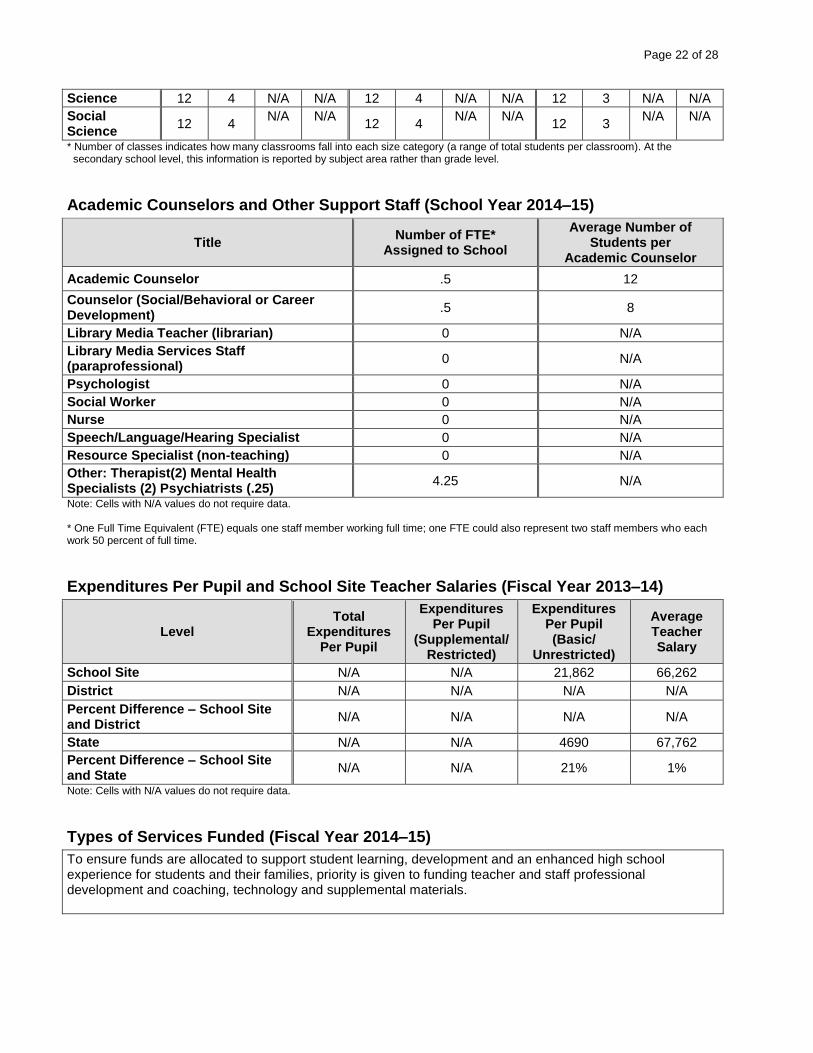
Science 12 4 N/A N/A 12 4 N/A N/A 12 3 N/A N/A
Social Science
12 4 N/A N/A
12 4 N/A N/A
12 3 N/A N/A
* Number of classes indicates how many classrooms fall into each size category (a range of total students per classroom). At the secondary school level, this information is reported by subject area rather than grade level.
Academic Counselors and Other Support Staff (School Year 2014–15)
Title Number of FTE*
Assigned to School
Average Number of Students per
Academic Counselor
Academic Counselor .5 12
Counselor (Social/Behavioral or Career Development)
.5 8
Library Media Teacher (librarian) 0 N/A
Library Media Services Staff (paraprofessional)
0 N/A
Psychologist 0 N/A
Social Worker 0 N/A
Nurse 0 N/A
Speech/Language/Hearing Specialist 0 N/A
Resource Specialist (non-teaching) 0 N/A
Other: Therapist(2) Mental Health Specialists (2) Psychiatrists (.25)
4.25 N/A
Note: Cells with N/A values do not require data. * One Full Time Equivalent (FTE) equals one staff member working full time; one FTE could also represent two staff members who each work 50 percent of full time.
Expenditures Per Pupil and School Site Teacher Salaries (Fiscal Year 2013–14)
Level Total
Expenditures Per Pupil
Expenditures Per Pupil
(Supplemental/ Restricted)
Expenditures Per Pupil (Basic/
Unrestricted)
Average Teacher Salary
School Site N/A N/A 21,862 66,262
District N/A N/A N/A N/A
Percent Difference – School Site and District
N/A N/A N/A N/A
State N/A N/A 4690 67,762
Percent Difference – School Site and State
N/A N/A 21% 1%
Note: Cells with N/A values do not require data.
Types of Services Funded (Fiscal Year 2014–15)
To ensure funds are allocated to support student learning, development and an enhanced high school experience for students and their families, priority is given to funding teacher and staff professional development and coaching, technology and supplemental materials.
To be provided by LEA
Page 23 of 28
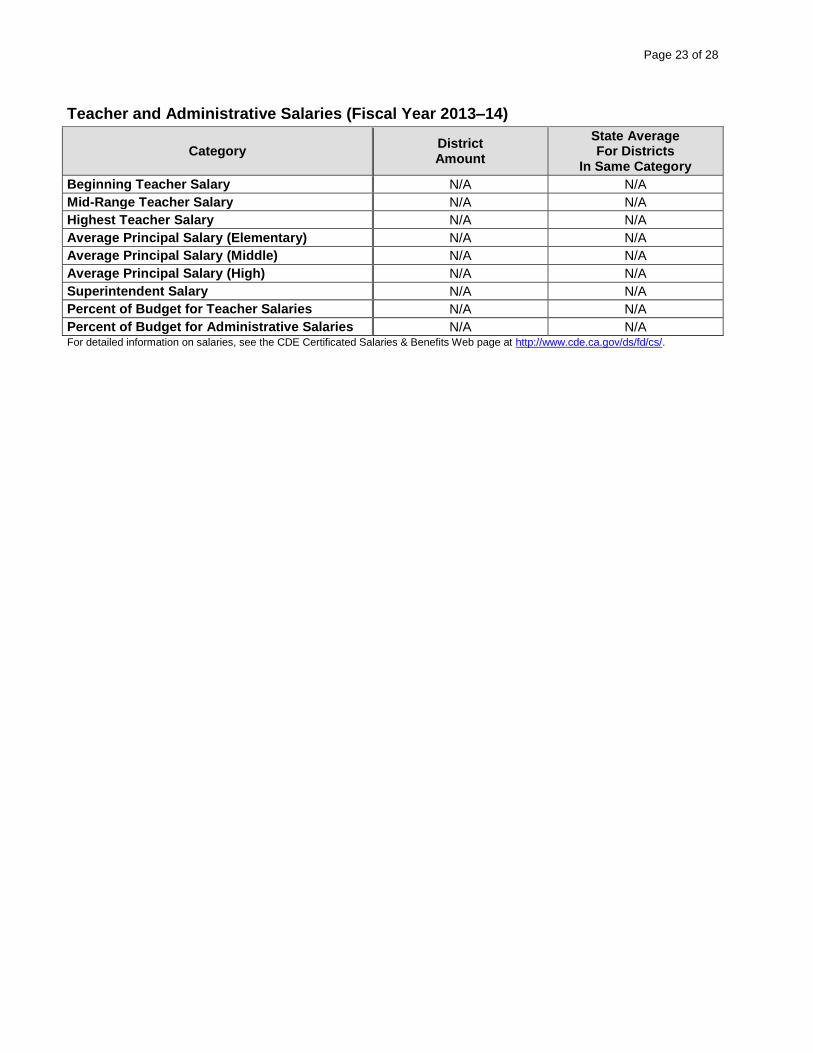
Teacher and Administrative Salaries (Fiscal Year 2013–14)
Category District Amount
State Average For Districts
In Same Category
Beginning Teacher Salary N/A N/A
Mid-Range Teacher Salary N/A N/A
Highest Teacher Salary N/A N/A
Average Principal Salary (Elementary) N/A N/A
Average Principal Salary (Middle) N/A N/A
Average Principal Salary (High) N/A N/A
Superintendent Salary N/A N/A
Percent of Budget for Teacher Salaries N/A N/A
Percent of Budget for Administrative Salaries N/A N/A For detailed information on salaries, see the CDE Certificated Salaries & Benefits Web page at http://www.cde.ca.gov/ds/fd/cs/.
Page 24 of 28
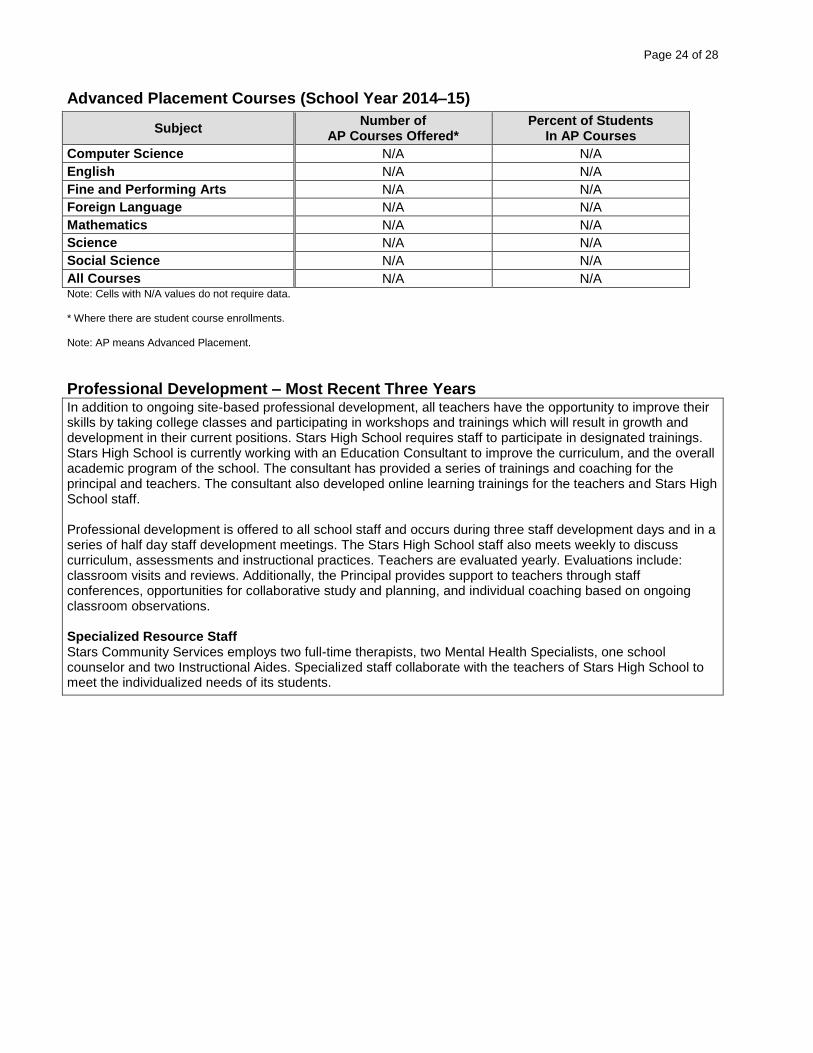
Advanced Placement Courses (School Year 2014–15)
Subject Number of
AP Courses Offered* Percent of Students
In AP Courses
Computer Science N/A N/A
English N/A N/A
Fine and Performing Arts N/A N/A
Foreign Language N/A N/A
Mathematics N/A N/A
Science N/A N/A
Social Science N/A N/A
All Courses N/A N/A Note: Cells with N/A values do not require data. * Where there are student course enrollments. Note: AP means Advanced Placement.
Professional Development – Most Recent Three Years In addition to ongoing site-based professional development, all teachers have the opportunity to improve their skills by taking college classes and participating in workshops and trainings which will result in growth and development in their current positions. Stars High School requires staff to participate in designated trainings. Stars High School is currently working with an Education Consultant to improve the curriculum, and the overall academic program of the school. The consultant has provided a series of trainings and coaching for the principal and teachers. The consultant also developed online learning trainings for the teachers and Stars High School staff. Professional development is offered to all school staff and occurs during three staff development days and in a series of half day staff development meetings. The Stars High School staff also meets weekly to discuss curriculum, assessments and instructional practices. Teachers are evaluated yearly. Evaluations include: classroom visits and reviews. Additionally, the Principal provides support to teachers through staff conferences, opportunities for collaborative study and planning, and individual coaching based on ongoing classroom observations. Specialized Resource Staff Stars Community Services employs two full-time therapists, two Mental Health Specialists, one school counselor and two Instructional Aides. Specialized staff collaborate with the teachers of Stars High School to meet the individualized needs of its students.