Embed Size (px)
Citation preview
Studies in Educational Evaluation
Studies in Educational Evaluation 28 (2002) 347-368 www.elsevier.com/stueduc
SCHOOL COMPOSITION AND ACHIEVEMENT IN PRIMARY EDUCATION: A LARGE-SCALE MULTILEVEL APPROACH
Geert Driessen
ITS - lnsfitufe for Applied Social Sciences University of Nijrnegen, the Netherlands
Introduction
In most large Western cities, the consequences of the concentration of socio- economic and ethnic underclasses in certain city sections are becoming increasingly visible (Wilson. 1987). In the USA, ghettoes are an established fact; in other countries, such as the
UK and the Netherlands. the chances of such ghettoes developing in the near future are considered very real (Ogbu, 1994; Tesser, van Praag, Dugteren, Herweijer, & van der Wouden, 1995). These developments have far-reaching consequences in numerous social
domains. The situation can be characterized as a concentration of unemployment. poverty, criminality, corruption, lack of norms and hopelessness. Education should occupy a key position with regard to improving the opportunities for exactly such groups in society. It is, however, clearly evident that the quality of the schools in such neighbourhoods often leaves much to be desired for a number of reasons. There is usually a lack of financial resources, and thus of opportunities to attract highly-qualified teachers and purchase adequate materials (Rossi & Montgomery, 1994; Tomlinson, 1997). It is difficult for teachers to motivate pupils and remain motivated themselves within a context in which hopelessness pervades and the utility of an education is simply not recognised. In addition “white flight” and “black flight” are increasingly relevant terms with regard to such neighbourhoods:
Whenever the opportunity occurs, the few remaining non-minorities flee to other neighbourhoods and schools which present better perspectives for their children; the better
019 l-49 1 X/02/$ - see front matter 0 2002 Published by Elsevier Science Ltd. PII: SOlSl-491X(02)00043-3
348 G. Driessen /Studies in Educational Evaluation 28 (2002) 347-368
situated ethnic minorities are also increasingly doing the same (Bagley. 1996; Gorard.
1999). The assumption in such cases is that, to the extent that a school is visited by more disadvantaged pupils, an additional negative effect is exerted on the achievement of the pupils. in excess of the individual effects of social milieu and ethnic origin. In other words.
the social and ethnic pupil composition of schools has important consequences for educational opportunities. The exact extent to which this actually holds. however. is not at all clear.
Research on the effects of the composition of a student population on the
achievement of individual students has a long tradition. Thrupp (1995) distinguishes four phases. closely linked to the political. economic and social context and the methodological
state-of-the-art at a particular point in time. In the 1960s. the influential report by Coleman.
Armor. Crain. Miller, Stephan. Walberg, and Wortman (1966) concluded that rather than racial composition, it was social class and prior achievement composition of schools that made the difference. In the 1970s people’s trust in the compensatory role of education
largely waned. Jencks et al. (1972) concluded that the influence of socio-economic composition on a pupil’s level of achievement was very small. In the 1980s. the school- effectiveness research movement published a positive message: Schools do make a difference. A link was made between school composition and level of achievement via school climate. Since the end of the 1980s renewed attention has been paid to the influence of school composition characteristics within the framework of school effectiveness
research, largely as a result of the development of multilevel analytic computer programmes.
In research on school composition, two different approaches can be distinguished.
namely. composition according to social milieu and composition according to
ethnicity/race. While the two approaches are strongly related, they are distinct (Jencks & Mayer, 1990: Thrupp. 1999). In the USA, school composition research has always been strongly related to issues of segregation and desegregation. As a consequence, much of the American research has been aimed at comparing more or less ethnically homogeneous schools with ethnically heterogeneous schools (segregated vs. integrated schools) and black versus white pupils (Bankston & Caldas, 2000; Entwisle & Alexander, 1992; Rivkin. 2000: Rumberger & Willms, 1992). Outside the USA, less research has been conducted along these lines. Thrupp (1995) refers with reference to the UK to “narrow sampling” or
researchers studying predominantly homogeneous, socially disadvantaged schools rather than more widely representative samples that could highlight the role of contextual factors
to a greater degree. A narrow approach also characterizes some of the relevant Dutch studies (e.g., Everts, Golhof, Stassen, & Teunissen, 1986) although the number of studies of ethnic school composition in the Netherlands is quite limited because ethnic minorities have only entered the educational system in large numbers during the past few decades
(Driessen, 2000). Research into the effects of school composition has produced a variety of
conclusions. Review studies by Cook (1984), Jencks and Mayer (1990) and Thrupp (1995) have shown the results of such research to strongly vary: Sometimes effects are found and sometimes not. In so far as effects are encountered, moreover, no general pattern can be found to hold for all school outcomes (i.e., test scores, school attendance and graduation). In addition to this, the effects differ depending on the aspects of composition considered.
G. Driessen /Studies in Educational Evaluation 28 (2002) 347-368 349
Research by Caldas and Bankston (1997) has shown the socio-economic status of the pupils in a school, in general, to be almost as strong a predictor of achievement as the specific socio-economic status of an individual pupil. In other studies, the same researchers demonstrated a strong effect of racial concentration on academic outcomes for both white and black pupils (Bankston & Caldas, 1996; Caldas & Bankston, 1998). On the basis of further analyses, these effects were attributed to the strong concentration of pupils from single-parent families within the relevant schools (Caldas & Bankston, 1999). Other studies show, however, no effects of racial composition; in addition, no effects of family configuration are observed. It is nevertheless pointed out that differential effects may occur; that is, the effect of individual pupil background is not the same in all school contexts (Caldas & Bankston, 1998; Entwisle & Alexander, 1992; Rivkin, 2000). These conflicting results may stem from, among other things, differences between the subject populations, the breadth and composition of the samples, the variables included and the variables controlled for in the analyses. The fact that social and ethnic/race composition characteristics are strongly related to each other, as well as the inadequacy of the analytic techniques typically employed may also play a role (Jencks & Mayer, 1990; Rivkin, 2000).
A lack of clarity thus exists not only with regard to the occurrence of composition effects but also to just how such effects should be explained when found (Nash, 2001; Thrupp, 1998, 1999). Some possible explanations will be considered here; for more extensive reviews, the reader is referred to Westerbeek ( 1999) and Guldemond (1994). One important type of explanation draws upon resource theory. Of particular concern is the so- called cultural and social capital available to individuals (Bourdieu & Passeron, 1977; Coleman, 1988; Putnam, 1995), but also such variants as linguistic capital (Carrington & Luke, 1997; Driessen, 2001). The pupils themselves can also be construed as resources to the extent that they learn from each other. Such parental characteristics as race, education and home language influence not only parents’ own children but also the educational performance of these children’s schoolmates. Ethnic minority pupils generally have fewer resources available to them than non-minority pupils. When numerous minority children like this attend a single school, the pupils in the school are obviously placed in a position to benefit less from the resources or “capital” of other pupils. Pupils’ language development in such a situation can also be inhibited by a lack of contact with the majority language or the presence of extreme ethnic and linguistic diversity (Entwisle & Alexander, 1994). Another type of explanation emphasises the influence of the peer group and also makes a link with the assumption that pupils are resources. Caldas and Bankston (1997) argue that schoolmates create their own social context independent of individual background and that this social context strongly influences pupils’ individual academic achievement. The relevant factors in this process are shared beliefs, habits and peer pressure not to excel in school, for example (Ogbu, 1988; Rossi & Montgomery, 1994). The peer group can affect individual pupil performance not only directly but also indirectly via teachers’ perceptions of the peer group (e.g., teachers’ experiences with the group and their stereotypes of the group). Negative perceptions can lead teachers to have artificially low expectations of pupils and thereby create a self-fultilling prophecy resulting in underachievement.
In the remainder of this article, the results of an empirical study among Dutch primary school children will be presented. The central question is: What are the effects of socio-ethnic school composition on the language and math achievement of pupils? With

3.50 G. Driessen /Studies in Educational Evaluation 28 (2002) 347-368
respect to much of’ the previous research, the present study has obvious added value: It is large-scale in nature. makes use of recent national statistics and addresses a period of
education which has not received much attention to date ~ namely. the primary school period. In addition to this. a combination of social milieu and ethnicity variables is analysed along with whether or not the effects of these variables differ depending on the categories of pupils being distinguished. In addition. appropriate analytic techniques are employed, namely multilevel analysis. and the net effects of school composition after controlling for
other factors is calculated.
Method
‘l‘he data analysed here come from the Dutch cohort study “Primary Education”
(PRIMA). As part of this research prqject. data were collected on primary-school pupils, their parents. their teachers and the relevant school administrators every two years since the 1994195 school year with the aid of tests and questionnaires. The prqject has involved a total of 700 primary schools which is almost 10% of the total number of Dutch primary
schools, and some 60.000 grade levels 2, 4, 6 and 8 pupils (Driessen & Vierke, 1999). The PRIMA project is characterized by an overrepresentation of schools with a relatively large
number of minority pupils. which makes it possible to reliably estimate the systematic effects of‘ factors pertaining to ethnicity. In the present analyses, use was made of the results from the third PRIMA measurement taking place in the 1998/99 school year (Driessen. van Langcn, & Vierkc. 2000). The analyses involved grade levels 4 and 8. as these grades encompass the initial phase of formal language and math instruction, on the one hand. and the last year of primary education. on the other hand.’ The decision to refer
to these groups is in keeping with the recent discussion in which researchers indicated that the chances of finding effects of socio-economic status and ethnicity are probably greater with younger pupils than with older pupils. Most of the relevant research. however. has becll conccntratcd on secondar), schools while the rates ol‘cognitive growth and effects of
school composition can be expected to be greater in the early school years (Entwisle & Alexander, 1994: .lcncks & Mayer. 1990). The 4th and 8th grade analysts involved a total
01‘ 14.334 and 12.630 students. respectively. drawn from a total of 583 primary schools.
Three types of pupil level variables were used in the analyses: effect variables (language and math proficiency), predictor variables (parental ethnicity and education, pupil’s sex and age) and a control variable (intelligence). The variables are described below.
Lunguage proficienq,. Dutch language proficiency was measured using two tests developed by the Dutch National Institute for Educational Measurement (CITO). The tests indicate the general level of Dutch language proficiency and consist of 60 and 64 multiple- choice items for Grades 4 and 8. respectively. The tests involve three types of exercises: morphological. syntactic and semantic. The reliabilities of the tests (K-R 20) were .85 and .86. respcctivcly. With the application of a calibration procedure, the items from the two
G. Driessen /Studies in Educational Evaluation 28 (2002) 347-368 351
tests were resealed in such a manner that they constituted a one-dimensional metric
proficiency scale (Vierke. 1995). Math proficiency. General math proficiency was also measured using tests
developed by CITO. The tests consist of 58 and 120 multiple-choice items for Grades 4 and 8, respectively. Subcomponents of the tests include, among other things: numbers and calculations, measurement. time and money. The reliabilities of the tests (Cronbach’s a)
were .95 and .97, respectively. The scores on these tests were also resealed to constitute a one-dimensional metric proficiency scale.
Pa~enral ethici~~. To determine parental ethnicity. the birthplace of the mother was
used or, when this information was lacking, the birthplace of the father. On content grounds. four categories were distinguished: 1) Dutch. 2) Surinamese or Antillean, 3)
Turkish or Moroccan. and 4) other minority background. The latter category includes a mixture of Western and non-Western immigrants.’
Parental education. Education was taken to be an indicator of social milieu. The highest level of education within the family. and thus for the father or mother, was used. Four categories were distinguished: 1) primary education, 2) junior secondary vocational education, 3) senior secondary vocational education, and 4) higher vocational education
and university education. Sex. Boys were coded 1) and girls 2). Age. A relative measure normed according to form was taken to provide a rough
indicator of repeating a grade or delayed entrance by immigrant children. Three categories were distinguished: 1) the “norm” or a maximum of six months older, 2) more than six months older. and 3) more than a year older.
Intelligence. This was measured using two non-verbal intelligence tests with the number of correct answers summed to a total sc0re.j Non-verbal tests were used to avoid bias in relation to ethnic minority pupils who don’t speak Dutch well. The test for Grade 4 included 37 multiple-choice items: the test for Grade 8 included 34 multiple-choice items. The reliabilities (Cronbach’s CY.) were .84 and .75, respectively. The score on the
intelligence test was used to control for different basic capacities and starting skill levels across pupils (cf. Rumberger & Willms, 1992).
School Level Variables
Tvvo school composition variables were used: socio-ethnic school composition, and
ethnic diversity. The variables are described below. Sclzool composition. Within the PRIMA prqject, a school composition variable was
constructed on the basis of the ethnicity and education of the parents4 The following categories were distinguished for this variable:
. schools with at least 50% Turkish or Moroccan children of parents with no more than a junior secondary vocational education [label used in tables: -jr. voc., T/M];
. schools with at least 50% ethnic minority children of parents with no more than a junior secondary vocational education (not only Turkish and Moroccan but all ethnic minority children) [jr. voc., minority];

352 G. Driessen /Studies in Educational Evaluation 28 (2002) 347-368
. schools with at least 50% non-minority (i.e., Dutch) children of parents with no more than ajunior secondary vocational education br. voc., non-minority];
. schools with at least 50% children of parents with a senior secondary vocational education [sr. voc.];
. schools with at least 50% children of parents with a higher vocational or university education [higher educ.];
. schools with a heterogeneous, relatively privileged and predominantly non-minority school population: at least 90% non-minority children of parents with more than
primary education [privileged]; . schools with a very heterogeneous school population including both underprivileged as
well as privileged and both minority as well as non-minority pupils [heterogeneous].
Ethnic diversity. In addition to the school composition variable. the number of different ethnic groups was also included as a predictor variable at the level of the school.
This provides an indicator of the heterogeneity of the school with regard to ethnic origin and thereby a measure of the linguistic and cultural diversity characteristic of the school. In ethnically heterogeneous schools, the language development of pupils may be particularly hindered by such diversity (Entwisle & Alexander, 1994). Children have less contact with
the ma.jority language and teachers may also have marked difficulties coordinating their pedagogical approach with such diversity. On the other hand it could be argued that in
ethnically heterogeneous schools children are forced to speak Dutch as a li~guafranca; the question remains, however. how well they speak Dutch. This variable could range from 1 to 10.
Results
Descriptive Analyses
To start with, the distributions of and relations between the various pupil characteristics were examined. In Table 1, the distributions for the four predictor variables
are presented; in Table 2. the relations of the predictor variables with the intelligence, language and math proficiency scores of the pupils are presented.
Table 1: Distributions of Ethnicity. Education, Sex and Age, by Grade (in %)
Ethnicity Education
Grade Dutch S/A T/M other primary jr. voc. sr. voc. higher
4 69 s 17 9 15 34 31 20
8 72 6 14 8 16 35 30 19
Grade
Sex Age boys girls norm >112 yr. >I yr. N= 100%
4 50 50 57 40 3 14,334
8 49 Sl 56 40 5 12,630
G. Driessen / Studies in Educational Evaluation 28 (2002) 347-368 353
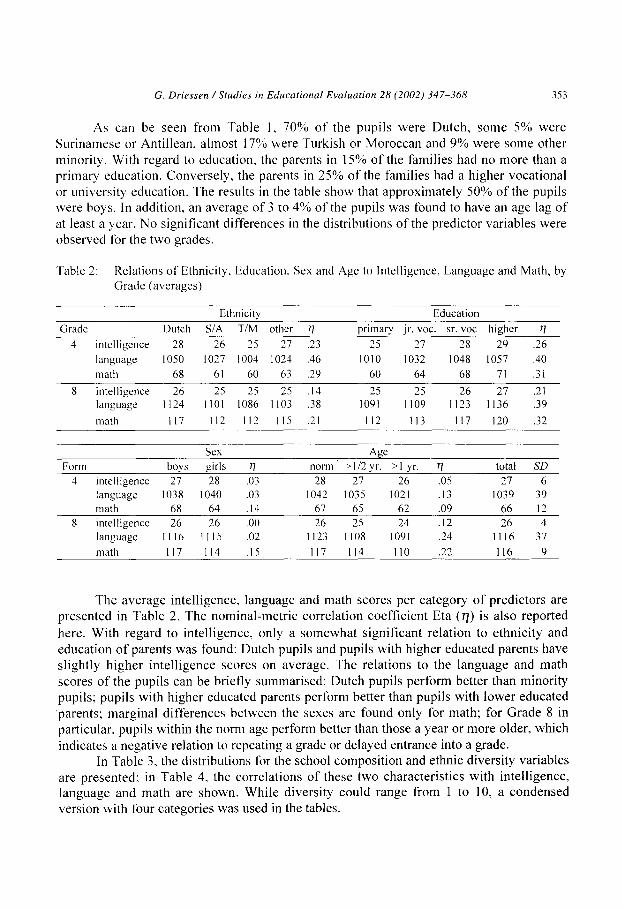
As can be seen from 'Fable 1, 70% o f the pupi l s were Dutch, some 5% were Sur inamese or Ant i l lean, a lmost 17% were Turkish or Moroccan and 9% were some other minori ty . With regard to educat ion, the parents in 15% o f the famil ies had no more than a pr imary educat ion. Converse ly , the parents in 25% o f the famil ies had a h igher vocat ional or universi ty educat ion. The results in the table show that approximate ly 50% o f the pupi ls were boys. In addit ion, an average o f 3 to 4% o f the pupils was fbund to have an age lag o f at least a year, No signif icant differences in the distr ibut ions o f the predictor var iables were observed tbr the two grades.
"[able 2: Relations of Ethnicity, Education, Sex and Age to Intelligence, Language and Math, by Grade (averages)
Ethnicity Education Grade Dutch S/A T/M other r/ primary jr. voc. sr. voc higher r/
4 intelligence 28 26 25 27 .23 25 27 28 29 .26 language 1050 1027 1004 1024 .46 1010 1032 1048 1057 .40 math 68 61 60 63 .29 60 64 68 71 .3 I
8 intelligence 26 25 25 25 .14 25 25 26 27 .2l language 1124 I I01 1086 1103 .38 1091 1109 1123 1136 .39 math 117 112 112 115 .21 112 113 117 120 .32
Sex Age Form boys girls r/ norm >1/2 yr. >1 yr. 7/ total SD
4 intelligence 27 28 .03 28 27 26 .05 27 6 language 1038 1040 .03 1042 1035 1021 .13 1039 39 math 68 64 .14 67 65 62 .09 66 12
8 intelligence 26 26 .00 26 25 24 .12 26 4 language 1116 1115 .02 1123 1108 1091 .24 1116 37 math 117 114 .15 117 114 II0 .22 116 9
The average intel l igence, language and math scores per ca tegory o f predic tors are presented in Table 2. The nomina l -met r i c correla t ion coeff ic ient Eta (r/) is also repor ted
here. Wi th regard to in te l l igence , only a somewhat s igni f icant re la t ion to e thnic i ty and educat ion o f parents was Ibund: Dutch pupils and pupils with higher educated parents have s l ight ly h igher in te l l igence scores on average. The re la t ions to the l anguage and math scores o f the pupi l s can be brief ly summarised: Dutch pupi ls per form bet ter than minori ty pupils; pupi l s with higher educated parents perform better than pupi ls with lower educated 'parents; margina l d i f ferences be tween the sexes are found only for math; for Grade 8 in part icular, pupi ls within the norm age perform better than those a year or more older, which
indicates a negat ive relat ion to repeat ing a grade or delayed entrance into a grade. In Table 3, the dis tr ibut ions tbr the school composi t ion and ethnic divers i ty var iables
are presented; in Table 4, the corre la t ions o f these two character is t ics wi th in te l l igence , l anguage and math are shown. Whi le d ivers i ty could range from 1 to 10, a condensed vers ion with four categories was used in the tables.
354 G. Driessen / Srudies in Educarinnal Evaluation 2S (2002) 347-368
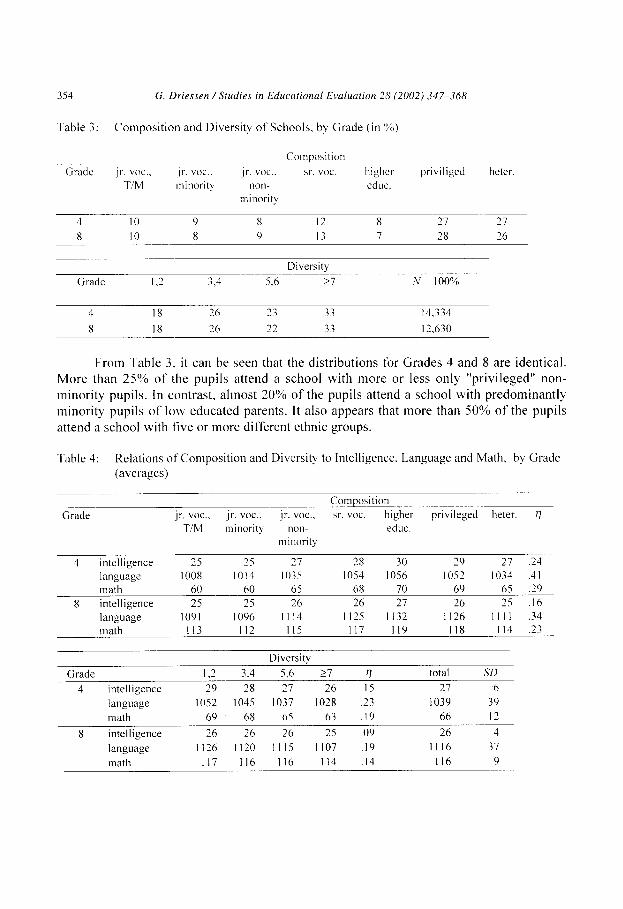
Table 3: Composition and Diversity of’ Schools, by Grade (in ‘%)
Grade ,jr. voc.. .jr. vw.. T/M Ininorit!
Composition
_jr. voc.. sr. \ioc. higher priviliged heter.
non- cd uc.
minorit)
4 IO 9 8 I2 8 27 21
8 I 0 8 ‘1 13 7 28 26
Grade I.2 3.4 Diversity
5.6 27 N= 100%
4 I8 26 2 3 33 14.334
8 IS 26 22 33 12,630
From Table 3. it can be seen that the distributions for Grades 4 and 8 are identical. More than 25% of the pupils attend a school with more or less only “privileged” non-
minority pupils. In contrast, ahnost 20% of the pupils attend a school with predominantly minority pupils of low educated parents. It also appears that more than 50% of the pupils attend a school with five or more different ethnic groups.
Table 4: Relations of Composition and Diversity to Intelligence. Language and Math. by Grade
(averages)
Grade Composition
jr. voc.. jr. voc.. jr. voc.. sr. voc. higher privileged heter. q T/M minorit> non- educ.
minority
4 intelligence 25 2s 21 28 30 29 27 .23
language I008 1014 1035 1054 1056 1052 I034 .3l
math 60 60 65 68 70 69 65 29
8 intelligence 25 25 26 26 27 26 25 .I6
language 1091 IO96 1114 II25 1132 II26 III1 .34
math I I3 II2 II5 II7 II5 II8 II4 .23
Diversity
Grade I,2 3.4 5.6 27 rl total sn
4 intelligence 29 28 27 26 .I5 27 6
language 1052 104.5 1037 1028 .23 1039 39
math 69 68 65 63 .I9 66 12
8 intelligence 26 26 26 25 .09 26 4
language II26 II20 III5 II07 .I9 III6 37
math II7 II6 II6 II4 .I4 II6 9
G. Driessen /Studies in Educational Evaluation 28 (2002) 347-368 355
Table 4 shows that there are school composition differences with respect to intelligence, language and math. There are also differences with respect to ethnic diversity,
although here the relations are weaker. Largest are the differences for language, math and - less - intelligence. The results for Grade 8 are in the same direction as for grade 4 although the relations for the former are generally not as strong as for the latter. This finding supports the expectations of both Entwisle and Alexander (1994) and Jencks and Mayer (1990). The results also show that a metrical quantification can be obtained by placing the composition category heterogeneous between jr. voc., minority and jr. voc.,
nonminoriTy. In the presentation of the multilevel analyses, this order will therefore be adhered to.
Multilevel Analyses
Having provided a descriptive overview of the distributions and relations of the relevant variables, the results of an analysis in which the characteristics are multivariately related to each other will now be presented. For this purpose, use was made of multilevel analyses. With the aid of this technique, a distinction can be made between variance explanations at different levels. The idea behind this is that the variation in, for example,
pupil performance is situated in part at the pupil level and in part at the school level. Variance at the school level is usually referred to as systematic variance. With school
variables, then, only variation in performance at the level of the school can be explained. In such a manner, moreover, a school variable explaining only a small portion of the total variance in a regular regression analysis with school and pupil variables can be an important predictor when the non-systematic (i.e., pupil level) portion of the variance is omitted (cf. Snijders & Bosker, 1999).
The analyses involve the testing of a series of models. These models are constructed
stepwise, as follows:
To start with, a so-called null model was calculated. This model is also called the empty model because it contains no explanatory variables. It provides the basic partition of the
variability in the data between the two levels. The results of this model show which part of the total variance in the effect measures is due to pupils (within-school variance) and
which to schools (between-schools variance). Thereafter, in Model 1, ethnicity was entered in the form of three dummy variables, with “Dutch” used as the reference group. In Model 2, education, sex and age were entered as “correction factors.” In Model 3, intelligence was added as a control for basic starting capacities. In Models 4, 5 and 6, the school level variables of composition and diversity were
added; in Model 4, only composition; in Model 5, only diversity; in Model 6, both variables. For the dummy school-composition variables, the category “privileged: at least 90% non-minority children of parents with more than primary education” was used as the reference category. In Model 7, the interactive effects of composition and diversity with ethnicity and education were finally added. On the basis of this information, it could be determined
3% G. Driessen /Studies in Educational Evaluation 28 (2002) 347-368
whether the effects found in Model 3 of ethnicity and education respectively differ for scl~ools with a different composition or diversity.
In the tables. the unstandardised regression coefficients (B) and the accompanying
standard errors (SE) are rcportcd. In addition. the degree to which the estimates significantly deviate from zero is indicated (under p). Significant effects are indicated with an asterisk (*) while highly signilicant effects are indicated with two asterisks (**).’
The tables are constructed as follows. For the null model (“0 model”). the percentage of variance in the test scores linked to the pupil and school level is reported in the section entitled “variance components”. For the following models. which part of the variance is
cxplaincd by the predictors that have been entered is then calculated for each of the two Icvcls. ‘l‘hesc variance explanations are first calculated with respect to the null model. Ihcrcaftcr. the explanation for Model 1 is subtracted from the explanation for Model 2.
which yields the extra variance explained by Model 2 after entering education, sex and age.
For Model 3. the sum of the variance explained by Models I and 2 is subtracted from Model 3 to determine the amount of extra variance explained by the addition of intelligence under Model 3. For Models 4, 5 and 6, the amount of additional variance explained is calculated with rcspcct to Model 3: Ibr Model 7, the amount is calculated with respect to Model 6.
The values under ~‘/clf’are used to test whether one model significantly deviates
from another model: Model 1 is tested with respect to the null Model: Model 2 is tested
with respect to Model 1; Model 3 is tested with respect to Model 2: Models 4, 5 and 6 are tested with respect to Model 3; and Model 7 is tested with respect to Model 6. Significant effects are marked with *, highly significant effects with ** .h
The control variable of intelligence is divided by 10 so that the regression coefficient indicates the number of points of change in the cftcct measure for an increase of 10 points in intclligencc scores. This is also done for the school variable diversity so that the
regression coefficient indicates the number of points of change between schools with I ethnic group as compared to schools with a maximum number of 10 ethnic groups. In all of
the tables. the estimate for the general average of the effect measures has been omitted because these. as a result of centering the predictors around their means (i.e.. the individual score minus the grand mean). are equivalent to the averages presented in Table 4 under “total.”
The analysts of Model 7 showed that none of the interaction effects was significant. Because WC do not want to report a long series of these nonsignificant effects (a total of 28 here). Model 7 was omitted from the tables.
The results of the analyses of the Grade 4 data with language achievement constituting the variable to be explained are presented below. In the upper part of Table 5, the results at the pupil level are presented: in the lower part. the results at the school level arc presented.
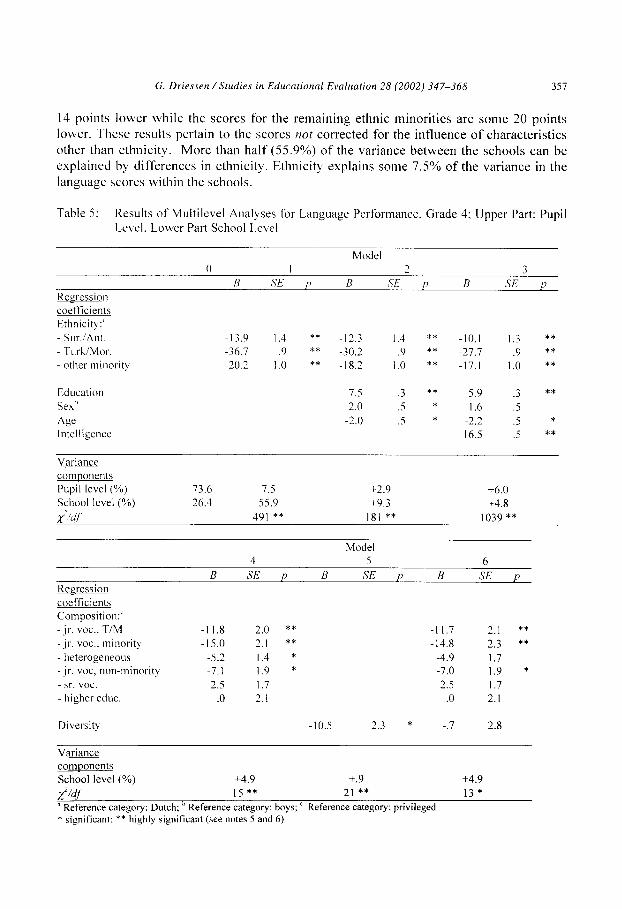
Prom the information on the null model in the upper part of Table 5. it can be deduced that some 26.4% of the variance in the language scores occurs at the school level. From the information on Model 1, it can be seen that the language scores for the Turkish and Moroccan pupils are ahnost 37 points lower on average than those for the Dutch pupils (i.e., the rcfcrcnce category); the scores for the Surinamese and Antillean pupils are almost
G. Driessen /Studies in Educational Evaluation 28 (2002) 347-368 351
14 points lower while the scores for the remaining ethnic minorities are some 20 points lower. These results pertain to the scores not corrected for the influence of characteristics other than ethnicity. More than half (55.9%) of the variance between the schools can be explained by differences in ethnicity. Ethnicity explains some 7.5% of the variance in the language scores within the schools.
Table 5: Results of Multilevel Analyses for Language Performance, Grade 4; Upper Part: Pupil Level. Lower Part School Level
Model
Keeression
coefficients
Ethnicity:”
- Sur./Ant.
TurLiMor. -
- other minority
0 I 2 3
n SE 1’ I! SE p B SE p
-13.9 1.4 ** -12.3 1.4 ** -10.1 1.3 **
-36.1 .9 ** -30.2 .9 ** -27.7 .9 **
-20.2 I.0 ** -18.2 1.0 ** -17.1 1.0 **
Education 7.5 .3 ** 5.9 .3 **
Sex” 2.0 .s * 1.6 .5 Age -2.0 .5 * -2.2 .5 *
Intelligence 16.5 .5 **
Variance
components
Pupil level (%)
School level (%)
X’kQ~
73.6 7.5 i2.9 +6.0
26.4 55.9 +9.3 +4.s
491 ** I81 ** 1039 **
Reqression
coefficients
Composition:‘
-jr. VOL. TIM
-jr. voc.. minority
- heterogeneous
-jr. voc. non-minority
- sr. voc.
- higher educ.
Model
4 5 6
B SE (, B SE p B SE p
-11.8 2.0 ** -11.7 2.1 **
-15.0 2.1 ** -14.8 2.3 **
-5.2 1.4 * -4.9 1.7
-7.1 I.9 * -7.0 1.9 *
2.5 I.7 2.5 I.7
.o 2.1 .O 2.1
Diversity -10.5 2.3 * -.7 2.8
Variance
comuonents
School level (%) i4.9 i.9 +4.9
2 /df I5 ** 21 ** I3 *
a Reference category: Dutch; ’ Reference category: boys; ’ Reference category: privileged * significant: ** highly significant (see notes 5 and 6)

358 G. Driessen /Studies in Educational Evaluation 28 (2002) 347-368
In light of the fact that ethnicity correlates with the other pupil level predictors (such as parental education). keeping the other predictors constant as in Model 2 somewhat
reduces the differences relative to the Dutch pupils but they remain very significant. Of the three additional predictor variables in Model 2, parental education has the strongest partial
correlation with language: one category higher in terns of education is associated with a 7.5 point increase in the language score. that is, on average within the ethnic groups and controlling for any sex and age differences between the categories of parental education. Parental education, sex and age together add 2.9% to the amount of variance explained at
the pupil level and 9.3% to the amount of variance explained at the school level. While a weak effect of sex, with girls scoring an average of 2 points higher than
boys, occurs on average within the ethnic groups when parental education and age are controlled for, the difference is nonsignificant after intelligence is also taken into
consideration in Model 3. The remaining effects also decline in magnitude with the inclusion of intelligence in the Model. Intelligence adds 6% and 4.8%, respectively, to the
amount of variance explained at the pupil and school levels. In the lower part of Table 5, the results at the school level are presented. Inspection
of the results for Model 4 shows, particularly for schools with more than 50% minority pupils with lower educated parents, clearly lower scores for language when compared to
schools with predominantly non-minority, privileged pupils: schools with numerous Turkish and Moroccan pupils with lower educated parents score an average of 11.8 points
lower; for similar schools with predominantly other minority pupils, a difference of as much as 15 points is detected. It is important to note that these effects are still present even after a number of the factors which account for the compositional differences between the schools are controlled for: namely, ethnic&y. parental education, sex, age and intelligence.
The results for Model 5 show ethnic diversity to have a weak effect. In schools with 10 different ethnic groups compared to schools with only one ethnic group, the pupils
obtain a language score that is 10.5 points lower on average. Given that school composition and diversity necessarily correlate, schools with only
Dutch pupils fall more or less by definition within the “privileged” category, And given that the correlation of school composition with language achievement is stronger than the
correlation of diversity with language achievement, the independent effect of diversity in Model 6 is minimal. School composition and diversity together add 4.9% to the amount of
variance found to be explained in the Models up to and including Model 3. Together, the pupil level variables explain 7.5 + 2.9 + 6.0 = 16.4% of the variance
observed at the pupil level and 55.9 + 9.3 + 4.8 = 70% of the variance at the school level. The school level variables explain 4.9%. In total (16.4 * 73.6 = 12.1%) + (74.9 * 26.4 =
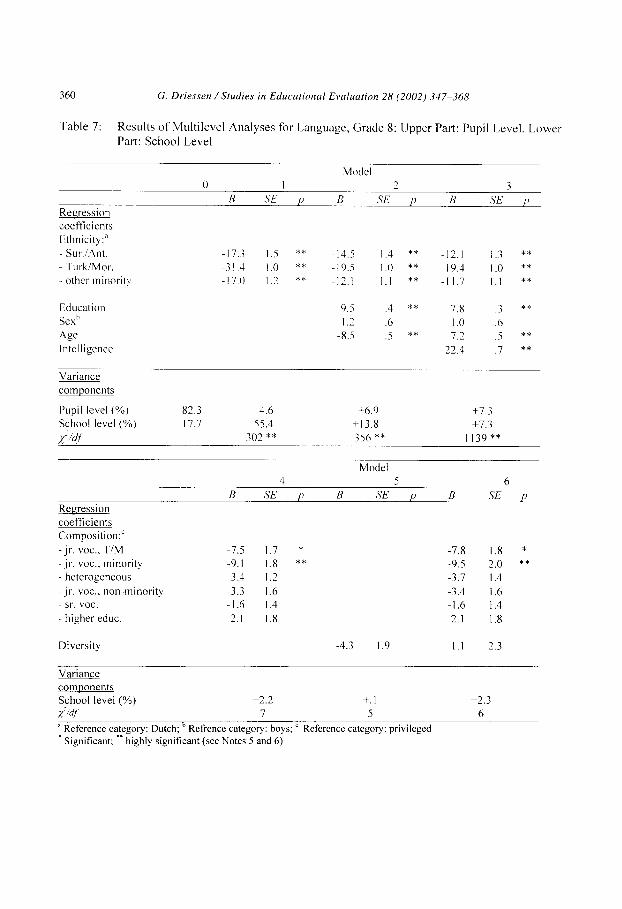
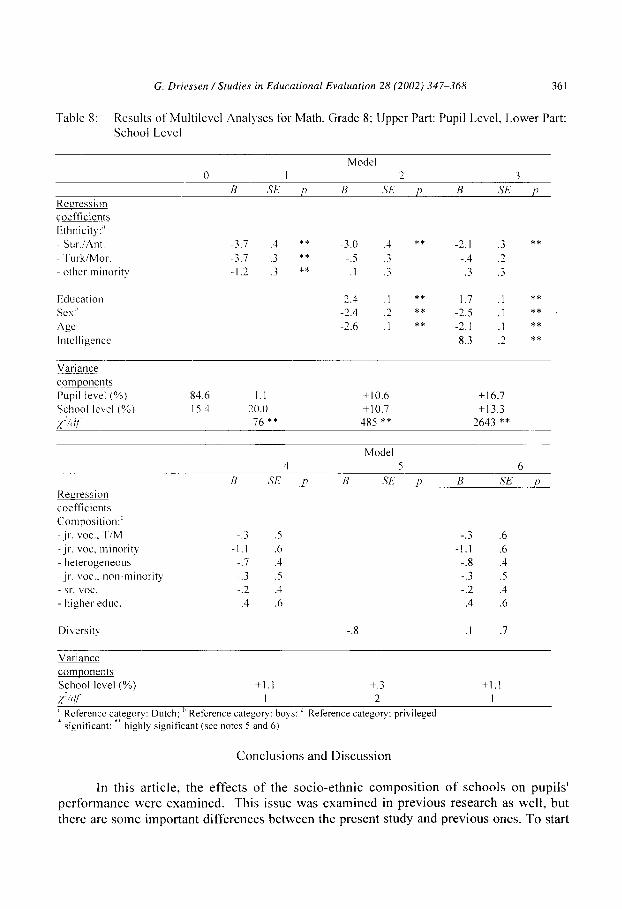
19.8%) = 3 1.9% of the variance in language achievement is explained. In Tables 6, 7 and 8, the results of the analyses for the Grade 4 math scores and
grade 8 language and math scores are presented. In summary, the statistics in the tables clearly show the effect of school composition
to be reasonably strong for the prediction of the language scores of the pupils in Grade 4, rather limited for the prediction of Grade 4 math scores and Grade 8 language scores, and non-significant for the Grade 8 math scores. When intelligence and individual background characteristics are taken into consideration, the analyses still show a particularly negative
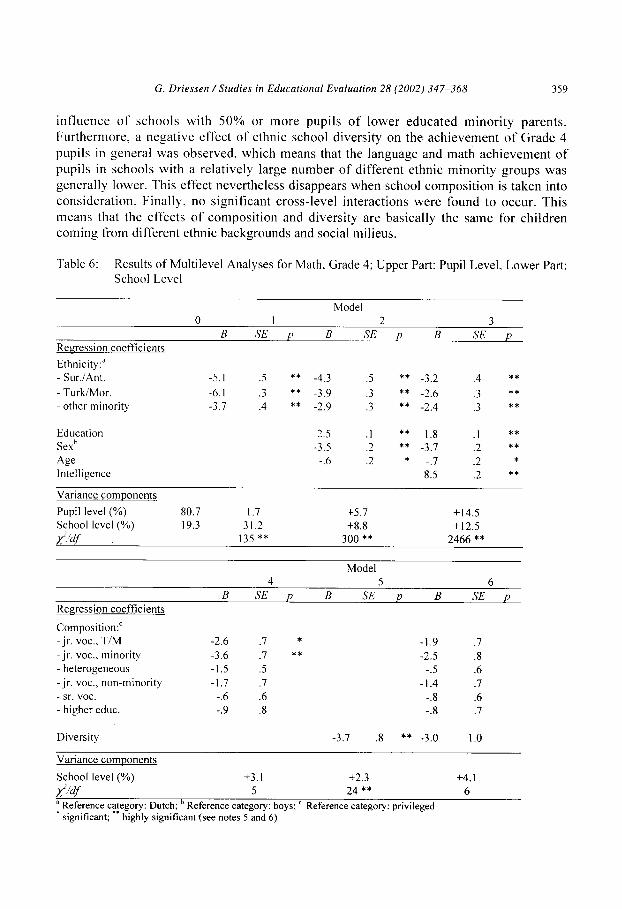
G. Driessen /Studies in Educational Evaluation 28 (2002) 347-368 359
influence of schools with 50% or more pupils of lower educated minority parents. Furthermore. a negative effect of ethnic school diversity on the achievement of Grade 4
pupils in general was observed, which means that the language and math achievement of pupils in schools with a relatively large number of different ethnic minority groups was generally lower. This effect nevertheless disappears when school composition is taken into consideration. Finally, no significant cross-level interactions were found to occur. This means that the effects of composition and diversity are basically the same for children coming from different ethnic backgrounds and social milieus.
Table 6: Results of Multilevel Analyses for Math, Grade 4; Upper Part: Pupil Level, Lower Part: School Level
Regression coefficients
Ethnicity!
- Sur./Ant.
- TurkiMor.
- other minority
Model
0 I 2 3
B SE p B ,TE p B SE p
-5.1 .5 ** -4.3 .5 ** -3.2 .4 **
-6.1 .3 ** -3.9 .3 ** -2.6 .3 **
-3.7 .4 ** -2.9 .3 ** -2.4 .3 **
Education 2.5 .I ** 1.8 .I **
Sex” -3.5 .2 ** -3.7 .2 ** Age -. 6 .2 * -.7 .2 *
Intelligence 8.5 .2 **
Variance components
Pupil level (%) 80.7 1.7 i5.7 +14.5
School level (%) 19.3 31.2 +8.8 +12.5
d/d! . I35 ** 300 ** 2466 **
Regression coefficients
Composition:c
-jr. voc., T/M
-jr. voc., minority
- heterogeneous
-jr. voc., non-minority
- sr. voc.
- higher educ.
B
-2.6
-3.6
-1.5
-1.7
-. 6
-. 9
Model
4 5 6
SE p B SE p B SE p
.I * -1.9 .7
.7 ** -2.5 .8
.5 5
.7 -1:4
.6
.7
.6 -. 8 .6
.8 -. 8 .7
Diversity
Variance components
School level (%)
i?M 5 24 ** 6
a Reference category: Dutch; b Reference category: boys; ’ l significant; l * highly significant (see notes 5 and 6)
Reference category: privileged
-3.7 .8 ** -3.0 1.0
+3.1 +2.3 +4.1
360 G. Driessen /Studies in Educational E\ealuation 28 (2002) 347-368
Table 7: Results of Multilevel Analyses for Language, Grade 8: llpper Part: Pupil Level. Lower Part: School Level
Regression coefficients Ilthnicilq:” - Sur./Ant.
- Turk/Mar.
- other minority
Model
0 I 2 3 n LYE p B SE p B ,SE L
-17.3 1.5 ** -14.5 I.4 ** -12.1 1.3 **
-3 I .J I.0 ** -19,s I.0 ** - 19.4 I.0 **
-I 7.0 I.2 ** -12.1 I.1 ** -I 1.7 1.1 **
Education 9.5 .4 ** 7.8 .3 **
SW” I .2 .6 I .O .6
A&F -8.5 .5 ** -7.2 .5 **
Intelligence 22.4 .7 **
Variance
components
Pupil level (%) 82.3 4.6 i6.9 t7.3
School level (%) 17.7 5.5.4 i-13.8 i7.3
x@’ 302 ** 356 ** 1139**
Regression
coefficients
Composition:’
-jr. voc., T/M
-jr. voc., minority - heterogeneous
-jr. voc.. non-minority
sr. voc.
- higher educ.
Model
3 5 6
B SE p B ,5’E p B SE p
-1.5 1.7 * -7.8 I.8 *
-9. I I.8 ** -9.5 2.0 **
-3.4 1.2 -3.7 I .4
-3.3 1.6 -3.4 I.6
-1.6 I .4 -1.6 I .4
2.1 I.8 2.1 I.8
Diversity -4.3 1.9 I.1 2.3
Variance
components
School level (%) t2.2 +.I +2.3 $,df ~ ’ 7 5 6
a Reference category: Dutch; ’ Refrence category: boys; ’ Reference category: privileged
* Significant; ‘* highly significant (see Notes 5 and 6)
G. Driessen /Studies in Educational Evaluation 28 (2002) 347-368 361
Table 8: Results of Multilevel Analyses for Math. Grade 8: Upper Part: Pupil Level, Lower Part: School Level
Kcyression
coefficients
Ethnicit) :”
Model
0 I 2 3
B SE (’ B ,‘;E p B SE p
Sur./Ant. -3.7 .3 ** -3.0 .‘I ** -2.1 .3 **
TurkiMor. -3.7 7 :; ** - -.5 .3 -. 4 .2
other minorit) -I 2 ** - ,I .3 .3 .3
I‘:dLlcation 2.4 .I ** 1.7 .I **
Sex” -2.4 .2 ** -2.5 .I ** . Age -2.6 ,I ** -2.1 .I **
Intcllirencc 8.3 .2 ** c
Variance
components
Pupil level (%)
scllool level (%,
X?,‘@
84.6 ).I +10.6 +16.7
15.4 20.0 +10.7 +13.3
76 ** 485 ** 2643 **
4
Model
5 6
Regression
coefficients
Composition:‘
-jr. voc.. TIM
-jr. voc. minority
hererogeneous
.jr. voc.. non-minority
- sr. voc.
- higher educ.
B ,SE p B SE p B tS’E p
-.3 .5 3
-1.1 .6 -;:I
.6
.6
-. 7 .4 -_ 8 .4
-_ 3 5 ._ -. 3 .5
-.2 .4 -.2 .4
.4 .6 .4 .6
Diversity
Variance
components
School level (%)
-. 8 .I .7
t1.1 +.3 +1.1
,yi‘lf I 2 I
” Reference category: Dutch; ” Reference category: boys: ’ Reference category: privileged
* significant: ** highly significant (see notes 5 and 6)
Conclusions and Discussion
In this article, the effects of the socio-ethnic composition of schools on pupils’ performance were examined. This issue was examined in previous research as well, but there are some important differences between the present study and previous ones. To start
362 G. Driessen /Studies in Educational Evaluation 28 (2002) 347-368
with. use was made of recent large-scale. national data from a heterogeneous sample of primary schools. In addition, information with regard to both social milieu and ethnicity was included: a number of the relevant pupil characteristics was controlled for; and multilevel analyses were applied.’
The descriptive results show large differences particularly with regard to the language achievement of the Dutch versus Turkish/Moroccan pupils. This is really not
surprising when one considers the fact that Turkish and Moroccan individuals were brought to the Netherlands and other West European countries in the 1960s to perform unschooled labour. Half of the Turkish/Moroccan parents in our sample had no more than a primary education. The achievements of the Surinamese and Antillean pupils in our sample arc probably higher because their parents typically have a higher level of education than Turkish or Moroccan parents and their patents -- as es-colonialists - are more familiar
with the Dutch language and culture than other minority parents. In so far as they can be compared. the differences in social milieu and ethnicity at the level of the family show up
in socio-ethnic composition at the lcvcl of the school. Once again. it is primarily the schools with >tJ”/ or more pupils of lower educated Turkish or Moroccan parents who perform the lowest. Schools with 50% or more minority children. including a relatively large number of Surinamesc and Antillean pupils. perform somewhat better but still
considerably lower than schools with mostly Dutch pupils. With regard to the central question in this article. concerning the effects of school
composition on the language and math.achievement of Grades 4 and 8 primary school pupils. the multilevel analyses reveal a reasonably strong effect on the language
performance of Grade 4 pupils and weak effects on the math performance of Grade 4 pupils and the language performance of Grade 8 pupils. No effects on the math performance of
Grade 8 pupils were found. In other words. after taking intelligence, sex, age, ethnicity and parental education into consideration. schools with 50% or more children of lower educated
minority parents perform significantly lower than schools with mostly children of higher educated non-minority parents. For Grade 4. a negative effect of ethnic diversity was also observed, which means that the pupils in schools with numerous different ethnic groups perform lovver than other schools. When school composition is taken into account.
however. this effect disappears. In addition to this, it appears that the effects of composition and diversity do not differ for the children of parents with different ethnic backgrounds and
from different social milieus. This means that all of the children. no matter what their background, perform worse in a school with a large minority population.
Two points are worth mentioning. Firstly. there are differences between language and math achievement. This is in line with many earlier findings. which show that it is mainly language that is responsible for the educational disadvantage of ethnic minority pupils (e.g.. Rossi & Montgomery. 1994; Tesser et al., 1995). Secondly, there are larger composition effects in Grade 4 than in Grade 8, which might imply that the problem reduces over time. This would support the idea that because of different rates of cognitive growth effects are greater in the early school years (Entwistle & Alexander, 1994).
The present results suggest that ethnic minority pupils are better off in schools with a large percentage non-minority pupils. This could imply that one or the other form of distribution of pupils may be necessary. In the Dutch situation, a number of possibilities are available. In contrast to many other countries. freedom of educational choice exists in the
G. Driessen /Studies in Educational Evaluation 28 (2002) 347-368 363
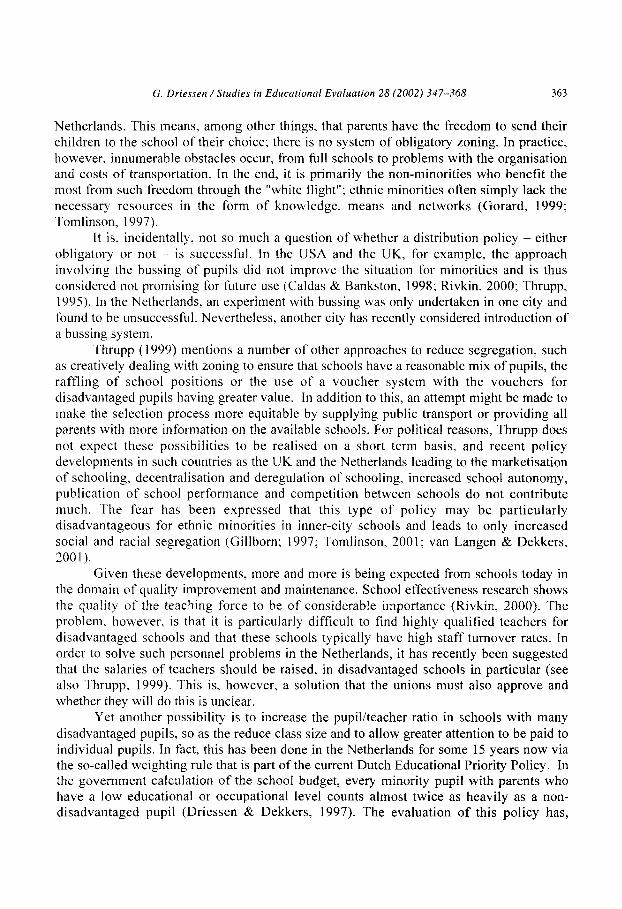
Netherlands. This means, among other things, that parents have the freedom to send their children to the school of their choice; there is no system of obligatory zoning. In practice,
however. innumerable obstacles occur, from full schools to problems with the organisation and costs of transportation. In the end, it is primarily the non-minorities who benefit the most from such freedom through the “white flight”; ethnic minorities often simply lack the necessary resources in the form of knowledge, means and networks (Gorard, 1999;
Tomlinson, 1997). It is. incidentally. not so much a question of whether a distribution policy - either
obligatory or not - is successful. In the USA and the UK, for example, the approach involving the bussing of pupils did not improve the situation for minorities and is thus considered not promising for future use (Caldas & Bankston, 1998; Rivkin, 2000; Thrupp, 1995). In the Netherlands. an experiment with bussing was only undertaken in one city and
found to be unsuccessful. Nevertheless, another city has recently considered introduction of a bussing system.
Thrupp (1999) mentions a number of other approaches to reduce segregation, such as creatively dealing with zoning to ensure that schools have a reasonable mix of pupils, the raffling of school positions or the use of a voucher system with the vouchers for disadvantaged pupils having greater value. In addition to this, an attempt might be made to make the selection process more equitable by supplying public transport or providing all parents with more information on the available schools. For political reasons, Thrupp does
not expect these possibilities to be realised on a short term basis, and recent policy developments in such countries as the UK and the Netherlands leading to the marketisation of schooling, decentralisation and deregulation of schooling, increased school autonomy, publication of school performance and competition between schools do not contribute much. The fear has been expressed that this type of policy may be particularly disadvantageous for ethnic minorities in inner-city schools and leads to only increased social and racial segregation (Gillborn; 1997; Tomlinson, 2001; van Langen & Dekkers, 2001).
Given these developments, more and more is being expected from schools today in the domain of quality improvement and maintenance. School effectiveness research shows the quality of the teaching force to be of considerable importance (Rivkin, 2000). The problem. however. is that it is particularly difficult to find highly qualified teachers for
disadvantaged schools and that these schools typically have high staff turnover rates. In order to solve such personnel problems in the Netherlands, it has recently been suggested that the salaries of teachers should be raised, in disadvantaged schools in particular (see also Thrupp, 1999). This is, however, a solution that the unions must also approve and whether they will do this is unclear.
Yet another possibility is to increase the pupil/teacher ratio in schools with many disadvantaged pupils, so as the reduce class size and to allow greater attention to be paid to individual pupils. In fact, this has been done in the Netherlands for some 15 years now via the so-called weighting rule that is part of the current Dutch Educational Priority Policy. In the government calculation of the school budget, every minority pupil with parents who have a low educational or occupational level counts almost twice as heavily as a non- disadvantaged pupil (Driessen & Dekkers, 1997). The evaluation of this policy has,
364 G. Driessen /Studies in Educnfional Evaluation 28 (2002) 347-368
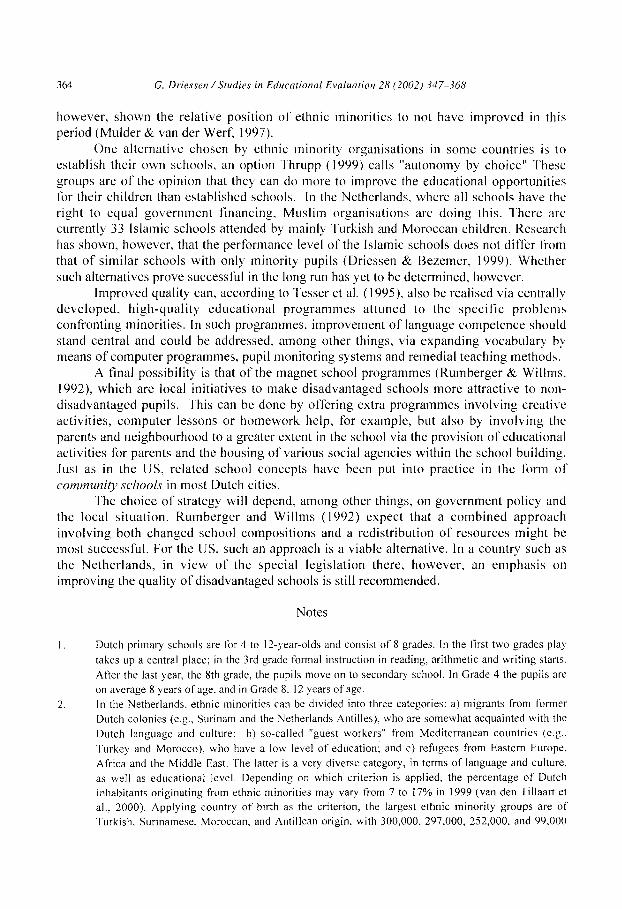
however, shown the relative position of ethnic minorities to not have improved in this period (Mulder & van der Werf, 1997).
One alternative chosen by ethnic minority organisations in some countries is to establish their own schools, an option ‘l’hrupp (1999) calls “autonomy by choice” These
groups are of the opinion that they can do more to improve the educational opportunities l’or their children than established schools. In the Netherlands. where all schools have the right to equal government financing. Muslim organisations arc doing this. There are currently 33 Islamic schools attended by mainly Turkish and Moroccan children. Research has shown, however. that the performance level ofthe Islamic schools does not differ from that of similar schools with only minority pupils (Driessen & Bezemer, 1999). Whether
such alternatives prove successful in the long run has yet to be determined, however. Improved quality can, according to Tesser et al. ( 1995). also be realised via centrally
developed. high-quality educational programmes attuned to the specific problems confronting minorities. In such programmes. improvement of language competence should
stand central and could be addressed, among other things. via expanding vocabulary by means of computer programmes, pupil monitoring systems and remedial teaching methods.
A final possibility is that of the magnet school programmes (Rumberger & Willms, 1992), which are local initiatives to make disadvantaged schools more attractive to non- disadvantaged pupils. This can be done by offering extra programmes involving creative
activities, computer lessons or homework help, for example, but also by involving the parents and neighbourhood to a greater extent in the school via the provision of educational activities for parents and the housing of various social agencies within the school building. .lust as in the lJS, related school concepts have been put into practice in the form of
community schools in most Dutch cities. The choice of strategy will depend, among other things, on government policy and
the local situation. Rumberger and Willms (1992) expect that a combined approach involving both changed school compositions and a redistribution of resources might be most successful. For the IJS. such an approach is a viable alternative. In a country such as the Netherlands, in view of the special legislation there, however. an emphasis on improving the quality of disadvantaged schools is still recommended.
Notes
Dutch primary schools are for 4 to 12.year-olds and consist of 8 grades. In the first two grades pIa>
takes up a central place; in the 3rd grade formal instruction in reading, arithmetic and writing starts.
After the last year, the 8th grade, the pupils move on to secondary school. In Grade 4 the pupils are
on average 8 years of age. and in Grade 8. I2 years of age.
In the Netherlands. ethnic minorities can be divided into three categories: a) migrants from former
Dutch colonies (e.g., Surinam and the Netherlands Antilles). who are somewhat acquainted with the
Dutch language and culture; b) so-called “guest workers” from Mediterranean countries (e.g.,
Turkey and Morocco), who have a low level of education; and c) refugees from Eastern Europe,
Africa and the Middle East. The latter is a very diverse category. in terms of language and culture,
as well as educational level. Depending on which criterion is applied, the percentage of Dutch
inhabitants originating from ethnic minorities may vary from 7 to 17% in 1999 (van den Tillaart et
al.. 2000). Applying country of birth as the criterion, the largest ethnic minority groups are of
Turkish. Surinamese. Moroccan, and Antillean origin, with 300,000, 297,000, 252,000, and 99,000
3.
4.
5.
6.
7.
G. Driessen /Studies in Educational Evaluation 28 (2002) 347-368 365
members, respectively, on a total Dutch population of 16 million. It is customary to view a person
as belonging to an ethnic minority group if at least one of his or her parents is born abroad. In the
big cities more than half of the pupils belong to an ethnic minority group.
In the PRIMA project the tests are termed inlelligence tests: a perhaps more adequate name would
be non-verhul twxoning ccptitude te.~ts.
As ethnic origin and social milieu are strongly correlated, the PRIMA project opted for a reul Ii@
categorization in terms of socio-ethnic types of schools instead of a more abstract composition in
the form of percentage of ethnic minority pupils, and percentage of pupils with low educated
parents.
The degree of significance can be derived by calculating a 2 score, namely z = B/SE. The exact
meaning of significant and highly significant in terms of I depends on the number of units (here:
schools) in the analysis (cf. Cohen, 1988). For Iv’ < I20 schools, an effect is generally assumed to be
just significant when the p value < .I0 in keeping with a z > I .65. For R! = 200 schools, just
significant is p < .05 or z >I .96. For N = 500 schools, just significant is p < .OOl or z > 3.29. In
keeping with this, the following holds for N= 583 schools: * : 3.62 > z i 4.83; ** : z > 4.83.
The value obtained is a yvalue and calculated by subtracting the 2 value for the Model to be
examined from the x1 for the reference Model to see if they differ significantly. The difference in
the 2 values is then divided by the difference in the degrees of freedom for the two Models. For N =
583 schools and (l’f‘= I, a ,$/~!f.> 13 indicates a just significant difference.
A probably even better approach would be a longitudinal design with achievement measured at two
points and using the difference between the test results as the dependent variable. In the present
cross-sectional study the coefficients in the multilevel Models are actually simply associations. In a
longitudinal design the coefficients could be interpreted as causal. Such a design, however, has
disadvantages associated with, for instance, selective non-response according to ethnicity and social
milieu because of differential retention rates. In addition, there is controversy as to the method of
analysis, e.g., the covariance Model or the difference or gain score approach.
Acknowledgements
The author would like to thank J. Doesborgh for his help with the multilevel analyses. The
Netherlands Organization for Scientific Research (NWO) is gratefully acknowledged for funding the project
on which this article is based. The research was supported by grant # 41 I-20-005 from NWO’s Social
Science Research Council.
References
Bagley, C. (1996). Black and white unite or flight? The racialised dimension of schooling and
parental choice. British Educutionul Reseurch .Journal. 22, 569-580.
Bankston, C. III, & Caldas, S. (1996). Majority African American schools and social injustice: the
influence of de facto segregation on academic achievement. Social Forces, 75, 535-555.
Bankston, C. 111, & Caldas, S. (2000). Majority African American schools and the family structure
of schools: school racial composition and academic achievement among black and white students.
Sociological Focus, 33, 243-263.
366 G. Driessen /Studies in Educational Evaluation 28 (2002) 347-368
Caldas. S.. & Bankston. c‘. III (1997). Effect of school population socioeconomic status on
individual academic achicvemcnt. T/Ic, .lo~rtwc~l of LXwutiontrl Rc.rcarch. 90. 269-277.
C‘aldas. S.. Kr Bankston. C. III ( 1998). The inequality of separation: racial composition of schools
and academic achievement. /Ctlrt~~itli~>rzci/ .,fl/rl7ir7l.\/,.~ition Qiii~r/er/~~. I-/. 53X-557.
Caldas. S.. Kc f3ankston. C. I II ( 1999). Multilevel examination of student, school, and district-level
ctXxts on academic achicvcmcnt. The .I~mrrwl of /?l11c~trtio~7ul Re.sctrr~ciz. 93, 9 I - 100.
C‘arrington. V.. & I.uhc. A. (1007). I.itcrac) and Bourdieu’s sociological theory: a reframing.
I.trt7~li~r,~~ trncl IGltrc~trliott. Il. 96- I I?.
C‘ohen. 1, ( 1988). .%//i.Y/iLYl/ ,“‘\““” ri,ltr/>:YiY /or //lC hehur’ioml .sC~icvxY!.v. Hillsdale. NJ: Erlbaum.
C‘olemnn. .I. ( 1088). Social capital in the creation of human capital. Amuictrr~ ./orrtxu/ r!f’,~oi,ir,/~~,~~,.
0-i. 0% 120.
t‘olrman. J.. Armor. I).. (‘rain. I~.. Miller. N., Stephan, W., Walberg. 1-I.. K; Wortman. P. (1966).
/$~olil~. C!I LY/~CU/~O~UI/ r~/)/x~~/i~~/li‘ Washington: IJS Government Printing Office.
I)i-iesacn. (i. (2000). The limits of educational policy and practice‘? The case 01‘ ethnic minorit>
pupils in the Netherlands. (‘o/~rl~trrc//i~~~’ I:;/li~tr/ior7, 36. 55-72.
f)riessen. (;. (2001 ). Ethnicit!. Ibrms ol’capital. and educational achievement. lrt/crr~r/ionc~/ Revi~~11’
of Eh~L//iOll. i-. 5 I j-537.
Dricssen. 6.. & kzemer. J. (I 999). Background and achievement levels of Islamic schools in the
Netherlands: al-e the reservations j ustitied? Rtrw E:lhr7i~i/~, uml Ecluwtior~. 2. 235-255.
f>rici;scn. ii.. K: Dehkcrs. I I. (1997). t:ducational opportunities in the Netherlands. Policy. students=
perlbrmancc and issues. Ir11er.r7tr1ior1trl RCJ,,;CJM of’Ehctrtior7. 4-i. 299-3 IS.
I>ricssen. <i.. van Langcn. A,. Kr V ierke. I I. ( 2000). Bu,si.so~tdt~tw~j~s ~,cidir,c~k~,~i..s/ff~~.
l~cvlin,~~c’~c,~~~,~~,\ CH o~~c/u~~~~r.cl~:~~rIlii.\./i’ll. BLI~~.F~~I~?~~oI./LI~‘L’ f’Rl~~~-l-col~or-londe~:~~~k, Dude Meting I YYcY:W
[Primary education: Technical report of the PRIMA cohort study. Third measurement 19981991. Nijmegen:
ITS.
Driessen, G.. & Vierke. H. (1999). Abordar la igualdad y la calidad educativas a travCs de In
investigacicin: coma ejemplo un estudio national de cohortes [An approach to educational quality and
equality through research. taking as an example a national study 011 cohorts]. Revistu de Edu~ucidn. 3/C). 37.
60.
Entwisle. D.. &r Alexander. K. (1992). Summer setback: race, poverty, school composition, and
mathematics achievement in the first two years of school. ilmeri~on Sociolngicul Rcvicw 57, 72-84.
G. Driessen /Studies in Educational Evaluation 28 (2002) 347-368 361
Entwisle. D., & Alexander, K. (I 994). Winter setback: the racial composition of schools and
learning to read. American Sociological Review. 59. 446-460.
Ever&. H.. Golhof, A., Stassen. P.. & Teunissen. J. (1986). De kzrltureel-etnische situutie op OVB-
.scholen [The cultural-ethnic situation in disadvantaged schools]. Utrecht: RUU.
Gillborn. D. ( 1997). Racism and reform: new ethnicitiesiold inequalities? British Educutional
Re.rcYirch Journtrl. 23. 345-360.
Gerard. S. (1999). ‘Well. That about wraps it up for the school choice research’: a state of the art
review. Scl~ool Leotlership & Munugement, 19. 25-47.
Guldemond, H. ( 1994). l’ur~ de kikker en de vijl,er. Groeps,sef;f&ten op individuele leerprestuties
[Frog - pond effects: Group effects on individual achievements]. LeuveniApeldoorn: Garant.
Jencks, C., Smith. M.. Acland. II.. Bane. M.. Cohen. D.. Gintis. H., Heyns. B., & Michelson, S.
( 1972). lnecluulit>*: A rctr.u.se.ssment of’ the rffC;c/ qf’firmi!v and schooling in Americu. New York: Basic
Books.
Jencks, C.. & Mayer, S. (1990). The social consequences of growing up in a poor neighborhood. In
L. Lynn jr. & M. McGeary (Eds.). Inner-citl, poverty in the United S/ate.y (pp. I I I -I 86). Washington. DC:
National Academy Press.
Mulder. I,.. & van der Werf. G. (1997). Implementation and effects of the Dutch Educational
Priority Policy: results of four years of evaluation studies. Educutionul Reseurch und Evuluution, 3, 3 I7-
339.
Nash. Ii. (2001). Progress at school and school effectiveness: non-cognitive dispositions and within-
class markets. .Journul of Education Poliq,. 16. 80- 102.
Ogbu. J. (1988). Class stratification. racial stratification. and schooling. In L. Weis (Ed.), Class,
r’crce. und gender in .4mericun eductrtion (pp. 163-182). Albany: State University of New York Press.
Ogbu, J. (I 994). Racial stratification and education in the United States: Why inequality persists.
Teucher.v C‘olle<~c Record, 96. 264-298.
78.
Putnam, R. (I 995). Bowling alone: America’s declining social capital. .Juurnu/ ufDemocrucy. 6, 65-
Rivkin. S. (2000). School desegregation, academic attainment. and earnings. The Journal qf Human
Resources. 35, 333-346.
Rossi. R., & Montgomery, A. (Eds.) (I 994). Educutionul reforms and students at risk. A review oj”
the current .rtute of’the urt. Washington, DC: US Department of Education.
Rumberger. R., & Willms, J. (1992). The impact of racial and ethnic segregation on the
achievement gap in California high schools. Educutionul Evaluation and Policy Analysis, 14, 377-396.
Snijders, T., & Bosker, R. (1999). Multilevel unulysis. An introduction to basic und advanced
muhilevel Modeling: London/Thousand Oaks/New Delhi: SAGE.
368 G. Driessen /Studies in Educational Evaluation 28 (2002) 347-368
Tesser, P., van Praag, C., Dugteren, F.. Herweijer, L., & van der Wouden, H. (1995). Rupportqqe
mim/erheden lYY5. C’oncentrutie en .w,ywgtrtic [Report on ethnic tninorities 1995. Concentration and
segregation]. Den Haag: VUGA.
Thrupp. M. (1995). The school mix effect: the history of an enduring problem in educational
research, policy and practice. B~iti.~h ./oz/rntr/ of’Socio/o~~~ of Edwulion, 16. 183-203.
Thrupp. M. (I 998). The art of the possible: organizing and managing high and low socioeconomic
schools. .Jownul of’Educutiontrl Poliq~. 13. 191-Z 19.
Ihrupp. M. ( 1999). ,%~hooi.\ muking u diff&nce Let !v hc realisfic! School mi.x. .school efj’&tivenc.t.s
md /he yocioi limi/.s ofyfi~~~. BuckinghamiPhiladelphia: Open University Press.
Tomlinson. S. ( 1997). Diversity. choice and ethnicity: the effects of educational markets on ethnic
minorities. O&fi)r-d Rclaie~, of Educa/im 23, 63-76.
Tomlinson. S. (2001). Educational policy. 1997-2000: the effects on top, bottom and middle
l:ngland. In~enzutionul S/z/dies it1 S~~ciolo,q c$Edtrcotim. I I. 26 l-277.
van den Tillaart, H.. Olde Monnikhot; M.. van den Berg, S.. & Warmerdam, J. (2000). Nieuwe
etni.yche gr.oep~ in Ncderlmd. Een onderxek onder vluchtelingen en stutushouders uit A,fkhunistun.
Ell7iopic m7 Eritlcu. I~II. Somulic 07 l’ie/r7unz [New ethnic minority groups in the Netherlands. A study
among refugees from Afghanistan, Ethiopia and Eritrea. Iran, Somalia and Vietnam]. Nijmegen: ITS.
van Langen. A., & Dekkers, H. (2001). Decentralisation and combating educational exclusion.
( ‘otnpurtrlil~c Edlrcwtion. 3 -. 367-384.
Vierke. H. ( 1995). De PRIMA-toet.sm gc~culihreerd. De ontwikkeling van ~1aurdi~heids.score.s over
de leer;juren hew7 op hu.sis vun de jawgroeptorisen in her cohort Primuir Ondewijs (PRIMA) [Calibration
of the PRIMA tests. The development of proficiency scores in the cohort Primary Education (PRIMA)].
Nijmegen: ITS.
Westerbeek, K. (1999). 7‘11~ ~olorirs of my ~~lus~roonr. A .study into the [email protected] of‘ the ethnic
composition of c~luwroorns on the achievement (?f’pupils ,fiwn d{ff&nt ethnic buckgrounds. Rotterdam:
CED.
Wilson. W. (I 987). The truly disudvuntuged: The inner city, the wtderc1u.s.s. and pttblic policy.
Chicago: The University of Chicago Press.
The Author
GEERT DRIESSEN received his Ph.D. in the social sciences from the University of Nijmegen. the Netherlands. He is an educational researcher at the Institute for Applied Social Sciences (ITS) of the University of Nijmegen. His major research interests include the position of ethnic minorities in education, inequality in education, educational careers. first and second language acquisition, minority language and culture teaching, and religion and education.
Correspondence: <[email protected]>