Embed Size (px)
Citation preview
School District Key Performance Indicators (KPIs):
Values and Trends
January 2018
An Analysis by Performance Management
Dale Schmidt, Director
Leigh Kamens, Coordinator
2
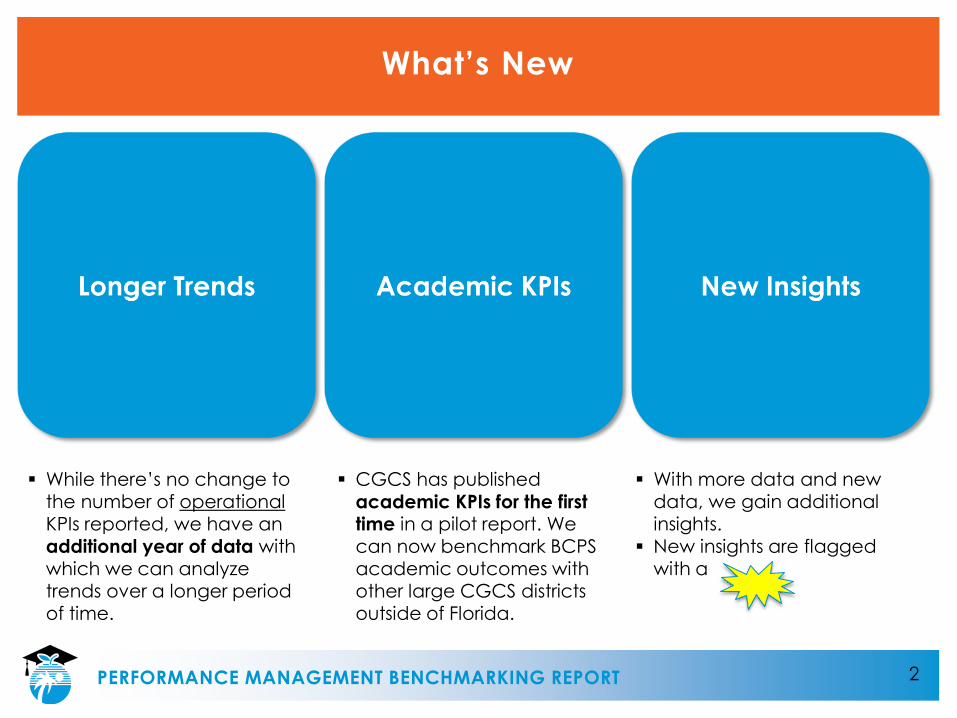
What’s New
PERFORMANCE MANAGEMENT BENCHMARKING REPORT
While there’s no change to the number of operationalKPIs reported, we have an additional year of data with which we can analyze trends over a longer period of time.
CGCS has published
academic KPIs for the first time in a pilot report. We can now benchmark BCPS academic outcomes with other large CGCS districts outside of Florida.
With more data and new data, we gain additional insights.
New insights are flagged with a
3
Executive Summary
PERFORMANCE MANAGEMENT BENCHMARKING REPORT
BCPS uses key performance indicators (KPIs) published by the Council of Great City Schools (CGCS) to inform its practices and drive performance improvements in operations and academics.
There are many limitations to CGCS KPI reporting, but it is the best available source. Member districts have several essential demographic characteristics in common with BCPS; if accurately reported, their KPIs provide reasonable and useful benchmarks.
Overall, there were no significant changes in KPIs reported between the most current CGCS report and the prior one.
BCPS collectively across all operations INCREASED its number of BEST QUARTILE rankings from 25 to 26, driven by improved KPIs in Transportation, Risk Management and Procurement.
Across focus areas, BCPS Food Services KPIs are MIXED. Meal participation rates among FRL fell. Meals per labor hour have plateaued, while the fund balance continues to improve.
Across focus areas, BCPS Information Technology KPIs continue to IMPROVE.
While teacher retention continues to be a major challenge, new teacher induction programs and additional support appear for now to have helped stem attrition.
Academic KPIs published by CGCS in its pilot report are problematic. Thus, only a subset (Secondary level) are reported here.
Districts that have sequentially ranked in the best quartile may be good sources for best practice
guidance. They are identified at the end of this report.
An Excel-based data book with source data accompanies this report.
4
Introduction
PERFORMANCE MANAGEMENT BENCHMARKING REPORT
Performance Management compiled operational key performance indicators
(KPIs) published by the Council of Great City Schools (CGCS) in six separate reports
published between October 2012 and November 2017.
In addition, academic KPIs were reported by CGCS for the first time in a pilot report.
Thus, this year’s Broward Benchmarking Report includes KPIs around both operations
and academics.
BCPS Departments (operations, not academics) were requested to identify a subset
of one-to-four KPIs—referred to here as “focus KPIs”—that most inform their work.
Across the focus KPIs, a trend analysis was performed. It includes a comparison
against other large Florida districts.
In addition, across all KPIs reported by BCPS consistently over at least the past four
years, an index analysis was completed to understand how KPI values have
fluctuated over time relative to their baseline value.*
Finally, across all KPI families (operations only), the districts that perform consistently
in the best quartile are identified. Further research into the contexts of those districts
is recommended, as it might yield best practices that can be implemented at BCPS.
* Baseline values are the KPI values first reported by BCPS to CGCS. Typically, they are from the 2011/12 or 2012/13 school year.
5
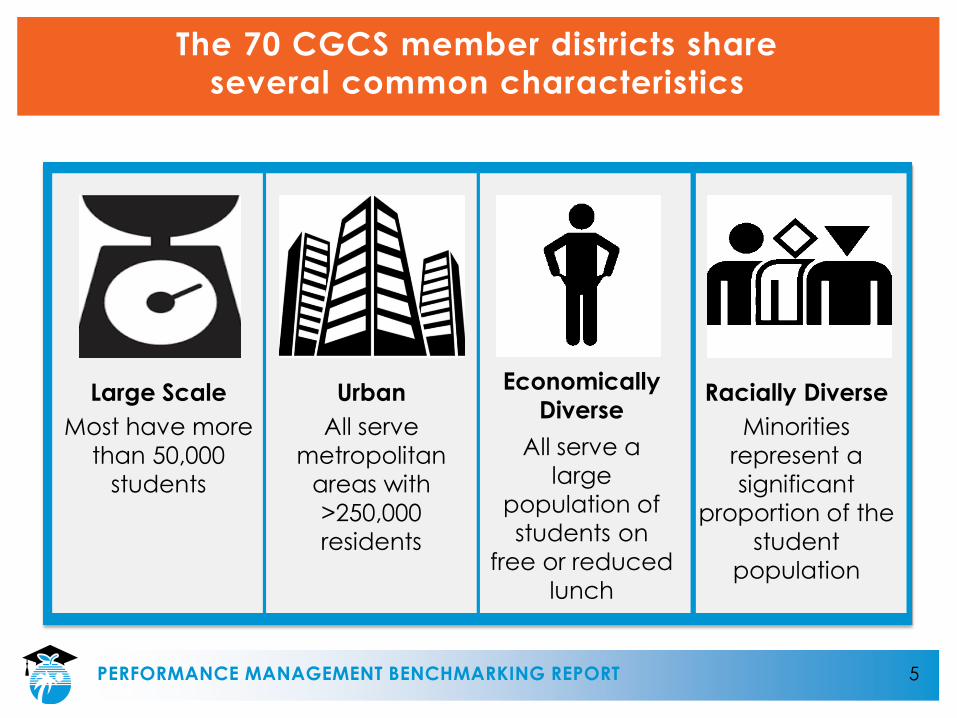
The 70 CGCS member districts share
several common characteristics
PERFORMANCE MANAGEMENT BENCHMARKING REPORT
Large Scale
Most have more
than 50,000
students
Racially Diverse
Minorities
represent a
significant
proportion of the
student
population
Urban
All serve
metropolitan
areas with
>250,000
residents
Economically
Diverse
All serve a
large
population of
students on
free or reduced
lunch
6
Limitations of CGCS’s KPIs
PERFORMANCE MANAGEMENT BENCHMARKING REPORT
• The data used in this report are pulled from the CGCS “Managing for
Results” report, published annually in October or November, and its
“Academic Key Performance Indicators” pilot report, published in October
2017.
• The published KPIs are12 months old or more by the time they are
published. KPIs in the latest (2017) reports are from the 2015/16 school year.
• Trend analysis and comparisons with other districts depend on the extent of
transparency and regularity of reporting.
KPIs are selectively reported by districts. We cannot compare what’s
not reported.
Levels of transparency often vary from year to year. Some districts
report a wide range of KPIs consistently, some do not.
Trend analysis is not possible with the academic KPIs as CGCS reports
only one year of data.
7
Limitations of CGCS’s KPIs, continued
PERFORMANCE MANAGEMENT BENCHMARKING REPORT
• The set of KPIs collected by CGCS is somewhat stable, but each year there
are changes. Some KPIs once tracked are no longer reported.
• KPI definitions and underlying calculations can (and do) change. Past
values cannot always be mapped to later values.
• Wide fluctuations in reported KPIs by districts are not uncommon. They can
result from miscalculations, policy changes, State legislative changes, errors
in CGCS’s reporting, etc.
• Districts can (and do) revise their prior-year data. Districts also can (and
do) retroactively provide prior-year data. Thus, the mix of districts falling in
the best quartile—and the best quartile range of values—may fluctuate
year over year. Revisions and reporting for prior years occur regularly in the
latest report.
8
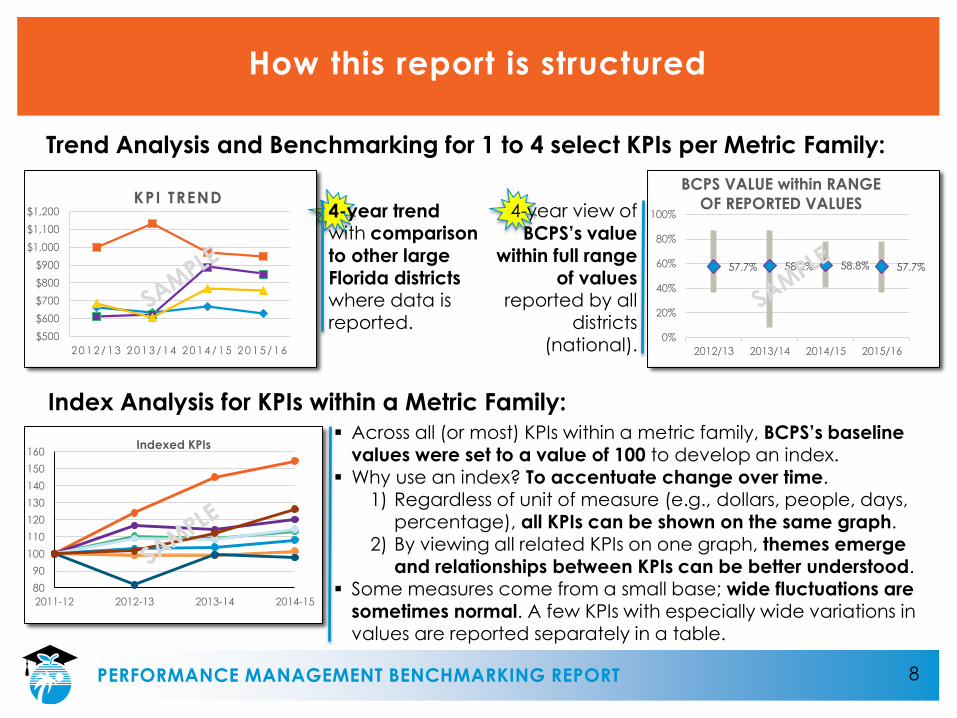
How this report is structured
PERFORMANCE MANAGEMENT BENCHMARKING REPORT
$500
$600
$700
$800
$900
$1,000
$1,100
$1,200
2 0 1 2 / 1 3 2 0 1 3 / 1 4 2 0 1 4 / 1 5 2 0 1 5 / 1 6
KPI TREND
57.7% 58.2% 58.8% 57.7%
0%
20%
40%
60%
80%
100%
2012/13 2013/14 2014/15 2015/16
BCPS VALUE within RANGE
OF REPORTED VALUES
80
90
100
110
120
130
140
150
160
2011-12 2012-13 2013-14 2014-15
Indexed KPIs
Trend Analysis and Benchmarking for 1 to 4 select KPIs per Metric Family:
Index Analysis for KPIs within a Metric Family:
4-year trend with comparison
to other large
Florida districts where data is reported.
4-year view of
BCPS’s value within full range
of values reported by all
districts (national).
Across all (or most) KPIs within a metric family, BCPS’s baseline values were set to a value of 100 to develop an index.
Why use an index? To accentuate change over time.1) Regardless of unit of measure (e.g., dollars, people, days,
percentage), all KPIs can be shown on the same graph. 2) By viewing all related KPIs on one graph, themes emerge
and relationships between KPIs can be better understood. Some measures come from a small base; wide fluctuations are
sometimes normal. A few KPIs with especially wide variations in values are reported separately in a table.
9
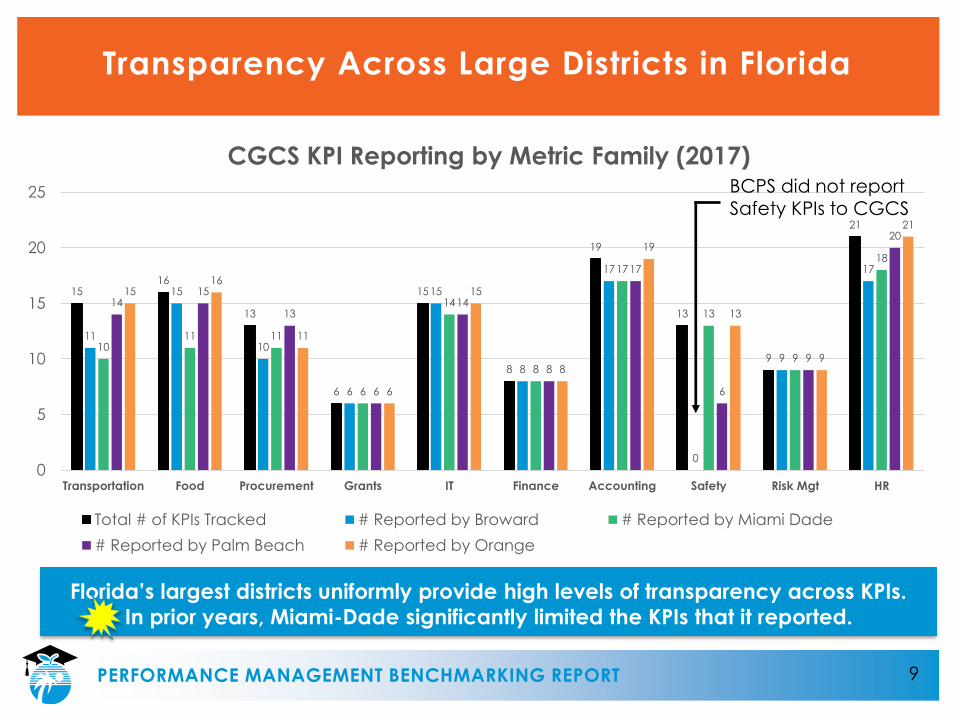
Transparency Across Large Districts in Florida
PERFORMANCE MANAGEMENT BENCHMARKING REPORT
1516
13
6
15
8
19
13
9
21
11
15
10
6
15
8
17
0
9
17
1011 11
6
14
8
17
13
9
18
1415
13
6
14
8
17
6
9
20
1516
11
6
15
8
19
13
9
21
0
5
10
15
20
25
Transportation Food Procurement Grants IT Finance Accounting Safety Risk Mgt HR
CGCS KPI Reporting by Metric Family (2017)
Total # of KPIs Tracked # Reported by Broward # Reported by Miami Dade
# Reported by Palm Beach # Reported by Orange
Florida’s largest districts uniformly provide high levels of transparency across KPIs.
In prior years, Miami-Dade significantly limited the KPIs that it reported.
BCPS did not report Safety KPIs to CGCS
10
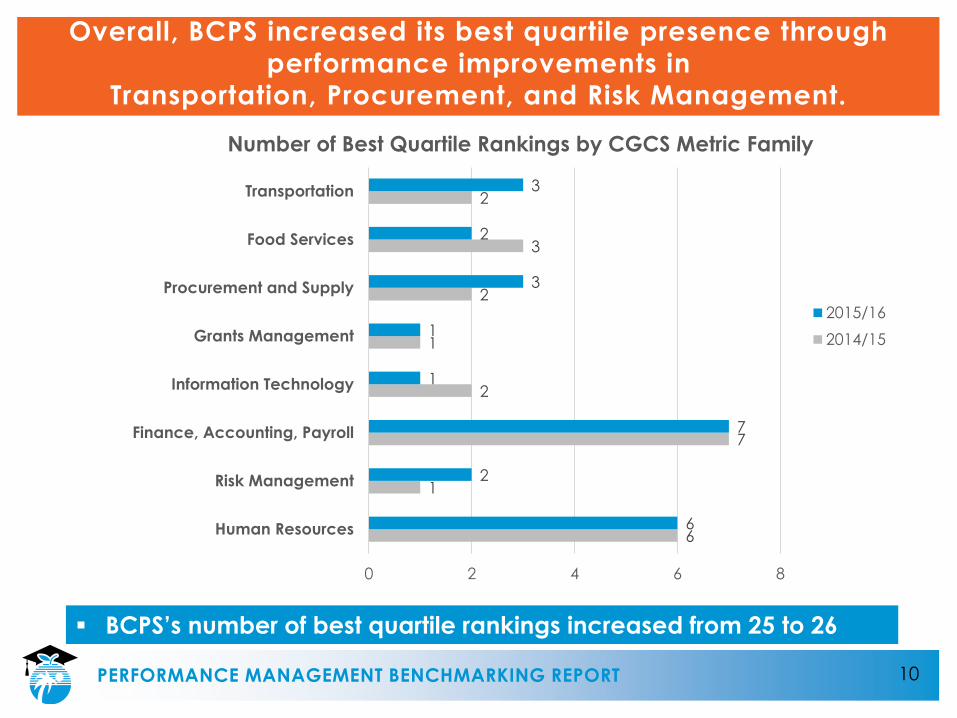
Overall, BCPS increased its best quartile presence through
performance improvements in
Transportation, Procurement, and Risk Management.
PERFORMANCE MANAGEMENT BENCHMARKING REPORT
6
1
7
2
1
2
3
2
6
2
7
1
1
3
2
3
0 2 4 6 8
Human Resources
Risk Management
Finance, Accounting, Payroll
Information Technology
Grants Management
Procurement and Supply
Food Services
Transportation
Number of Best Quartile Rankings by CGCS Metric Family
2015/16
2014/15
BCPS’s number of best quartile rankings increased from 25 to 26
11
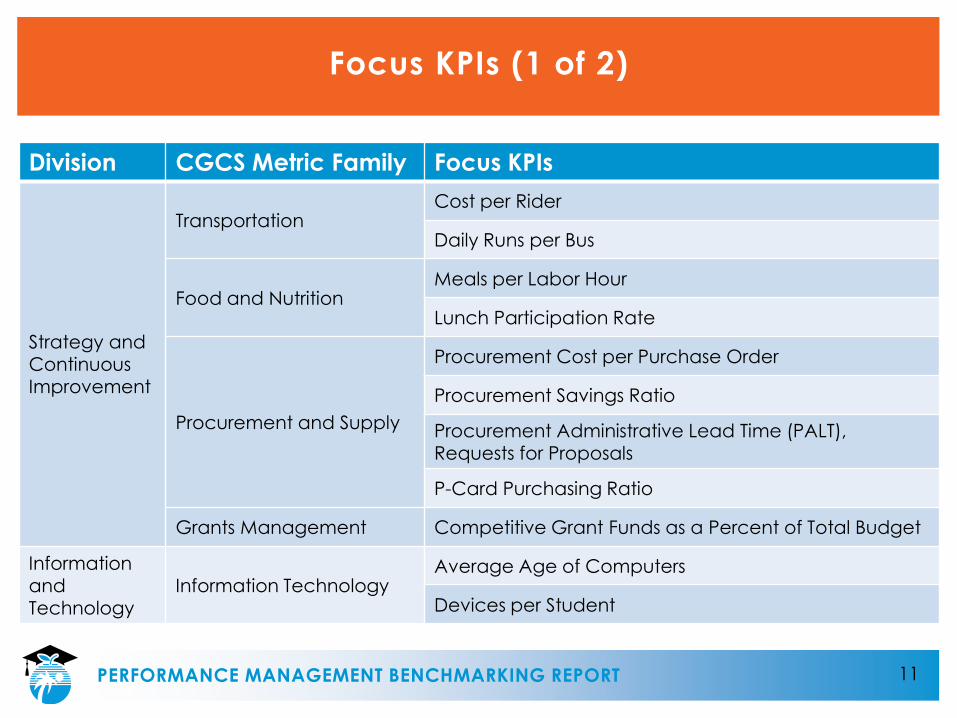
Focus KPIs (1 of 2)
PERFORMANCE MANAGEMENT BENCHMARKING REPORT
Division CGCS Metric Family Focus KPIs
Strategy and Continuous Improvement
TransportationCost per Rider
Daily Runs per Bus
Food and Nutrition Meals per Labor Hour
Lunch Participation Rate
Procurement and Supply
Procurement Cost per Purchase Order
Procurement Savings Ratio
Procurement Administrative Lead Time (PALT), Requests for Proposals
P-Card Purchasing Ratio
Grants Management Competitive Grant Funds as a Percent of Total Budget
Information and Technology
Information TechnologyAverage Age of Computers
Devices per Student
12
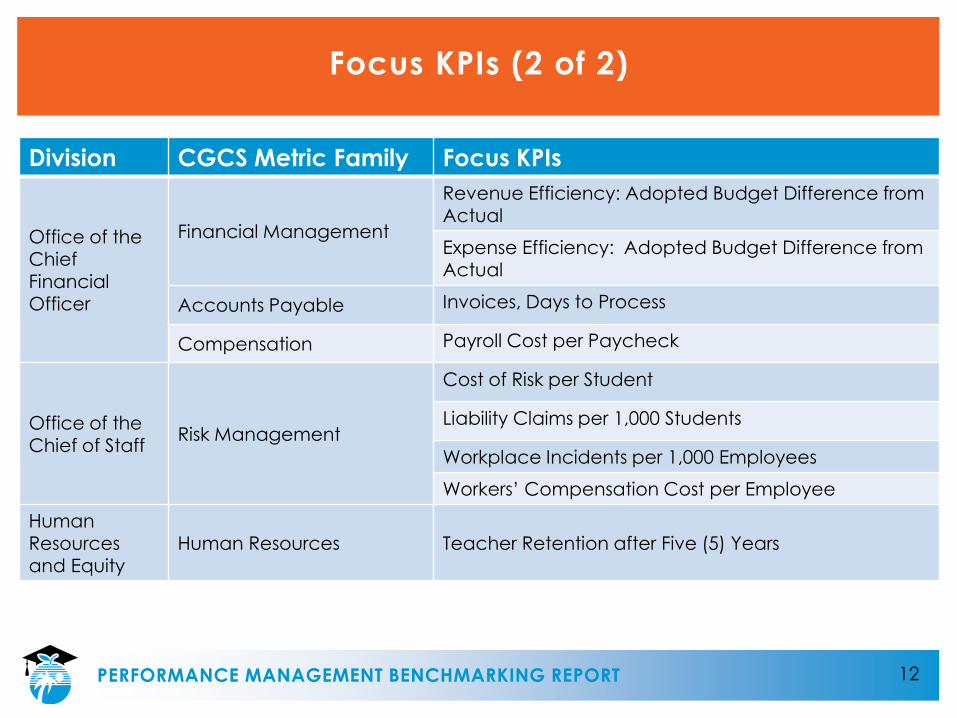
Focus KPIs (2 of 2)
PERFORMANCE MANAGEMENT BENCHMARKING REPORT
Division CGCS Metric Family Focus KPIs
Office of the Chief Financial Officer
Financial Management
Revenue Efficiency: Adopted Budget Difference from Actual
Expense Efficiency: Adopted Budget Difference from Actual
Accounts Payable Invoices, Days to Process
Compensation Payroll Cost per Paycheck
Office of the Chief of Staff
Risk Management
Cost of Risk per Student
Liability Claims per 1,000 Students
Workplace Incidents per 1,000 Employees
Workers’ Compensation Cost per Employee
HumanResources and Equity
Human Resources Teacher Retention after Five (5) Years
13
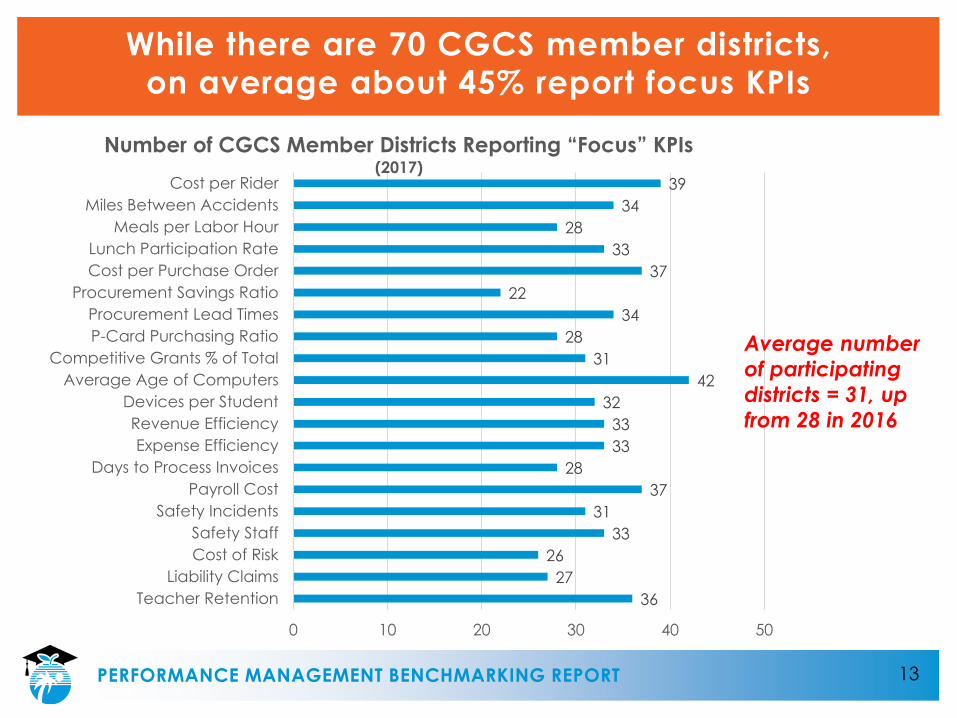
While there are 70 CGCS member districts,
on average about 45% report focus KPIs
PERFORMANCE MANAGEMENT BENCHMARKING REPORT
36
27
26
33
31
37
28
33
33
32
42
31
28
34
22
37
33
28
34
39
0 10 20 30 40 50
Teacher Retention
Liability Claims
Cost of Risk
Safety Staff
Safety Incidents
Payroll Cost
Days to Process Invoices
Expense Efficiency
Revenue Efficiency
Devices per Student
Average Age of Computers
Competitive Grants % of Total
P-Card Purchasing Ratio
Procurement Lead Times
Procurement Savings Ratio
Cost per Purchase Order
Lunch Participation Rate
Meals per Labor Hour
Miles Between Accidents
Cost per Rider
Number of CGCS Member Districts Reporting “Focus” KPIs (2017)
Average number
of participating
districts = 31, up
from 28 in 2016
14
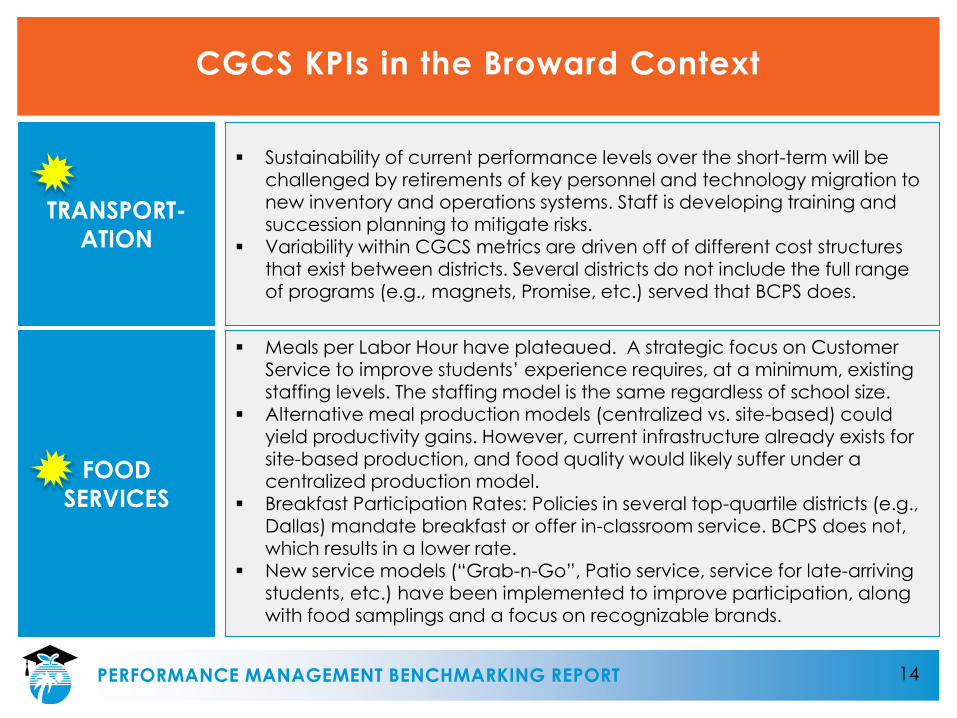
CGCS KPIs in the Broward Context
PERFORMANCE MANAGEMENT BENCHMARKING REPORT
Meals per Labor Hour have plateaued. A strategic focus on Customer Service to improve students’ experience requires, at a minimum, existing
staffing levels. The staffing model is the same regardless of school size. Alternative meal production models (centralized vs. site-based) could
yield productivity gains. However, current infrastructure already exists for site-based production, and food quality would likely suffer under a centralized production model.
Breakfast Participation Rates: Policies in several top-quartile districts (e.g., Dallas) mandate breakfast or offer in-classroom service. BCPS does not,
which results in a lower rate. New service models (“Grab-n-Go”, Patio service, service for late-arriving
students, etc.) have been implemented to improve participation, along with food samplings and a focus on recognizable brands.
FOOD
SERVICES
Sustainability of current performance levels over the short-term will be challenged by retirements of key personnel and technology migration to new inventory and operations systems. Staff is developing training and succession planning to mitigate risks.
Variability within CGCS metrics are driven off of different cost structures that exist between districts. Several districts do not include the full range of programs (e.g., magnets, Promise, etc.) served that BCPS does.
TRANSPORT-
ATION
15
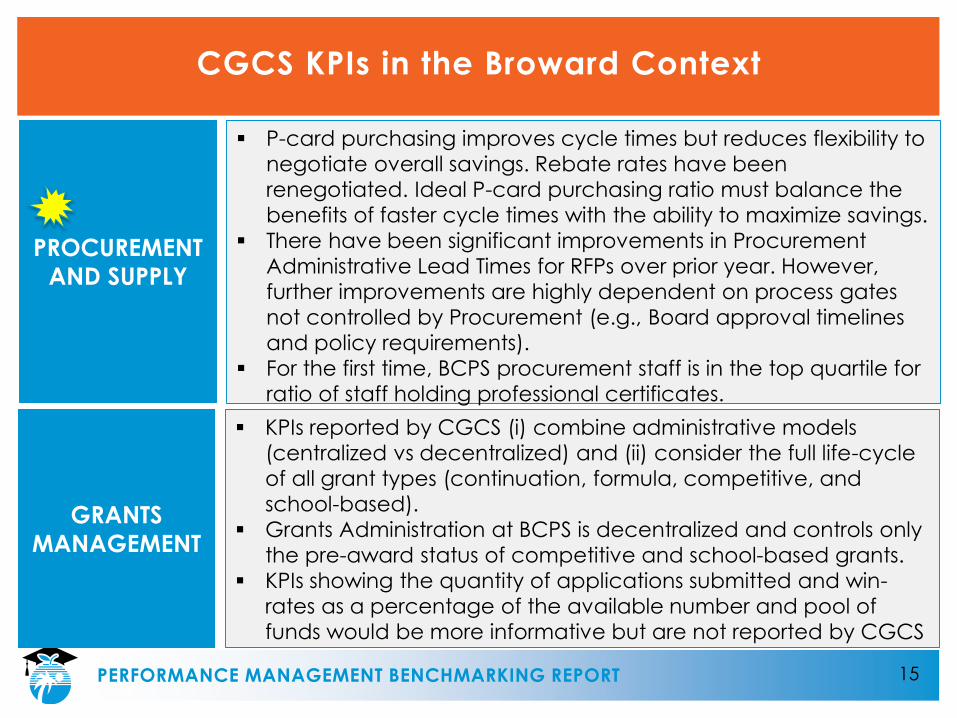
CGCS KPIs in the Broward Context
PERFORMANCE MANAGEMENT BENCHMARKING REPORT
PROCUREMENT
AND SUPPLY
KPIs reported by CGCS (i) combine administrative models
(centralized vs decentralized) and (ii) consider the full life-cycle
of all grant types (continuation, formula, competitive, and
school-based).
Grants Administration at BCPS is decentralized and controls only
the pre-award status of competitive and school-based grants.
KPIs showing the quantity of applications submitted and win-
rates as a percentage of the available number and pool of
funds would be more informative but are not reported by CGCS
GRANTS
MANAGEMENT
P-card purchasing improves cycle times but reduces flexibility to
negotiate overall savings. Rebate rates have been
renegotiated. Ideal P-card purchasing ratio must balance the
benefits of faster cycle times with the ability to maximize savings.
There have been significant improvements in Procurement
Administrative Lead Times for RFPs over prior year. However,
further improvements are highly dependent on process gates
not controlled by Procurement (e.g., Board approval timelines
and policy requirements).
For the first time, BCPS procurement staff is in the top quartile for
ratio of staff holding professional certificates.
16
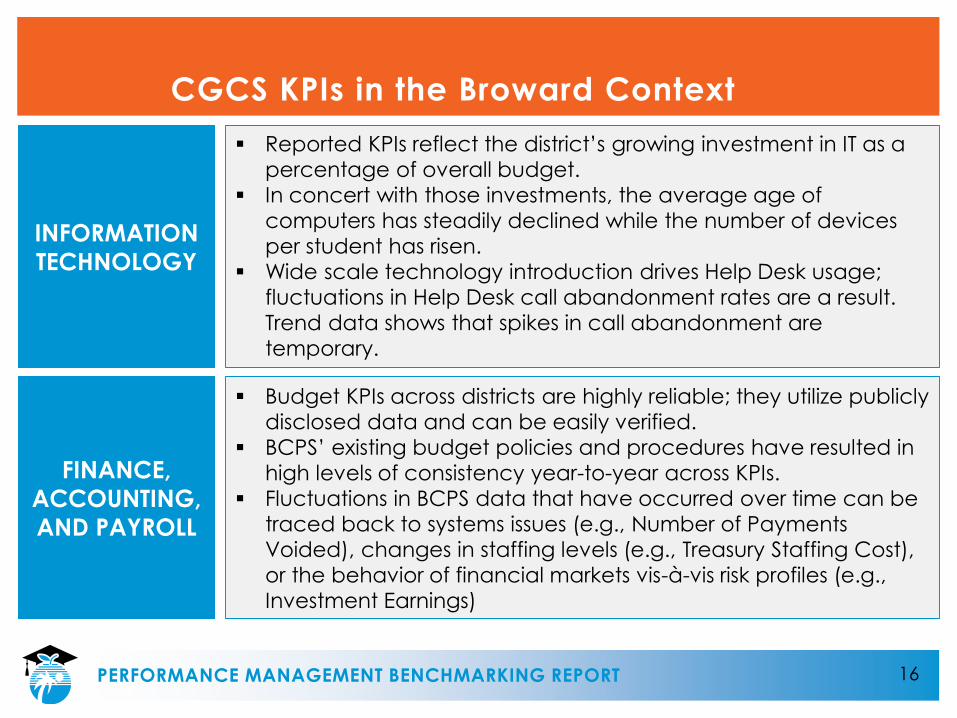
CGCS KPIs in the Broward Context
PERFORMANCE MANAGEMENT BENCHMARKING REPORT
Reported KPIs reflect the district’s growing investment in IT as a
percentage of overall budget.
In concert with those investments, the average age of
computers has steadily declined while the number of devices
per student has risen.
Wide scale technology introduction drives Help Desk usage;
fluctuations in Help Desk call abandonment rates are a result.
Trend data shows that spikes in call abandonment are
temporary.
INFORMATION
TECHNOLOGY
Budget KPIs across districts are highly reliable; they utilize publicly
disclosed data and can be easily verified.
BCPS’ existing budget policies and procedures have resulted in
high levels of consistency year-to-year across KPIs.
Fluctuations in BCPS data that have occurred over time can be
traced back to systems issues (e.g., Number of Payments
Voided), changes in staffing levels (e.g., Treasury Staffing Cost),
or the behavior of financial markets vis-à-vis risk profiles (e.g.,
Investment Earnings)
FINANCE,
ACCOUNTING,
AND PAYROLL
17
CGCS KPIs in the Broward Context
PERFORMANCE MANAGEMENT BENCHMARKING REPORT
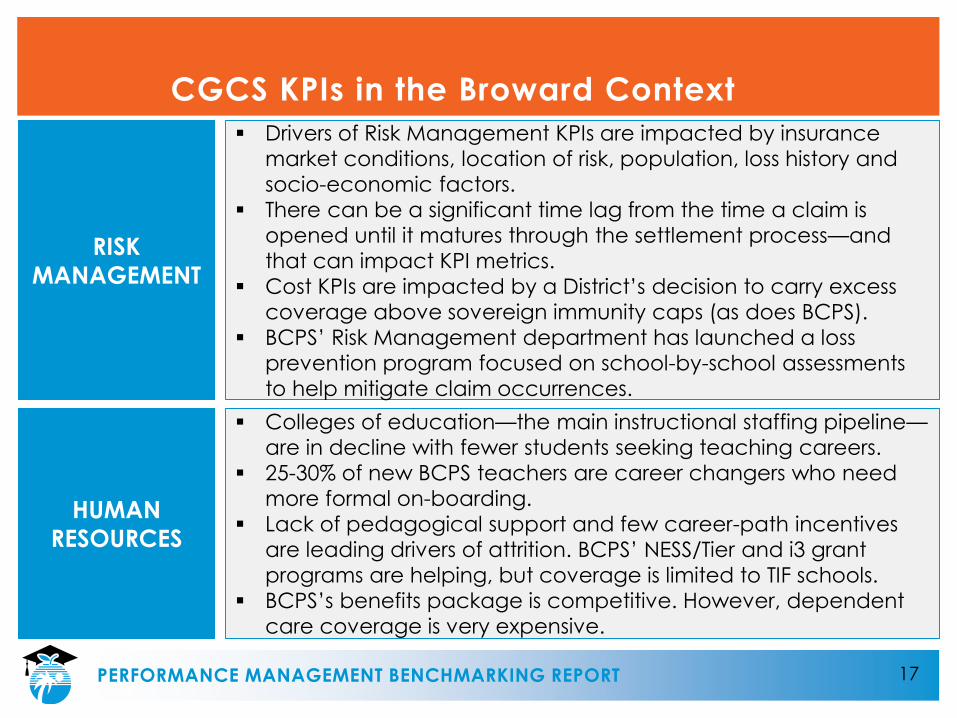
Colleges of education—the main instructional staffing pipeline—
are in decline with fewer students seeking teaching careers.
25-30% of new BCPS teachers are career changers who need
more formal on-boarding.
Lack of pedagogical support and few career-path incentives
are leading drivers of attrition. BCPS’ NESS/Tier and i3 grant
programs are helping, but coverage is limited to TIF schools.
BCPS’s benefits package is competitive. However, dependent
care coverage is very expensive.
HUMAN
RESOURCES
Drivers of Risk Management KPIs are impacted by insurance
market conditions, location of risk, population, loss history and
socio-economic factors.
There can be a significant time lag from the time a claim is
opened until it matures through the settlement process—and
that can impact KPI metrics.
Cost KPIs are impacted by a District’s decision to carry excess
coverage above sovereign immunity caps (as does BCPS).
BCPS’ Risk Management department has launched a loss
prevention program focused on school-by-school assessments
to help mitigate claim occurrences.
RISK
MANAGEMENT
18
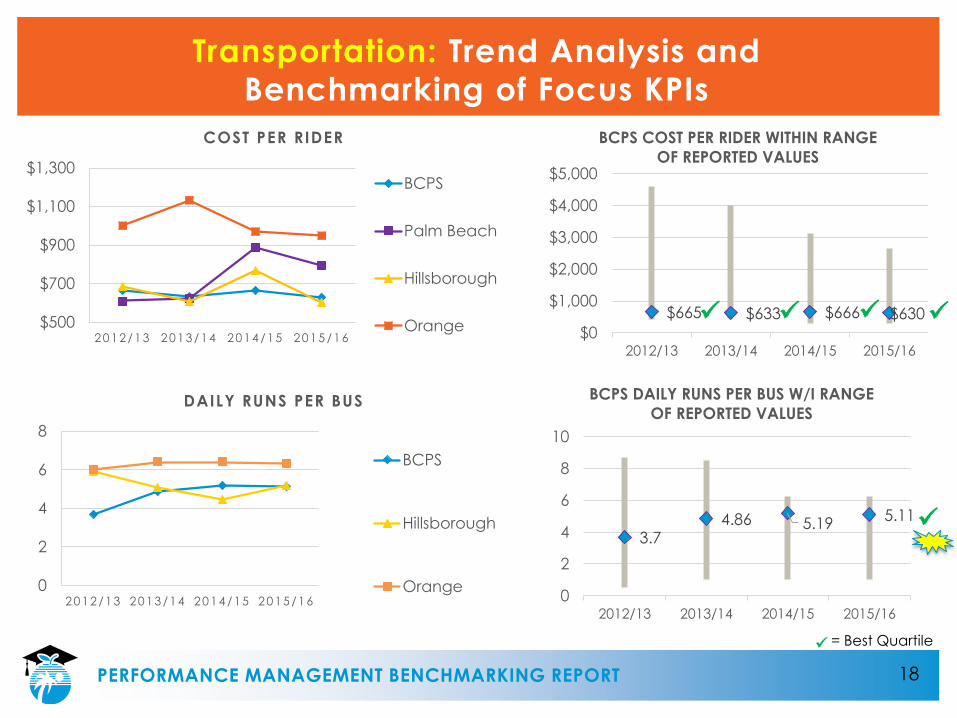
Transportation: Trend Analysis and
Benchmarking of Focus KPIs
PERFORMANCE MANAGEMENT BENCHMARKING REPORT
$500
$700
$900
$1,100
$1,300
2012/13 2013/14 2014/15 2015/16
COST PER RIDER
BCPS
Palm Beach
Hillsborough
Orange
0
2
4
6
8
2012/13 2013/14 2014/15 2015/16
DAILY RUNS PER BUS
BCPS
Hillsborough
Orange
$665 $633 $666 $630$0
$1,000
$2,000
$3,000
$4,000
$5,000
2012/13 2013/14 2014/15 2015/16
BCPS COST PER RIDER WITHIN RANGE
OF REPORTED VALUES
3.74.86 5.19
5.11
0
2
4
6
8
10
2012/13 2013/14 2014/15 2015/16
BCPS DAILY RUNS PER BUS W/I RANGE
OF REPORTED VALUES
= Best Quartile
19
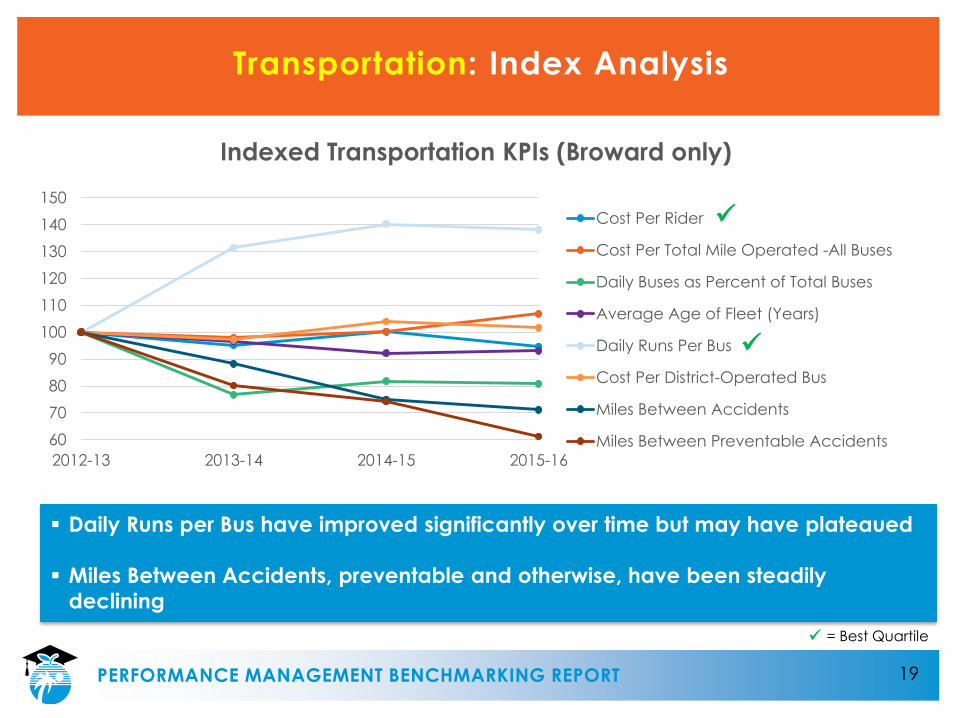
Transportation: Index Analysis
PERFORMANCE MANAGEMENT BENCHMARKING REPORT
60
70
80
90
100
110
120
130
140
150
2012-13 2013-14 2014-15 2015-16
Indexed Transportation KPIs (Broward only)
Cost Per Rider
Cost Per Total Mile Operated -All Buses
Daily Buses as Percent of Total Buses
Average Age of Fleet (Years)
Daily Runs Per Bus
Cost Per District-Operated Bus
Miles Between Accidents
Miles Between Preventable Accidents
Daily Runs per Bus have improved significantly over time but may have plateaued
Miles Between Accidents, preventable and otherwise, have been steadily
declining
= Best Quartile
20
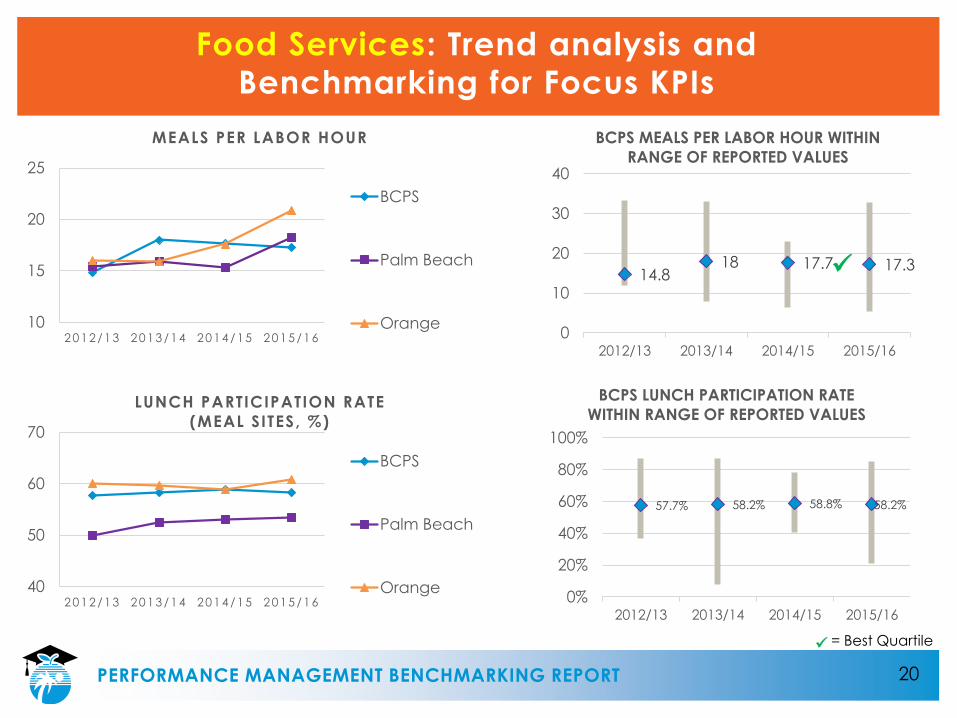
Food Services: Trend analysis and
Benchmarking for Focus KPIs
PERFORMANCE MANAGEMENT BENCHMARKING REPORT
10
15
20
25
2012/13 2013/14 2014/15 2015/16
MEALS PER LABOR HOUR
BCPS
Palm Beach
Orange
40
50
60
70
2012/13 2013/14 2014/15 2015/16
LUNCH PARTICIPATION RATE
(MEAL SITES, %)
BCPS
Palm Beach
Orange
14.818 17.7 17.3
0
10
20
30
40
2012/13 2013/14 2014/15 2015/16
BCPS MEALS PER LABOR HOUR WITHIN
RANGE OF REPORTED VALUES
57.7% 58.2% 58.8% 58.2%
0%
20%
40%
60%
80%
100%
2012/13 2013/14 2014/15 2015/16
BCPS LUNCH PARTICIPATION RATE
WITHIN RANGE OF REPORTED VALUES
= Best Quartile
21
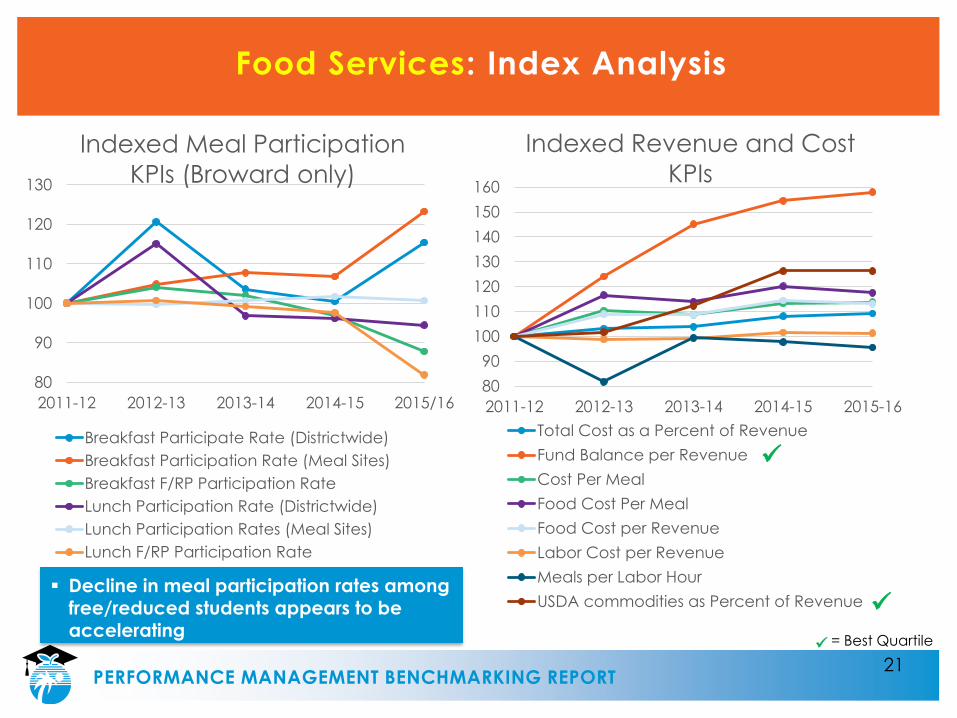
Food Services: Index Analysis
PERFORMANCE MANAGEMENT BENCHMARKING REPORT
80
90
100
110
120
130
2011-12 2012-13 2013-14 2014-15 2015/16
Indexed Meal Participation
KPIs (Broward only)
Breakfast Participate Rate (Districtwide)
Breakfast Participation Rate (Meal Sites)
Breakfast F/RP Participation Rate
Lunch Participation Rate (Districtwide)
Lunch Participation Rates (Meal Sites)
Lunch F/RP Participation Rate
= Best Quartile
80
90
100
110
120
130
140
150
160
2011-12 2012-13 2013-14 2014-15 2015-16
Indexed Revenue and Cost
KPIs
Total Cost as a Percent of Revenue
Fund Balance per Revenue
Cost Per Meal
Food Cost Per Meal
Food Cost per Revenue
Labor Cost per Revenue
Meals per Labor Hour
USDA commodities as Percent of Revenue
Decline in meal participation rates among free/reduced students appears to be accelerating
22
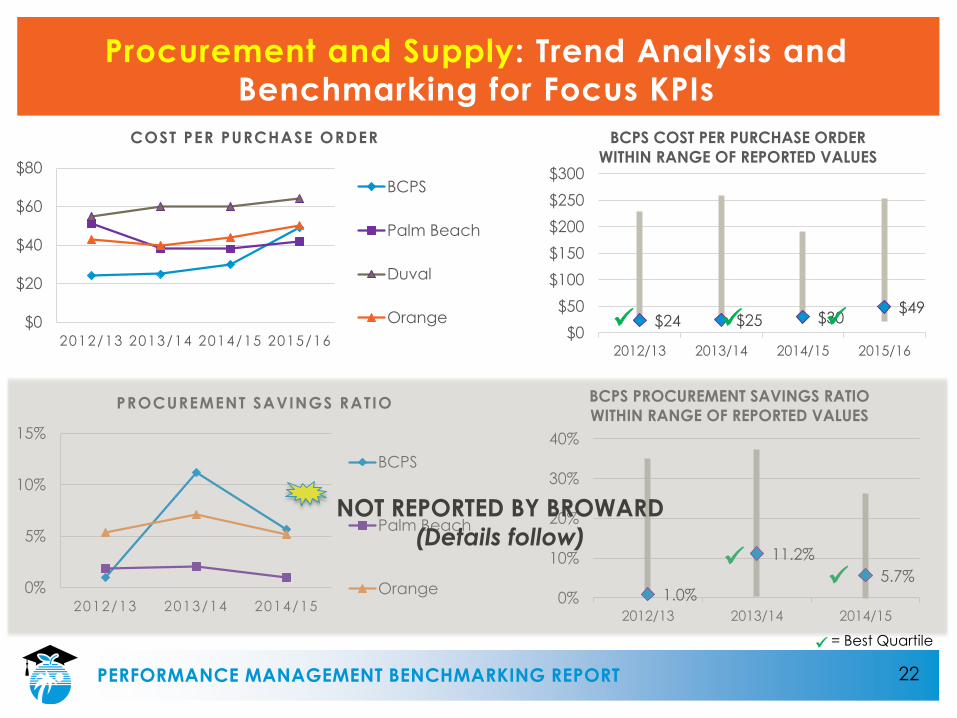
Procurement and Supply: Trend Analysis and
Benchmarking for Focus KPIs
PERFORMANCE MANAGEMENT BENCHMARKING REPORT
$0
$20
$40
$60
$80
2012/13 2013/14 2014/15 2015/16
COST PER PURCHASE ORDER
BCPS
Palm Beach
Duval
Orange
0%
5%
10%
15%
2012/13 2013/14 2014/15
PROCUREMENT SAVINGS RATIO
BCPS
Palm Beach
Orange
$24 $25 $30$49
$0
$50
$100
$150
$200
$250
$300
2012/13 2013/14 2014/15 2015/16
BCPS COST PER PURCHASE ORDER
WITHIN RANGE OF REPORTED VALUES
1.0%
11.2%
5.7%
0%
10%
20%
30%
40%
2012/13 2013/14 2014/15
BCPS PROCUREMENT SAVINGS RATIO
WITHIN RANGE OF REPORTED VALUES
= Best Quartile
NOT REPORTED BY BROWARD
(Details follow)
23
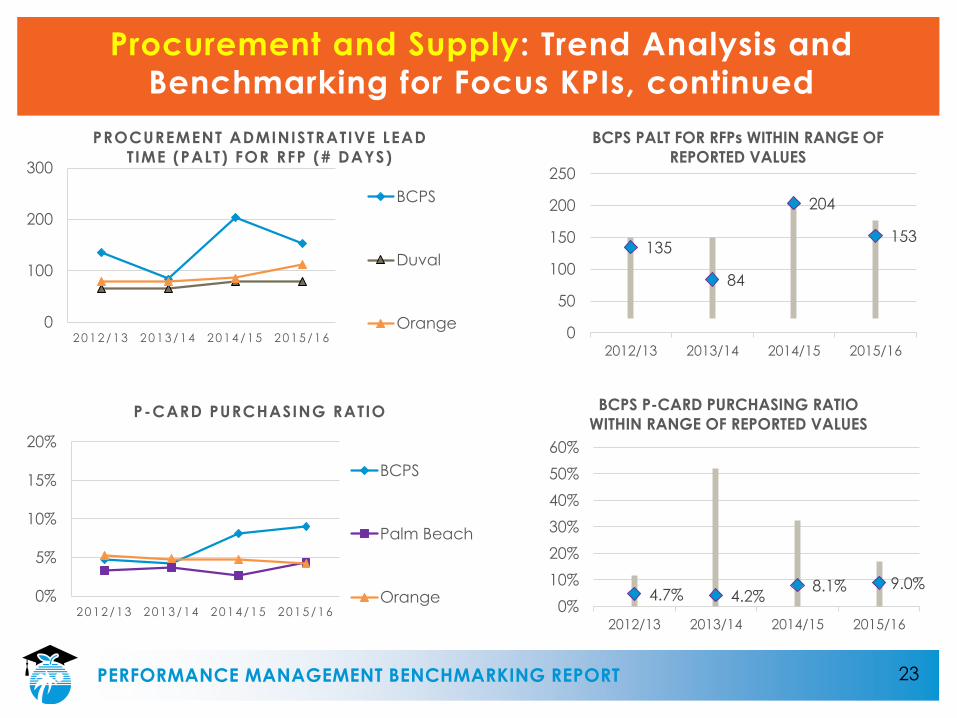
Procurement and Supply: Trend Analysis and
Benchmarking for Focus KPIs, continued
PERFORMANCE MANAGEMENT BENCHMARKING REPORT
0
100
200
300
2012/13 2013/14 2014/15 2015/16
PROCUREMENT ADMINISTRATIVE LEAD
TIME (PALT) FOR RFP (# DAYS)
BCPS
Duval
Orange
0%
5%
10%
15%
20%
2012/13 2013/14 2014/15 2015/16
P-CARD PURCHASING RATIO
BCPS
Palm Beach
Orange
135
84
204
153
0
50
100
150
200
250
2012/13 2013/14 2014/15 2015/16
BCPS PALT FOR RFPs WITHIN RANGE OF
REPORTED VALUES
4.7% 4.2%8.1% 9.0%
0%
10%
20%
30%
40%
50%
60%
2012/13 2013/14 2014/15 2015/16
BCPS P-CARD PURCHASING RATIO
WITHIN RANGE OF REPORTED VALUES
24
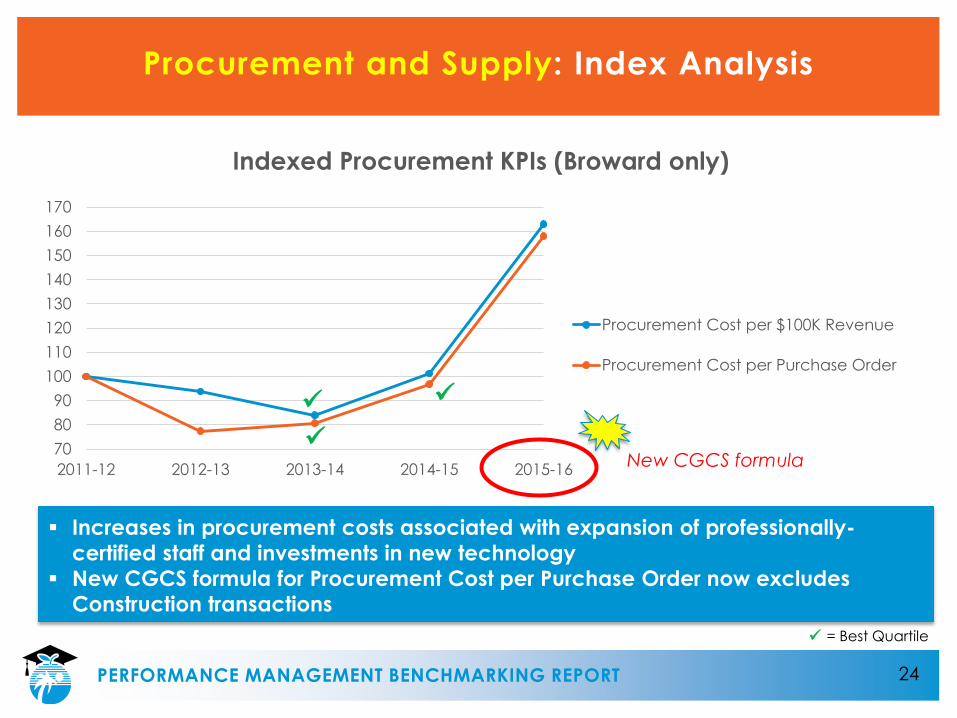
Procurement and Supply: Index Analysis
PERFORMANCE MANAGEMENT BENCHMARKING REPORT
70
80
90
100
110
120
130
140
150
160
170
2011-12 2012-13 2013-14 2014-15 2015-16
Indexed Procurement KPIs (Broward only)
Procurement Cost per $100K Revenue
Procurement Cost per Purchase Order
= Best Quartile
Increases in procurement costs associated with expansion of professionally-
certified staff and investments in new technology
New CGCS formula for Procurement Cost per Purchase Order now excludes
Construction transactions
New CGCS formula
25
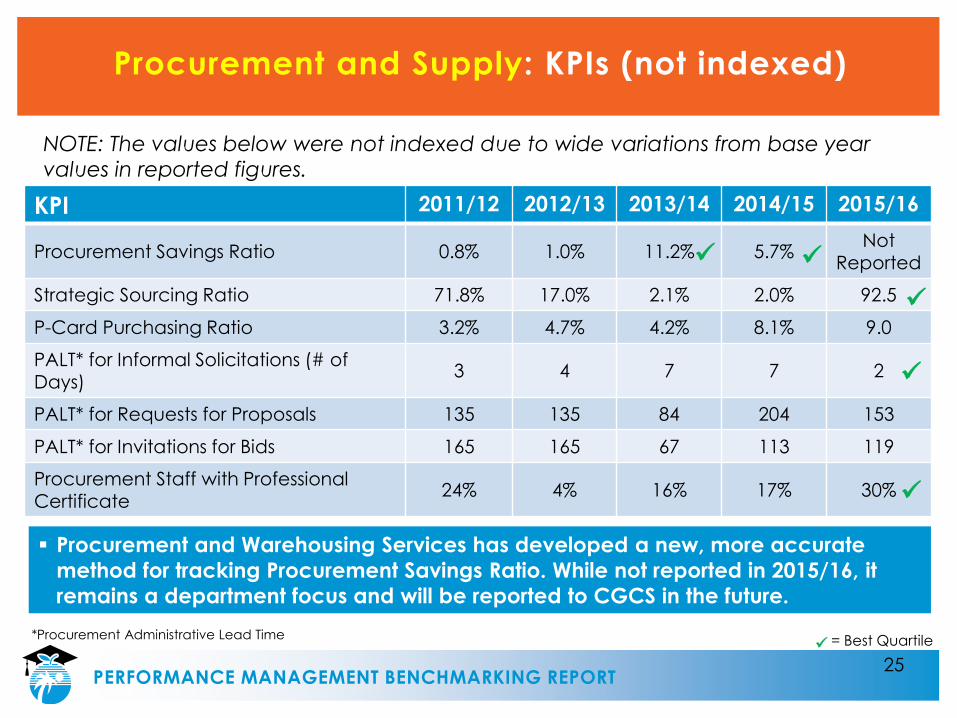
Procurement and Supply: KPIs (not indexed)
PERFORMANCE MANAGEMENT BENCHMARKING REPORT
= Best Quartile
KPI 2011/12 2012/13 2013/14 2014/15 2015/16
Procurement Savings Ratio 0.8% 1.0% 11.2% 5.7%Not
Reported
Strategic Sourcing Ratio 71.8% 17.0% 2.1% 2.0% 92.5
P-Card Purchasing Ratio 3.2% 4.7% 4.2% 8.1% 9.0
PALT* for Informal Solicitations (# of Days)
3 4 7 7 2
PALT* for Requests for Proposals 135 135 84 204 153
PALT* for Invitations for Bids 165 165 67 113 119
Procurement Staff with Professional Certificate
24% 4% 16% 17% 30%
*Procurement Administrative Lead Time
NOTE: The values below were not indexed due to wide variations from base year
values in reported figures.
Procurement and Warehousing Services has developed a new, more accurate
method for tracking Procurement Savings Ratio. While not reported in 2015/16, it
remains a department focus and will be reported to CGCS in the future.
26
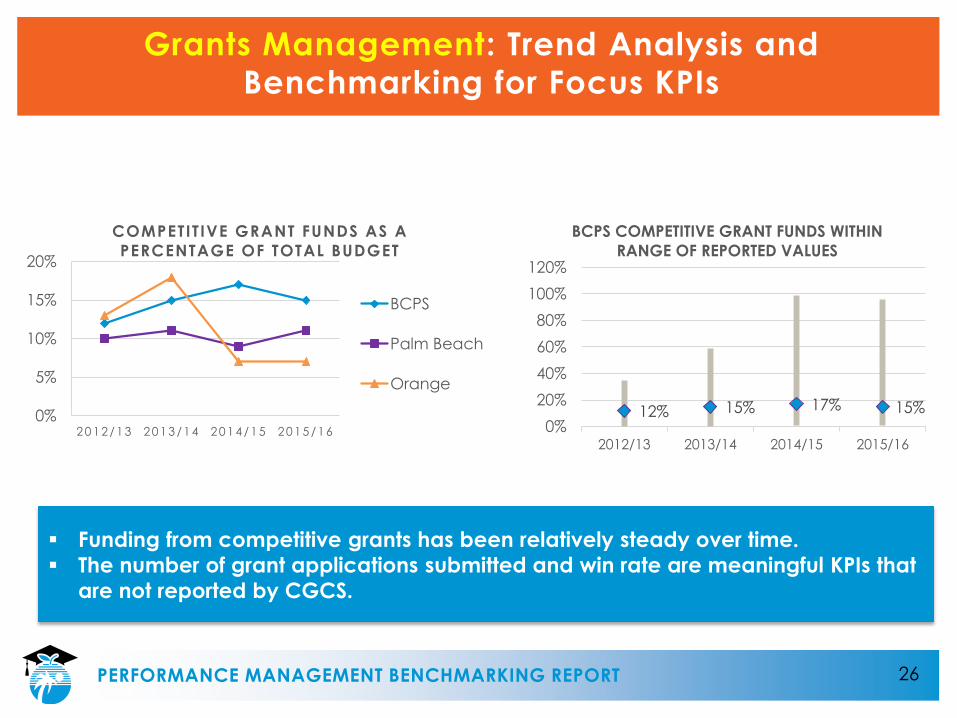
Grants Management: Trend Analysis and
Benchmarking for Focus KPIs
PERFORMANCE MANAGEMENT BENCHMARKING REPORT
0%
5%
10%
15%
20%
2012/13 2013/14 2014/15 2015/16
COMPETITIVE GRANT FUNDS AS A
PERCENTAGE OF TOTAL BUDGET
BCPS
Palm Beach
Orange
12% 15% 17% 15%0%
20%
40%
60%
80%
100%
120%
2012/13 2013/14 2014/15 2015/16
BCPS COMPETITIVE GRANT FUNDS WITHIN
RANGE OF REPORTED VALUES
Funding from competitive grants has been relatively steady over time.
The number of grant applications submitted and win rate are meaningful KPIs that
are not reported by CGCS.
27
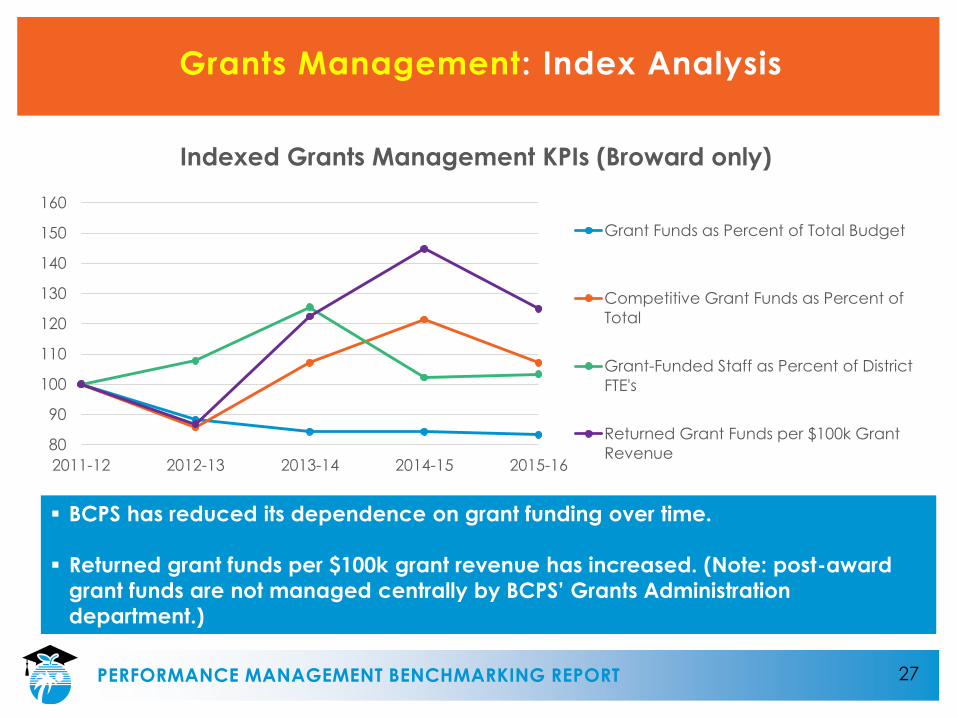
Grants Management: Index Analysis
PERFORMANCE MANAGEMENT BENCHMARKING REPORT
80
90
100
110
120
130
140
150
160
2011-12 2012-13 2013-14 2014-15 2015-16
Indexed Grants Management KPIs (Broward only)
Grant Funds as Percent of Total Budget
Competitive Grant Funds as Percent of
Total
Grant-Funded Staff as Percent of District
FTE's
Returned Grant Funds per $100k Grant
Revenue
BCPS has reduced its dependence on grant funding over time.
Returned grant funds per $100k grant revenue has increased. (Note: post-award
grant funds are not managed centrally by BCPS’ Grants Administration
department.)

28
Information Technology: Trend analysis and
Benchmarking for Focus KPIs
PERFORMANCE MANAGEMENT BENCHMARKING REPORT
0
2
4
6
2012/13 2013/14 2014/15 2015/16
AVERAGE AGE OF COMPUTERS - YEARS
BCPS
Miami Dade
Palm Beach
Orange
0
0.2
0.4
0.6
0.8
1
2012/13 2013/14 2014/15 2015/16
DEVICES PER STUDENT
BCPS
Duval
Orange
Miami-Dade
4.3
2.92.47
2.15
0
1
2
3
4
5
6
2012/13 2013/14 2014/15 2015/16
BCPS AVERAGE AGE OF COMPUTERS
WITHIN RANGE OF REPORTED VALUES
0.41 0.43 0.480.61
0
0.5
1
1.5
2012/13 2013/14 2014/15 2015/16
BCPS DEVICES PER STUDENT WITHIN
RANGE OF REPORTED VALUES
= Best Quartile
29
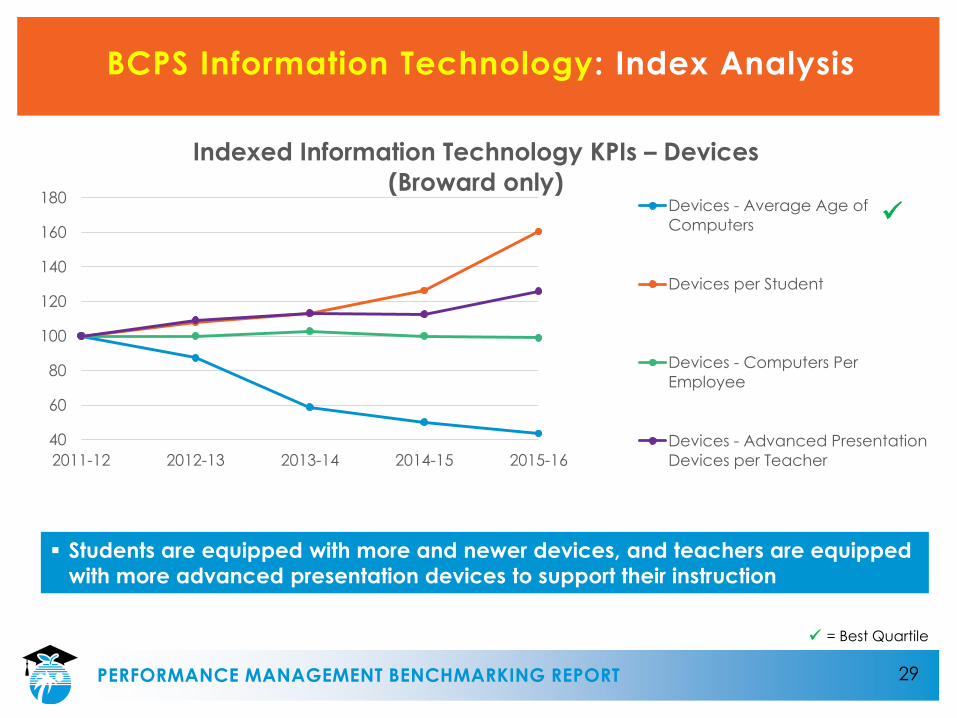
BCPS Information Technology: Index Analysis
PERFORMANCE MANAGEMENT BENCHMARKING REPORT
40
60
80
100
120
140
160
180
2011-12 2012-13 2013-14 2014-15 2015-16
Indexed Information Technology KPIs – Devices
(Broward only) Devices - Average Age of
Computers
Devices per Student
Devices - Computers Per
Employee
Devices - Advanced Presentation
Devices per Teacher
Students are equipped with more and newer devices, and teachers are equipped
with more advanced presentation devices to support their instruction
= Best Quartile
30
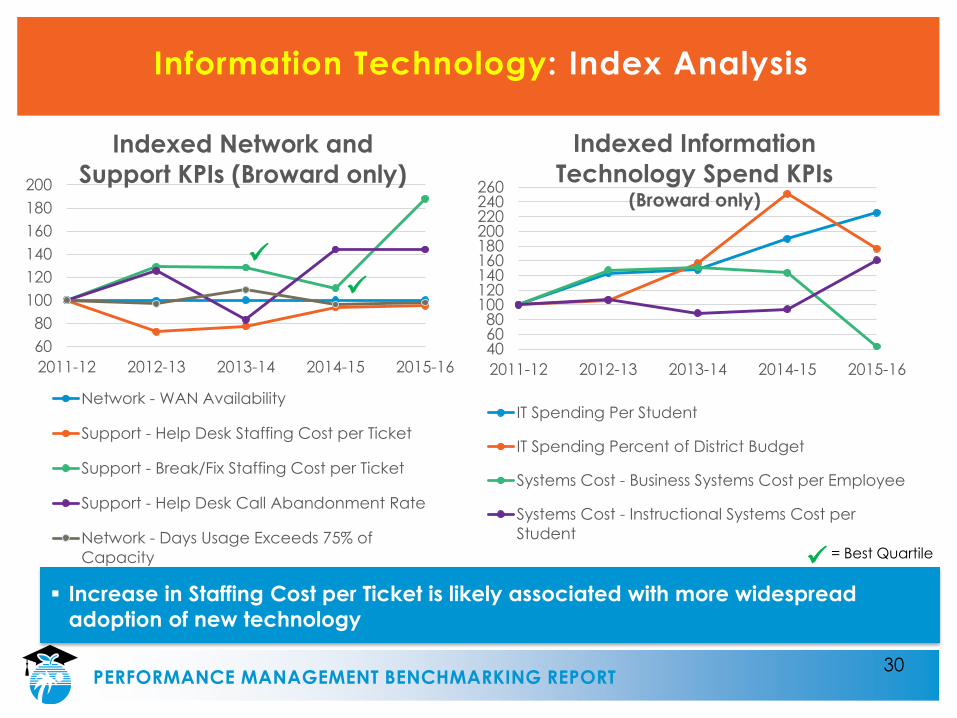
Information Technology: Index Analysis
PERFORMANCE MANAGEMENT BENCHMARKING REPORT
60
80
100
120
140
160
180
200
2011-12 2012-13 2013-14 2014-15 2015-16
Indexed Network and
Support KPIs (Broward only)
Network - WAN Availability
Support - Help Desk Staffing Cost per Ticket
Support - Break/Fix Staffing Cost per Ticket
Support - Help Desk Call Abandonment Rate
Network - Days Usage Exceeds 75% of
Capacity
406080
100120140160180200220240260
2011-12 2012-13 2013-14 2014-15 2015-16
Indexed Information
Technology Spend KPIs (Broward only)
IT Spending Per Student
IT Spending Percent of District Budget
Systems Cost - Business Systems Cost per Employee
Systems Cost - Instructional Systems Cost per
Student
Increase in Staffing Cost per Ticket is likely associated with more widespread
adoption of new technology
= Best Quartile
31
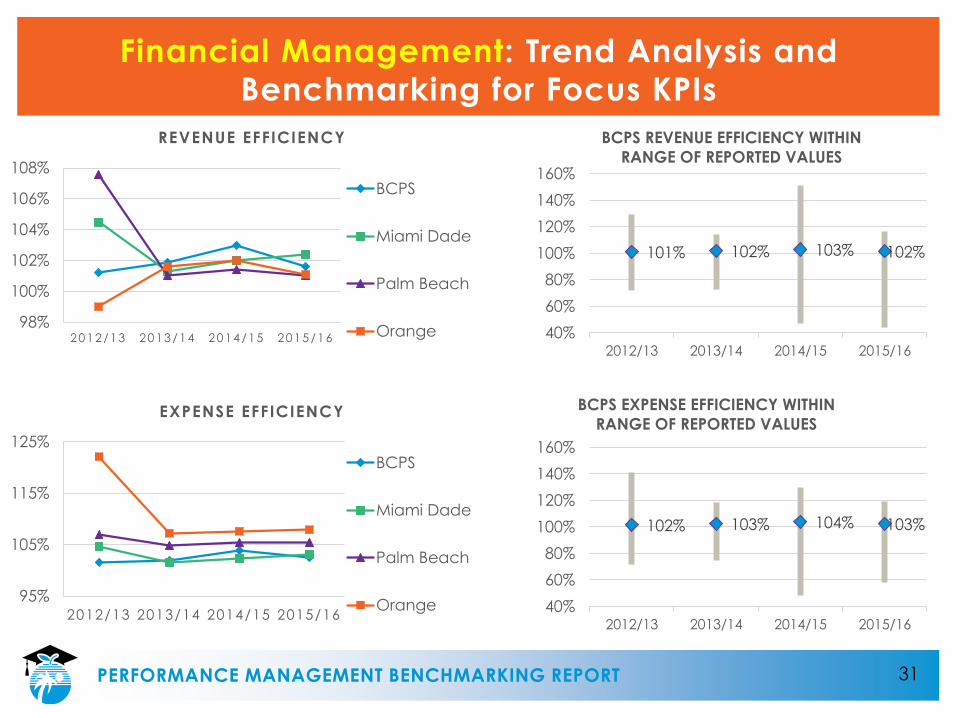
Financial Management: Trend Analysis and
Benchmarking for Focus KPIs
PERFORMANCE MANAGEMENT BENCHMARKING REPORT
98%
100%
102%
104%
106%
108%
2012/13 2013/14 2014/15 2015/16
REVENUE EFFICIENCY
BCPS
Miami Dade
Palm Beach
Orange
95%
105%
115%
125%
2012/13 2013/14 2014/15 2015/16
EXPENSE EFFICIENCY
BCPS
Miami Dade
Palm Beach
Orange
101% 102% 103% 102%
40%
60%
80%
100%
120%
140%
160%
2012/13 2013/14 2014/15 2015/16
BCPS REVENUE EFFICIENCY WITHIN
RANGE OF REPORTED VALUES
102% 103% 104% 103%
40%
60%
80%
100%
120%
140%
160%
2012/13 2013/14 2014/15 2015/16
BCPS EXPENSE EFFICIENCY WITHIN
RANGE OF REPORTED VALUES
32
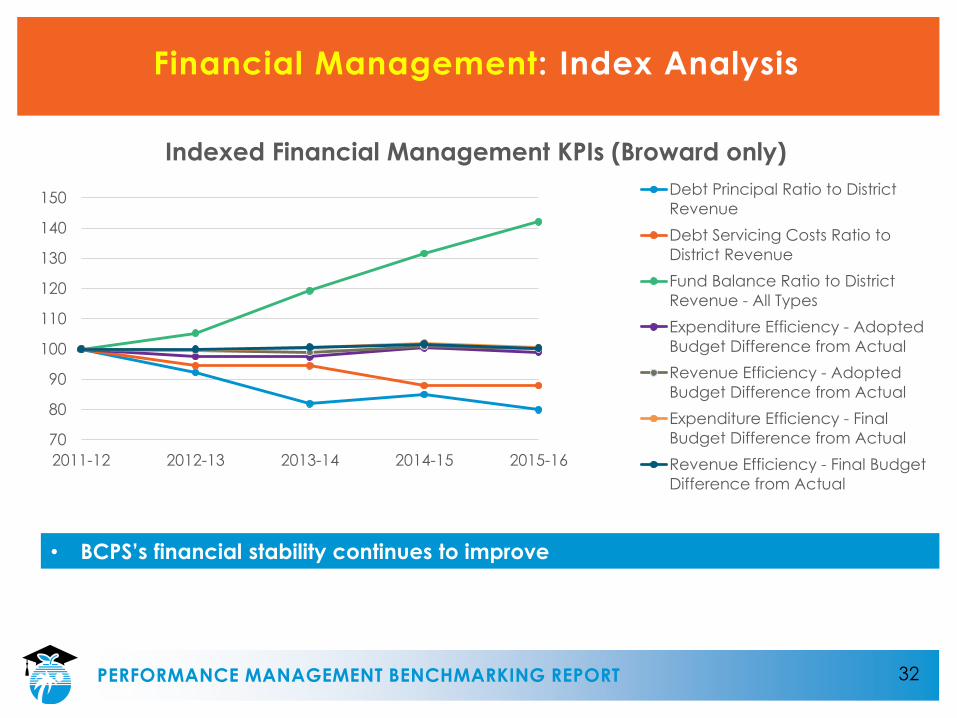
Financial Management: Index Analysis
PERFORMANCE MANAGEMENT BENCHMARKING REPORT
70
80
90
100
110
120
130
140
150
2011-12 2012-13 2013-14 2014-15 2015-16
Indexed Financial Management KPIs (Broward only)
Debt Principal Ratio to District
Revenue
Debt Servicing Costs Ratio to
District Revenue
Fund Balance Ratio to District
Revenue - All Types
Expenditure Efficiency - Adopted
Budget Difference from Actual
Revenue Efficiency - Adopted
Budget Difference from Actual
Expenditure Efficiency - Final
Budget Difference from Actual
Revenue Efficiency - Final Budget
Difference from Actual
• BCPS’s financial stability continues to improve
33
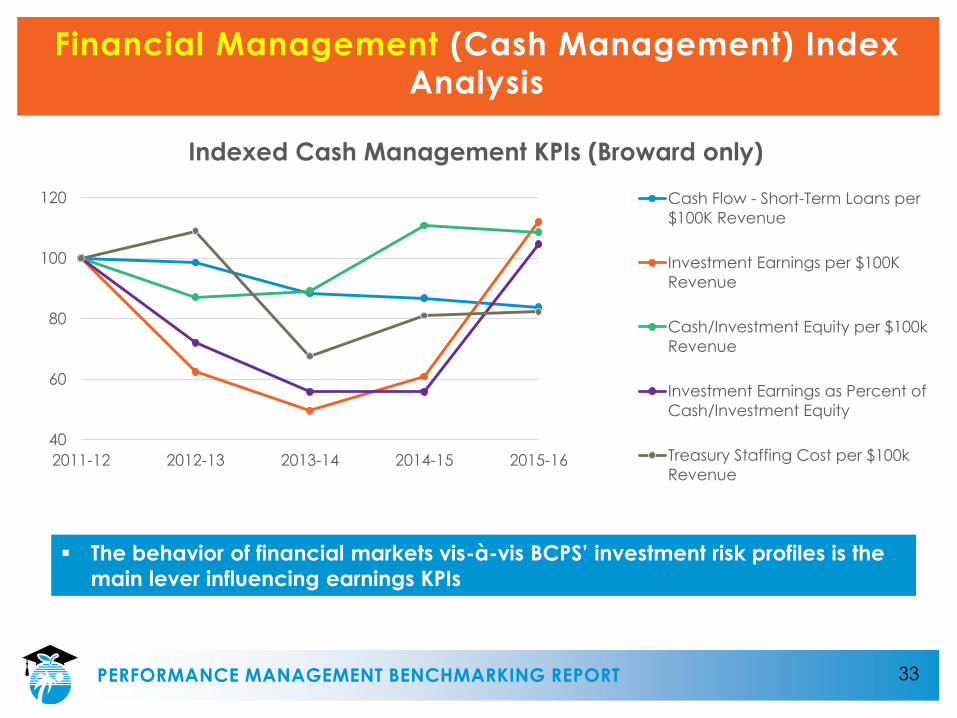
Financial Management (Cash Management) Index
Analysis
PERFORMANCE MANAGEMENT BENCHMARKING REPORT
40
60
80
100
120
2011-12 2012-13 2013-14 2014-15 2015-16
Indexed Cash Management KPIs (Broward only)
Cash Flow - Short-Term Loans per
$100K Revenue
Investment Earnings per $100K
Revenue
Cash/Investment Equity per $100k
Revenue
Investment Earnings as Percent of
Cash/Investment Equity
Treasury Staffing Cost per $100k
Revenue
The behavior of financial markets vis-à-vis BCPS’ investment risk profiles is the
main lever influencing earnings KPIs
34
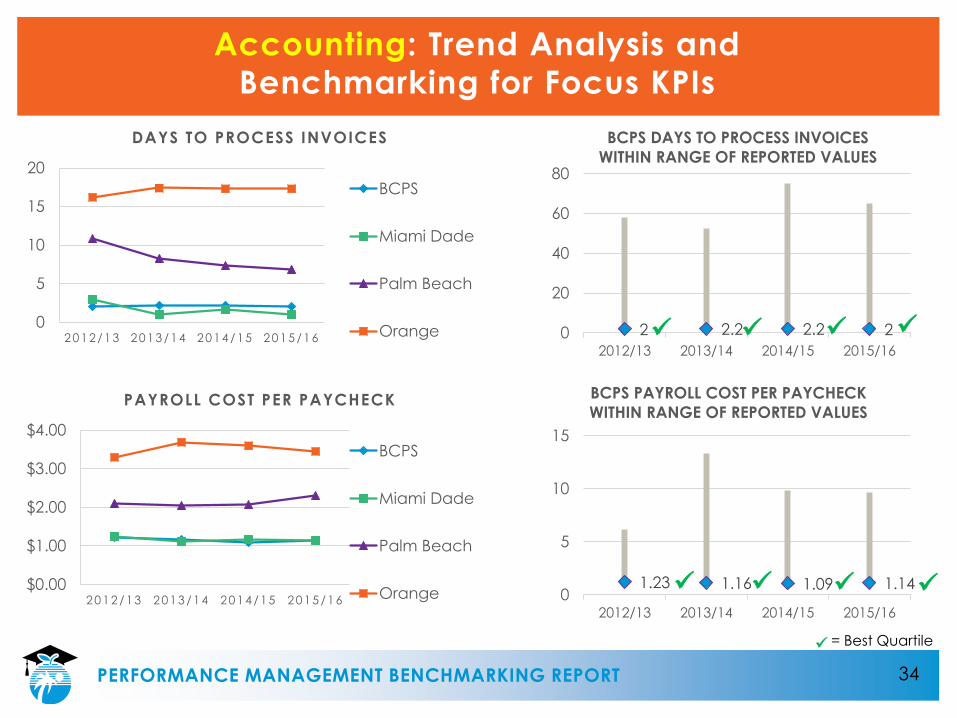
Accounting: Trend Analysis and
Benchmarking for Focus KPIs
PERFORMANCE MANAGEMENT BENCHMARKING REPORT
0
5
10
15
20
2012/13 2013/14 2014/15 2015/16
DAYS TO PROCESS INVOICES
BCPS
Miami Dade
Palm Beach
Orange
$0.00
$1.00
$2.00
$3.00
$4.00
2012/13 2013/14 2014/15 2015/16
PAYROLL COST PER PAYCHECK
BCPS
Miami Dade
Palm Beach
Orange
2 2.2 2.2 20
20
40
60
80
2012/13 2013/14 2014/15 2015/16
BCPS DAYS TO PROCESS INVOICES
WITHIN RANGE OF REPORTED VALUES
1.23 1.16 1.09 1.140
5
10
15
2012/13 2013/14 2014/15 2015/16
BCPS PAYROLL COST PER PAYCHECK
WITHIN RANGE OF REPORTED VALUES
= Best Quartile
35
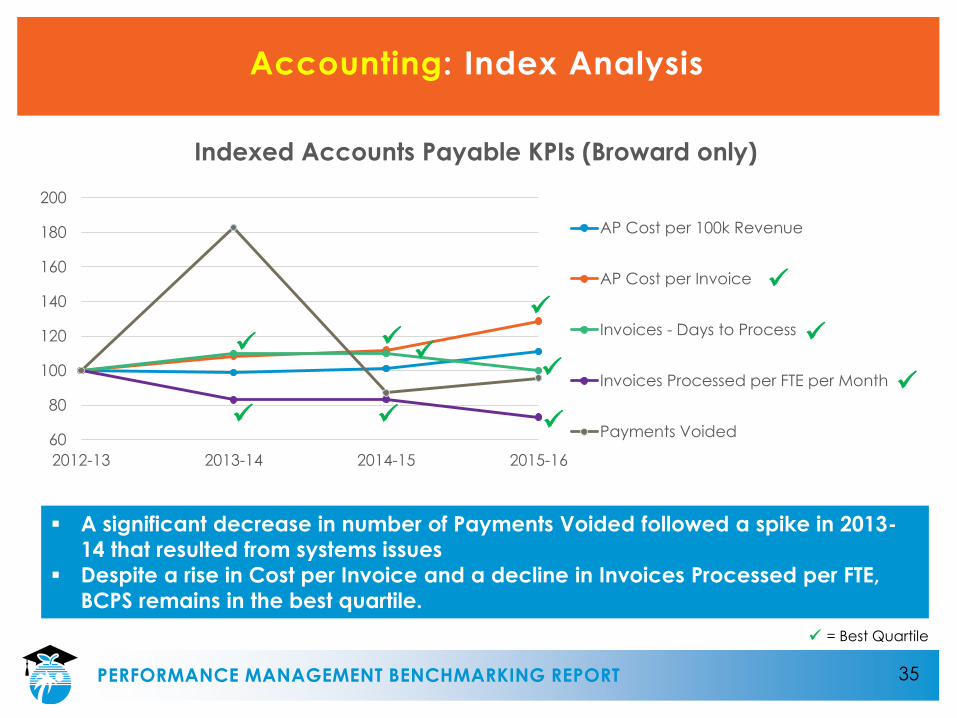
Accounting: Index Analysis
PERFORMANCE MANAGEMENT BENCHMARKING REPORT
60
80
100
120
140
160
180
200
2012-13 2013-14 2014-15 2015-16
Indexed Accounts Payable KPIs (Broward only)
AP Cost per 100k Revenue
AP Cost per Invoice
Invoices - Days to Process
Invoices Processed per FTE per Month
Payments Voided
A significant decrease in number of Payments Voided followed a spike in 2013-
14 that resulted from systems issues
Despite a rise in Cost per Invoice and a decline in Invoices Processed per FTE,
BCPS remains in the best quartile.
= Best Quartile
36
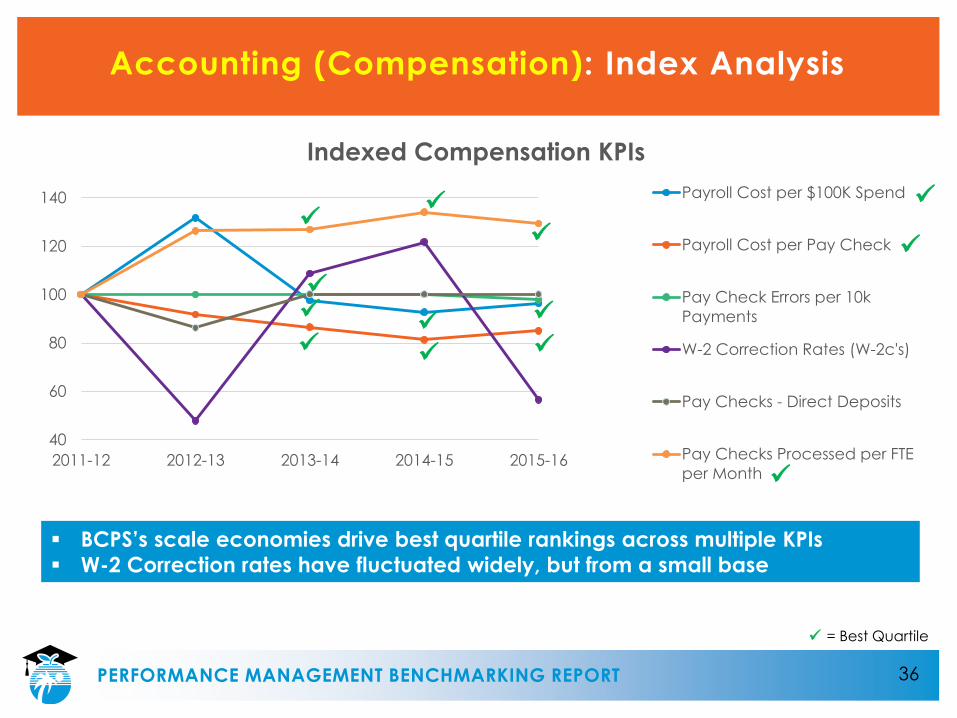
Accounting (Compensation): Index Analysis
PERFORMANCE MANAGEMENT BENCHMARKING REPORT
40
60
80
100
120
140
2011-12 2012-13 2013-14 2014-15 2015-16
Indexed Compensation KPIs
Payroll Cost per $100K Spend
Payroll Cost per Pay Check
Pay Check Errors per 10k
Payments
W-2 Correction Rates (W-2c's)
Pay Checks - Direct Deposits
Pay Checks Processed per FTE
per Month
BCPS’s scale economies drive best quartile rankings across multiple KPIs
W-2 Correction rates have fluctuated widely, but from a small base
= Best Quartile
37
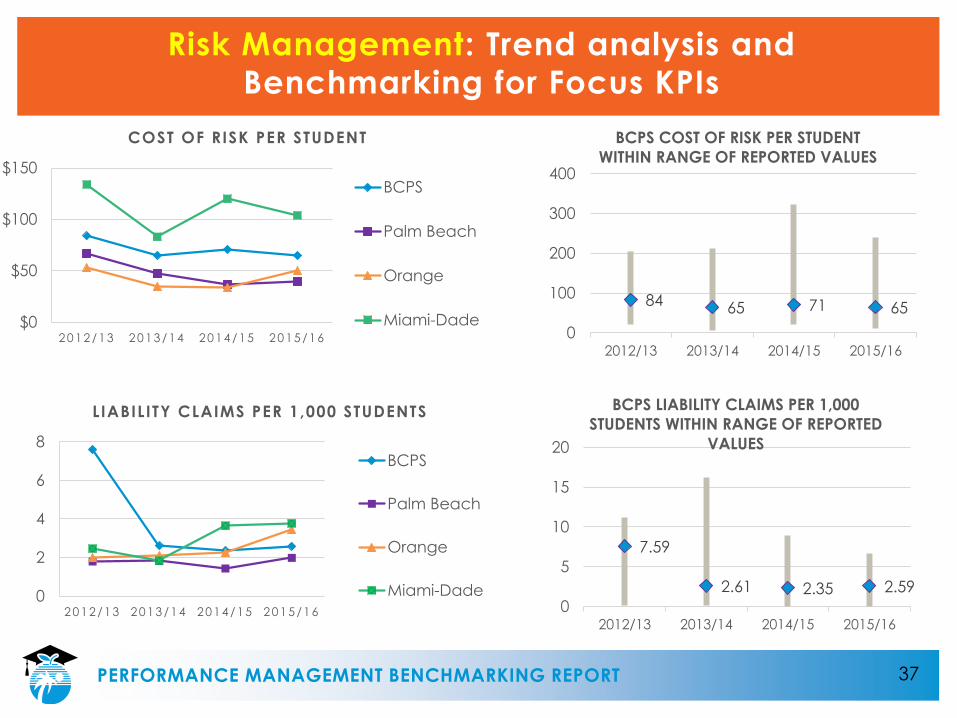
Risk Management: Trend analysis and
Benchmarking for Focus KPIs
PERFORMANCE MANAGEMENT BENCHMARKING REPORT
$0
$50
$100
$150
2012/13 2013/14 2014/15 2015/16
COST OF RISK PER STUDENT
BCPS
Palm Beach
Orange
Miami-Dade
0
2
4
6
8
2012/13 2013/14 2014/15 2015/16
LIABILITY CLAIMS PER 1,000 STUDENTS
BCPS
Palm Beach
Orange
Miami-Dade
84 65 71 65
0
100
200
300
400
2012/13 2013/14 2014/15 2015/16
BCPS COST OF RISK PER STUDENT
WITHIN RANGE OF REPORTED VALUES
7.59
2.61 2.35 2.59
0
5
10
15
20
2012/13 2013/14 2014/15 2015/16
BCPS LIABILITY CLAIMS PER 1,000
STUDENTS WITHIN RANGE OF REPORTED
VALUES
38
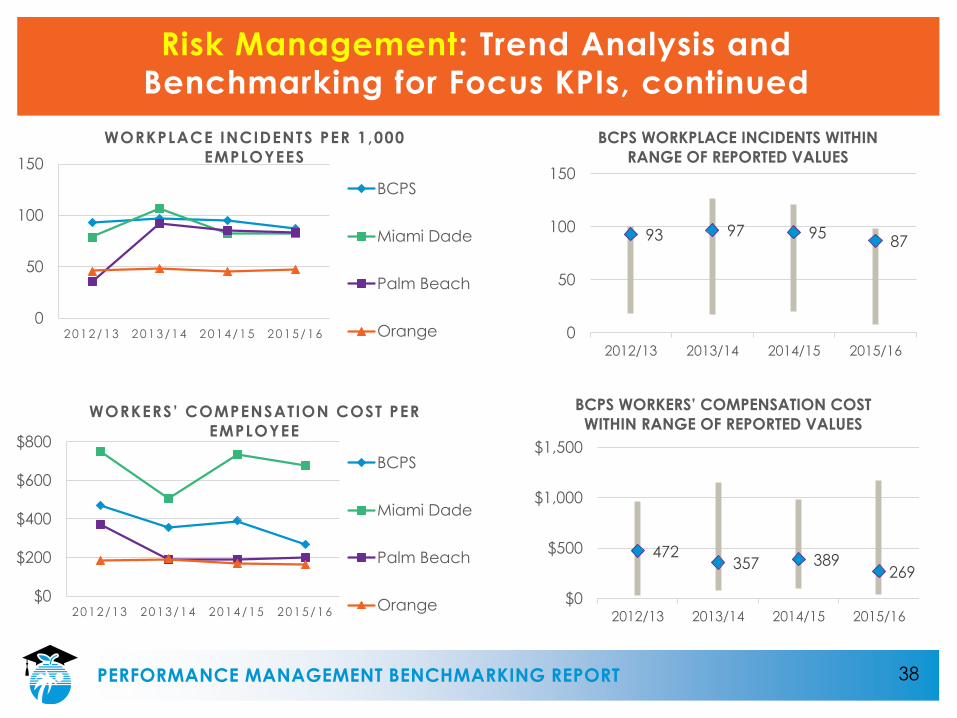
Risk Management: Trend Analysis and
Benchmarking for Focus KPIs, continued
PERFORMANCE MANAGEMENT BENCHMARKING REPORT
0
50
100
150
2012/13 2013/14 2014/15 2015/16
WORKPLACE INCIDENTS PER 1,000
EMPLOYEES
BCPS
Miami Dade
Palm Beach
Orange
$0
$200
$400
$600
$800
2012/13 2013/14 2014/15 2015/16
WORKERS’ COMPENSATION COST PER
EMPLOYEE
BCPS
Miami Dade
Palm Beach
Orange
93 97 9587
0
50
100
150
2012/13 2013/14 2014/15 2015/16
BCPS WORKPLACE INCIDENTS WITHIN
RANGE OF REPORTED VALUES
472357 389
269
$0
$500
$1,000
$1,500
2012/13 2013/14 2014/15 2015/16
BCPS WORKERS’ COMPENSATION COST
WITHIN RANGE OF REPORTED VALUES
39
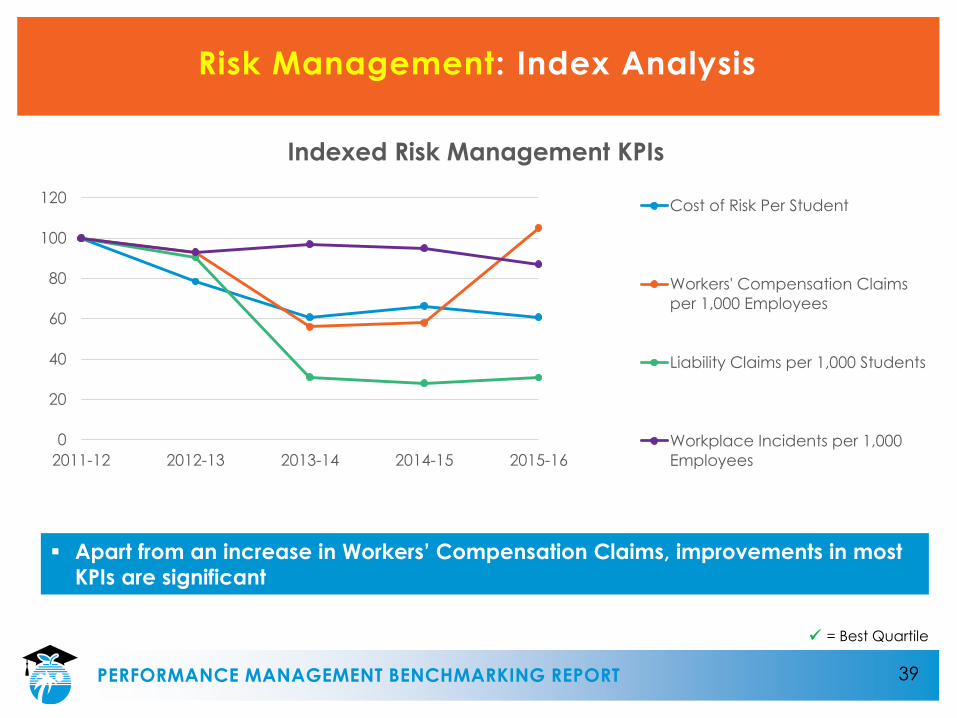
Risk Management: Index Analysis
PERFORMANCE MANAGEMENT BENCHMARKING REPORT
0
20
40
60
80
100
120
2011-12 2012-13 2013-14 2014-15 2015-16
Indexed Risk Management KPIs
Cost of Risk Per Student
Workers' Compensation Claims
per 1,000 Employees
Liability Claims per 1,000 Students
Workplace Incidents per 1,000
Employees
Apart from an increase in Workers’ Compensation Claims, improvements in most
KPIs are significant
= Best Quartile
40
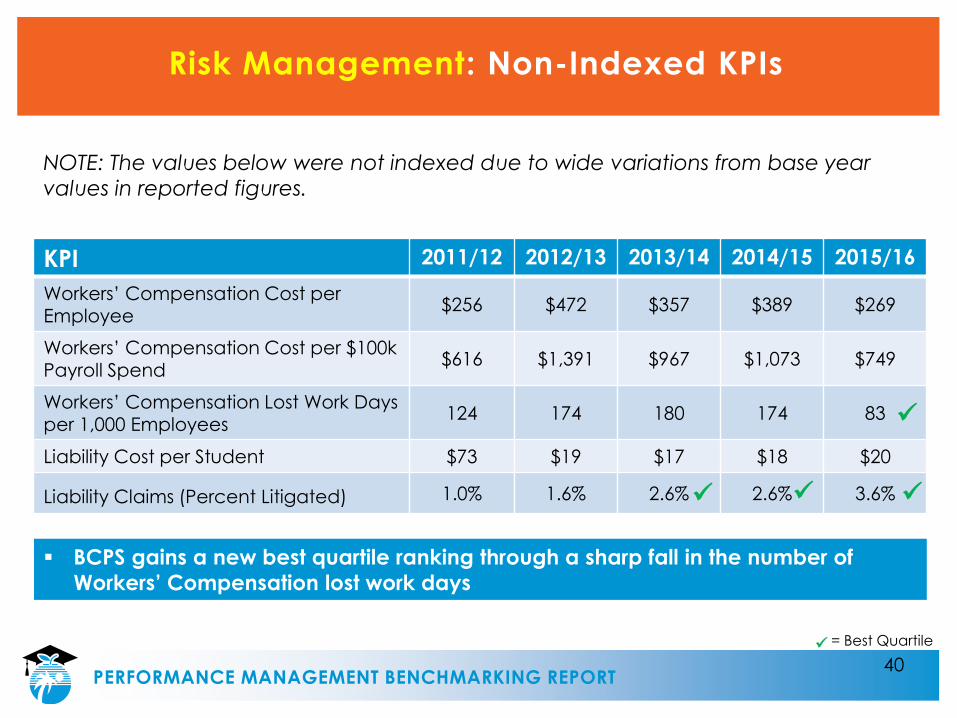
Risk Management: Non-Indexed KPIs
PERFORMANCE MANAGEMENT BENCHMARKING REPORT
= Best Quartile
KPI 2011/12 2012/13 2013/14 2014/15 2015/16
Workers’ Compensation Cost per Employee
$256 $472 $357 $389 $269
Workers’ Compensation Cost per $100kPayroll Spend
$616 $1,391 $967 $1,073 $749
Workers’ Compensation Lost Work Days per 1,000 Employees
124 174 180 174 83
Liability Cost per Student $73 $19 $17 $18 $20
Liability Claims (Percent Litigated) 1.0% 1.6% 2.6% 2.6% 3.6%
NOTE: The values below were not indexed due to wide variations from base year
values in reported figures.
BCPS gains a new best quartile ranking through a sharp fall in the number of
Workers’ Compensation lost work days
41
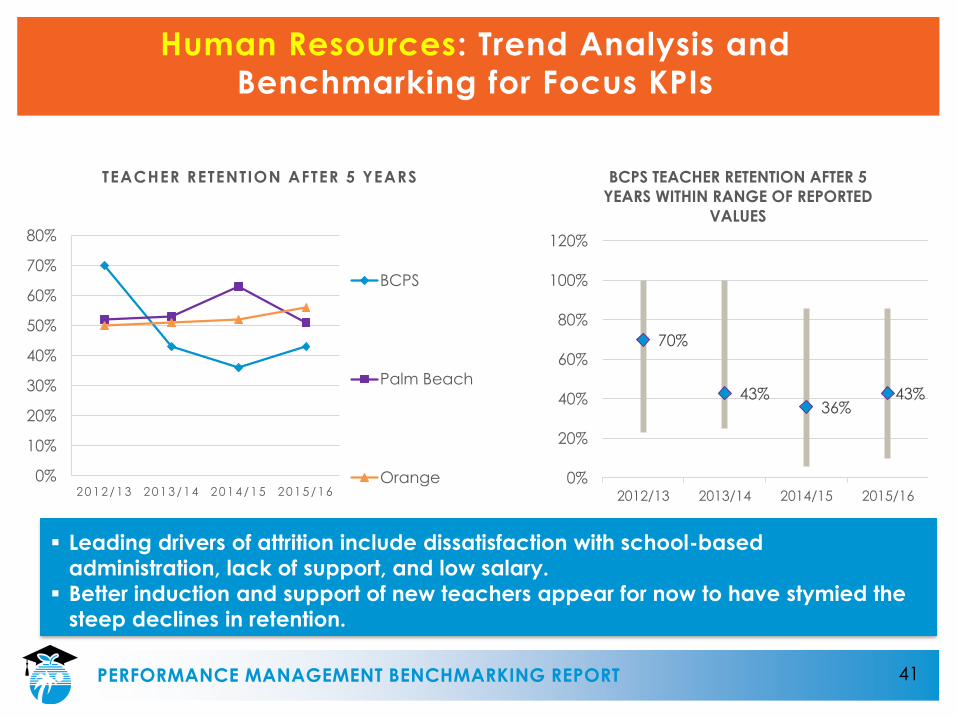
Human Resources: Trend Analysis and
Benchmarking for Focus KPIs
PERFORMANCE MANAGEMENT BENCHMARKING REPORT
0%
10%
20%
30%
40%
50%
60%
70%
80%
2012/13 2013/14 2014/15 2015/16
TEACHER RETENTION AFTER 5 YEARS
BCPS
Palm Beach
Orange
70%
43%36%
43%
0%
20%
40%
60%
80%
100%
120%
2012/13 2013/14 2014/15 2015/16
BCPS TEACHER RETENTION AFTER 5
YEARS WITHIN RANGE OF REPORTED
VALUES
Leading drivers of attrition include dissatisfaction with school-based
administration, lack of support, and low salary.
Better induction and support of new teachers appear for now to have stymied the
steep declines in retention.
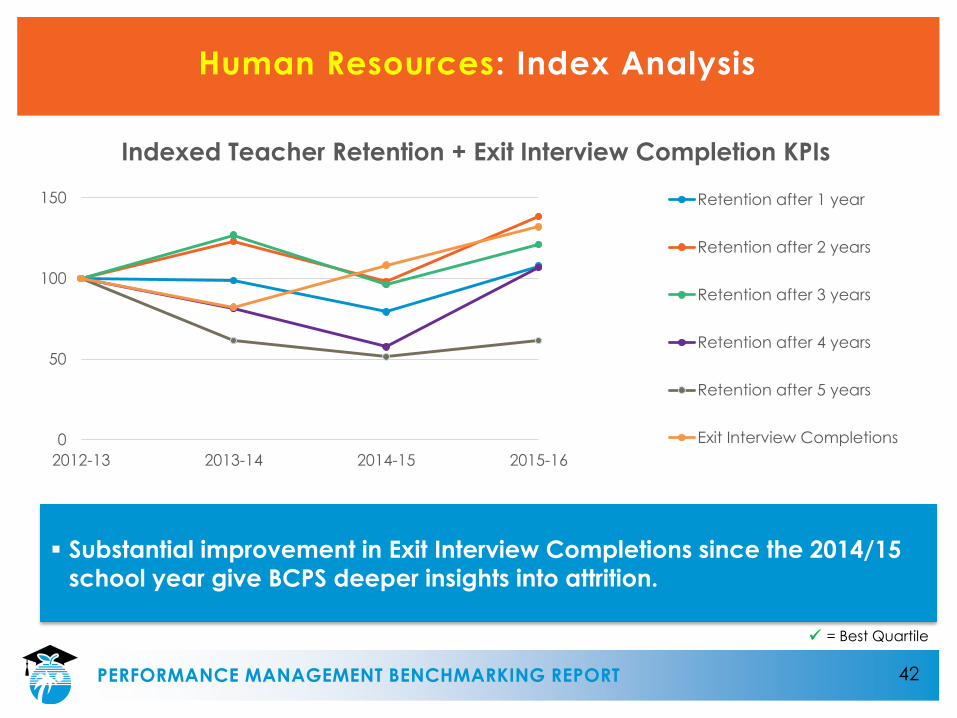
Substantial improvement in Exit Interview Completions since the 2014/15
school year give BCPS deeper insights into attrition.
42
Human Resources: Index Analysis
PERFORMANCE MANAGEMENT BENCHMARKING REPORT
0
50
100
150
2012-13 2013-14 2014-15 2015-16
Indexed Teacher Retention + Exit Interview Completion KPIs
Retention after 1 year
Retention after 2 years
Retention after 3 years
Retention after 4 years
Retention after 5 years
Exit Interview Completions
= Best Quartile
43
NEW: Academic KPIsSecondary Level
PERFORMANCE MANAGEMENT BENCHMARKING REPORT
CGCS’s pilot academic KPI report, Academic Performance Indicators,
largely draws its KPIs from NAEP assessments. However, because of the
size and distribution of its population, BCPS is not part of the NAEP
sample.
Several incidents of inaccurate best quartile rankings appear in the
CGCS report, with two incidents erroneously excluding BCPS and one
erroneously including BCPS.
Some subgroup data is highly suspicious. For example, year-over-year
change in AP exam data among black males is exactly the same as it is
for all students for BCPS, Miami-Dade, and Palm Beach counties.
Due to concerns over data accuracy, Performance Management
cautions usage of or reliance on the CGCS report. We have alerted
CGCS and will continue to monitor the evolution and utility of CGCS’s
academic KPI reporting.
For the purposes of this report, we are only including benchmarks at the
Secondary level that present data aggregated for all students.
44
NEW: Academic KPIsSecondary Level
PERFORMANCE MANAGEMENT BENCHMARKING REPORT
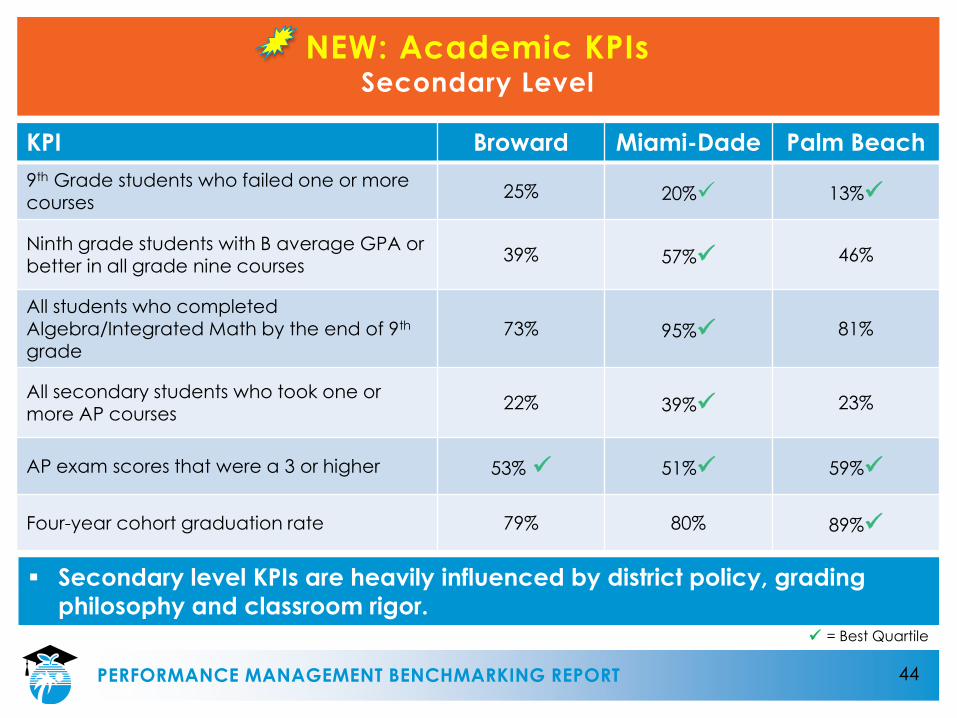
KPI Broward Miami-Dade Palm Beach
9th Grade students who failed one or more
courses25% 20% 13%
Ninth grade students with B average GPA or better in all grade nine courses
39% 57% 46%
All students who completed Algebra/Integrated Math by the end of 9th
grade73% 95% 81%
All secondary students who took one or more AP courses
22% 39% 23%
AP exam scores that were a 3 or higher 53% 51% 59%
Four-year cohort graduation rate 79% 80% 89%
= Best Quartile
Secondary level KPIs are heavily influenced by district policy, grading
philosophy and classroom rigor.
45
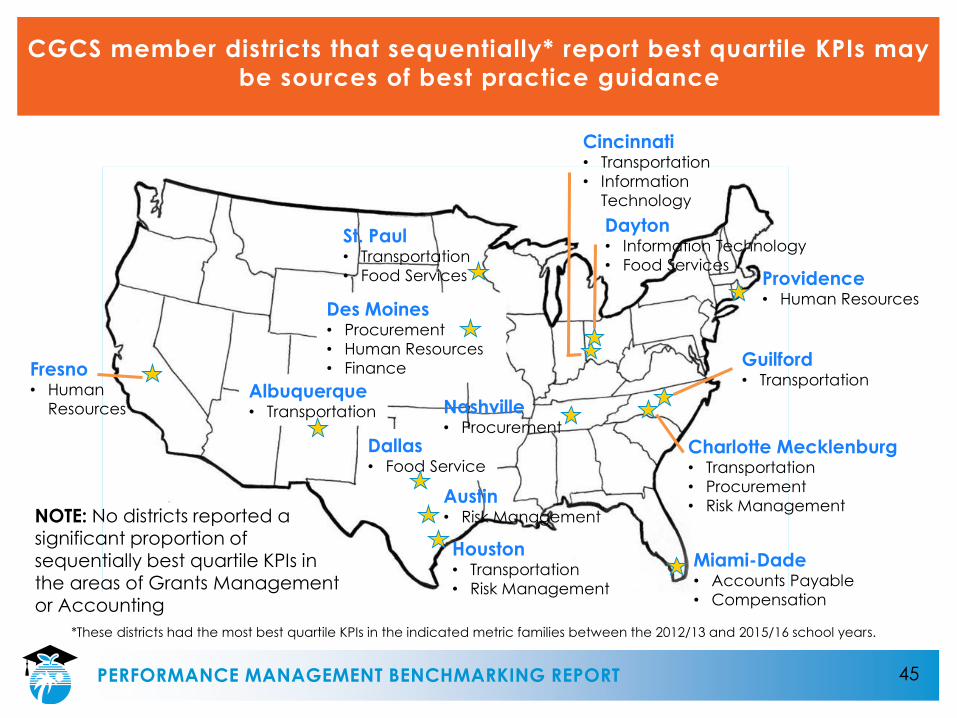
CGCS member districts that sequentially* report best quartile KPIs may
be sources of best practice guidance
PERFORMANCE MANAGEMENT BENCHMARKING REPORT
Albuquerque• Transportation
Charlotte Mecklenburg• Transportation
• Procurement
• Risk Management
Cincinnati• Transportation
• Information
Technology
Guilford• Transportation
Houston• Transportation
• Risk Management
Dallas• Food Service
Nashville• Procurement
Des Moines• Procurement
• Human Resources
• Finance
Dayton• Information Technology
• Food Services
Miami-Dade• Accounts Payable
• Compensation
Austin• Risk Management
Providence• Human Resources
Fresno• Human
Resources
St. Paul• Transportation
• Food Services
*These districts had the most best quartile KPIs in the indicated metric families between the 2012/13 and 2015/16 school years.
NOTE: No districts reported a significant proportion of sequentially best quartile KPIs in the areas of Grants Management or Accounting
46
Recommendations
PERFORMANCE MANAGEMENT BENCHMARKING REPORT
BCPS should leverage its membership in the CGCS to help drive quality
improvements in the annual “Managing for Results” and, more critically,
the “Academic Key Performance Indicators” reports.
Performance Management should conduct Performance Management
reviews of select departments to help ensure benchmarking data is being
used to drive continuous improvements and to drive a balanced view of
BCPS’s results. A temporary shift in focus from academics to operations is
recommended.
The impact of policy on many KPIs has not been thoroughly investigated.
In its work with various departments, Performance Management will seek
to develop a richer understanding of the magnitude of policy effects.
Performance Management will continue to spotlight the inter-relationships
and trade-offs that are associated with KPIs. It will highlight these in its next
benchmarking report (early 2019).
47PERFORMANCE MANAGEMENT BENCHMARKING REPORT
APPENDIX
48
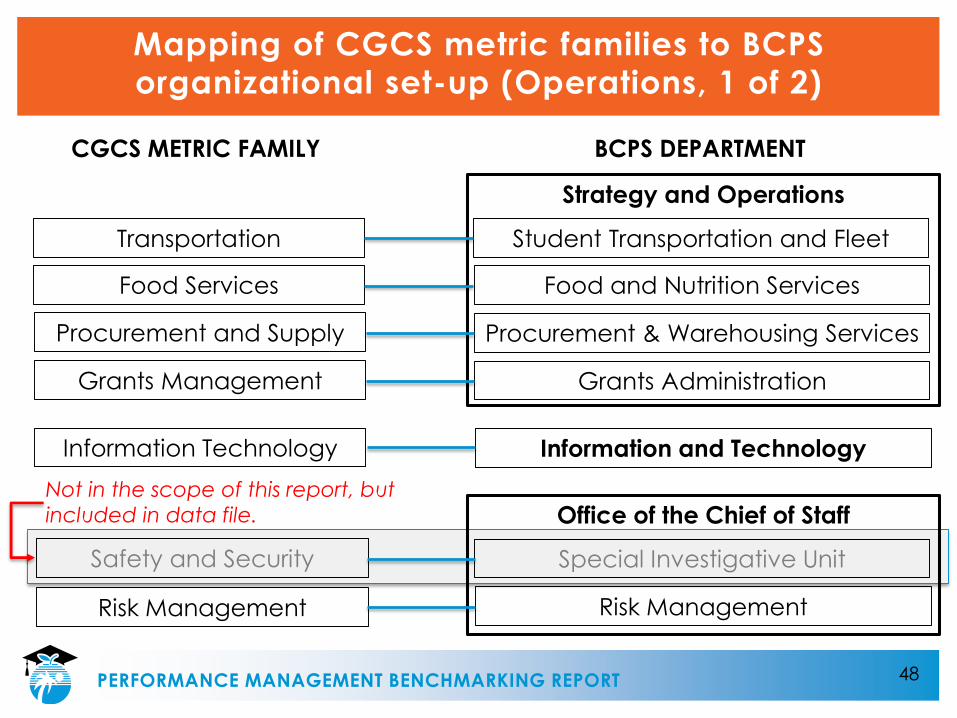
Mapping of CGCS metric families to BCPS
organizational set-up (Operations, 1 of 2)
PERFORMANCE MANAGEMENT BENCHMARKING REPORT
Transportation
Food Services
Procurement and Supply
Grants Management
Information Technology
Safety and Security
Risk Management
Student Transportation and Fleet
Food and Nutrition Services
Procurement & Warehousing Services
Grants Administration
Information and Technology
Special Investigative Unit
Risk Management
Office of the Chief of Staff
Strategy and Operations
CGCS METRIC FAMILY BCPS DEPARTMENT
Not in the scope of this report, but
included in data file.
49
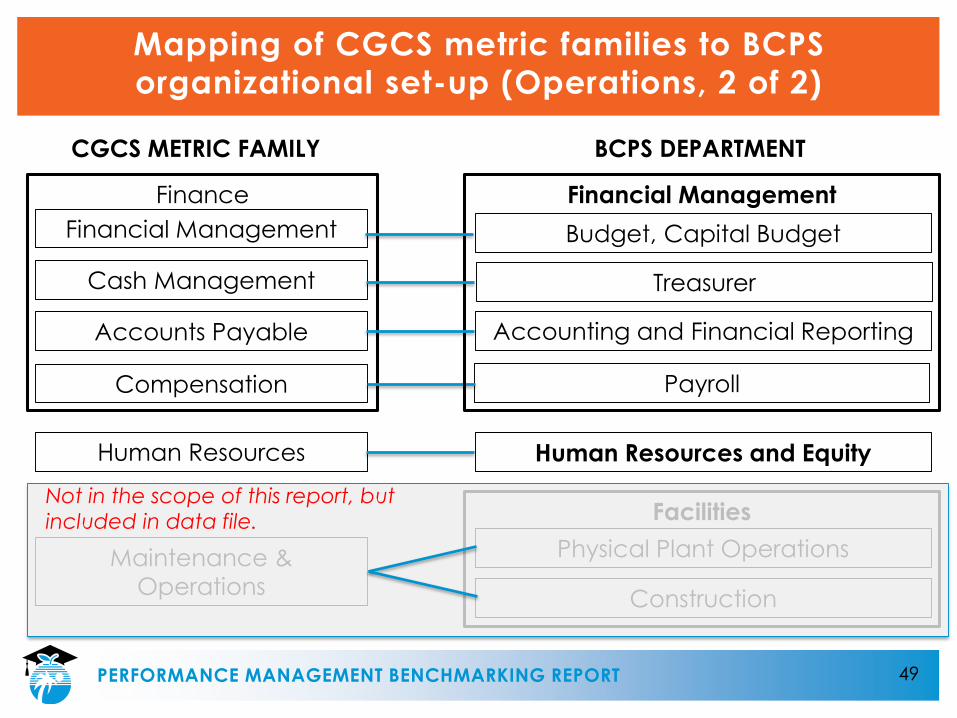
Mapping of CGCS metric families to BCPS
organizational set-up (Operations, 2 of 2)
PERFORMANCE MANAGEMENT BENCHMARKING REPORT
Financial Management
Accounts Payable
Cash Management
Compensation
Finance
Payroll
Accounting and Financial Reporting
Budget, Capital Budget
Financial Management
Human Resources
CGCS METRIC FAMILY BCPS DEPARTMENT
Human Resources and Equity
Maintenance &
Operations
Physical Plant Operations
Construction
FacilitiesNot in the scope of this report, but
included in data file.
Treasurer
50
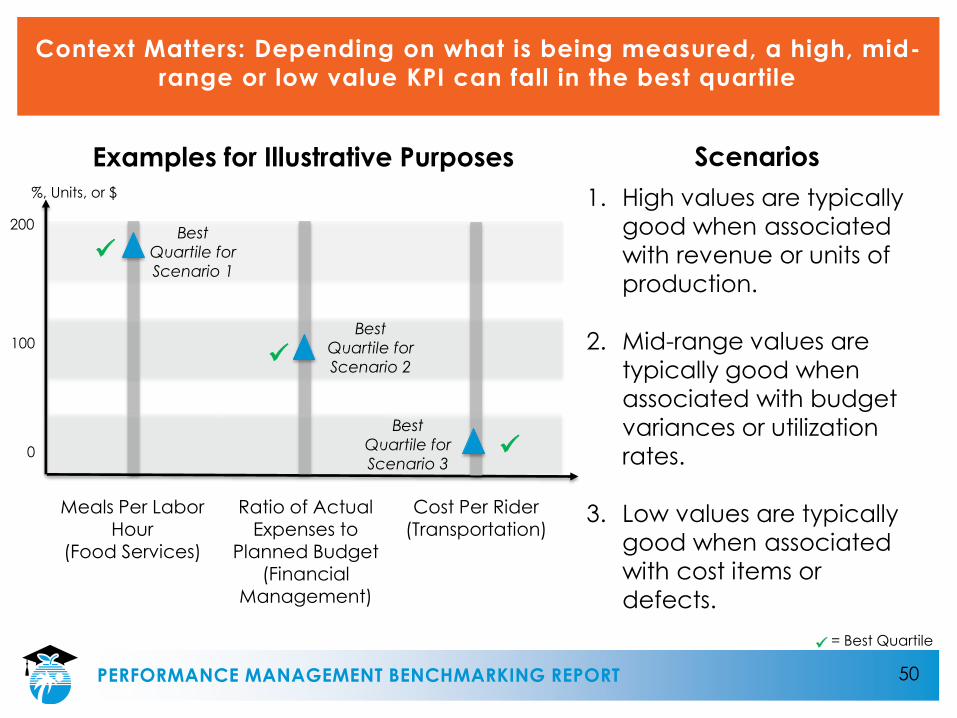
Context Matters: Depending on what is being measured, a high, mid-
range or low value KPI can fall in the best quartile
PERFORMANCE MANAGEMENT BENCHMARKING REPORT
1. High values are typically
good when associated
with revenue or units of
production.
2. Mid-range values are
typically good when
associated with budget
variances or utilization
rates.
3. Low values are typically
good when associated
with cost items or
defects.
Examples for Illustrative Purposes
0
100
200
%, Units, or $
= Best Quartile
Best
Quartile for
Scenario 1
Scenarios
Best
Quartile for
Scenario 2
Best
Quartile for
Scenario 3
Cost Per Rider (Transportation)
Ratio of Actual Expenses to
Planned Budget(Financial
Management)
Meals Per Labor Hour
(Food Services)
51
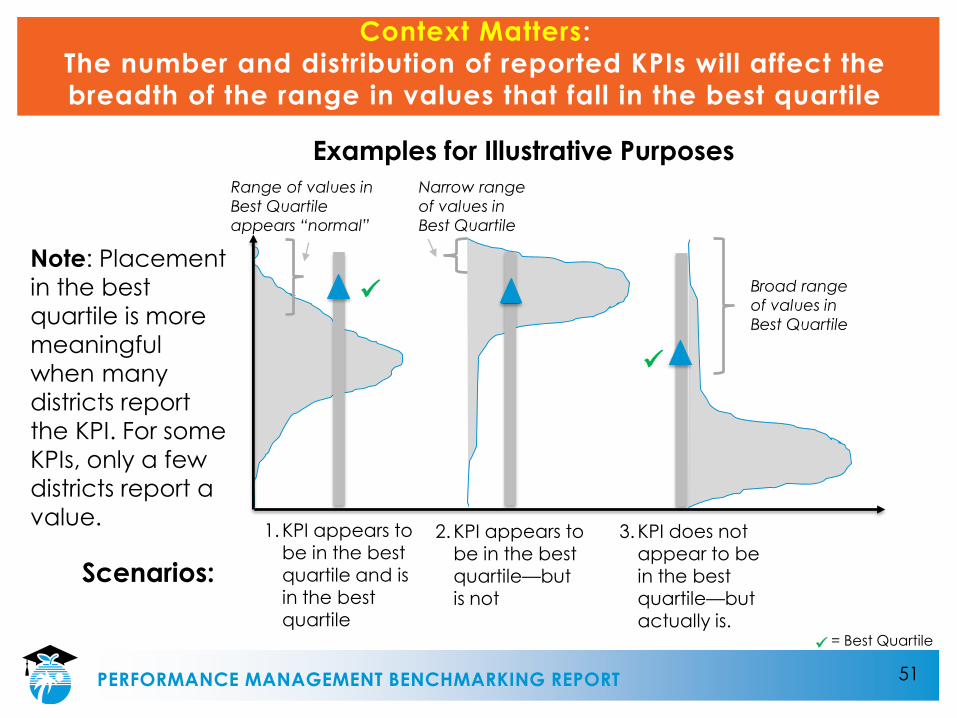
Context Matters:
The number and distribution of reported KPIs will affect the
breadth of the range in values that fall in the best quartile
PERFORMANCE MANAGEMENT BENCHMARKING REPORT
= Best Quartile
1. KPI appears to be in the best quartile and is in the best quartile
2. KPI appears to be in the best quartile—but is not
Examples for Illustrative Purposes
3. KPI does not appear to be in the best quartile—but actually is.
Scenarios:
Broad range
of values in
Best Quartile
Narrow range
of values in
Best Quartile
Note: Placement
in the best
quartile is more
meaningful
when many
districts report
the KPI. For some
KPIs, only a few
districts report a
value.
Range of values in
Best Quartile
appears “normal”