Embed Size (px)
Citation preview

Submitted by:
Final Report September 2013
School Efficiency Review of Fairfax County Public Schools


School Efficiency Review of
Fairfax County Public Schools
Final Report
September 2013
Submitted By:
1221 South MOPAC Expressway Suite 355
Austin, Texas 78746 www.gibsonconsult.com

Contents
Introduction .................................................................................................................................................. 1
State of Virginia’s School Efficiency Review Program ............................................................................... 1
Review of Fairfax County Public Schools .................................................................................................. 1
Methodology ............................................................................................................................................. 3
Organization of Report ............................................................................................................................. 6
Chapter 1 – Governance and Administration ............................................................................................... 7
Introduction .............................................................................................................................................. 7
A. Board Governance .......................................................................................................................... 11
B. Management and Administration ................................................................................................... 23
C. Policies and Procedures .................................................................................................................. 31
Chapter 2 – Educational Service Delivery ................................................................................................... 33
Introduction ............................................................................................................................................ 33
A. Organization and Management ...................................................................................................... 36
B. School Administration ..................................................................................................................... 39
C. Curriculum Policies and Management ............................................................................................ 45
D. Special Education ............................................................................................................................ 49
E. Other Special Programs .................................................................................................................. 60
Chapter 3 – Facilities Use and Management .............................................................................................. 63
Introduction ............................................................................................................................................ 63
A. Organization and Management ...................................................................................................... 66
B. Plans, Policies, and Procedures ....................................................................................................... 70
C. Maintenance Operations ................................................................................................................ 73
D. Custodial Operations....................................................................................................................... 76
E. Energy Management ....................................................................................................................... 82
Chapter 4 – Transportation ......................................................................................................................... 87
Introduction ............................................................................................................................................ 87
A. Organization and Staffing ............................................................................................................... 89
B. Planning, Policies, and Procedures ................................................................................................. 94
C. Routing and Scheduling .................................................................................................................. 96
D. Vehicle Maintenance and Bus Replacement Schedules ................................................................. 98

Chapter 5 – Technology Management...................................................................................................... 103
Introduction .......................................................................................................................................... 103
A. Technology Administration ........................................................................................................... 106
B. Instructional and Administrative Software ................................................................................... 110
C. Technology Planning ..................................................................................................................... 113
D. Technology Policies and Procedures ............................................................................................. 114
E. Technology Support and Help Desk Operations ........................................................................... 116
F. Technology Acquisition, Donations, and Surplus Practices .......................................................... 118
G. School-Based Technology Support ............................................................................................... 119
Chapter 6 – Financial Management .......................................................................................................... 123
Introduction .......................................................................................................................................... 123
A. Organization, Management, and Staffing ..................................................................................... 127
B. Financial Performance .................................................................................................................. 133
C. Planning and Budgeting ................................................................................................................ 139
D. Administrative Technology ........................................................................................................... 142
E. Review and Evaluation of Contracting Process ............................................................................. 145
Chapter 7 – Human Resources .................................................................................................................. 149
Introduction .......................................................................................................................................... 149
A. Organization and Management .................................................................................................... 153
B. Policies and Procedures ................................................................................................................ 161
C. Recruitment, Hiring, and Retention .............................................................................................. 163
D. Staff Development ........................................................................................................................ 166
E. Compensation and Classification Systems .................................................................................... 166
Appendices ................................................................................................................................................ 171
Appendix A – Fiscal Impact Summary ....................................................................................................... 173
Appendix B – Stakeholder Survey Results................................................................................................. 177
Survey Development and Administration ............................................................................................. 177
Survey Sample ....................................................................................................................................... 177
Survey Results ....................................................................................................................................... 180
Appendix C – Peer Comparisons ............................................................................................................... 189

1
Introduction State of Virginia’s School Efficiency Review Program
In 2005, as part of the then governor’s Education for a Lifetime initiative, a comprehensive school efficiency review program was created in the Commonwealth of Virginia to ensure that Virginia’s education dollars were being spent wisely and effectively. The goal of the efficiency review program is to identify administrative savings achievable through the examination and implementation of best practices and operational improvements in school division administration, educational service delivery, human resources, facilities use and management, financial management, transportation, technology management, food services, and other non-instructional expenditures, thereby allowing the school division to return administrative savings to the classroom to more directly benefit Virginia’s children.
Review of Fairfax County Public Schools
In October 2012, Gibson Consulting Group, Inc. (Gibson) was contracted by the Virginia Department of Planning and Budget (DPB) to conduct an efficiency review of Fairfax County Public Schools (FCPS and the division). The purpose of this project was to conduct an objective review of operational areas within the division and to determine whether savings can be achieved through increased efficiencies.
Because the division was in the midst of or had recently conducted other reviews, several areas were excluded from the scope of work specified in the DPB project protocols. These areas were food services, facilities maintenance staffing, and transportation bell schedules. Accordingly, these three areas were excluded from this review.
FCPS is an excellent school system and one that is often referred to by Gibson’s other school system clients as one they would like to emulate. The division has received national accolades and awards for several academic programs, its technology function, and its budget document, among others, and many other commendable practices are noted in this report including:
The Strategic Governance Manual effectively documents oversight responsibilities of the FCPS board.
School improvement plans have increased their usefulness through the use of short-term planning and monitoring templates.
The centralization of route planning functions into a single office serving all geographic areas has been an excellent organizational response to the changes in service demand within the division.
The division implemented a “bring your own device” program that has the necessary ingredients for success.
Through three separate support teams, the financial services department provides effective support to schools and departments.
2
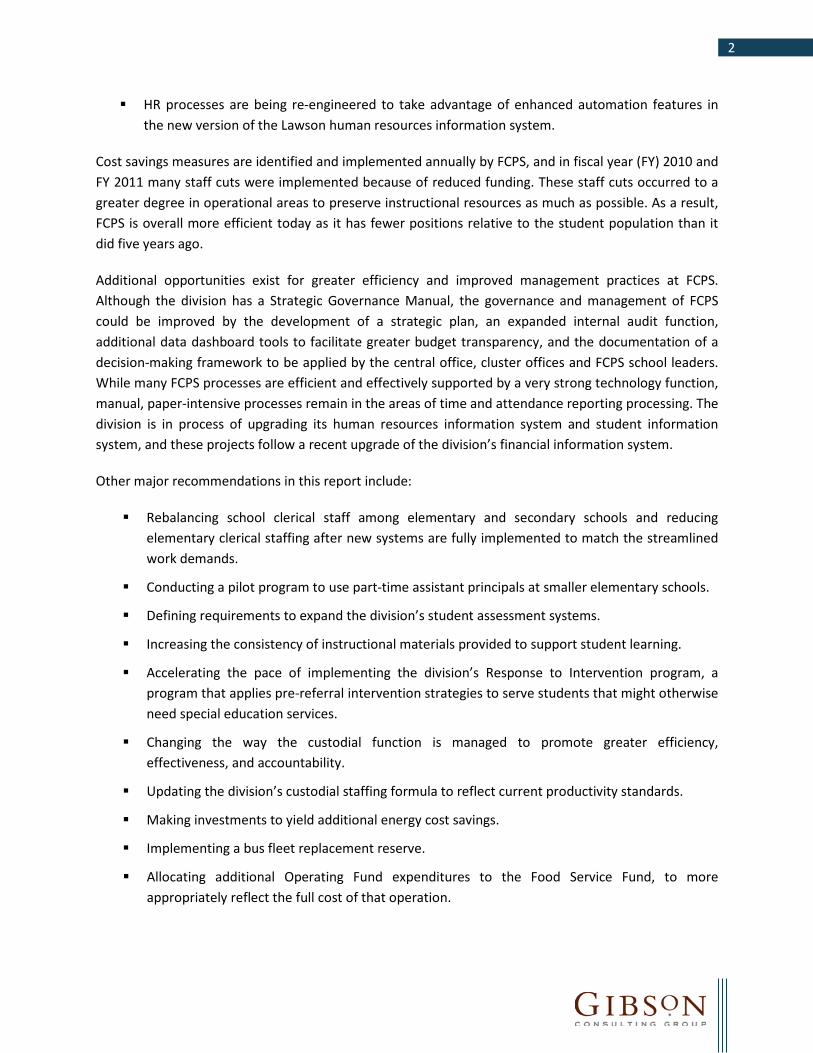
HR processes are being re-engineered to take advantage of enhanced automation features in the new version of the Lawson human resources information system.
Cost savings measures are identified and implemented annually by FCPS, and in fiscal year (FY) 2010 and FY 2011 many staff cuts were implemented because of reduced funding. These staff cuts occurred to a greater degree in operational areas to preserve instructional resources as much as possible. As a result, FCPS is overall more efficient today as it has fewer positions relative to the student population than it did five years ago.
Additional opportunities exist for greater efficiency and improved management practices at FCPS. Although the division has a Strategic Governance Manual, the governance and management of FCPS could be improved by the development of a strategic plan, an expanded internal audit function, additional data dashboard tools to facilitate greater budget transparency, and the documentation of a decision-making framework to be applied by the central office, cluster offices and FCPS school leaders. While many FCPS processes are efficient and effectively supported by a very strong technology function, manual, paper-intensive processes remain in the areas of time and attendance reporting processing. The division is in process of upgrading its human resources information system and student information system, and these projects follow a recent upgrade of the division’s financial information system.
Other major recommendations in this report include:
Rebalancing school clerical staff among elementary and secondary schools and reducing elementary clerical staffing after new systems are fully implemented to match the streamlined work demands.
Conducting a pilot program to use part-time assistant principals at smaller elementary schools.
Defining requirements to expand the division’s student assessment systems.
Increasing the consistency of instructional materials provided to support student learning.
Accelerating the pace of implementing the division’s Response to Intervention program, a program that applies pre-referral intervention strategies to serve students that might otherwise need special education services.
Changing the way the custodial function is managed to promote greater efficiency, effectiveness, and accountability.
Updating the division’s custodial staffing formula to reflect current productivity standards.
Making investments to yield additional energy cost savings.
Implementing a bus fleet replacement reserve.
Allocating additional Operating Fund expenditures to the Food Service Fund, to more appropriately reflect the full cost of that operation.

3
This report contains 33 recommendations for improving the efficiency and effectiveness of FCPS’ operations, including the opportunity for several new investments.
Potential Savings and Investments
The review team anticipates that the recommendations contained in this report will be implemented over the next five years (2014-18). Once fully implemented, these recommendations will result in net annual savings of $7,529,331 by 2017-18. If fully implemented, recommendations contained in this report will require one-time investments of $2,325,000, additional investments in subsequent years, with a five-year net savings of $10,840,362.
For those recommendations involving position reductions, average pay for that position was applied in calculating savings. It is expected that some of these positions can be eliminated through attrition. A benefits rate of 43.7 percent was applied in calculating gross savings from position reductions.
Appendix A lists all recommendations made as a result of the review, by operational area, along with estimated savings, investments, and net fiscal impacts.
Methodology
Data Collection
To conduct a comprehensive review of FCPS, Gibson used a variety of data collection and analysis approaches. This comprehensive review of FCPS’ non-instructional areas included the following data collection approaches:
Existing FCPS data Interviews with division staff School site visits Focus group sessions Community survey Washington Area Boards of Education (WABE) guide National peer data
Existing FCPS Data To provide proper context for the review, Gibson requested from the FCPS a broad spectrum of data and documents related to the operational areas under review. Gibson collected over 1,000 documents from FCPS’ staff. The purpose of this data request and subsequent analyses was to gain a deeper understanding of FCPS operations and provide background and context for the review. In addition, these data and documents were utilized to help formulate questions for the interviews and focus group sessions held with division administrators, department heads and staff, school administrators and staff, and teachers. Data analyses, discussed later, were conducted to determine levels of efficiency within the organization.

4
Interviews with Division Staff To ensure that the review team had a complete and thorough understanding of division processes, procedures, operations, and issues, interviews of key staff involved in day-to-day operations in the FCPS were conducted from February 11 through 21, 2013. Interviews included school board members, division leadership, department heads and staff, school administrators and staff, operational leads, and support staff, among others.
Since some preliminary data analyses were completed prior to the site visit, interview time was dedicated more to understanding performance trends, in addition to learning about system processes and staff responsibilities. Through these interviews and focus groups, the review team was able to develop a better overall understanding of divisional operations and clarify any data questions that arose during preliminary analysis, including investigation of possible causes of unfavorable variances, current efficiency or performance measurement systems, current plans and initiatives, current approach to cost savings, recent cost savings or cost cutting measures, decision-making frameworks, and additional areas of concern for the staff.
School Site Visits A sample of FCPS’ schools was selected for site visits based on geographic location within the division. The review team selected and conducted site visits to ten FCPS elementary, middle, and high schools, plus special education centers. The purpose of the school visits was to gather information on school operations as well as staff members’ perceptions of the services provided by the central office. The site visits, which were conducted between February 11 and February 21, included five elementary schools, two middle schools, and three high schools in the division. Following is a list of the schools visited during this review:
Columbia Elementary School (ES) Kent Garden ES Laurel Ridge ES Ravensworth ES Shrevewood ES Key Middle School (MS) Whitman MS Centreville High School (HS) Mount Vernon HS South Lakes HS
The Kilmer Center, a special education program serving high needs students with disabilities, was also visited.
Focus Group Sessions Focus groups are an effective way of obtaining more in-depth information from staff than a one-on-one formal interview or other data collection instruments. In addition, the dynamics of a focus group often stimulate the expression of ideas that might otherwise go unstated. The project team conducted focus

5
group sessions with varying groups of stakeholders (e.g., principals, teachers, operational area leads, departmental and school staff). These focus groups were conducted during the February 2013 site visit.
Community Survey At the request of division management, a community stakeholder survey was developed by Gibson to measure the community’s perceptions as to the efficiency of FCPS. This online survey was administered from March 25 to April 19, 2013. FCPS communications promoted the survey on the division’s homepage, through their social media accounts, and newsletters for parents, employees, and the community. Approximately 11,000 responses were received. Appendix B presents the results of the community stakeholder survey.
WABE Guide Analysis Gibson used the most recent WABE guide (Fall 2012) for peer comparisons to FCPS. This guide reports facts and selected measures for 10 Washington area school systems, including two in Maryland. Where applicable, these peer comparisons were included in the report.
National Peer Data Analysis Gibson collected information from the most recent survey of the Council of Great City Schools (COGCS). While FCPS is not a member of COGCS, the division compares selected performance measures to the information in this report. Where applicable, Gibson included benchmark comparisons from the COGCS survey. In other instances, research of individual school systems was conducted to provide additional peer comparisons.
Analysis
Data Analysis As discussed previously, existing FCPS data were requested and analyzed to provide background and context for this review. During the assessment phase of this project, each functional area was reviewed individually to determine whether efficient financial and operational management practices were in place. It is important to note that the functional areas defined by the DPB in the work protocols do not correspond exactly to FCPS divisions and departments.
For the analysis of each functional area, the review team applied the DPB’s protocols for developing well-supported findings and recommendations. Qualitative interview and focus group data were analyzed by functional area leads conducting the focus group sessions to determine common trends across the various stakeholder groups (e.g., division administration, school leaders and staff, department heads and staff). Other sources of input (e.g., observations, divisional data, and industry best practices) were also included in analyses.
It is important to note that departmental expenditure data presented throughout the remainder of this report represents non-school-based operating expenditures, excluding employee benefits.

6
Comparative Cost Analysis For this review, comparisons were conducted using peer divisions from the WABE guide. These school systems include Alexandria City, Arlington County, Falls Church City, Loudoun County, Manassas City, Manassas Park City, Montgomery County (MD), Prince George’s County (MD), and Prince William County. Peer data comparisons were analyzed for staffing levels, fund sources, disbursements, and expenditures, among others. Appendix C – Peer Comparison includes the WABE peer analyses conducted for this review. Where applicable, other peer school systems and industry standards were applied for comparison purposes.
Interview and Focus Group Data Qualitative interview and focus group data were analyzed by functional area leaders conducting the focus group sessions and interviews to determine common trends across the various stakeholder groups (e.g., division administration, school leaders and staff, department heads, and staff).
Organization of Report
The remainder of this report is organized into the following:
Chapter 1 – Governance and Administration Chapter 2 – Educational Service Delivery Chapter 3 – Facilities Use and Management Chapter 4 – Transportation Chapter 5 – Technology Management Chapter 6 – Financial Management Chapter 7 – Human Resources Appendices
7
Chapter 1 – Governance and Administration Introduction
The effective and efficient education of students depends on a division’s governance structure, administrative management, and planning processes. The role of the school board (board) is to set goals and priorities, establish policies, and to approve the plans and funding necessary to achieve division goals and objectives. The superintendent is responsible for managing division operations, recommending staffing levels, and preparing a plan for spending financial resources in order to carry out the board’s goals and objectives. Department and school administration executes the plans and measures performance against established targets that are aligned with the division’s goals and objectives. Each component of this system of governance and administration helps ensure that goals and objectives are in fact achieved, and that departments, schools, and the individuals that oversee them are held accountable for results.
This chapter provides commendations and recommendations related to board governance and division and school-level management and administration in three sections:
A. Board Governance B. Management and Administration C. Policies and Procedures
Fairfax County Public Schools (FCPS and the division), the largest school division in Virginia, serves the residents of Fairfax County in northern Virginia. In 2012, the division had 177,918 students in 196 schools, including 139 elementary schools, 23 middle schools, 25 secondary and high schools, 7 special education centers, and 2 alternative high schools. Compared to other school systems in the Washington D.C. area, Fairfax has a higher average enrollment per school. Table 1.1 shows a comparison of FCPS’ student membership counts and number of schools to other divisions in the Washington D.C. area. In fiscal year (FY) 2012, FCPS had the largest average school size among its peers at 908 students, just slightly above Prince William County.

8
Table 1.1. Comparison to other Washington D.C. area school divisions, 2012
School Division FY 2012 Actual Membership
Total Number of Schools
Average School Size
Alexandria City 12,395 22 563
Arlington County 21,878 37 591
Fairfax County 177,918 196 908
Falls Church City 2,178 4 544
Loudoun County 65,668 82 801
Manassas City 7,156 9 795
Manassas Park City 3,071 4 768
Montgomery County, MD 146,497 202 725
Prince George’s County, MD 123,833 207 598
Prince William County 81,944 91 900
Source: Washington Area Boards of Education Guide FY 2013
FCPS provides educational services primarily through human resources, which represent more than 85 percent of its total operating expenditures. In FY 2013, the FCPS operating budget was $2.5 billion, or $13,564 per student, and included 23,528 full-time positions. Approximately 93 percent of these positions are school-based.
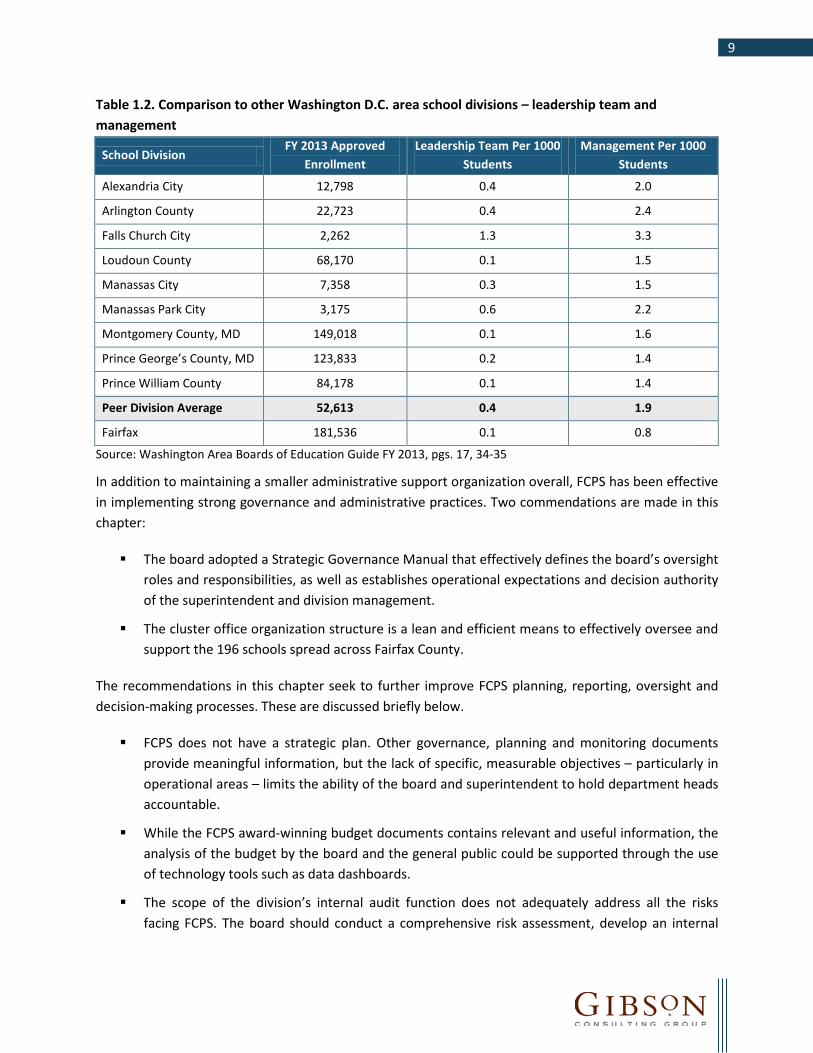
Table 1.2 shows a comparison of FCPS to other Washington D.C. area divisions for non-school based leadership staff per 1,000 students. For leadership team, FCPS was tied with Loudoun County, Montgomery County, and Prince William County for the lowest staff levels. In FY 2013, FCPS also had the lowest management staff per 1,000 students among its Washington Area Boards of Education (WABE) peer school systems, and is approximately one-half the peer average. These staffing levels were due in part to the economies of scale available to a large school system. However, FCPS management levels were also significantly lower than other large school systems – Montgomery County (MD), Prince George’s County (MD), and Prince William County. FCPS central administrative and staffing is discussed later in this chapter.
9
Table 1.2. Comparison to other Washington D.C. area school divisions – leadership team and management
School Division FY 2013 Approved
Enrollment Leadership Team Per 1000
Students Management Per 1000
Students
Alexandria City 12,798 0.4 2.0
Arlington County 22,723 0.4 2.4
Falls Church City 2,262 1.3 3.3
Loudoun County 68,170 0.1 1.5
Manassas City 7,358 0.3 1.5
Manassas Park City 3,175 0.6 2.2
Montgomery County, MD 149,018 0.1 1.6
Prince George’s County, MD 123,833 0.2 1.4
Prince William County 84,178 0.1 1.4
Peer Division Average 52,613 0.4 1.9
Fairfax 181,536 0.1 0.8
Source: Washington Area Boards of Education Guide FY 2013, pgs. 17, 34-35
In addition to maintaining a smaller administrative support organization overall, FCPS has been effective in implementing strong governance and administrative practices. Two commendations are made in this chapter:
The board adopted a Strategic Governance Manual that effectively defines the board’s oversight roles and responsibilities, as well as establishes operational expectations and decision authority of the superintendent and division management.
The cluster office organization structure is a lean and efficient means to effectively oversee and support the 196 schools spread across Fairfax County.
The recommendations in this chapter seek to further improve FCPS planning, reporting, oversight and decision-making processes. These are discussed briefly below.
FCPS does not have a strategic plan. Other governance, planning and monitoring documents provide meaningful information, but the lack of specific, measurable objectives – particularly in operational areas – limits the ability of the board and superintendent to hold department heads accountable.
While the FCPS award-winning budget documents contains relevant and useful information, the analysis of the budget by the board and the general public could be supported through the use of technology tools such as data dashboards.
The scope of the division’s internal audit function does not adequately address all the risks facing FCPS. The board should conduct a comprehensive risk assessment, develop an internal

10
audit plan based on those risks, and expand the scope of the internal audit function to address them.
A decision-making framework needs to be established between central administration, cluster offices, and the schools to determine which organizational unit has the authority to make which decisions.
FCPS procedure update practices need to be improved.
The expanded scope of the internal audit unit and the development of budget data dashboards should reduce the time demands that the board places on its staff to conduct research of budget and other issues. Once these recommendations are implemented, the board can then re-evaluate board staff levels and qualifications.
Table 1.3 provides a summary of divisional administration recommendations and resulting fiscal impacts over the next five years.
Table 1.3. Fiscal impacts of divisional administration recommendations
Recommendations One-Time
Cost/ Savings
2013-14 2014-15 2015-16 2016-17 2017-18 Total Fiscal
Impact
Governance
1-1. Develop a long-range strategic plan.
$0 $0 $0 $0 $0 $0 $0
1-2. Expand on current county data dashboard initiative.
($500,000) ($40,000) ($40,000) ($40,000) ($40,000) ($40,000) ($700,000)
1-3. Expand role of the board’s internal audit function.
($75,000) $0 ($300,000) ($300,000) ($300,000) ($300,000) ($1,275,000)
Management and Administration
1-4. Develop a decision-making framework for instructional and school administrators.
($50,000) $0 $0 $0 $0 $0 ($50,000)
Policies and Procedures
1-5. Improve procedure update practices.
$0 $0 $0 $0 $0 $0 $0
Net Fiscal Impact ($625,000) ($40,000) ($340,000) ($340,000) ($340,000) ($340,000) ($2,025,000)
Note: Costs are negative. Savings are positive.
11
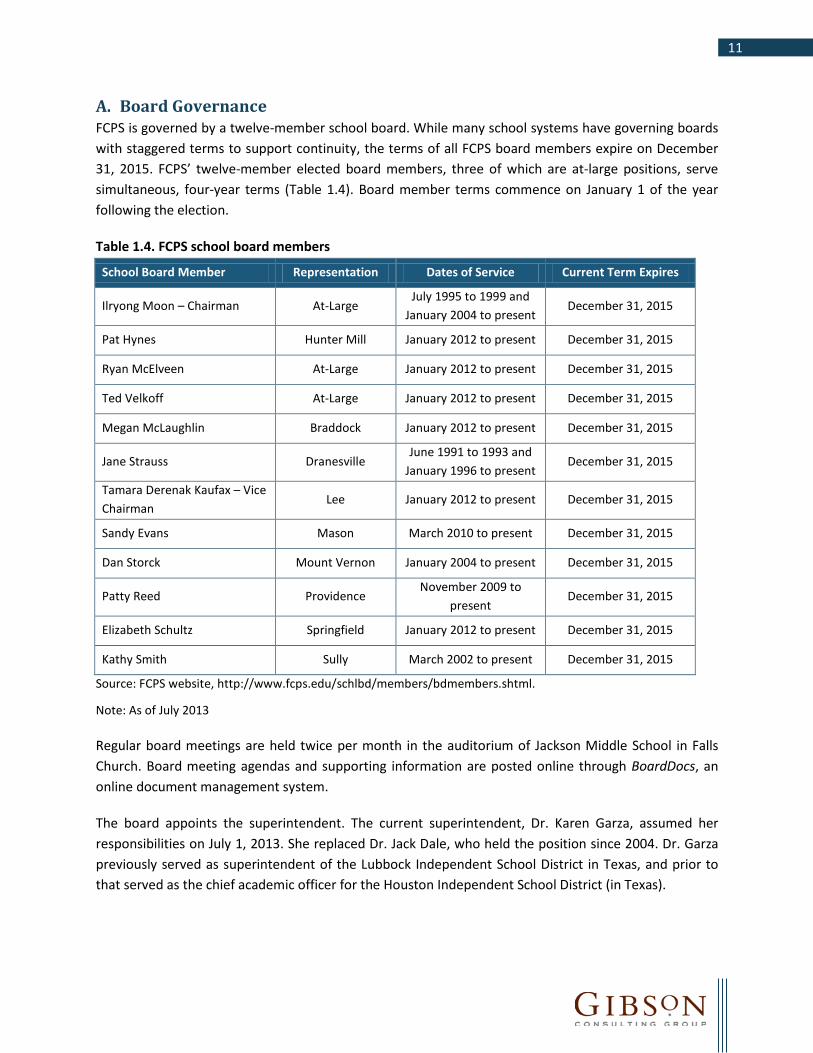
A. Board Governance FCPS is governed by a twelve-member school board. While many school systems have governing boards with staggered terms to support continuity, the terms of all FCPS board members expire on December 31, 2015. FCPS’ twelve-member elected board members, three of which are at-large positions, serve simultaneous, four-year terms (Table 1.4). Board member terms commence on January 1 of the year following the election.
Table 1.4. FCPS school board members
School Board Member Representation Dates of Service Current Term Expires
Ilryong Moon – Chairman At-Large July 1995 to 1999 and
January 2004 to present December 31, 2015
Pat Hynes Hunter Mill January 2012 to present December 31, 2015
Ryan McElveen At-Large January 2012 to present December 31, 2015
Ted Velkoff At-Large January 2012 to present December 31, 2015
Megan McLaughlin Braddock January 2012 to present December 31, 2015
Jane Strauss Dranesville June 1991 to 1993 and
January 1996 to present December 31, 2015
Tamara Derenak Kaufax – Vice Chairman
Lee January 2012 to present December 31, 2015
Sandy Evans Mason March 2010 to present December 31, 2015
Dan Storck Mount Vernon January 2004 to present December 31, 2015
Patty Reed Providence November 2009 to
present December 31, 2015
Elizabeth Schultz Springfield January 2012 to present December 31, 2015
Kathy Smith Sully March 2002 to present December 31, 2015
Source: FCPS website, http://www.fcps.edu/schlbd/members/bdmembers.shtml.
Note: As of July 2013
Regular board meetings are held twice per month in the auditorium of Jackson Middle School in Falls Church. Board meeting agendas and supporting information are posted online through BoardDocs, an online document management system.
The board appoints the superintendent. The current superintendent, Dr. Karen Garza, assumed her responsibilities on July 1, 2013. She replaced Dr. Jack Dale, who held the position since 2004. Dr. Garza previously served as superintendent of the Lubbock Independent School District in Texas, and prior to that served as the chief academic officer for the Houston Independent School District (in Texas).

12
The other primary responsibilities of the board are establishing policy, adopting the budget, and voting on FCPS decisions requiring board approval, such as purchases and contracts exceeding a predetermined dollar limit.
In addition to the superintendent, the board has two organizational units that report to it – internal audit (discussed later in this chapter) and the board staff. The board has a dedicated staff of 11.5 full-time equivalent (FTE) positions. Six of the 11.5 positions are assigned to two board members as direct support. Figure 1.1 presents an organization structure of the board staff office.
Figure 1.1. FCPS board staff office organization structure
School Board
Deputy Clerk Deputy Clerk
Administrative Assistant
Support Tech, Directives
Executive Assistant/Clerk
Support Tech, Records
Executive Administrative
Assistants
Source: Board staff focus group
Board staff provides several types of support services for board members. The more significant responsibilities include:
Communicating with and assisting Fairfax County citizens. This involves emails, phone calls, direct communication, directing citizen’s needs to FCPS staff, and planning meetings between citizens and the board. Many of these communications do not involve a specific board member. Overall, these activities comprise 30 percent to 40 percent of the average work day.
Board and board member direct support. Support is based on requests received from assigned board members such as calendar management, reminders, meeting planning, briefing preparation, and interfacing with county supervisors. These activities can also take up to 40 percent of board staff’s time, on average.
13
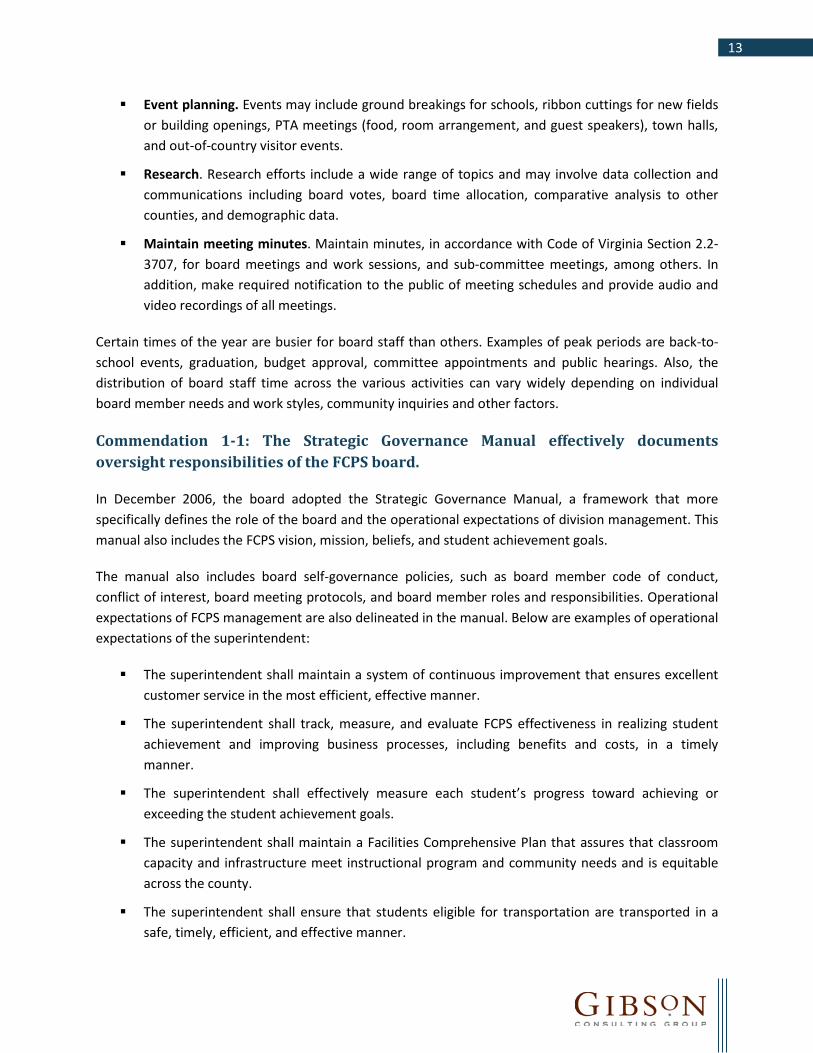
Event planning. Events may include ground breakings for schools, ribbon cuttings for new fields or building openings, PTA meetings (food, room arrangement, and guest speakers), town halls, and out-of-country visitor events.
Research. Research efforts include a wide range of topics and may involve data collection and communications including board votes, board time allocation, comparative analysis to other counties, and demographic data.
Maintain meeting minutes. Maintain minutes, in accordance with Code of Virginia Section 2.2-3707, for board meetings and work sessions, and sub-committee meetings, among others. In addition, make required notification to the public of meeting schedules and provide audio and video recordings of all meetings.
Certain times of the year are busier for board staff than others. Examples of peak periods are back-to-school events, graduation, budget approval, committee appointments and public hearings. Also, the distribution of board staff time across the various activities can vary widely depending on individual board member needs and work styles, community inquiries and other factors.
Commendation 1-1: The Strategic Governance Manual effectively documents oversight responsibilities of the FCPS board.
In December 2006, the board adopted the Strategic Governance Manual, a framework that more specifically defines the role of the board and the operational expectations of division management. This manual also includes the FCPS vision, mission, beliefs, and student achievement goals.
The manual also includes board self-governance policies, such as board member code of conduct, conflict of interest, board meeting protocols, and board member roles and responsibilities. Operational expectations of FCPS management are also delineated in the manual. Below are examples of operational expectations of the superintendent:
The superintendent shall maintain a system of continuous improvement that ensures excellent customer service in the most efficient, effective manner.
The superintendent shall track, measure, and evaluate FCPS effectiveness in realizing student achievement and improving business processes, including benefits and costs, in a timely manner.
The superintendent shall effectively measure each student’s progress toward achieving or exceeding the student achievement goals.
The superintendent shall maintain a Facilities Comprehensive Plan that assures that classroom capacity and infrastructure meet instructional program and community needs and is equitable across the county.
The superintendent shall ensure that students eligible for transportation are transported in a safe, timely, efficient, and effective manner.

14
The superintendent shall use technology to support teaching, learning, and the board’s operational expectations and student achievement goals.
Specific board member roles and responsibilities include establishing expectations for student achievement, providing resources to enable students to meet those expectations, and hold FCPS accountable for student achievement. Other board roles relate to representing the interests of Fairfax County citizens, adopting policies, and building coalitions to advocate for the board’s goals and objectives.
As required by the Strategic Governance Manual, FCPS management submits monitoring reports for each functional area to the board. These reports include performance measures and trends, and in some cases, comparisons to targets.
FCPS board members’ perspectives on the Strategic Governance Manual vary. Some members believe that it inappropriately removes the board from the necessary details of effective oversight. Most members see the Strategic Governance Manual as an effective guide for division governance and decision-making. Regardless of the perspectives on the FCPS Strategic Governance Manual, documenting a framework provides further clarification regarding governance and management roles and responsibilities and is a best practice.
Recommendation 1-1: Develop a long-range strategic plan.
FCPS Administrative Regulation 1406.3 Part III (A) specifies that the following eight divisionwide plans be approved annually or biennially, in addition to or as part of the annual budget. The organizational unit responsible for developing each plan is presented in parentheses.
1. School Board Strategic Governance Initiative (School Board)
2. Divisionwide Comprehensive Plan (Department of Professional Learning and Accountability)
3. School Board’s Approved Budget (Department of Financial Services)
4. Special Education Annual Plan Individuals with Disabilities Education Act (IDEA) (Department of Special Services)
5. Career and Technical Education Management System (CTEMS) (Instructional Services Department)
6. Annual Facilities and Student Accommodation Plan (Department of Facilities and Transportation Services)
7. Fairfax County School Board Legislative Program (Office of Government Relations)
8. Strategic Technology Plan (Department of Information Technology)
Items 1 and 2 above represent the primary divisionwide planning documents for FCPS.

15
FCPS does not have a long-range strategic plan. The Strategic Governance Manual is a framework for outlining the responsibilities of the board and division administration in the governance and oversight of the division. Although the Strategic Governance Manual contains several elements of a strategic plan, including beliefs, vision, mission, and the goals of the division, it is primarily a governance reference manual. The operational expectations in the manual outline what FCPS management is supposed to “do” but does not provide targets as to what operational areas are expected to “achieve” in terms of performance outcomes. This is left up to the individual departments.
The major elements of a strategic plan that are not found in the Strategic Governance Manual include the following:
Plan duration – strategic plans have a beginning and end date, and are updated annually based on needed changes. The Strategic Governance Manual does not have a timetable primarily because it is not a plan.
Establishment of global priorities – these priorities will drive long-term plans and decisions in other long-term planning documents, such as the facilities and technology long-range plans. Currently, the board establishes budget priorities annually, but not in the context of a defined long-term strategy or plan.
Measureable objectives and targets – the goals in the Strategic Governance Manual are appropriate longer-term goals, as they dictate expectations for “all students.” However, it does not establish measureable targets for operational areas, nor does it establish interim targets for either academic or operational areas.
The second major planning document for the division is the FCPS Comprehensive Plan. In accordance with the Virginia Department of Education (VDOE), Standards of Quality (SOQ) 2011, Standard 6 (§22.1-253.13:6(B)), each local school board shall adopt a divisionwide comprehensive plan biennially. The most recent FCPS comprehensive plan was approved in November 2011 and contains:
Vision, mission, beliefs, and goals Historical measures of student performance and other performance, aligned under FCPS goals Progress and status notes for lower-level goals
This plan is academically focused and does not address (nor is it required to address) operational areas.
FCPS Board Monitoring Reports provide many measures of performance (both academic and operational) that are aligned with the operational expectations in the Strategic Governance Manual. These measures are modified periodically and approved by the board. Examples of performance measures contained in FCPS’ monitoring reports are presented in Table 1.5.

16
Table 1.5. Examples of monitoring report performance measures
Goal / Program or Operational Area Performance Measure Example
Achieve full academic potential in the core discipline of mathematics
Percent of grade 6 students who met or exceeded mathematics achievement levels
Achieve full academic potential in the core discipline of English Language Arts: Reading, Writing, and Communicating
Percent of grade 8 students scoring pass advanced on the Reading Standards of Learning test or approved alternative assessment
Communicate in two languages
Exceeding expectations in grade 8 for students with prior immersion instruction (using the adult performance guideline: novice mid or higher on the world languages secondary performance assessment)
Provide for public use of facilities at a reasonable net cost to the school system, as long as student safety, student functions, and the instructional program are not compromised and use guidelines are administered consistently
Custodial staffing at a ratio of one custodian for each 19,000 square feet for all base (non-community use) schools
Financial Services Competitive property insurance premium rate per one hundred dollar value (Goal: .02 - .045 cents per $100)
Source: FCPS Board Monitoring Reports (http://www.fcps.edu/schlbd/monitoringreports/monitoring.shtml)
Targets and measures for student achievement are reported in many other documents provided to the board throughout the year. However, the Board Monitoring Reports present the primary source for measuring performance of operational and administrative areas. As Table 1.5 shows, there are several measures where specific targets are identified (custodial staffing and financial services). For some measures a target is specified, but there are no expectations on how long it will take to achieve the target. For other operational areas, there are no out-year or interim targets.
Based on the review team’s assessment, the shortcomings of the Comprehensive Plan and the absence of a strategic plan are likely having adverse implications on FCPS in the following ways:
Performance evaluations and accountability. While efficiency or other improvement is expected, how much improvement and by what date is not documented. Without clear performance expectations, performance evaluations of staff are more subjective than objective. Measurement of performance against specific targets and a specific timetable will help FCPS hold management accountable for results.
Impact on, dependency by, other plans. Long-range academic priorities and strategies have a significant impact on other long-term planning needs such as facilities and technology. Without this guidance, lower-level plans tend to operate in a vacuum having to make assumptions about those priorities. A long-range strategic plan will contribute to more effective long-range planning in other areas.
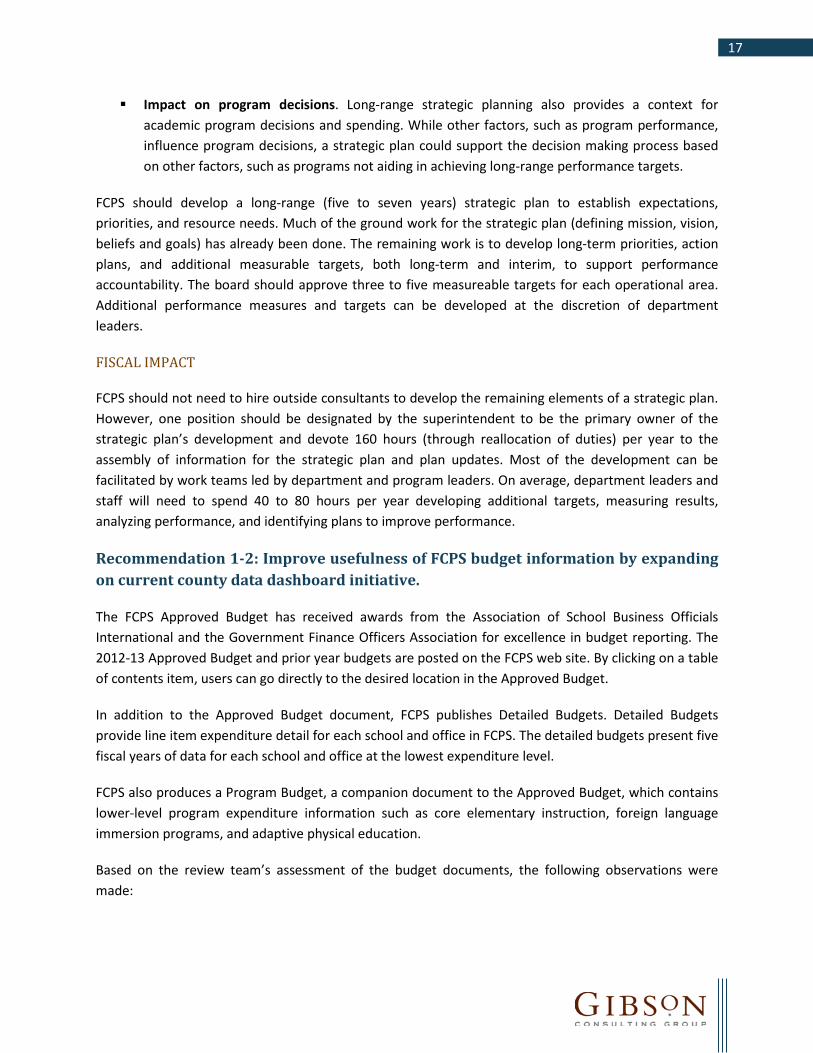
17
Impact on program decisions. Long-range strategic planning also provides a context for academic program decisions and spending. While other factors, such as program performance, influence program decisions, a strategic plan could support the decision making process based on other factors, such as programs not aiding in achieving long-range performance targets.
FCPS should develop a long-range (five to seven years) strategic plan to establish expectations, priorities, and resource needs. Much of the ground work for the strategic plan (defining mission, vision, beliefs and goals) has already been done. The remaining work is to develop long-term priorities, action plans, and additional measurable targets, both long-term and interim, to support performance accountability. The board should approve three to five measureable targets for each operational area. Additional performance measures and targets can be developed at the discretion of department leaders.
FISCAL IMPACT
FCPS should not need to hire outside consultants to develop the remaining elements of a strategic plan. However, one position should be designated by the superintendent to be the primary owner of the strategic plan’s development and devote 160 hours (through reallocation of duties) per year to the assembly of information for the strategic plan and plan updates. Most of the development can be facilitated by work teams led by department and program leaders. On average, department leaders and staff will need to spend 40 to 80 hours per year developing additional targets, measuring results, analyzing performance, and identifying plans to improve performance.
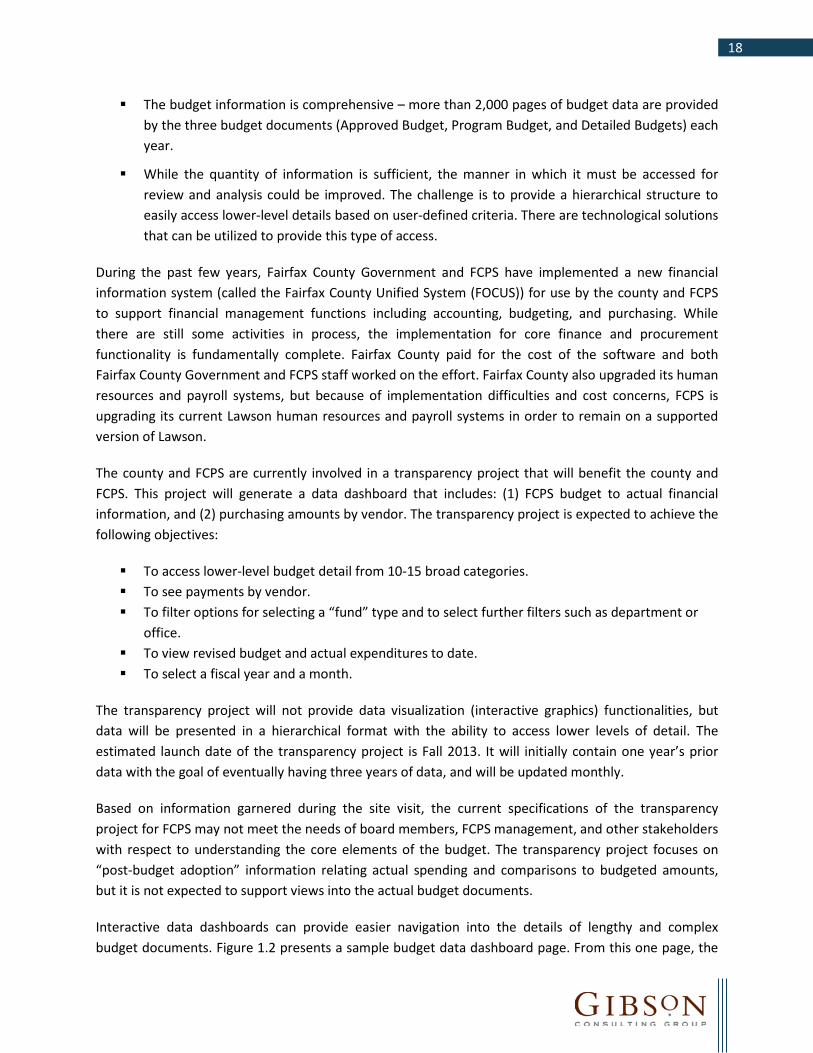
Recommendation 1-2: Improve usefulness of FCPS budget information by expanding on current county data dashboard initiative.
The FCPS Approved Budget has received awards from the Association of School Business Officials International and the Government Finance Officers Association for excellence in budget reporting. The 2012-13 Approved Budget and prior year budgets are posted on the FCPS web site. By clicking on a table of contents item, users can go directly to the desired location in the Approved Budget.
In addition to the Approved Budget document, FCPS publishes Detailed Budgets. Detailed Budgets provide line item expenditure detail for each school and office in FCPS. The detailed budgets present five fiscal years of data for each school and office at the lowest expenditure level.
FCPS also produces a Program Budget, a companion document to the Approved Budget, which contains lower-level program expenditure information such as core elementary instruction, foreign language immersion programs, and adaptive physical education.
Based on the review team’s assessment of the budget documents, the following observations were made:
18
The budget information is comprehensive – more than 2,000 pages of budget data are provided by the three budget documents (Approved Budget, Program Budget, and Detailed Budgets) each year.
While the quantity of information is sufficient, the manner in which it must be accessed for review and analysis could be improved. The challenge is to provide a hierarchical structure to easily access lower-level details based on user-defined criteria. There are technological solutions that can be utilized to provide this type of access.
During the past few years, Fairfax County Government and FCPS have implemented a new financial information system (called the Fairfax County Unified System (FOCUS)) for use by the county and FCPS to support financial management functions including accounting, budgeting, and purchasing. While there are still some activities in process, the implementation for core finance and procurement functionality is fundamentally complete. Fairfax County paid for the cost of the software and both Fairfax County Government and FCPS staff worked on the effort. Fairfax County also upgraded its human resources and payroll systems, but because of implementation difficulties and cost concerns, FCPS is upgrading its current Lawson human resources and payroll systems in order to remain on a supported version of Lawson.
The county and FCPS are currently involved in a transparency project that will benefit the county and FCPS. This project will generate a data dashboard that includes: (1) FCPS budget to actual financial information, and (2) purchasing amounts by vendor. The transparency project is expected to achieve the following objectives:
To access lower-level budget detail from 10-15 broad categories. To see payments by vendor. To filter options for selecting a “fund” type and to select further filters such as department or
office. To view revised budget and actual expenditures to date. To select a fiscal year and a month.
The transparency project will not provide data visualization (interactive graphics) functionalities, but data will be presented in a hierarchical format with the ability to access lower levels of detail. The estimated launch date of the transparency project is Fall 2013. It will initially contain one year’s prior data with the goal of eventually having three years of data, and will be updated monthly.
Based on information garnered during the site visit, the current specifications of the transparency project for FCPS may not meet the needs of board members, FCPS management, and other stakeholders with respect to understanding the core elements of the budget. The transparency project focuses on “post-budget adoption” information relating actual spending and comparisons to budgeted amounts, but it is not expected to support views into the actual budget documents.
Interactive data dashboards can provide easier navigation into the details of lengthy and complex budget documents. Figure 1.2 presents a sample budget data dashboard page. From this one page, the

19
user can make various selections related to the type, purpose, program, and funding source of the expenditure. The same could also be done for staffing information. This navigation would significantly improve transparency, allowing easy access to user-defined levels of detail simply by pointing and clicking on menu options.
Figure 1.2. Sample budget data dashboard page
Source: Gibson Consulting Group, Inc.
In the long term, the budget dashboard could be supplemented with (and/or linked to) performance and efficiency dashboards for operational and program areas. This would provide an even richer source of information that would integrate measures now shown on Board Monitoring Reports with budgets for the applicable department and program areas.
These budget and performance dashboard tools must be designed so that they are simple enough for the average Fairfax County citizen to use without instruction or help desk support, and rich enough to meet the information needs. Once these dashboards have been fully implemented, the board and division administration will be in a better position to evaluate the need for additional board staff and/or board budget analysts.
20
FISCAL IMPACT
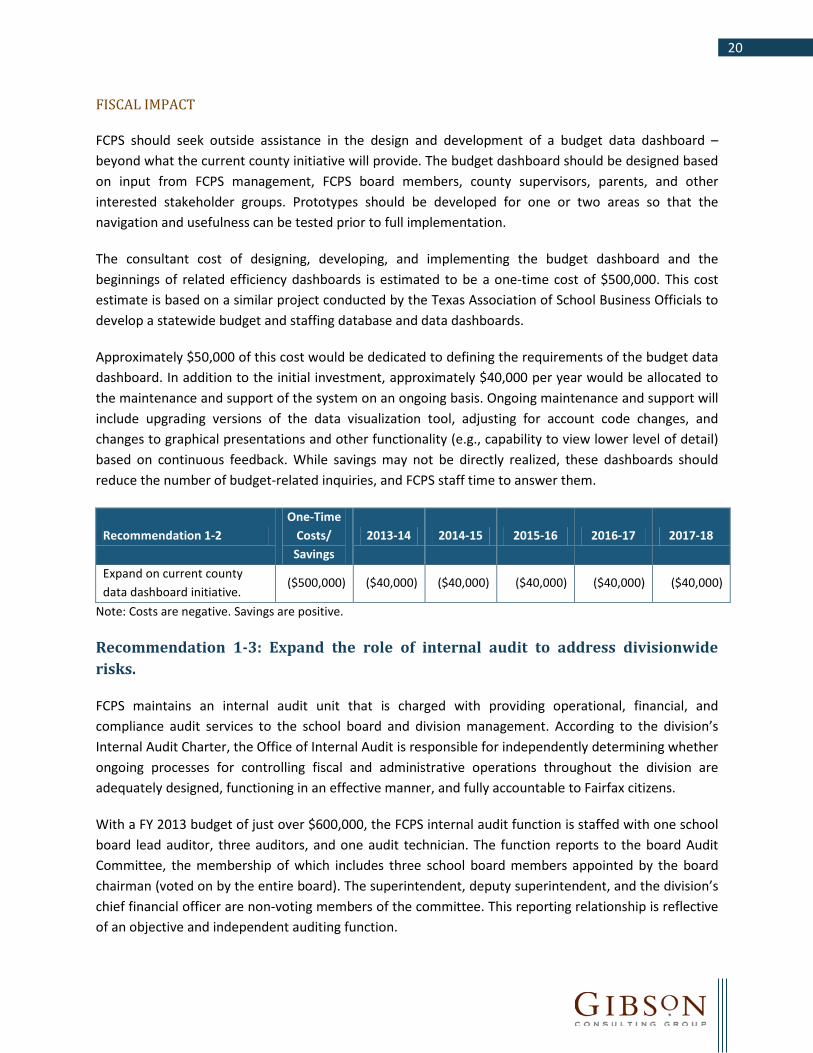
FCPS should seek outside assistance in the design and development of a budget data dashboard – beyond what the current county initiative will provide. The budget dashboard should be designed based on input from FCPS management, FCPS board members, county supervisors, parents, and other interested stakeholder groups. Prototypes should be developed for one or two areas so that the navigation and usefulness can be tested prior to full implementation.
The consultant cost of designing, developing, and implementing the budget dashboard and the beginnings of related efficiency dashboards is estimated to be a one-time cost of $500,000. This cost estimate is based on a similar project conducted by the Texas Association of School Business Officials to develop a statewide budget and staffing database and data dashboards.
Approximately $50,000 of this cost would be dedicated to defining the requirements of the budget data dashboard. In addition to the initial investment, approximately $40,000 per year would be allocated to the maintenance and support of the system on an ongoing basis. Ongoing maintenance and support will include upgrading versions of the data visualization tool, adjusting for account code changes, and changes to graphical presentations and other functionality (e.g., capability to view lower level of detail) based on continuous feedback. While savings may not be directly realized, these dashboards should reduce the number of budget-related inquiries, and FCPS staff time to answer them.
Recommendation 1-2 One-Time
Costs/ Savings
2013-14 2014-15 2015-16 2016-17 2017-18
Expand on current county data dashboard initiative.
($500,000) ($40,000) ($40,000) ($40,000) ($40,000) ($40,000)
Note: Costs are negative. Savings are positive.
Recommendation 1-3: Expand the role of internal audit to address divisionwide risks.
FCPS maintains an internal audit unit that is charged with providing operational, financial, and compliance audit services to the school board and division management. According to the division’s Internal Audit Charter, the Office of Internal Audit is responsible for independently determining whether ongoing processes for controlling fiscal and administrative operations throughout the division are adequately designed, functioning in an effective manner, and fully accountable to Fairfax citizens.
With a FY 2013 budget of just over $600,000, the FCPS internal audit function is staffed with one school board lead auditor, three auditors, and one audit technician. The function reports to the board Audit Committee, the membership of which includes three school board members appointed by the board chairman (voted on by the entire board). The superintendent, deputy superintendent, and the division’s chief financial officer are non-voting members of the committee. This reporting relationship is reflective of an objective and independent auditing function.

21
The lead internal auditor prepares an annual audit plan that is reviewed and approved by the audit committee and then it is approved by the full board. The division’s audit plan and distribution of work for FY 2013 is presented in Table 1.6.
Table 1.6. FCPS audit plan for FY 2013 Audit Number of Hours Percent of Total
Performance Audits
Fair Labor Standards Act 200 2.4
Trade and Industrial Programs 150 1.8
Procurement Cards 120 1.4
Athletic Funds 100 1.2
Other Audit Projects and Tasks
Local School Activity Funds 4,500 54.0
FOCUS Participation 100 1.2
Continuous Auditing 150 1.8
Follow-up Reviews 250 3.0
Assistance Provided to Others 450 5.4
Professional Development 200 2.4
Office Initiatives and Projects 250 3.0
Administrative Duties 1,874 22.4
Total Hours 8,344 100.0
Source: Office of Internal Audit, Fiscal Year 2013 Annual Audit Plan, http://www.fcps.edu/schlbd/internalaudit/reports/FY2013.pdf
The majority of the division’s internal audit effort in FY 2013 – 54 percent of total hours – was dedicated to the audit of school activity fund accounts. Code of Virginia 8VAC20-240-40 (Audits; monthly and annual reports) states:
School activity funds (internal accounts) shall be audited at least once a year by a duly qualified accountant or accounting firm approved by the local school board and a copy of the audit report shall be filed in the office of the division superintendent. Monthly reports of such funds shall be prepared and filed in the principal's office, and annual reports shall be filed in the office of the principal or division superintendent. The cost of such an audit is a proper charge against the school operating fund or school activity funds.
In FY 2013, the office assumed the responsibility for conducting local school activity funds audits, which were completed by a contracted vendor in prior years. The FY 2013 audit plan reflects hours for developing the new audit process, training, and conducting baseline audits of all school sites. Since

22
these audits will be conducted annually from June to August with the assistance of audit interns, the impact on the total audit plan will not be as significant in subsequent years.
The division’s annual audit plan is based on a risk assessment developed in 2006. The scope of this risk assessment, and the resulting scope of the FCPS internal audit function, is too narrow to adequately address all the risks facing the school system. FCPS has focused its efforts (separate from the required activity funds audits) on administrative and financial risks and not academic program risks, such as the failure to achieve program objectives or to comply with federal program requirements.
FCPS should conduct a new risk assessment that is more comprehensive in scope, addressing all risk factors facing the division. The items listed below represent examples of risk factors that should be addressed in a comprehensive risk assessment. Based on a review of the FCPS internal audit work plans, the bolded items represent factors that are not included or under-represented in the current internal audit function.
Injury, accident, illness, or death of students or employees
Violation of laws, regulations, or rules
Fraud and theft risk factors
Violation of contract terms or grant provisions
Department failure to meet stated objectives or goals
Ineffective – or inefficient – use of FCPS resources
Risk of inaccurate data for administrative management reporting
Negative public sentiment towards FCPS
In addition to these types of risks, a risk assessment should include all functional and program components of a school system, including special education, technology and information systems, safety and security, construction management, and transportation.
A broader risk assessment will result in a broader and more impactful internal audit function. Depending on the results of the risk assessment, the internal audit function may need to contract outside technical assistance and/or train its staff to meet the additional internal audit demands.
FISCAL IMPACT
FCPS should consider hiring an outside firm to conduct an independent risk assessment and assist in the development of an audit plan for the division. Any arrangement with an outside auditor should include a transfer of knowledge so that the division’s lead internal auditor can perform these functions in future years.
Hiring an outside firm to conduct a comprehensive risk assessment would cost approximately $75,000, based on fees Gibson Consulting Group, Inc. has charged other school systems. No other additional

23
resources should be needed in the short-term. However, based on the audit needs identified through the risk assessment, additional in-house or external resources may be needed, as the scope of the internal audit function is expected to be significantly broader. While a better estimate can be provided after the risk assessment is completed, it is estimated that the annual internal audit budget will need to be increased by 50 percent, or approximately $300,000, beginning in FY 2015.
Recommendation 1-3 One-Time
Costs/ Savings
2013-14 2014-15 2015-16 2016-17 2017-18
Hire an outside firm to conduct a comprehensive risk assessment.
($75,000) $0 $0 $0 $0 $0
Expand the role of internal audit.
$0 $0 ($300,000) ($300,000) ($300,000) ($300,000)
Total ($75,000) $0 ($300,000) ($300,000) ($300,000) ($300,000)
Note: Costs are negative. Savings are positive.
B. Management and Administration Division management functions are performed by the superintendent and the senior management team. The superintendent is responsible for establishing an organization structure and management team to effectively run the school system on a day-to-day basis and that supports the achievement of long-term goals. Figure 1.3 shows the current organization structure of the division.

24
Figure 1.3.FCPS divisional organization structure
Division SuperintendentChief of Staff
Division Counsel
Government Relations
Deputy Superintendent
Assistant Superintendent
Communications and Community Outreach
Assistant Superintendent
Facilities and Transportation
Assistant Superintendent
Financial Services
Assistant Superintendent
Human Resources
Assistant Superintendent
Information Technology
Hearings
Student Activities
Assistant Superintendents
Clusters I-VIII
Principals
Assistant Superintendent
Instructional Services
Assistant Superintendent
Professional Learning and Accountability
Assistant Superintendent Special
Services
Source: FCPS school board’s Adopted Budget FY 2013
25
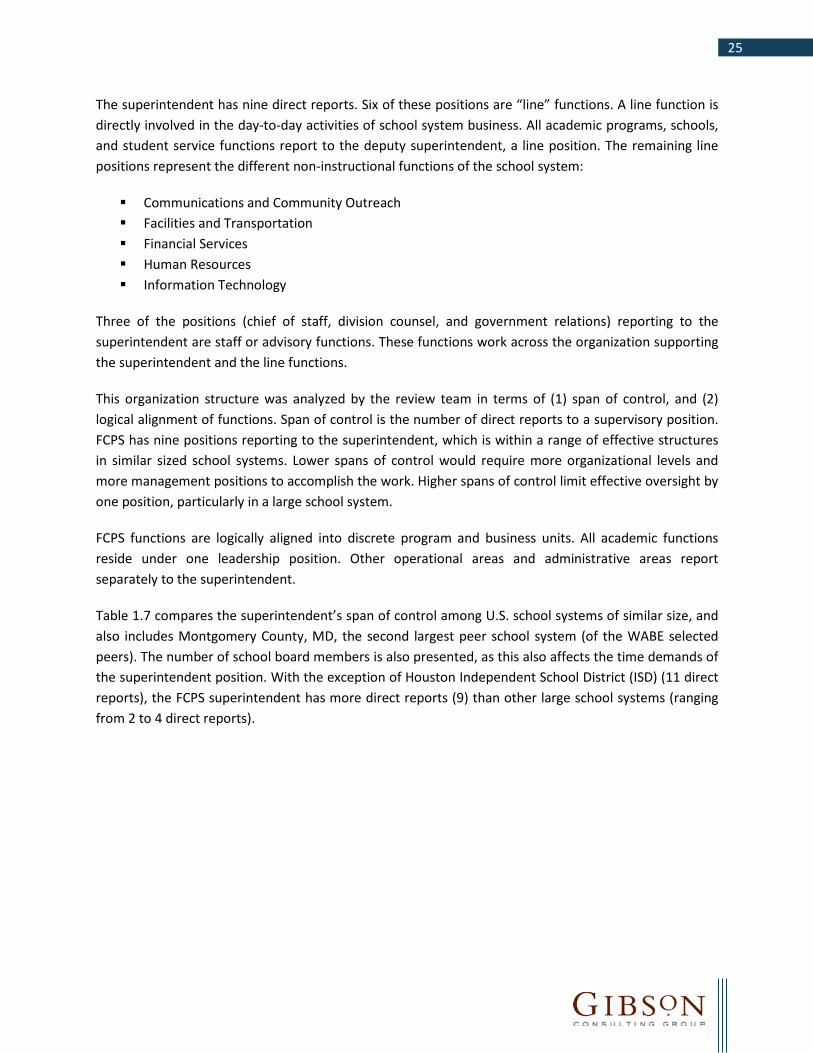
The superintendent has nine direct reports. Six of these positions are “line” functions. A line function is directly involved in the day-to-day activities of school system business. All academic programs, schools, and student service functions report to the deputy superintendent, a line position. The remaining line positions represent the different non-instructional functions of the school system:
Communications and Community Outreach Facilities and Transportation Financial Services Human Resources Information Technology
Three of the positions (chief of staff, division counsel, and government relations) reporting to the superintendent are staff or advisory functions. These functions work across the organization supporting the superintendent and the line functions.
This organization structure was analyzed by the review team in terms of (1) span of control, and (2) logical alignment of functions. Span of control is the number of direct reports to a supervisory position. FCPS has nine positions reporting to the superintendent, which is within a range of effective structures in similar sized school systems. Lower spans of control would require more organizational levels and more management positions to accomplish the work. Higher spans of control limit effective oversight by one position, particularly in a large school system.
FCPS functions are logically aligned into discrete program and business units. All academic functions reside under one leadership position. Other operational areas and administrative areas report separately to the superintendent.
Table 1.7 compares the superintendent’s span of control among U.S. school systems of similar size, and also includes Montgomery County, MD, the second largest peer school system (of the WABE selected peers). The number of school board members is also presented, as this also affects the time demands of the superintendent position. With the exception of Houston Independent School District (ISD) (11 direct reports), the FCPS superintendent has more direct reports (9) than other large school systems (ranging from 2 to 4 direct reports).

26
Table 1.7. Comparative analysis of large school district superintendent span of control
School System Enrollment Superintendent Direct Reports
Number of School Board Members
Fairfax County, VA 180,616 9 12
Montgomery County, MD 148,780 4 7
Hillsborough County, FL 200,287 2 7
Houston ISD, TX 202,842 11 9
Palm Beach County, FL 179,494 3 7
Source: School system web sites.
Note: Direct reports exclude secretarial positions.
The school systems in Table 1.7 with low spans of control have implemented the “deputy” model for both instructional and non-instructional areas, whereby two or three positions oversee all academic, administrative and operational areas. Houston ISD, with the highest span of control, has separate academic and administrative units reporting to the superintendent, instead of through deputy positions. FCPS has a deputy position over academic programs and schools, and separate operational and administrative functions report directly to the superintendent.
School systems applying the deputy model (lower span of control for the superintendent) implicitly acknowledge the significant external demands (e.g., board and community members) of the superintendent position, and place more of the responsibility of school system management under the deputy positions. School systems with larger spans of control place more of the day-to-day management under the superintendent’s direct authority. Neither approach is technically better than the other, and largely depends on the board’s preference for the superintendent being more internally or externally focused.
The management and administration of individual schools are led by school principals, with assistance from assistant principals, and other office staff. FCPS allocates these administrative positions based on staffing formulas approved by the board. School administration is addressed in Chapter 2 – Educational Service Delivery of this report.
Other FCPS management positions have remained constant. The number of assistant superintendent positions declined by 1, from 17 to 16, between FY 2008 and FY 2012. This was the result of the consolidation of the department of accountability and the department of professional Learning.
Commendation 1-2: The FCPS cluster office organization is an efficient and effective way to provide oversight and support to the division’s 196 schools.
FCPS uses regional, cluster offices to provide support and oversight for its schools. Eight clusters are geographically located in Fairfax County. Each cluster office has an assistant superintendent, a supervisor position, and one-half of an administrative position. All clusters have three high school

27
pyramids, which is a grouping of schools comprised of a high school and the middle and elementary schools which feed into the high school.
The assistant superintendent position for each cluster is the instructional leader, manager, and administrative advocate for each school in their respective clusters. The major responsibilities of the cluster offices include the following:
Principal recruitment, hiring recommendations, and evaluation School improvement planning, review and assistance Visiting schools Program implementation assistance Monitoring school and student performance Ensuring compliance with FCPS policies and procedures Community engagement Communications Problem solving and crisis management
Cluster offices fulfill these responsibilities with minimal staffing and budget. Tables 1.8 and 1.9 provide the staff levels and expenditure history for each cluster office over the past five years. Staffing for all cluster offices combined has declined from 24 positions to 21 positions since FY 2008, and the budget has remained constant at $3 million a year with the exception of FY 2011. In that year only, more than $1 million was used from non-recurring federal funds to support several school improvement and student achievement efforts.
Table 1.8. Cluster office staffing, FY 2008 through FY 2012 Cluster FY 2008 FY 2009 FY 2010 FY 2011 FY 2012
I 3 3 3 2.5 2.5
II 3 3 3 2.5 2.5
III 3 3 3 2.5 2.5
IV 3 3 3 2.5 2.5
V 3 3 3 2.5 2.5
VI 3 3 3 3.5 3.5
VII 3 3 3 2.5 2.5
VIII 3 3 3 2.5 2.5
Total 24 24 24 21 21
Source: FCPS Actual Expenditure and FTE History

28
Table 1.9. Cluster office expenditures, all funds, FY 2008 through FY 2012 Cluster FY 2008 FY 2009 FY 2010 FY 2011 FY 2012
I $347,968 $368,966 $334,280 $452,873 $330,977
II $369,978 $369,732 $430,054 $506,415 $330,795
III $360,000 $363,782 $355,120 $466,587 $422,648
IV $368,825 $364,371 $337,068 $488,468 $353,417
V $426,977 $414,983 $396,266 $527,196 $366,276
VI $415,753 $446,067 $385,483 $634,551 $464,089
VII $318,931 $379,077 $377,095 $447,673 $348,153
VIII $422,475 $368,514 $326,853 $525,026 $348,737
Total $3,030,907 $3,075,492 $2,942,219 $4,048,789 $2,965,092
Source: FCPS Actual Expenditure and FTE History
Other large school systems have regional offices similar to the FCPS cluster model, but have large budgets and staff levels, many of which may overlap with central office spending and staffing. The FCPS model is highly efficient, perhaps too efficient given the demands on the cluster offices. Through its budget process, FCPS should evaluate the appropriateness of its cluster office staff levels and the ability to provide effective support for the schools. A related recommendation in this chapter addresses the decision authority of cluster offices (see Recommendation 1-4).
Recommendation 1-4: Develop a decision-making framework for instructional and school administrators.
While the board has a governance framework in its Strategic Governance Manual, FCPS currently does not have a decision-making framework or any single document that defines decision-making authority between the central office, the cluster offices, and the schools. The job descriptions for principals outline specific responsibilities, including planning, assessment, instructional leadership, communication, community relations, safety, and administrative management. Job description tasks provide a deeper level of detail related to the above responsibilities, but do not define the decision authority of principals. The same holds true for the cluster assistant superintendent job description. The FCPS policy manual provides guidance on some decisions, but there is no single source for principals, cluster management, or division management to reference in making decisions.
During principal focus groups, teacher focus groups, and school visits, the review team identified examples where the lack of a decision-making framework was contributing to inefficient practices. For example:
Curriculum/instructional materials. Schools, cluster management, and division management would benefit from knowing where decisions can be made with respect to curriculum and instructional materials. The division uses a standard curriculum, but the materials supporting that curriculum are not, and may not necessarily need to be, fully standardized. The location of
29
this authority is important to document in order to prevent an approach that may be either too fragmented or too inflexible.
Student data analysis. There are wide ranges of school-based tools and methods applied in the analysis of student data, resulting in duplication of effort. Providing system-wide tools for data analysis would improve data comparability across FCPS, as well as providing a more efficient process to analyze and report these data.
Custodial services. School principals have decision authority over custodial services at their schools, yet principals are not trained in the operation of a custodial function. Certain decisions relating to equipment, cleaning frequencies, and custodial supplies should be made by positions that are trained in such matters. A decision-making framework will help identify where current decision authority may be displaced in an organization.
Manual logs. Some schools continue to use manual logs and spreadsheets as a back-up to the division information systems. Decisions to use these tools are school-based, and contribute to duplicative and inefficient practices.
Some decisions, such as curriculum decisions, should be made or guided centrally in order to provide consistent application and efficient operations at the school and division administration levels. Other decisions, such as differentiation of instruction for individual students, can and should be made at the school level. Documentation of a single decision-making framework will help ensure that all principals and cluster and division administrators understand the criteria for making certain decisions. Adopting a decision-making framework will ensure its consistent use by all positions involved in decision making. At a minimum, decisions should be identified in the following four categories:
1. Site-based decisions not requiring division administration approval. These are decisions that can be made or approved independently by principals or their designees without intervention or approval by division administration. These decisions might include teaching strategies used and assignments of special projects to staff.
2. Site-based selection from a list of division-provided options. Examples of selection lists might include computer and instructional software available for purchase. Schools can be provided choices of computer brands and software as long as they meet minimum specifications established by division administration’s technology function. Purchasing items that are not on the approved list could result in the inability of the technology function to effectively support the hardware or software. Selecting from a list provides decision-making flexibility within a framework that helps ensure divisionwide efficiency and effectiveness.
3. Site-based decisions requiring division or cluster office approval. Certain decisions, such as hiring or terminating school staff, should require the approval of cluster and division administration to ensure compliance with state and federal laws and division policy.
4. Division or cluster office decisions. There are certain decisions that should be made by division administration and enforced at all schools. A single standardized curriculum and the school bell schedule are examples of decisions that should be established, or standardized, by division

30
administration. In making these decisions, however, division administration should elicit input from schools and cluster offices to ensure that decisions make sense for the schools, as well as the division.
In developing a site-based decision-making framework, the authority, using the four options above, should be defined for the types of decisions. Differing types of decisions are included in the following list.
Curriculum / curriculum guides Academic program decisions Ability to re-allocate instructional and/or non-instructional staff to meet needs identified by
school Response to Intervention Benchmark testing Course offerings (secondary) Identification of professional development needs School calendar School bell schedule Class size Bus routes Cafeteria schedule Authority over custodians and how they spend their time Authority over food service workers and how they spend their time Work schedules for any categories of staff Number of work days per year for any categories of staff Block scheduling (secondary) Terminating school staff Establishing staffing needs Establishing non-staff budget needs School facility renovations Student discipline – code of conduct Student activity funds – software / processes Class rank determination / computation Purchasing decisions as they relate to teachers’ or principals’ authority to select vendors, versus
using the division administration purchasing department or only pre-approved vendors Computers / servers Instructional software purchases Hiring school staff
In implementing this recommendation, division administration should first conduct a brief online staff survey to gauge perceptions of decision-making authority based on the list of decisions, and any additional decision areas desired by division management. A committee of school principals, cluster

31
assistant superintendents, and divisional leaders from all program and operational areas should be convened to review the survey results and develop the decision-making framework.
Job descriptions for all affected instructional and school administrative positions, cluster assistant superintendent positions, and central office leadership positions should reference the decision-making framework.
FISCAL IMPACT
The division is expected to need outside assistance ($50,000 in consulting or contractor fees) in implementing this recommendation. This is based on an estimated 250 hours of facilitation and advisory services at an hourly rate of $200. In addition, school and division administrators will need to dedicate approximately 20 hours each to the development of the framework and modification of job descriptions. The outside consultant/contractor will serve as an independent facilitator for the committee and be primarily responsible for developing the decision-making framework materials.
Recommendation 1-4 One-Time
Costs/ Savings
2013-14 2014-15 2015-16 2016-17 2017-18
Develop site-based decision-making framework.
($50,000) $0 $0 $0 $0 $0
Note: Costs are negative. Savings are positive.
C. Policies and Procedures Virginia Law §22.1-253.13:7 requires each local school board to maintain and follow up-to-date policies, and that all policies be reviewed at least every five years and revised in the interim as needed. State law also requires school divisions to maintain a copy of the board policy manual on the division’s web site. The FCPS policy manual is easily accessible online and can be sorted for review either by policy title alphabetically or by numerical sequence.
Board policies and administrative regulations are presented through the same web site. Administrative regulations, which provide greater specificity in how certain policies are to be applied, do not require board approval unless specifically required by law. Policies are specified by a “P” and a 4-digit number; administrative regulations reflect an “R” and a 4-digit number using the same numbering schema. The web site has a word search capability to allow the viewer to type in words or phrases to identify all applicable policies and regulations. Separate web pages provide links to policies modified within the past 12 months and policy changes currently under consideration.
FCPS uses the Virginia School Board Association’s policy review and development service to provide policy updates based on changes in state law. Other recommended changes to board policy may be brought to the board for consideration by individual board members, FCPS staff members, students, citizens, community groups, consultants, or the County Board of Supervisors. FCPS tracks the last

32
revision date for each policy in the policy manual and separately tracks compliance with the five-year policy review mandate.
Recommendation 1-5: Improve procedure update practices.
Operating procedures are maintained by FCPS departments. In addition, some departments maintain process maps or visual representations of major transactions. Pursuant to a data request at the beginning of this project, FCPS provided more than 60 examples of operating procedures for academic programs, human resources, financial services, information technology, facilities and transportation and other functional areas.
Some FCPS operating procedures included the most recent revision date, others did not. Documented procedures also varied in format and level of specificity. All operating procedures should include the revision date and follow a consistent format.
FISCAL IMPACT
The superintendent’s office or designee should determine the format for operating procedures. Each department leader will continue to be responsible for the development/update of procedures in their respective areas using the prescribed format. The implementation of this recommendation will not require any out-of-pocket investment by the division.

33
Chapter 2 – Educational Service Delivery Introduction
The mission of Fairfax County Public Schools (FCPS and the division) is to be a world class school system that inspires, enables, and empowers students to meet high academic standards, lead ethical lives, and demonstrate responsible citizenship. The extent to which this mission is achieved is largely dependent on the quality of its academic programs and services, and the effective and efficient use of division human and financial resources. Having adequate processes in place to identify student educational needs, providing for those needs, and measuring performance as a result of these programs are all critical to the success of an education system. Educational service delivery includes the provision of programs for students with special needs as well as careful adherence to other state and federal mandates concerning the curriculum.
This chapter provides commendations and recommendations related to the management and delivery of educational programs and services. Five aspects of educational service delivery were assessed during this project:
A. Organization and Management B. School Administration C. Curriculum Policies and Management D. Special Education E. Other Special Programs
FCPS provides educational services to 177,918 students in grades pre-K to 12 in 25 secondary and high schools, 23 middle schools, 139 elementary schools, 7 special education centers, and 2 alternative high schools. All schools in FCPS are accredited based on academic standards, and all but two schools are fully accredited. Over the past five years, student enrollment has grown by 16,000 students, and the economically disadvantaged population has increased 5 percentage points to equal 26 percent of total enrollment. The combination of enrollment increases, changing demographics, and reduced funding levels has created challenges for FCPS, yet student performance trends have been largely positive.
The Virginia Standards of Learning (SOL) establish the expectations for student learning and achievement for various subjects in grades 3-12. These assessments determine the extent to which students have mastered the specific knowledge and skills contained in the curriculum frameworks for core subject areas.
This review focuses on FCPS’ operating efficiency and not academic results, but it is important to place efficiency in the context of student performance. Table 2.1 presents the division’s 2011-12 SOL passing rates (the most recent year available) by subject compared to the state for all students and economically disadvantaged students. For all students, FCPS passing rates were above the state average in all subject areas with the exception of science, where it was the same as the state average. FCPS economically

34
disadvantaged students performed better than the state averages in English, Mathematics, Writing, and History, but to a lesser degree than for all students. In Science, FCPS economically disadvantaged students’ passing rates were less than the state average.
Table 2.1. SOL passing rates by subject, FCPS and state, 2011-12
Subject Area All Students Economically Disadvantaged
Students FCPS State FCPS State
English 94 89 86 81
Mathematics 78 68 60 54
Writing 94 89 85 81
History 90 85 77 74
Science 91 91 79 83
Source: Virginia Department of Education - https://p1pe.doe.virginia.gov/reportcard/
Table 2.2 shows the overall accomplishment of FCPS students with respect to the board’s student achievement goals from fiscal year (FY) 2007 through FY 2011. Composite indicators measure the achievement of students relative to the SOL’s for core subject areas combined. These trends show four-year net increases in student achievement for every grade level tested between FY 2007 and FY 2011.
Table 2.2. SOL composite results, FY 2007 through FY 2011
Source: FCPS FY 2013 Approved Budget
Continued student achievement gains in the face of financial and demographic challenges have been the result of effective instructional programs and high quality teachers at FCPS. There are many educational programs and practices at FCPS that have been noted by third parties as best practices. During the course of this review, the review team noted several practices related to academic programs and program management that were particularly commendable:
School improvement plans have increased their usefulness through the use of short-term planning and monitoring templates.
FCPS is implementing programs and procedures to improve minority and historically under-served representation in the gifted services (Advanced Academic) program.
The FCPS English Speakers of Other Languages (ESOL) program has received national-level recognition.
Grade Level FY 2007 FY 2008 FY 2009 FY 2010 FY 2011
Grade 3 78% 80% 81% 81% 80%
Grade 6 68% 71% 76% 75% 79%
Grade 8 74% 77% 83% 87% 86%
Grade 12 74% 75% 76% 78% 78%

35
The special services Applied Behavior Analysis (ABA) program is well organized, includes well trained personnel, and provides instructional support to teachers of students with Autism.
Several recommendations are made in this chapter to improve the efficiency and effectiveness of school operations and academic program management. School administrative efficiency could be improved by changing the staffing formulas for elementary office assistants to better reflect the work demands relative to middle and high schools. FCPS should also consider piloting the use of part-time assistant principals to get closer to staffing levels established in national guidelines. Certain content areas in the division’s curriculum need further standardization, and requirements for an interim assessment system need to be developed. In the area of special education, FCPS needs to accelerate the implementation of its Responsive Intervention program divisionwide, reassign instructional staff to serve more students in less restrictive environments, and work collaboratively with the county to reduce the number of students served through expensive out-of-district placements.
Table 2.3 provides a summary of education service delivery recommendations and resulting fiscal impacts over the next five years.
Table 2.3. Fiscal impact of recommendations
Recommendations One-Time
Costs/ Savings
2013-14 2014-15 2015-16 2016-17 2017-18 Total Fiscal
Impact
School Administration
2-1. Pilot the use of part-time assistant principals at elementary schools to obtain optimal staff levels.
$0 $0 $0 $0 $0 $0 $0
2-2. Adjust school office assistant staffing formulas to reflect work demands.
$0 $0 $4,629,291 $4,629,291 $4,629,291 $4,629,291 $18,517,164
Curriculum Policies and Management
2-3. Standardize elements of the division’s curriculum support materials.
$0 $0 $0 $0 $0 $0 $0
2-4. Define requirements for a divisionwide interim assessment system.
($50,000) $0 $0 $0 $0 $0 ($50,000)

36
Recommendations One-Time
Costs/ Savings
2013-14 2014-15 2015-16 2016-17 2017-18 Total Fiscal
Impact
Special Education
2-5. Accelerate implementation of the division’s Response to Intervention (RtI) model.
$0 ($1,050,000) ($1,050,000) $0 $0 $0 ($2,100,000)
2-6. Increase the inclusion of students with disabilities into general education environments.
($50,000) $0 $0 $0 $0 $0 ($50,000)
2-7. Collaborate with county administration to reduce the number of students served out-of-district in multi-agency services.
$0 $0 $0 $0 $0 $0 $0
Net Fiscal Impact ($100,000) ($1,050,000) $3,579,291 $4,629,291 $4,629,291 $4,629,291 $16,317,164
Note: Costs are negative. Savings are positive.
A. Organization and Management All FCPS schools and academic programs are aligned under the deputy superintendent, who reports to the superintendent. Figure 2.1 presents the organization structure under the deputy superintendent. This model, often referred to in public education as the “Chief Academic Officer” model, is common in larger school systems. Reporting to the deputy superintendent are assistant superintendents for eight geographic clusters of schools. Principals of schools in each cluster report directly to the assistant superintendent for that cluster. Each of the eight clusters has 2.5 full-time equivalent (FTE) staff positions; one additional FTE position is shared among all the clusters. Cluster offices are responsible for evaluating and supporting principals, school improvement planning, communications, community relations, events planning and execution, school crisis management, and other responsibilities and demands. The role of cluster offices is addressed in Chapter 1 – Governance and Administration.
Also reporting to the deputy superintendent are the following positions:
Assistant Superintendent for Instructional Services – oversees curriculum development in all content areas, instructional professional development, library services, guidance services and instructional program stewardship.

37
Assistant Superintendent for Professional Learning and Accountability – includes professional development for instructional and support staff, student assessment, program evaluation, Thomas Jefferson Office of Admissions, School Accreditation (SACS and State), and leadership development.
Assistant Superintendent for Special Services – includes special education instruction, special education procedural support, intervention and prevention services (including oversight of psychologists, social workers, safety and wellness, homebound and home-based instruction, and alternative schools), and operations and strategic planning (including budget, data management, registration, translation services and student health services).
Figure 2.1. FCPS organization structure for schools and academic programs
Deputy Superintendent
Hearings
Student Activities
Assistant Superintendents
Clusters I-VIII
Principals
Assistant Superintendent
Instructional Services
Assistant Superintendent
Professional Learning and Accountability
Assistant Superintendent Special
Services
Director PreK-12 Curriculum and
Instruction
Director Professional and Life Skills
Director Language Acquisition and Title I
Director Operations, Strategic Planning, and
Communications
Director Intervention and Prevention
Services
Director Operations and Strategic Planning
Director Special Education Instruction
Director Special Education Procedural
Support
Director Leadership Development
Director Professional Practice
Director Program Evaluation
Director Student Testing
Director Thomas Jefferson HS for Science
and Technology Admissions
Source: FCPS 2013
Table 2.4 presents actual expenditures for all areas under the deputy superintendent, with the exception of the clusters and schools, for the past five years. While the trend shows a precipitous decline in spending, approximately one-half of the reduction relates to changes in the classification of resources allocated to departments to support schools. These resources include funding for items such as hourly teachers, substitutes, tests, and instructional supplies.
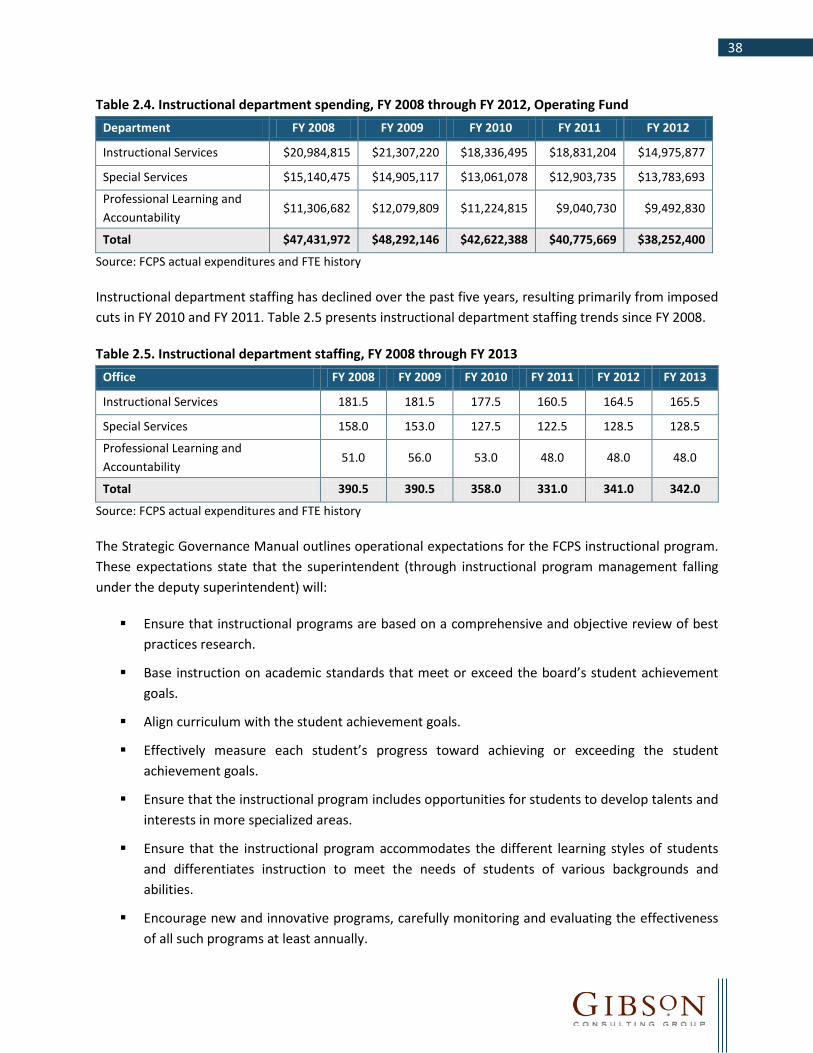
38
Table 2.4. Instructional department spending, FY 2008 through FY 2012, Operating Fund Department FY 2008 FY 2009 FY 2010 FY 2011 FY 2012
Instructional Services $20,984,815 $21,307,220 $18,336,495 $18,831,204 $14,975,877
Special Services $15,140,475 $14,905,117 $13,061,078 $12,903,735 $13,783,693
Professional Learning and Accountability
$11,306,682 $12,079,809 $11,224,815 $9,040,730 $9,492,830
Total $47,431,972 $48,292,146 $42,622,388 $40,775,669 $38,252,400
Source: FCPS actual expenditures and FTE history
Instructional department staffing has declined over the past five years, resulting primarily from imposed cuts in FY 2010 and FY 2011. Table 2.5 presents instructional department staffing trends since FY 2008.
Table 2.5. Instructional department staffing, FY 2008 through FY 2013 Office FY 2008 FY 2009 FY 2010 FY 2011 FY 2012 FY 2013
Instructional Services 181.5 181.5 177.5 160.5 164.5 165.5
Special Services 158.0 153.0 127.5 122.5 128.5 128.5
Professional Learning and Accountability
51.0 56.0 53.0 48.0 48.0 48.0
Total 390.5 390.5 358.0 331.0 341.0 342.0
Source: FCPS actual expenditures and FTE history
The Strategic Governance Manual outlines operational expectations for the FCPS instructional program. These expectations state that the superintendent (through instructional program management falling under the deputy superintendent) will:
Ensure that instructional programs are based on a comprehensive and objective review of best practices research.
Base instruction on academic standards that meet or exceed the board’s student achievement goals.
Align curriculum with the student achievement goals.
Effectively measure each student’s progress toward achieving or exceeding the student achievement goals.
Ensure that the instructional program includes opportunities for students to develop talents and interests in more specialized areas.
Ensure that the instructional program accommodates the different learning styles of students and differentiates instruction to meet the needs of students of various backgrounds and abilities.
Encourage new and innovative programs, carefully monitoring and evaluating the effectiveness of all such programs at least annually.
39
Ensure that all instructional programs are regularly evaluated and modified as necessary to assure their continuing effectiveness.
Maintain a procedure for reviewing instructional materials upon formal request by a parent or other stakeholder.
Review academic program placement periodically to assure reasonable access and available capacity.
Commendation 2-1: School improvement plans have increased their usefulness through the use of short-term planning and monitoring templates.
Each school, with assistance from cluster offices, is responsible for the development of annual school improvement plans. As part of a grant funded initiative, these annual school improvement templates were modified to develop 60-day and 90-day action plans for eligible schools. Other schools have requested to use this modified template, as it provides more timely feedback on meeting shorter term targets and making necessary adjustments.
For many school systems reviewed by Gibson Consulting Group, Inc., annual improvement plans too often represent reporting requirements as opposed to effective planning instruments. By breaking up the planning and evaluation processes into shorter time periods, the monitoring templates have been more effective in identifying problems sooner, and will likely show results in student outcomes. This is a best practice that should be emulated by other school systems.
B. School Administration FCPS schools are organized into eight geographic clusters. Each school has administrative and support staff to conduct the transactional business of providing an education. Most of the school budget is driven by staffing or other formulas; however, school principals and site-based committees have flexibility in shifting staff positions to meet more pressing needs and determine how to spend their materials and supplies budgets to best meet student needs.
Recommendation 2-1: Pilot the use of part-time assistant principals at elementary schools to obtain optimal staff levels.
FCPS staffs each school with a principal, and additional assistant principals based on staffing formulas that vary by school type. The job descriptions for assistant principals of elementary, middle, and high schools are virtually identical in terms of the job definitions and typical tasks. These tasks include, but are not limited to, instructional leadership, management, communications, discipline management, planning, and problem analysis and resolution.
Figure 2.2 presents the ratio of students to school administrators (principals and assistant principals combined) for FCPS and the Washington Area Boards of Education (WABE) peer school systems. The higher the ratio, the lower the staff counts relative to the student population. FCPS falls in the middle of the group overall and ranks second highest among the four larger school systems (Montgomery, Prince
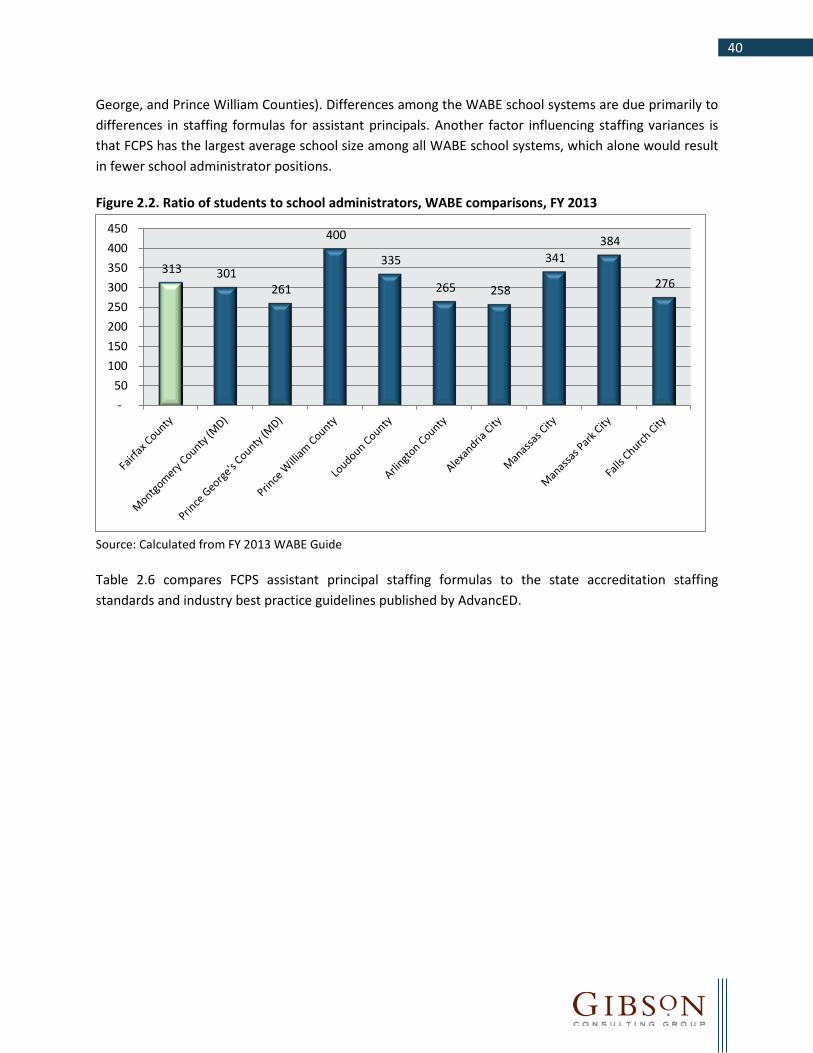
40
George, and Prince William Counties). Differences among the WABE school systems are due primarily to differences in staffing formulas for assistant principals. Another factor influencing staffing variances is that FCPS has the largest average school size among all WABE school systems, which alone would result in fewer school administrator positions.
Figure 2.2. Ratio of students to school administrators, WABE comparisons, FY 2013
Source: Calculated from FY 2013 WABE Guide
Table 2.6 compares FCPS assistant principal staffing formulas to the state accreditation staffing standards and industry best practice guidelines published by AdvancED.
313 301 261
400
335
265 258
341 384
276
- 50
100 150 200 250 300 350 400 450

41
Table 2.6. FCPS assistant principal staffing formulas compared to state standards and industry guidelines
School Level FCPS Formula Applicable State Staffing
Standards (minimum staff levels)
AdvancED Guidelines
Elementary School
1.0 per school for up to 949 students 2.0 per school for 950 or more students and 76 or more instructional positions
0.5 for 600 to 899 students 1.0 for 900 or more students
0.5 for 500 to 749 students 1.0 for 750 to 999 students 1.5 for 1,000 to 1,249 students 2.0 for 1,250 to 1,499 students
Middle School
2.0 per school 1.0 for 600 to 1,199 students 2.0 for 1,200 to 1,799 students
1.0 for 500 to 749 students 1.5 for 750 to 999 students 2.0 for 1,000 to 1,249 students 2.5 for 1,250 to 1,499 students 1.0 additional staff position for each additional 250 students
High School
3.0 for up to 1999 students 4.0 for 2,000 to 2,599 students 5.0 for 2,600 or more students 1.0 Associate Principal for secondary schools
1.0 for 600 to 1,199 students 2.0 for 1,200 to 1,799 students 3.0 for 1,800 to 2,399 students 4.0 for 2,400 to 2,999 students
1.0 for 500 to 749 students 1.5 for 750 to 999 students 2.0 for 1,000 to 1,249 students 2.5 for 1,250 to 1,499 students 1.0 additional staff position for each additional 250 students
Source: FCPS Approved Budget, FY 2013; AdvancED Educational Practices Reference Guide, 2007
The state staffing standards and AdvancED guidelines both prescribe half-time positions in certain situations. FCPS does not apply half-time positions in their formulas. Logistically, half-time positions can be challenging due to the need for an assistant principal to split time between two campuses.
FCPS assistant principal staffing levels for all school types meet the applicable state minimum standards prescribed by the Commonwealth of Virginia’s Standards of Quality (SOQ). When compared to AdvancED guidelines, staff level comparisons vary by school type. Table 2.7 compares FCPS assistant principal staff counts by school to the counts suggested by AdvancED guidelines. Elementary schools

42
have 84.5 more assistant principals than what AdvancED guidelines suggest, while high schools have 37.5 fewer assistant principals. Middle school assistant principal levels are in line overall with AdvancED guidelines; however, the guidelines would suggest reallocating positions from lower enrollment middle schools to higher enrollment middle schools.
Table 2.7. Comparison of FCPS assistant principal counts to AdvancED guidelines
School Level Assistant Principals
Actual Target Number
(AdvancED) Difference
Overage (Shortage)
Elementary 171.0 86.5 84.5
Middle 52.0 48.5 3.5
High 102.0 139.5 (37.5)
Totals 325.0 274.5 50.5
Sources: FCPS actual expenditure and FTE history; calculations based on AdvancED Educational Practices Reference Guide, 2007
FCPS should pilot part-time assistant principals at a sample of low enrollment elementary schools. Student performance and student demographics should also weigh in on the school selection process. If FCPS learns through the pilot program that schools can achieve the same or higher level of success with fewer administrative staff, consideration should be given to modifying the staffing formula for assistant principals. Other factors affecting assistant principal time, such as offsite principal meetings or other principal commitments away from school, should also be analyzed.
FISCAL IMPACT
The pilot project will determine the feasibility of implementing part-time assistant principal staff on a broader scale. Any initial savings should be considered for investments in additional high school assistant principals. Accordingly, there is no fiscal impact associated with this recommendation.
Recommendation 2-2: Adjust school office assistant formulas to reflect work demands.
FCPS applies staffing formulas for most school-based staff, including school office assistants. Office assistants perform important work in the processing of school transactions, handling communications and supporting school administrators and teachers. Based on the FCPS job description definition an office assistant performs a variety of general office duties required to support the activities of a school to include: responding to requests for information, maintaining and updating records, and preparing documents, and performs related duties as required or assigned.

43
Specific tasks office assistants perform vary by school type, but generally include the following:
Communicating with parents, school staff, and central office staff via phone and email. Processing transactions and maintaining files for student-related transactions (enrollment,
attendance), executing school purchases, reporting time and attendance, initiating facility maintenance and technology maintenance requests, and managing student activity funds.
Providing secretarial support for school administrators. Providing supplies, photocopying, and other support services for teachers. Managing the security system. Opening and distributing mail and supply orders. Managing substitutes. Planning and coordinating school events.
During school visits, the review team validated the number of office assistants and their responsibilities, and also learned about factors that are influencing the office assistant work demands. For example, technology helps support the efficiency of office assistant work at FCPS schools. Information systems support direct entry of grades, attendance and substitute requests by teachers, relieving the office assistants of this responsibility. Auto-dialers automatically notify parents via phone or email message of student absences, reducing the amount of effort on the phone by school office assistants. Some processes, however, such as time and attendance reporting, remain highly manual, paper-intensive, and time consuming. FCPS is in process of upgrading its human resources and payroll systems (human resources information system discussed separately in Chapter 6 – Financial Management), but as of the date of this review the time and attendance reporting process at schools is highly inefficient and demands significant time by school office assistants.
FCPS assigns office assistants to schools based on a formula. For elementary schools, one FTE office assistant is allocated for every 10 professional positions assigned to a school. Middle schools are assigned four FTE office assistant positions, plus additional part-time or full-time positions for schools with higher enrollment. For high schools, the formula allocates 8.5 FTE office assistant positions, plus additional full-time or part-time positions for larger schools. If the high school has a sub-school configuration, the formula allocates 10.0 FTE office assistant positions, plus additional full-time or part-time positions for larger schools. Each middle school and high school includes a finance technician position primarily to support the greater demands of activity fund accounting at the schools. Two of the high schools, which have academies, have two finance technicians.
FCPS staffing formulas exceed the minimum state requirements for office assistant staffing. Virginia establishes minimum staffing levels for accreditation for many staff positions, including office assistants. The state standards, presented in the SOQ, are based on the number of students for all school levels.
Figure 2.3 compares the average student/office assistant staff ratios for FCPS elementary, middle and high schools. The lower the ratio, the higher the staff level relative to the student population. The student/office assistant ratios for high and secondary schools range from 142 to 255, with an average of

44
211. The higher ratios are generally associated with the larger high schools where economies of scale and related efficiencies can be achieved.
The average middle school ratio reflects a greater burden of work for office assistants than the high schools. The middle school ratios, including Key and Kilmer Centers with their respective middle schools, range from 121 to 290 and the average is 239. Elementary schools reflect a far less burden on office assistants relative to the number of students, and show a wider dispersion of productivity. The ratio ranges from 72 to 192 with an average of 135. Elementary school ratios, on average, are 64 percent of high school ratios and 56 percent of middle school ratios.
Figure 2.3. Average student/office assistant ratios by FCPS school type, 2012-13
Source: Calculated from FCPS staff inventory and student enrollment, 2012-13
The work demands for office assistants at elementary schools should be relatively lower than those at middle schools or high schools. This is due to the nature of the instructional settings. Middle schools and high schools have multiple class periods, increasing the transactional demands on office assistants for activities such as attendance tracking and discipline referrals. Middle schools and high schools have a much larger number of activity funds to manage relative to their student populations than elementary schools. Since most middle schools and high schools are generally larger than elementary schools, they should be more efficient due to economies of scale. However, the difference in workloads should not be as wide as they currently are.
After FCPS upgrades its human resources system and re-engineers the school processes related to time and attendance reporting (see discussion in Chapter 6 – Financial Management), staffing formulas for office assistants should be adjusted to be more commensurate with the relative work demands. Elementary school office assistant staffing should be based on the number of students, not the number of professional staff – similar to how FCPS high schools, middle schools, and the Virginia SOQ’s determine staffing levels.
211
239
135
-
50
100
150
200
250
300
High Schools Middle Schools Elementary Schools

45
If the ratio of students to office assistants, on average, was increased from 133 to 175 – still well below the middle school and high school average ratios – 170.4 fewer positions would be needed. A portion of these positions could be reallocated to middle schools and high schools, depending on the degree to which new information systems relieve the burden and related time demands of office assistants.
FISCAL IMPACT
The fiscal impact of implementing this recommendation assumes that 50 percent of the savings from elementary position reductions would be allocated to middle school and high school positions. A reduction of 170.4 positions, applied against an average elementary office assistant salary of $37,811, plus 43.7 percent for benefits results in annual savings of $9,258,583. No more than 50 percent of this amount ($4,629,291) should be reinvested in middle school and high school positions after the work demands are re-evaluated. FCPS should validate that the recent and planned upgrades of its information systems are contributing to lower work demands at the schools.
During 2013-14, FCPS management may decide to reallocate elementary positions to middle and high schools. This would not have a material fiscal impact on the 2013-14 budget.
Recommendation 2-2 One-Time
Costs/ Savings
2013-14 2014-15 2015-16 2016-17 2017-18
Adjust school office assistant staffing formulas.
$0 $0 $4,629,291 $4,629,291 $4,629,291 $4,629,291
Note: Costs are negative. Savings are positive.
C. Curriculum Policies and Management FCPS Administrative Regulation 3230.2 outlines the division’s responsibility for curriculum development and updates. This regulation states that FCPS curriculum coordinators and program specialists, along with staff teams including classroom teachers, will be primarily involved in developing and updating the program of studies (curriculum) and communicating any changes to the board through the annual operating plan. FCPS develops most of its curriculum in-house, and purchases third party products and software to supplement the curriculum. The following curriculum is developed by FCPS staff and is made available through the division’s web site:
Pre-Kindergarten Program of Studies
Grades K-12 English Language Arts (ELA), Mathematics, Science, Social Studies, Health and Physical Education, Fine Arts, World Languages, Library Science, ESOL, and Technology
Grades 7-12 Business and Information Technology, Family and Consumer Science, Health and Medical Sciences, Technology and Engineering Education, Trade and Industrial Education
In FY 2012, 58 positions in instructional services were devoted to curriculum development and providing curriculum support to FCPS schools. This level is down from 71 positions in FY 2008. The two content areas with the most positions are ELA (9) and Mathematics (8).

46
The FCPS program of studies for all grade levels is aligned to the state SOL in all curricular areas. Division curriculum leaders and teachers engage in curriculum projects over the summer months to ensure that the FCPS program of studies remains aligned to new standards and any changes are published in the curriculum management system, eCART. This alignment is verified annually in preparation for the Operational Expectations Monitoring Reports given to the school board. The majority of the FCPS program of studies is available via eCART.
Recommendation 2-3: Standardize elements of the division’s curriculum support materials.
While teachers have access to curriculum and curriculum support documents such as pacing guides for each of the core content areas, there is significant variation in how each content area approaches the development of their respective curriculum support materials. For example, the mathematics content area uses a scaffolding approach, clearly identifying the correlated standards from the prior grade level as well as the next grade level for each unit of study. Identifying the grade level above standards supports teachers with extending and differentiating instruction for advanced learners. Principals in the elementary focus group indicated this was a valuable resource for their teachers and stated that they would like the same level of detail for ELA.
Each of the core content areas has a unique design for their pacing guides. The Social Studies content area identifies essential understandings, essential questions, and essential skills for each of the social studies standards. None of the other content areas provide this level of information. Variation across content areas is particularly problematic for elementary-level teachers who teach multiple content areas and have to adjust to multiple formats and varied presentation of information.
In addition to the variation in the design of curriculum materials, participants in the teacher focus group reported confusion regarding which curriculum materials are housed in Blackboard (learning portal) versus eCART. While Blackboard is the conduit to eCART, and access to eCART curriculum materials is through Blackboard, teachers were unclear about the relationship between the two systems. Increased communication and training around access and availability of resources in eCART would be helpful in reducing confusion.
The review team’s independent assessment validated the input from focus groups. Table 2.8 presents the varying levels of detail across content areas for the elementary curriculum pacing guides.

47
Table 2.8. Contents of FCPS elementary curriculum pacing guides by core content area Content Area
Level of Detail Social
Studies Reading /
ELA Mathematics Science
Scaffolded skills/standards including extension for enrichment/differentiation
X
Sample units of instruction X X X X Teacher notes for understanding essential standards
X X
Reference to formative assessments X X Source: FCPS curriculum pacing guides, FCPS 2013
FCPS should seek to standardize the level of detail and format of the elementary pacing guides across all content areas. This will provide a richer and easier to use curriculum for teachers.
FISCAL IMPACT
Staff resources in Social Studies, ELA, and Science need to be reallocated temporarily (i.e., shifted from school support to curriculum development) to improve the pacing guides. Because of their familiarity with the curriculum, FCPS staff should perform this work. It is estimated that one FTE position for one year could accomplish this task in each of the three areas. Additional training can be conducted by the FCPS instructional technology unit.
Recommendation 2-4: Define requirements for a divisionwide interim assessment system aligned to Virginia SOL.
The use of interim benchmark assessments, generally administered on a quarterly basis, provide a divisionwide view of how individual schools and individual students are progressing through the division’s curriculum. These assessments are essential in today’s high stakes testing environment and for a division the size of FCPS. Just as important is the use of more frequent, short-cycle formative assessments that provide at least weekly information for teachers to gauge the effectiveness of their instruction and identify students in need of immediate academic support.
The assessment item bank in eCART was originally developed for use in constructing standards aligned with short-cycle formative assessments rather than interim benchmark assessments predictive of success on end-of-year state summative exams. Short-cycle formative assessments are designed to be diagnostic in nature, aligned to lessons and units of study, and provide teachers with information regarding individual student’s response to, and progress with, instruction. Short-cycle formative assessments are provided on an ongoing and frequent basis, generally weekly, and provide feedback to teachers to assist with the modification of instruction. Figure 2.4 describes the three major forms of assessment referenced in this chapter and the primary purpose of each.
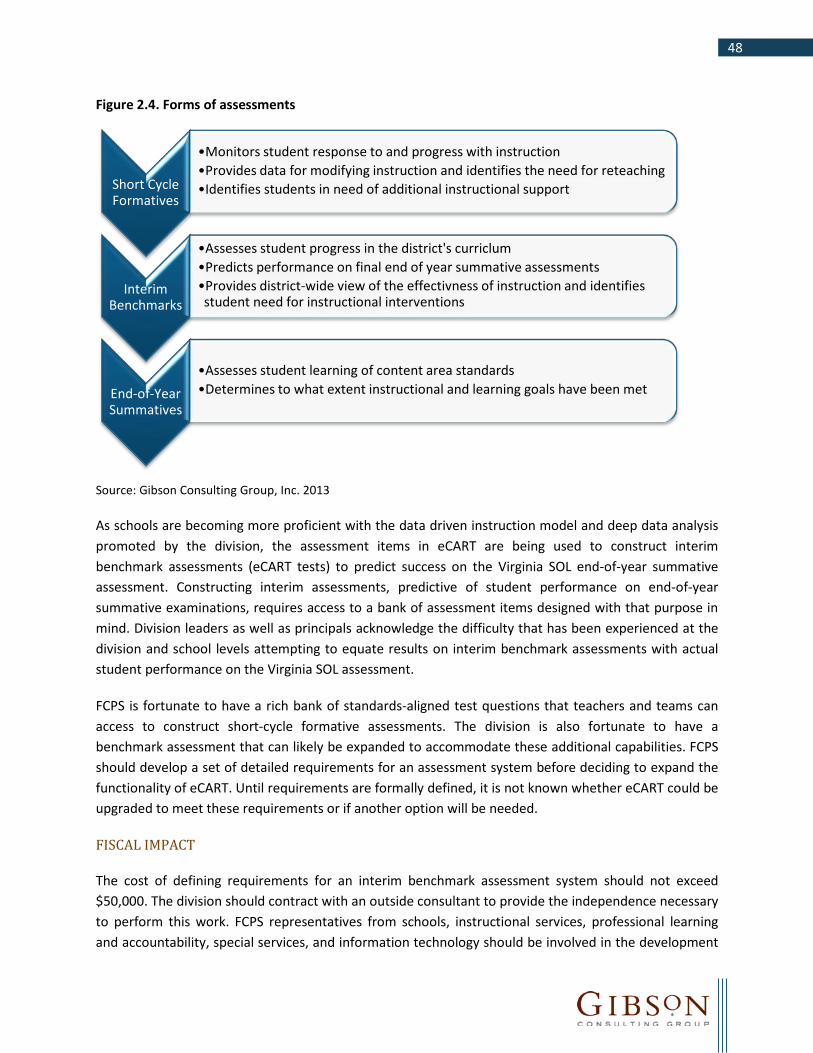
48
Figure 2.4. Forms of assessments
Source: Gibson Consulting Group, Inc. 2013
As schools are becoming more proficient with the data driven instruction model and deep data analysis promoted by the division, the assessment items in eCART are being used to construct interim benchmark assessments (eCART tests) to predict success on the Virginia SOL end-of-year summative assessment. Constructing interim assessments, predictive of student performance on end-of-year summative examinations, requires access to a bank of assessment items designed with that purpose in mind. Division leaders as well as principals acknowledge the difficulty that has been experienced at the division and school levels attempting to equate results on interim benchmark assessments with actual student performance on the Virginia SOL assessment.
FCPS is fortunate to have a rich bank of standards-aligned test questions that teachers and teams can access to construct short-cycle formative assessments. The division is also fortunate to have a benchmark assessment that can likely be expanded to accommodate these additional capabilities. FCPS should develop a set of detailed requirements for an assessment system before deciding to expand the functionality of eCART. Until requirements are formally defined, it is not known whether eCART could be upgraded to meet these requirements or if another option will be needed.
FISCAL IMPACT
The cost of defining requirements for an interim benchmark assessment system should not exceed $50,000. The division should contract with an outside consultant to provide the independence necessary to perform this work. FCPS representatives from schools, instructional services, professional learning and accountability, special services, and information technology should be involved in the development
Short Cycle Formatives
•Monitors student response to and progress with instruction •Provides data for modifying instruction and identifies the need for reteaching •Identifies students in need of additional instructional support
Interim Benchmarks
•Assesses student progress in the district's curriclum •Predicts performance on final end of year summative assessments •Provides district-wide view of the effectivness of instruction and identifies student need for instructional interventions
End-of-Year Summatives
•Assesses student learning of content area standards •Determines to what extent instructional and learning goals have been met
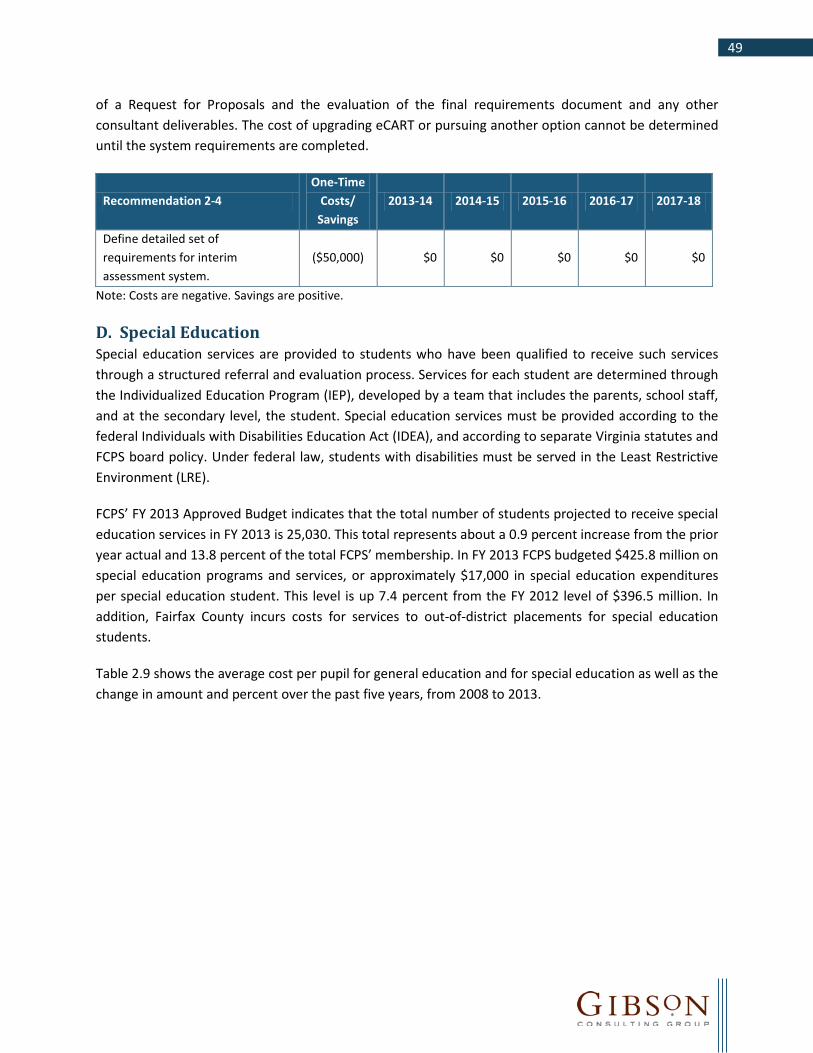
49
of a Request for Proposals and the evaluation of the final requirements document and any other consultant deliverables. The cost of upgrading eCART or pursuing another option cannot be determined until the system requirements are completed.
Recommendation 2-4 One-Time
Costs/ Savings
2013-14 2014-15 2015-16 2016-17 2017-18
Define detailed set of requirements for interim assessment system.
($50,000) $0 $0 $0 $0 $0
Note: Costs are negative. Savings are positive.
D. Special Education Special education services are provided to students who have been qualified to receive such services through a structured referral and evaluation process. Services for each student are determined through the Individualized Education Program (IEP), developed by a team that includes the parents, school staff, and at the secondary level, the student. Special education services must be provided according to the federal Individuals with Disabilities Education Act (IDEA), and according to separate Virginia statutes and FCPS board policy. Under federal law, students with disabilities must be served in the Least Restrictive Environment (LRE).
FCPS’ FY 2013 Approved Budget indicates that the total number of students projected to receive special education services in FY 2013 is 25,030. This total represents about a 0.9 percent increase from the prior year actual and 13.8 percent of the total FCPS’ membership. In FY 2013 FCPS budgeted $425.8 million on special education programs and services, or approximately $17,000 in special education expenditures per special education student. This level is up 7.4 percent from the FY 2012 level of $396.5 million. In addition, Fairfax County incurs costs for services to out-of-district placements for special education students.
Table 2.9 shows the average cost per pupil for general education and for special education as well as the change in amount and percent over the past five years, from 2008 to 2013.
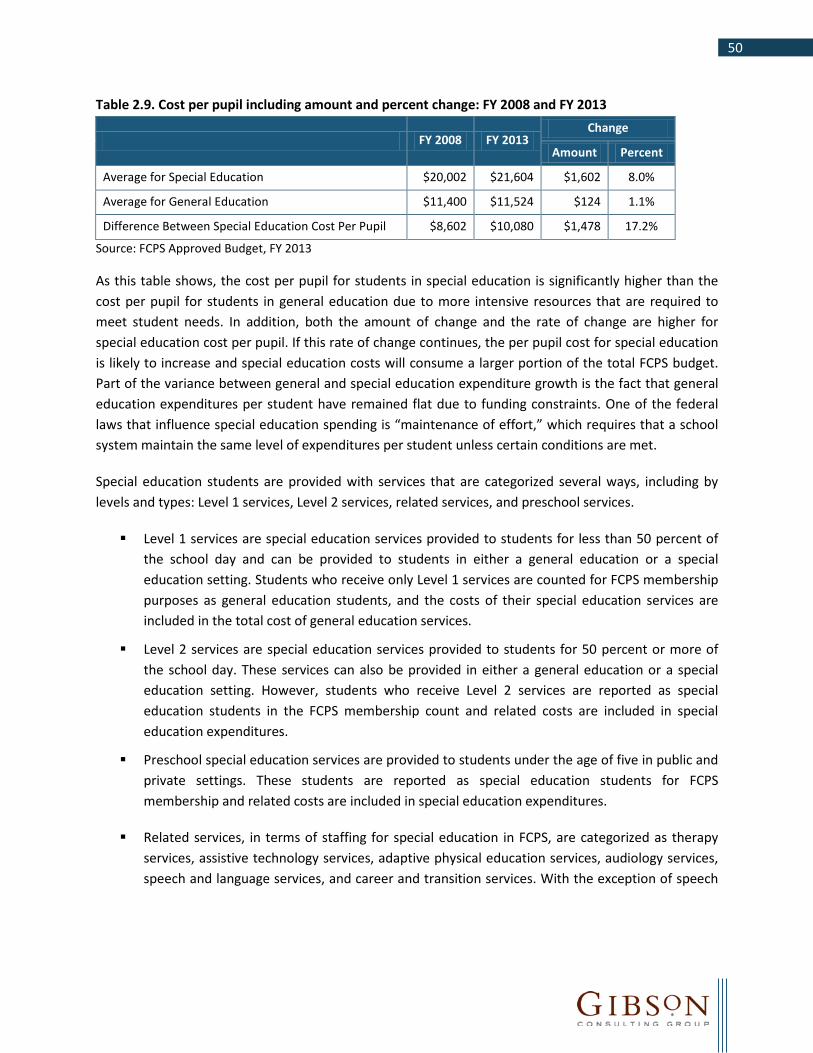
50
Table 2.9. Cost per pupil including amount and percent change: FY 2008 and FY 2013
FY 2008 FY 2013 Change
Amount Percent
Average for Special Education $20,002 $21,604 $1,602 8.0%
Average for General Education $11,400 $11,524 $124 1.1%
Difference Between Special Education Cost Per Pupil $8,602 $10,080 $1,478 17.2%
Source: FCPS Approved Budget, FY 2013
As this table shows, the cost per pupil for students in special education is significantly higher than the cost per pupil for students in general education due to more intensive resources that are required to meet student needs. In addition, both the amount of change and the rate of change are higher for special education cost per pupil. If this rate of change continues, the per pupil cost for special education is likely to increase and special education costs will consume a larger portion of the total FCPS budget. Part of the variance between general and special education expenditure growth is the fact that general education expenditures per student have remained flat due to funding constraints. One of the federal laws that influence special education spending is “maintenance of effort,” which requires that a school system maintain the same level of expenditures per student unless certain conditions are met.
Special education students are provided with services that are categorized several ways, including by levels and types: Level 1 services, Level 2 services, related services, and preschool services.
Level 1 services are special education services provided to students for less than 50 percent of the school day and can be provided to students in either a general education or a special education setting. Students who receive only Level 1 services are counted for FCPS membership purposes as general education students, and the costs of their special education services are included in the total cost of general education services.
Level 2 services are special education services provided to students for 50 percent or more of the school day. These services can also be provided in either a general education or a special education setting. However, students who receive Level 2 services are reported as special education students in the FCPS membership count and related costs are included in special education expenditures.
Preschool special education services are provided to students under the age of five in public and private settings. These students are reported as special education students for FCPS membership and related costs are included in special education expenditures.
Related services, in terms of staffing for special education in FCPS, are categorized as therapy services, assistive technology services, adaptive physical education services, audiology services, speech and language services, and career and transition services. With the exception of speech

51
and language services, which is also provided as a stand-alone service, related services are provided to students already receiving Level 1, Level 2, or preschool special education services1.
Virginia mandates that special education programming be staffed according to ratios for each category of service provided at a school.
The number of students (the projected unduplicated membership count) receiving Level 1 services in FY 2013 is 9,822 or 5.4 percent of the total membership, and the number of students receiving Level 2 services is 15,208 or 8.4 percent of the total division membership.
Over the last five years, the total special education student membership has increased slightly. However, as Table 2.10 shows, the distribution of students by disability category has changed significantly. These changes in disability category impact types and levels of service provided to students, which in turn impact staffing ratios and overall costs. This information, based on the December 1, 2012 special education counts, shows an increase in the percent of students in the autism and developmental delay categories and a decrease in the emotional disability and learning disability categories. The most recent state report by the Virginia Department of Education (2010 December count used for FY 2011) shows a statewide Autism percentage of 7.2 percent, compared to FCPS FY 2011 level of 9.7 percent. FCPS also had a higher incidence of Developmental Delay students (9.8 percent) than the state average (6.4 percent).
1 FCPS Approved Budget FY 2013
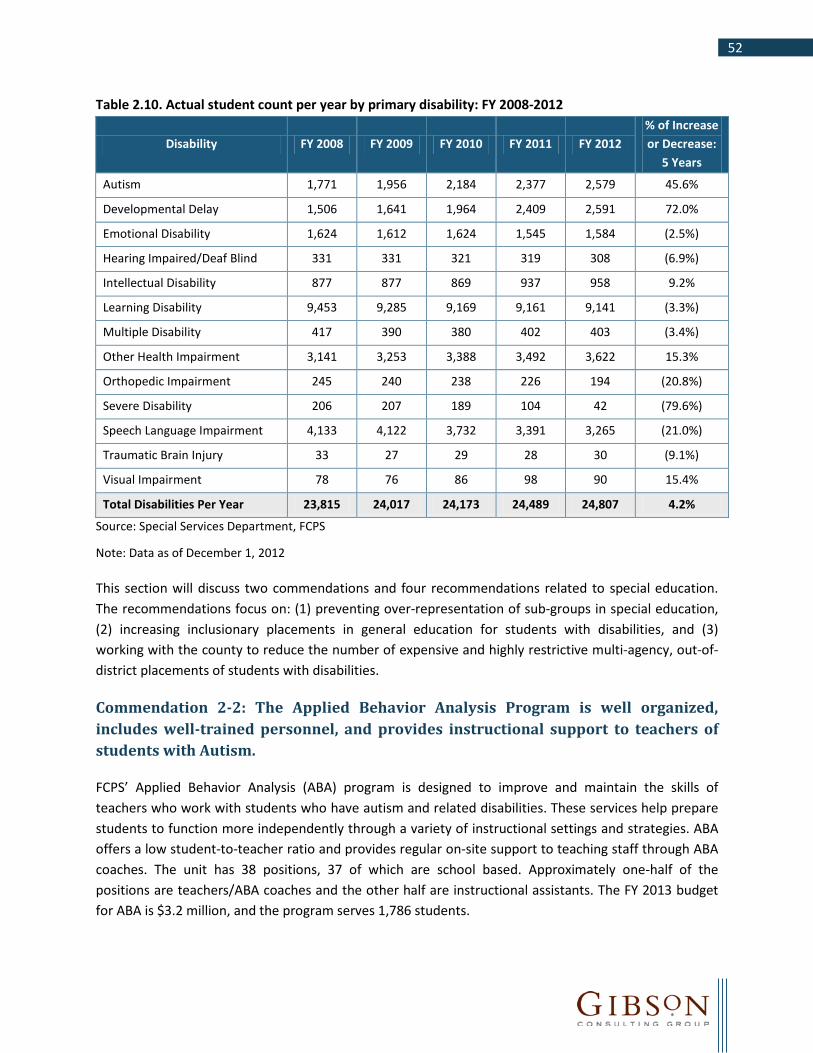
52
Table 2.10. Actual student count per year by primary disability: FY 2008-2012
Disability FY 2008 FY 2009 FY 2010 FY 2011 FY 2012 % of Increase or Decrease:
5 Years
Autism 1,771 1,956 2,184 2,377 2,579 45.6%
Developmental Delay 1,506 1,641 1,964 2,409 2,591 72.0%
Emotional Disability 1,624 1,612 1,624 1,545 1,584 (2.5%)
Hearing Impaired/Deaf Blind 331 331 321 319 308 (6.9%)
Intellectual Disability 877 877 869 937 958 9.2%
Learning Disability 9,453 9,285 9,169 9,161 9,141 (3.3%)
Multiple Disability 417 390 380 402 403 (3.4%)
Other Health Impairment 3,141 3,253 3,388 3,492 3,622 15.3%
Orthopedic Impairment 245 240 238 226 194 (20.8%)
Severe Disability 206 207 189 104 42 (79.6%)
Speech Language Impairment 4,133 4,122 3,732 3,391 3,265 (21.0%)
Traumatic Brain Injury 33 27 29 28 30 (9.1%)
Visual Impairment 78 76 86 98 90 15.4%
Total Disabilities Per Year 23,815 24,017 24,173 24,489 24,807 4.2%
Source: Special Services Department, FCPS
Note: Data as of December 1, 2012
This section will discuss two commendations and four recommendations related to special education. The recommendations focus on: (1) preventing over-representation of sub-groups in special education, (2) increasing inclusionary placements in general education for students with disabilities, and (3) working with the county to reduce the number of expensive and highly restrictive multi-agency, out-of-district placements of students with disabilities.
Commendation 2-2: The Applied Behavior Analysis Program is well organized, includes well-trained personnel, and provides instructional support to teachers of students with Autism.
FCPS’ Applied Behavior Analysis (ABA) program is designed to improve and maintain the skills of teachers who work with students who have autism and related disabilities. These services help prepare students to function more independently through a variety of instructional settings and strategies. ABA offers a low student-to-teacher ratio and provides regular on-site support to teaching staff through ABA coaches. The unit has 38 positions, 37 of which are school based. Approximately one-half of the positions are teachers/ABA coaches and the other half are instructional assistants. The FY 2013 budget for ABA is $3.2 million, and the program serves 1,786 students.

53
Because the ABA program focuses on teachers, not just on individual students, it works to build the capacity of those teachers to effectively teach their own students in the classroom environment. The program leadership is strong and the team is collaborative and demonstrates professional, positive attitudes toward their service delivery model.
Commendation 2-3: The special services program provides frequent and comprehensive communication and opportunities for training to parents, families, and the community.
Through several different initiatives, information is shared often and in many different formats. Learning opportunities addressing a wide-range of topics are provided with flexible schedules in order to make participation convenient for FCPS residents and stakeholders. A special education advisory committee is in place and the special services personnel provide avenues for communication to all county residents.
Recommendation 2-5: Accelerate the implementation of the division’s Response to Intervention model.
Response to Intervention (RtI) is the practice of providing high-quality instruction and interventions matched to student need, and monitoring progress frequently to make decisions about changes in instruction or goals. By addressing academic problems earlier, RtI may be able to help avoid the need to refer a student to special education. RtI was first introduced by the 2004 re-authorization of IDEA. It is important to note that while RtI influences special education referrals, it is not a special education program.
Nine years after the introduction of RtI, FCPS has fully implemented its standardized approach in 57 schools, less than 30 percent of all FCPS schools. Other schools have implemented RtI concepts on their own through professional learning communities or other initiatives. The lack of a single, consistent approach may be contributing to an emerging issue of over-representation of economically disadvantaged and minority students in special education.
The FY 2013 Approved Budget for FCPS explained that one of the major challenges for the division is the continuing change in the composition of the student population. Students in the division are from more than 200 countries and speak over 100 different languages. One in four students in FCPS is economically disadvantaged, as identified by eligibility for free or reduced price meals. From FY 2008 to FY 2013, students classified as ESOL increased 44.7 percent and the percentage of students in the economically disadvantaged category increased 38.6 percent.
Table 2.11 shows that as of October 2012, there were 9,047 students in the special education program categorized as economically disadvantaged. This represents approximately 36 percent of the special education population of 25,285. Of the students not in special education (153,968), approximately 25 percent, or 38,827, were economically disadvantaged. The gap between the percent of economically disadvantaged students in the special education and general education population is 10.5 percent. This is a significant gap and one that could increase if the division’s demographics continue the current trend.
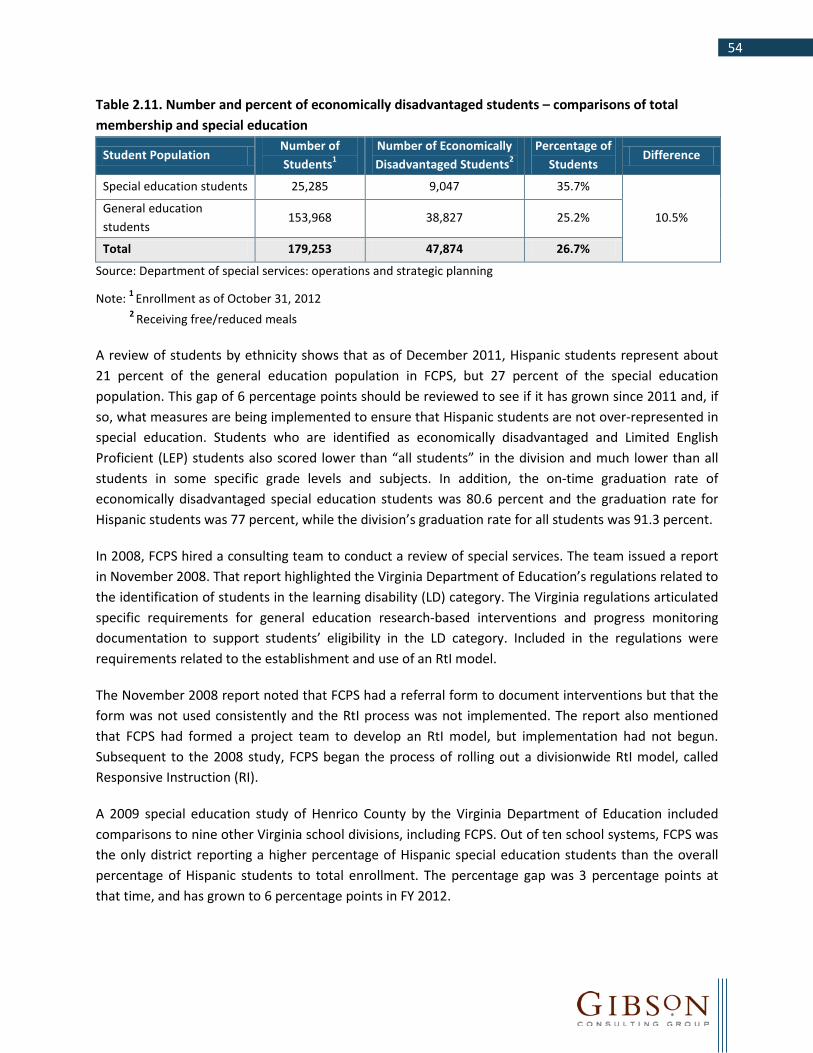
54
Table 2.11. Number and percent of economically disadvantaged students – comparisons of total membership and special education
Student Population Number of Students1
Number of Economically Disadvantaged Students2
Percentage of Students
Difference
Special education students 25,285 9,047 35.7%
10.5% General education students
153,968 38,827 25.2%
Total 179,253 47,874 26.7%
Source: Department of special services: operations and strategic planning
Note: 1 Enrollment as of October 31, 2012 2 Receiving free/reduced meals
A review of students by ethnicity shows that as of December 2011, Hispanic students represent about 21 percent of the general education population in FCPS, but 27 percent of the special education population. This gap of 6 percentage points should be reviewed to see if it has grown since 2011 and, if so, what measures are being implemented to ensure that Hispanic students are not over-represented in special education. Students who are identified as economically disadvantaged and Limited English Proficient (LEP) students also scored lower than “all students” in the division and much lower than all students in some specific grade levels and subjects. In addition, the on-time graduation rate of economically disadvantaged special education students was 80.6 percent and the graduation rate for Hispanic students was 77 percent, while the division’s graduation rate for all students was 91.3 percent.
In 2008, FCPS hired a consulting team to conduct a review of special services. The team issued a report in November 2008. That report highlighted the Virginia Department of Education’s regulations related to the identification of students in the learning disability (LD) category. The Virginia regulations articulated specific requirements for general education research-based interventions and progress monitoring documentation to support students’ eligibility in the LD category. Included in the regulations were requirements related to the establishment and use of an RtI model.
The November 2008 report noted that FCPS had a referral form to document interventions but that the form was not used consistently and the RtI process was not implemented. The report also mentioned that FCPS had formed a project team to develop an RtI model, but implementation had not begun. Subsequent to the 2008 study, FCPS began the process of rolling out a divisionwide RtI model, called Responsive Instruction (RI).
A 2009 special education study of Henrico County by the Virginia Department of Education included comparisons to nine other Virginia school divisions, including FCPS. Out of ten school systems, FCPS was the only district reporting a higher percentage of Hispanic special education students than the overall percentage of Hispanic students to total enrollment. The percentage gap was 3 percentage points at that time, and has grown to 6 percentage points in FY 2012.

55
During this review, FCPS staff reported that approximately 57 schools have been trained in the division’s standardized RtI model. Lack of sufficient resources to implement at a faster pace was cited as a primary factor for the slow implementation of RtI. The lack of an FCPS decision-making framework, addressed separately in a recommendation in Chapter 1 – Governance and Administration, also has appeared to contribute to the delay of RtI implementation.
The result has been the lack of a standardized approach in most FCPS schools, prompting some schools to develop individualized approaches that may or may not be effective. Because the division has not fully implemented its comprehensive RtI model divisionwide, and because of changing student demographics, the representation gaps may continue to grow.
FCPS needs to accelerate the implementation of RtI throughout the division. In doing so, several strategies can be considered. For example, when selecting and implementing whole group classroom instruction for economically disadvantaged students and for English Language Learners, the curriculum and instruction leadership should focus on professional development, curricula selection (both core curricula and supplementary curricula), and high-quality in-class instruction designed to ensure success for all students. In addition, each school and cluster should closely monitor the progress of economically disadvantaged students and English Language Learners, as well as Hispanic students. Monthly progress monitoring should be implemented. Assessments for special education students should be included in the requirements study discussed in Recommendation 2-4.
In order to address the needs of specific sub-populations and prevent potentially unnecessary referrals to special education, existing resources should be re-allocated to support:
Proven, effective Tier 1 and Tier 2 interventions for economically disadvantaged students.
Proven, effective Tier 1 and 2 interventions and for English Language Learners, especially Hispanic students.
The effective use of the 15 percent special education funding designated for Early Intervening Services for specific sub-populations of students at high risk for special education identification.
Before RtI implementation is expanded to other schools, the division should identify all assessments, progress monitoring tools, and supplemental interventions already being used by schools to determine if any of these should be included in the model.
Implementing this recommendation will have many of the benefits realized by other school systems that have fully implemented RtI, including reduction of representation gaps, more students being served in general education, increased exposure to more rigorous academic programs for all students, and improved student achievement.
FISCAL IMPACT
In the past, FCPS has not dedicated full-time positions to the implementation of RtI. This has resulted in implementation at 57 schools or an average of 14 per year since implementation began. To achieve full

56
implementation over the next two years, the division will need to average 70 schools each year, a multiple of five over its current efforts. FCPS has added three positions for FY 2014 that will be exclusively dedicated to RtI, but this level will not be sufficient to achieve implementation.
FCPS should implement this recommendation over the next two years through the assistance of contracted services. A conservative estimate of $1,050,000 in additional contracted expenditures during each of the next two years will be needed to accomplish this. This estimate is based on 10 consultants needed to implement RtI at 70 schools in each of the next two years, or seven schools for each consultant. An average rate of $70 per hour is assumed and 1,500 hours per year (per consultant) of assistance. FCPS staff members dedicated to RtI should be able to provide implementation management and ongoing support after implementation.
Recommendation 2-5 One-Time
Costs/ Savings
2013-14 2014-15 2015-16 2016-17 2017-18
Accelerate implementation of RtI model.
$0 ($1,050,000) ($1,050,000) $0 $0 $0
Note: Costs are negative. Savings are positive.
Recommendation 2-6: Increase the inclusion of students with disabilities into general education environments.
According to the Virginia Department of Education’s Special Education Performance Reports for 2008 to 2012, Fairfax County has not met the state requirements for LRE for any of the last five years. On all three indicators of how much time students spent in less restrictive environments with their non-disabled peers, FCPS failed to meet the state target. The three sub-indicators are:
80 percent or more of time inside regular classroom 40 percent or less of time inside regular classroom Served in separate public or private school, residential, home-based, or hospital facility.
Table 2.12 shows the division’s performance on LRE Indicator 5 as reported in the 2012 report. FCPS levels not only fall short of state targets, they also fall short of the state average for more inclusionary settings (80 percent or more of time inside regular classroom).

57
Table 2.12. FCPS performance on indicator 5 of the Special Education Performance Report
Performance on Indicator 5 2010-11 Division
Performance 2010-11 State
Target State Target
Met? 2010-11 State Performance
5a. 80 percent or more time inside regular classroom
49% 68% No 55%
5b. 40 percent or less time inside regular classroom
14% 8% No 19%
5c. Served in separate public or private school, residential, home-based, or hospital facility
2% <1% No 4%
Source: Special Education Performance Report, June 1, 2012
Patterns of placement in restrictive environments not only risks LRE non-compliance, they do not allow students to access the general education curriculum taught by general teachers. The lack of exposure to grade level content taught by teachers who are experts in the content in a classroom and in a setting with non-disabled peers could have an adverse impact on students’ academic progress.
Indicator 3 of the Special Education Performance Report addresses participation and proficiency rates for students with disabilities in Reading and Mathematics. For 2010-11 (the year for which the 2012 data were collected), the state target was a proficiency rate in English/Reading of 86 percent and a proficiency rate of 85 percent in Mathematics. While the students with disabilities have done well in reading over the past five years, they have met the state target in Mathematics performance only once during that time period.
A review of the Virginia Department of Education 2012-13 Summary of Accountability Results indicates that students with disabilities in Fairfax County schools have higher passing rates than their statewide counterparts. However, as a sub-group, students with disabilities still perform lower than most of their non-disabled peers both overall and at most grade levels. Students with disabilities score consistently lower in Mathematics. Table 2.13 shows the passing rates and the gaps between “all students” and students with disabilities. There are specific grade levels and subjects where the gap between students with disabilities and all students is even wider than the composite data indicate. For example, the division’s passing percentages for Grade 3 Mathematics are 78 percent for all students and 50 percent for students with disabilities.
Table 2.13. Percentage of students passing in English, Reading, and Mathematics: division and State FY 2012
Passing Rate in English Reading Passing Rate in Mathematics
All Students Division 94% 78%
State 89% 68%
Students with Disabilities Division 84% 50%
State 66% 40%
Source: Virginia Department of Education 2012-2013 Summary of Accountability Results
58
There are likely several factors that account for the lower math scores, including the fact that the state’s test was more rigorous and was designed to measure higher order thinking skills. The shift to a more challenging assessment requires adjustments and over time, and FCPS is working to ensure that the Mathematics instructional program meets the objectives being assessed. While the division has focused on Reading/ELA and has a common approach that seems to be consistently adopted and implemented through the division (supported with common materials, instructional strategies, and professional development), it seems that Mathematics instruction will need a renewed focus due to changes in not only the rigor of the assessment, but also demands in Science, Technology, Engineering, and Math (STEM) education.
There are many schools in FCPS that are using a “team teaching” or “co-teaching” model and many principals are enthusiastic and proactive about implementing this instructional arrangement. However, the high proportion of students not served in the least restrictive environment could be one of the reasons that the test scores of students with disabilities are lower than their peers, especially in Mathematics. The review team could not find evidence of a divisionwide plan articulated and supported by central special services leadership that is currently being implemented to increase inclusive instructional arrangements and decrease restrictive instructional arrangements. Some schools have implemented team teaching and other inclusive arrangements, but have done so on their own initiative.
For students with disabilities, making adopted programs in Mathematics a priority will also be important. Both the high incidence and low incidence programs have well-organized and clear documents explaining Language Arts resources and materials they are using. In school systems implementing an RtI model, these would be considered Tier 3 interventions. For the low incidence program, reading materials include Edmark, Early Literacy Skills Builder, Pathways to Literacy, PCI Reading, and others. In the high incidence program, Language, Leveled Literacy Intervention System (LLI), and Read Naturally are included as specialized reading programs. While the specialized Reading materials are very comprehensive and provide a range of interventions, the Mathematics programs are lacking the same range of opportunities for students who require specialized instruction. For high incidence students, there are not divisionwide, adopted curricula for students in special education. For the low incidence program, there are some supplemental materials, but not a comprehensive divisionwide curriculum or program. Broadening the range of math curricula and supplemental materials in special education should not be undertaken separately from general education Mathematics planning, but should be closely linked to it.
To increase the placement of students in less restrictive environments, FCPS should implement specific program models through its annual planning process that foster:
Co-teaching (team teaching) Inclusive behavior services and supports for students in the Emotional Disturbance disability
category Additional Tier 3 curricula and services for students receiving Mathematics instruction in special
education

59
FISCAL IMPACT
This recommendation should involve reassignments of current staff, but not the addition of new staff. Instructional staff currently providing services in more restrictive placements with low pupil-staff ratios can be reassigned to support general instruction through a co-teaching or other less restrictive arrangement. Additional inclusion training (train-the-trainer model) will be needed in FY 2014, with subsequent training in FY 2015 and FY 2016 by FCPS staff trainers. It is estimated that the one-time training cost will be no more than $50,000, which is commensurate with prior FCPS inclusion training efforts.
Recommendation 2-6 One-Time
Costs/ Savings
2013-14 2014-15 2015-16 2016-17 2017-18
Increase inclusion of students with disabilities into general education environments.
($50,000) $0 $0 $0 $0 $0
Note: Costs are negative. Savings are positive.
Recommendation 2-7: Collaborate with county administration to reduce the number of students served out-of-district in multi-agency services.
The December 1, 2012 Child Count for FCPS indicates that 297 students In Fairfax County were being served in multi-agency services (MAS). These out-of-district services are provided for special education students with severe disabilities and include day and residential programs. The costs of the MAS are paid by the county after invoices are reviewed by the division. The MAS staff members oversee the MAS programming, ensuring compliance with regulations and policies. From 2008 to 2012, the total outside placement cost has risen from $15.6 million to $21.8 million. Based on the December 1 count for 2012, the average annual cost per student for a MAS placement is $73,351.
For the past five years, the number of students in their multi-agency placements has remained about the same, ranging from 289 to 302. In some cases, parents have placed their children in out-of-district settings and then the division continues the placement, but most of the placements originate from within the division. FCPS has implemented guidelines and has done very well at preventing the number of out-of-district placements from increasing, but the total cost of the placements continues to increase. While all instructional programs are decided by students’ IEP teams, it is important that exclusive arrangements not be used unless absolutely necessary. While a continuum of services for students with disabilities is required, IDEA places a high value on educating students with disabilities with their non-disabled peers whenever possible.
There are two categories of special education that account for about two-thirds of the MAS placements: Autism and Emotional Disturbance, with 97 and 82 out-of-district placements, respectively. An indicator that the division’s efforts at providing intensive, appropriate, and supportive programming for students are paying off is the low percentage of elementary students placed out of the division (38 of 273 or
60
about 14 percent) versus the higher number of placements for older students (235 or 86 percent of the total). Additionally, in an effort to keep students within FCPS, in 1993 the school system opened four highly specialized behavior transition classes. Currently FCPS has expanded the model to include 17 classes to address needs around significant behavior challenges for students with intellectual disabilities and Autism.
The county’s expenditures for these placements are high. While there are no easy solutions to this expensive practice, some possible initiatives include:
Work collaboratively with the county to provide support services to families, including mental health services, in-home training, and respite services for parents and families who agree to in-district placement in lieu of MAS.
Coordinate school visits, parent-staff communication, and establishment of parent-to-parent relationships so that parents understand the in-district options available to them.
Consider additional professional development for special education leaders in each school, so that they are well educated on the options provided within FCPS.
FISCAL IMPACT
FCPS does not pay for the out-of-district placements and cannot control the actions of the county management. Division and special services leadership should collaborate closely with the county and re-direct up to three special services staff resources toward preventative services to reduce the referrals to more restrictive placements over time. There should be no direct fiscal impact for the division.
E. Other Special Programs FCPS provides other programs to students with special needs. Two of the more significant programs are the Advanced Academic Program (AAP) and the ESOL program. FCPS is currently conducting a separate study of the AAP program.
Commendation 2-4: FCPS is implementing programs and procedures to improve minority and historically under-served representation in the gifted services (Advanced Academic) program.
The student composition of the FCPS’ AAP differs from that of the overall student population in terms of ethnicity. Forty-three percent of all FCPS’ students are White, yet 51 percent of students in the gifted services program are White. Table 2.14 presents the ethnicity distribution of all students at the FCPS and Advanced Academic Program students at FCPS.

61
Table 2.14. FCPS ethnicity distribution divisionwide and advanced academic program, 2011-12
Ethnicity All Students
Advanced Academic Program Students
Number Percent
(of all students) Number
Percent (of all AAP)
White 76,508 43.1% 39,340 51.1%
Black 18,454 10.4% 5,607 7.3%
Hispanic 39,164 22.0% 9,470 12.3%
American Indian/Alaska Native 360 0.2% 131 0.2%
Asian or Pacific Islander 34,478 19.4% 18,517 24.0%
Multi-racial 8,213 4.6% 3,850 5.0%
Native Hawaiian 256 0.1% 91 0.1%
Not Determined 2 0.0% - 0.0%
Total 177,435 77,006 Source: FCPS annual report to the Virginia Department of Education 2011-12 Gifted Services.
FCPS has incorporated several strategies to address the under-representation of minority students in AAP. The most significant activities are listed below:
Revised the current battery of assessments for gifted services identification process to include a reasoning/non-verbal assessment.
Developed and introduced the Young Scholars Program that targets K-2 students from diverse cultural, ethnic, and linguistic backgrounds who are not likely to be considered for gifted programs using traditional methods of identification, and who are less likely to pursue advanced levels of learning without intervention. The focus is on early identification and intervention in grades K-2; however, students continue to be identified through grade 8. As a result of the program, Black and Hispanic students enrolled in the Young Scholars Program in K-8 increased by 21 percent from 2009 to 2012. The Young Scholars Program was recognized in the National Association for Gifted Children’s 2012 publication: Unlocking Emergent Talent: Supporting High Achievement of Low-Income, High Ability Students as a successful program that supports low-income, high-ability learners.
Redesigned the division’s approach to providing gifted education services. The division allocated 69.5 advanced academic resource teachers to serve 139 elementary schools. This supported the transition from a school-based pull-out model for a small group of identified students, to a collaborative model in which the gifted and talented resource teacher works with classroom teachers to provide a continuum of gifted services in kindergarten through Grade 6.
Implemented a program titled “Twice-exceptional Learners” to recognize the unique needs of special education students who also have the ability to think, reason, and problem-solve at very high levels. Instructional services has collaborated with office of special education instruction to present numerous parent and teacher workshops on twice exceptional students. The division has developed and funds an online graduate level course called Underserved Populations of

62
Gifted to help teachers understand the importance of serving these learners (see http://www.fcps.edu/is/aap/column/columntwicelearners.shtml).
Commendation 2-5: The FCPS ESOL program has received national-level recognition.
FCPS has implemented a model of instruction that ensures students receiving ESOL services have access to the required curriculum and content while learning English. The overall approach is to teach English through the content areas scaffolded appropriately based on the student’s English proficiency. This strategy ensures that students continue to gain knowledge and skills in the core content areas while acquiring English proficiency.
FCPS is committed to serving all English Language Learners as evidenced by their successful request and associated approval and funding from the Virginia Department of Education to extend services for students who arrive in the United States at age 12 or above until age 22. These students are provided access to a free public education just the same as special education students.
The FCPS approach to serving their ESOL students will be featured as a best practice model in a late 2013 publication of the United States Department of Education (USDOE). The USDOE recently completed a process to identify best practice ESOL models/programs. The USDOE asked state Departments of Education to nominate two programs each for consideration and review. After a rigorous review process, the FCPS approach was one of the 20 programs selected as a best practice model.

63
Chapter 3 – Facilities Use and Management Introduction
School facilities should be designed and maintained to support student learning and to provide an effective learning environment that is educationally adequate to deliver the curriculum. Having suitable facilities requires good planning, which is made possible by accurate measurement of school capacities and enrollment projections. There must be good communication between facilities planning, design and construction, and facilities management. Finally, processes to enable feedback from the operations and maintenance of facilities to planning and design are important to enhance the quality of new and renovated schools.
Once facilities are built, preventive maintenance (i.e., an ongoing plan for addressing annual maintenance and operations) and a long-term capital improvement program are critical. One of the most important aspects of maintaining facilities in the long-term is preventive maintenance. Through preventive and ongoing maintenance, life cycle costs are reduced and the serviceable life of facilities is extended. Beyond maintenance, an aggressive energy management program is critical to reducing operating expense and providing a sustainable building environment. In addition, adequate custodial operations are necessary not only to provide clean buildings, but healthy learning environments as well.
The Fairfax County Public Schools’ (FCPS and the division) facilities management services unit is responsible for operating and maintaining 196 schools and over 27 million square feet of space, plus other administrative and support buildings. The Strategic Governance Manual defines operational expectations of the superintendent with respect to facilities management (to be fulfilled by facilities management services):
Ensure facilities are clean and safe.
Develop and annually report on a master plan required to implement an effective preventive maintenance program.
Provide for public use of facilities at a reasonable net cost to the school system, as long as student safety, student functions, and the instructional program are not compromised and that guidelines are administered consistently.
Establish and regularly update a Facilities Comprehensive Plan.
Establish an objectively prioritized Capital Improvement Program for major maintenance, renovation, and new construction.

64
This chapter presents recommendations for facilities use and management for FCPS and includes the following major sections:
A. Organization and Management B. Plans, Policies, and Procedures C. Maintenance Operations D. Custodial Operations E. Energy Management
Facilities Engineering Associates (FEA), a subcontractor to Gibson Consulting Group, Inc. on this review, conducted a comprehensive evaluation of the FCPS office of facilities management (OFM) in 2012, just prior to the initiation of this project. The OFM is the largest section of the facilities and transportation services division. The results of the previous evaluation were presented in a report dated July 6, 2012 (FEA, 2012)2. The 2012 report addressed in detail the overall organization and management, policies and procedures, and maintenance operations of OFM. Key findings from the 2012 report include the following:
A review of the operations’ benchmarks resulted in low levels of maintenance funding, and lower than average utility expenditures compared to peer organizations. Capital renewal (systemic replacements) was also historically, and currently, significantly underfunded. Recommended capital renewal funding levels should be in the range of 1 to 2 percent of the current replacement value (CRV) of facilities. FCPS is currently funding at about 0.2 percent of CRV compared to peer group organizations averaging 0.68 percent of CRV on an annual basis.
During the period from 1989 to 2012, the total gross building area of FCPS schools grew from 19.2 million square feet to 27.2 million square feet, an increase of more than 42 percent. In the same time period, OFM staffing levels have decreased from 565 (including the 73 positions OFM gained when acquiring the plant operations, energy management, and operating engineers groups) to 462, about an 18 percent decrease. Thus, OFM staff are operating and maintaining 79 percent more area per staff full-time equivalents (FTE) since 1989. This largely accounts for the inability of OFM maintenance staff to get beyond reactive maintenance to truly desired planned maintenance. The FCPS Board Operational Expectations Monitoring Report from July 2012 in Measurement 1.3 compared the percentage of facility-related preventive maintenance work hours performed to the percentage of reactive repair work hours performed. The optimal target is 80 percent preventive and 20 percent reactive. Based on information obtained during that study, OFM is 10.9 percent preventive and 89.1 percent reactive.
Since the maintenance function was addressed in the prior year study, the scope of this project excluded maintenance staffing. This review focused on the remaining elements of the Virginia Department of
2 Facility Engineering Associates (FEA). Final Report for Performance Management Assessment. Fairfax County Public Schools Office of Facilities Management. MMB-219-12. July 6, 2012.

65
Planning and Budget’s School Efficiency Review program protocols, including facilities design and construction, facilities planning, custodial operations, and energy management.
In general, FCPS’ OFM has does an excellent job of planning, managing and operating its school buildings. The OFM is well organized and has developed processes that are strategically aligned to help FCPS achieve the overall business initiatives of the school system by providing a safe and comfortable environment that supports teaching and learning. There is a high degree of technical and managerial competence and high levels of trust within the organization and by OFM customers. OFM operates well above the average public school system in terms of strategic planning, operations and maintenance effectiveness and efficiency, use of supporting information technologies, and performance measurement.
There are opportunities for improvement however. Custodial staffing formulas are based on outdated standards, and the decentralized management approach to custodial services is hindering the widespread use of best practices that would increase efficiency and effectiveness. Additional opportunities for energy savings exist, and design standards and training programs need to be updated for new design technologies that are available. These recommendations are summarized in Table 3.1 with more detailed findings and recommended actions following in each of the five sections of this chapter.
Table 3.1. Fiscal impact of recommendations
Recommendations One-Time
Costs/ Savings
2013-14 2014-15 2015-16 2016-17 2017-18 Total Fiscal
Impact
Plans, Policies, and Procedures
3-1. Conduct internal audit of the facilities management.
($50,000) $0 $0 $0 $0 $0 ($50,000)
3-2. Develop long-range plan to upgrade facilities technology and design standards.
$0 $0 $0 $0 $0 $0 $0
Maintenance Operations
3-3. Conduct re-engineering study of facilities purchasing and warehousing functions.
($100,000) $0 $0 $0 $0 $0 ($100,000)

66
Recommendations One-Time
Costs/ Savings
2013-14 2014-15 2015-16 2016-17 2017-18 Total Fiscal
Impact
Custodial Operations
3-4. Implement centralized management approach to custodial services.
$0 ($896,139) ($896,139) ($896,139) ($896,139) ($896,139) ($4,480,695)
3-5. Modify the custodial staffing formula to reflect current staffing standards.
$0 $0 $4,170,384 $8,340,768 $8,340,768 $8,340,768 $29,192,688
Energy Management
3-6. Make additional investments to realize energy savings.
$0 ($923,183) ($364,098) $194,987 $754,072 $1,313,157 $974,935
Net Fiscal Impact ($150,000) ($1,819,322) $2,910,147 $7,639,616 $8,198,701 $8,757,786 $25,536,928
Note: Costs are negative. Savings are positive.
A. Organization and Management The FCPS department of facilities and transportation services (FTS) is organized to support the following facilities management functions and services: facilities planning, design and construction, administrative services, transportation services, facilities management, and safety and security. An organization structure for FTS is shown in Figure 3.1. Transportation services are addressed separately in Chapter 4 – Transportation of this report. Energy management is a component of the OFM.
Figure 3.1. FCPS FTS organization structure
Department of Facilities and Transportation
Services
Office of Design and Construction
Office of Facilities Planning
Office of Administrative Services
Office of Transportation Services
Office of Facilities Management
Office of Safety and Security
Source: FCPS 2013
FTS is led by the chief operating officer, a title which more appropriately reflects the scope of responsibility for this department. Auxiliary operations such as transportation, facilities management functions, and safety and security are commonly organized under a single operating unit.
67
The office of facilities planning (OFP) manages the processes and information necessary to ensure the efficient and effective accommodation of all students and educational programs. The OFP produces a five-year Capital Improvement Program (CIP), school enrollment projections by grade level, and attendance area (school boundary) adjustment studies. The OFP also prepares bond referenda to fund required capital improvements, in conjunction with office of design and construction (ODC). In addition, this office supports the recently created and appointed Facilities Planning Advisory Council (FPAC), which is made up of citizen appointees from each magisterial district and at-large members.
The ODC is responsible for design and construction services for new school facilities; additions to existing schools; renewals (renovations) of existing school facilities; completion of capital improvement work orders; minor facility improvements; and the purchase, installation, and relocation of temporary classroom facilities. The ODC provides project and construction management services and on-site inspection staff to guarantee quality assurance of all projects. This office also provides building evaluation and assessment services to coordinate the planning of construction projects for each successive school bond referendum to best support the educational needs of the students. The ODC provides the necessary liaison between FCPS planning and design, instructional programs, and Fairfax County for all construction and development projects. Finally, this office also evaluates the capacity and effective utilization of each school on a yearly basis.
The office of administrative services (OAS) is responsible for providing administrative and logistical support to the department by overseeing community use of FCPS facilities, supporting technology requirements, providing property management services, and providing departmental financial management and procurement support.
The OFM is responsible for routine preventive and corrective building and grounds maintenance services, facilities infrastructure repair and replacement, and energy conservation in the design and operation of FCPS facilities. The OFM was reorganized in 2005 to include centralized management and planning support and decentralized maintenance and repair shops. The centralized sections include: facilities resource management, infrastructure and environmental engineering, planning and operations, energy management, and plant operations. Maintenance and repair of all mechanical, electrical, and structural equipment and systems is provided by technicians located in four decentralized satellite maintenance facilities. Two additional sections provide grounds maintenance and centralized trades functions.
The office of safety and security (OSS) provides overall guidance, direction, and support to the FCPS safety, health, and security programs. This unit coordinates the activities of county and state agencies providing support on matters of student safety and emergency management, and conducts safety audits. OSS also monitors the division’s compliance with applicable federal environmental and work safety laws.
The costs associated with the operation and maintenance of FCPS facilities for FY 2008 through FY 2012 are shown in Table 3.2. Since FY 2008, facilities management costs have declined more than $3 million

68
(6.4 percent), mostly due to staff cuts. Expenditures per square foot dropped 2.6 percent, from $1.93 to $1.88.
Table 3.2. Summary of FCPS facility operation and maintenance costs, FY 2008 through FY 2012, Operating Fund
Office FY 2008 FY 2009 FY 2010 FY 2011 FY 2012
Assistant Superintendent $269,704 $281,896 $277,454 $257,129 $266,828
Adm. and Operational Services
$5,538,055 $5,513,703 $7,651,195 $6,275,681 $6,406,753
Facilities Management $34,818,854 $36,569,482 $40,147,588 $34,355,220 $33,171,691
Design and Construction $1,006,435 $760,316 $644,444 $777,355 $1,197,837
Energy Management $2,763,479 $2,589,665 $2,490,470 $10,554,054 $12,808
Facilities Planning $714,318 $730,599 $701,581 $668,144 $676,195
Safety and Security $4,439,114 $3,932,041 $3,995,781 $4,356,919 $4,623,730
Grand Total $49,549,958 $50,377,701 $55,908,512 $57,244,502 $46,355,843
Gross Square Feet 25,687,915 26,041,114 26,278,181 26,480,424 26,293,673
Expenditures per Square Foot
$1.93 $1.93 $2.13 $2.16 $1.76
Source: FCPS actual expenditure and FTE history
In FY 2011 there was a one-time energy contract expenditure of $8 million. These costs do not include school custodians and building engineers who are school-based; they are included in the school budgets. Utilities costs are allocated to FTS and the department of information technology.
Table 3.3 presents staffing trends in all facilities management functions over the past five years and budgeted for FY 2013. These counts do not include custodial services, as they are charged to the schools. Overall, staff counts were reduced from 561.4 to 517.4 during this period, a reduction of 7.8 percent. Most of this occurred through imposed cuts in FY 2011 in the OFM, by far the largest of the facilities units in terms of staffing. Energy management staff positions are included in the OFM.

69
Table 3.3. Facilities operation and maintenance staffing trends, FY 2008 through FY 2013
FY 2008 FY 2009 FY 2010 FY 2011 FY 2012 FY 2013
Assistant Superintendent 2.0 2.0 2.0 2.0 2.0 2.0
Adm. and Operational Services 39.2 39.2 39.2 38.2 38.2 38.2
Facilities Management 449.8 449.8 446.8 414.8 415.8 408.8
Design and Construction 12.4 12.4 12.4 11.4 11.4 14.4
Facilities Planning 9.0 9.0 9.0 8.0 8.0 8.0
Safety and Security 49.0 49.0 47.0 45.0 46.0 46.0
Total 561.4 561.4 556.4 519.4 521.4 517.4
Source: FCPS actual expenditure and FTE history
FTS establishes performance targets that are aligned with its operational expectations. Table 3.4 presents selected performance measures from the FY 2012 Board Monitoring report for facilities management services.
Table 3.4. Selected facilities management services performance measures, FY 2012
Performance Measure Target FY 2012
Outcome Target Met?
Average Grade (out of 100 points) for custodial cleanliness >60 76 Yes
Custodial Productivity – measured by gross square feet of space cleaned per custodian
19,000 22,364 Yes
Percentage of preventive maintenance work orders to total work orders
80% 10.9% No
Energy Use – measured by 1,000 British Thermal Units (kBtu) per gross square feet of space
No target 70.70 N/A
Accuracy of 5-Year Enrollment Projections 95% 92.6% No
Sources: FY 2012 Board Monitoring Report for facilities management
The target grade for custodial cleanliness of greater than 60 points is above satisfactory based on the division’s grading structure, but is not a very challenging goal on a 100 point scale. The custodial productivity target of 19,000 square feet per custodian is low based on current industry standards. Facilities management services also has a performance measure for comparing custodial cost per square foot to peers, but the data in the board monitoring report does not present peer data. The report does show a decline in FCPS custodial cost per square foot, from $2.67 in FY 2008 to $2.32 in FY 2011. These management issues are addressed in recommendations later in this chapter (see Recommendations 3-4 and 3-5).
The Board Monitoring Report for facilities management cites that there are no national or state standards or benchmarks for kBtu usage per square feet. However, based on research conducted during this review, there are national standards that suggest additional energy savings opportunities. These are addressed by a separate recommendation later in this chapter (see Recommendation 3-6).

70
B. Plans, Policies, and Procedures The FTS has a comprehensive set of complete and well-developed plans and policies across the various offices. There are also procedures in place to maximize the effectiveness of the plans. As an example, the FPAC provides FCPS with valuable school and community input to enhance strategic facilities plans.
Documentation of policies and procedures is only effective if properly executed and target results are achieved. Based on the review team’s analysis, there are areas for improvement in the execution of policies and procedures that warrant additional analysis by FCPS.
Recommendation 3-1: Conduct internal audit of facilities management functions.
During this review three factors suggested the need for additional analysis in the facilities management area:
Feedback from OFM leaders indicating a lack of coordination within OFM and between OFM and other FCPS stakeholders is contributing to a lack of trust and data integrity issues.
Analysis of historical enrollment projections compared to FCPS goals for projection accuracy.
Data integrity issues that surfaced during this review with respect to gross square feet of space and FTE custodial counts.
Lack of Coordination
The lack of coordination among facilities management offices and other stakeholders has caused redundant work, potential excess space, and additional and unnecessary construction change orders. Directors of both OFP and ODC stated a need for better collaboration among the facilities offices, the school principals, and the instructional development teams. OFP and ODC staff reported concerns with the lack of sufficient instructional program input into the revised educational specifications for the new and rehabilitated schools.
FTS, under new leadership, is currently undergoing some organization changes to improve the coordination among the individual offices and other stakeholders.
Enrollment Projections
The process of preparing student enrollment projections falls under various departments in the division. The facilities planning office has a demographer that works with data trends to develop estimates of total student enrollment, while the instructional services department develops projections for students enrolled in English for Speakers of Other Languages and advanced academics. The budget services office develops projections for special education students and for students attending the division’s alternative programs.
An antiquated process for developing long-range (five-year) enrollment projections has contributed to underestimated enrollment. Short-term annual enrollment projections, on the other hand, have been

71
much more accurate. Table 3.5 presents the enrollment projections contained in the FY 2008 approved budget compared to the actual FY 2012 enrollment data contained in the FY 2013 approved budget. In FY 2008, FCPS projected flat enrollment for five years, underestimating FY 2012 enrollment by more than 13,000 students or 7.5 percent. The FY 2008 enrollment projection for elementary schools in FY 2012 was underestimated by 8.9 percent and high school projections were underestimated by 8.2 percent. Special education enrollment was overestimated by 1.7 percent. The current target in the Board Monitoring Reports is 5 percent for a 5-year projection.
Table 3.5. FCPS enrollment projections compared to actual for FY 2008 through FY 2012
FY 2008 FY 2009 FY 2010 FY 2011 FY 2012
FY 2008 Projected Enrollment
Grades K-6 Grades 7-8 Grades 9-12 Special Education Total
80,492 22,363 48,674 13,314
164,843
80,192 22,299 47,991 13,741
164,223
80,618 22,260 47,198 14,156
164,232
81,071 21,940 46,828 14,595
164,434
81,139 22,064 46,411 15,029
164,643
Actual Enrollment
Grades K-6 Grades 7-8 Grades 9-12 Special Education Total
81,341 22,744 48,723 13,499
166,307
83,115 22,931 49,422 14,071
169,539
84,919 23,416 49,899 14,157
172,391
86,796 23,384 50,153 14,600
174,933
89,049 23,508 50,583 14,778
177,918
% Variance
Grades K-6 Grades 7-8 Grades 9-12 Special Education Total
(1.0%) (1.7%) (0.1%) (1.4%) (0.9%)
(3.5%) (2.8%) (2.9%) (2.3%) (3.1%)
(5.1%) (4.9%) (5.4%)
0.0% (4.7%)
(6.6%) (6.2%) (6.6%)
0.0% (6.0%)
(8.9%) (6.1%) (8.2%)
1.7% (7.5%)
Source: FCPS Approved Budgets, FY 2008 through FY 2013
New enrollment projection software is currently being designed and implemented within the OFP to aid in improving projections. This was reported to be an important step forward in replacing older legacy systems that did not fully address the assumptions and planning process required for accurate student enrollment projections.
Enrollment projections are updated annually and have significant implications for school system planning and budgeting, and particularly those long-term plans related to facilities.
Data Integrity
During this review inconsistent data were received in connection with custodial staff levels related to facility square footage. Data from a spreadsheet provided by OFM suggested a custodial productivity level of less than 20,000 square feet per custodian, while the Board Monitoring Report disclosed a level

72
of just under 23,000 square feet per custodian. Total custodial staff counts varied based on information provided by facilities management and staff information provided for all areas pursuant to a data request for this review. Also, the base staffing standard of 19,000 square feet per custodian referenced in the Board Monitoring Report does not reflect the current standard.
An internal audit should be conducted to further analyze these issues and underlying causes. The scope of work should include:
Review of internal communications protocols for facilities planning and management.
Survey and/or focus groups of FCPS facilities management stakeholders to evaluate customer satisfaction, service quality, communications, and service responsiveness. Stakeholders should include school principals, the department of financial services, the department of instructional services, and representatives from programs for special populations.
Review of enrollment projection processes.
Evaluation of data collection and reporting practices.
Evaluation of performance measures and adequacy of targets / benchmarks.
FISCAL IMPACT
The FCPS internal audit department should conduct this audit in FY 2014, while the comprehensive risk assessment is being conducted. (See related recommendation [Recommendation 1-3] in Chapter 1 – Governance and Administration.) Additional costs will need to be incurred since the expansion of the internal audit function is not expected until FY 2015, after the risk assessment is completed. Based on the nature of issues surfaced during this review, and the review team’s experience conducting these types of audits, FCPS should budget $50,000 to conduct an internal audit of the facilities management function.
Recommendation 3-1 One-Time
Costs/ Savings
2013-14 2014-15 2015-16 2016-17 2017-18
Conduct internal audit of facilities management.
($50,000) $0 $0 $0 $0 $0
Note: Costs are negative. Savings are positive.
Recommendation 3-2: Develop long-range plan to upgrade facilities technology and data standards.
The ODC is organized into four teams overseen by coordinators. The teams include three capital bond design and construction teams and one facilities modification team. There is great depth in design, construction and project management, contract administration, compliance, and inspection expertise among the teams. These teams have done an extraordinary job in maintaining overall school construction and renovation costs below both national and local peer group benchmarks.

73
There are organizational capabilities and efficient processes within the ODC that have contributed to high quality new and renovated school spaces to support the mission of FCPS. However, technologies in the design and construction field are rapidly changing at this point in time and FCPS is not current with all of these technologies or the design standards that apply to them.
These transformational changes in design and construction technologies can aid in reducing the cost of facilities construction and provide valuable facilities information for more effective operations and maintenance. Design technologies such as AutoDesk Revit and Navisworks are replacing traditional AutoCAD design and construction visualization applications. The new technologies are supported by robust industry standards and processes including Building Information Modeling (BIM) and Construction Operations Building Information Exchange (COBie).
One major advantage of Autodesk Revit is the ability to model a building in the design phase of a project (BIM) – specifically for energy modeling. This modeling indicates which systems are most suitable for a building from both an installation and energy savings perspective very early in the design phase.
Several FCPS design consultants are currently using Autodesk Revit for school designs and renovations and are submitting drawings as requested in that format. Others are using the older AutoCAD technologies and standards. FCPS recognizes that AutoCAD will eventually be supplanted by Autodesk Revit and have begun making preparations for the transition with their internal design staff. ODC staff will begin training within the next 18 months and producing drawings within the next two years. However, new design and data standards to accommodate these new design technologies have not been developed.
New standards and related training programs should be developed to transition to the new technologies so that all ODC design consultants can maximize the use of them. Educating ODC staff on new industry standards and processes such as BIM and COBie will also lead to more efficient construction and operations of new and rehabilitated FCPS facilities.
FISCAL IMPACT
The development of standards will require approximately 250 hours of ODC staff time over a period of a year. There will be no out of pocket costs incurred in connection with this recommendation. Implementing these standards, however, will likely generate savings on future construction projects and facility operations.
C. Maintenance Operations The OFM is responsible for routine preventive and corrective building and grounds maintenance services, facilities infrastructure repair and replacement, and energy conservation in the design and operation of FCPS facilities. At the time of the 2012 FEA study, OFM was comprised of 415.8 FTE positions including the director and all front-line trades and crafts personnel. The OFM is responsible for operating and maintaining 196 schools totaling over 27 million square feet of area, plus other administrative and support buildings. An organization structure of OFM is presented in Figure 3.2.

74
Figure 3.2. FCPS OFM organization structure
Department of Facilities and Transportation
Services
Office of Facilities Management
Facilities Resource Management
Infrastructure and Environmental
Engineering
Planning and Operations Energy Management Plant Operations
Edison Satellite Support Center
Herndon Satellite Support Center
Sideburn Satellite Support Center
Merrifield Satellite Support Center Central Operations Grounds Operations
Source: FCPS 2013
OFM functions are logically organized with adequate spans of control. The reorganization to implement satellite operations, conducted a few years ago, has resulted in reduced travel times and improved response times to school customers. However, the gains in operations and maintenance efficiencies are not enough to make up for a substantial shortfall in facilities personnel and lack of investment in school buildings. FEA’s benchmarking in the 2012 study identified a shortfall of 264 full-time equivalents (FTEs) of front-line maintenance staff.
Recommendation 3-3: Conduct re-engineering study of facilities purchasing and warehousing functions.
There were reported inefficiencies in the facilities warehousing and purchasing processes that are having a significant impact on the overall productivity of the facilities staff. These inefficiencies are also adversely affecting the safety of facilities and customer satisfaction. Various facilities leaders and staff reported delays caused by waiting for parts, supplies, materials and tools needed to accomplish their work tasks. The inability to take advantage of just-in-time delivery of materials and supplies was also affecting facilities worker productivity and morale.
There were also reports of inadequate systems to identify in-stock materials. This has created a culture of excessive materials and supplies ordering generating surplus materials and waste. The Sideburn Warehouse is ordering approximately 40 non-stock items (many of which are stock items) per day because of undeveloped nomenclature of non-stock in the ordering system, which is causing inefficiencies.

75
Team Works, the warehouse inventory system used by FCPS, provides access to inventory levels of in-stock items. Non-stock items are ordered by FCPS satellite staff directly through the procurement team at facilities management’s warehouse operation. The warehouse has well-developed naming conventions, as well as part numbers assigned to all in-stock items. Inefficiencies arise because non-stock orders do not flow through the warehouse for review, coupled with the improper use of a consistent naming convention or part number by the satellite staff when placing a non-stock order.
The parts acquisition process could be improved. There are many processes in place such as using web-based applications for the automatic reorder of stock parts, high/low stock evaluations, and trending reports. However, the process of requesting and receiving non-stock items is a tremendous administrative burden.
According to maintenance staff, 25 trips per week, on average, are made between two FCPS facilities associated with parts acquisition. Supervisors must constantly monitor the status of ordered parts; sometimes parts are actually ready, but satellites are not notified. Waiting on parts is affecting work order completion times and thus customer satisfaction.
It is recommended that facilities purchasing and warehousing functions be re-engineered to support more efficient processing. This should include the consideration of just-in-time delivery approaches and purchasing policy and training review, as well as evaluation of the warehouse inventory management system and data. The development of consistent naming conventions for warehouse supply requests to prevent non-stock ordering of stock items is also recommended.
FISCAL IMPACT
Based on similar projects conducted by other school systems, FCPS should budget a one-time cost of $100,000 for a re-engineering study. Additional costs may be necessary, but cannot be determined until the re-engineering study is completed. Potential savings related to the effectiveness and efficiency of maintenance staff and reduction in materials and parts ordering costs are also dependent on the results of this re-engineering study.
Recommendation 3-3 One-Time
Costs/ Savings
2013-14 2014-15 2015-16 2016-17 2017-18
Conduct re-engineering study of facilities purchasing and warehousing functions.
($100,000) $0 $0 $0 $0 $0
Note: Costs are negative. Savings are positive.
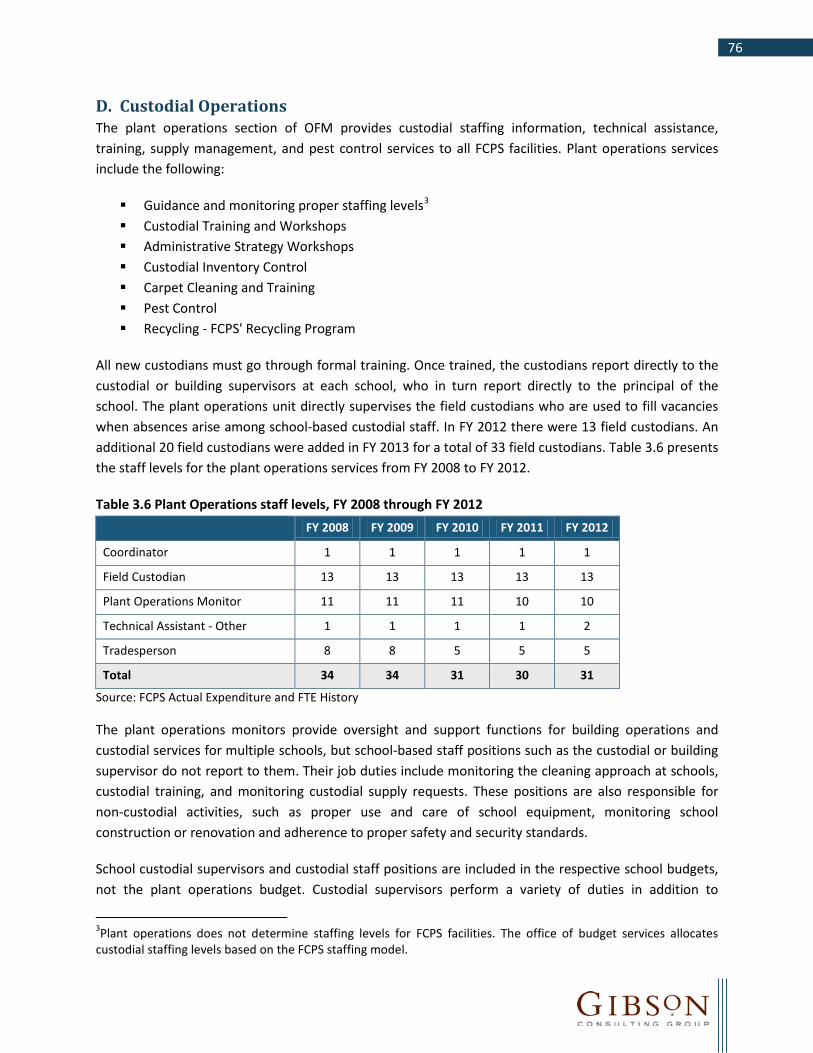
76
D. Custodial Operations The plant operations section of OFM provides custodial staffing information, technical assistance, training, supply management, and pest control services to all FCPS facilities. Plant operations services include the following:
Guidance and monitoring proper staffing levels3 Custodial Training and Workshops Administrative Strategy Workshops Custodial Inventory Control Carpet Cleaning and Training Pest Control Recycling - FCPS' Recycling Program
All new custodians must go through formal training. Once trained, the custodians report directly to the custodial or building supervisors at each school, who in turn report directly to the principal of the school. The plant operations unit directly supervises the field custodians who are used to fill vacancies when absences arise among school-based custodial staff. In FY 2012 there were 13 field custodians. An additional 20 field custodians were added in FY 2013 for a total of 33 field custodians. Table 3.6 presents the staff levels for the plant operations services from FY 2008 to FY 2012.
Table 3.6 Plant Operations staff levels, FY 2008 through FY 2012 FY 2008 FY 2009 FY 2010 FY 2011 FY 2012
Coordinator 1 1 1 1 1
Field Custodian 13 13 13 13 13
Plant Operations Monitor 11 11 11 10 10
Technical Assistant - Other 1 1 1 1 2
Tradesperson 8 8 5 5 5
Total 34 34 31 30 31
Source: FCPS Actual Expenditure and FTE History
The plant operations monitors provide oversight and support functions for building operations and custodial services for multiple schools, but school-based staff positions such as the custodial or building supervisor do not report to them. Their job duties include monitoring the cleaning approach at schools, custodial training, and monitoring custodial supply requests. These positions are also responsible for non-custodial activities, such as proper use and care of school equipment, monitoring school construction or renovation and adherence to proper safety and security standards.
School custodial supervisors and custodial staff positions are included in the respective school budgets, not the plant operations budget. Custodial supervisors perform a variety of duties in addition to
3Plant operations does not determine staffing levels for FCPS facilities. The office of budget services allocates custodial staffing levels based on the FCPS staffing model.

77
cleaning. They open school buildings in the morning, perform minor building operations and maintenance duties, help set up for special events at the school during the day, and other duties that may be requested by the principal or other school administrator. Custodial supervisors are included in the custodial staffing formulas.
The majority of the work done by custodians in FCPS schools during the day shift involves cleanliness policing, cafeteria service, grounds maintenance immediately adjacent to schools, event set up, emergencies, and other school needs. Since few areas of the school can be adequately cleaned while school is in session, most of the FCPS custodial staff is assigned to the after-school or night shift. Night shift non-cleaning duties vary from facility to facility within FCPS and after-school facility usage has a direct impact on night shift cleaning schedules. Examples of after school building usage include after-school educational programs, PTA meetings, adult continuing education programs, athletic events, and other community programs.
Overall costs for custodial services were $64.2 million in FY 2012, down from $68.7 million in FY 2008, a reduction of 6.5 percent during a time when building space increased 2.3 percent. Table 3.7 presents a five year history of custodial services expenditures and efficiency measures. The FY 2012 spending level equates to $2.44 per square foot, down from $2.67 per square foot in FY 2008. This reduction is due primarily to custodial staff cuts in FY 2010 and FY 2011.
Table 3.7. FCPS custodial costs, FY 2008 through FY 2012 FY 2008 FY 2009 FY 2010 FY 2011 FY 2012
Personnel (salaries) $46,643,858 $48,189,883 $47,593,409 $41,516,559 $42,751,841
Personnel (benefits) $17,724,666 $19,275,953 $17,990,309 $15,361,127 $17,100,736
Supplies (paper, plastic, cleaning, etc.)
$2,770,002 $3,035,346 $3,092,162 $3,224,459 $3,186,730
Custodial equipment repair costs
$501,666 $520,949 $507,420 $489,311 $379,496
Equipment replacement costs
$226,772 $130,783 $142,064 $311,604 $118,212
Contracts (labor, services, etc.)
$841,358 $785,627 $586,965 $592,905 $677,933
Total Costs $68,708,322 $71,938,541 $69,912,329 $61,495,965 $64,214,948
Total gross square footage
25,687,915 26,041,114 26,278,181 26,480,424 26,293,673
Custodial cost per square foot
$2.67 $2.76 $2.66 $2.32 $2.44
Source: FCPS plant operations
Industry benchmarks for custodial cost per square foot for public schools published by the International Facilities Management Association (IFMA) and American Schools and Universities (AS&U) range between $1.61 and $1.77 per square foot. FCPS custodial costs exceed these benchmarks, even when considering other support services and tasks performed by custodians such as grounds maintenance activities. A

78
significant portion of the benchmark variance appears to be due to variances in custodial pay levels nationwide. Table 3.8 presents average pay rates for custodians in a sample of school systems. Custodial pay levels in the Washington area are similar; however, all of the other large school systems sampled have lower pay levels, and most are significantly lower.
Table 3.8 Average custodial pay rate comparisons School System Average Custodial Pay
Washington Area
Fairfax County Public Schools $33,358
Arlington Public Schools (VA) $30,940
Prince William County Public Schools (VA) $31,640
Other U.S. School Systems
Broward County Public Schools (FL) $31,458
Miami-Dade County Public Schools (FL) $23,589
Los Angeles Unified School District (CA) $22,984
Hillsborough County Public Schools (FL) $19,000
Houston Independent School District (TX) $17,057
Sources: Gibson Consulting Group, Inc. research, FY 2013
Two major opportunities exist to improve the management and efficiency of the custodial function. These opportunities are presented in the following recommendations.
Recommendation 3-4: Implement centralized management approach to custodial services.
The FCPS custodial building supervisors and custodial staff report to school principals. This reporting structure emphasizes the custodians’ responsiveness to the principal and his or her staff, but is not the most effective model in terms of cleaning efficiency or effectiveness. The FCPS plant operations coordinator and supporting staff are the experts regarding the day-to-day cleaning of school buildings. They have experience and expertise in custodial procedures, equipment, supplies, and training; principals do not. Cleaning efficiencies and improved quality can be achieved with greater oversight and input from the plant operations coordinator.
According to division management, the decentralized approach used by FCPS is more common in the Washington D.C. area than other areas of the country, particularly with larger school systems. However, this is not a best practice, and typically large school systems, including the Clark County School District in Nevada, apply a more centralized approach.
Some school systems have a dual reporting system. Under this approach the custodial supervisor reports administratively to the principal (attendance, discipline matters), while reporting technically to a technical leadership position in the central office. In other school systems, the principal serves as the

79
customer of the custodial function, not the line supervisor, providing important customer feedback that influences the evaluation of the custodial function.
Custodial services should fall under the responsibility of FCPS plant operations with a dual reporting role to the school principals for administrative purposes. A centralized approach would improve the consistency of cleaning processes and oversight, provide better support for Vendor Managed Inventory (VMI) programs, and improve methods of cleaning and work assignments. The plant operations section has piloted several industry best practices including utilizing VMI programs, improved floor-cleaning methods and team cleaning, and has achieved an increase in efficiency in several schools.
FCPS should increase its plant operations monitors for the increased oversight and evaluation responsibilities. All custodial supervisors should report to a plant operations monitor, who would conduct their annual performance evaluation. School administrators should provide input on the performance evaluation and be surveyed throughout the year to evaluate ongoing work quality.
As part of this recommendation, plant operations should update the performance measures and targets for custodial services. The fiscal accountability for this function should also be changed. Custodial staff and related expenditures can be recorded in the FCPS accounting system as “school-based” but should fall under the plant operations budget. This is similar to how itinerant teaching staff in office of instructional services is handled.
FISCAL IMPACT
FCPS should increase the plant operations monitors by 10 FTE positions during FY 2014. With average pay of $60,970 plus benefits of 43.7 percent, the annual staff costs would be $876,139. Additional travel cost of $1,000 per monitor (for all 20 monitors), or $20,000 in total, is expected. The total annual cost is projected to be $896,139, starting in FY 2014.
The staff increase would double the number of facility operations monitor positions and provide a reasonable span of control (approximately 10 schools per monitor) for technical oversight and evaluation of school custodial supervisors. Approximately 50 percent of the monitors’ time should be spent at the schools monitoring work quality, work efficiency, and providing technical oversight. They would still be able to perform their other responsibilities.
Recommendation 3-4 One-Time
Costs/ Savings
2013-14 2014-15 2015-16 2016-17 2017-18
Implement centralized management approach to custodial services.
$0 ($896,139) ($896,139) ($896,139) ($896,139) ($896,139)
Note: Costs are negative. Savings are positive.

80
Recommendation 3-5: Modify the custodial staffing formula to reflect current staffing standards.
FCPS uses a staffing formula for custodians which is calculated by the office of budget services. The FCPS custodial staffing formula is similar to the Florida Department of Education Maintenance and Operations Administrative Guidelines for School Districts and Community Colleges4, which applies the Association of Physical Plant Administrators (APPA) Custodial Staffing Guidelines as the basis for the calculations5. The standards use 19,000 gross square feet per FTE custodian as the core basis for staffing, and adds 0.5 FTE, 0.75 FTE, and 1.0 FTE for other activities at elementary schools, middle schools, and high schools, respectively.
The staffing standards applied by FCPS are outdated. APPA updated their custodial staffing guidelines in 2011; FCPS standards still apply the prior guidelines which had been in effect since 1998. The updated guidelines show an increase in overall area cleaned per custodian across all space types by an average of approximately 36 percent. A summary of the productivity standard (gross square feet per custodian) using the 1998 and 2011 guidelines for each APPA level of service is presented in Table 3.9. APPA service level 2 – the cleaning standard applied for most school facilities – is the one applied by FCPS.
Table 3.9. Comparison of space cleaned per FTE between APPA 1998 and 2011 guidelines APPA Level of Service 1 2 3 4 5
APPA 2011 Guidelines 15,531 25,576 29,642 32,455 34,760
APPA 1998 Guidelines 12,359 19,007 21,603 23,429 24,552
Variance 26% 35% 37% 39% 42%
Source: Association of Physical Plant Administrators, 2011
Based on a review of school staffing and budget data there are 1,412 staff positions including custodians, field custodians, building supervisors, assistant building supervisors, administrative building support, and school building support. Most of these positions (1,305) relate to school custodial services. Approximately 66 percent of this total relates to the night shift staff. Table 3.10 presents the gross square feet, total custodial staffing productivity by school, and the range of variability in productivity among schools.
4 Florida Department of Education (FLDOE). 1989. Maintenance and Operations Administrative Guidelines for School Districts and Community Colleges – Chapter 5.0 Management of Custodial Programs. Florida Center for Community Design + Research. 5 Association of Physical Plant Administrators (APPA). 1998. “Custodial Staffing Guidelines for Educational Facilities. Second Edition,” ISBN 1-890956-06-6. Alexandria, VA.

81
Table 3.10. Productivity of school-based custodians, FY 2013
School Type Number Gross Square
Feet (GSF)
FTE Custodial Positions
GSF per FTE Custodian
Lowest Productivity
School
Highest Productivity
School
Elementary Schools 139 11,923,496 647.5 18,414 15,422 22,352
Middle Schools 26 4,478,475 197.5 22,675 19,233 26,084
High Schools 30 9,132,527 460.0 19,853 18,082 22,926
Total 195 25,534,495 1,305.0 19,566 - -
Source: FCPS office of budget services
The updated APPA 2011 staffing guidelines reflect a target productivity level of 25,576 square feet per FTE custodian for Level 2 cleaning. FCPS custodial staff productivity is 23 percent below this target.
Several actions can be considered to move FCPS closer to the new standards over the next two years:
Centralizing the management function (see Recommendation 3-5) will help spread best practices throughout the division (e.g., team cleaning, VMI programs).
Reviewing custodial work schedules.
Reviewing custodial contract days.
Evaluating use of part-time staff or shared custodian among schools to increase productivity.
Evaluating cleaning frequencies.
Conducting time and motion studies to determine how long it should take to perform cleaning of classrooms, rest rooms and other school space.
Evaluating balance of day and night shift custodians at each school based on attributes of that school (such as after-school use, campus layout).
Conducting surveys of school principals to monitor service quality.
Evaluating staff levels at schools with lower productivity.
Through these actions FCPS should be able to reduce the variance between current staffing levels and the new standards by at least 50 percent, achieving a target productivity level of 22,577 by FY 2016. This can be achieved through a reduction of 174 custodial positions.
FISCAL IMPACT
The fiscal impact assumes no position reductions in FY 2014. This year will allow the new management approach to take hold and school by school analysis to be conducted. Position reductions would occur in FY 2015.
A reduction of 174 positions would yield total annual general fund savings of $8,340,768 (average salary per custodian $33,358 x 43.7 percent benefits x 174 positions). These reductions will be phased in over a

82
2-year period, with one-half of the savings realized in FY 2015 and the full savings realized in FY 2016 and each subsequent year.
Recommendation 3-5 One-Time
Costs/ Savings
2013-14 2014-15 2015-16 2016-17 2017-18
Modify the custodial staffing formula to reflect current staffing standards.
$0 $0 $4,170,384 $8,340,768 $8,340,768 $8,340,768
Note: Costs are negative. Savings are positive.
E. Energy Management FCPS spends $28.1 million per year on electricity costs, and an additional $6.7 million per year on natural gas. These two line items present the vast majority of the operating budget for the office of energy management.
The FCPS energy management function is responsible for preparing utility expenditure forecasts, analyzing and implementing utility contracts and rate schedules, implementing energy related mandates, managing energy performance contracts, and operating the computerized Central Control and Monitoring System that controls temperatures and air flow throughout the division.
Recommendation 3-6: Make additional investments to realize energy savings.
The OFM has a system in place to review utility bills and track consumption on a monthly basis. Software such as ENERGY STAR’s Portfolio Manager and Energy Watch Dog are routinely used by the energy management department to monitor energy consumption and costs.
Significant efforts have been made to reduce energy consumption including:
Installation and upgrading of Digital Control Systems (DCS), also known as Energy Management Systems across the portfolio.
Major energy retrofits through energy savings performance contract from 2000 – 2006, including lighting, HVAC, and window upgrades.
HVAC replacement with more efficient equipment.
Installation of motion sensors in schools and office buildings.
Replacing parking lot and garage lights with LED lights.
Re-negotiation of utility rates.
Most of these energy conservation measure projects have achieved substantial return-on-investments with very short payback periods.
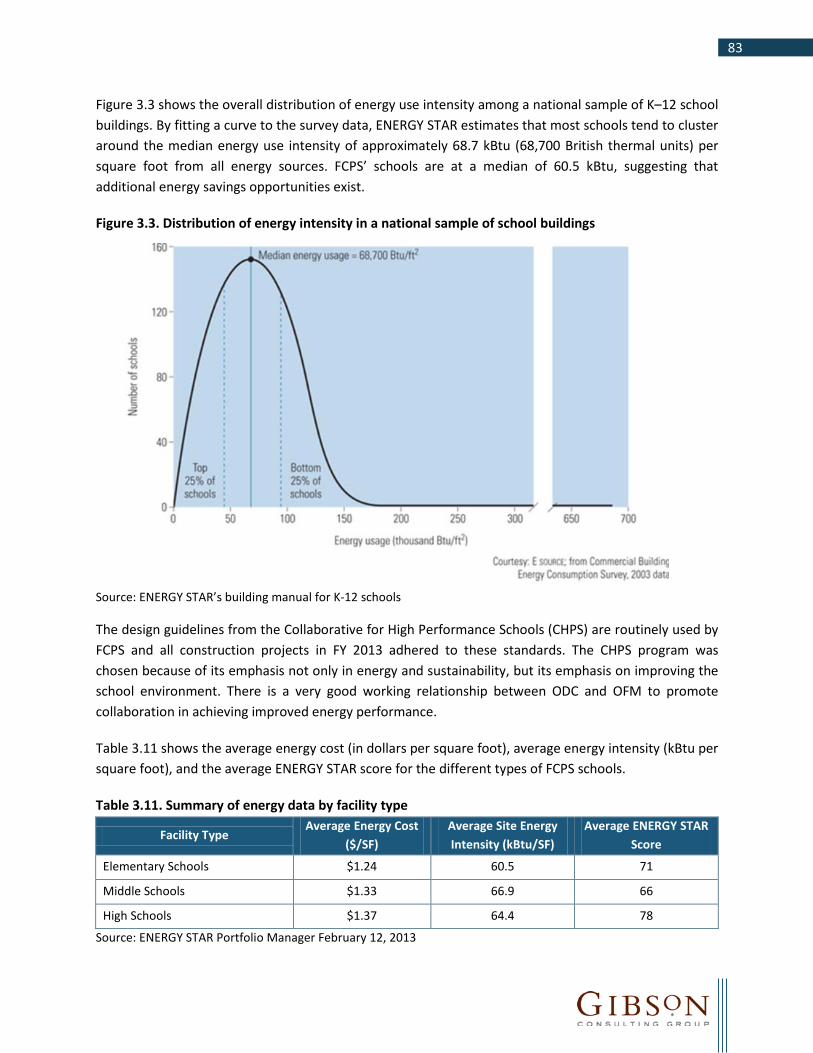
83
Figure 3.3 shows the overall distribution of energy use intensity among a national sample of K–12 school buildings. By fitting a curve to the survey data, ENERGY STAR estimates that most schools tend to cluster around the median energy use intensity of approximately 68.7 kBtu (68,700 British thermal units) per square foot from all energy sources. FCPS’ schools are at a median of 60.5 kBtu, suggesting that additional energy savings opportunities exist.
Figure 3.3. Distribution of energy intensity in a national sample of school buildings
Source: ENERGY STAR’s building manual for K-12 schools
The design guidelines from the Collaborative for High Performance Schools (CHPS) are routinely used by FCPS and all construction projects in FY 2013 adhered to these standards. The CHPS program was chosen because of its emphasis not only in energy and sustainability, but its emphasis on improving the school environment. There is a very good working relationship between ODC and OFM to promote collaboration in achieving improved energy performance.
Table 3.11 shows the average energy cost (in dollars per square foot), average energy intensity (kBtu per square foot), and the average ENERGY STAR score for the different types of FCPS schools.
Table 3.11. Summary of energy data by facility type
Facility Type Average Energy Cost
($/SF) Average Site Energy Intensity (kBtu/SF)
Average ENERGY STAR Score
Elementary Schools $1.24 60.5 71
Middle Schools $1.33 66.9 66
High Schools $1.37 64.4 78
Source: ENERGY STAR Portfolio Manager February 12, 2013

84
Almost one-half of the FCPS facilities are reported to have ENERGY STAR ratings of 75 or greater, indicating high energy efficiency. Figure 3.4 shows the number of FCPS schools with high, moderate, and low energy efficiency as measured by ENERGY STAR scores. Those schools with low ENERGY STAR scores represent the best potential for energy improvements and energy cost reductions.
Figure 3.4. Portfolio wide ENERGY STAR scores
Source: ENERGY STAR Portfolio Manager as of February 12, 2013
Currently, 11 FTE positions support the division’s energy management function, but none of these positions are fully dedicated to the identification and implementation of energy conservation measures. There is 0.5 FTE dedicated to HVAC scheduling within the DCS. Utilizing the DCS for scheduling, monitoring alarms, and viewing trends allows for greater efficiency and has a good potential to decrease energy consumption. There are no other FCPS positions dedicated to initiating and overseeing additional energy conservation projects that would yield savings. Based on the above analysis, additional energy savings could be achieved if FCPS would invest in additional staff resources to identify and implement energy conservation measures.
Contracted services could also be used to improve energy efficiency and reduce costs through a retro-commissioning study. The major energy consuming systems have not been commissioned and/or tested for proper function since 2006 when the energy performance savings contract retrofit work was conducted. Performing retro-commissioning of buildings has the potential to reduce energy consumption by 16 percent, on average, with a typical payback of one year.6 Performing retro-commissioning is a crucial step to optimizing equipment efficiency and helps move towards continuous commissioning where staff is consistently utilizing the DCS.
6 Lawrence Berkeley National Laboratory Study published in 2009 for the California Energy Commission – Public Interest Energy Research (PIER)
0
20
40
60
80
100
120
75 or higher 50 to 74 Below 50

85
With additional permanent staffing and the use of contracted services, FCPS could continue to reduce energy costs by performing the following activities:
Retro-commissioning buildings. The retro-commissioning should be done through contracting.
Focusing more on streamlining operations schedules (e.g., providing conditioned air to only spaces used during the day and evening).
Continuing to upgrade controls. Some of the controls are at end of their life and need to be upgraded.
Continuing to install occupancy sensors for lighting and HVAC. New wireless sensors are making this much more cost effective.
Replacing older chillers with new energy-efficient magnetic bearing chillers.
Re-evaluating LED lighting in the context of recent price reductions.
FCPS should focus on implementing these energy savings opportunities in schools with an ENERGY STAR score of less than 75, representing approximately 11.2 million square feet.
FISCAL IMPACT
The estimated cost of an outside contractor for performing retro-commissioning is $0.20 per square foot, or a total cost of $2,236,340. This effort can be spread across four years at $559,085 annually. Assuming a one year payback for retro-commissioning, this amount of savings will begin to accumulate annually in 2014-15.
Three additional positions should be added to the permanent energy management staff to focus on energy usage analysis and energy savings opportunities. This dedicated effort will result in the identification of other investments that need to be made along with the resulting savings. Only the staff cost can be reasonably estimated at this time. Capital investments in equipment will likely be required; however, these could be made from the FCPS fund balance or carry forward funds (discussed in Chapter 6 – Financial Management).
Assuming three positions at an average technical specialist pay of $84,458, plus 43.7 percent benefits, the estimated annual cost would be $364,098. The return on investment will depend on the energy savings opportunities, the investment required, and the payback period for each opportunity. OFM staff believe that in the long run an additional $7 million in annual savings can be achieved, but most of this may occur after 2017-18.

86
Recommendation 3-6 One-Time
Costs/ Savings
2013-14 2014-15 2015-16 2016-17 2017-18
Cost of retro-commissioning
$0 ($559,085) ($559,085) ($559,085) ($559,085) ($559,085)
Annual savings from retro-commissioning
$0 $0 $559,085 $1,118,170 $1,677,255 $2,236,340
Additional staff costs $0 ($364,098) ($364,098) ($364,098) ($364,098) ($364,098)
Total $0 ($923,183) ($364,098) $194,987 $754,072 $1,313,157
Note: Costs are negative. Savings are positive.
87
Chapter 4 – Transportation Introduction
Transportation is a vital support service that requires sound management. The primary mission is to provide timely, safe, efficient, and effective transportation services to and from school and other school related activities. Capital investments in the bus fleet and annual expenditures on the operation and maintenance of those buses are substantial. Although numerous state regulations govern transportation services, school divisions have the flexibility to establish operating policies and procedures that can substantially influence the efficiency and effectiveness of their operations. The manner in which transportation services support the educational mission of the division is defined by parameters such as service eligibility and the coordination of school bell schedules. These planning parameters combine with efficiently designed bus routes and sound operational procedures to produce a transportation program that adequately balances the educational objectives of the division with the cost of providing transportation services.
This chapter examines the entire transportation program, focusing on and evaluating those factors most affecting transportation service quality and cost. According to data included in the division’s annual state report, the program currently provides transportation services to approximately 135,000 daily student riders on 1,272 operational route buses, making it one of the largest K-12 student transportation operations in the country, and the largest in Virginia. In addition to the bus drivers and on-board attendants, staffing consists of 86 managerial, supervisory, administrative, and planning positions.
The sections that follow evaluate the effectiveness and efficiency of this function, with commendations and recommendations presented in the following key areas:
A. Organization and Staffing B. Planning, Policies, and Procedures C. Routing and Scheduling D. Vehicle Maintenance and Bus Replacement Schedules
While this review included state reporting and training and safety, no significant commendations or recommendations were identified in these areas. Also, bell time management was not reviewed as this is being studied separately by the division.
Transportation services is a well-managed operation and has shown improved efficiency over the past five years. Two practices recently implemented are particularly noteworthy, and are commendations made in this chapter:
The centralization of route planning functions in a single office serving all geographic areas has been an excellent organizational response to the changes in service demand within the division.
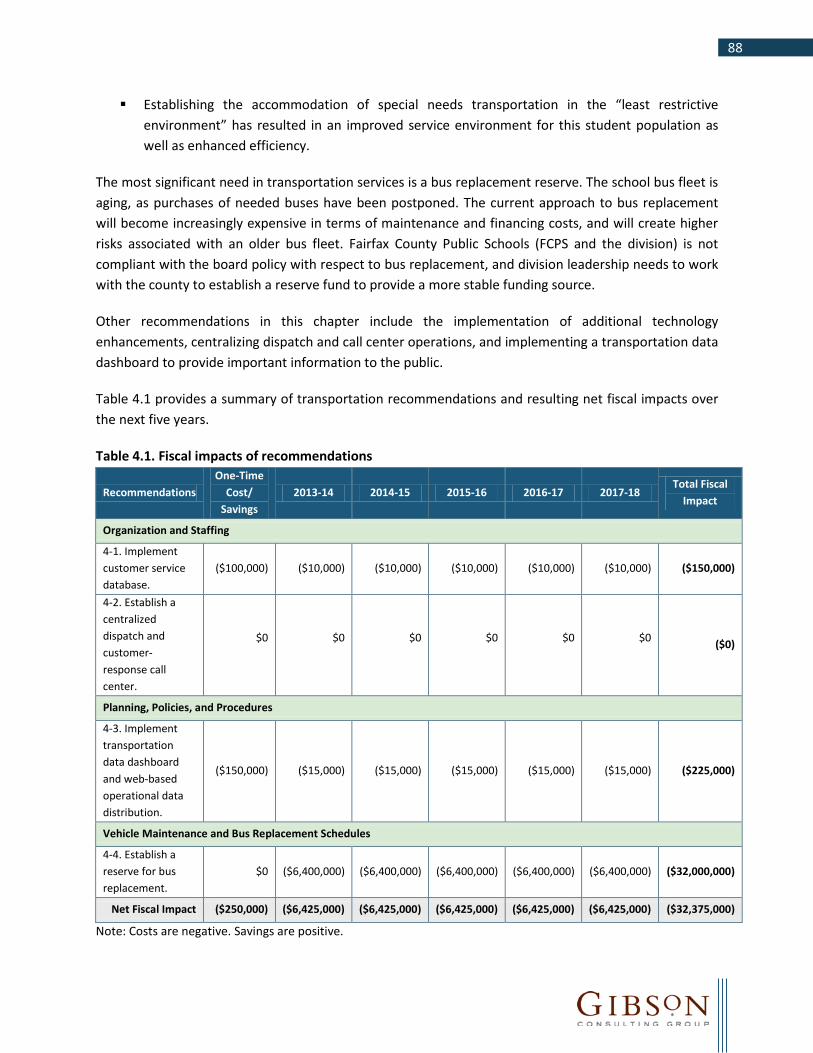
88
Establishing the accommodation of special needs transportation in the “least restrictive environment” has resulted in an improved service environment for this student population as well as enhanced efficiency.
The most significant need in transportation services is a bus replacement reserve. The school bus fleet is aging, as purchases of needed buses have been postponed. The current approach to bus replacement will become increasingly expensive in terms of maintenance and financing costs, and will create higher risks associated with an older bus fleet. Fairfax County Public Schools (FCPS and the division) is not compliant with the board policy with respect to bus replacement, and division leadership needs to work with the county to establish a reserve fund to provide a more stable funding source.
Other recommendations in this chapter include the implementation of additional technology enhancements, centralizing dispatch and call center operations, and implementing a transportation data dashboard to provide important information to the public.
Table 4.1 provides a summary of transportation recommendations and resulting net fiscal impacts over the next five years.
Table 4.1. Fiscal impacts of recommendations
Recommendations One-Time
Cost/ Savings
2013-14 2014-15 2015-16 2016-17 2017-18 Total Fiscal
Impact
Organization and Staffing
4-1. Implement customer service database.
($100,000) ($10,000) ($10,000) ($10,000) ($10,000) ($10,000) ($150,000)
4-2. Establish a centralized dispatch and customer-response call center.
$0 $0 $0 $0 $0 $0 ($0)
Planning, Policies, and Procedures
4-3. Implement transportation data dashboard and web-based operational data distribution.
($150,000) ($15,000) ($15,000) ($15,000) ($15,000) ($15,000) ($225,000)
Vehicle Maintenance and Bus Replacement Schedules
4-4. Establish a reserve for bus replacement.
$0 ($6,400,000) ($6,400,000) ($6,400,000) ($6,400,000) ($6,400,000) ($32,000,000)
Net Fiscal Impact ($250,000) ($6,425,000) ($6,425,000) ($6,425,000) ($6,425,000) ($6,425,000) ($32,375,000)
Note: Costs are negative. Savings are positive.

89
A. Organization and Staffing The FCPS Strategic Governance Manual defines the operational expectations of the transportation function. The manual prescribes that the superintendent assure the transportation of all students in a safe and timely manner, to instructional programs for which they are eligible or that meet their needs, in an efficient, effective manner. The office of transportation services (OTS) is primarily responsible for meeting these operational expectations.
The vast majority of staffing in the OTS is dedicated to on-bus operations. Figure 4.1 summarizes the managerial and administrative organization structure for OTS.
Figure 4.1. FCPS OTS organization structure
Director of Transportation
Services
Assistant Director
Area 2 Coordinator Area 3 Coordinator Area 4 CoordinatorArea 1 Coordinator Coordinator, Planning and Routing
Operations Manager Operations Manager Operations Manager Operations Manager Manager, Routing
Routers
Supervisors Supervisors Supervisors Supervisors Van Supervisor
Source: FCPS 2013
Total annual expenditures on transportation services were approximately $123.5 million7 in fiscal year (FY) 2012. Table 4.2 summarizes the five-year trend in overall OTS expenditures. Despite growing enrollment and higher demands placed upon the transportation system, the division has succeeded in maintaining a flat trend in the overall cost of providing transportation services.
7 Based on total division reported OTS expenditures, including capital outlays and expenditures on non-bus fleet assets (administrative and support vehicles, etc.).
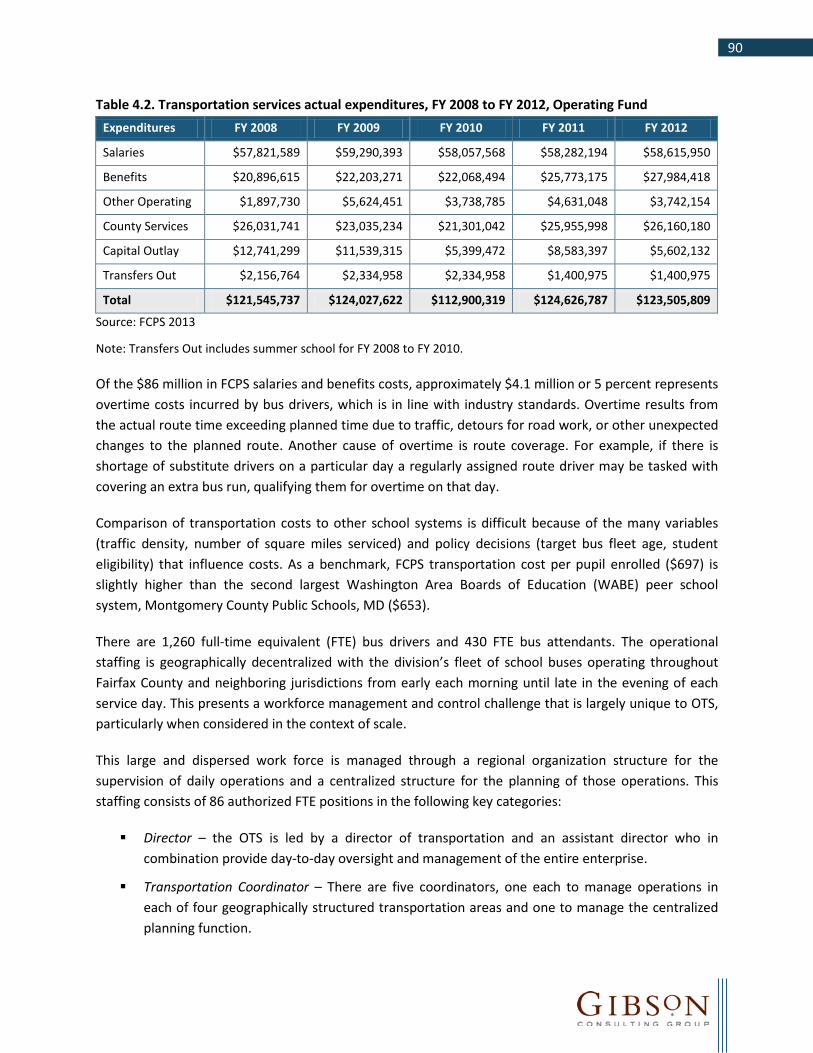
90
Table 4.2. Transportation services actual expenditures, FY 2008 to FY 2012, Operating Fund Expenditures FY 2008 FY 2009 FY 2010 FY 2011 FY 2012
Salaries $57,821,589 $59,290,393 $58,057,568 $58,282,194 $58,615,950
Benefits $20,896,615 $22,203,271 $22,068,494 $25,773,175 $27,984,418
Other Operating $1,897,730 $5,624,451 $3,738,785 $4,631,048 $3,742,154
County Services $26,031,741 $23,035,234 $21,301,042 $25,955,998 $26,160,180
Capital Outlay $12,741,299 $11,539,315 $5,399,472 $8,583,397 $5,602,132
Transfers Out $2,156,764 $2,334,958 $2,334,958 $1,400,975 $1,400,975
Total $121,545,737 $124,027,622 $112,900,319 $124,626,787 $123,505,809
Source: FCPS 2013
Note: Transfers Out includes summer school for FY 2008 to FY 2010.
Of the $86 million in FCPS salaries and benefits costs, approximately $4.1 million or 5 percent represents overtime costs incurred by bus drivers, which is in line with industry standards. Overtime results from the actual route time exceeding planned time due to traffic, detours for road work, or other unexpected changes to the planned route. Another cause of overtime is route coverage. For example, if there is shortage of substitute drivers on a particular day a regularly assigned route driver may be tasked with covering an extra bus run, qualifying them for overtime on that day.
Comparison of transportation costs to other school systems is difficult because of the many variables (traffic density, number of square miles serviced) and policy decisions (target bus fleet age, student eligibility) that influence costs. As a benchmark, FCPS transportation cost per pupil enrolled ($697) is slightly higher than the second largest Washington Area Boards of Education (WABE) peer school system, Montgomery County Public Schools, MD ($653).
There are 1,260 full-time equivalent (FTE) bus drivers and 430 FTE bus attendants. The operational staffing is geographically decentralized with the division’s fleet of school buses operating throughout Fairfax County and neighboring jurisdictions from early each morning until late in the evening of each service day. This presents a workforce management and control challenge that is largely unique to OTS, particularly when considered in the context of scale.
This large and dispersed work force is managed through a regional organization structure for the supervision of daily operations and a centralized structure for the planning of those operations. This staffing consists of 86 authorized FTE positions in the following key categories:
Director – the OTS is led by a director of transportation and an assistant director who in combination provide day-to-day oversight and management of the entire enterprise.
Transportation Coordinator – There are five coordinators, one each to manage operations in each of four geographically structured transportation areas and one to manage the centralized planning function.

91
Transportation Operations Manager – There are nine positions, two reporting to each of the transportation area coordinators and one reporting to the coordinator of transportation planning.
Transportation Supervisor – There are 33 authorized positions spread throughout the organization to provide direct on-road and in-office supervision of daily bus operations.
Dispatcher – There are eight positions, two in each geographical transportation area that provide the first line of communications and coordination for bus drivers and users of the system operationally.
The remaining 29 positions consist of a variety of administrative assistants, transportation specialists, analysts, and specialty positions to support operations and the unique functional requirements of this large and complex logistical support service. Transportation administrative staff levels in FY 2013 are the same as they were in FY 2008.
The current organization of operational staff through four geographic areas is a functional and effective model for staff supervision, particularly within the context of the systems and processes currently in use. There is a clear commitment and engagement on the part of staff to provide a high level of customer service, and consistency from area to area is encouraged by regular meetings and sharing of ideas among the coordinators and managers.
The staffing level for operational control and supervision of bus operations, as represented by the staffing structure described above, is adequate to the tasks assigned. There is a ratio of one management/administrative staff member to 15 operational route buses8. There is no directly relevant industry standard to compare this staffing structure against, as the ratio is highly dependent on local decisions regarding the manner of supervision for bus drivers, and the cross-use of personnel for both driving and administrative tasks.
Commendation 4-1: The centralization of route planning functions in a single office serving all geographic areas has been an excellent organizational response to the changes in service demand within the division.
In prior years, the OTS decentralized route planning functions to each of the transportation areas. More recently the division has experienced a steady increase in the demand for services, not just in terms of volume (i.e., students transported) but also in the demand for cross-boundary services whereby more students are being transported to schools and programs geographically separated from their home or residence-based school. This increase in demand is exacerbated by the ongoing urbanization of the service area which results in greater traffic congestion, effectively decreasing the distance each bus can travel in a given timeframe even as the demand pattern reflects the need to travel longer and farther. The response of OTS has been to create a centralized team of route planners that serve the entire
8 1,272 operational route buses, 86 total staff positions

92
division from a central location, recognizing the integration required and the need to operate the system as single unified whole.
The centralized planning office is organized around a core team of 12 route planners, each of which is responsible for planning the routes serving a particular group of schools and programs, regardless of the origination point of the students attending those programs or the nature of those programs (e.g., special needs, regular education, or specialty). By ensuring the close proximity of the entire planning team, and access to system-wide data in the MapNet route planning software, there is an ease of coordination among the planners and a team-based culture that works toward the development of a “one-system” approach and a maximization of logistical efficiency that was not achievable in the earlier, decentralized organization.
With an increase in specialized and cross-boundary transportation placing pressure on efficiency, this centralization has facilitated the ability to identify, implement, and maintain the most efficient logistical solutions. The results are apparent: operational bus counts peaked at 1,344 in FY 2009, dropping by 72 (5 percent) to 1,272 buses in the current year while carrying 3,350 (3 percent) more riders. When viewed in the context of higher congestion and slower traffic patterns throughout the service area, the effectiveness of the central planning team is even more impressive.
Recommendation 4-1: Implement customer service database.
The OTS organization has been piloting new technologies to improve communication and information work flow. Currently, the reliance on the radio system to communicate telephone messages has proven to be rather cumbersome and inefficient. Additionally, time sheets are hand written, collected by supervisors to be data entered into the time and attendance system resulting in a labor intensive process. An exception to this pattern is the recent adoption and use of automated vehicle location (AVL/GPS) technology. This technology places vast quantities of targeted information at the fingertips of operational supervisors. Any staff member with access to this system can immediately respond to an operational customer request, question, or complaint regarding such matters as service delays, missed stops, etc. The OTS is also exploring the expanded use of this technology and enhancement to its routing software platform to begin distributing more and better information to bus drivers. In a pilot program currently scheduled for implementation, 20 mobile data terminals are being added to buses. The goal is to utilize these terminals for driver time and attendance reporting, distribution of route information and changes to drivers in real time, and to communicate emergency information. Conceptually, this centralized availability of data and information obviates the need for much of the decentralization of staff prevalent in the current organization structure, and facilitates increased specialization of tasking and responsibility which would, in turn, have a positive impact on operating efficiency.

93
The division should make investments in additional technology to improve operational processes and customer service. Examples include:
Maximizing the utility of existing AVL data for supervising and monitoring day-to-day bus operations.
Establishing a central request/complaint database to track all customer contact events.
Centralizing these functions will improve communications and streamline operational processes.
FISCAL IMPACT
The investment in AVL technology has already been absorbed by the division, and improving the utility of the system and related data by staff will require no additional monetary investment. The organization will, however, need a concerted effort to plan for an appropriate level of access to, and analysis and distribution of, the available data. This would represent a one-time investment of staff time, primarily in the management and supervisory ranks to design and implement enhanced operational procedures.
Establishing a centralized customer service database and request management system may require a one-time, and a smaller ongoing investment of financial resources for acquisition and support of the software, plus an analogous effort on the part of staff to integrate its use into the operations of the OTS. While numerous commercial systems are available, it is also possible that the division may choose to develop this product internally, or adapt another similar product that may already be in use elsewhere in the division. To be conservative, the fiscal impact assumes the purchase of a commercial product.
The estimated cost of purchasing a centralized customer service database and request management system is $100,000, based on similar systems implemented in other school systems, adjusted for the increased scale required in a large organization such as FCPS. Ongoing investments to maintain this system are assumed to be 10 percent per year, or $10,000.
The following provides the fiscal impact of this recommendation by year.
Recommendation 4-1 One-Time
Costs/ Savings
2013-14 2014-15 2015-16 2016-17 2017-18
Implement customer service database.
($100,000) ($10,000) ($10,000) ($10,000) ($10,000) ($10,000)
Note: Costs are negative. Savings are positive.
Recommendation 4-2: Establish a centralized dispatch and customer-response call center.
Daily dispatch, on-road supervision, and response activities are decentralized among four geographic operating areas. These activities are further decentralized among several layers of staff within each

94
area, and administered with highly manual processes. This runs counter to the advantages of centralized planning as currently recognized in the other core part of the organization.
With the benefits of improved technology use realized, the division should consider the establishment of a centralized dispatch and customer-response call center that leverages the availability of AVL data and the customer-response database. The intent would be to capture and respond to all on-road and customer requests in real time, or to properly route and track a deferred response when required. The current structure distributes these responsibilities to multiple staff members within each of the four transportation areas. There is no coordination or centralized data capture, and while by all appearances the level of customer responsiveness is high, the current and likely future operating demands and community characteristics will require a higher level of responsiveness and immediate access to more, and more detailed information by bus drivers and users of the system.
FISCAL IMPACT
While an investment may be required to establish the office, technology, and communications infrastructure required to house the proposed dispatch and customer service center, it is estimated that there could be a substantial long-term offset provided through the operational efficiencies it yields. Administrative and supervisory staffing levels could be reduced, as measured by the ratio of staff to route buses, by the integration of technology with revised operational processes. In the context of the current OTS organization, many of the current distributed tasks related to customer response and the monitoring of daily bus operations would be centralized and supported by new or enhanced technology. A specialized, centralized, and trained dispatch staff relying upon the existing AVL and proposed mobile data terminal technologies would provide a productive substitute for current manual processes used for route distribution and operational monitoring.
A significant amount of detailed operational planning and analysis must occur to bring this recommendation to fruition, and to better calculate the costs and benefits of the proposed approach. The results of this more detailed assessment will influence the actual fiscal impact as the design and processes for the actual centralized operation are determined. It is unlikely that the aggregation of investments required will be significant, or that the operational efficiencies realized would be substantial relative to the overall annual operating budget of the OTS.
B. Planning, Policies, and Procedures The FCPS transportation system is well planned and operated by the OTS. The basis for all student transportation operations displaying these characteristics is the documentary guidance provided by policies, administrative regulations, and internal standard operating procedures. These documents collectively provide the service level constraints and planning parameters under which the OTS is tasked with optimizing service delivery. The FCPS documentation is robust, and clearly describes all key elements required for planning and operating the system.
The results achieved are evident in a series of core indicators of performance. Table 4.3 presents operating statistics and performance trends over the past five years.

95
Table 4.3. Transportation indicators of performance9 FY 2008 FY 2009 FY 2010 FY 2011 FY 2012
Regular Education Students Transported
126,831 127,565 128,618 130,482 130,784
Special Education Students Transported
4,270 4,295 4,368 4,401 4,433
Total 131,101 131,860 132,986 134,883 135,217
Cost per transported student
$927.12 $940.60 $848.96 $923.96 $913.39
Operational route buses
1,295 1,344 1,333 1,272 1,272
Cost per route bus $93,858 $92,282 $84,696 $97,977 $97,096
Buses per 100 students 0.99 1.02 1.00 0.94 0.94
Source: FCPS 2013
Each of these indicators is consistent with efficient operations throughout the country when adjusted for regional cost norms. This result is particularly noteworthy given that the FCPS rates of pay for bus drivers, representing a majority of all transportation related costs, are amongst the highest within the WABE peers.
The overall five-year increase in students transported is 3.4 percent, less than the 7 percent enrollment growth during the same time period. Overall costs per transported student have decreased by 1.5 percent. The measure of buses used per 100 students transported is a comprehensive measurement of asset and capacity utilization. In a nominal three-tier bell structure an industry benchmark range is 1.0-1.3, with lower results indicative of more efficient systems. Similar benchmark expectations for cost per student, when adjusted for regional cost norms, are $950-$1,050, and the cost per bus $85,000-$100,000.
Recommendation 4-3: The division should implement a transportation services data dashboard for increased transparently and web-based operational data distribution for increased customer service.
Student transportation is a data-rich operational function, which facilitates robust analysis and use of data for reporting and management purposes. The OTS generally makes excellent internal use of these data and information to plan and improve its operations. The calculation of key performance indicators and the presentation of these data to outside consumers and stakeholders in an ongoing, simplified format would provide an excellent platform for demonstrating the value provided by the OTS and the efficiency with which it executes its mission.
9 The values were calculated using all identifiable costs directly attributable to OTS; as a result they will vary from similar values calculated using state-reported data categories alone.

96
The OTS has been reluctant to provide student specific transportation data available to parents, citing safety issues and the management burden of such systems. An emerging trend in the provision of student transportation services is to push service information to users, both school building administrators and parents, directly from the data systems in use to plan and operate the service. Software vendors have developed and are continuing to refine sophisticated mechanisms to transmit these data securely so that core service information (e.g., route assignment, stop location, and pickup time) is readily available to facilitate secure, password protected access to student data via a secure web portal. The current standard of service within the division is for limited access to this information, and only through direct telephone or email communication with staff. The division should consider a more general distribution of a transportation services data dashboard to create and push relevant operational statistics and performance results to internal and external stakeholders in a secure manner. The division should also consider enhancements for distributing operational information to system users. This would likely reduce calls for routine information requests. Together with the other recommendations resulting from this review, these actions would help to instill a data-centric operating environment within the OTS that is more consistent with best practices observed by the reviewers in similar operations throughout the country.
FISCAL IMPACT
Because OTS already has a data dashboard, the cost for enhancements would be relatively minor. Approximately $50,000 would be needed to design and develop the data dashboard, and an additional $100,000 to implement the web-based distribution platform. An estimated 10 percent of the investment would be needed in each subsequent year for system maintenance and ongoing improvements. The following table summarizes the expected fiscal impact.
Recommendation 4-3 One-Time
Costs/ Savings
2013-14 2014-15 2015-16 2016-17 2017-18
Implement transportation data dashboard
($50,000) ($5,000) ($5,000) ($5,000) ($5,000) ($5,000)
Implement web-based operational data distribution
($100,000) ($10,000) ($10,000) ($10,000) ($10,000) ($10,000)
Total ($150,000) ($15,000) ($15,000) ($15,000) ($15,000) ($15,000)
Note: Costs are negative. Savings are positive.
C. Routing and Scheduling FCPS Board Policy 8610.8 establishes services levels for student transportation. Daily bus service is provided for all elementary students living in excess of one mile from school and for secondary school students living in excess of one and one-half miles from school. Elementary students eligible for bus transportation may be required to walk up to one mile to reach a bus stop; one and one-half miles for secondary students. Exceptions to these criteria, such as hazardous conditions, may be allowed by the superintendent. Board policy and administrative regulations also define service levels for transportation of students for special education, magnet programs, Advanced Academic Programs, field trips, and other

97
transportation needs. Changes to bus routes require parent notification at least 14 days prior to the opening of school, which drives internal decisions and deadlines earlier in the year.
Other factors, such as the staggering of bell schedules, also influence operating efficiency. Staggering bell schedules allows buses to make multiple runs each day, increasing their utilization and reducing overall costs. As previously noted, bell schedules are being studied separately by FCPS and are excluded from this review.
The board monitoring report for transportation has performance measures for on-time service, accident rates, and target maximums for the duration of bus rides to schools (30 minutes for elementary and 60 minutes for secondary). The division’s performance goal for on-time service is to have 95 percent of all bus arrivals to be within the window of acceptability. Actual performance in the FY 2012 board monitoring report was 83 percent. The performance target for bus ride duration is to fall within the maximum allowable for 100 percent of the routes. FCPS achieved 97 percent for high school routes and 86 percent for elementary routes.
The FCPS routing and scheduling function is a key element in operating an efficient transportation system. FCPS uses an automated system to support the efficient routing and scheduling of buses. This system contributes to efficient processes and also provides a wealth of management information.
One overall indicator of routing efficiency is bus utilization. The average planned capacity utilization across all individual bus runs in the FCPS system is 64 percent.10 While slightly lower than a broadly applied industry expectation of 70 percent, the “one-system” routing strategy used by OTS somewhat limits the ability of the system to achieve higher levels of capacity utilization on individual bus runs. The management strategy used to compensate for this is to maximize asset utilization in a multi-tier structure, whereby each bus is used to perform multiple bus runs each service day. Table 4.4 illustrates these results for the OTS. Regular route buses average 7.1 daily runs. The expected average in a nominal three-tier bell time stagger would be 6.0, where each bus is able to complete three morning and three afternoon bus runs. The FCPS average is considerably higher than this, and is illustrative of an efficient route structure.
10 Planned capacity utilization is measured by dividing the number of students assigned to the bus run by the available capacity of the bus; these values were derived from data extracted from the OTS route planning software program.

98
Table 4.4. Daily runs per route bus, regular routes Daily Runs Count of Buses
1 15
2 6
3 14
4 30
5 222
6 175
7 170
8 190
9 136
10 103
>10 49
Weighted Average 7.1
Source: FCPS 2013
Commendation 4-2: Establishing the accommodation of special needs transportation in the “least restrictive environment” has resulted in an improved service environment for this student population as well as enhanced efficiency.
OTS recently reorganized its planning and scheduling functions to provide a “one-system” planning methodology that effectively integrates special needs transportation planning with regular transportation. One benefit of this approach is a deliberate focus on establishing the accommodation of special needs transportation in the “least restrictive environment” as called for by the federal Individuals with Disabilities Education Act. This approach has resulted in a cultural change whereby “specialized transportation” is not the default solution for these students. OTS participates in the Individualized Education Program (IEP) planning for students and determines first if regular transportation can meet the student’s needs. The integration of transportation with the IEP process has resulted in an improved service environment for this student population as well as enhanced route efficiency.
D. Vehicle Maintenance and Bus Replacement Schedules FCPS maintains a fleet of 1,542 (including operational and spares) buses to provide transportation services to its student population. Board Policy 8611.3 establishes the maximum age for school buses:
School buses should be replaced after no more than 15 years of service as bus reliability and cost are critical considerations to a successful transportation operation.
Exceptions to the FCPS policy have been allowed for the retention of spare buses and in other exceptional circumstances.
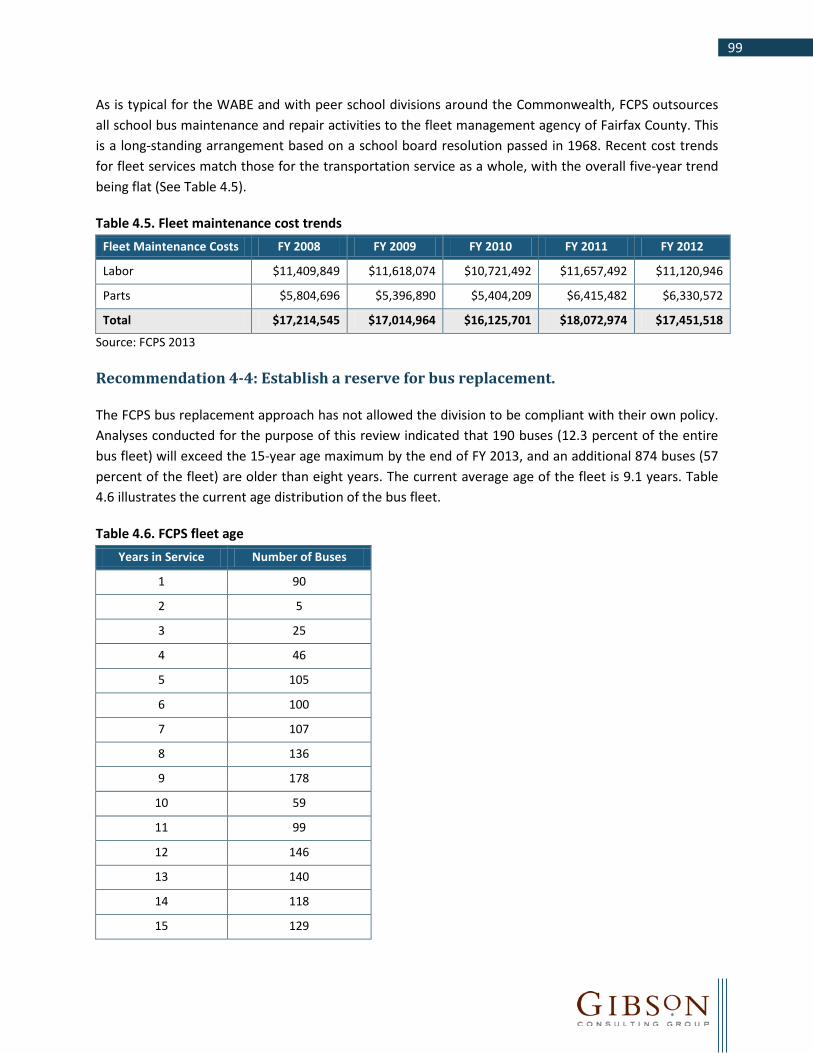
99
As is typical for the WABE and with peer school divisions around the Commonwealth, FCPS outsources all school bus maintenance and repair activities to the fleet management agency of Fairfax County. This is a long-standing arrangement based on a school board resolution passed in 1968. Recent cost trends for fleet services match those for the transportation service as a whole, with the overall five-year trend being flat (See Table 4.5).
Table 4.5. Fleet maintenance cost trends Fleet Maintenance Costs FY 2008 FY 2009 FY 2010 FY 2011 FY 2012
Labor $11,409,849 $11,618,074 $10,721,492 $11,657,492 $11,120,946
Parts $5,804,696 $5,396,890 $5,404,209 $6,415,482 $6,330,572
Total $17,214,545 $17,014,964 $16,125,701 $18,072,974 $17,451,518
Source: FCPS 2013
Recommendation 4-4: Establish a reserve for bus replacement.
The FCPS bus replacement approach has not allowed the division to be compliant with their own policy. Analyses conducted for the purpose of this review indicated that 190 buses (12.3 percent of the entire bus fleet) will exceed the 15-year age maximum by the end of FY 2013, and an additional 874 buses (57 percent of the fleet) are older than eight years. The current average age of the fleet is 9.1 years. Table 4.6 illustrates the current age distribution of the bus fleet.
Table 4.6. FCPS fleet age Years in Service Number of Buses
1 90
2 5
3 25
4 46
5 105
6 100
7 107
8 136
9 178
10 59
11 99
12 146
13 140
14 118
15 129
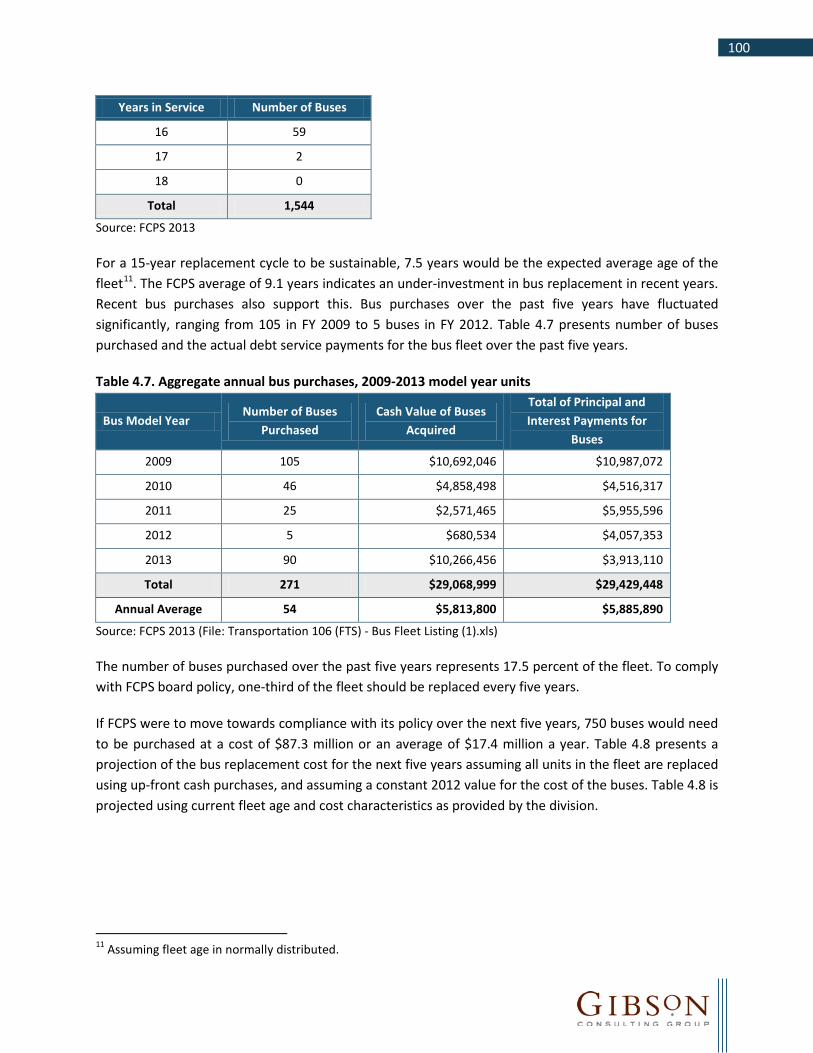
100
Years in Service Number of Buses
16 59
17 2
18 0
Total 1,544
Source: FCPS 2013
For a 15-year replacement cycle to be sustainable, 7.5 years would be the expected average age of the fleet11. The FCPS average of 9.1 years indicates an under-investment in bus replacement in recent years. Recent bus purchases also support this. Bus purchases over the past five years have fluctuated significantly, ranging from 105 in FY 2009 to 5 buses in FY 2012. Table 4.7 presents number of buses purchased and the actual debt service payments for the bus fleet over the past five years.
Table 4.7. Aggregate annual bus purchases, 2009-2013 model year units
Bus Model Year Number of Buses
Purchased Cash Value of Buses
Acquired
Total of Principal and Interest Payments for
Buses
2009 105 $10,692,046 $10,987,072
2010 46 $4,858,498 $4,516,317
2011 25 $2,571,465 $5,955,596
2012 5 $680,534 $4,057,353
2013 90 $10,266,456 $3,913,110
Total 271 $29,068,999 $29,429,448
Annual Average 54 $5,813,800 $5,885,890
Source: FCPS 2013 (File: Transportation 106 (FTS) - Bus Fleet Listing (1).xls)
The number of buses purchased over the past five years represents 17.5 percent of the fleet. To comply with FCPS board policy, one-third of the fleet should be replaced every five years.
If FCPS were to move towards compliance with its policy over the next five years, 750 buses would need to be purchased at a cost of $87.3 million or an average of $17.4 million a year. Table 4.8 presents a projection of the bus replacement cost for the next five years assuming all units in the fleet are replaced using up-front cash purchases, and assuming a constant 2012 value for the cost of the buses. Table 4.8 is projected using current fleet age and cost characteristics as provided by the division.
11 Assuming fleet age in normally distributed.

101
Table 4.8. Calculated year-over-year fleet replacement requirements
Replacement Year Count of Buses
Required Replacement Cost
(2012 value) 2013 189 $22,082,465
2014 132 $15,396,080
2015 125 $14,464,720
2016 146 $16,994,260
2017 158 $18,384,284
Total 750 $87,321,809
Average 150 $17,464,362 Source: FCPS 2013
Regular investment in bus fleet replacement is important to ensure the ongoing safety, reliability, and efficiency of transportation services. Older vehicles are less reliable, leading to an increase in breakdowns and service disruptions, as well as the need to retain a higher proportion of spare vehicles in the fleet to cover more frequent and greater duration maintenance and repair activities. Older vehicles also fail to take advantage of the latest improvements in vehicle technology for safety and environmentally conscious operation. Finally, older vehicles also become more costly to maintain. The tradeoff between the capital expenditures required to purchase replacement buses and the ongoing operational costs of repair and maintenance favor the retention of a balance whereby the fleet is distributed evenly across the range of allowable vehicle age.
FCPS and Fairfax County should consider a commitment to reinvest in bus fleet replacement through the establishment of a reserve, in addition to replenishing its fleet in the short term through financing. A reserve would provide a more stable funding source for the division and help the division comply with board policy in the long term.
In this hybrid approach, the division would continue to use the current lease financing mechanism for funding fleet replacement while also establishing a replacement reserve fund. Over time, as the reserve fund balance permits, the division could gradually replace the lease financing with self-sustaining funding from the reserve. An estimate of the associated costs would combine the estimated annual replacement reserve fund contributions with the debt service payments required to continue supporting the current fleet replacement funding mechanism.
The replacement reserve fund would require that a fixed annual amount be deposited to cover the future replacement cost of each vehicle. The amount of these annual deposits only need to cover the annual depreciation and incremental replacement cost for each unit since these amounts are spread over the entire service life of the unit. At the end of the unit’s service life, the funds required for its replacement are drawn from the fund without the need to budget for these expenditures. This has the effect of smoothing the aggregate annual amounts required to be budgeted, as the division will never have to budget for the entire cost of any one unit in any one year. Fundamentally, this approach breaks

102
the link between the amounts budgeted and the amounts actually expended on the purchase of new buses in any one year, and ensures that funds are available to replace a unit when it comes due.
FISCAL IMPACT
The actual amounts deposited for each unit should be calculated based on its depreciation expense, net of the expected salvage value, with a factor for the expected inflated cost of the replacement unit. An additional factor that can be considered in the calculation is the interest earned on funds deposited into the reserve fund and before they are withdrawn to pay for the replacement asset. Interest earned would be retained by the county.
Annual depreciation expense to maintain a balanced fleet averaging 7.5 years in age is estimated to be $7.7 million based on data provided by the division. If FCPS continues to finance its bus fleet requirements for the next five years at an assumed annual rate of 3.5 percent, using a ten-year loan term, the average principal and interest payments required would average $6.4 million annually. Combining the two – reserve fund contributions and debt service – yields an average annual expenditure of $14.1 million. This represents the annual cost of restoring the fleet over the next five years and establishing a reserve.
The county should provide $7.7 million in annual funding to establish the reserve. FCPS should increase its bus purchases through financing over the next five years to ensure compliance with board policy. Over time, substantial financing costs will be saved as the reserve grows and the need for financing is reduced.
The net fiscal impact to pursue this recommendation in the form described is illustrated below.
Recommendation 4-4 One-Time
Costs/ Savings
2013-14 2014-15 2015-16 2016-17 2017-18
Bus replacement fund startup with debt financing.
$0 ($14,100,000) ($14,100,000) ($14,100,000) ($14,100,000) ($14,100,000)
Additional revenue from county to establish replacement reserve.
$0 $7,700,000 $7,700,000 $7,700,000 $7,700,000 $7,700,000
Total $0 ($6,400,000) ($6,400,000) ($6,400,000) ($6,400,000) ($6,400,000)
Note: Costs are negative. Savings are positive.

103
Chapter 5 – Technology Management Introduction
The use of technology has enabled school systems to enhance operational, instructional and business efficiency and effectiveness. Technological advances in hardware and software, combined with increasingly affordable pricing, allow school systems of all sizes to use information systems to perform vital functions. An effective information system provides many benefits, including more efficient operations through speed of processing, increased management information and analysis to support decision-making, the ability to more seamlessly integrate programs, and provide highly efficient communication systems.
Fairfax County Public Schools (FCPS and the division) has an outstanding technology management function, one that is emulated by other major school systems. The division’s technology infrastructure, technology devices, software, project management, and service levels all represent best practices in public education. This success is the result of sound and significant investments by FCPS in the technology function. The division is clearly a national leader in this regard and is commended for establishing technology as a priority in enhancing student learning and operational efficiency. This review found no inefficiencies or other major weaknesses in the technology function. While FCPS technology expenditures are significantly higher than most other school systems, this is the result of high service levels not commonly found in public education and worthwhile investments to keep FCPS current with technological advances.
In this context, this chapter provides several commendations and one recommendation related to seven aspects of technology management:
A. Technology Administration B. Instructional and Administrative Software C. Technology Planning D. Technology Policies and Procedures E. Technical Support and Help Desk Operations F. Technology Acquisition, Donation, and Surplus Practices G. School-Based Technology Support
While other areas were included as part of the review of technology management (e.g., organization and staffing, inventory and control, system infrastructure and integration, etc.), no major commendations, findings, or recommendations resulted from the review of these areas.
FCPS’ main technology functions are distributed among two separate groups: the information technology (IT) department, led by a chief information officer that reports to the superintendent, and the instructional technology group that reports to the director of the office of professional and life skills within the instructional services department.

104
Technology related expenditures at FCPS include IT central office costs, instructional technology costs, school-based instructional technology and technical support, technology equipment, and centrally managed expenditures such as telecommunications. Collectively, technology spending at FCPS is budgeted to be $94.5 million in FY 2013, or 3.9 percent of the division’s operating budget. This level of investment relative to the total operating budget has remained constant for the past five years. Figure 5.1 shows the technology expenditures as a percent of the division’s overall expenditures since FY 2008.
Figure 5.1. Technology related expenditures as a percentage of division’s overall expenditures, FY 2008 to FY 2012
Source: FCPS Fiscal and staffing data February 2013
On a per student basis, the division’s technology related expenditures per student has declined from $556.87 to $502.57 over the past five years, a reduction of 8.9 percent. Figure 5.2 shows the technology expenditures per student for the past 5 years.
4.3% 4.2% 4.1% 4.3%
4.0%
0.0%
0.5%
1.0%
1.5%
2.0%
2.5%
3.0%
3.5%
4.0%
4.5%
5.0%
FY 2008 FY 2009 FY 2010 FY 2011 FY 2012
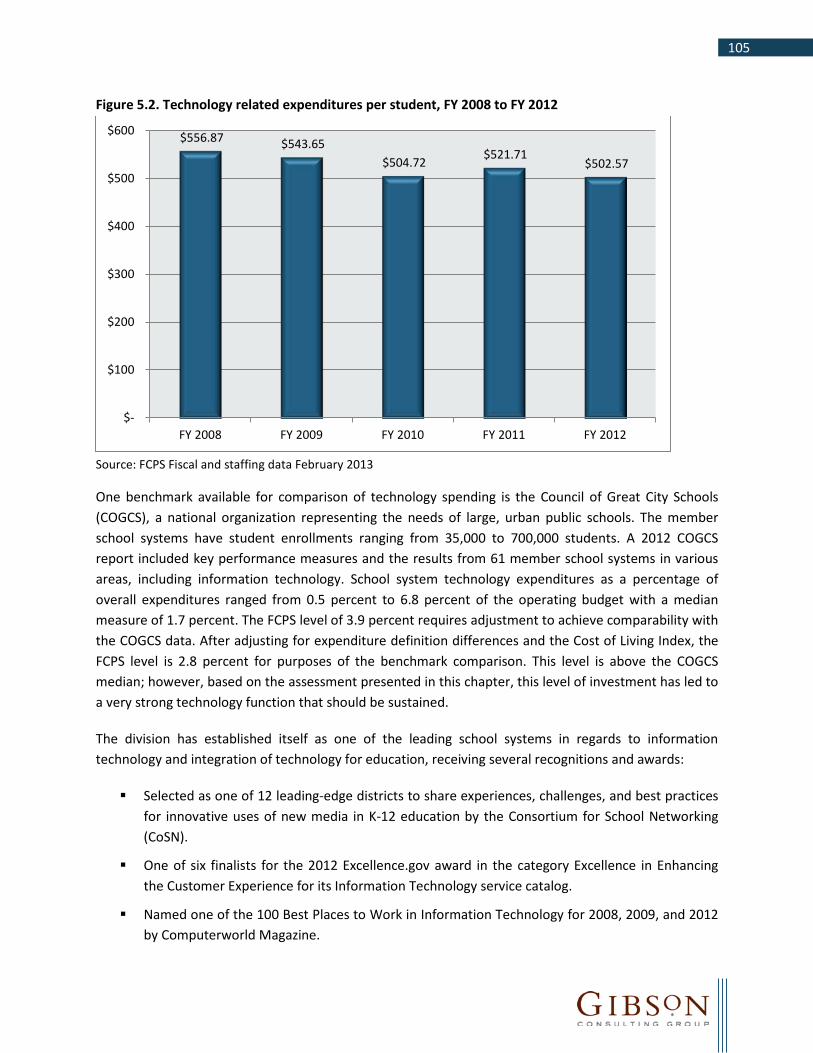
105
Figure 5.2. Technology related expenditures per student, FY 2008 to FY 2012
Source: FCPS Fiscal and staffing data February 2013
One benchmark available for comparison of technology spending is the Council of Great City Schools (COGCS), a national organization representing the needs of large, urban public schools. The member school systems have student enrollments ranging from 35,000 to 700,000 students. A 2012 COGCS report included key performance measures and the results from 61 member school systems in various areas, including information technology. School system technology expenditures as a percentage of overall expenditures ranged from 0.5 percent to 6.8 percent of the operating budget with a median measure of 1.7 percent. The FCPS level of 3.9 percent requires adjustment to achieve comparability with the COGCS data. After adjusting for expenditure definition differences and the Cost of Living Index, the FCPS level is 2.8 percent for purposes of the benchmark comparison. This level is above the COGCS median; however, based on the assessment presented in this chapter, this level of investment has led to a very strong technology function that should be sustained.
The division has established itself as one of the leading school systems in regards to information technology and integration of technology for education, receiving several recognitions and awards:
Selected as one of 12 leading-edge districts to share experiences, challenges, and best practices for innovative uses of new media in K-12 education by the Consortium for School Networking (CoSN).
One of six finalists for the 2012 Excellence.gov award in the category Excellence in Enhancing the Customer Experience for its Information Technology service catalog.
Named one of the 100 Best Places to Work in Information Technology for 2008, 2009, and 2012 by Computerworld Magazine.
$556.87 $543.65 $504.72 $521.71
$502.57
$-
$100
$200
$300
$400
$500
$600
FY 2008 FY 2009 FY 2010 FY 2011 FY 2012
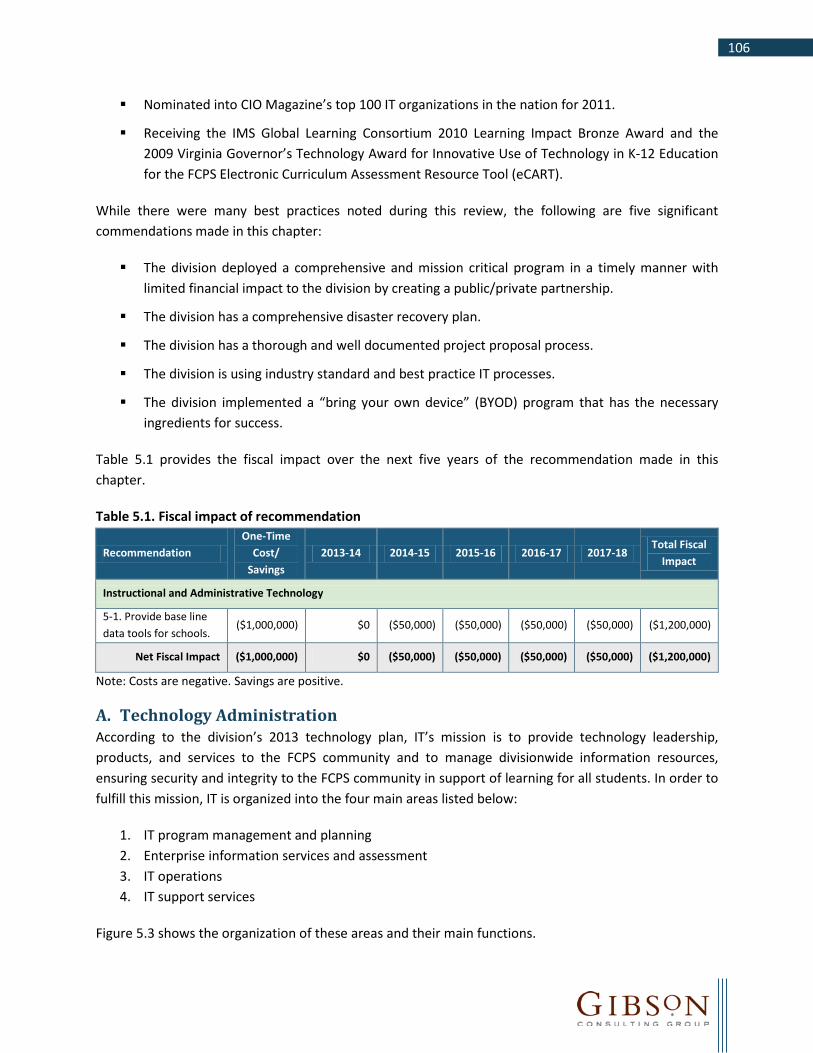
106
Nominated into CIO Magazine’s top 100 IT organizations in the nation for 2011.
Receiving the IMS Global Learning Consortium 2010 Learning Impact Bronze Award and the 2009 Virginia Governor’s Technology Award for Innovative Use of Technology in K-12 Education for the FCPS Electronic Curriculum Assessment Resource Tool (eCART).
While there were many best practices noted during this review, the following are five significant commendations made in this chapter:
The division deployed a comprehensive and mission critical program in a timely manner with limited financial impact to the division by creating a public/private partnership.
The division has a comprehensive disaster recovery plan.
The division has a thorough and well documented project proposal process.
The division is using industry standard and best practice IT processes.
The division implemented a “bring your own device” (BYOD) program that has the necessary ingredients for success.
Table 5.1 provides the fiscal impact over the next five years of the recommendation made in this chapter.
Table 5.1. Fiscal impact of recommendation
Recommendation One-Time
Cost/ Savings
2013-14 2014-15 2015-16 2016-17 2017-18 Total Fiscal
Impact
Instructional and Administrative Technology
5-1. Provide base line data tools for schools.
($1,000,000) $0 ($50,000) ($50,000) ($50,000) ($50,000) ($1,200,000)
Net Fiscal Impact ($1,000,000) $0 ($50,000) ($50,000) ($50,000) ($50,000) ($1,200,000)
Note: Costs are negative. Savings are positive.
A. Technology Administration According to the division’s 2013 technology plan, IT’s mission is to provide technology leadership, products, and services to the FCPS community and to manage divisionwide information resources, ensuring security and integrity to the FCPS community in support of learning for all students. In order to fulfill this mission, IT is organized into the four main areas listed below:
1. IT program management and planning 2. Enterprise information services and assessment 3. IT operations 4. IT support services
Figure 5.3 shows the organization of these areas and their main functions.

107
Figure 5.3. FCPS IT department organization structure
Chief Information Officer
IT Program Management and PlanningIT Support Services
Multimedia Service Center
Technology Support Service Center
IT FASTeam
Customer Service Center
Project Management
Services
Enterprise Information Services and Assessment
Business Systems
Student Systems
Instructional Systems
Data Services
Decision Support
Document Management
Technology Architecture and
Assessment
IT Operations
Field Information Systems
Field Services
Network and Systems Services
Computing Services
Source: FCPS information technology department, August 2012

108
The IT support services group is responsible for managing the customer service function for the department, providing technical services and support to schools, administrative offices, and the larger FCPS community. The services and support include the IT service desk, school-based technology support specialists (TSSpec) in the schools and administrative offices, support for system-wide software applications, project management, and media, production and computer training. The TSSpecs provide on-site technology support in all schools, centers and administrative offices. Their support activities include local server administration, desktop, operating system and network troubleshooting, software and computer installation, and consultation and local support for technology operations essential for teaching and learning.
The enterprise information services and assessment group provides operational support for over 150 major information systems covering all aspects of school division operations such as student information, libraries, transportation, food services, human resources, payroll, facilities planning, finance, special education, and instructional management. In addition, the group supports the assessment and piloting of new and emerging information technology systems, products, and services for schools and administrative sites.
The information technology operations unit is responsible for providing design, installation, operation, maintenance, and repair services for FCPS information technology infrastructure. This group’s responsibilities include configuring and operating the wide area network, local area networks, wireless networks, fire and security systems, voice systems, public address systems, and cable television (CATV) systems. This group also manages the division’s network operating centers; the Wilton Woods Network Operation Center (WWNC) is operational 24 hours a day, seven days per week (24/7). FCPS’ divisionwide systems such as e-mail, Internet and Intranet servers, and student information system reside in this center. This group is also responsible for the hardware break/fix for computers and all other peripherals including printers, audiovisual equipment, telephones, network switches, wireless access points, and projectors.
The office of information technology program management and planning works with the IT department’s leadership on IT budgeting by providing financial planning and support on using and compliance with different funds. The group manages all technology contracts, including hardware and maintenance, IT professional and telecommunications services, and instructional and administrative software licenses. The group also places procurement orders for the information technology department.
Based on the 2012 Operational Expectations Monitoring Report to the board, FCPS’ IT department reported 22 performance measures regarding information technology. A representative sample of the measures included in the monitoring report is listed in Table 5.2.
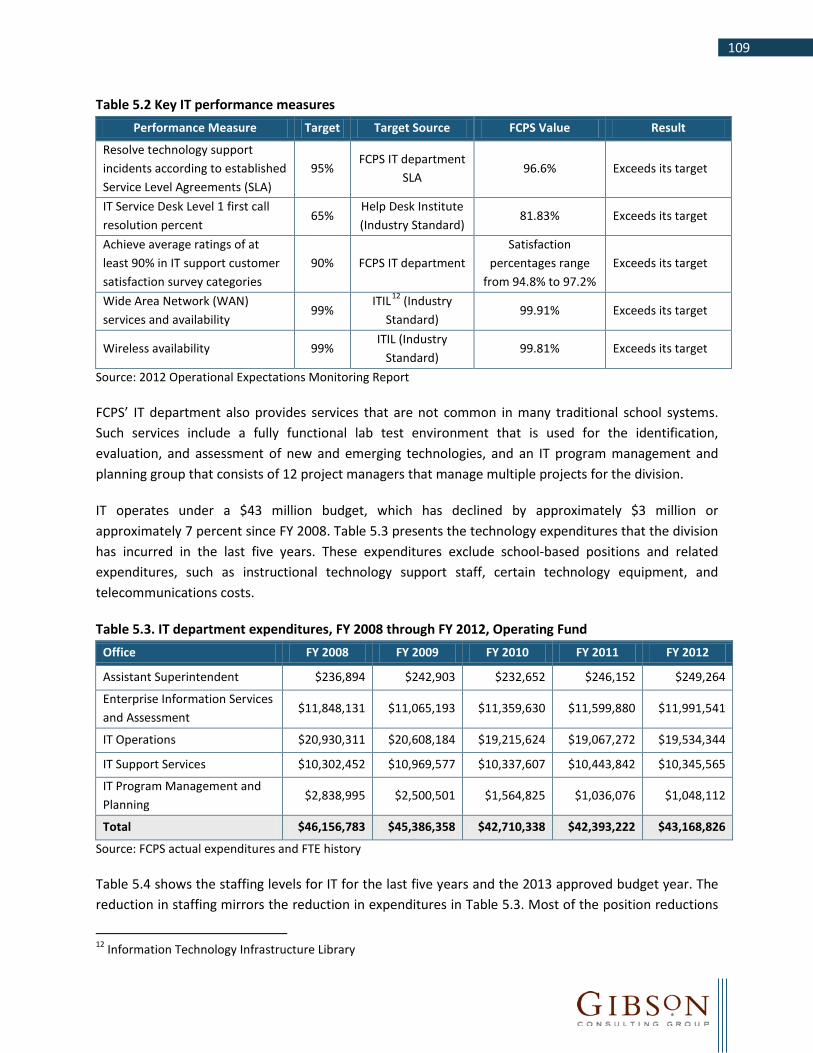
109
Table 5.2 Key IT performance measures Performance Measure Target Target Source FCPS Value Result
Resolve technology support incidents according to established Service Level Agreements (SLA)
95% FCPS IT department
SLA 96.6% Exceeds its target
IT Service Desk Level 1 first call resolution percent
65% Help Desk Institute (Industry Standard)
81.83% Exceeds its target
Achieve average ratings of at least 90% in IT support customer satisfaction survey categories
90% FCPS IT department Satisfaction
percentages range from 94.8% to 97.2%
Exceeds its target
Wide Area Network (WAN) services and availability
99% ITIL12 (Industry
Standard) 99.91% Exceeds its target
Wireless availability 99% ITIL (Industry
Standard) 99.81% Exceeds its target
Source: 2012 Operational Expectations Monitoring Report
FCPS’ IT department also provides services that are not common in many traditional school systems. Such services include a fully functional lab test environment that is used for the identification, evaluation, and assessment of new and emerging technologies, and an IT program management and planning group that consists of 12 project managers that manage multiple projects for the division.
IT operates under a $43 million budget, which has declined by approximately $3 million or approximately 7 percent since FY 2008. Table 5.3 presents the technology expenditures that the division has incurred in the last five years. These expenditures exclude school-based positions and related expenditures, such as instructional technology support staff, certain technology equipment, and telecommunications costs.
Table 5.3. IT department expenditures, FY 2008 through FY 2012, Operating Fund Office FY 2008 FY 2009 FY 2010 FY 2011 FY 2012
Assistant Superintendent $236,894 $242,903 $232,652 $246,152 $249,264
Enterprise Information Services and Assessment
$11,848,131 $11,065,193 $11,359,630 $11,599,880 $11,991,541
IT Operations $20,930,311 $20,608,184 $19,215,624 $19,067,272 $19,534,344
IT Support Services $10,302,452 $10,969,577 $10,337,607 $10,443,842 $10,345,565
IT Program Management and Planning
$2,838,995 $2,500,501 $1,564,825 $1,036,076 $1,048,112
Total $46,156,783 $45,386,358 $42,710,338 $42,393,222 $43,168,826
Source: FCPS actual expenditures and FTE history
Table 5.4 shows the staffing levels for IT for the last five years and the 2013 approved budget year. The reduction in staffing mirrors the reduction in expenditures in Table 5.3. Most of the position reductions
12 Information Technology Infrastructure Library

110
resulted from imposed cuts on the department in FY 2011. The counts in Table 5.4 do not include school-based positions that report to school principals and provide technology support in the schools. School-based positions and support functions are discussed later in this chapter.
Table 5.4. IT department staffing trends, FY 2008 through FY 2013 Office FY 2008 FY 2009 FY 2010 FY 2011 FY 2012 FY 2013
Assistant Superintendent 2.0 2.0 2.0 2.0 2.0 2.0
Enterprise Information Services and Assessment
67.0 67.0 78.0 72.0 72.0 72.0
IT Operations 129.0 130.0 129.0 124.0 124.0 124.0
IT Support Services 98.5 100.5 93.5 88.5 88.5 91.5
IT Program Management and Planning 26.0 26.0 14.0 12.0 12.0 12.0
Total 322.5 325.5 316.5 298.5 298.5 301.5
Source: FCPS actual expenditures and FTE history
B. Instructional and Administrative Software The division has more than 150 divisionwide administrative and instructional software systems that support FCPS students and staff. Student information, finance and human resources, and curriculum and assessment systems are examples of the software systems that perform critical functions and are used by a majority of users within the division.
FCPS is in the fifth and last stage of replacing its student information system (SIS). All FCPS elementary schools are using the new SIS system and secondary schools are scheduled to be converted to the new SIS in the 2013-14 school year.
Fairfax County and FCPS implemented a financial management system that supports finance, budget, procurement, and related administrative functions. The project was called Fairfax County Unified System (FOCUS). Most FOCUS modules have been fully implemented at FCPS; the budget and transparency modules are still in process of being implemented.
FCPS originally planned to use the same new human resources information system as the county. However, because of functional requirements unique to school systems and the related cost of customization, FCPS and the county jointly decided to upgrade the division’s current human resources information system instead.
Every year, based on user requests and or needs, the division’s IT department evaluates and adds various instructional and administrative applications to the list of applications they support.

111
Commendation 5-1: The division deployed a comprehensive and mission critical program in a timely manner with limited financial impact to the division by creating a public/private partnership.
The division uses an electronic curriculum and assessment toolset called eCART. This toolset provides teachers with a single point of access to integrated curriculum, resources, and a formative assessment application.
FCPS’ IT department, through a public/private partnership arrangement, designed and developed eCART to provide teachers with a single point of access to integrated curricula and resources, including formative assessment software applications. The eCART program is comprised of four components including an FCPS-developed Curriculum Repository and a patented FCPS Education Decision Support Library (EDSL). A learning technologies firm, BlackBoard Inc., developed the 24/7 learning portal component of eCART, while the aerospace and defense technology firm, Northrop Grumman, developed the formative assessment component of the program.
The partnership arrangement required FCPS to provide instructional expertise for the development of the tool, while Northrop Grumman provided software development expertise. The development of the assessment engine, now known as Horizon, was free of charge to FCPS and the division was granted a perpetual license at no cost. The division pays Northrop Grumman annual maintenance and operations costs for the Horizon component. Though IT does not know how much the development of Horizon actually cost Northrop Grumman, they estimate that the division would have incurred approximately $1.8 million to enhance the assessment tool being used at the time to meet its needs.
Prior to the development of eCART, the division was incurring over $900,000 annually to conduct its formative assessments which were limited to Reading and Mathematics in Grades 3 through 8. The eCART solution provides assessments for 169 subjects covering all grade levels, with online results provided immediately as opposed to paper-pencil results provided within 24 to 48 hours. In 2011-12, the division completed almost 3.5 million individual assessments using eCART and its assessment component.
Recommendation 5-1: Develop a divisionwide analytical tool for schools to analyze student, sub-group, and school-level information from various sources.
EDSL provides data and reports such as membership, demographics, attendance, discipline, and formative and summative assessments through the eCART system. Users can download reports and data from the eCART system. Although reports are useful, many school administrators and teachers are looking for ways to go beyond these set reports. Users want to be able to access information at the individual student level, create visualizations, use filters, and customize reports. School administrators and teachers stated that the eCART system does not have a data analysis tool that they can use to perform these functions and desired analyses. Users report that they pull data from the eCART system and transfer it to spreadsheets for analysis and creating customized reports. This can be a time
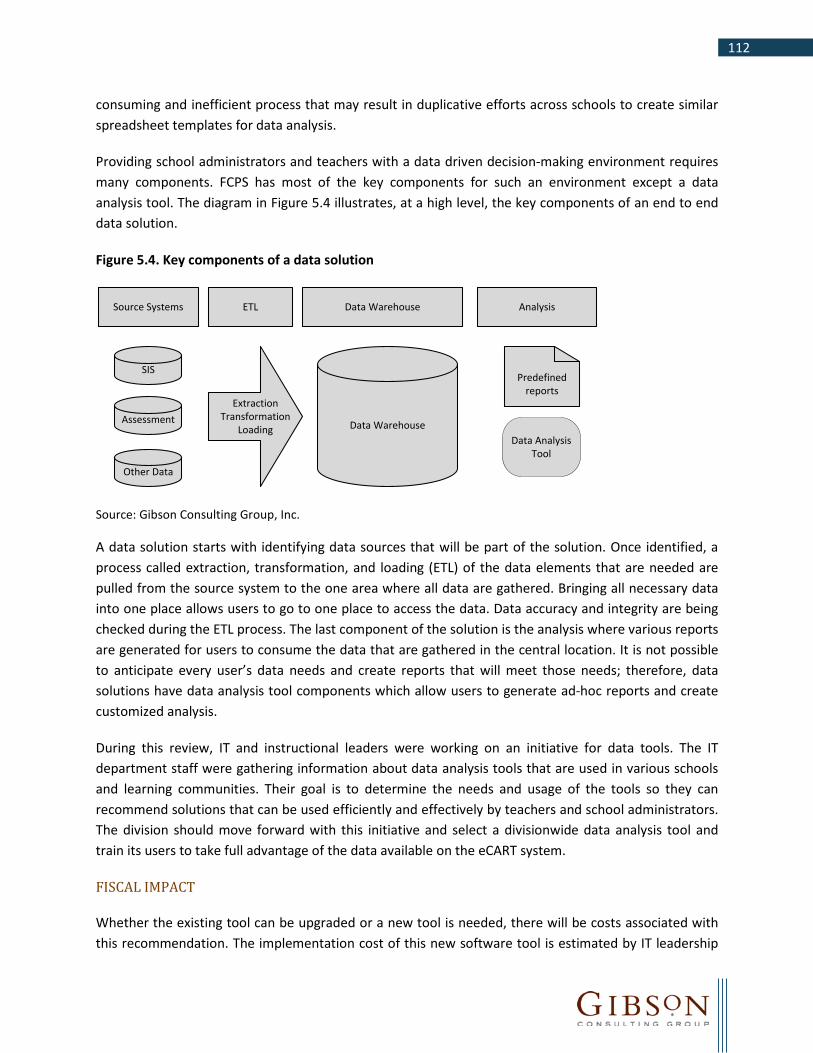
112
consuming and inefficient process that may result in duplicative efforts across schools to create similar spreadsheet templates for data analysis.
Providing school administrators and teachers with a data driven decision-making environment requires many components. FCPS has most of the key components for such an environment except a data analysis tool. The diagram in Figure 5.4 illustrates, at a high level, the key components of an end to end data solution.
Figure 5.4. Key components of a data solution
SIS
Assessment
Other Data
Source Systems ETL
Data Warehouse
Data Warehouse Analysis
ExtractionTransformation
Loading
Predefined reports
Data Analysis Tool
Source: Gibson Consulting Group, Inc.
A data solution starts with identifying data sources that will be part of the solution. Once identified, a process called extraction, transformation, and loading (ETL) of the data elements that are needed are pulled from the source system to the one area where all data are gathered. Bringing all necessary data into one place allows users to go to one place to access the data. Data accuracy and integrity are being checked during the ETL process. The last component of the solution is the analysis where various reports are generated for users to consume the data that are gathered in the central location. It is not possible to anticipate every user’s data needs and create reports that will meet those needs; therefore, data solutions have data analysis tool components which allow users to generate ad-hoc reports and create customized analysis.
During this review, IT and instructional leaders were working on an initiative for data tools. The IT department staff were gathering information about data analysis tools that are used in various schools and learning communities. Their goal is to determine the needs and usage of the tools so they can recommend solutions that can be used efficiently and effectively by teachers and school administrators. The division should move forward with this initiative and select a divisionwide data analysis tool and train its users to take full advantage of the data available on the eCART system.
FISCAL IMPACT
Whether the existing tool can be upgraded or a new tool is needed, there will be costs associated with this recommendation. The implementation cost of this new software tool is estimated by IT leadership

113
to range from $250,000 (eCART upgrade) to $1,000,000 (new system). Some of the variables that will determine the cost are software license fees based on the number of users, any new hardware needed, consulting fees, software support, and training. The high end of this range is used for purposes of estimating a conservative fiscal impact for the new system. An estimate of $50,000 per year will be needed after implementation for system maintenance.
Recommendation 5-1 One-Time
Costs/ Savings
2013-14 2014-15 2015-16 2016-17 2017-18
Develop a divisionwide analytical tool.
($1,000,000) $0 ($50,000) ($50,000) ($50,000) ($50,000)
Note: Costs are negative. Savings are positive.
C. Technology Planning FCPS has a technology plan that aligns not only with the division’s overall mission, vision, objectives, and priorities but also aligns with the Virginia State Board of Education’s Educational Technology Plan. The plan is developed mainly by the Joint Technology Committee (JTC) and is reviewed and updated annually. The JTC is comprised of representatives from all FCPS departments and school administrators. Among other things, the plan includes funding information on new and continuing technology initiatives. In addition to educational technology plans, many school systems develop comprehensive disaster recovery plans to address how they will recover their mission critical systems and functions in the event of a disaster. The division has a comprehensive disaster recovery plan that includes all necessary components and is updated as needed.
Commendation 5-2: The division has a comprehensive disaster recovery plan.
FCPS has a formalized disaster recovery plan that covers divisionwide critical services. This plan is essential for FCPS to effectively react to, and quickly resume operations in the event of, a disaster.
FCPS uses WWNC as their main data center. WWNC has the necessary characteristics of an industry standard data center such as raised floors, redundant cooling and power systems, and a waterless fire prevention system. It is also maintained and used 24/7 by the division’s information technology staff. In 2009, the division added the Fairfax Ridge Center, which allowed the division to create a redundancy for their data center. With this capability, the division’s core services and systems can recover and become functional in the event of a disaster that may affect one of the data centers.
In addition to industry specific facilities, the division has IT staff assigned to various roles in the disaster recovery plan and part of the disaster recovery team. The plan identifies roles and responsibilities of key personnel and has detailed information regarding how to reach and communicate with contacts within and outside the division such as vendors, fire and police departments, and county and other governmental staff. The plan addresses procedures regarding notifications and activations which are critical for successful communication in the event of a disaster. The disaster recovery team updates the plan as new application servers are added and configured to the division’s technical infrastructure.
114
One of the most important keys to a successful disaster recovery plan is to have a clear understanding between IT and user departments in terms of identifying what systems and services are critical and also what acceptable recovery time, or down time, is for each system or service. The FCPS IT department manages this by using a business impact analysis (BIA) process. The heart of the process is the BIA form in which IT works with user departments to capture key information. Some of the information captured through the BIA process includes:
System or service name System or service owner /sponsor The staff that supports the system or service within IT System or service main users System or services function also known as vital business functions Impact if the system or service was unavailable from the below perspectives:
- Business - Instruction - Security - Legal - Safety - Public - Data Loss - Other
System or services hardware inventory, operating systems, applications, databases, backup procedures, software vendors’ service level agreements, hardware vendors’ service level agreements, and replacement commitments
System or services dependencies from network, hardware, data and software point of view System or services recovery resources in terms of internal IT staff and vendor Maximum tolerable period of disruption Recovery time objective
The division uses the appropriate amount of resources and meets users’ recovery expectation through the implementation of the BIA process.
D. Technology Policies and Procedures The division’s IT department has several written procedures and regulations that explain critical and important technology related functions in detail. Key benefits of having written procedures include the ability to provide consistent service, compliance with regulations, and the ability to institutionalize the knowledge so it will not be lost with the departure of key staff.
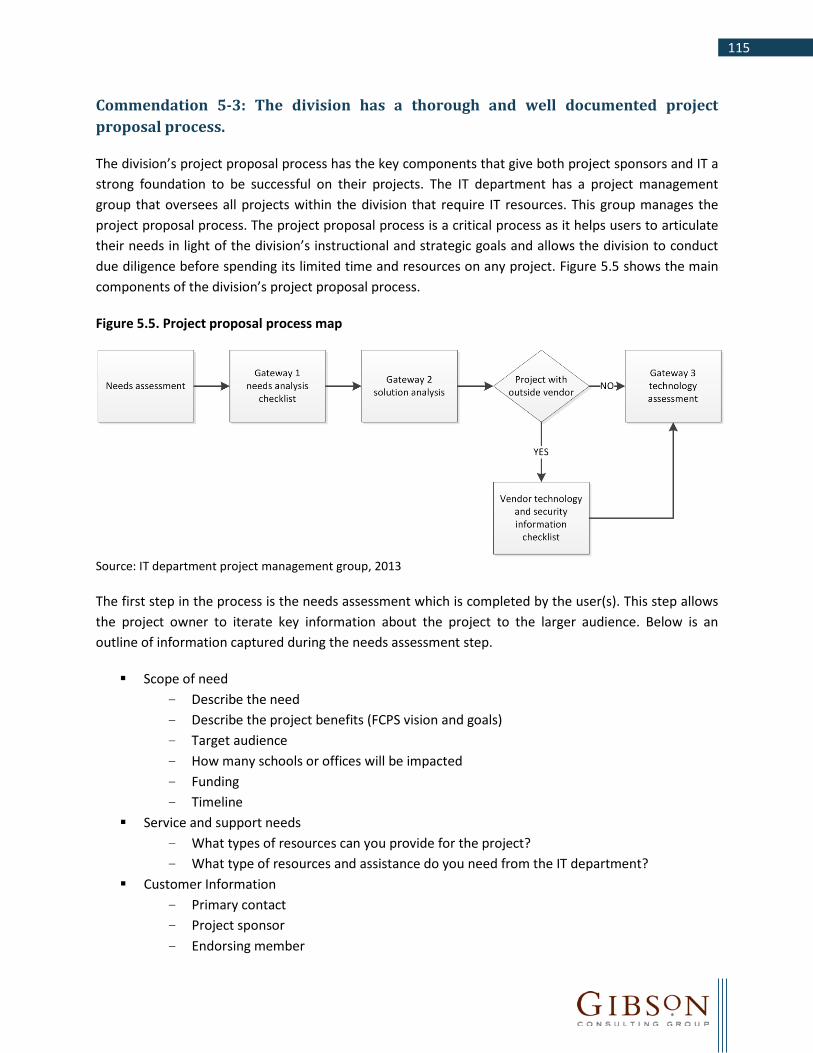
115
Commendation 5-3: The division has a thorough and well documented project proposal process.
The division’s project proposal process has the key components that give both project sponsors and IT a strong foundation to be successful on their projects. The IT department has a project management group that oversees all projects within the division that require IT resources. This group manages the project proposal process. The project proposal process is a critical process as it helps users to articulate their needs in light of the division’s instructional and strategic goals and allows the division to conduct due diligence before spending its limited time and resources on any project. Figure 5.5 shows the main components of the division’s project proposal process.
Figure 5.5. Project proposal process map
Source: IT department project management group, 2013
The first step in the process is the needs assessment which is completed by the user(s). This step allows the project owner to iterate key information about the project to the larger audience. Below is an outline of information captured during the needs assessment step.
Scope of need - Describe the need - Describe the project benefits (FCPS vision and goals) - Target audience - How many schools or offices will be impacted - Funding - Timeline
Service and support needs - What types of resources can you provide for the project? - What type of resources and assistance do you need from the IT department?
Customer Information - Primary contact - Project sponsor - Endorsing member

116
Based on the information gathered during the needs assessment step, the project management team puts the project through a three-step vetting process called “three gateways”.
Gateway 1: the project management team reviews the user’s needs and creates a project scope document. The scope helps identify potential resources and solutions for the project. Also in this step, the team verifies the information provided by the project sponsor and collects additional information that is necessary for the scope of the project.
Gateway 2: the project management team reviews the proposed project and tries to find a solution that will deliver the highest value with the least amount of resources. During this step the team looks to see if the division’s existing application(s) or solution(s) can address the project’s needs. If there is no existing application, the team seeks to determine if an off-the-shelf commercial product(s) can be used to address the needs of the users. The team recommends a custom development solution if there is no reasonable way to address user’s needs with an existing solution. If the recommended solution involves utilizing a vendor, the division requests detailed technical information from the vendor in order to properly asses the project. The information collected during this step includes hardware, software, network, database, security, support, and training.
Gateway 3: the project management team identifies the technical components (e.g., servers, support, and network) of the solution. IT determines what technologies are going to be used and their impact on the existing technology infrastructure.
Upon completion of these steps the department sends the recommended solutions to be reviewed by the division’s senior leadership for consideration and approval to proceed as a project. This process ensures the proposed project will work with the existing technology of the division, that there are no duplicative solutions within the division, and if there is an existing solution, the division can purchase it rather than building one.
E. Technology Support and Help Desk Operations The division’s IT service desk is the single point of contact for all information technology requests. The IT service desk serves as the day-to-day technology liaison between FCPS’ teachers, administrators, central office staff, school board members, and IT support groups. The IT service desk uses a three-tiered level of support. TSSpecs and school-based instructional technology support specialists (SBTS) act as the level 1 support in schools (discussed later in this chapter). If they cannot resolve the request or the issue, it is escalated to level 2 support, which is provided by various central IT groups depending upon the nature of the issue or request. If they cannot address the issue, level 3 support, which consists of senior level technical staff from various IT groups, will attempt to resolve the issue. The division’s technology support and help desk operations use a service level agreement that defines response and resolution timeframes for various levels of priorities that are assigned to service requests. IT uses a help desk ticketing system to monitor the compliance with the service level agreement and vital statistics of the support such as number of open requests, number of requests by technician, request type etc. FCPS staff can use the ticketing system to initiate a request and also track the status of their request. The
117
division’s IT department uses systems and processes to streamline their technology support and help desk operations.
Commendation 5-4: The division is using industry standard and best practice IT processes.
FCPS has adapted and implemented industry standard and best practice processes and frameworks for IT service management and related areas. The division’s IT department is using Information Technology Infrastructure Library (ITIL) frameworks and processes to deliver IT services to its customers. The ITIL is a set of practices for IT service management that focuses on aligning IT services with the needs of an organization. ITIL practices are accepted and adopted internationally and nationally by IT organizations for best practice and standards.
FCPS has documented processes including service catalog management, request fulfillment management, incident management, change management, IT services continuity management, information security management and more.
Service catalog management is where an IT organization creates a list of services that it provides based on the needs of its users. This list is communicated to the users and the key decision makers to ensure they know which department within IT delivers what services. This process is closely related to service level management where IT departments communicate the time frame in which they would respond if these services were interrupted or affected. Service catalog management also allows both IT management and other key FCPS management to make capacity decisions in terms of IT staffing. If there are more services added to the IT service catalog, these services are expected to be serviced in an expedited manner. This may increase the workload of the current IT staff and may cause service response issues. The FCPS IT department has an IT service catalog and a service level agreement that aligns with that catalog.
As part of the request fulfillment management process, FCPS has created a single point of contact for IT requests where all IT requests come to an IT service desk and users are serviced and/or routed to the proper destination. Request fulfillment management processes tie to the incident management process where the requests may become incidents. Based on the documented ITIL process, the IT service desk identifies the incidents, then logs, categorizes, and prioritizes them. The FCPS IT service desk also functions as level 1 support – diagnosing incidents and attempting to solve them. If the incident requires escalation, they escalate the incident to level 2 or level 3 support groups which are higher in technical competency respectively or to another group that may be specialized in that particular incident.
Change management process is a process that brings various IT groups and the user departments together. The key to this process is the change advisory board (CAB). CAB allows different functional IT teams to get together and discuss how certain changes in hardware, software, network or any other significant IT area will affect the system. Change management processes facilitate and improve communication and collaboration among IT functional areas and users.
118
IT services continuity management and information security management processes exist to ensure that IT services can recover and continue should a serious incident occur. The division is using these processes in developing and maintaining their disaster recovery plan.
These processes help FCPS’ IT department provide quality customer service, streamline operations, better align IT resources with FCPS needs, and improve communication and coordination among various areas of IT as well as the customer. Many FCPS IT managers are ITIL trained and certified. They also created an internal website that includes all documentation surrounding the frameworks and processes that will serve as a knowledge base to all staff.
F. Technology Acquisition, Donations, and Surplus Practices As of November 2012, FCPS maintained a computer inventory of more than 140,000 computers. The inventory also includes 1,600 servers, 8,700 electronic whiteboards, 13,500 projectors, and more than 6,000 registered devices registered through the division’s BYOD program.
FCPS uses the Automated Computer Inventory Systems (ACIS) to collect and maintain information about the number and types of computers at every site. Principals and program managers certify their computer inventory twice per year and prioritize the need for replacement computers. This inventory is used to make educational and administrative decisions related to allocating, distributing, servicing, and replacing computers. In order to enhance and augment student access to online digital instructional resources, the division began allowing students to bring in personally-owned computing devices in August 2011.
Commendation 5-5: The division implemented a BYOD program that has the necessary ingredients for success.
FCPS implemented its BYOD program that has the necessary ingredients for success. Many school systems are deploying BYOD programs to have more and current technologies in the hands of its students. BYOD programs allow students to have access to instructional materials anywhere, anytime and also creates smooth transitions between home and school in terms of access to instruction. There are several key factors for successful BYOD program implementation. FCPS has identified and implemented these key factors:
Involving key stakeholders from the beginning: FCPS ensured parents, teachers, instructional leaders, and technical staff that will support the infrastructure, as well as the technical staff who will support the program in schools, were involved in the process.
Preparing for a robust wireless and security infrastructure: FCPS created a technical infrastructure to support devices regardless of brand or type while maintaining its security and compliance needs.
Developing user friendly, yet comprehensive, procedures regarding the program: FCPS has created forms and a registration process to accept devices into the system. They also assigned

119
roles and responsibilities to their technical staff and trained them on how to implement these procedures.
Adopting and developing instructional resources that are device agnostic: FCPS’ IT and instructional services departments are working together to create a list of instructional applications that are safe and suitable for the division to use.
Developing professional development for educators to use and integrate these tools and applications: FCPS has identified professional development needs of staff systemwide and is using SBTS to provide support and professional development for the applications and tools educators are using.
Table 5.5 shows the number of devices that are registered with the division in each level.
Table 5.5. Number of registered devices under the BYOD program Type of Site Number of Devices
Elementary Schools 2,573
Middle Schools 2,537
High Schools 955
Special Schools 551
Administration 29
Total 6,645
Source: IT Department Request IT support report, April 2013
Note: Number of devices registered between September 2012 and April 2013
According to IT, more devices are being registered in the division every month. In order to engage students outside the normal school times and in line with its BYOD program, the division has chosen a device agnostic cloud-based application for students and teachers to store files and collaborate on documents, spreadsheets, and presentations from school or home. By allowing students to bring their own devices, to augment the existing technologies in their schools and by using online applications, FCPS is working towards creating a 21st century learning environment.
G. School-Based Technology Support School-based technology support is provided by TSSpecs who report to the information technology department and SBTS who report to their school leadership. While SBTS positions report to their school leadership, they work very closely with non-school based instructional technology staff. Instructional technology’s central office staff includes nineteen members led by the Instructional technology coordinator who reports to director of professional and life skills under the instructional services department (see Figure 5.6).

120
Figure 5.6. FCPS instructional technology integration office organization structure
Office of Professional and Life
Skills Director
Instructional Technology Coordinator
SBTS Elementary and Secondary
Program Manager
Instructional Technology
Education Specialist
eCART TeamProgram Manager
FCPS 24-7 LearningEducation Specialist
Instructional Technology
Education Specialists
Instructional TechnologyIntegration Specialist
Source: FCPS, February 2013
SBTS provide ongoing staff development to all teachers at their schools. Their training focuses on how to best integrate technology into instruction to individualize learning and improve student achievement. SBTS’ activities include modeling effective uses of instructional technology, co-teaching collaboratively planned lessons, collaboration with teachers and administrators, assisting with curriculum integration of software and hardware in instruction, and supporting divisionwide technology initiatives. Non-school based division instructional technology staff provide mentoring, professional training, and support for SBTS so they can serve teachers and administrators. SBTS also play a key technology support role in elementary schools where there are no full time TSSpecs.
The TSSpecs work closely with SBTS to provide primary technology support to the division’s schools, departments, and programs.
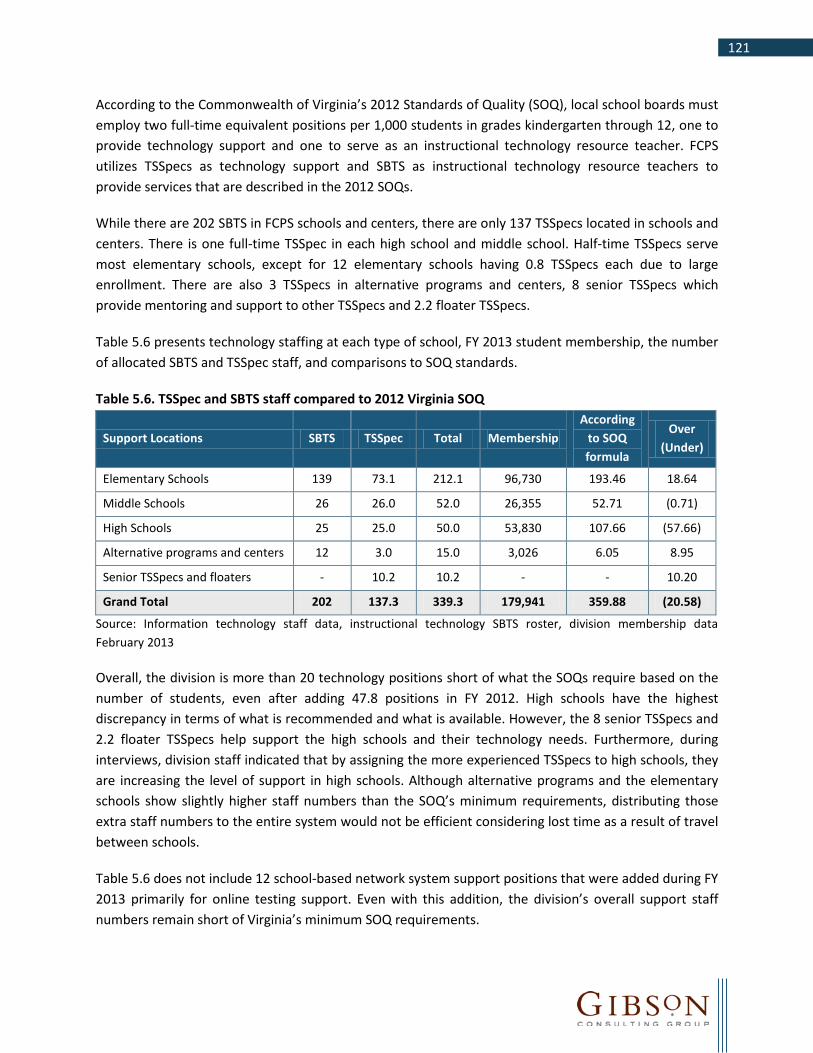
121
According to the Commonwealth of Virginia’s 2012 Standards of Quality (SOQ), local school boards must employ two full-time equivalent positions per 1,000 students in grades kindergarten through 12, one to provide technology support and one to serve as an instructional technology resource teacher. FCPS utilizes TSSpecs as technology support and SBTS as instructional technology resource teachers to provide services that are described in the 2012 SOQs.
While there are 202 SBTS in FCPS schools and centers, there are only 137 TSSpecs located in schools and centers. There is one full-time TSSpec in each high school and middle school. Half-time TSSpecs serve most elementary schools, except for 12 elementary schools having 0.8 TSSpecs each due to large enrollment. There are also 3 TSSpecs in alternative programs and centers, 8 senior TSSpecs which provide mentoring and support to other TSSpecs and 2.2 floater TSSpecs.
Table 5.6 presents technology staffing at each type of school, FY 2013 student membership, the number of allocated SBTS and TSSpec staff, and comparisons to SOQ standards.
Table 5.6. TSSpec and SBTS staff compared to 2012 Virginia SOQ
Support Locations SBTS TSSpec Total Membership According
to SOQ formula
Over (Under)
Elementary Schools 139 73.1 212.1 96,730 193.46 18.64
Middle Schools 26 26.0 52.0 26,355 52.71 (0.71)
High Schools 25 25.0 50.0 53,830 107.66 (57.66)
Alternative programs and centers 12 3.0 15.0 3,026 6.05 8.95
Senior TSSpecs and floaters - 10.2 10.2 - - 10.20
Grand Total 202 137.3 339.3 179,941 359.88 (20.58)
Source: Information technology staff data, instructional technology SBTS roster, division membership data February 2013
Overall, the division is more than 20 technology positions short of what the SOQs require based on the number of students, even after adding 47.8 positions in FY 2012. High schools have the highest discrepancy in terms of what is recommended and what is available. However, the 8 senior TSSpecs and 2.2 floater TSSpecs help support the high schools and their technology needs. Furthermore, during interviews, division staff indicated that by assigning the more experienced TSSpecs to high schools, they are increasing the level of support in high schools. Although alternative programs and the elementary schools show slightly higher staff numbers than the SOQ’s minimum requirements, distributing those extra staff numbers to the entire system would not be efficient considering lost time as a result of travel between schools.
Table 5.6 does not include 12 school-based network system support positions that were added during FY 2013 primarily for online testing support. Even with this addition, the division’s overall support staff numbers remain short of Virginia’s minimum SOQ requirements.

122
It is important to note, however, that Virginia’s SOQ’s provide for minimum staffing levels that exceed most other states and large school systems. Most states do not prescribe minimum staffing standards for school technology support, resulting in fewer school-based technology support staff than FCPS relative to their student populations.
123
Chapter 6 – Financial Management Introduction
School divisions must practice sound financial management to maximize the effectiveness of limited resources and to plan for future needs. Effective financial management ensures that internal controls are in place and operating as intended, technology is maximized to increase productivity, and that reports are generated that help management reach its goals.
This chapter provides commendations and recommendations related to five aspects of financial management of Fairfax County Public Schools (FCPS and the division):
A. Organization, Management, and Staffing B. Financial Performance C. Planning and Budgeting D. Administrative Technology E. Review and Evaluation of Contracting Process
FCPS’ fiscal year (FY) 2013 Operating Fund budget was $2.4 billion, an increase of $184.8 million, or 8.2 percent, over the FY 2012 Approved Budget, and an increase of $73.0 million, or 3.1 percent, over the FY 2012 estimated actual expenditures. The Operating Fund is the primary source of ongoing school system operating expenditures. Other funds, such as construction, health insurance, retirement, and nutrition services serve special purposes and are tracked separately in the FCPS accounting systems. For all funds combined, the FCPS budget was $3.4 billion in FY 2013. The remainder of this chapter, as well as other chapters in this report, focuses on the Operating Fund expenditures since these expenditures relate more closely to the scope of this efficiency review.
Almost 69 percent of the division’s revenue comes from an allocation from Fairfax County (the county), which for FY 2013 was $1.7 billion, an increase of 4.5 percent from the prior year’s allocation. County revenue is derived primarily from real and personal property taxes collected from Fairfax residents and businesses.
Table 6.1 shows FCPS’ sources of revenue and revenue per student as compared to peer divisions that are part of the Washington Area Boards of Education (WABE). FCPS is the largest school division in Virginia as well as the largest in the WABE peer group. In addition to state, local, federal, and other revenue sources, some school systems use a portion of their fund balance (accumulation of prior year surpluses) to support the operating budget. These amounts are reflected as beginning balances in the table.

124
Table 6.1. Sources of revenue – School Operating Fund, FY 2013
School Division Federal State Local Beginning Balance
Other Total Revenue
per Student
Arlington County 2.0% 12.2% 83.0% 2.3% 0.5% $19,089
Alexandria City 4.0% 13.6% 79.0% 3.0% 0.4% $18,320
Falls Church City 1.3% 13.9% 78.2% 3.8% 2.8% $17,312
Montgomery County 3.1% 28.0% 67.5% 0.8% 0.6% $14,352
Prince George's County 6.4% 54.4% 38.0% 0.0% 1.2% $13,441
Manassas City 3.6% 47.9% 47.7% 0.0% 0.7% $12,308
Loudoun County 1.8% 31.0% 65.2% 1.2% 0.8% $12,275
Manassas Park City 3.7% 60.8% 32.1% 0.0% 3.4% $10,529
Prince William County 3.2% 49.0% 43.9% 3.7% 0.2% $10,496
Average (mean) of Peers 3.2% 34.5% 59.4% 1.6% 1.2% $14,236
Fairfax County 2.9% 22.9% 69.4% 2.4% 2.4% $13,636
FCPS % variance above / below peer average (4.2%)
Source: Washington Area Boards of Education Guide FY 2013
Note: Minor adjustments were made due to rounding.
More than 69 percent of FCPS’ revenue comes from local sources, as compared to almost 23 percent from state sources and just under 3 percent from federal sources. While there are a few exceptions, those that rely more heavily on local funding (those having a higher property tax base) have higher revenues per student. FCPS is ranked fifth out of the ten WABE school systems in total revenues per student, and is below the WABE average (mean of total revenue per student amounts).
FCPS spends almost 86 percent of its operating funds on instructional programs and other school-based expenditures that support those programs. Figure 6.1 shows the breakdown of how the division’s operating funds were budgeted for FY 2013. Instruction includes all school-based instructional activities and student services as well as the cluster and central office oversight and support functions. Instruction costs also include school-based expenditures required to provide the instruction, such utility costs and custodial services. Facilities management expenditures relate to maintenance and operations, facilities planning and design, and energy management. The vast majority of transportation expenditures relate to school bus service for FCPS students, including those with special needs. General support includes central office administrative functions such as human resource, financial services, and the superintendent’s office.

125
Figure 6.1. FCPS FY 2013 approved operating expenditures
Source: FCPS Approved 2013 Budget
The operational expectations of the financial services unit are outlined in the FCPS Strategic Governance Manual. There are separate expectations for financial planning, financial administration, and asset protection. These expectations include the following assurances that the superintendent will (through the FCPS financial services department), among other responsibilities:
Keep accurate financial records. File required financial reports accurately and on time. Administer purchases in accordance with the Fairfax County Purchasing Resolution. Assure that payroll and other debts are promptly paid when due. Prepare a budget that specified requirements.
The FCPS financial services unit establishes targets for its own performance and compares actual performance against those targets in the Board Monitoring Reports. Each measure is referenced to the applicable operational expectation.
FCPS has faced several significant challenges, including increased enrollment during periods of reductions in funding. Over the past five years, the division has seen an enrollment growth of over 15,000 students, a 7 percent increase. Although the Virginia legislature provided additional funding to schools in FY 2012, these amounts were one-time supplemental payments to support operational costs of school divisions and the State’s share of the increase in the retirement contribution rate.
Another significant challenge for FCPS in recent years has been the implementation of a new financial management information system for its business operations. Paid for and maintained by the county, the new system, called FOCUS (Fairfax County Unified System), has affected processes throughout the division, requiring significant staff time to learn and implement the new system. At the time of this
Instruction 85.8%
Transportation 5.5%
General Support 4.6%
Facilities Management 4.2%

126
review, implementation was still in process. FCPS was involved in developing the requirements for this system and the selection process.
In spite of these struggles, this review found FCPS’ financial management functions to be working well, with several commendable practices noted throughout this chapter. Commendations are made in this chapter recognizing the division’s efforts in supporting financial staff in schools and departments by providing training, help desk assistance, and application development solutions. The division also provides flexibility in budgeting and setting spending priorities by allowing schools to carry over a portion of unexpended funds each year. In addition, the division requires all employees to receive their paychecks via direct deposit, and implemented a procurement card program that streamlined the purchasing process.
The FCPS financial management function could be improved by implementing several recommendations. Budget reductions should be separately identified and summarized as cuts, efficiencies, or program changes, providing additional information to support leadership and board analysis and evaluation of the recommended budget. Other recommendations will relieve school support staff in their daily operations:
Implementing an automated timekeeping system to achieve processing efficiencies, relieving the schools of excessive manual, paper-intensive activities in the processing of time and attendance.
Consolidating student activity funds into a single division bank account, eliminating the need for separate deposit processes by school staff.
Providing additional training for school staff on the use of the new financial information system and the discontinuation of unnecessary and duplicative processes performed under the old system.
Finally, all eligible indirect costs should be allocated to the food and nutrition services operation. The board should consider increasing the indirect cost rate charged to the food and nutrition services operation as allowed so that a complete financial picture of the food service operation can be provided.
Table 6.2 provides a summary of financial management recommendations and resulting fiscal impacts for FCPS over the next five years.

127
Table 6.2. Fiscal impacts of recommendations
Recommendations One-Time
Cost/ Savings
2013-14 2014-15 2015-16 2016-17 2017-18 Total Fiscal
Impact
Financial Performance
6-1. Separately identify and summarize budget reductions resulting from cuts, efficiencies and program shifts.
$0 $0 $0 $0 $0 $0 $0
6-2. Allocate all eligible indirect costs to the food and nutrition services operation.
$0 $957,254 $957,254 $957,254 $957,254 $957,254 $4,786,270
6-3. Consolidate student activity funds into a single division bank account.
$0 $0 $0 $0 $0 $0 $0
Administrative Technology
6-4. Implement automated timekeeping system to streamline school payroll processes.
($200,000) $0 $0 $0 $0 $0 ($200,000)
6-5. Conduct additional training to eliminate manual, duplicative financial transaction processing at schools.
$0 $0 $0 $0 $0 $0 $0
Net Fiscal Impact ($200,000) $957,254 $957,254 $957,254 $957,254 $957,254 $4,586,270
Note: Costs are negative. Savings are positive.
A. Organization, Management, and Staffing The mission of the department of financial services is to protect and maintain the fiscal integrity of FCPS and to ensure resources are effectively directed to the classroom. Financial services plays an active role in fulfilling FCPS’ overall mission by providing accurate, timely, relevant financial information and guidance to the school board and to stakeholders; by demonstrating prudent stewardship of financial resources with integrity and high ethical standards; by streamlining business processes to maximize financial efficiencies; and by promoting school community wellness and students’ readiness to learn.
FCPS’ financial management functions fall under the supervision of the division’s assistant superintendent for financial services. During FY 2013, the department reorganized and made changes to employee titles, resulting in the organization structure depicted in Figure 6.2.

128
Figure 6.2.FCPS financial services organization structure
Assistant SuperintendentFinancial Services
Comptroller Director Payroll ManagementDirector Budget Services
Grants Development Coordinator
Grants and Revenue Budgeting Coordinator
Staffing and Compensation
Coordinator
Budget Services Staff
Assistant ComptrollerAssistant Comptroller
Accounting Operations Coordinator
Financial Reporting and Compliance
Coordinator
Risk Management Coordinator
Financial Systems and Control Coordinator
Financial Support Team Coordinator
Functional Application Support Team (FAST)
Coordinator
Comptroller Staff
Payroll Administration Coordinator
Payroll Benefits and Accounting Coordinator
Payroll Management Staff
Director Procurement Services
Purchasing and Contracting Coordinator
Warehouse Operations Coordinator
Comptroller Staff
Procurement Staff
Source: FCPS 2013
Note: The food services director also reports to the assistant superintendent for financial services. The food service operation was excluded from the scope of this study.
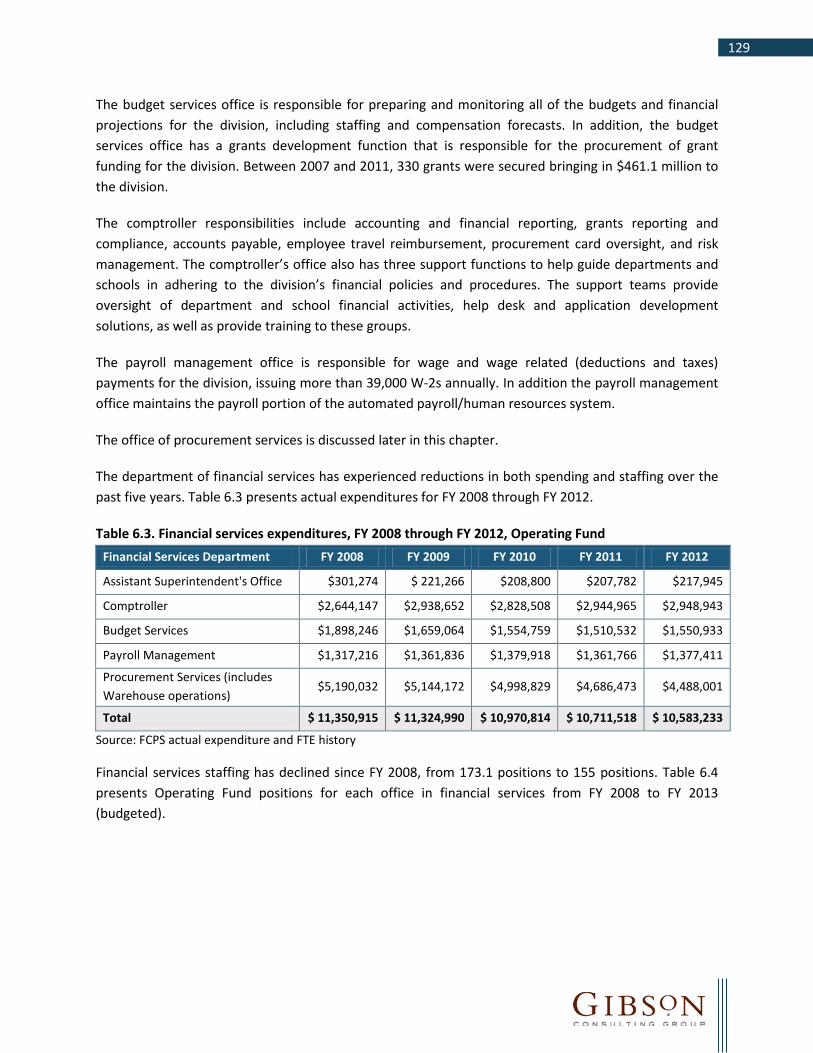
129
The budget services office is responsible for preparing and monitoring all of the budgets and financial projections for the division, including staffing and compensation forecasts. In addition, the budget services office has a grants development function that is responsible for the procurement of grant funding for the division. Between 2007 and 2011, 330 grants were secured bringing in $461.1 million to the division.
The comptroller responsibilities include accounting and financial reporting, grants reporting and compliance, accounts payable, employee travel reimbursement, procurement card oversight, and risk management. The comptroller’s office also has three support functions to help guide departments and schools in adhering to the division’s financial policies and procedures. The support teams provide oversight of department and school financial activities, help desk and application development solutions, as well as provide training to these groups.
The payroll management office is responsible for wage and wage related (deductions and taxes) payments for the division, issuing more than 39,000 W-2s annually. In addition the payroll management office maintains the payroll portion of the automated payroll/human resources system.
The office of procurement services is discussed later in this chapter.
The department of financial services has experienced reductions in both spending and staffing over the past five years. Table 6.3 presents actual expenditures for FY 2008 through FY 2012.
Table 6.3. Financial services expenditures, FY 2008 through FY 2012, Operating Fund Financial Services Department FY 2008 FY 2009 FY 2010 FY 2011 FY 2012
Assistant Superintendent's Office $301,274 $ 221,266 $208,800 $207,782 $217,945
Comptroller $2,644,147 $2,938,652 $2,828,508 $2,944,965 $2,948,943
Budget Services $1,898,246 $1,659,064 $1,554,759 $1,510,532 $1,550,933
Payroll Management $1,317,216 $1,361,836 $1,379,918 $1,361,766 $1,377,411
Procurement Services (includes Warehouse operations)
$5,190,032 $5,144,172 $4,998,829 $4,686,473 $4,488,001
Total $ 11,350,915 $ 11,324,990 $ 10,970,814 $ 10,711,518 $ 10,583,233
Source: FCPS actual expenditure and FTE history
Financial services staffing has declined since FY 2008, from 173.1 positions to 155 positions. Table 6.4 presents Operating Fund positions for each office in financial services from FY 2008 to FY 2013 (budgeted).

130
Table 6.4. Financial services staffing trends, FY 2008 through FY 2013, Operating Fund Financial Services Department FY 2008 FY 2009 FY 2010 FY 2011 FY 2012 FY 2013
Assistant Superintendent's Office 2.0 3.0 3.0 3.0 3.0 2.0
Comptroller 42.0 43.0 39.0 37.0 37.0 46.0
Budget Services 23.6 22.9 20.4 18.5 18.5 18.5
Payroll Management 21.0 21.0 20.0 19.5 19.5 19.5
Procurement Services (includes Warehouse operations)
84.5 84.5 81.0 77.0 77.0 69.0
Total 173.1 174.4 163.4 155.0 155.0 155.0
Source: FCPS actual expenditure and full-time equivalent history
The comptroller’s office, budget services, payroll management, and procurement services experienced most of the staffing decline over the past three years due to imposed cuts on the department of financial services. Since the implementation of the division’s new financial information system, FOCUS, efficiencies have been realized. (See commendation later in this chapter.)
Comparisons to other school systems are difficult because of different organization structures. For example, many school systems combine financial services with other administrative services in their budgets. Two other large school systems with comparable staffing data for financial services (excluding purchasing) were compared to FCPS. Table 6.5 presents the financial services staff full-time equivalent (FTE) count, school system enrollment, and the ratio of enrollment to financial services staff. The higher the ratio, the fewer staff FTEs (or more efficient) relative to the student population. FCPS has financial services staff levels that are 4 percent below the Houston Independent School District (TX), and 10 percent above Montgomery County Public Schools (MD) relative to their student populations.
Table 6.5. Financial services staffing comparison FY 2013, Operating Fund Financial Services Department Staff FTE Enrollment Ratio
Fairfax County Public Schools 77.0 181,536 2,358/1
Montgomery County Public Schools (MD) 57.0 149,018 2,614/1
Houston Independent School District (TX) 89.3 201,594 2,259/1
Sources: FCPS actual expenditure and FTE history; Houston ISD FY 2013 Adopted Budget, Departments Section; Montgomery County FY 2013 Approved Budget
Note: Minor adjustments were made so that the data were more comparable.
One factor contributing to slightly larger staff levels in FCPS financial services is the amount of support this unit provides to other departments and schools. This topic is discussed later in this chapter.
Financial services establishes targets and tracks actual performance for efficiency and customer satisfaction. Table 6.6 presents a sample of these measures as presented in the FY 2013 Board Monitoring Report.

131
Table 6.6. Selected financial services performance measures, FY 2012
Performance Measure Target FY 2012
Outcome Target Met?
Percentage of payroll processing staff meets or exceeds external benchmark
<0.09% 0.05% Yes
Percentage of electronic vendor payments to total payments
60% 63% Yes
Percentage of employees enrolled in electronic pay statements
5 percentage point increase
annually
22 percentage point increase
Yes
Percentage of customers satisfied with the guidance and support provided by financial services to successfully perform their jobs
85% 74% No
Sources: FY 2013 Board Monitoring Report for financial services
FCPS uses the Council of Great City Schools’ (COGCS) median measure as the target for the percentage of payroll staff FTEs to total employees. The COGCS annually collects self-reported information from 61 of the largest urban school systems in the United States for comparison purposes. FCPS actual payroll staff levels are 56 percent of the average of the COGCS, and their measure aligns with the low end of the range of COGCS measures reported. This is based on 12 FTE positions (out of 19.5 total FTEs in the FCPS payroll management area) that actually process payroll. If all 19.5 positions are used in this measure, FCPS’ percentage of 0.09 percent is still below the COGCS median.
Electronic vendor payments have increased from 47 percent of total payments to 63 percent between FY 2008 and FY 2012, and in FY 2013 this increased to 75 percent. (See related commendation later in this chapter.)
More FCPS employees are receiving electronic pay statements as opposed to paper printouts, saving time and expenses incurred for printing, sorting and distribution. The FCPS goal of a 5 percentage point increase was exceeded in FY 2012.
Customer satisfaction levels were lower than the target for a baseline survey conducted by FCPS in FY 2012. This was the year that new financial information systems were implemented throughout the division. This chapter includes a related recommendation for training of school staff (see Recommendation 6-5).
Commendation 6-1: Through three separate support teams, the financial services department provides effective support to schools and departments.
The division’s comptroller provides a variety of support to schools and departments, primarily through one of three support teams:
Financial Support Team – 6 FTEs Functional Applications Support Team – 7 FTEs
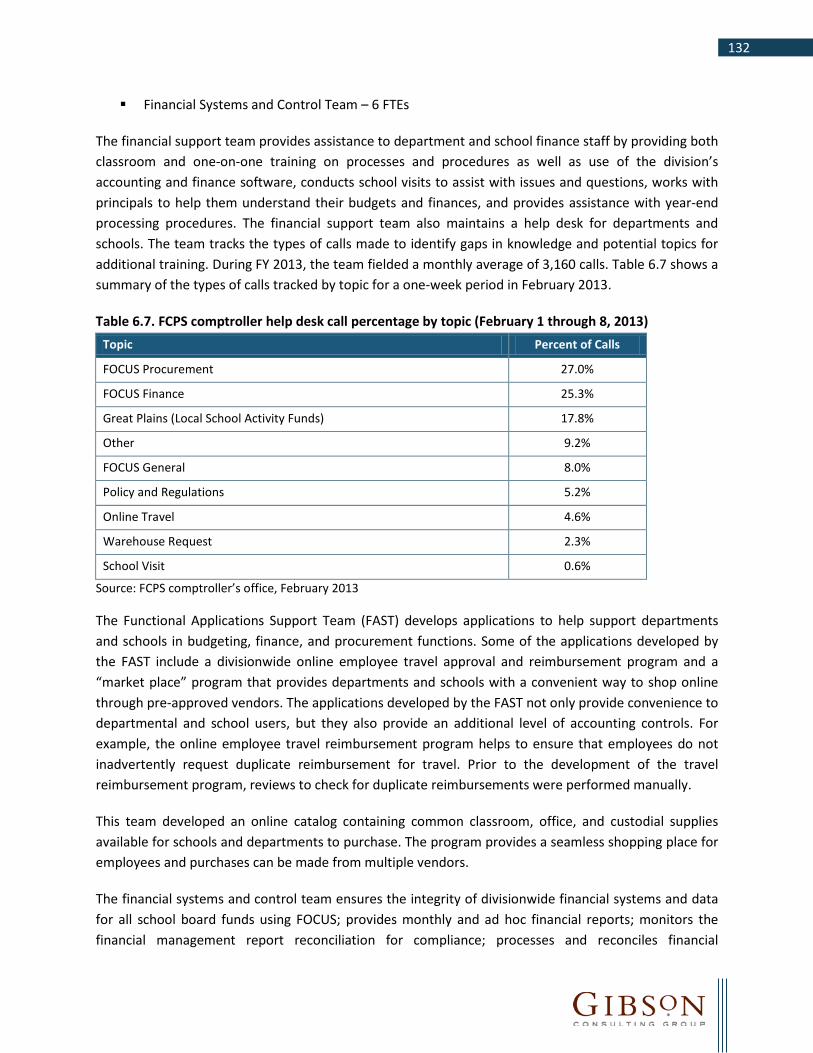
132
Financial Systems and Control Team – 6 FTEs
The financial support team provides assistance to department and school finance staff by providing both classroom and one-on-one training on processes and procedures as well as use of the division’s accounting and finance software, conducts school visits to assist with issues and questions, works with principals to help them understand their budgets and finances, and provides assistance with year-end processing procedures. The financial support team also maintains a help desk for departments and schools. The team tracks the types of calls made to identify gaps in knowledge and potential topics for additional training. During FY 2013, the team fielded a monthly average of 3,160 calls. Table 6.7 shows a summary of the types of calls tracked by topic for a one-week period in February 2013.
Table 6.7. FCPS comptroller help desk call percentage by topic (February 1 through 8, 2013) Topic Percent of Calls
FOCUS Procurement 27.0%
FOCUS Finance 25.3%
Great Plains (Local School Activity Funds) 17.8%
Other 9.2%
FOCUS General 8.0%
Policy and Regulations 5.2%
Online Travel 4.6%
Warehouse Request 2.3%
School Visit 0.6%
Source: FCPS comptroller’s office, February 2013
The Functional Applications Support Team (FAST) develops applications to help support departments and schools in budgeting, finance, and procurement functions. Some of the applications developed by the FAST include a divisionwide online employee travel approval and reimbursement program and a “market place” program that provides departments and schools with a convenient way to shop online through pre-approved vendors. The applications developed by the FAST not only provide convenience to departmental and school users, but they also provide an additional level of accounting controls. For example, the online employee travel reimbursement program helps to ensure that employees do not inadvertently request duplicate reimbursement for travel. Prior to the development of the travel reimbursement program, reviews to check for duplicate reimbursements were performed manually.
This team developed an online catalog containing common classroom, office, and custodial supplies available for schools and departments to purchase. The program provides a seamless shopping place for employees and purchases can be made from multiple vendors.
The financial systems and control team ensures the integrity of divisionwide financial systems and data for all school board funds using FOCUS; provides monthly and ad hoc financial reports; monitors the financial management report reconciliation for compliance; processes and reconciles financial

133
transactions to include interfaces from other systems; serves as a liaison between FCPS and the Fairfax County department of information technology; and coordinates implementation of financial system updates. During school site visits, the review team received positive comments from school staff regarding the quality of financial system services provided by this team.
As a result of the outreach and assistance provided to schools and departments, the division maintains a 90 percent compliance rate with its monthly financial reports. That is, 90 percent of schools and departments are reconciling their monthly financial reports and credit card statements accurately and on time.
These three support teams report to an assistant comptroller, and work together to assist departments and schools in maintaining their budgets and reports. For instance, if either the FAST or the financial systems control team identifies an issue, this is communicated to the financial support team who will contact the school or department and provide additional training to help resolve the issue.
B. Financial Performance School division financial management involves the effective use of limited resources to support student achievement. The division is required to manage its financial operations in conformity with the regulations and requirements of the Virginia State Board of Education, in conjunction with the Virginia Auditor of Public Accounts and the Code of Virginia, and to report data in compliance with the Uniform Reporting Manual published by the Virginia Office of the Auditor of Public Accounts.
FCPS tracks several performance measures in connection with the division’s financial performance. Performance measure 1.5 of the Board Monitoring Report for financial services states that FCPS will receive a “clean” or “unqualified” opinion on the division’s audit report by an outside accounting firm. FCPS has consistently received clean opinions on its financial statements, indicating that the financial statements “present fairly, in all material respects, the respective financial position of the governmental activities…”
FCPS has been effective in managing its financial resources during a period of declining funding and increasing student enrollment. From FY 2008 to FY 2012 (the most recent year audited actual expenditure data is available) FCPS’ student enrollment grew from 166,307 to 177,918, an increase of 7 percent. During this same time period Operating Fund expenditures increased only 3.3 percent, or an average of less than 1 percent per year. Expenditures per student declined 3.5 percent. Table 6.8 presents a five-year trend of FCPS actual expenditures and expenditures per student.

134
Table 6.8. FCPS actual expenditures and expenditures per student, FY 2008 – FY 2012, Operating Fund
FY 2008 FY 2009 FY 2010 FY 2011 FY 2012
5-Year % Change
Operating Expenditures (in thousands)
$2,144,142 $2,176,658 $2,096,962 $2,122,771 $2,214,362 3.3%
FCPS Enrollment 166,307 169,538 172,391 174,933 177,918 7.0%
Operating Expenditures per Student
$12,893 $12,839 $12,164 $12,135 $12,446 (3.5%)
Source: FCPS Actual Expenditure and FTE History
In FY 2012, 88 percent of FCPS operating expenditures related to salaries and benefits, and this percentage has been increasing slightly over the past five years. Table 6.9 shows the amounts and percentage distribution of expenditures by expenditure type for the past five years.
Table 6.9. FCPS actual expenditures and percentage distribution by type, FY 2008 – FY 2012, Operating Fund
Type of Expenditure FY 2008 FY 2009 FY 2010 FY 2011 FY 2012 5-Year % Change
Amounts (in thousands)
Salaries and Benefits $1,854,502 $1,904,692 $1,844,201 $1,839,069 $1,948,296 5.1%
County Services $30,490 $27,367 $26,300 $31,121 $30,902 1.4%
Contracted Services $98,791 $101,129 $90,534 $106,795 $98,999 0.2%
Materials and Supplies $74,380 $70,126 $70,810 $86,235 $86,354 16.1%
Capital Outlay $30,592 $25,852 $22,080 $23,399 $14,878 (51.4%)
Other $55,387 $47,492 $43,036 $36,153 $34,934 (36.9%)
Total $2,144,142 $2,176,658 $2,096,961 $2,122,772 $2,214,363 3.3%
Percentages
Salaries and Benefits 86.5% 87.5% 87.9% 86.6% 88.0% 1.5%
County Services 1.4% 1.3% 1.3% 1.5% 1.4% 0.0%
Contracted Services 4.6% 4.6% 4.3% 5.0% 4.5% -0.1%
Materials and Supplies 3.5% 3.2% 3.4% 4.1% 3.9% 0.4%
Capital Outlay 1.4% 1.2% 1.1% 1.1% 0.7% -0.7%
Other 2.6% 2.2% 2.1% 1.7% 1.6% -1.0%
Total 100.0% 100.0% 100.0% 100.0% 100.0% 0.0%
Source: FCPS actual expenditure and FTE history
FCPS has been able to control expenditure growth primarily because of its ability to increase staff (FTE) levels at a slower pace than enrollment growth. Table 6.10 presents staff FTEs and student to staff ratios for the past five years. Overall staff FTEs have increased 2.3 percent, compared to 7 percent enrollment growth. Nonschool-based staff FTEs declined 7.8 percent between FY 2008 and FY 2012, while school-
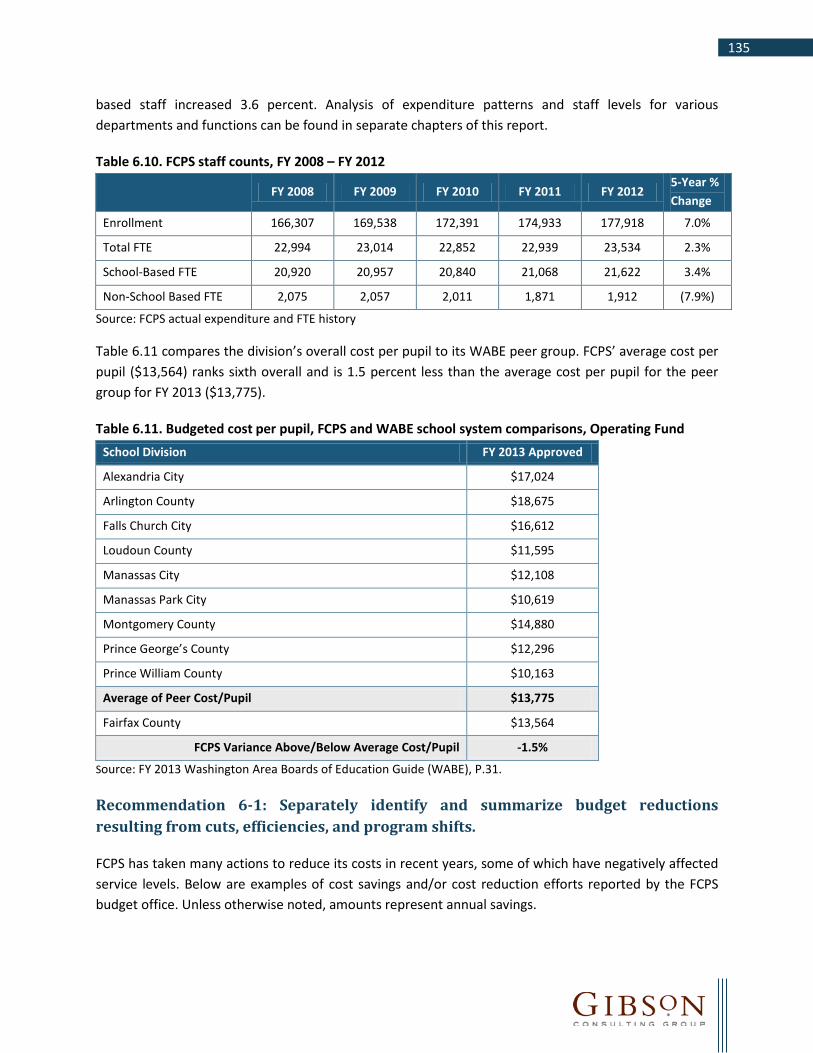
135
based staff increased 3.6 percent. Analysis of expenditure patterns and staff levels for various departments and functions can be found in separate chapters of this report.
Table 6.10. FCPS staff counts, FY 2008 – FY 2012
FY 2008 FY 2009 FY 2010 FY 2011 FY 2012
5-Year % Change
Enrollment 166,307 169,538 172,391 174,933 177,918 7.0%
Total FTE 22,994 23,014 22,852 22,939 23,534 2.3%
School-Based FTE 20,920 20,957 20,840 21,068 21,622 3.4%
Non-School Based FTE 2,075 2,057 2,011 1,871 1,912 (7.9%)
Source: FCPS actual expenditure and FTE history
Table 6.11 compares the division’s overall cost per pupil to its WABE peer group. FCPS’ average cost per pupil ($13,564) ranks sixth overall and is 1.5 percent less than the average cost per pupil for the peer group for FY 2013 ($13,775).
Table 6.11. Budgeted cost per pupil, FCPS and WABE school system comparisons, Operating Fund School Division FY 2013 Approved
Alexandria City $17,024
Arlington County $18,675
Falls Church City $16,612
Loudoun County $11,595
Manassas City $12,108
Manassas Park City $10,619
Montgomery County $14,880
Prince George’s County $12,296
Prince William County $10,163
Average of Peer Cost/Pupil $13,775
Fairfax County $13,564
FCPS Variance Above/Below Average Cost/Pupil -1.5%
Source: FY 2013 Washington Area Boards of Education Guide (WABE), P.31.
Recommendation 6-1: Separately identify and summarize budget reductions resulting from cuts, efficiencies, and program shifts.
FCPS has taken many actions to reduce its costs in recent years, some of which have negatively affected service levels. Below are examples of cost savings and/or cost reduction efforts reported by the FCPS budget office. Unless otherwise noted, amounts represent annual savings.

136
FY 2012
Savings from increased centralization of bus routing ($4.6 million) Closing of elementary school ($1.2 million) Prepayment of lease payments associated with energy performance program ($2.2 million) Reduction in funding for other post-employment benefits resulting from an actuarial study
(savings of $5 million) Savings identified through a health insurance dependent eligibility verification audit ($2.6
million)
FY 2011
Reduction of 41 positions and other costs in facilities and transportation ($2.2 million) Reduction of 6.5 positions and other costs in financial services ($0.4 million) Reduction of 3 positions in human resources ($0.4 million) Reduction of 18 positions and other costs in information technology ($1.2 million) Reduction of 13 positions and other costs in instructional services ($1.0 million) Reduction of 5 positions and other costs in professional learning and accountability ($0.5
million) Reduction of 5 positions and other costs in special services ($0.5 million) Reduction of 66.5 custodial staff positions ($2.0 million) Contract length reductions (reducing number of work days in a year) for 450 positions ($1.6
million)
Many of the reductions in FY 2011 were the result of across the board cuts, requiring each department leader to make adjustments to share the budget reduction burden. While organizationally fair and perhaps politically expedient, this is a less effective method for balancing the budget than a method driven by more intensive efficiency analysis. A budget cut is a reduction in the budget or staffing without reducing the work demands, in essence spreading the same amount of work among fewer positions. An efficiency savings occurs when the demands on the work are reduced, through re-engineering of processes, implementation of new information systems, standardization of operating procedures, or improved supervision. Other budget reductions may be the result of a program shift or termination, based on changing priorities or program evaluation results.
The FCPS budget office should categorize each budget reduction as a cut, an efficiency saving, program shift, or other appropriate category. This will provide the board, the county, and other stakeholders with additional transparency into the spending and saving patterns of the division. This information should be disclosed in the approved budget each year.

137
FISCAL IMPACT
The budget office has the information needed to support the separate identification and summarization of budget cuts, budget efficiencies, and program shifts, although it will require several days each year to assemble and report this information. No out-of-pocket costs will need to be incurred.
Recommendation 6-2: Allocate all eligible indirect costs to the food and nutrition services operation.
FCPS operates a food and nutrition services (FNS) program that employs over 1,300 workers and feeds approximately 149,000 customers daily at 196 schools and special education centers, 5 other educational sites, 3 day care centers, 13 senior citizen programs, 21 Meals-on-Wheels sites, 138 School-Age Child Care programs, and 62 Family and Early Childhood Education programs. In FY 2012, the FNS program had $76 million in expenditures, and had excess revenues of $14,833.
The FNS program is supported by the federal government through the National School Lunch Program and the School Breakfast Program. Federal regulations permit the school system to allocate certain indirect costs to nutrition operations, including utilities, pest control, trash removal, security, and janitorial services.
For FY 2009 through FY 2013, FCPS charged the FNS fund $2.6 million each year to cover indirect costs. Indirect costs cover services provided to FNS such as human resources, accounting, facilities maintenance, procurement, utilities, and information technology. In addition, direct costs of 1.5 support positions in payroll and accounts payable are also charged to the FNS fund.
During the preparation of the FY 2013 budget, the division determined that it could charge the FNS fund an additional $957,254 in indirect costs based on the Virginia Department of Education’s indirect cost rate of 16.2 percent. However, the rate was not approved by the board. Currently the food service operation is undergoing a separate review by FCPS, and accordingly it was excluded from this efficiency review.
The board should reconsider this recommendation. The food service operation should be self-sustaining after all applicable direct and indirect costs are reflected in its financial results. If indirect cost allocations cause the FNS fund to experience an operating loss, then one or more of the economic variables in the food service operation should be adjusted to cover the loss. Operational adjustments could include menu price increases, alternative menus, reconfiguration of lunch lines, or efforts to increase student participation.
FISCAL IMPACT
The fiscal impact of this recommendation is based on the division’s calculation which was verified by the review team. Based on the application of the state approved indirect cost rate of 16.2 percent to the FNS fund’s applicable direct costs, the net savings to the Operating Fund would be $957,254 annually.

138
Recommendation 6-2 One-Time
Costs/ Savings
2013-14 2014-15 2015-16 2016-17 2017-18
Allocate all eligible indirect costs to the food and nutrition services operation.
$0 $957,254 $957,254 $957,254 $957,254 $957,254
Note: Costs are negative. Savings are positive.
Recommendation 6-3: Consolidate schools’ Student Activity Fund (SAF) bank accounts into one or two divisionwide accounts to better manage school funds and to eliminate employees making trips to the bank.
Each FCPS school manages funds for student activities. For FY 2012, the total collective cash balance in these accounts at the end of the year was an estimated $20 million, and throughout the year $80 million of transactions flow through these funds.
At each school site, an administrative assistant or financial technician maintains the SAF accounts, the responsibilities of which include transporting deposits to the bank on a daily basis and reconciling the bank accounts on a monthly basis.
At some schools, particularly the middle and high schools where there are many SAF accounts to be managed, the job of accounting for these funds is a full-time responsibility. Financial technicians are required to make frequent trips to the bank to make deposits, sometimes daily. In addition to the time spent away from the office and the mileage reimbursements provided to the employee, this situation also puts the division at risk by not having a secure deposit process.
Even though the division has armored car service that picks up deposits from central kitchens daily, the service is unable to deliver SAF deposits because of the different banks involved. Some school systems consolidate their banking for SAFs with internal account numbers to track specific funds by school. Fort Bend Independent School District (TX), for example, applies this practice. All student activity funds are deposited into a single bank account that is managed and controlled by the central office. Individual school amounts are tracked by special coding contained in each school’s individual deposit slips. Each school is still required to reconcile their portion of the bank account, but the consolidation allows for armored car pick-ups and eliminates the daily trips to the bank by a financial technician.
FISCAL IMPACT
The implementation of this recommendation will result in greater efficiencies for school-based office staff. However, because the amount of time saved at any one school will be less than a few hours a week, there are no staff savings projected. There should be no additional cost to expand armored car service since they already service the division’s central kitchens. Further, the division may be able to achieve better banking rates by consolidating several accounts into a single account, but that savings cannot be determined without a detailed analysis of current banking agreements.

139
C. Planning and Budgeting Budget preparation and administration are important aspects of overall division operations. Providing adequate resources for programs within the constraints of available funding presents administrators with a significant challenge. The superintendent is responsible for preparing and presenting the preliminary budget based on annual priorities established by the board. The superintendent submits the budget to the board, and ultimately to the county, for appropriation authority. The FCPS board uses a Strategic Governance Manual to help guide the operations of the planning and budgeting functions. The Strategic Governance Manual requires that “…the superintendent shall develop and maintain a multi-year financial plan that is related directly to the board’s student achievement goals priorities and Operational Expectations goals, and that avoids long-term fiscal jeopardy to the district.”
The manual further requires that the superintendent shall develop a budget that13:
Is in a summary format that is understandable, transparent and easily accessible by the community and presented in a manner that demonstrates the relationship between the budget and the priorities within the Student Achievement Goals and any Operational Expectations goals.
Accurately describes revenues and expenditures.
Shows the amount spent in each budget category for the previous three fiscal years, the amount budgeted for the current fiscal year, and the amount budgeted for the next fiscal year.
Explains budget-planning assumptions, identifying significant trends and changes.
Provides the board with a fiscal forecast of needs five (5) years into the future. Reflects anticipated changes in employee compensation, including inflationary adjustments, step increases, performance increases, and benefits.
Includes such amounts as the board determines to be necessary for its governing function, including school board staff, board member training, consultation, attendance at professional conferences and events, and other matters determined by the board to be necessary for it to effectively perform its governance duties.
The division’s budget development process is year-round, beginning in May – a full year before the budget is adopted by the board. Below are the major events in the division’s budget process:
Ongoing
School board monitors school system performance through Board Monitoring Reports.
May through August
Budget priorities solicited from community groups and employees. School board receives initial financial forecast and assumptions that will drive the budget.
13 Strategic Governance Manual, page 18, Operational Expectations

140
September and October
Departments and schools (through the cluster offices) submit budget requests. Final baseline budget recommendations made by leadership team to superintendent. Per-pupil staffing budgets are prepared. Community and employee dialogue meetings are held.
November
The superintendent works with the school board to prioritize recommended initiatives. The proposed budget is prepared.
December
The proposed budget is finalized. The Governor’s proposed budget with the state revenue projections is released.
January
The superintendent releases the FCPS proposed budget. The superintendent meets with community, county, and employee groups to discuss the
proposed budget. The school board reviews the proposed budget and holds work sessions and hearings.
February and March
The school board adopts the FCPS advertised budget. The superintendent forwards the FCPS advertised budget to the county executive. The county executive releases the county’s advertised budget including a proposed transfer to
FCPS. Staffing and membership projections are updated.
April
The Virginia General Assembly adopts the state budget (tentative). The school board presents its budget request to the Board of Supervisors.
May
The county adopts its budget and determines the transfer to FCPS. The school board holds public hearings and work sessions. The school board adopts its approved budget.
The public has several opportunities to comment on the budget throughout the budget development process. Prior to the preparation of the proposed budget, the division seeks input from the community. After the presentation of the proposed budget to the school board, community members can provide input through the formal budget hearing process.
A separate program budget is prepared subsequent to the adoption of the approved budget. The program budget is more detailed, containing program specific financial and staffing information. Certain

141
expenditures charged to a central office function in the approved budget, such as employee benefits (charged to the department of financial services), are allocated to the respective programs and departments in the program budget.
The approved budget has consistently won awards for excellence in presentation:
The Meritorious Budget Award – presented by the Association of School Business Officials International for excellence in the presentation and issuance of the school system budget.
The Distinguished Budget Presentation Award – presented by the Government Finance Officers Association.
The FCPS budget documents contain a wealth of information, including narrative descriptions of key budget changes and economic conditions, enrollment projections, board goals and operational expectations, student achievement results, organization structures and information, descriptions of major programs and functions, explanation of the budget process, and definitions of key terms. Both the approved budget and the program budget are available online dating back to FY 2001, and are easy to access on the division’s web site. (See related recommendation in Chapter 1 – Governance and Administration [see Recommendation 1-2] regarding the implementation of a budget dashboard to support increased accessibility and navigation by the board, county, and other stakeholders.)
FCPS holds itself accountable for the accuracy of its budgeting process. In the FY 2013 Board Monitoring Report for financial services, performance measure 1.4 states that FCPS’ budget accuracy will be 98 percent, meaning that division expenditures will fall between 98 percent and 100 percent of budgeted expenditures. Based on information contained in the Board Monitoring Report, FY 2012 actual expenditures were $44 million less than what was budgeted, or 98.1 percent of the FY 2012 third quarter estimate.
Commendation 6-2: FCPS allows schools to carryover unexpended funds up to a maximum of 25 percent of allocated funds.
Section 22.1-100, Code of Virginia, requires school divisions to return unexpended state funds to the Commonwealth at the close of each fiscal year. However, Chapter 806 of the 2013 Acts of Assembly allows school divisions that have met certain conditions to elect to carry forward to fiscal year 2014 any remaining state fund balances that are unexpended as of June 30, 2013. Local balances can also be carried forward one year with the approval of the county.
Language included in Chapter 806 permits school divisions to use carry forward state funds to address any revenue shortfall related adjustments in state funding to the locality, regardless of the original purpose of such funds. The adopted language requires the state carryover funds to be re-appropriated by the local governing body to the school division’s budget for fiscal year 2014. Local funds are returned to the county, but may be re-appropriated by the county in the subsequent year. In practice, the county has consistently re-appropriated funds for specific purposes.
142
Allowing schools to carryover a percentage of their unexpended budgets provides a degree of flexibility in school governance, and prevents nonessential year-end spending experienced under conventional “use-it or lose-it” budget policies.
Studies of spending behavior indicate that traditional line-item budgeting encourages managers to spend their entire budget amounts out of fear of receiving cuts in future years. As a result, end-of-year spending can often be wasteful with unnecessary items being purchased. This is a particular problem in a school environment where end of year purchasing is only a “best guess” at what may be needed for the upcoming school year. Allowing for funding carryovers rewards principals and other school administrators who make prudent use of their funds throughout the school year. Further, carryovers allow schools to save for equipment and programs that may take more than a single fiscal year to purchase or implement. Carryovers must meet a designated purpose and generally must be spent in the following year.
D. Administrative Technology School division technology focuses primarily on instructional technology, leaving many divisions with substandard administrative applications. The failure to invest in technology at the administrative level stunts instructional programs by diverting vital resources to labor-intensive manual processes. Fully automated and integrated administrative functions can help divisions eliminate some of the manual aspects of processes requiring labor hours and improve the accuracy of the data gathered and reported.
In a cooperative effort with Fairfax County, FCPS underwent a major computer systems conversion that was implemented in November 2011. The FOCUS project provides shared solutions for business operations including procurement, finance, and budget, for both the county and FCPS. The county paid for this software and will pay the ongoing maintenance fees.
Most modules have been fully implemented; however, the budget and transparency modules are not yet completed. Also, while the county implemented FOCUS to support its human resources and payroll functions, FCPS decided to upgrade its existing systems for these functions. This was done as a result of higher than anticipated cost estimates for FOCUS human resources and payroll systems and the unique requirements of FCPS in these areas.
Commendation 6-3: FCPS uses electronic transfers to pay employees and vendors, resulting in efficiency gains.
Instead of issuing checks to employees and vendors, FCPS uses direct deposit and electronic funds transfers, as well as electronic pay advices (ePay). One hundred percent of employees are paid through direct deposit and 75 percent of vendor payments are made electronically. Mandatory direct deposit for employees has eliminated costs associated with reissuing lost and unclaimed checks. In addition, instead of issuing paper pay advices to communicate direct deposit information to employees, 83 percent of pay advices are issued electronically (paperless). The electronic pay advice program substantially reduced and will eventually eliminate paper and postage costs, as well as the associated labor costs related to

143
storing, printing, sealing, sorting, transporting and mailing paper. These efficiencies have helped the department of financial services absorb the position cuts of FY 2010 and FY 2011.
Recommendation 6-4: Implement automated timekeeping software to streamline school payroll processes.
Time and attendance reporting processes continue to be a largely manual process in FCPS schools. For instance, while core work hours are automatically generated for regular (non-temporary) employees, clerical personnel located at each school and in each division department are responsible for collecting and entering manual timesheets and leave reports for all biweekly paid employees, and all leave reports for monthly paid employees. Five different manual forms, as opposed to an automated timekeeping or absence tracking system, are being used to support the transaction data entry for time and attendance reporting. This is a very time consuming task particularly at the larger schools. If employees directly entered their time into a timekeeping system, supervisors would need only to verify and facilitate the approval of the time for absence reporting. It is highly unusual for a school system the size of FCPS to not be using an automated timekeeping system.
The Lawson Human Resources Information System (HRIS) has a time and attendance module, and the financial services and human resources departments are evaluating whether or not it can meet the needs of the division. In addition, transportation has a pilot program to utilize mobile terminals on 20 buses which will include time and attendance reporting (See related recommendation regarding technology enhancements in Chapter 4 – Transportation [Recommendation 4-1] of this report). After the pilot program is evaluated, the additional costs required to implement the full system will need to be determined. The implementation of a timekeeping system will help reduce the work demands of school clerical staff. (See related recommendation regarding elementary office assistants in Chapter 2 – Educational Service Delivery [Recommendation 2-2] of this report.) Since the upgrade of the HRIS is underway and will be in process through FY 2014, implementation of the timekeeping system is recommended to be scheduled for implementation in FY 2015 or as soon as feasibly possible.
FISCAL IMPACT
If the HRIS timekeeping system module can be used, there will be no additional licensing or maintenance fees. Additional consulting services will be needed for process re-engineering and training of central office staff. Based on prior implementation assistance received by FCPS, it is expected that a one-time cost of $200,000 will be sufficient for these purposes. In addition to training central staff, a plan will need to be developed to train all employees. Various options for training, including online, should be considered to minimize the amount of additional training costs and the impact to employees. If the HRIS module cannot meet FCPS’ needs, then an alternative system will need to be purchased.

144
Recommendation 6-4 One-Time
Costs/ Savings
2013-14 2014-15 2015-16 2016-17 2017-18
Implement automated timekeeping system.
($200,000) $0 $0 $0 $0 $0
Note: Costs are negative. Savings are positive.
Recommendation 6-5: Conduct additional training to eliminate duplicative, manual financial transaction processing in place at schools.
Although the division has implemented a new financial system, many of the processes at the school level continue to be manual processes. For instance, the procurement process is automated, using electronic routing for authorization of purchases. However, schools continue to complete the manual paperwork associated with the procurement process, including obtaining signatures on paper requisition forms, which is not required by the central office. The originators of purchasing transactions continue to submit requests on paper or via email, requiring school office data entry. Because of the dual manual and automated approval and recordkeeping, the ordering process with the new FOCUS system is cumbersome.
Other processes that school-based staff indicated became more cumbersome with the implementation of the new FOCUS system include financial management report reconciliations and budget transfers. For each of these processes, there is an automated process with electronic approvals, yet schools continue to maintain the paper process as well, including having the principal or designee approve the paperwork.
Finance staff and principals interviewed stated that the FCPS central office required the dual processes and that paper copies of all transactions need to be maintained in school files even though electronic approvals are contained in the FOCUS system.
However, when the review team inquired about these dual processes, central office staff said that this is not the case and that school staff are maintaining the dual processes by choice. Because the review team received similar information from several schools visited, it was determined that this is an issue that needs to be addressed through additional training or other clarification. Chapter 1 – Governance and Administration contains a separate recommendation for the implementation of a decision-making framework at FCPS (see Recommendation 1-4).
The support teams housed in the comptroller’s office should develop instructions to clarify exactly what is and is not required for schools and disseminate this information through training, memos, or financial staff newsletters.
FISCAL IMPACT
There are no out-of-pocket costs associated with the implementation of this recommendation, as this training can be done by the existing financial support teams during school visits for other purposes. Less

145
than one hour per school should be needed to provide this additional support and clarification regarding dual processes and hard copy documentation. While no tangible savings are expected, clarifying requirements for school financial staff will help to eliminate some unnecessary efforts and will help schools to become more efficient in conducting their routine processes.
E. Review and Evaluation of Contracting Process The division’s office of procurement services (OPS) function is led by a director. This position reports to the assistant superintendent for financial services. Procurement services has two primary sections: purchasing and contracting, and warehouse services. The purchasing and contracting arm of the function is charged with overseeing the contracting process which includes sourcing, evaluating, negotiating, awarding, and administering contracts for goods and services. Warehouse services is tasked with the oversight of a 65,000-square foot storage facility. Oversight responsibilities include inventory management and stock control, which includes ordering, receiving, storage, and distribution of goods and resources. Figure 6.3 shows the organization of the FCPS procurement operations.
Figure 6.3. FCPS office of procurement services organization structure
Director Procurement Services
Warehouse Operations Coordinator
Purchasing and Contracting Coordinator
Buyers
Contract Administrators
Purchasing and Contracting Staff
Warehouse Manager
Warehouse Staff
Source: FCPS 2013
Table 6.12 presents a five-year trend of FCPS staffing in procurement services. Like other FCPS departments, procurement services experienced cuts in staffing due to budget constraints in FY 2010 and FY 2011.

146
Table 6.12. Procurement services staffing trends, FY 2008 through FY 2012 Procurement Services Staff FY 2008 FY 2009 FY 2010 FY 2011 FY 2012
Management and Supervision 6 6 6 5 5
Business Specialist 9 9 9 9 9
Technical Specialist 8 8 6 6 6
Technical Assistant 6.5 6.5 6 5 5
Technician 9 9 9 9 9
Tradesperson (Warehouse) 46 46 45 43 43
Grand Total 84.5 84.5 81 77 77
Source: FCPS actual expenditure and FTE history
Operating Fund expenditures incurred by the office of procurement services decreased by $700,000 (13.5 percent) since FY 2009, from $5.2 million to $4.5 million a year. The majority of this cost reduction is due to the staffing reductions shown in Table 6.12.
The office of procurement services tracks performance measures for its area. In the FY 2013 Board Monitoring Report, the following measures were reported (see Table 6.13).
Table 6.13. Selected procurement services performance measures, FY 2012
Performance Measure Target FY 2012
Outcome Target Met?
Generate revenue through the use of cooperative purchasing, rebates, and other procurement programs
$1 million per year
$1.2 million Yes
Percentage of contracts awarded through a publicly advertised, competitive process
70% 70% Yes
Percentage of customers satisfied with procurement process Quality and timeliness of service Quality of goods and services
85% 85%
94% 98%
Yes Yes
Source: FY 2013 Board Monitoring Report for financial services
The FCPS procurement function has been delegated procurement authority from Fairfax County. FCPS and the county conduct several cooperative procurement arrangements when feasible.
In FCPS, schools and departments have delegated authority for purchases of less than $5,000. Schools and departments can make purchases at any dollar amount without central purchasing approval if the item or service is offered as a line item on a central contract. Other procurement limits are:
OPS buyers approve purchases between $5,000 and $50,000 OPS buyer supervisor approves purchases between $50,000 and $100,000 OPS coordinator and director approve purchases greater than $100,000

147
Commendation 6-4: The FCPS procurement card program, combined with the new financial information system, provides an efficient method for high volume, repetitive purchases.
The procurement card expedites the acquisition of goods and services as an alternative to the traditional purchasing process. It results in a significant reduction in the volume of small purchase orders, invoices, and checks processed while earning a volume usage rebate from the bank that manages the procurement card program for FCPS. Procurement cards are issued to schools and departments, who are also responsible for their card account reconciliation.
The procurement card program complies with, and is not intended to bypass, the FCPS’ purchasing procedures. The program has effective controls to limit the amount and type of spending. It is administered by the office of the comptroller, accounting operations section, and has been subject to audits by the division’s internal auditor.
FCPS currently uses three types of procurement cards:
General use which is associated with department and school appropriated funds FOCUS procurement cards which operate as the payment mechanism for FOCUS marketplace
orders Local School Activity Fund procurement cards which are associated with schools activity funds.
The division’s new information system has contributed to streamline processing of procurement card transactions and other purchasing transactions. Procurement card usage continues to increase as a percentage of overall purchases, as evidenced by the increase in rebates from the division’s procurement card vendor. Rebates have increased from $545,468 in FY 2008 to $842,637 in FY 2013.
The efficiency gains through the use of procurement cards have helped the office of procurement services absorb the 4.5 FTE position cuts (excluding warehouse staff) in FY 2010 and FY 2011.
Commendation 6-5: FCPS’ warehouse operation has implemented a “just-in-time” inventory process in addition to other cost-saving initiatives.
Over the course of several years, FCPS’ warehouse coordinator has reduced the stock items carried in the warehouse as items become more readily available through just-in-time (JIT) supply contracts. For instance, the division primarily orders its office supplies through JIT arrangements whereby vendors will deliver orders directly to a department or school location one day after an order has been placed.
These JIT arrangements prevent the division’s warehouse staff from having to stock, transport, and protect these items, as well as reduce the amount of inventory lost due to spoilage.
Another cost-saving initiative implemented by the warehouse is creating and stocking science kits for elementary schools. These kits are available to purchase from outside vendors, and vendors provide a service to replenish the kits on a regular basis.

148
Commendation 6-6: For the past two years, FCPS has partnered with the county for property and fidelity insurance, saving both in premium amounts and in deductible amounts.
By partnering with the county on property and fidelity insurance coverage, FCPS has reduced its premium costs as well as its deductible amounts paid. Because both the county and division are covered by a single property policy, they share a single deductible amount per claim.
In addition, the division and the county have received more favorable premium rates by having insurance brokers compete against each other.

149
Chapter 7 – Human Resources Introduction
Human Resources (HR) management is an important area to examine in an efficiency review, as more than 75 percent of all financial resources in public education are devoted to labor expenses. As financial resources for school divisions become increasingly restricted, HR management is an area that is often looked to for change, primarily because the fiscal impact can be significant.
HR management involves recruitment, selection, hiring, development, compensation (salary and benefits), retention, evaluation, and promotion of personnel within the division, and compliance with equal employment opportunity statutes and other federal and state laws.
This chapter provides findings, commendations and recommendations related to the HR management function of Fairfax County Public Schools (FCPS or the division). It is divided into the following major sections:
A. Organization and Management B. Policies and Procedures C. Recruitment, Hiring, and Retention D. Staff Development E. Compensation and Classification Systems
Employee-related costs represent the majority of FCPS expenditures, and teachers represent the largest employee group. FCPS applies staffing formulas to allocate teaching positions to schools. Figure 7.1 shows comparative ratios of students to authorized school-based teachers for FCPS and the Washington Area Boards of Education (WABE) comparison school systems. The number of teachers reflects “teacher-scale” positions which include other types of classroom teachers (music, physical education, vocational education) as well as non-classroom positions with teacher certifications (librarians). The chart is ordered left to right from the largest to the smallest school system in terms of enrollment.

150
Figure 7.1. Ratio of students to teacher scale positions, FCPS and WABE peer group FY 2013
Source: Calculated from FY 2013 WABE Guide
Note: This information does not represent average class size, but the relationship between the number of students and all teacher scale positions (including pre-k, kindergarten, alternative schools, and self-contained special education).
Among the five largest school systems, FCPS has the lowest pupil-teacher ratio, indicating more teacher scale positions relative to the respective student populations. Overall, FCPS has the fourth lowest ratio.
There are several factors that drive the overall ratio of students to teachers, including the average class size for classroom teachers. Table 7.1 compares average class size by school level for FCPS and its peer divisions. FCPS’ FY 2013 average class size was near the median of the peer divisions’ class sizes when assessed by students per classroom teacher. When compared to the selected nine WABE peers, FCPS has the fifth largest class size at the elementary school level, the sixth largest class size at the middle/intermediate school level, and the fifth largest class size at the secondary/high school level.
11.7 12.6
14.3 14.3 12.6
9.9 10.1 11.9
14.6
10.8
-
2.0
4.0
6.0
8.0
10.0
12.0
14.0
16.0

151
Table 7.1. FY 2013 average class size, FCPS and WABE peer group, FY 2013
School Division Students per Classroom Teacher1
Students per Teacher-Scale Position2
Elem Middle/Int. High Elem Middle/Int. High
Alexandria City 20.9 18.0 19.7 10.2 11.3 14.0
Arlington County 20.8 20.4 19.5 10.1 16.2 16.6
Fairfax County 21.4 24.4 24.9 14.1 19.9 20.9
Falls Church City 22.3 24.6 23.9 13.3 18.0 18.4
Loudoun County 24.7 24.3 25.8 17.1 22.4 22.1
Manassas City 21.3 20.5 24.7 11.6 17.5 17.6
Manassas Park City 18.6 29.1 27.7 12.1 20.3 19.9
Montgomery County, MD 17.7 24.7 25.9 13.2 21.4 23.2
Prince George’s County, MD 23.5 24.5 24.7 14.8 16.5 16.8
Prince William County 22.8 28.6 29.2 15.1 20.4 21.9
Source: FY 2013 Washington Area Boards of Education Guide (WABE), P.29.
Note: Table excludes teachers and students in pre-K, kindergarten, alternative schools, and self-contained special education. 1 Classroom teachers are positions used to determine class size. 2 Students per teacher-scale positions include classroom teachers and other teachers such as ESOL/ESL, librarians,
reading, coaches, mentors, music, art, physical education, and so forth.
Table 7.2 compares the number of school-based administrators, educational specialists, instructional assistants and non-management/all others staff per 1,000 students for FCPS and the peer divisions. FCPS ranks sixth highest of 10 for principals/assistant principals and educational specialists, and fifth highest for instructional assistants and non-management/all others. This data suggests that on average, staffing for school-based authorized non-teacher positions at FCPS is close to the peer median. Principals and assistant principals are discussed further in Chapter 2 – Educational Service Delivery.
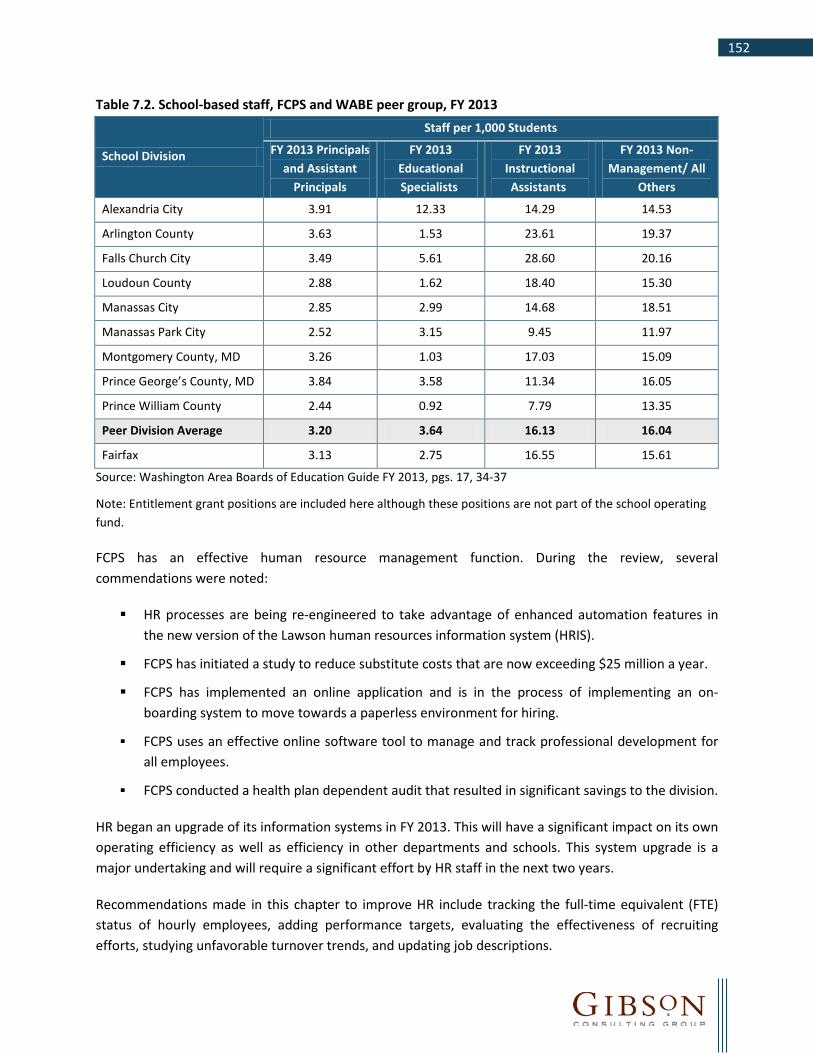
152
Table 7.2. School-based staff, FCPS and WABE peer group, FY 2013
School Division
Staff per 1,000 Students
FY 2013 Principals and Assistant
Principals
FY 2013 Educational Specialists
FY 2013 Instructional Assistants
FY 2013 Non-Management/ All
Others
Alexandria City 3.91 12.33 14.29 14.53
Arlington County 3.63 1.53 23.61 19.37
Falls Church City 3.49 5.61 28.60 20.16
Loudoun County 2.88 1.62 18.40 15.30
Manassas City 2.85 2.99 14.68 18.51
Manassas Park City 2.52 3.15 9.45 11.97
Montgomery County, MD 3.26 1.03 17.03 15.09
Prince George’s County, MD 3.84 3.58 11.34 16.05
Prince William County 2.44 0.92 7.79 13.35
Peer Division Average 3.20 3.64 16.13 16.04
Fairfax 3.13 2.75 16.55 15.61
Source: Washington Area Boards of Education Guide FY 2013, pgs. 17, 34-37
Note: Entitlement grant positions are included here although these positions are not part of the school operating fund.
FCPS has an effective human resource management function. During the review, several commendations were noted:
HR processes are being re-engineered to take advantage of enhanced automation features in the new version of the Lawson human resources information system (HRIS).
FCPS has initiated a study to reduce substitute costs that are now exceeding $25 million a year.
FCPS has implemented an online application and is in the process of implementing an on-boarding system to move towards a paperless environment for hiring.
FCPS uses an effective online software tool to manage and track professional development for all employees.
FCPS conducted a health plan dependent audit that resulted in significant savings to the division.
HR began an upgrade of its information systems in FY 2013. This will have a significant impact on its own operating efficiency as well as efficiency in other departments and schools. This system upgrade is a major undertaking and will require a significant effort by HR staff in the next two years.
Recommendations made in this chapter to improve HR include tracking the full-time equivalent (FTE) status of hourly employees, adding performance targets, evaluating the effectiveness of recruiting efforts, studying unfavorable turnover trends, and updating job descriptions.
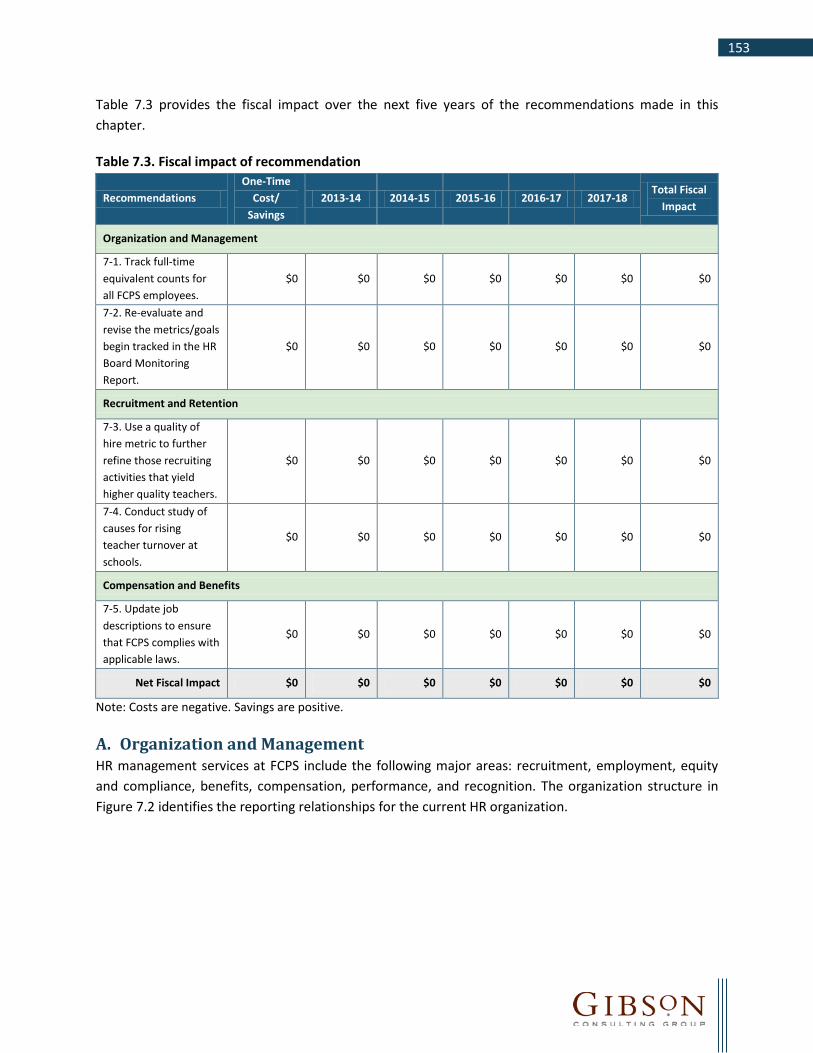
153
Table 7.3 provides the fiscal impact over the next five years of the recommendations made in this chapter.
Table 7.3. Fiscal impact of recommendation
Recommendations One-Time
Cost/ Savings
2013-14 2014-15 2015-16 2016-17 2017-18 Total Fiscal
Impact
Organization and Management
7-1. Track full-time equivalent counts for all FCPS employees.
$0 $0 $0 $0 $0 $0 $0
7-2. Re-evaluate and revise the metrics/goals begin tracked in the HR Board Monitoring Report.
$0 $0 $0 $0 $0 $0 $0
Recruitment and Retention
7-3. Use a quality of hire metric to further refine those recruiting activities that yield higher quality teachers.
$0 $0 $0 $0 $0 $0 $0
7-4. Conduct study of causes for rising teacher turnover at schools.
$0 $0 $0 $0 $0 $0 $0
Compensation and Benefits
7-5. Update job descriptions to ensure that FCPS complies with applicable laws.
$0 $0 $0 $0 $0 $0 $0
Net Fiscal Impact $0 $0 $0 $0 $0 $0 $0
Note: Costs are negative. Savings are positive.
A. Organization and Management HR management services at FCPS include the following major areas: recruitment, employment, equity and compliance, benefits, compensation, performance, and recognition. The organization structure in Figure 7.2 identifies the reporting relationships for the current HR organization.
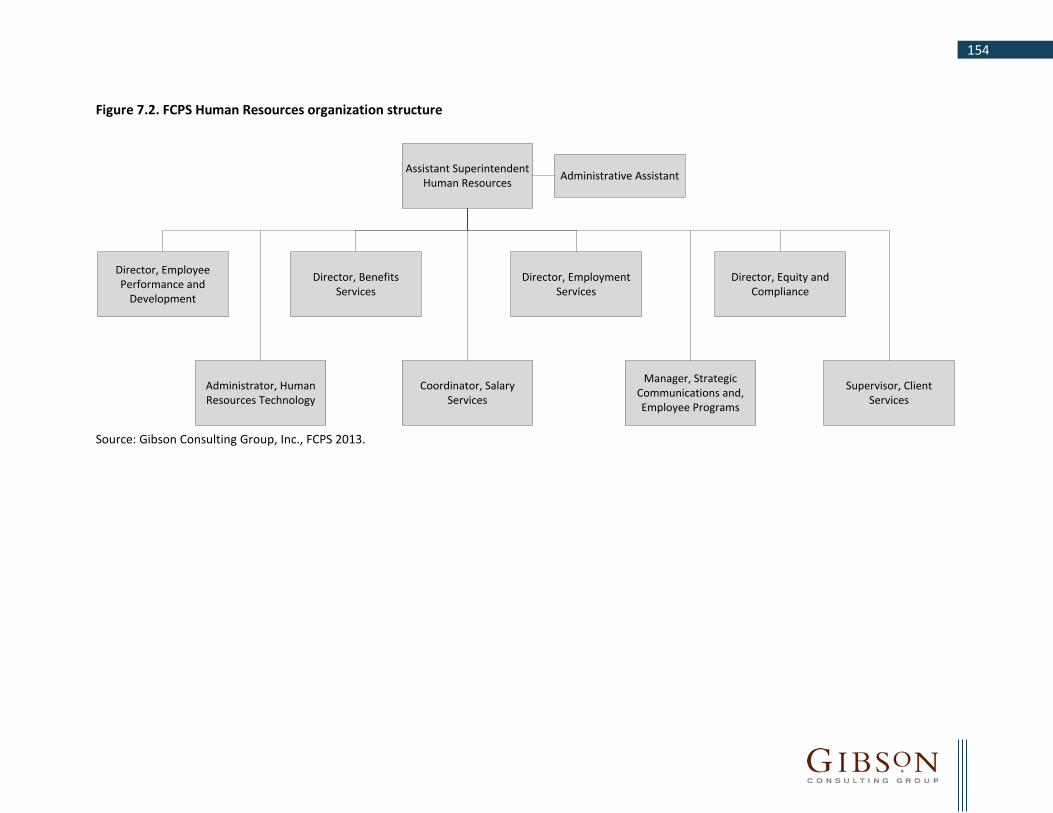
154
Figure 7.2. FCPS Human Resources organization structure
Assistant Superintendent Human Resources
Director, Benefits Services
Coordinator, Salary Services
Director, Employment Services
Director, Employee Performance and
Development
Director, Equity and Compliance
Administrative Assistant
Administrator, Human Resources Technology
Manager, Strategic Communications and, Employee Programs
Supervisor, Client Services
Source: Gibson Consulting Group, Inc., FCPS 2013.

155
The office of employee performance and development (OEPD) provides support for administration of division performance evaluations and provides and facilitates assessment processes that support the supervision, development, and retention of a high-performing work force. OEPD manages programs such as the colleague assistance program (CAP) and intervention teams for those employees needing additional assistance to maintain their instructional position. All performance evaluations are tracked through the OEPD and maintained in HR. OEPD includes investigations and employee relations. The office provides guidance to administrators and program managers when addressing issues of employee behavior and conduct which may lead to progressive discipline.
The office of benefits services administers employee benefits programs for the division, including employee insurance, integrated disability management, employee assistance, and wellness programs.
The office of employment services is primarily responsible for the recruitment and hiring of FCPS employees, and assigns staff to all instructional positions. This unit provides career counseling and is responsible for helping instructional staff in obtaining and renewing certifications. This office also manages the Substitute Employee Management System and provides a pool of substitutes to cover teacher absences.
The office of equity and compliance monitors compliance with HIPAA and all laws affecting equal opportunity through training and support, and investigates complaints of discrimination from employees, applicants, students, and parents.
The HR technology team provides business process analysis and technical solutions to support HR and the office of payroll management, and is providing a key role in the division’s upgrade of its human resources information systems.
The office of salary services maintains salary and job classification plans and schedules, and ensures that they are equitable and externally competitive. This unit is also primarily responsible for compliance with federal, state, and local regulations related to the processing of new employees, and for providing divisionwide training and support for time and attendance processing.
The office of strategic communications and employee programs builds employee awareness, enthusiasm, and commitment through new employee orientation, recognition, and retention programs.
The office of client services evaluates and analyzes HR processes and provides service to applicants, employees, and retirees of FCPS. This unit is also responsible for the processing of newly-hired FCPS employees.
The HR technology office provides business process analysis and technical solutions for HR and the office of payroll management; supports systemwide projects and data requests; maintains the Lawson HRIS system; responds to federal- and state-mandated reporting requirements; and maintains Uconnect, the online system providing employees with direct access to their HR and payroll data. Additionally, the office provides technical and functional application support to include LAN, department file, and

156
application servers; provides hardware and software support; maintains CareerQuest and SEMS/Webcenter.
The department of professional learning and accountability (which reports separately to the deputy superintendent) coordinates professional development for school-based instructional employees and support staff. This organizational approach is common in major school systems. Professional development is provided through various methods, such as online, coaching/mentoring, face-to-face, and embedded into the work place. A learning management system called My PLT is used to enroll and track professional development for the division, as well as to maintain professional development records.
Table 7.4 presents actual expenditures for each office of HR since FY 2008. Total expenditures have dropped by almost $1 million (7.7 percent) since FY 2008, largely the result of imposed staff cuts beginning in FY 2010.
Table 7.4. HR actual expenditures, Operating Fund, FY 2008 through FY 2012 Office FY 2008 FY 2009 FY 2010 FY 2011 FY 2012
Assistant Superintendent $502,313 $576,763 $590,104 $728,824 $973,507
Client Services $606,632 $493,747 $400,735 $358,360 $443,279
HR Technology $1,076,655 $1,055,883 $862,303 $1,012,763 $900,289
Benefits Services $938,326 $1,197,261 $625,270 $547,166 $540,189
Equity and Compliance $1,001,120 $963,919 $862,281 $876,833 $990,557
Salary Services $2,039,673 $1,786,827 $1,523,697 $1,545,041 $1,786,147
Employee Performance and Development
$988,436 $838,067 $848,424 $750,261 $837,204
Employment Services $4,251,692 $4,187,820 $3,746,159 $3,816,838 $4,053,414
Grand Total $11,404,847 $11,100,287 $9,458,973 $9,636,087 $10,524,586
Source: FCPS actual expenditure and FTE history
The position cuts can be seen in the historical staffing trends. Table 7.5 presents HR staffing levels since FY 2008 and includes budgeted positions for FY 2013, by office.

157
Table 7.5. HR staff levels (FTE), FY 2008 through FY 2013 Office FY 2008 FY 2009 FY 2010 FY 2011 FY 2012 FY 2013
Assistant Superintendent 7.0 8.0 7.5 6.5 6.5 6.5
Client Services 11.0 10.0 10.0 9.0 9.0 10.0
HR Technology 8.0 8.0 7.0 7.0 7.0 7.0
Benefits Services 10.5 10.5 5.5 5.5 5.5 5.5
Equity and Compliance 12.0 12.0 11.0 11.0 11.0 11.0
Salary Services 19.0 19.0 18.0 17.0 17.0 16.0
Employee Performance and Development
9.0 9.0 9.0 9.0 9.0 9.0
Employment Services 48.0 48.0 46.0 46.0 46.0 46.0
Grand Total 124.5 124.5 114.0 111.0 111.0 111.0
Source: FCPS actual expenditure and FTE history
A common measure of HR efficiency is the ratio of HR staff to total employees. As shown in Table 7.6, the division has maintained HR staff at 131 (headcount) for three years while the total number of employees (headcount) has increased from 25,944 to 27,332 (a 5.4 percent increase). Overtime worked by non-exempt staff in HR represented less than the pay of two FTEs ($77,628) in FY 2012.
Table 7.6. FCPS HR staffing to employees ratio trends
Comparison Year Total Employees* HR Staff Employees Supported per
HR Staff Member
FY 2013 27,332 131 209
FY 2012 26,492 131 202
FY 2011 25,944 131 198
FY 2010 25,914 134 193
FY 2009 25,996 140.5 185
FY 2008 25,813 138.5 186
Source: Fairfax County School Board Operational Expectations Monitoring Report-Human Resources (11-1-11/10-31-12), page 7
Note: *Includes all active benefits-eligible employees FCPS staff levels in HR are consistent with other large United States school systems. The FY 2013 HR staff-to-employee ratio for national, large school systems is shown in Table 7.7. FCPS falls in the middle of these peers in terms of efficiency, with 209 employees supported by each HR staff member. Overtime information for these peers was not available.

158
Table 7.7. FY 2013 HR staff-to-employees large school districts
School Districts Surveyed Total FTEs FTEs for HR Functions Employees Supported per
HR Staff Member Broward County, FL 25,325.0 143.0 177
Gwinnett County, GA 19,906.5 90.8 219
Montgomery County, MD 20,127.0 92.5 218
Palm Beach County, FL 21,300.0 131.0 163
Fairfax County, VA 27,332.0 131.0 209 Source: Fairfax County School Board, Operational Expectations Monitoring Report, Human Resources, Period Covered: 11-1-2011/10-31-12, P. 7 (FCPS Website: School Board Governance Tab)
Recommendation 7-1: Track full-time equivalent counts for all FCPS employees.
The FCPS budget discloses the position count of all full-time permanent positions. However, there are several thousand additional full-time and part-time employees that are hourly. Their pay is included in the payroll dollar amount, but there is no accounting for the number of FTE employees in the budget. Several functions, such as food services and transportation, are represented primarily by hourly employees. Other departments also have hourly employees that support department functions on a routine basis. Since many of the hourly positions are part-time, conversion to FTE staff is necessary to fully understand the level of cost. Hourly FTE information should be reflected in the financial summary at the beginning of each program budget, and also in the global information contained in the superintendent’s budget. With global FTE information, general staffing trends such as number of students per FTE employee can be tracked and compared to peers. Also, since 80 percent of FCPS expenditures relate to personnel, and a significant portion of these expenditures relate to hourly personnel, it is important to track all full-time equivalent employees for each fund.
Only part-time employees supporting a consistent function on a recurring basis should be included, and certain positions should be excluded from the part-time or hourly FTE employee count. Teacher substitutes, bus driver substitutes (and any other substitute pools), as well as temporary employees, should be excluded. The rationale is that these employees serve to fill existing positions that are temporarily vacant due to illness, vacation, or other leave.
For each hourly position to be included in the FTE count, a percentage of full-time work will need to be calculated. Some positions, such as bus drivers and food service workers, may be considered full-time even though they work less than an eight-hour day. Management needs to be consistent in its definition of a full-time employee for all positions. The FTE percentage should be assigned at the position level. If two positions are the same except for the number of hours per week worked, then an additional position should be established. Each position can then be converted to an FTE count by dividing the number of hours to be worked by the total number of hours considered full-time for that position. Once aggregated, an FTE count of hourly part-time and full-time employees will be achieved.

159
FISCAL IMPACT
The implementation of this recommendation will not have a fiscal impact and can be accomplished with current staff. This recommendation will require an up-front effort by the HR and budget departments to assign FTE percentages to each hourly position and create additional positions, if necessary. Once these are established, a minor effort will be required in future years to keep this information current.
Recommendation 7-2: Re-evaluate and revise the metrics/goals being tracked in the HR Board Monitoring Report.
Each department at FCPS, including HR, tracks specific measures in Board Monitoring Report. The HR department tracks 11 effectiveness measures, 2 efficiency measures, and 4 customer service measures. However, it is not clear how - or if - these measures link to the division’s goals. HR measures and goals, if stated, are shown in Table 7.8.
Table 7.8. FY 2013 HR Board Monitoring Report measures Stated Measures Measurable Goals
Effectiveness Measures
1.1. Measures the number of full-time teaching positions filled each year, as well as the number of vacant full-time teaching positions on the first day of school.
Goal unknown. However, it is stated that the rating will change to “watch” should the outcome drop below 5% of goal.
1.2. Measures the number of substitute jobs that were filled.
Goal unknown. However, it is stated that the rating will change to “watch” should the outcome drop below 5% of goal.
1.3. Measures the number of background checks done, the number of candidates with criminal histories, and the number of FCPS badges issued.
None stated.
1.4. Measures the percentage of evaluations completed (school-based administrators and teachers only)
None stated.
1.5. Measures benchmark positions compared to market.
Within 5% of the regional market for each benchmarked position, and for benefits structures.
1.6. Measures the percentage of teachers who have achieved Highly Qualified status.
Goal unknown. However, it is stated that the rating will change to “watch” should the outcome drop below 5% of goal.
1.7. Measures trends in diversity for teachers, school-based administrators, and non-school-based administrators.
None stated.
1.8. Measures the retention rate trend for teachers and bus drivers.
None stated.

160
Stated Measures Measurable Goals
1.9. Lists the number of DHR directives that have been updated, as well as the number of mediations that have been conducted.
None stated.
1.10. Measures percentage of positive teacher responses to surveys regarding working conditions.
None stated.
1.11. Lists the employee development programs offered by DHR (compliance, HR practices, and career advancement and staff development).
None stated.
Efficiency Measures
2.1 Lists employee relations-related items completed (e.g. complaints received, investigations conducted, and requests for accommodations).
None stated.
2.2 Compares staffing ratio of FCPS HR department to national large school districts.
None stated.
2.3 Lists projects in process that contribute to continuous improvement and efficiency (e.g., electronic contract process, online forms)
None stated.
Customer Service Measures
3.1 Measures customer satisfaction based on surveys of new employees, principals, applicants, and employee associations and advisory councils.
A rating of at least 4.0 on a 5-point scale.
3.2 Lists call completion rates for the Welcome Center.
Goal unknown. However, it is stated that the rating will change to “watch” should the outcome drop below 5% of goal.
3.3 Measures satisfaction with HR services based on FCPS’ school-based administrator satisfaction survey.
None stated.
3.4 Lists wellness initiatives. None stated.
Source: Fairfax County School Board, Operational Expectations Monitoring Report, Human Resources, Period Covered: 11-1-2011/10-31-12 (FCPS Website: School Board Governance Tab)
Some of the measures appear to be a vehicle for reporting the annual activities of the HR department, and should be separated from the actual metrics. Additionally, the majority of these actual metrics do not contain specific, tangible goals to be measured against.
Additional areas of measurement should be evaluated for substitute costs and teacher absences.
161
FISCAL IMPACT
The implementation of this recommendation will not have a fiscal impact and can be accomplished with current staff. Approximately 120 hours of HR staff time designated by the assistant superintendent of HR will be needed in the first year to develop specific targets for HR measures and identify and collect data on new measures, and analyze performance results. Less effort should be required in subsequent years.
B. Policies and Procedures The HR function at FCPS is guided by school board policies and administrative regulations that are well-documented. Operating procedures are also well-documented for department staff.
Although the HR area meets customer and organizational expectations in terms of meeting deadlines and providing services as expected, in general, HR operations are paper-driven. Automation is needed to solve the inefficiencies of the parallel manual processes which at times require duplicative data entry and extra processing of the same paperwork. There are minimal formalized workflow processes to move information efficiently from place to place within the HR sub-departments. For example, while automation of the applicant tracking process is in progress, benefits enrollment, processing of employment changes (such as for new hires, salary transactions, terminations), and attendance and time reporting are manual, sometimes with multiple forms and performed in silos. Attendance and time reporting for regular staff and substitutes is particularly burdensome because of the various forms and staff who are involved in the process and paperwork flow. The HR processing inefficiencies are being addressed through an upgrade in information systems (see commendation below). Timekeeping inefficiencies are addressed through a separate recommendation in Chapter 6 – Financial Management (see Recommendation 6-4).
Commendation 7-1: HR processes are being re-engineered to take advantage of enhanced automation features in the new version of the Lawson HRIS.
FCPS is involved in upgrading its Lawson HRIS. Previously, FCPS had planned to implement the new HR system implemented by the county. Because of unique requirements and the resulting cost implications for that system, FCPS decided to upgrade its current system. The decision was made based on the available functionality within the updated version of Lawson’s software, as well as pricing considerations.
Because FCPS had worked with the county’s software vendor to document and re-engineer HR processes during the 2010-12 time period, process improvements were identified. The process maps and related improvements are being modified through the Lawson software upgrade.
Commendation 7-2: FCPS has initiated a study to reduce substitute costs.
Substitutes are used for absences related to personal days, sick days, professional development days, organization official business time off, and to fill in for staff vacancies. Substitutes are required for
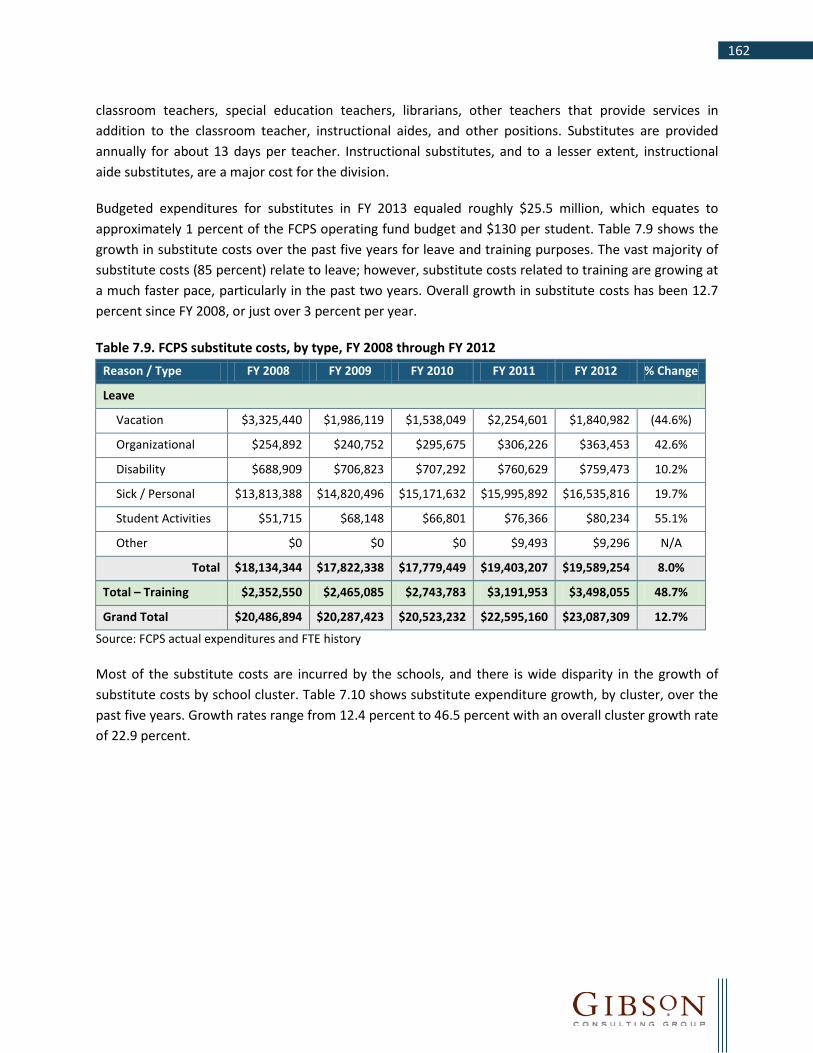
162
classroom teachers, special education teachers, librarians, other teachers that provide services in addition to the classroom teacher, instructional aides, and other positions. Substitutes are provided annually for about 13 days per teacher. Instructional substitutes, and to a lesser extent, instructional aide substitutes, are a major cost for the division.
Budgeted expenditures for substitutes in FY 2013 equaled roughly $25.5 million, which equates to approximately 1 percent of the FCPS operating fund budget and $130 per student. Table 7.9 shows the growth in substitute costs over the past five years for leave and training purposes. The vast majority of substitute costs (85 percent) relate to leave; however, substitute costs related to training are growing at a much faster pace, particularly in the past two years. Overall growth in substitute costs has been 12.7 percent since FY 2008, or just over 3 percent per year.
Table 7.9. FCPS substitute costs, by type, FY 2008 through FY 2012 Reason / Type FY 2008 FY 2009 FY 2010 FY 2011 FY 2012 % Change
Leave
Vacation $3,325,440 $1,986,119 $1,538,049 $2,254,601 $1,840,982 (44.6%)
Organizational $254,892 $240,752 $295,675 $306,226 $363,453 42.6%
Disability $688,909 $706,823 $707,292 $760,629 $759,473 10.2%
Sick / Personal $13,813,388 $14,820,496 $15,171,632 $15,995,892 $16,535,816 19.7%
Student Activities $51,715 $68,148 $66,801 $76,366 $80,234 55.1%
Other $0 $0 $0 $9,493 $9,296 N/A
Total $18,134,344 $17,822,338 $17,779,449 $19,403,207 $19,589,254 8.0%
Total – Training $2,352,550 $2,465,085 $2,743,783 $3,191,953 $3,498,055 48.7%
Grand Total $20,486,894 $20,287,423 $20,523,232 $22,595,160 $23,087,309 12.7%
Source: FCPS actual expenditures and FTE history
Most of the substitute costs are incurred by the schools, and there is wide disparity in the growth of substitute costs by school cluster. Table 7.10 shows substitute expenditure growth, by cluster, over the past five years. Growth rates range from 12.4 percent to 46.5 percent with an overall cluster growth rate of 22.9 percent.

163
Table 7.10. Substitute expenditures by cluster, FY 2008 through FY 2012 Cluster FY 2008 FY 2009 FY 2010 FY 2011 FY 2012 % Change
I $1,599,551 $1,776,141 $1,714,162 $1,942,525 $1,901,291 18.9%
II $1,504,078 $1,588,254 $1,614,933 $1,900,617 $1,871,382 24.4%
III $1,947,551 $2,173,854 $2,251,739 $2,303,838 $2,471,351 26.9%
IV $2,075,748 $2,265,023 $2,297,887 $2,344,333 $2,332,346 12.4%
V $1,498,862 $1,697,473 $1,744,337 $1,959,480 $1,956,303 30.5%
VI $1,976,698 $2,004,715 $2,024,107 $2,196,539 $2,234,547 13.0%
VII $2,244,013 $2,156,222 $2,392,049 $2,549,047 $2,592,518 15.5%
VIII $1,822,936 $2,021,518 $2,103,050 $2,340,751 $2,671,297 46.5%
Total $14,669,437 $15,683,200 $16,142,264 $17,537,130 $18,031,035 22.9%
Source: FCPS actual expenditure and FTE history
FCPS has convened a cross-functional committee, led by financial services, to examine substitute costs and practices. The committee recognizes that rescheduling professional development on non-instructional days would reduce substitute costs and would also likely have a positive impact on student achievement. Additionally, the committee is looking at leave of absence policy modifications, such as a reduction in the available time off and/or changes to policy allotments and accruals.
As a part of this internal study, the committee will research competitive practices and publish best practices information regarding substitute management and train school administrators on substitute management. FCPS should also consider using the WABE report process, which it manages, to solicit benchmark data about substitute practices, costs and usage in similar sized and surrounding school divisions.
C. Recruitment, Hiring, and Retention
Recruitment and Hiring
There are three sections in the office of employment services that focus on recruitment, hiring and retention – one for instructional staff, one for support staff, and one for administrative staff. These sections work to increase the applicant pool and strive to ensure the quality and diversity of the work force. These sections also provide training to management and employees on a variety of hiring functions and fair interviewing practices.
Commendation 7-3: FCPS has implemented an online application and onboarding system to move towards a paperless environment for hiring.
Recently, FCPS’ HR department implemented an online application and onboarding system for staffing and recruitment. Additionally, processes were updated to take advantage of the systems paperless functionalities. These new processes are reportedly working very well.

164
FCPS also has plans to automate the exit interview process to more efficiently gather and analyze information about the reasons that employees voluntarily terminate employment in order to make changes to policies and practices, when appropriate.
Recommendation 7-3: Use a quality of hire metric to further refine those recruiting activities that yield higher quality teachers.
One of the ways FCPS identifies employee candidates is through job fairs or other recruiting trips. In FY 2012, approximately 55 recruiting trips were taken by HR department staff, with an average cost of $765 per trip. Thirty of the 55 job fairs were in Virginia and one was a virtual job fair. The top 10 most expensive trips cost an average of $2,250 each and yielded an average of 37 new hires each.
Using metrics to track the success and failure of various recruitment and selection activities is essential to a successful hiring process. Currently, FCPS’ HR department tracks the costs of resulting hires from each recruiting trip that is undertaken by department staff. To better identify those recruitment sources that produce the highest-quality teachers, the department should begin incorporating information on the quality of the teachers hired by using principal walk-through information and/or performance evaluation results.
Each recruitment source, including advertising in specific newspapers and periodicals (as opposed to just recruiting trips) should be examined in this same manner.
FISCAL IMPACT
The implementation of this recommendation will not have a fiscal impact and can be accomplished with current staff in the office of employment services. Approximately 40 hours of effort is expected for data collection and measure calculation.
Retention
FCPS’ total employee turnover for the period of November 2011 to October 2012 was 10.3 percent. For the period from November 2011 to October 2012, FCPS’ HR staff turnover was 4.4 percent, excluding internal HR transfers, which indicates a good level of HR employee satisfaction with their jobs.
Recommendation 7-4: Conduct study of causes for rising teacher turnover at schools.
There is an unfavorable trend in staff turnover in an increasing number of schools. Table 7.11 shows the FCPS schools that experienced annual teacher turnover of 20 percent or more during the past three years. From November 2009 to October 2010, there were five schools that had teacher turnover of 20 percent or more and the total division teacher turnover was 9.2 percent. In the following 12 month period nine schools had teacher turnover of 20 percent or higher and the overall division teacher turnover was 10.1 percent – slightly higher than the prior year. From November 2011 to October 2012, the number of schools with teacher turnover of 20 percent or higher increased to 18 schools and the

165
total division teacher turnover increased to 11.8 percent. Two schools with turnover of 20 percent or more in the 2010 to 2011 reporting period also appeared on the following year’s listing of those with 20 percent or higher.
Table 7.11. Teacher turnover greater than or equal to 20 percent – three-year history 11/1/2009-10/31/2010
Overall=9.18% 11/1/2010-10/31/2011
Overall=10.06% 11/1/2011-10/31/2012
Overall=11.79% Elem 1 (24.14%) Middle 1 (22.37%) Elem 2 (21.62%) Middle 2 (21.43%) Elem 3 (20.69%)
Elem 1 (28%) Elem 2 (24.24%) Elem 3 (23.53%) Elem 4 (23.53%) Elem 5 (22.92%) Elem 6 (22.22%) Elem 7 (21.57%) Elem 8 (20.83%) Elem 9 (20.59%)
Elem 1 (33.33%) Elem 2 (26.83%) Elem 3 (25.71%) Elem 4 (23.81%) Elem 5 (23.26%) Middle 1 (23.08%) Elem 6 (22.86%) Elem 7 (22.22%) Elem 8 (22.22%) Elem 9 (21.43%) Elem 10 (21.05%) Elem 11 (21.05%) Elem 12 (20.75%) Elem 13 (20.45%) Elem 14 (20.37%) Elem 15 (20.00%) Elem 16 (20.00%) Elem 17 (20.00%)
Source: FCPS turnover data
All but three of the schools in Table 7.11 are elementary schools; the other three are middle schools. Also, in addition to more schools exceeding a 20 percent turnover, the level of turnover has increased steadily. The highest turnover school in each of the past three years experienced 24 percent, 28 percent, and 33 percent turnover, respectively.
The overall turnover rate for instructional assistants from November 2011 to October 2012 was 14 percent, with 49 schools experiencing turnover of 20 percent or greater and 22 schools with 30 percent or greater.
These trends warrant further study by FCPS. The assistant superintendent of HR should assign an internal committee to evaluate these trends, analyze potential causal factors, and determine if any corrective action can be taken.
166
FISCAL IMPACT
The implementation of this recommendation will not have a fiscal impact and can be accomplished with current staff. It is estimated that approximately 360 hours of data analysis and school interviews by HR staff will be needed to conduct this work. The effort should focus on the schools with rates above 20 percent, and then determine if additional analysis is needed.
D. Staff Development The OEPD provides support for the administration of division performance evaluations, and provides and facilitates assessment processes that support the supervision, development, and retention of a high performing work force. The department of professional learning and accountability coordinates professional development for both school-based instructional employees and support staff. These two areas were examined as part of this review, but no significant recommendations were identified.
Commendation 7-4: FCPS uses an effective online software tool to manage and track professional development for all employees.
In May 2007, the department of professional learning and training (now part of the department of professional learning and accountability) implemented My PLT, and online enterprise-wide learning management systems for all FCPS employees. This system provides 24 hours a day, 7 days a week access to employees and managers for registration, tracking, and evaluation of professional development programs, including courses, conferences, and workshops.
System features include automated email reminders, training updates, user transcripts for FCPS courses, online training content, and tools that support a coordinated but decentralized professional development approach. The system also supports the provision of employee feedback on trainings and on the use of the system. The information technology department provides customer support for My PLT.
The primary benefit of this system is having a single tracking mechanism for all FCPS employee professional development, regardless of the position type or department. The online system supports more efficient processes, and the management information helps department leaders ensure that the appropriate technical skills and other relevant knowledge are being learned by their respective employees.
E. Compensation and Classification Systems
Job Descriptions
Job descriptions serve a very important function in an organization. They are used during the hiring process to identify the appropriate knowledge, skills, and abilities of candidates for employment, and an accurate job description can be a valuable resource for performance management by establishing an agreement between the employer and employee about what acceptable job performance looks like.

167
Additionally, they can be extremely helpful in identifying necessary training and development to bring an employee up to an acceptable level of performance.
Recommendation 7-5: Update job descriptions to ensure that FCPS complies with applicable laws.
Based on the examination of a selected sample of FCPS’ job descriptions, the HR department should begin a project for the purpose of updating these documents. Of the job descriptions reviewed, 25 percent were last updated ten years ago and 30 percent were updated between 5 and 10 years ago. Additionally, none of the job descriptions provided information on Fair Labor Standards Act (FLSA) status of exempt or non-exempt from overtime, the positions’ primary purposes were not clear, and working conditions – such as lifting, standing and repetitive hand motions required – were not stated.
Some jobs are dynamic, changing rapidly and extensively, due to technological or organizational considerations. The descriptions for these types of jobs should be reviewed at least annually. Other jobs change very little over long periods of time and their job descriptions need not be reviewed as often.
The first step in updating job descriptions is to perform a structured job analysis to determine what competencies and skills the incumbent in each position must possess, as well as the current job responsibilities and duties of the position. This analysis can be accomplished using observations or interviews with selected incumbents, in addition to questionnaires that can be provided to all incumbents and their supervisors to efficiently gather information about specific job types.
As part of the job description review, the FCPS should verify FLSA status and Equal Employment Opportunity classifications for each position and reclassify them, if necessary.
To keep job descriptions up-to-date in the future, each should be addressed annually as part of the performance appraisal process. At performance appraisal time, the HR department should provide a copy of each employee’s current job description to the appropriate supervisors. Supervisors will then review each job description and provide notes to the HR department regarding any new job duties and/or duties that are no longer performed by the employee. The appropriate staff in HR will review all changes made by the employees’ supervisors for appropriateness, make necessary changes to the job descriptions, and provide the updated job descriptions to each employee for review and signature.
FISCAL IMPACT
The implementation of this recommendation will involve time and effort of each department in FCPS (approximately two hours per job description), as well as HR staff (30 minutes per job description), and should be done over the next two years. HR should oversee and be held accountable for the completion of job description updates.

168
Salaries and Benefits
FCPS’ average teacher pay levels are 2 percent higher than the WABE peer division median and 1 percent lower than the WABE peer division average. Teacher pay levels for Alexandria, Arlington, and Montgomery Counties are considerably higher than the rest of the peer group. Table 7.12 presents a comparative analysis of FCPS teacher average pay to the WABE peer group for FY 2013.
Table 7.12. Comparison of peer teacher pay, FCPS and WABE peer group, FY 2013
School Division Scheduled Days Hours per
Day Average Annual
Salary
Alexandria City 197 7.25 $72,734
Arlington County 194 7.5 $72,997
Falls Church City 191 7.5 $66,252
Loudoun County 194 7.5 $60,875
Manassas City 195 7.5 $60,850
Manassas Park City 195 7.5 $58,479
Montgomery County, MD 193 8.0 $74,855
Prince George's County, MD 192 7.5 $63,566
Prince William County 195 7.5 $58,893
WABE Peer Division Median 194 7.5 $63,566
WABE Peer Division Average 194 7.5 $65,500
Fairfax 194 7.5 $64,813
Source: Washington Area Boards of Education Guide, FY 2013, pg. 38
FCPS offers employees a full-spectrum of benefits programs, including retirement, medical plan alternatives, dental, long-term care, life and accidental disability, disability, life insurance, wellness, employee assistance plan, and disease management plans for active employees and retirees. Generally, FCPS contributes approximately 75 to 85 percent of plan costs for non-voluntary plan options for employees.
Table 7.13 presents a comparison of FCPS’ health insurance cost percentages to the WABE peer group. FCPS’ overall benefit percentage, relative to average salary, is above the WABE peer group average and median, and is the third highest of the WABE peers.
Costs for the health insurance portion of a full-spectrum of benefits offerings represent the largest element of benefits costs. FCPS’ health insurance as a percentage of average salary is slightly above the peer median and below the peer average – ranking fifth out of the 10 WABE divisions.
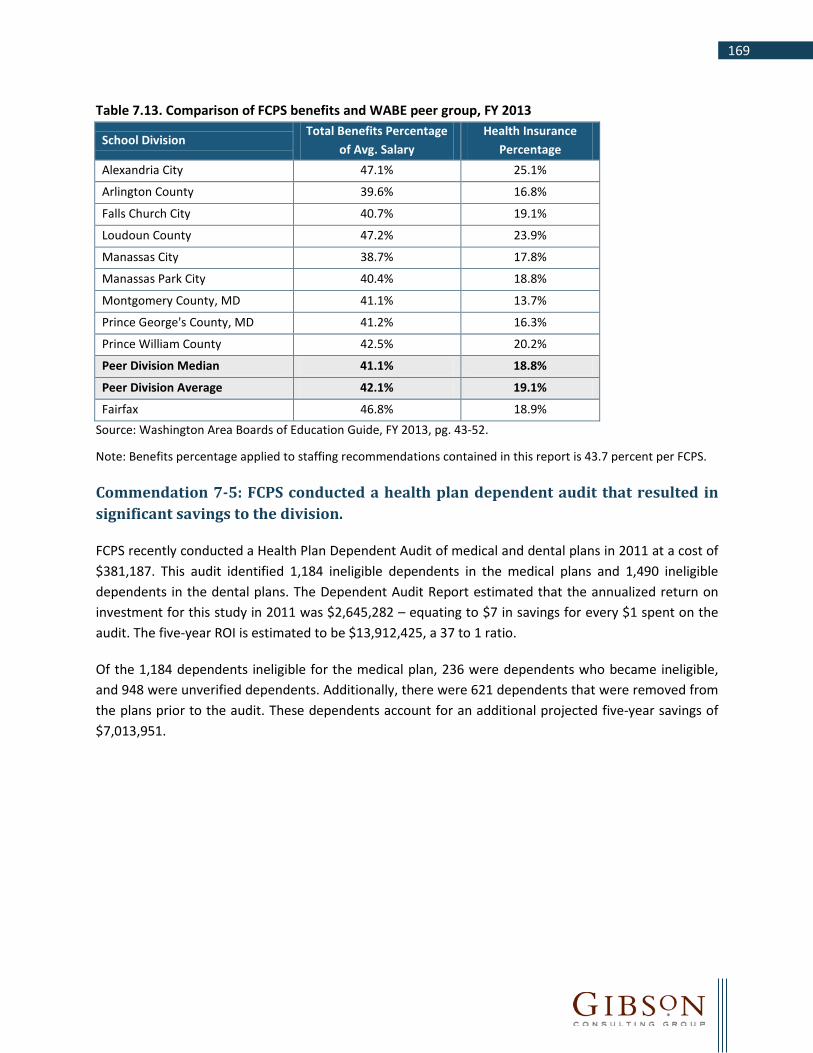
169
Table 7.13. Comparison of FCPS benefits and WABE peer group, FY 2013
School Division Total Benefits Percentage
of Avg. Salary Health Insurance
Percentage Alexandria City 47.1% 25.1%
Arlington County 39.6% 16.8%
Falls Church City 40.7% 19.1%
Loudoun County 47.2% 23.9%
Manassas City 38.7% 17.8%
Manassas Park City 40.4% 18.8%
Montgomery County, MD 41.1% 13.7%
Prince George's County, MD 41.2% 16.3%
Prince William County 42.5% 20.2%
Peer Division Median 41.1% 18.8%
Peer Division Average 42.1% 19.1%
Fairfax 46.8% 18.9% Source: Washington Area Boards of Education Guide, FY 2013, pg. 43-52.
Note: Benefits percentage applied to staffing recommendations contained in this report is 43.7 percent per FCPS.
Commendation 7-5: FCPS conducted a health plan dependent audit that resulted in significant savings to the division.
FCPS recently conducted a Health Plan Dependent Audit of medical and dental plans in 2011 at a cost of $381,187. This audit identified 1,184 ineligible dependents in the medical plans and 1,490 ineligible dependents in the dental plans. The Dependent Audit Report estimated that the annualized return on investment for this study in 2011 was $2,645,282 – equating to $7 in savings for every $1 spent on the audit. The five-year ROI is estimated to be $13,912,425, a 37 to 1 ratio.
Of the 1,184 dependents ineligible for the medical plan, 236 were dependents who became ineligible, and 948 were unverified dependents. Additionally, there were 621 dependents that were removed from the plans prior to the audit. These dependents account for an additional projected five-year savings of $7,013,951.

170
This page intentionally left blank.
171
Appendices

172
This page intentionally left blank.

173
Appendix A – Fiscal Impact Summary Table A.1 lists all recommendations made as a result of the review, by operational area, priority level for implementing each recommendation, as well as estimated savings, investments, and net fiscal impacts.
Table A.1. Summary of fiscal impacts (five-year)
Recommendations One-Time
Costs/ Savings
2013-14 2014-15 2015-16 2016-17 2017-18 Total Fiscal
Impact
Chapter 1 – Governance and Administration
1-1. Develop a long-range strategic plan. $0 $0 $0 $0 $0 $0 $0
1-2. Expand on current county data dashboard initiative. ($500,000) ($40,000) ($40,000) ($40,000) ($40,000) ($40,000) ($700,000)
1-3. Expand role of the board’s internal audit function. ($75,000) $0 ($300,000) ($300,000) ($300,000) ($300,000) ($1,275,000) 1-4. Develop a decision-making framework for instructional and school administrators.
($50,000) $0 $0 $0 $0 $0 ($50,000)
1-5. Improve policy and procedure update practices. $0 $0 $0 $0 $0 $0 $0
Net Fiscal Impact – Chapter 1 ($625,000) ($40,000) ($340,000) ($340,000) ($340,000) ($340,000) ($2,025,000)
Chapter 2 – Educational Service Delivery 2-1. Pilot the use of part-time principals at elementary schools to obtain optimal staff levels.
$0 $0 $0 $0 $0 $0 $0
2-2. Adjust school office assistant staffing formulas to reflect work demands.
$0 $0 $4,629,291 $4,629,291 $4,629,291 $4,629,291 $18,517,164
2-3. Standardize elements of the division’s curriculum support materials.
$0 $0 $0 $0 $0 $0 $0
2-4. Define requirements for a divisionwide interim assessment system.
($50,000) $0 $0 $0 $0 $0 ($50,000)
2-5. Accelerate implementation of the division’s Response to Intervention (RtI) model.
$0 ($1,050,000) ($1,050,000) $0 $0 $0 ($2,100,000)
2-6. Increase the inclusion of students with disabilities into general education environments.
($50,000) $0 $0 $0 $0 $0 ($50,000)

174
Recommendations One-Time
Costs/ Savings
2013-14 2014-15 2015-16 2016-17 2017-18 Total Fiscal
Impact
2-7. Collaborate with county administration to reduce the number of students served out-of-district in multi-agency services.
$0 $0 $0 $0 $0 $0 $0
Net Fiscal Impact – Chapter 2 ($100,000) ($1,050,000) $3,579,291 $4,629,291 $4,629,291 $4,629,291 $16,317,164
Chapter 3 – Facilities
3-1. Conduct internal audit of the facilities management. ($50,000) $0 $0 $0 $0 $0 ($50,000) 3-2. Develop long-range plan to upgrade facilities technology and design standards.
$0 $0 $0 $0 $0 $0 $0
3-3. Conduct re-engineering study of facilities purchasing and warehousing functions.
($100,000) $0 $0 $0 $0 $0 ($100,000)
3-4. Implement centralized management approach to custodial services.
$0 ($896,139) ($896,139) ($896,139) ($896,139) ($896,139) ($4,480,695)
3-5. Modify the custodial staffing formula to reflect current staffing standards.
$0 $0 $4,170,384 $8,340,768 $8,340,768 $8,340,768 $29,192,688
3-6. Make additional investments to realize energy savings. $0 ($923,183) ($364,098) $194,987 $754,072 $1,313,157 $974,935
Net Fiscal Impact – Chapter 3 ($150,000) ($1,819,322) $2,910,147 $7,639,616 $8,198,701 $8,757,786 $25,536,928
Chapter 4 – Transportation
4-1. Implement customer service database. ($100,000) ($10,000) ($10,000) ($10,000) ($10,000) ($10,000) ($150,000) 4-2. Establish a centralized dispatch and customer-response call center.
$0 $0 $0 $0 $0 $0 ($0)
4-3. Implement transportation data dashboard and web-based operational data distribution.
($150,000) ($15,000) ($15,000) ($15,000) ($15,000) ($15,000) ($225,000)
4-4. Establish a reserve for bus replacement. $0 ($6,400,000) ($6,400,000) ($6,400,000) ($6,400,000) ($6,400,000) ($32,000,000)
Net Fiscal Impact – Chapter 4 ($250,000) ($6,425,000) ($6,425,000) ($6,425,000) ($6,425,000) ($6,425,000) ($32,375,000)
Chapter 5 –Technology Management
5-1. Develop a divisionwide analytical tool. ($1,000,000) $0 ($50,000) ($50,000) ($50,000) ($50,000) ($1,200,000)
Net Fiscal Impact – Chapter 5 ($1,000,000) $0 ($50,000) ($50,000) ($50,000) ($50,000) ($1,200,000)

175
Recommendations One-Time
Costs/ Savings
2013-14 2014-15 2015-16 2016-17 2017-18 Total Fiscal
Impact
Chapter 6 – Financial Management 6-1. Separately identify and summarize budget reductions resulting from cuts, efficiencies, and program shifts.
$0 $0 $0 $0 $0 $0 $0
6-2. Allocate all eligible indirect costs to the food and nutrition services operation.
$0 $957,254 $957,254 $957,254 $957,254 $957,254 $4,786,270
6-3. Consolidate student activity funds into a single division bank account.
$0 $0 $0 $0 $0 $0 $0
6-4. Implement automated timekeeping system to streamline school payroll processes.
($200,000) $0 $0 $0 $0 $0 ($200,000)
6-5. Conduct additional training to eliminate manual, duplicative financial transaction processing at schools.
$0 $0 $0 $0 $0 $0 $0
Net Fiscal Impact – Chapter 6 ($200,000) $957,254 $957,254 $957,254 $957,254 $957,254 $4,586,270
Chapter 7 – Human Resources 7-1. Track Full-Time Equivalent (FTE) counts for all FCPS employees.
$0 $0 $0 $0 $0 $0 $0
7-2. Re-evaluate and revise the metric/goals being tracked in the HR Monitoring Report.
$0 $0 $0 $0 $0 $0 $0
7-3. Use a quality of hire metric to further refine those recruiting activities that yield higher quality teachers.
$0 $0 $0 $0 $0 $0 $0
7-4. Conduct study of causes of rising teacher turnover at schools.
$0 $0 $0 $0 $0 $0 $0
7-5. Update job descriptions. $0 $0 $0 $0 $0 $0 $0
Net Fiscal Impact – Chapter 7 $0 $0 $0 $0 $0 $0 $0
Grand Total Net Fiscal Impact ($2,325,000) ($8,377,068) $631,692 $6,411,161 $6,970,246 $7,529,331 $10,840,362 Note: Costs are negative. Savings are positive.

176
This page intentionally left blank.
177
Appendix B – Stakeholder Survey Results
Survey Development and Administration
A brief survey for Fairfax residents was created to examine the community’s opinions about the efficiency of Fairfax County Public Schools (FCPS and the division). Once finalized, the survey was programmed into an online survey platform, and the link was made available to the public through FCPSsurvey.com. The survey link was available to the community for a period of 3 weeks. To aid in promoting the survey, FCPS staff sent the survey link to all division employees and parents via email. In addition, the link was provided on the division’s homepage and promoted through FCPS social media accounts and newsletters for parents, employees, and the community.
Survey Sample
A total of 10,935 survey responses were submitted. Some responses were eliminated from the analytic dataset because the respondent indicated that they did not live in Fairfax, were under 18 years of age, or because their completion time was unrealistic (e.g., under one minute). Thus, a total of 10,265 responses were included in the final analytic sample.
The vast majority (89 percent) of respondents were parents, either of current FCPS students (75 percent) or of past FCPS students (13 percent). The remaining 11 percent of respondents had never been a parent of a FCPS student. Respondents were also predominantly women (76 percent), white (71 percent), and from high income households (63 percent reported annual household income over $100,000)14. Most respondents were in their 40s (42 percent), with many also in their 30s or 50s (another 46 percent). There was variability in the length of time respondents have lived in Fairfax, with most living there more than 10 years (66 percent), and 36 percent living there more than 20 years. Approximately one-third of respondents were currently employed by FCPS, (with another 4 percent being employed by FCPS at some point previously.)
Respondents were asked to identify themselves in terms of how familiar they are with the operations and decisions of FCPS. While 13 percent said they are mostly unaware of operations and decisions and 12 percent described themselves as actively involved, the majority of respondents (76 percent) described themselves as somewhere in the middle, indicating that they sometimes hear about things going on (e.g., on the radio or through conversations) or that they seek information (e.g., through news stories and social media). The box below displays additional demographic characteristics of the responding sample. (Note, respondents sometimes left a question blank, thus all demographic variables do not have 10,265 total responses.)
14 2010 census data for Fairfax County reports annual household income over $100,000 for 55% of the county’s population. Ethnicity comparisons could not be made due to differences in question format.
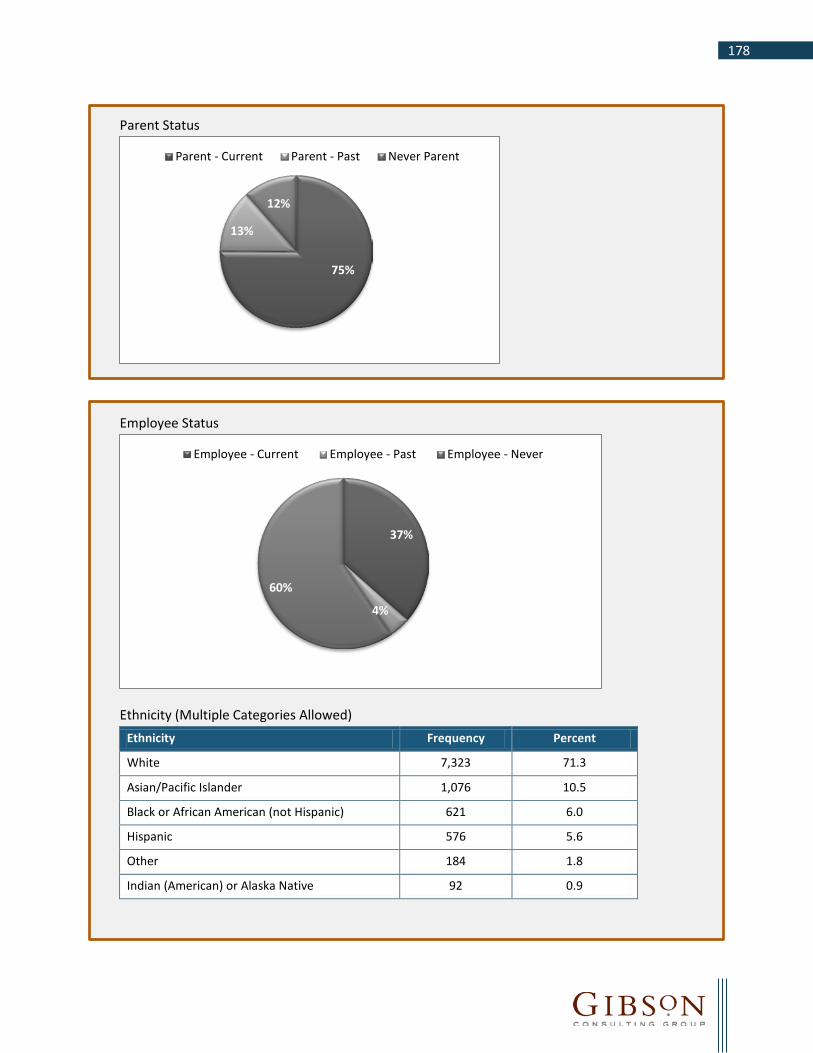
178
Parent Status
Employee Status
Ethnicity (Multiple Categories Allowed) Ethnicity Frequency Percent
White 7,323 71.3
Asian/Pacific Islander 1,076 10.5
Black or African American (not Hispanic) 621 6.0
Hispanic 576 5.6
Other 184 1.8
Indian (American) or Alaska Native 92 0.9
75%
13%
12%
Parent - Current Parent - Past Never Parent
37%
4%
60%
Employee - Current Employee - Past Employee - Never
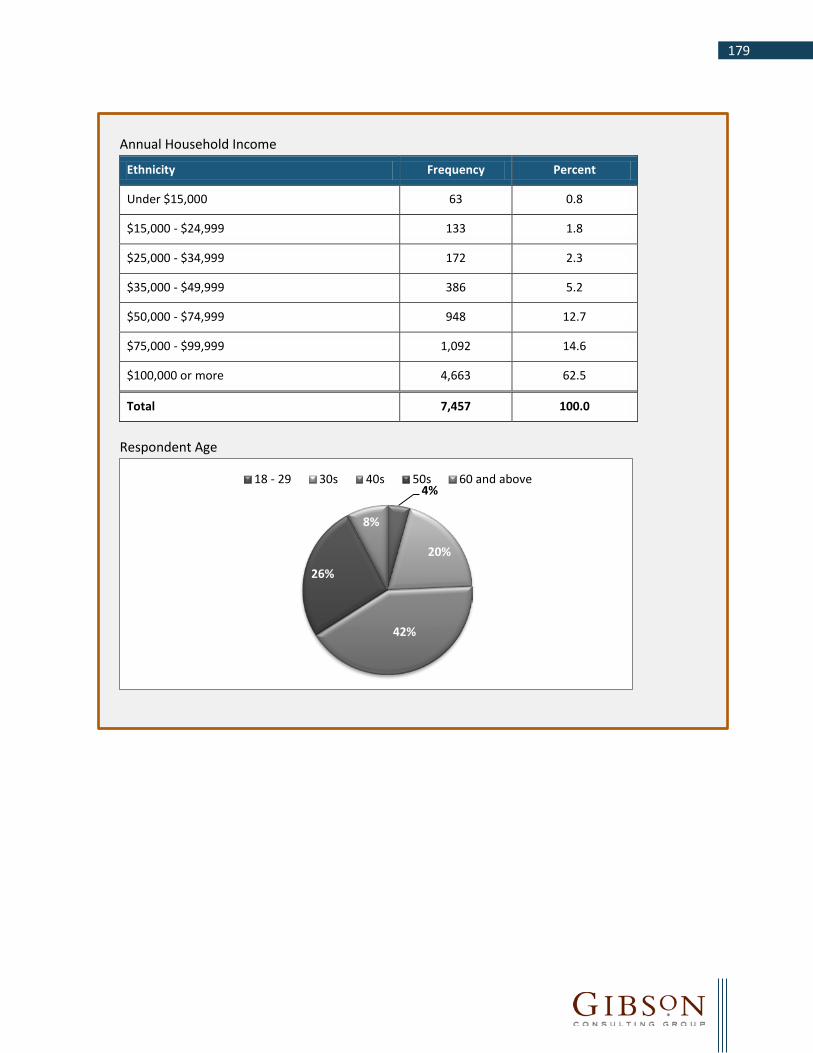
179
Annual Household Income
Ethnicity Frequency Percent
Under $15,000 63 0.8
$15,000 - $24,999 133 1.8
$25,000 - $34,999 172 2.3
$35,000 - $49,999 386 5.2
$50,000 - $74,999 948 12.7
$75,000 - $99,999 1,092 14.6
$100,000 or more 4,663 62.5
Total 7,457 100.0
Respondent Age
4%
20%
42%
26%
8%
18 - 29 30s 40s 50s 60 and above

180
Fairfax Residency
Number of Years Frequency Percent
Less than 1 year 286 3.2
1 – 5 years 1,264 14.3
6 – 10 years 1,467 16.6
11 – 15 years 1,601 18.1
16 – 20 years 1,060 12.0
More than 20 years 3,167 35.8
Total 8,845 100.0
Survey Results
Table B.1 presents the percentage of respondents who Agreed/Strongly Agreed, who Disagreed/Strongly Disagreed, or who responded “Don’t Know” to each of the survey items (three of which were phrased in the negative, and which are represented in red font). Questions were asked about functional areas where it was expected the community would have knowledge or opinions. These areas included facilities, operations, finances, governance and communications.
Overall, 85 percent of respondents agreed or strongly agreed that FCPS staff are helpful, while 80 percent agreed or strongly agreed that teachers are using current technology in their instruction. These were the two highest scoring items. The community was also positive towards staff responsiveness and maintenance of buildings (approximately 75 percent agreed with each of those statements). Almost two-thirds of the survey sample also agreed or strongly agreed that school bus stops are safe and that FCPS is up to date technologically. Approximately 75 percent of the sample did not endorse two negatively worded items, namely that student bus rides are too long and that the Board does not allow sufficient time for public input at meetings (approximately 25 percent agreed or strongly agreed).
Almost two–thirds of respondents agreed or strongly agreed that FCPS schools have too many portable buildings. For all of the items related to finance, a large proportion of respondents provided a response of “Don’t Know”, ranging from 19 percent to 47 percent of all responses. For example, 42 percent of respondents did not know whether financial reports are readily available to the community and 47 percent did not know whether the financial reports are easy to read/understand. Half of the entire respondent pool indicated that they did not know whether the Board allows sufficient time for public input at meetings.
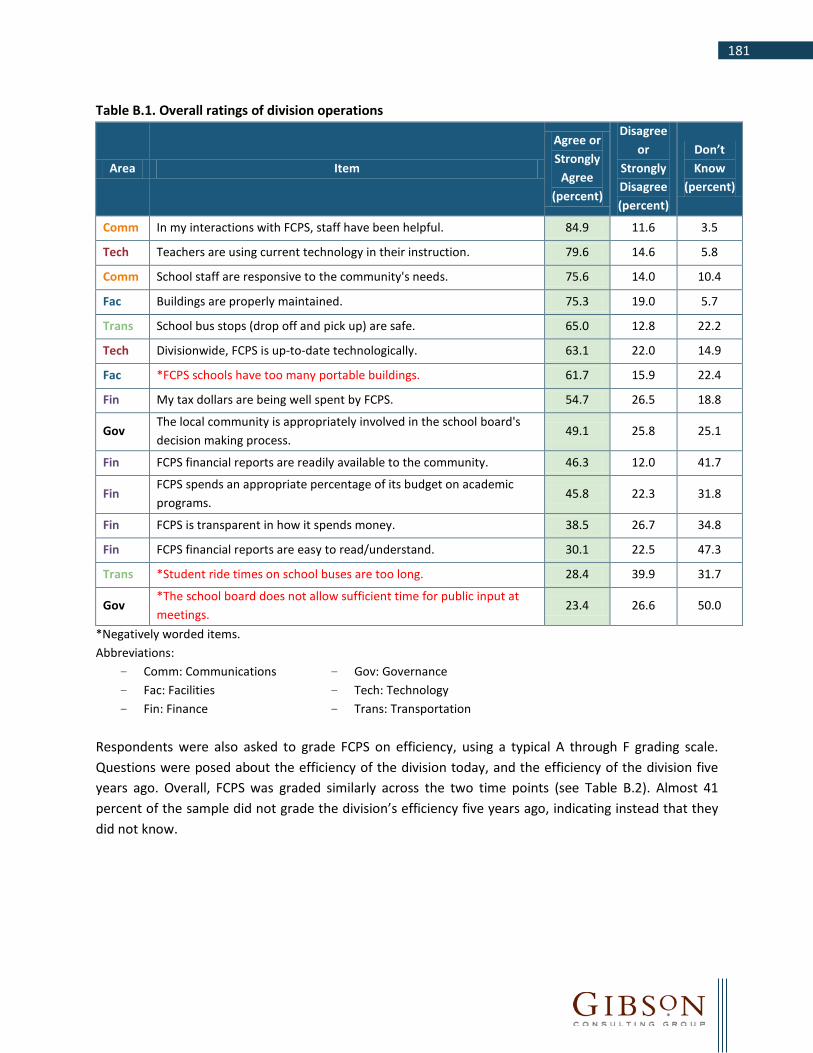
181
Table B.1. Overall ratings of division operations
Area Item
Agree or Strongly
Agree (percent)
Disagree or
Strongly Disagree (percent)
Don’t Know
(percent)
Comm In my interactions with FCPS, staff have been helpful. 84.9 11.6 3.5
Tech Teachers are using current technology in their instruction. 79.6 14.6 5.8
Comm School staff are responsive to the community's needs. 75.6 14.0 10.4
Fac Buildings are properly maintained. 75.3 19.0 5.7
Trans School bus stops (drop off and pick up) are safe. 65.0 12.8 22.2
Tech Divisionwide, FCPS is up-to-date technologically. 63.1 22.0 14.9
Fac *FCPS schools have too many portable buildings. 61.7 15.9 22.4
Fin My tax dollars are being well spent by FCPS. 54.7 26.5 18.8
Gov The local community is appropriately involved in the school board's decision making process.
49.1 25.8 25.1
Fin FCPS financial reports are readily available to the community. 46.3 12.0 41.7
Fin FCPS spends an appropriate percentage of its budget on academic programs.
45.8 22.3 31.8
Fin FCPS is transparent in how it spends money. 38.5 26.7 34.8
Fin FCPS financial reports are easy to read/understand. 30.1 22.5 47.3
Trans *Student ride times on school buses are too long. 28.4 39.9 31.7
Gov *The school board does not allow sufficient time for public input at meetings.
23.4 26.6 50.0
*Negatively worded items. Abbreviations:
- Comm: Communications - Gov: Governance - Fac: Facilities - Tech: Technology - Fin: Finance - Trans: Transportation
Respondents were also asked to grade FCPS on efficiency, using a typical A through F grading scale. Questions were posed about the efficiency of the division today, and the efficiency of the division five years ago. Overall, FCPS was graded similarly across the two time points (see Table B.2). Almost 41 percent of the sample did not grade the division’s efficiency five years ago, indicating instead that they did not know.
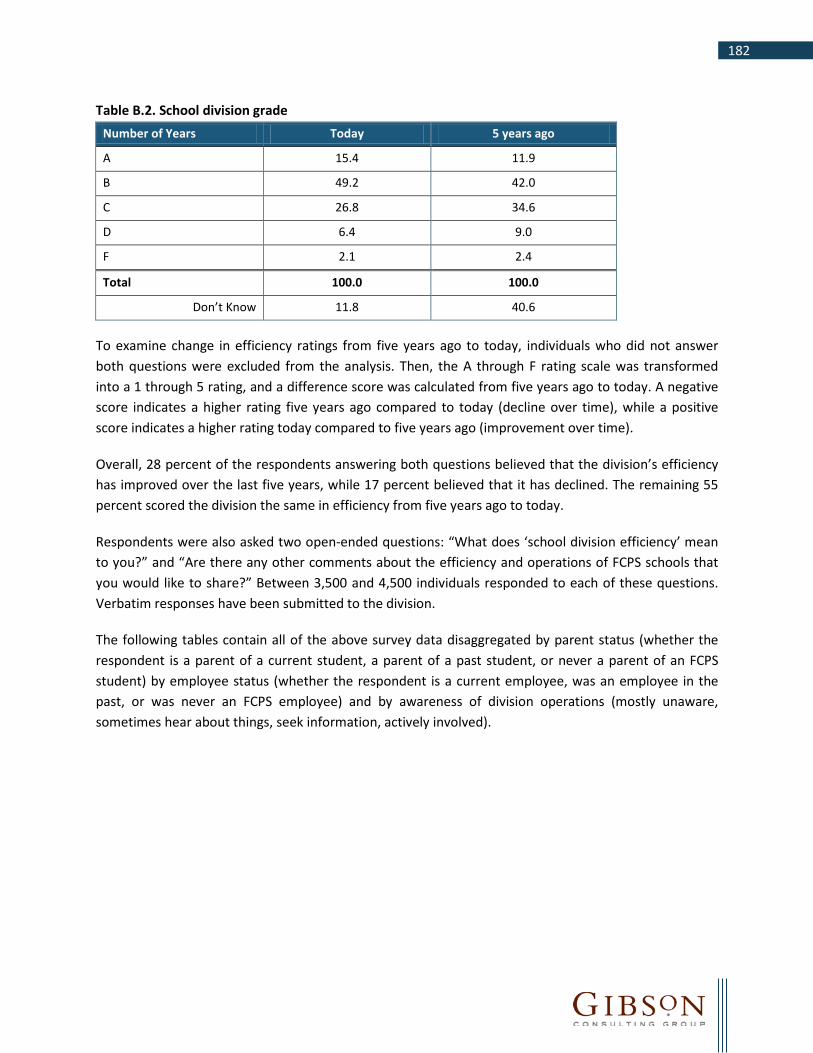
182
Table B.2. School division grade Number of Years Today 5 years ago
A 15.4 11.9
B 49.2 42.0
C 26.8 34.6
D 6.4 9.0
F 2.1 2.4
Total 100.0 100.0
Don’t Know 11.8 40.6
To examine change in efficiency ratings from five years ago to today, individuals who did not answer both questions were excluded from the analysis. Then, the A through F rating scale was transformed into a 1 through 5 rating, and a difference score was calculated from five years ago to today. A negative score indicates a higher rating five years ago compared to today (decline over time), while a positive score indicates a higher rating today compared to five years ago (improvement over time).
Overall, 28 percent of the respondents answering both questions believed that the division’s efficiency has improved over the last five years, while 17 percent believed that it has declined. The remaining 55 percent scored the division the same in efficiency from five years ago to today.
Respondents were also asked two open-ended questions: “What does ‘school division efficiency’ mean to you?” and “Are there any other comments about the efficiency and operations of FCPS schools that you would like to share?” Between 3,500 and 4,500 individuals responded to each of these questions. Verbatim responses have been submitted to the division.
The following tables contain all of the above survey data disaggregated by parent status (whether the respondent is a parent of a current student, a parent of a past student, or never a parent of an FCPS student) by employee status (whether the respondent is a current employee, was an employee in the past, or was never an FCPS employee) and by awareness of division operations (mostly unaware, sometimes hear about things, seek information, actively involved).

183
Parent Status
Table B.3. Survey responses by parent status (Parent of current student, Parent of past student, Never a parent of a FCPS student)
Area Item Overall Current
(n=7,577) Past
(n=1,354) Never
(n=1,164)
A or SA
D or SD
DK A or SA
D or SD
DK A or SA
D or SD
DK
Comm In my interactions with FCPS, staff have been helpful. 84.9 83.3 13.1 3.6 88.8 8.4 2.8 90.6 6.0 3.5
Tech Teachers are using current technology in their instruction. 79.6 78.7 15.3 6.0 82.8 11.0 6.1 81.3 14.7 4.1
Comm School staff are responsive to the community's needs. 75.6 72.5 15.6 11.8 83.5 11.5 5.0 85.4 7.1 7.5
Fac Buildings are properly maintained. 75.3 75.7 17.9 6.3 75.1 20.5 4.4 73.1 23.6 3.4
Trans School bus stops (drop off and pick up) are safe. 65.0 67.9 14.6 17.4 66.7 8.4 24.8 46.1 6.4 47.5
Tech Divisionwide, FCPS is up-to-date technologically. 63.1 61.6 20.7 17.7 69.2 24.4 6.4 65.7 27.1 7.1
Fac *FCPS schools have too many portable buildings. 61.7 60.7 15.2 24.0 66.5 18.1 15.4 62.8 17.1 20.1
Fin My tax dollars are being well spent by FCPS. 54.7 54.6 24.5 20.8 55.7 35.7 8.6 54.1 28.8 17.1
Gov The local community is appropriately involved in the school board's decision making process.
49.1 47.8 25.7 26.5 60.5 27.6 11.9 45.3 24.9 29.7
Fin FCPS financial reports are readily available to the community.
46.3 44.7 11.3 44.0 56.2 14.6 29.2 45.8 12.6 41.6
Fin FCPS spends an appropriate percentage of its budget on academic programs.
45.8 42.7 21.1 36.2 57.2 28.1 14.8 52.2 23.7 24.2
Fin FCPS is transparent in how it spends money. 38.5 37.1 24.1 38.8 45.5 37.6 16.9 39.2 30.9 29.9
Fin FCPS financial reports are easy to read/understand. 30.1 28.6 19.9 51.6 39.2 31.8 29.0 30.1 28.6 41.3
Trans *Student ride times on school buses are too long. 28.4 30.6 42.2 27.3 26.7 38.8 34.5 18.4 27.9 53.8
Gov *The school board does not allow sufficient time for public input at meetings.
23.4 23.0 25.5 51.5 28.7 36.6 34.6 19.6 22.0 58.4
*Table Notes: A or SA (Agree or Strongly Agree); D or SD (Disagree or Strongly Disagree); DK (Don’t Know). All table values are percentages.

184
Table B.4. School division grading by parent status
Change in Grade Overall Current
(n=3,502) Past
(n=1,178) Never
(n=710)
Improved 28.2 29.4 25.8 25.5
Stayed the Same 54.8 56.1 52.4 51.4
Declined 17.0 14.4 21.8 23.5
*Table Note: All table values are percentages.

185
Employee Status
Table B.5. Survey responses by employee status (Current employee, Past employee, Never an employee)
Area Item Overall Current
(n=3,683) Past
(n=403) Never
(n=6,011)
A or SA
D or SD
DK A or SA
D or SD
DK A or SA
D or SD
DK
Comm In my interactions with FCPS, staff have been helpful. 84.9 91.6 5.9 2.5 83.0 13.5 3.5 80.9 15.0 4.1
Tech Teachers are using current technology in their instruction. 79.6 83.2 13.1 3.7 75.5 17.8 6.8 77.9 15.3 6.8
Comm School staff are responsive to the community's needs. 75.6 85.9 8.1 5.9 67.6 20.8 11.6 69.8 17.1 13.0
Fac Buildings are properly maintained. 75.3 75.3 21.8 2.9 71.8 22.7 5.5 75.9 16.8 7.4
Trans School bus stops (drop off and pick up) are safe. 65.0 61.4 9.0 29.7 66.6 17.1 16.3 67.4 14.7 17.9
Tech Divisionwide, FCPS is up-to-date technologically. 63.1 67.9 25.7 6.4 60.1 27.4 12.6 60.6 19.0 20.4
Fac *FCPS schools have too many portable buildings. 61.7 65.7 16.8 17.5 68.2 14.5 17.3 58.7 15.3 26.0
Fin My tax dollars are being well spent by FCPS. 54.7 57.4 29.4 13.1 45.6 34.3 20.1 54.0 23.8 22.3
Gov The local community is appropriately involved in the school board's decision making process.
49.1 55.5 24.3 20.1 48.4 30.8 20.8 45.4 26.2 28.4
Fin FCPS financial reports are readily available to the community.
46.3 54.0 11.5 34.5 45.2 14.8 39.9 41.8 11.9 46.3
Fin FCPS spends an appropriate percentage of its budget on academic programs.
45.8 56.1 24.0 19.9 40.9 29.0 30.1 39.9 20.6 39.5
Fin FCPS is transparent in how it spends money. 38.5 45.0 31.0 24.0 35.3 34.8 30.0 34.9 23.2 41.9
Fin FCPS financial reports are easy to read/understand. 30.1 36.4 28.1 35.5 26.1 29.6 44.4 26.5 18.4 55.1
Trans *Student ride times on school buses are too long. 28.4 26.2 34.8 38.9 35.6 39.8 24.6 29.3 43.1 27.6
Gov *The school board does not allow sufficient time for public input at meetings.
23.4 23.4 31.1 45.5 28.5 25.5 46.0 22.7 23.9 53.4
*Table Notes: A or SA (Agree or Strongly Agree); D or SD (Disagree or Strongly Disagree); DK (Don’t Know). All table values are percentages.

186
Table B.6. School division grading by employee status
Change in Grade Overall Current
(n=2,686) Past
(n=294) Never
(n=2,975)
Improved 28.2 27.8 28.9 29
Stayed the Same 54.8 52.1 52.4 57.4
Declined 17.0 20.2 18.7 13.6
*Table Note: All table values are percentages.

187
Involvement in School Division Operations
Table B.7. Survey responses by awareness of operations (Unaware, Sometimes Hear, Seek Info, Active)
Area Item Overall Unaware (n=1,291)
Sometimes Hear (n=3,665)
Seek Info (n=4,072)
Active (n=1,183)
A or SA
D or SD
DK A or SA
D or SD
DK A or SA
D or SD
DK A or SA
D or SD
DK
Comm In my interactions with FCPS, staff have been helpful.
84.9 77.0 16.8 6.2 85.2 10.3 4.5 86.7 10.9 2.4 86.6 12.1 1.3
Tech Teachers are using current technology in their instruction.
79.6 72.3 17.0 10.7 79.3 14.3 6.4 81.9 13.7 4.4 80.9 16.0 3.1
Comm School staff are responsive to the community's needs.
75.6 64.8 17.6 17.6 73.3 12.1 14.6 79.4 13.9 6.6 81.9 15.5 2.6
Fac Buildings are properly maintained. 75.3 73.4 17.4 9.2 74.9 18.3 6.8 76.6 18.9 4.5 74.0 23.4 2.5
Trans School bus stops (drop off and pick up) are safe. 65.0 64.5 12.1 23.4 62.8 12.7 24.6 66.2 12.7 21.2 68.4 14.2 17.4
Tech Divisionwide, FCPS is up-to-date technologically. 63.1 55.2 20.4 24.4 60.6 20.2 19.3 67.4 22.1 10.6 64.7 28.9 6.4
Fac *FCPS schools have too many portable buildings. 61.7 55.3 15.2 29.5 61.2 13.8 25.0 62.4 17.2 20.4 67.8 18.0 14.2
Fin My tax dollars are being well spent by FCPS. 54.7 42.4 26.1 31.5 50.9 24.1 24.9 60.6 26.9 12.5 59.2 33.2 7.6
Gov The local community is appropriately involved in the school board's decision making process.
49.1 36.0 22.2 41.9 44.3 23.6 32.1 56.0 26.0 18.0 55.4 35.8 8.8
Fin FCPS financial reports are readily available to the community.
46.3 33.7 13.0 53.3 36.2 10.1 53.7 55.2 12.0 32.7 60.6 16.3 23.1
Fin FCPS spends an appropriate percentage of its budget on academic programs.
45.8 33.5 20.2 46.3 39.3 19.5 41.2 52.9 23.2 23.9 55.2 30.0 14.8
Fin FCPS is transparent in how it spends money. 38.5 27.6 23.9 48.5 31.0 23.2 45.8 46.1 28.0 25.9 47.7 35.9 16.3
Fin FCPS financial reports are easy to read/understand. 30.1 22.2 18.9 58.9 20.2 19.3 60.5 37.7 24.0 38.3 42.9 31.5 25.6
Trans *Student ride times on school buses are too long. 28.4 26.6 40.7 32.8 27.9 37.5 34.6 28.4 41.0 30.6 32.1 42.0 25.9
Gov *The school board does not allow sufficient time for public input at meetings.
23.4 20.6 18.5 61.0 20.2 18.6 61.2 24.3 32.4 43.3 33.0 40.2 26.8
*Table Notes: A or SA (Agree or Strongly Agree); D or SD (Disagree or Strongly Disagree); DK (Don’t Know). All table values are percentages.

188
Table B.8. School division grading by awareness of operations
Change in Grade Overall Unaware (n=628)
Sometimes Hear
(n=1,889)
Seek Info (n=2,652)
Active (n=866)
Improved 28.2 25.6 27.7 28.6 30.3
Stayed the Same 54.8 54.6 56.9 54.8 50.5
Declined 17.0 19.8 15.5 16.7 19.1
*Table Note: All table values are percentages.

189
Appendix C – Peer Comparisons Table C.1. Overview
School Division FY 2012 Actual Membership
FY 2012 Percentage ESOL
Membership
FY 2012 Percentage Free/Reduced
Price Meal Eligible
FY 2012 Percentage Special Education
Membership
Total Number of Schools
Alexandria City 12,395 22.7% 56.1% 12.8% 22
Arlington County 21,878 16.9% 31.0% 14.7% 37
Falls Church City 2,178 8.1% 7.1% 12.6% 4
Loudoun County 65,668 7.1% 15.3% 11.6% 82
Manassas City 7,156 33.0% 51.4% 13.9% 9
Manassas Park City 3,071 35.6% 54.9% 11.6% 4
Montgomery County, MD 146,497 12.7% 32.3% 11.9% 202
Prince George's County, MD 123,833 12.0% 57.7% 11.6% 207
Prince William County 81,944 16.3% 37.0% 11.5% 91
Peer Division Average 51,624 18.3% 38.1% 12.5% 73.1
Fairfax County 177,918 15.7% 25.9% 13.9% 196 Source: Washington Area Boards of Education Guide FY 2013, pgs. 5-15; 40
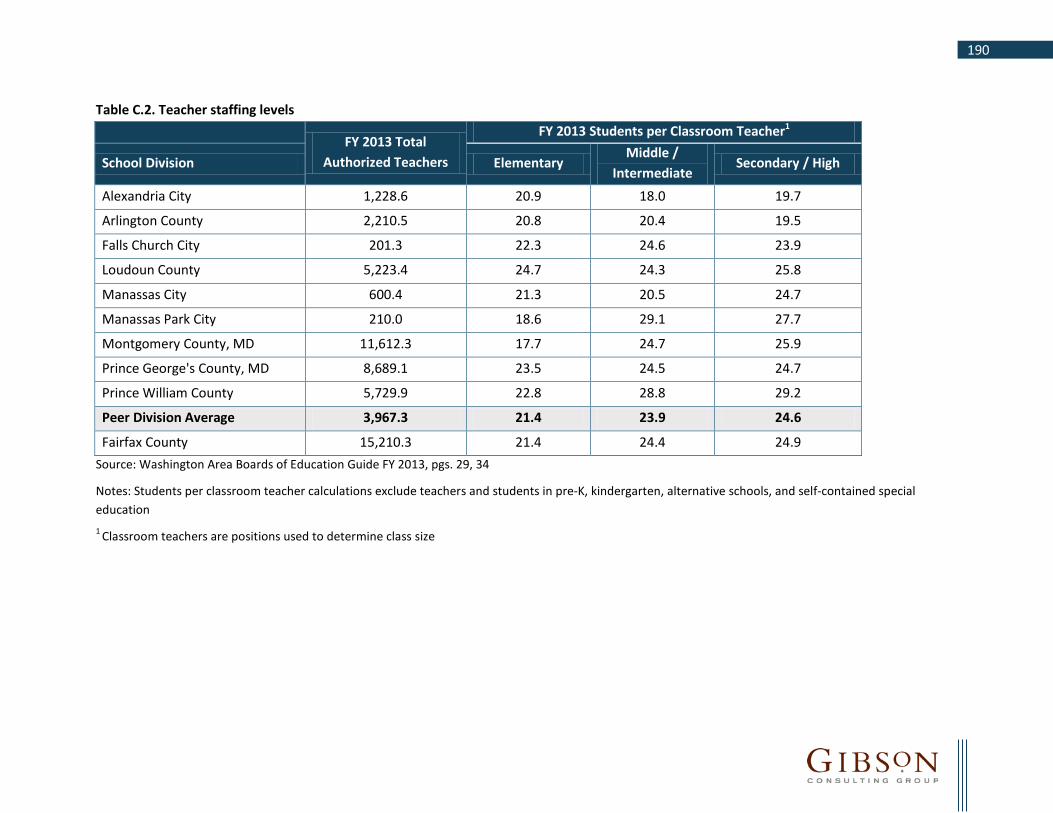
190
Table C.2. Teacher staffing levels
FY 2013 Total
Authorized Teachers
FY 2013 Students per Classroom Teacher1
School Division Elementary Middle /
Intermediate Secondary / High
Alexandria City 1,228.6 20.9 18.0 19.7
Arlington County 2,210.5 20.8 20.4 19.5
Falls Church City 201.3 22.3 24.6 23.9
Loudoun County 5,223.4 24.7 24.3 25.8
Manassas City 600.4 21.3 20.5 24.7
Manassas Park City 210.0 18.6 29.1 27.7
Montgomery County, MD 11,612.3 17.7 24.7 25.9
Prince George's County, MD 8,689.1 23.5 24.5 24.7
Prince William County 5,729.9 22.8 28.8 29.2
Peer Division Average 3,967.3 21.4 23.9 24.6
Fairfax County 15,210.3 21.4 24.4 24.9 Source: Washington Area Boards of Education Guide FY 2013, pgs. 29, 34
Notes: Students per classroom teacher calculations exclude teachers and students in pre-K, kindergarten, alternative schools, and self-contained special education 1 Classroom teachers are positions used to determine class size

191
Table C.3. Sources of revenue – school operating fund
School Division Federal Funds State Funds Local Funds Beginning balance
Other Funds Total Funds
Alexandria City 4.0% 13.6% 79.0% 3.0% 0.3% 99.9%
Arlington County 2.0% 12.2% 83.0% 2.3% 0.5% 100.0%
Falls Church City 1.3% 13.9% 78.2% 3.8% 2.8% 100.0%
Loudoun County 1.8% 31.0% 65.2% 1.2% 0.8% 100.0%
Manassas City 3.6% 47.9% 47.7% 0.0% 0.7% 99.9%
Manassas Park City 3.7% 60.8% 32.1% 0.0% 3.5% 100.1%
Montgomery County, MD 3.1% 28.0% 67.5% 0.8% 0.6% 100.0%
Prince George's County, MD 6.4% 54.4% 38.0% 0.0% 1.2% 100.0%
Prince William County 3.2% 49.0% 43.9% 3.7% 0.3% 100.1%
Peer Division Average 3.2% 34.5% 59.4% 1.6% 1.2% 100.0%
Fairfax County 2.9% 22.9% 69.4% 2.4% 2.5% 100.1% Source: Washington Area Boards of Education Guide FY 2013, pg. 25
Note: Funds for entitlement grants are included here under the School Operating Fund for consistency with other districts, although some districts may not consider these funds as part of their operating funds.
Note: May not total due to rounding.

192
Table C.4. Cost per pupil School Division FY 2011 Approved FY 2012 Approved FY 2013 Approved
Alexandria City $16,983 $17,618 $17,024
Arlington County $17,322 $18,047 $18,675
Falls Church City $16,729 $16,309 $16,612
Loudoun County $10,833 $11,014 $11,595
Manassas City $11,351 $11,478 $12,108
Manassas Park City n/a $9,888 $10,619
Montgomery County, MD n/a $14,776 $14,880
Prince George's County, MD $11,611 $11,753 $12,296
Prince William County $9,577 $9,852 $10,163
Peer Division Average $13,487 $13,415 $13,775
Fairfax County $12,597 $12,820 $13,564 Source: Washington Area Boards of Education Guide FY 2013, pg. 31 1 Manassas Park City Public Schools started participating in WABE guide in FY 2012 2 Montgomery County Public Schools did not participate in WABE guide in FY 2011
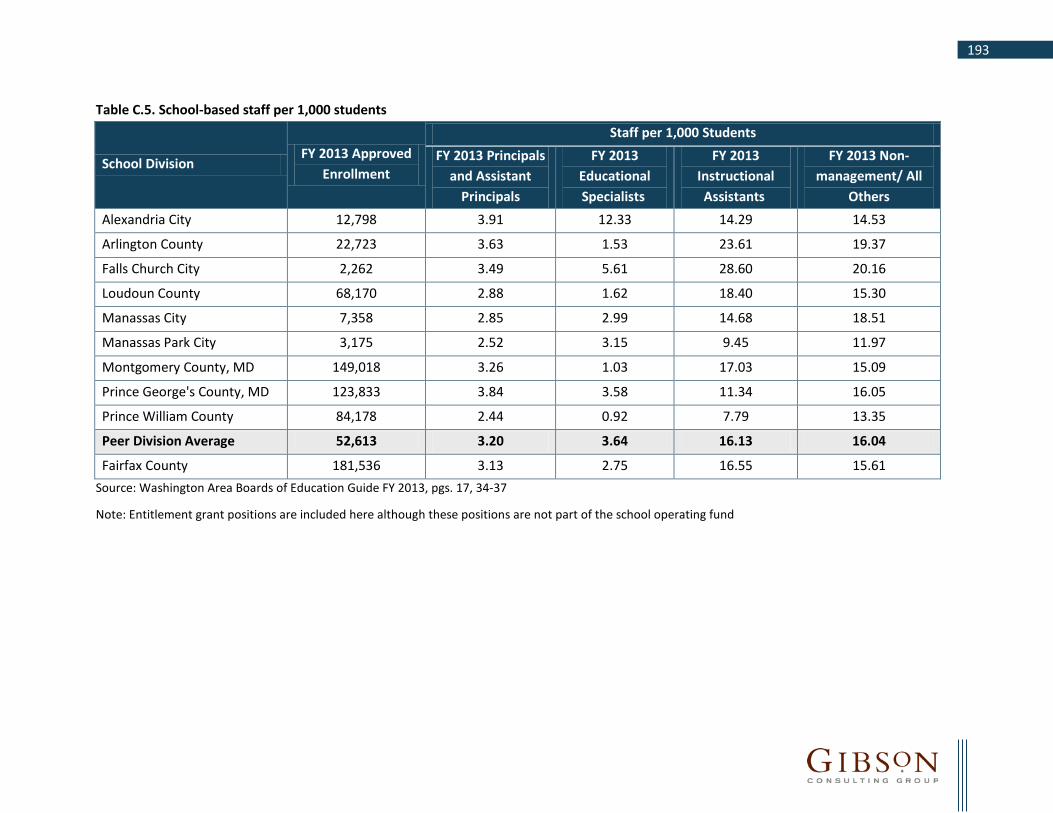
193
Table C.5. School-based staff per 1,000 students
School Division FY 2013 Approved
Enrollment
Staff per 1,000 Students FY 2013 Principals
and Assistant Principals
FY 2013 Educational Specialists
FY 2013 Instructional Assistants
FY 2013 Non-management/ All
Others Alexandria City 12,798 3.91 12.33 14.29 14.53
Arlington County 22,723 3.63 1.53 23.61 19.37
Falls Church City 2,262 3.49 5.61 28.60 20.16
Loudoun County 68,170 2.88 1.62 18.40 15.30
Manassas City 7,358 2.85 2.99 14.68 18.51
Manassas Park City 3,175 2.52 3.15 9.45 11.97
Montgomery County, MD 149,018 3.26 1.03 17.03 15.09
Prince George's County, MD 123,833 3.84 3.58 11.34 16.05
Prince William County 84,178 2.44 0.92 7.79 13.35
Peer Division Average 52,613 3.20 3.64 16.13 16.04
Fairfax County 181,536 3.13 2.75 16.55 15.61 Source: Washington Area Boards of Education Guide FY 2013, pgs. 17, 34-37
Note: Entitlement grant positions are included here although these positions are not part of the school operating fund

194
Table C.6. Nonschool-based educational specialists per 1,000 students
School Division FY 2013 Approved Enrollment Non-school Educational Specialists per
1000 Students Alexandria City 12,798 2.3
Arlington County 22,723 2.1
Falls Church City 2,262 0.7
Loudoun County 68,170 0.3
Manassas City 7,358 0.0
Manassas Park City 3,175 0.0
Montgomery County, MD 149,018 1.2
Prince George's County, MD 123,833 1.8
Prince William County 84,178 2.6
Peer Division Average 52,613 1.2
Fairfax County 181,536 0.7 Source: Washington Area Boards of Education Guide FY 2013, pgs. 17, 34-35

195
Table C.7. Nonschool-based, leadership staff per 1,000 students
School Division FY 2013 Approved Enrollment Leadership Team Per 1000
Students Management Per 1000
Students Alexandria City 12,798 0.4 2.0
Arlington County 22,723 0.4 2.4
Falls Church City 2,262 1.3 3.3
Loudoun County 68,170 0.1 1.5
Manassas City 7,358 0.3 1.5
Manassas Park City 3,175 0.6 2.2
Montgomery County, MD 149,018 0.1 1.6
Prince George's County, MD 123,833 0.2 1.4
Prince William County 84,178 0.1 1.4
Peer Division Average 52,613 0.4 1.9
Fairfax County 181,536 0.1 0.8 Source: Washington Area Boards of Education Guide FY 2013, pgs. 17, 34-35

196
Table C.8. Nonschool-based, technical/support and office support staff per 1,000 students
School Division FY 2013 Approved Enrollment Technical/Support Per 1000
Students Office Support Staff Per 1000
Students Alexandria City 12,798 4.6 2.8
Arlington County 22,723 4.0 2.6
Falls Church City 2,262 4.0 1.5
Loudoun County 68,170 1.8 2.2
Manassas City 7,358 1.2 2.0
Manassas Park City 3,175 1.6 2.5
Montgomery County, MD 149,018 3.2 2.0
Prince George's County, MD 123,833 1.8 2.8
Prince William County 84,178 1.9 1.6
Peer Division Average 52,613 2.7 2.2
Fairfax County 181,536 4.0 1.3 Source: Washington Area Boards of Education Guide FY 2013, pgs. 17, 34-35

197
Table C.9. Custodial and maintenance staff, FY 2013
School Division FY 2013
Approved Enrollment
School-based Custodians Non-School-based
Maintenance/Custodial Total per
1,000 students Staff FTEs
Per 1,000 Students
Staff FTEs Per 1,000 Students
Alexandria City 12,798 63.6 5.0 27.3 2.1 7.1
Arlington County 22,723 200.5 8.8 84.5 3.7 12.5
Falls Church City 2,262 22.5 9.9 2.0 0.9 10.8
Loudoun County 68,170 511.5 7.5 202.0 3.0 10.5
Manassas City 7,358 51.5 7.0 10.0 1.4 8.4
Manassas Park City 3,175 20.0 6.3 4.0 1.3 7.6
Montgomery County, MD 149,018 1,271.0 8.5 477.2 3.2 11.7
Prince George's County, MD 123,833 1,022.1 8.3 350.0 2.8 11.1
Prince William County 84,178 444.9 5.3 245.0 2.9 8.2
Peer Division Average 52,613 400.8 7.6 155.8 3.0 10.4
Fairfax County 181,536 1,381.0 7.6 401.0 2.2 9.8 Source: Washington Area Boards of Education Guide FY 2013, pgs. 17, 34-37
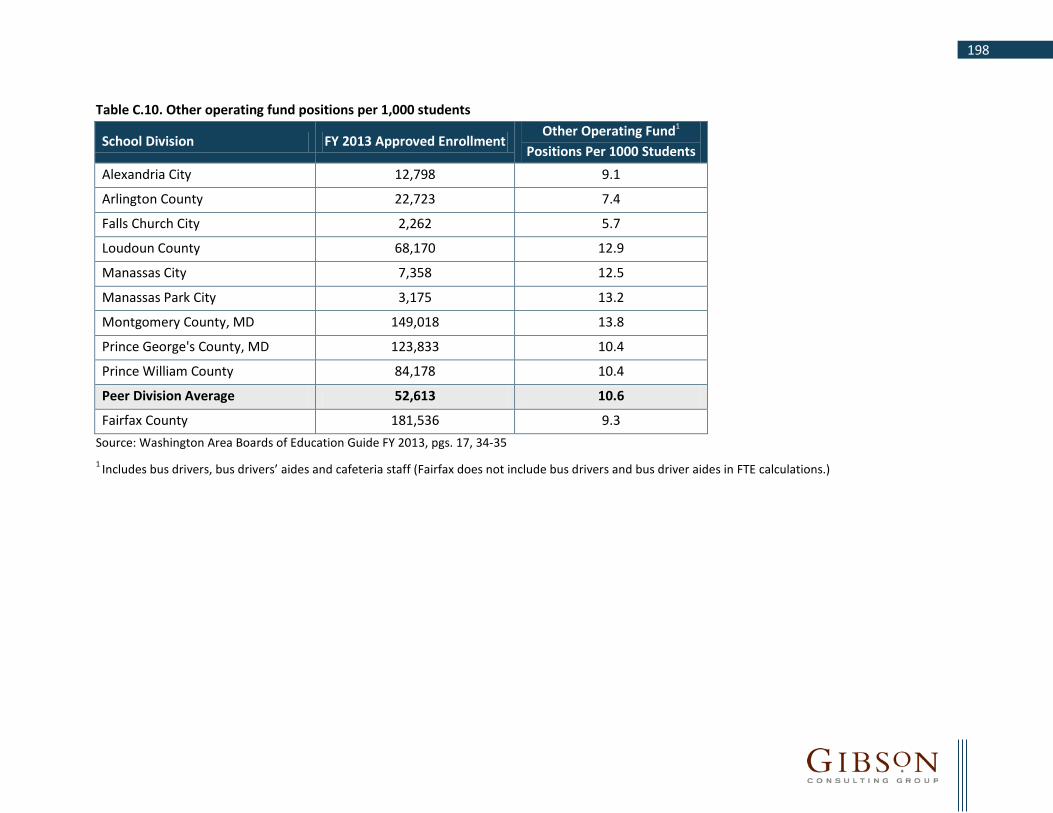
198
Table C.10. Other operating fund positions per 1,000 students
School Division FY 2013 Approved Enrollment Other Operating Fund1
Positions Per 1000 Students Alexandria City 12,798 9.1
Arlington County 22,723 7.4
Falls Church City 2,262 5.7
Loudoun County 68,170 12.9
Manassas City 7,358 12.5
Manassas Park City 3,175 13.2
Montgomery County, MD 149,018 13.8
Prince George's County, MD 123,833 10.4
Prince William County 84,178 10.4
Peer Division Average 52,613 10.6
Fairfax County 181,536 9.3 Source: Washington Area Boards of Education Guide FY 2013, pgs. 17, 34-35 1 Includes bus drivers, bus drivers’ aides and cafeteria staff (Fairfax does not include bus drivers and bus driver aides in FTE calculations.)

199
Table C.11. FY 2012 actual free and reduced lunch eligibility School Division Students Eligible Percent of Division Enrollment
Alexandria City 6,916 56.1%
Arlington County 6,835 31.0%
Falls Church City 151 7.1%
Loudoun County 10,063 15.3%
Manassas City 3,653 51.4%
Manassas Park City 1,670 54.9%
Montgomery County, MD 47,365 32.3%
Prince George's County, MD 71,506 57.7%
Prince William County 30,296 37.0%
Peer Division Average 19,828 38.1%
Fairfax County 46,117 25.9% Source: Washington Area Boards of Education Guide FY 2013, pg. 40

.
Changing the way public education is managed
1221 South MOPAC Expressway Suite 355
Austin, Texas 78746 www.gibsonconsult.com