Embed Size (px)
Citation preview

SCHOOL IMPACT FEE UPDATE STUDY
prepared for LEE COUNTY, FLORIDA
prepared by
in association with
Dr. James C. NicholasMaxwell & Hendry Valuation Services, Inc.
August 2008

Lee County\SCHOOL IMPACT FEE STUDY duncan|associates August 27, 2008, Page i
Contents
INTRODUCTION . . . . . . . . . . . . . . . . . . . . . . . . . . . . . . . . . . . . . . . . . . . . . . . . . . . . . . . . . . . . . . . 1
METHODOLOGY . . . . . . . . . . . . . . . . . . . . . . . . . . . . . . . . . . . . . . . . . . . . . . . . . . . . . . . . . . . . . . . 1
LEGAL FRAMEWORK . . . . . . . . . . . . . . . . . . . . . . . . . . . . . . . . . . . . . . . . . . . . . . . . . . . . . . . . . . . 1The Need Test . . . . . . . . . . . . . . . . . . . . . . . . . . . . . . . . . . . . . . . . . . . . . . . . . . . . . . . . . . . . . 3The Benefit Test . . . . . . . . . . . . . . . . . . . . . . . . . . . . . . . . . . . . . . . . . . . . . . . . . . . . . . . . . . . . 4Florida Statutes . . . . . . . . . . . . . . . . . . . . . . . . . . . . . . . . . . . . . . . . . . . . . . . . . . . . . . . . . . . . . 5
SCHOOL IMPACT FEES IN FLORIDA . . . . . . . . . . . . . . . . . . . . . . . . . . . . . . . . . . . . . . . . . . . . . 7
BENEFIT DISTRICTS . . . . . . . . . . . . . . . . . . . . . . . . . . . . . . . . . . . . . . . . . . . . . . . . . . . . . . . . . . . . 9
STUDENT GENERATION RATES . . . . . . . . . . . . . . . . . . . . . . . . . . . . . . . . . . . . . . . . . . . . . . . 112000 U.S. Census Data . . . . . . . . . . . . . . . . . . . . . . . . . . . . . . . . . . . . . . . . . . . . . . . . . . . . . . 11Calibrating to 2000 Actual Enrollment . . . . . . . . . . . . . . . . . . . . . . . . . . . . . . . . . . . . . . . . . 12New Units versus All Units . . . . . . . . . . . . . . . . . . . . . . . . . . . . . . . . . . . . . . . . . . . . . . . . . . 13Adjusting for Charter Schools . . . . . . . . . . . . . . . . . . . . . . . . . . . . . . . . . . . . . . . . . . . . . . . . 14
EXISTING LEVEL OF SERVICE . . . . . . . . . . . . . . . . . . . . . . . . . . . . . . . . . . . . . . . . . . . . . . . . . 15Student Station Capacity . . . . . . . . . . . . . . . . . . . . . . . . . . . . . . . . . . . . . . . . . . . . . . . . . . . . 15Existing School Inventory . . . . . . . . . . . . . . . . . . . . . . . . . . . . . . . . . . . . . . . . . . . . . . . . . . . 16Student-Capacity Ratio . . . . . . . . . . . . . . . . . . . . . . . . . . . . . . . . . . . . . . . . . . . . . . . . . . . . . . 18
CAPITAL COSTS . . . . . . . . . . . . . . . . . . . . . . . . . . . . . . . . . . . . . . . . . . . . . . . . . . . . . . . . . . . . . . . 19Construction Cost . . . . . . . . . . . . . . . . . . . . . . . . . . . . . . . . . . . . . . . . . . . . . . . . . . . . . . . . . 19Off-Site/Drainage Cost . . . . . . . . . . . . . . . . . . . . . . . . . . . . . . . . . . . . . . . . . . . . . . . . . . . . 23Land Cost . . . . . . . . . . . . . . . . . . . . . . . . . . . . . . . . . . . . . . . . . . . . . . . . . . . . . . . . . . . . . . . . 23Ancillary Facility Cost . . . . . . . . . . . . . . . . . . . . . . . . . . . . . . . . . . . . . . . . . . . . . . . . . . . . . . 26Interest Cost . . . . . . . . . . . . . . . . . . . . . . . . . . . . . . . . . . . . . . . . . . . . . . . . . . . . . . . . . . . . . . 28Cost Summary . . . . . . . . . . . . . . . . . . . . . . . . . . . . . . . . . . . . . . . . . . . . . . . . . . . . . . . . . . . . 29
REVENUE CREDITS . . . . . . . . . . . . . . . . . . . . . . . . . . . . . . . . . . . . . . . . . . . . . . . . . . . . . . . . . . . . 29State Capital Funding . . . . . . . . . . . . . . . . . . . . . . . . . . . . . . . . . . . . . . . . . . . . . . . . . . . . . . . 32Capital Improvement Tax . . . . . . . . . . . . . . . . . . . . . . . . . . . . . . . . . . . . . . . . . . . . . . . . . . . 33
NET COST SCHEDULES . . . . . . . . . . . . . . . . . . . . . . . . . . . . . . . . . . . . . . . . . . . . . . . . . . . . . . . . 36
Lee County\SCHOOL IMPACT FEE STUDY duncan|associates August 27, 2008, Page ii
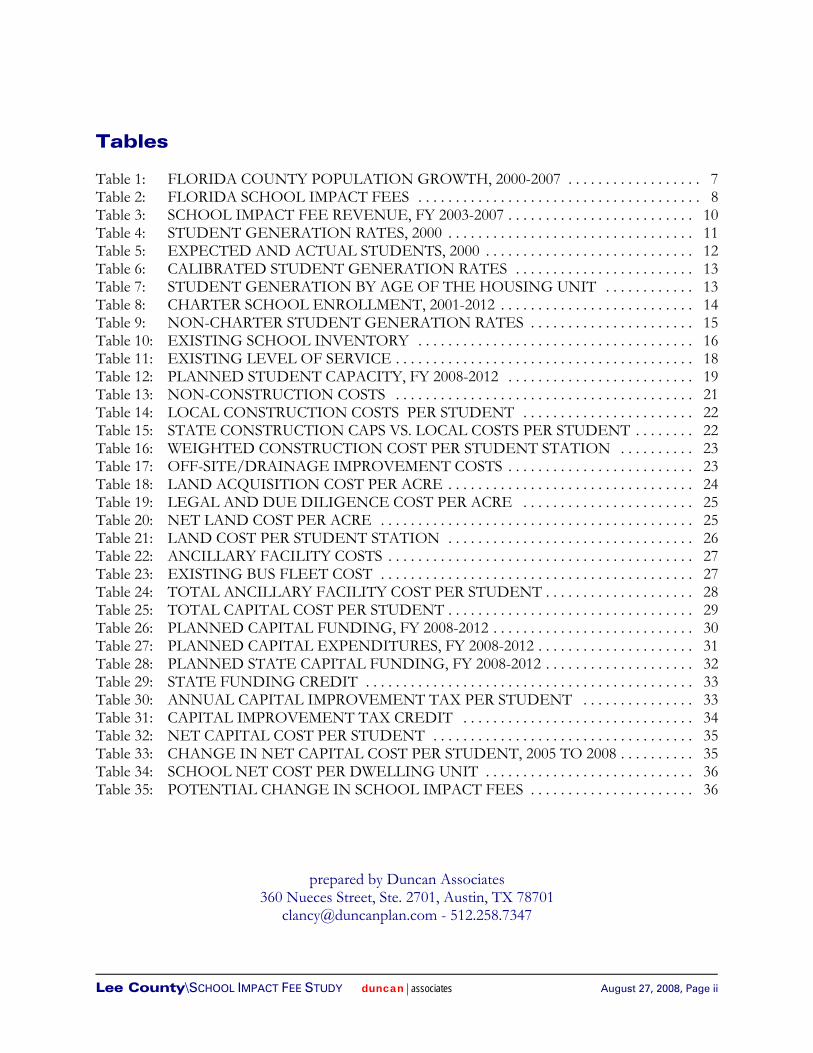
Tables
Table 1: FLORIDA COUNTY POPULATION GROWTH, 2000-2007 . . . . . . . . . . . . . . . . . . 7Table 2: FLORIDA SCHOOL IMPACT FEES . . . . . . . . . . . . . . . . . . . . . . . . . . . . . . . . . . . . . . 8Table 3: SCHOOL IMPACT FEE REVENUE, FY 2003-2007 . . . . . . . . . . . . . . . . . . . . . . . . . 10Table 4: STUDENT GENERATION RATES, 2000 . . . . . . . . . . . . . . . . . . . . . . . . . . . . . . . . . 11Table 5: EXPECTED AND ACTUAL STUDENTS, 2000 . . . . . . . . . . . . . . . . . . . . . . . . . . . . 12Table 6: CALIBRATED STUDENT GENERATION RATES . . . . . . . . . . . . . . . . . . . . . . . . 13Table 7: STUDENT GENERATION BY AGE OF THE HOUSING UNIT . . . . . . . . . . . . 13Table 8: CHARTER SCHOOL ENROLLMENT, 2001-2012 . . . . . . . . . . . . . . . . . . . . . . . . . . 14Table 9: NON-CHARTER STUDENT GENERATION RATES . . . . . . . . . . . . . . . . . . . . . . 15Table 10: EXISTING SCHOOL INVENTORY . . . . . . . . . . . . . . . . . . . . . . . . . . . . . . . . . . . . . 16Table 11: EXISTING LEVEL OF SERVICE . . . . . . . . . . . . . . . . . . . . . . . . . . . . . . . . . . . . . . . . 18Table 12: PLANNED STUDENT CAPACITY, FY 2008-2012 . . . . . . . . . . . . . . . . . . . . . . . . . 19Table 13: NON-CONSTRUCTION COSTS . . . . . . . . . . . . . . . . . . . . . . . . . . . . . . . . . . . . . . . . 21Table 14: LOCAL CONSTRUCTION COSTS PER STUDENT . . . . . . . . . . . . . . . . . . . . . . . 22Table 15: STATE CONSTRUCTION CAPS VS. LOCAL COSTS PER STUDENT . . . . . . . . 22Table 16: WEIGHTED CONSTRUCTION COST PER STUDENT STATION . . . . . . . . . . 23Table 17: OFF-SITE/DRAINAGE IMPROVEMENT COSTS . . . . . . . . . . . . . . . . . . . . . . . . . 23Table 18: LAND ACQUISITION COST PER ACRE . . . . . . . . . . . . . . . . . . . . . . . . . . . . . . . . . 24Table 19: LEGAL AND DUE DILIGENCE COST PER ACRE . . . . . . . . . . . . . . . . . . . . . . . 25Table 20: NET LAND COST PER ACRE . . . . . . . . . . . . . . . . . . . . . . . . . . . . . . . . . . . . . . . . . . 25Table 21: LAND COST PER STUDENT STATION . . . . . . . . . . . . . . . . . . . . . . . . . . . . . . . . . 26Table 22: ANCILLARY FACILITY COSTS . . . . . . . . . . . . . . . . . . . . . . . . . . . . . . . . . . . . . . . . . 27Table 23: EXISTING BUS FLEET COST . . . . . . . . . . . . . . . . . . . . . . . . . . . . . . . . . . . . . . . . . . 27Table 24: TOTAL ANCILLARY FACILITY COST PER STUDENT . . . . . . . . . . . . . . . . . . . . 28Table 25: TOTAL CAPITAL COST PER STUDENT . . . . . . . . . . . . . . . . . . . . . . . . . . . . . . . . . 29Table 26: PLANNED CAPITAL FUNDING, FY 2008-2012 . . . . . . . . . . . . . . . . . . . . . . . . . . . 30Table 27: PLANNED CAPITAL EXPENDITURES, FY 2008-2012 . . . . . . . . . . . . . . . . . . . . . 31Table 28: PLANNED STATE CAPITAL FUNDING, FY 2008-2012 . . . . . . . . . . . . . . . . . . . . 32Table 29: STATE FUNDING CREDIT . . . . . . . . . . . . . . . . . . . . . . . . . . . . . . . . . . . . . . . . . . . . 33Table 30: ANNUAL CAPITAL IMPROVEMENT TAX PER STUDENT . . . . . . . . . . . . . . . 33Table 31: CAPITAL IMPROVEMENT TAX CREDIT . . . . . . . . . . . . . . . . . . . . . . . . . . . . . . . 34Table 32: NET CAPITAL COST PER STUDENT . . . . . . . . . . . . . . . . . . . . . . . . . . . . . . . . . . . 35Table 33: CHANGE IN NET CAPITAL COST PER STUDENT, 2005 TO 2008 . . . . . . . . . . 35Table 34: SCHOOL NET COST PER DWELLING UNIT . . . . . . . . . . . . . . . . . . . . . . . . . . . . 36Table 35: POTENTIAL CHANGE IN SCHOOL IMPACT FEES . . . . . . . . . . . . . . . . . . . . . . 36
prepared by Duncan Associates360 Nueces Street, Ste. 2701, Austin, TX 78701
[email protected] - 512.258.7347

1 Duncan Associates, et. al., School Impact Fee Update Study, Lee County, Florida, September 2005
2 Duncan Associates and Dr. James C. Nicholas, Lee County School Impact Fee Study, November 2001
Lee County\SCHOOL IMPACT FEE STUDY duncan|associates August 27, 2008, Page 1
INTRODUCTION
This study was commissioned by Lee County to update the school impact fee calculations. The LeeCounty Board of County Commissioners adopted an ordinance imposing school impact fees inNovember 2001. The current fee schedule was adopted in November 2005. The county-wideordinance requires all new residential development within Lee County to pay applicable impact feesprior to the issuance of a building permit. Municipalities within the county collect the fees and turnthem over to the County, which in turn transmits them to the School Board to be spent on growth-related improvements according to the terms of an interlocal agreement between Lee County and theSchool District of Lee County.
METHODOLOGY
This update maintains the methodology utilized in the 2005 impact fee update.1 That prior study utilizeda methodology that differed from the original 2001 school impact fee study,2 which was challenged bya group of plaintiffs that included the Lee Building Industry Association and First Homebuilders ofFlorida. While the judge ruled in favor of the County, holding that the school impact fee methodologymet both prongs of the dual rational nexus test, the prior impact fee study’s approach was adjusted toaddress concerns raised by the trial court judge, who felt that the methodology should take intoconsideration future appreciation of property values. In addition, this update includes the legal andadministrative costs associated with the purchase of land, since these costs are part of the total cost ofland.
LEGAL FRAMEWORK
Impact fees are a way for local governments to require new developments to pay a proportionate shareof the infrastructure costs they impose on the community. In contrast to traditional “negotiated”developer exactions, impact fees are charges that are assessed on new development using a standardformula based on objective characteristics, such as the number and type of dwelling units constructed.The fees are one-time, up-front charges, with the payment usually made at the time of building permitissuance. Impact fees require that each new development project pay its pro-rata share of the cost ofnew capital facilities required to serve that development.
School impact fees have been litigated and upheld in Florida. In St. Johns County v. Northeast FloridaBuilders Association, the Florida Supreme Court ruled in 1991 that school impact fee ordinances do notconflict with the State constitutional requirement of a uniform system of public schools, and that neitherthe State constitution nor State law preempts county school impact fees. The Court further ruled thatthe failure of municipalities within the county to participate in the school impact fee could invalidatethe ordinance, since some of the funding would be used to construct schools that would benefitdevelopment not subject to the fee. For this reason, the Court held that no impact fee could becollected under the ordinance until “substantially all of the population of St. Johns County is subject tothe ordinance.”

3 There are six Florida cases that have guided the development of impact fees in the state: Contractors and BuildersAssociation of Pinellas County v. City of Dunedin, 329 So.2d 314 (Fla. 1976); Hollywood, Inc. v. Broward County, 431 So.2d 606 (Fla.1976); Home Builders and Contractors Association of Palm Beach County, Inc. v. Board of County Commissioners of Palm Beach County,446 So.2d 140 (Fla. 4th DCA 1983); Seminole County v. City of Casselberry, 541 So.2d 666 (Fla. 5th DCA 1989); City of OrmondBeach v. County of Volusia, 535 So.2d 302 (Fla. 5th DCA 1988); and St. Johns County v. Northeast Florida Builders Association, 583So. 2d 635, 637 (Fla. 1991).
4 Hollywood, Inc. v. Broward County, 431 So. 2d 606, 611-12 (Fla. 4th DCA), review denied, 440 So. 2d 352 (Fla. 1983),quoted and followed in St. Johns County v. Northeast Florida Builders Ass'n, 583 So. 2d 635, 637 (Fla. 1991).
Lee County\SCHOOL IMPACT FEE STUDY duncan|associates August 27, 2008, Page 2
In 2000, the Florida Supreme Court heard another school impact fee case, Volusia County v. Aberdeen atOrmond Beach, L.P. The case was brought by the company that owned Aberdeen at Ormond BeachManufactured Housing Community, an age-restricted mobile home park. The mobile home park hadrestrictive covenants that imposed limits on the age of residents, including a prohibition againstpermanent residence by persons younger than 18 years old. The Court held that the school impact feeordinance should not apply to age-restricted communities, because they will not generate a need foradditional school facilities.
Since impact fees were pioneered in states like Florida that lacked specific enabling legislation, such feeshave been defended as a legal exercise of local government’s broad “police power” to regulate landdevelopment in order to protect the health, safety and welfare of the community. The courts havedeveloped guidelines for constitutionally valid impact fees, based on “rational nexus” standards.3 Thestandards set by court cases generally require that an impact fee meet a two-part test:
1) The fees must be proportional to the need for new facilities created by new development, and
2) The expenditure of impact fee revenues must provide benefit to the fee-paying development.
A Florida district court of appeals described the dual rational nexus test in 1983 as follows, and thislanguage was quoted and followed by the Florida Supreme Court in its 1991 St. Johns County decision:4
In order to satisfy these requirements, the local government must demonstrate a reasonableconnection, or rational nexus, between the need for additional capital facilities and the growthin population generated by the subdivision. In addition, the government must show areasonable connection, or rational nexus, between the expenditures of the funds collected andthe benefits accruing to the subdivision. In order to satisfy this latter requirement, the ordinancemust specifically earmark the funds collected for use in acquiring capital facilities to benefit thenew residents.

5 Lee County, The Lee Plan, as amended through November 2006, Policy 158.5.1.
6 Lee County housing unit growth based on U.S. Census Bureau, Building Permit Estimates, January 2000 throughOctober 2007 from http://censtats.census.gov/cgi-bin/bldgprmt/.
Lee County\SCHOOL IMPACT FEE STUDY duncan|associates August 27, 2008, Page 3
Figure 1NON-CHARTER SCHOOL ENROLLMENT, 1996-2012
The Need Test
To meet the first prong of the dual rationalnexus test, it is necessary to demonstratethat new development creates the need foradditional educational facilities. TheCounty’s comprehensive plan expressesthe County’s commitment to “assist theLee County School Board in the orderlyand rational expansion of educationalfacilities that enhance economic growthand a desired quality of life.”5 Thecounty’s growing population createsdemands for new school facilities in orderto maintain acceptable levels of service.Regular (non-charter school) public schoolenrollment in Lee County increased byalmost 20,000 students in the last ten years,and it is anticipated that enrollment willincrease by about another 13,000 studentsin the next five years, according to themost recent official Department of Education (DOE) projections, as illustrated in Figure 1. The currentDOE projection incorporates the recent slow-down in enrollment growth from the rates experiencedin the early 2000s. The DOE long-range projection prepared for the five-year educational facilitiessurvey in December 2006 had enrollment growing to 90,853 students by the 2011-12 school year.However, the most recent DOE long-range forecast prepared in October 2007, which is used in theSchool District’s five-year work plan, shows enrollment growing to 84,869 students by the 2011-12school year.
Enrollment is not growing as fast as it had in the past largely because growth has slowed and fewerhousing units are being built.6 Nevertheless, it is clear that growth is still occurring, and that growth inresidential dwelling units leads to increases in public school enrollment. Figure 2 illustrates how LeeCounty Public School enrollment tracked Lee County housing unit growth during this decade.Enrollment growth has lagged somewhat behind housing growth over the last year or two, due to anoverbuilt residential market and a greater number of vacant units. However, this lag will be temporary,and the impact on enrollment will be felt when these units are sold and occupied. While the recenthousing down-turn has reduced the amount of new permit activity, the County’s preliminary enrollmentfigures for the 2007-08 school year shows that public school enrollment is still increasing, albeit at aslower rate.

7 Lee County Land Development Code, Sec. 2-406
8 Lee County Land Development Code, Sec. 2-403
9 Home Builders Ass'n v. Board of County Commissioners of Palm Beach County, 446 So. 2d 140 (Fla. Dist. Ct. App. 1983)
Lee County\SCHOOL IMPACT FEE STUDY duncan|associates August 27, 2008, Page 4
Figure 2STUDENTS & HOUSING, 2000-2007
The County’s school impact fees are proportionalto the number of students expected to enroll inpublic school in Lee County for each type ofdwelling unit constructed. Student generationrates derived from 2000 U.S. Census data for LeeCounty have been calibrated against actual publicschool enrollment and further adjusted to accountfor the fact that some public school students willattend charter schools. This methodology ensuresthat the school impact fees assessed areproportional to the impacts of the development.In addition, the impact fees are reduced to takeinto account future local school taxes and Statefunding that will be generated by new residentialdevelopment and used for capacity-expandingcapital improvements. Finally, the school impactfee ordinance contains a provision allowing anapplicant who believes that his development will have less impact than indicated by the fee schedulesto submit an independent fee calculation study.7
The Benefit Test
To meet the second prong of the dual rational nexus test, it is necessary to demonstrate that newdevelopment subject to the fee will benefit from the expenditure of the impact fee funds. Onerequirement is that the fees actually be used to fill the need that serves as the justification for the feesunder the first part of the test. The school impact fee ordinance contains provisions requiring thatimpact fee revenues be spent only on growth-related educational capital improvements, defining “capitalimprovement” as:
land acquisition, equipment purchase, site improvements, off-site improvements andconstruction associated with new or expanded public elementary or secondary schools andsupport facilities. Capital improvements do not include maintenance and operations.8
These provisions ensure that school impact fee revenues are spent on improvements that expand thecapacity of the public educational system to accommodate new students, rather than on the maintenanceor rehabilitation of existing school facilities or other purposes.
Another way to ensure that the fees are spent for their intended purpose is to require that the fees berefunded if they have not been used within a reasonable period of time. The Florida District Court ofAppeals upheld Palm Beach County’s road impact fee in 1983, in part because the ordinance includedrefund provisions for unused fees.9 Lee County’s school impact fee ordinance contains provisions
10 Lee County Land Development Code, Sec. 2-410
Lee County\SCHOOL IMPACT FEE STUDY duncan|associates August 27, 2008, Page 5
requiring that the fees be returned to the fee payer if they have not been spent or encumbered withinten years of fee payment.10
A final method of ensuring benefit is to restrict the funds to be spent in the geographic area in whichthey are collected. Currently, the county is divided into three “School Choice Zones.” Since studentsmay not attend a school outside the Choice Zone in which they reside, the ordinance provides that aslong as the Choice Zones are in effect, the fees collected within each Choice Zone will be spent withinthat same Zone. Additional discussion of this issue is presented in the “Benefit Districts” section ofthis report.
In sum, ordinance provisions requiring the earmarking of funds, refunding of unexpended funds tofeepayers, and restriction of impact fee revenues to be spent within the school choice zone in which theywere collected ensure that the fees are spent to benefit the fee-paying development.
Florida Statutes
The 2006 Florida Legislature passed Senate Bill 1194, which established certain requirements for impactfees in Florida. The bill, which became effective on June 14, 2006, created a new Section 163.31801,Florida Statutes, which reads as follows:
163.31801 Impact fees; short title; intent; definitions; ordinances levying impact fees.--
(1) This section may be cited as the “Florida Impact Fee Act.”
(2) The Legislature finds that impact fees are an important source of revenue for a localgovernment to use in funding the infrastructure necessitated by new growth. The Legislaturefurther finds that impact fees are an outgrowth of the home rule power of a local governmentto provide certain services within its jurisdiction. Due to the growth of impact fee collections andlocal governments' reliance on impact fees, it is the intent of the Legislature to ensure that, whena county or municipality adopts an impact fee by ordinance or a special district adopts animpact fee by resolution, the governing authority complies with this section.
(3) An impact fee adopted by ordinance of a county or municipality or by resolution of a specialdistrict must, at minimum:
(a) Require that the calculation of the impact fee be based on the most recent andlocalized data.
(b) Provide for accounting and reporting of impact fee collections andexpenditures. If a local governmental entity imposes an impact fee to address itsinfrastructure needs, the entity shall account for the revenues and expendituresof such impact fee in a separate accounting fund.
(c) Limit administrative charges for the collection of impact fees to actual costs.

Lee County\SCHOOL IMPACT FEE STUDY duncan|associates August 27, 2008, Page 6
Figure 3COUNTIES WITH SCHOOL IMPACT FEES
(d) Require that notice be provided no less than 90 days before the effective dateof an ordinance or resolution imposing a new or amended impact fee.
(4) Audits of financial statements of local governmental entities and district school boardswhich are performed by a certified public accountant pursuant to s. 218.39 and submitted tothe Auditor General must include an affidavit signed by the chief financial officer of the localgovernmental entity or district school board stating that the local governmental entity or districtschool board has complied with this section.
For the most part, these requirements are administrative and procedural. The only substantiverequirement that has a bearing on this study is that the impact fee must “be based on the most recentand localized data.” A variety of recent, local data has been compiled over the last six months to beused in the impact fee calculations. The major inputs into the formula are student generation rates, levelof service per unit of residential development, capital cost and revenue credits. Student generation ratesare based on 2000 Census data for Lee County, calibrated to actual 2000 School District enrollment, andthe percentage of public school students in charter schools in the current 2007/2008 school year. Thelevel of service is based on the 2006/2007 inventory of public school facilities, student station capacityand current student generation rates. Capital costs are based on the most recent land values based oncurrent appraised values for suitable school sites, recent school construction costs per student stationand ancillary facility costs per student. The revenue credits are based on the current five-year capitalfunding plan, state capital funding and property tax funds available for capacity expansion. In sum, thisreport complies with the substantive requirements of the Florida Impact Fee Act.
Lee County\SCHOOL IMPACT FEE STUDY duncan|associates August 27, 2008, Page 7
SCHOOL IMPACT FEES IN FLORIDA
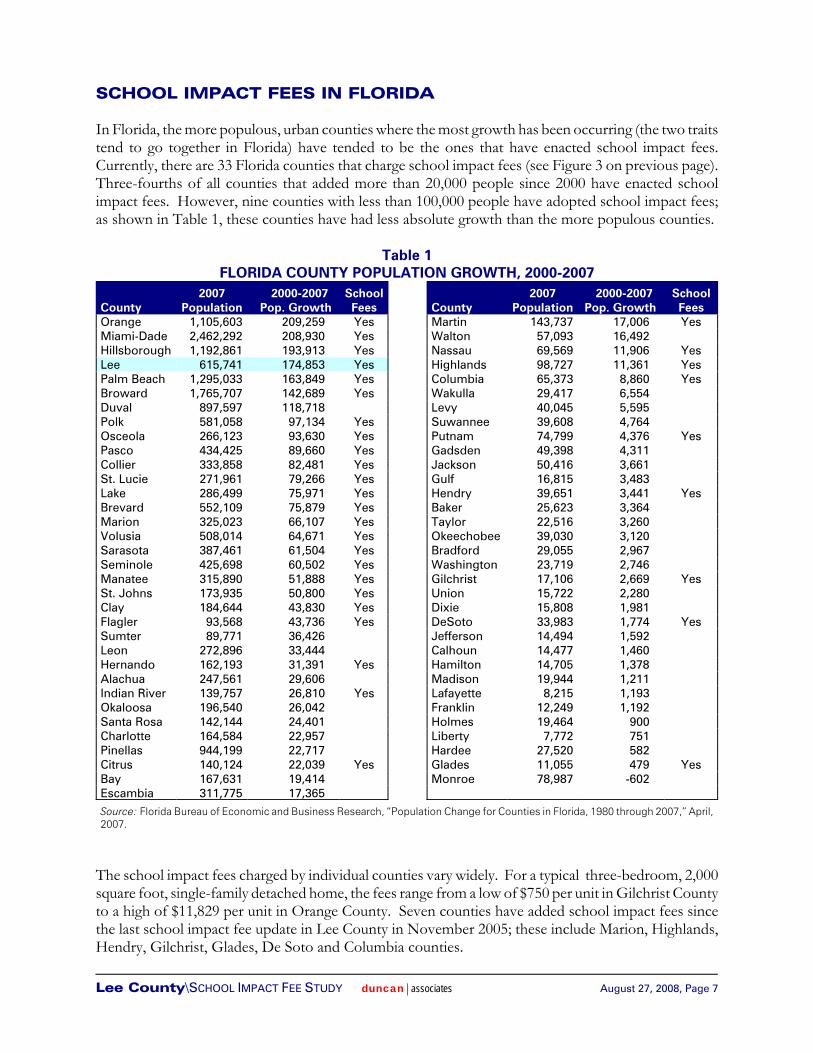
In Florida, the more populous, urban counties where the most growth has been occurring (the two traitstend to go together in Florida) have tended to be the ones that have enacted school impact fees.Currently, there are 33 Florida counties that charge school impact fees (see Figure 3 on previous page).Three-fourths of all counties that added more than 20,000 people since 2000 have enacted schoolimpact fees. However, nine counties with less than 100,000 people have adopted school impact fees;as shown in Table 1, these counties have had less absolute growth than the more populous counties.
Table 1FLORIDA COUNTY POPULATION GROWTH, 2000-2007
County2007
Population2000-2007
Pop. Growth SchoolFees County
2007Population
2000-2007 Pop. Growth
SchoolFees
Orange 1,105,603 209,259 Yes Martin 143,737 17,006 YesMiami-Dade 2,462,292 208,930 Yes Walton 57,093 16,492 Hillsborough 1,192,861 193,913 Yes Nassau 69,569 11,906 YesLee 615,741 174,853 Yes Highlands 98,727 11,361 YesPalm Beach 1,295,033 163,849 Yes Columbia 65,373 8,860 YesBroward 1,765,707 142,689 Yes Wakulla 29,417 6,554 Duval 897,597 118,718 Levy 40,045 5,595 Polk 581,058 97,134 Yes Suwannee 39,608 4,764 Osceola 266,123 93,630 Yes Putnam 74,799 4,376 YesPasco 434,425 89,660 Yes Gadsden 49,398 4,311 Collier 333,858 82,481 Yes Jackson 50,416 3,661 St. Lucie 271,961 79,266 Yes Gulf 16,815 3,483 Lake 286,499 75,971 Yes Hendry 39,651 3,441 YesBrevard 552,109 75,879 Yes Baker 25,623 3,364 Marion 325,023 66,107 Yes Taylor 22,516 3,260 Volusia 508,014 64,671 Yes Okeechobee 39,030 3,120 Sarasota 387,461 61,504 Yes Bradford 29,055 2,967 Seminole 425,698 60,502 Yes Washington 23,719 2,746 Manatee 315,890 51,888 Yes Gilchrist 17,106 2,669 YesSt. Johns 173,935 50,800 Yes Union 15,722 2,280 Clay 184,644 43,830 Yes Dixie 15,808 1,981 Flagler 93,568 43,736 Yes DeSoto 33,983 1,774 YesSumter 89,771 36,426 Jefferson 14,494 1,592 Leon 272,896 33,444 Calhoun 14,477 1,460 Hernando 162,193 31,391 Yes Hamilton 14,705 1,378 Alachua 247,561 29,606 Madison 19,944 1,211 Indian River 139,757 26,810 Yes Lafayette 8,215 1,193 Okaloosa 196,540 26,042 Franklin 12,249 1,192 Santa Rosa 142,144 24,401 Holmes 19,464 900 Charlotte 164,584 22,957 Liberty 7,772 751 Pinellas 944,199 22,717 Hardee 27,520 582 Citrus 140,124 22,039 Yes Glades 11,055 479 YesBay 167,631 19,414 Monroe 78,987 -602 Escambia 311,775 17,365 Source: Florida Bureau of Economic and Business Research, “Population Change for Counties in Florida, 1980 through 2007,” April,2007.
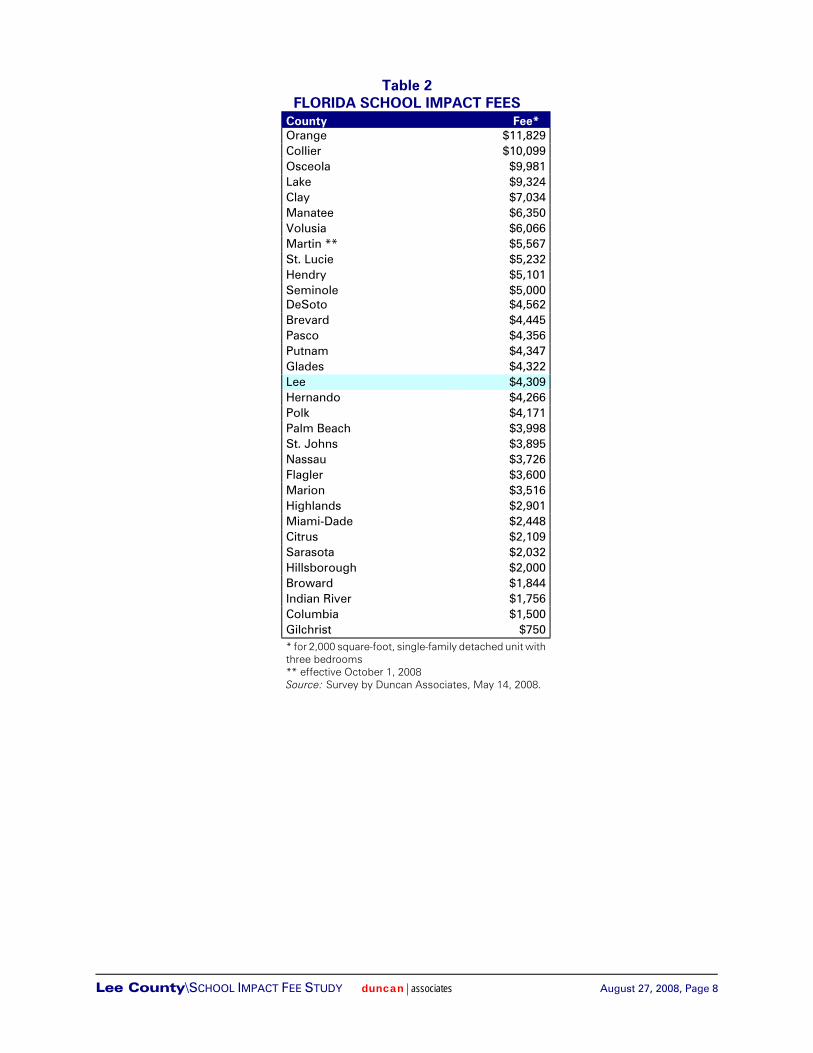
The school impact fees charged by individual counties vary widely. For a typical three-bedroom, 2,000square foot, single-family detached home, the fees range from a low of $750 per unit in Gilchrist Countyto a high of $11,829 per unit in Orange County. Seven counties have added school impact fees sincethe last school impact fee update in Lee County in November 2005; these include Marion, Highlands,Hendry, Gilchrist, Glades, De Soto and Columbia counties.
Lee County\SCHOOL IMPACT FEE STUDY duncan|associates August 27, 2008, Page 8
Table 2FLORIDA SCHOOL IMPACT FEES
County Fee* Orange $11,829Collier $10,099Osceola $9,981Lake $9,324Clay $7,034Manatee $6,350Volusia $6,066Martin ** $5,567St. Lucie $5,232Hendry $5,101Seminole $5,000DeSoto $4,562Brevard $4,445Pasco $4,356Putnam $4,347Glades $4,322Lee $4,309Hernando $4,266Polk $4,171Palm Beach $3,998St. Johns $3,895Nassau $3,726Flagler $3,600Marion $3,516Highlands $2,901Miami-Dade $2,448Citrus $2,109Sarasota $2,032Hillsborough $2,000Broward $1,844Indian River $1,756Columbia $1,500Gilchrist $750* for 2,000 square-foot, single-family detached unit withthree bedrooms** effective October 1, 2008Source: Survey by Duncan Associates, May 14, 2008.
Lee County\SCHOOL IMPACT FEE STUDY duncan|associates August 27, 2008, Page 9
Figure 4CURRENT SCHOOL CHOICE ZONES
BENEFIT DISTRICTS
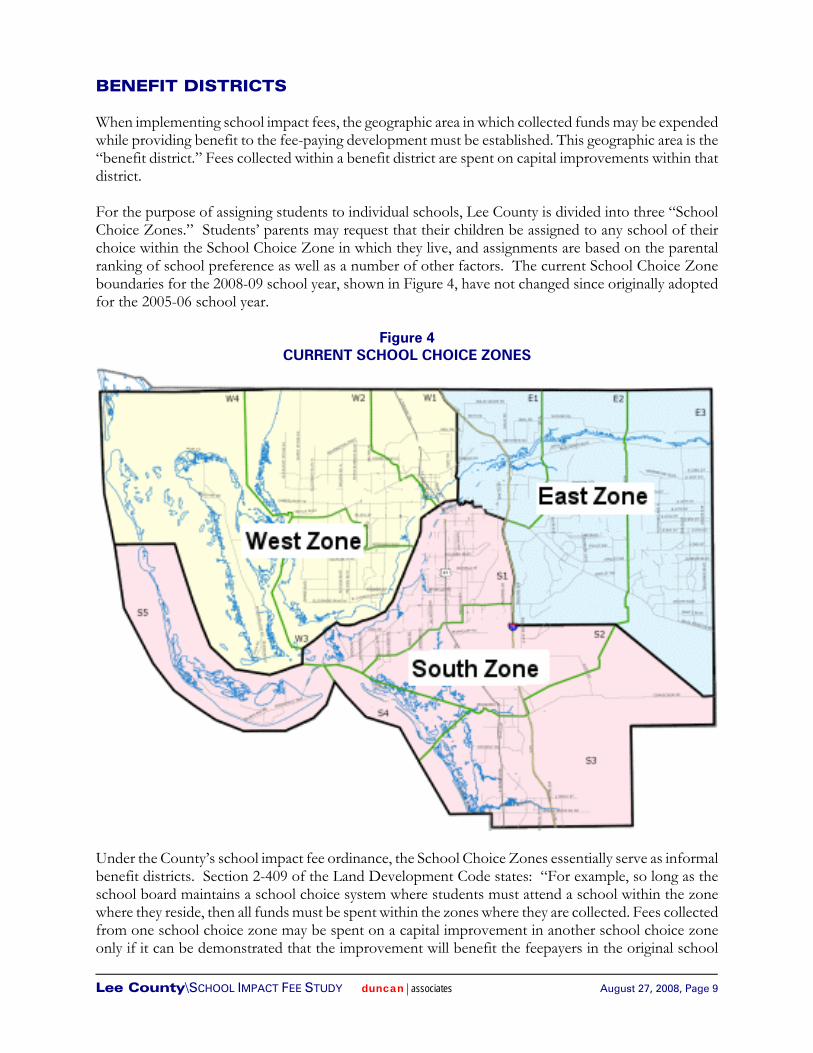
When implementing school impact fees, the geographic area in which collected funds may be expendedwhile providing benefit to the fee-paying development must be established. This geographic area is the“benefit district.” Fees collected within a benefit district are spent on capital improvements within thatdistrict.
For the purpose of assigning students to individual schools, Lee County is divided into three “SchoolChoice Zones.” Students’ parents may request that their children be assigned to any school of theirchoice within the School Choice Zone in which they live, and assignments are based on the parentalranking of school preference as well as a number of other factors. The current School Choice Zoneboundaries for the 2008-09 school year, shown in Figure 4, have not changed since originally adoptedfor the 2005-06 school year.
Under the County’s school impact fee ordinance, the School Choice Zones essentially serve as informalbenefit districts. Section 2-409 of the Land Development Code states: “For example, so long as theschool board maintains a school choice system where students must attend a school within the zonewhere they reside, then all funds must be spent within the zones where they are collected. Fees collectedfrom one school choice zone may be spent on a capital improvement in another school choice zoneonly if it can be demonstrated that the improvement will benefit the feepayers in the original school

Lee County\SCHOOL IMPACT FEE STUDY duncan|associates August 27, 2008, Page 10
choice zone. For example, the construction of magnet schools and administrative facilities that providebenefits across school choice zones.”
The school impact fee revenues collected since fiscal year 2003 in each of the Choice Zones aresummarized in Table 3. Significant amounts of revenue have been collected in each zone every year.For the three full fiscal years that the original fee schedule was in place, revenues increased every year,as residential development accelerated. In fiscal year 2006, however, revenue increased only becauseof the approximate doubling of impact fees at the beginning of 2006. Because of that increase, schoolimpact fee revenue did not begin to decline until fiscal year 2007.
Table 3SCHOOL IMPACT FEE REVENUE, FY 2003-2007
FY 2003 FY 2004 FY 2005 FY 2006* FY 2007
East Choice Zone $3,769,406 $7,459,041 $16,016,941 $24,571,414 $12,122,232
West Choice Zone $8,992,702 $14,208,311 $15,399,127 $20,067,667 $5,880,698
South Choice Zone $7,678,685 $10,144,781 $11,590,133 $10,130,475 $5,607,132
County-Wide $20,440,793 $31,812,133 $43,006,201 $54,769,556 $23,610,062
Actual Annual % Increase na 56% 35% 27% -57%* fees basically doubled (93% increase for single-family and 147% increase for multi-family)Source: Revenues by fiscal year (October to September) from Lee County Community Development Department,October 10, 2007 and December 14, 2007.
In the event that School Choice Zones are someday abandoned, the resulting county-wide benefitdistrict would be reasonable. The construction of a school anywhere in the county will increase capacityto serve new development, regardless of location. As new schools are constructed, attendance zonesare also modified to ensure that the capacity is efficiently utilized. A new residential developmentsubject to a school impact fee is not guaranteed that its students will attend a new school paid for withthose impact fees, just as a new development paying road impact fees is not guaranteed the ability todrive exclusively on new roads funded with those road impact fees. Instead, the benefit to an impactfee paying development is that the impact fees are spent to expand the overall capacity of the publicschool system, so that the students living in new developments have student stations available for them,regardless of whether those stations are in new or existing schools.
Regardless of whether the county is divided into multiple benefit districts, the Lee County SchoolDistrict strives to locate new schools as close as possible to where new residential development isoccurring in order to minimize pupil transportation costs. To provide an assurance that impact fees willbe spent in a manner that will provide benefit to fee payers, the School Board adopted a policy to spendimpact fee funds largely on new schools located as close as possible to where new residentialdevelopment is occurring. The cost of new schools makes it impossible to construct a new school inclose proximity to every growth area in the county each year. Nevertheless, it is possible to show areasonable correlation between where new schools funded by impact fees are located and where newresidential growth is occurring in the School Board’s five-year capital improvements plan, which isupdated on an annual basis.

Lee County\SCHOOL IMPACT FEE STUDY duncan|associates August 27, 2008, Page 11
STUDENT GENERATION RATES
The impact of new residential development on the demand for school facilities is based on the averagenumber of public school students generated per dwelling unit. The student generation rates are notcalculated as the ratio of students to occupied units, since not all units are occupied at all times. To takeinto account less than full occupancy, the student generation rates are calculated as the ratio of studentsto total dwelling units.
2000 U.S. Census Data
Public school districts in Florida are responsible for providing educational services to pre-kindergartenchildren eligible for Exceptional Student Education (ESE) programs as well as kindergarten throughtwelfth grade (K-12) students. The best available data source on student generation rates by type ofdwelling unit is the 2000 U.S. Census 5-percent Public-Use Microdata Samples (PUMS). The 2000PUMS data for Lee County consists of census enumerations for 13,107 occupied and vacant housingunits. In using the census sample data, public school students are defined as persons enrolled in publicschool and attending preschool through 12th grade. The student generation rates from the 2000 censussample data by housing type are shown in Table 4.
Table 4STUDENT GENERATION RATES, 2000
Housing Type
SampleSize
(Units)
Public School
StudentsTotal Units
2000Students/
Unit
Single-Family Detached 6,673 44,292 122,972 0.360
Multi-Family 4,365 11,627 82,124 0.142
Mobile Home 2,069 3,254 39,671 0.082
All Housing Types 13,107 59,173 244,767 0.242Source: U.S. Census Bureau, weighted 2000 PUMS 5% sample data for Lee County; publicschool students are defined as persons attending preschool through 12th grade in publicschool.
State law requires that impact fees in Florida be based on the most current available data. The 5-percentPUMS data that was available from the last decennial census will not be available in the future. Instead,the annual Census Bureau’s American Community Survey (ACS) will release annual 1-percent PUMSdata for the same large geographic areas (at least 100,000 residents). Unfortunately, only two years ofdata are available so far (for 2005 and 2006). The sample sizes from this data source are too small toyield reliable results for all housing types. For example, the Lee County sample size for mobile homeswas 2,069 units in the 2000 PUMS, but is only 396 in the 2005 PUMS and 353 in the 2006 PUMS.Based on these small samples, it is no surprise that the mobile home student generation rate changedfrom 0.082 in the 2000 PUMS to 0.130 in the 2005 PUMS and 0.036 in the 2006 PUMS.
Besides the small sample sizes available for the most recent data, another concern is that the 1-percent2005 and 2006 PUMS data is only available for years that are not typical of long-term conditions in LeeCounty. Student generation rates used to calculate school impact fees need to reflect long-term demand,not temporary unusual events, such as the current housing downturn, because the School District mustprovide capacity to meet demands from new units indefinitely. The 1-percent data have the largestsample sizes for single-family detached units. The data indicate that the vacancy rate for single-family

Lee County\SCHOOL IMPACT FEE STUDY duncan|associates August 27, 2008, Page 12
detached units had increased from 12 percent in 2000 to 17 percent in 2005 and 2006. While the dataindicate that the overall students per single-family detached unit declined slightly from 2000 to2005/2006, from 3.60 to 3.48, this decline is entirely attributable to the temporary rise in vacancy rates.Students generated per occupied unit has actually increased, from 4.09 in 2000 to 4.18 in 2005/2006.
Based on the foregoing analysis, the fees in this update will continue to be based on the 2000 Census5-percent PUMS data. The County should consider switching to the 1-percent ACS data when the feesare updated in three years. At that time, there will be five years of data that can be averaged to obtainreasonable reliability, and the duration of the current high vacancy rates can be more reliably ascertained.
Calibrating to 2000 Actual Enrollment
To ensure that the student generation rates derived from the 2000 sample data are representative ofactual conditions in 2000, the number of expected public school students, based on the number ofdwelling units enumerated by the 2000 census and the student generation rates derived from the 2000census sample data is compared to the actual public school enrollment for that year. As Table 5 shows,the actual students enrolled in the School District is only 92.7 percent of the expected number ofstudents. This indicates that the student generation rates derived from the 2000 census sample datasomewhat over-predict actual student enrollment in the District.
Table 5EXPECTED AND ACTUAL STUDENTS, 2000
Housing Type2000
Units
Student Generation
Rate ExpectedStudents
Single-Family Detached 122,543 0.360 44,115
Multi-Family 82,920 0.142 11,775
Mobile Home 39,942 0.082 3,275
Total Expected Students, April 2000 59,165
Actual Cycle 7 Enrollment, April 4, 2000 54,833
Ratio of Actual to Expected Students 0.927
Source: 2000 units from 2000 U.S. Census, Summary File 3 (weighted 1-in-6 sample data);student generation rates from Table 4; actual cycle 7 enrollment (excludes charter school,juvenile detention and other students not housed by the School District) from the Lee CountySchool District, April 25, 2005.
Calibrating for the actual number of students and dwelling units in Lee County at the time of the 2000census, the student generation rates derived from the 2000 census for Lee County have been adjusteddownward by 7.3 percent, as shown in Table 6.

11 As the Florida Supreme Court observed in St. Johns County, et al. v. Northeast Florida Builders Ass'n, 583 So.2d 635(1991): “During the useful life of the new dwelling units, school-age children will come and go. It may be that some of theunits will never house children. However, the county has determined that for every one hundred units that are built,forty-four new students will require an education at a public school.”
Lee County\SCHOOL IMPACT FEE STUDY duncan|associates August 27, 2008, Page 13
Table 6CALIBRATED STUDENT GENERATION RATES
Housing Type
2000 Students/
Unit Adjustment
Factor
Calibrated Students/
Unit
Single-Family Detached 0.360 0.927 0.334
Multi-Family 0.142 0.927 0.132
Mobile Home 0.082 0.927 0.076
All Housing Types 0.242 0.927 0.224 Source: 2000 students per unit from Table 4; adjustment factor from Table 5.
New Units versus All Units
The student generation rates discussed so far have been based on all dwelling units existing in LeeCounty at the time of the 2000 census. However, the 2000 census sample data also allow us to look athow student generation varies with the age of the unit. These data allow us to confirm that newdwelling units do, in fact, contain public school children and therefore have an immediate impact onthe need for new school facilities. These data, displayed in Table 7, clearly confirm that new dwellingunits, regardless of whether “new” is defined as units built in the last five, ten or 20 years, containsubstantial numbers of public school students and thus have an immediate impact on the need forpublic educational facilities. The fact that the number of students per unit fluctuates somewhatdepending on the age of a dwelling unit is to be expected, but the impact fee should be based on theexpected student occupancy over the life of the housing unit.11 The impact of new development is notconfined to the immediate impact, but also includes the long-term impact. The Lee County publicschool system will have the responsibility of providing facilities to serve a new dwelling unit inperpetuity.
Table 7STUDENT GENERATION BY AGE OF THE HOUSING UNIT
Age of the Housing Unit (Years)
Housing Type All Units 0-5 6-10 11-20 >20
Single-Family Detached 0.360 0.341 0.374 0.360 0.364
Multi-Family 0.142 0.114 0.105 0.103 0.202
Mobile Home 0.082 0.116 0.038 0.072 0.097
All Housing Types 0.242 0.244 0.246 0.209 0.267
Sample Size 13,107 2,007 1,609 4,249 5,242Source: U.S. Census Bureau, 2000 PUMS 5% sample data for Lee County; public school students aredefined as persons attending preschool through 12th grade in public school; age of unit based on yearbuilt, with 0-5 years old being units built 1995 through 2000, etc.

Lee County\SCHOOL IMPACT FEE STUDY duncan|associates August 27, 2008, Page 14
Adjusting for Charter Schools
An adjustment to the student generation multipliers may be required to account for charter schoolenrollment. Charter schools are public schools that receive State educational funding but are notrequired to meet all of the requirements that apply to regular public schools. In particular, charterschools do not have to meet all of the State requirements for capital facilities that apply to regular publicschools. The existence of charter schools relieves the regular public school system of the cost ofproviding capital facilities for the students enrolled. However, there is no guarantee that individualcharter schools will not fail and return the responsibility of providing capital facilities for their studentsto the regular public school system.
Charter school enrollment in Lee County has grown significantly since the first charter school wasestablished in the 2000/2001 school year. As shown in Table 8, charter schools have grown from only15 students in the 2000/2001 school year to more than 7,000 in the current school year, and from lessthan one percent to almost ten percent of public school enrollment. This recent rapid growth in charterschool enrollment, combined with the uncertain long-term viability of charter schools, makes futurecharter enrollment projections problematic. The School District, in making projections of its capitalneeds, acknowledges current charter school enrollment but does not assume that the historic growthrate for charter students will be sustained in the future. This seems to be a prudent course for publicfacility planning under these conditions of uncertainty, and the same approach will be taken in theimpact fee analysis. Based on the enrollment projections in the adopted five-year work plan, charterschool enrollment will account for just over ten percent of public school enrollment by 2012.
Table 8CHARTER SCHOOL ENROLLMENT, 2001-2012
SchoolYear
Public School Enrollment PercentCharterCharter Regular Total
2000/01 15 56,966 56,981 0.03%
2001/02 19 59,157 59,176 0.03%
2002/03 420 61,269 61,689 0.68%
2003/04 2,007 63,379 65,386 3.07%
2004/05 3,796 66,462 70,258 5.40%
2005/06 5,023 70,175 75,198 6.68%
2006/07 6,928 71,772 78,700 8.80%
2007/08 7,667 71,136 78,803 9.73%
2011/12 9,923 84,869 94,792 10.47%Source: Lee County School District, Department of Accountability, Research andContinuous Improvement (http://www.leeschools.net/dept/plan/Enrlcurr.htm); allenrollment figures are cycle 7 (March/April) except charter school enrollment for2000/01 and 2001/02, which are cycle 1 (August/September); 2011/12 enrollmentprojections are charter and capital outlay full-time equivalents (COFTE) from LeeCounty School District, 5-Year District Facilities Work Program for 2007/2008 through2011/2012, September 26, 2007.
If charter school enrollment had not increased as a percentage of total enrollment since 2000, the yearfor which the student generation rates were calibrated, no adjustment would be necessary. However,the percentage has increased significantly, as shown in the previous table.

Lee County\SCHOOL IMPACT FEE STUDY duncan|associates August 27, 2008, Page 15
In Table 9, the calibrated student generation rates for new units calculated earlier are reduced to accountfor the enrollment share of charter school students. As a result of the increased charter enrollment, thecalibrated non-charter student generation rates have declined by approximately five percent for eachhousing type when compared with the non-charter student generation rate developed for the previousschool impact fee update in 2005.
Table 9NON-CHARTER STUDENT GENERATION RATES
Housing TypeCalibrated
Students/Unit
Percent Non-Charter
Students
Calibrated Non-Charter
Students/Unit
Single-Family Detached 0.334 89.53% 0.299
Multi-Family 0.132 89.53% 0.118
Mobile Home 0.076 89.53% 0.068
All Housing Types 0.224 89.53% 0.201 Source: Calibrated student generation rates from Table 6; percent non-charter students is based onprojected enrollment for 2011/12 school year from Table 8.
EXISTING LEVEL OF SERVICE
A fundamental principle of impact fees is that new development should not be held to a higher standardthan existing development. If the impact fees are based on a higher standard than currently exists, newdevelopment must not be required to both pay the impact fee and pay taxes that are used to remedy theexisting deficiency, unless credit against the fees is given for such tax payments.
In the arena of school impact fees, the level of service can be measured in terms of the overall ratio ofstudents to school capacity. School capacity is determined in accordance with standards developed bythe State, as described below.
Student Station Capacity
The Florida Department of Education (DOE) maintains an inventory of student stations in schools.This inventory is referred to as the Florida Inventory of School Houses (FISH).
In the November 2002 election, Florida voters approved the Classroom Size Reduction Amendment(Amendment 9) to the Florida Constitution. Section 1 of Article IX of the State Constitutionestablishes, by the beginning of the 2010-2011 school year, the following maximum number of studentsin core-curricula courses assigned to a teacher: (1) Pre-kindergarten through grade 3: 18 students; (2)grades 4 through 8: 22 students; and (3) grades 9 through 12: 25 students.
Following passage of the amendment, the Legislature enacted SB-30A, which requires school districtsto reduce the average number of students in each classroom by at least two students per year beginningwith the 2003-2004 fiscal year until the maximum number of students per classroom does not exceedthe 2010-2011 maximum. If a district's class size does not meet the required maximum, the district mustreduce to the constitutional maximum in each of the three grade groupings or the average number ofstudents in each of the three grade groupings by at least two-students-per-year as follows:

Lee County\SCHOOL IMPACT FEE STUDY duncan|associates August 27, 2008, Page 16
o 2003-2004, 2004-2005 and 2005-2006 at the district level;o 2006-2007 and 2007-2008 at the school level; ando 2008-2009 at the classroom level.
Following the passage of the class size amendment, DOE adjusted (lowered) FISH classroom capacitiesto reflect the targets of 18 students per room in grades K-3, 22 per room in grades 4-8 and 25 per roomin grades 9-12. Lee County has adopted the use of post-amendment FISH for all internal and externalpurposes.
There are two types of FISH capacities: Satisfactory Student Stations and FISH Capacity. SatisfactoryStudent Stations are computed by multiplying the core-curriculum classrooms by the maximum studentsper class by grade level as provided in Section 1003.03, Florida Statutes (different capacities are specifiedfor specialized classrooms). FISH Capacity takes into account utilization rates adopted by DOE in theState Requirements for Educational Facilities (SREF). The utilization rates are: 100 percent ofSatisfactory Student Stations for elementary schools, 90 percent for middle schools and high schoolswith up to 1,500 Satisfactory Student Stations, and 95 percent for high schools with more than 1,500Satisfactory Student Stations. Utilization rates give districts some flexibility at middle and high schoollevels to accommodate inefficiencies created with multiple class changes, electives and other activities.Schools that have a combination of grade levels (e.g., K-8s and 6-12s) have a utilization rate of 90percent.
Existing School Inventory
To determine the current level of service for educational facilities in Lee County, an inventory wasprepared of existing schools completed and in service for the 2007/2008 school year. Table 10 showsthe existing school inventory, including the name of each school, site area, building square feet(permanent and portable), capacity in student stations based on post-amendment Florida Inventory ofSchool Houses (FISH) Capacity standards, and current (March 2008) enrollment. Charter schoolstudents as well as students confined in juvenile detention and other non-district facilities were notincluded in the inventory, because the District is not responsible for funding the capital costs of servingthese students.
Table 10EXISTING SCHOOL INVENTORY
School AcresPermanent
Sq. Feet PortableSq. Feet
FISH Capacity
2007/2008Enrollment
Allen Park Elementary 14.00 108,181 960 1,061 885Alva Elementary 5.00 46,524 5,760 391 447Bayshore Elementary 20.00 82,271 1,200 711 617Bonita Springs Elementary 5.00 51,746 3,120 467 434Caloosa Elementary 20.00 136,458 960 1,093 1,067Cape Coral Elementary 14.00 101,435 0 916 805Colonial Elementary 19.00 108,334 2,880 1,019 752Diplomat Elementary 32.00 116,525 0 1,086 945Edgewood Renaissance 13.00 92,356 2,400 777 478Edison Park Elementary 7.00 70,956 0 449 381Franklin Park Elementary 20.00 82,723 7,104 699 522Ft Myers Beach Elementary 11.00 27,020 0 200 180Gateway Elementary 16.00 111,893 1,920 824 779Gulf Elementary 30.00 156,247 0 1,396 1,271

School AcresPermanent
Sq. Feet PortableSq. Feet
FISH Capacity
2007/2008Enrollment
Lee County\SCHOOL IMPACT FEE STUDY duncan|associates August 27, 2008, Page 17
Hancock Creek Elementary 20.00 143,537 960 1,062 905Harns Marsh Elementary 47.54 122,125 0 930 884Hector A. Cafferata Jr. Elem 20.00 69,380 0 883 757Heights Elementary 25.00 75,384 0 911 635J. Colin English Elementary 15.00 91,658 8,640 651 463Lehigh Elementary 15.00 79,533 13,969 1,002 907Littleton Elementary 20.00 108,424 1,920 774 697Manatee Elementary 12.00 118,394 0 1,070 787Michigan International Academy (K-8) 18.00 83,627 11,328 771 526Mirror Lakes Elementary 25.00 131,223 5,760 1,089 1,090North Ft Myers Academy (K-8) 71.00 197,630 26,928 1,688 1,003Orange River Elementary 14.00 93,586 5,566 925 856Orangewood Elementary 13.00 86,249 6,000 764 708Patriot Elementary 11.00 118,394 0 1,070 770Pelican Elementary 22.00 143,026 0 1,362 1,114Pine Island Elementary 15.00 54,379 960 409 324Pinewoods Elementary 37.00 132,170 2,304 1,080 983Ray V. Pottorf Elementary 28.54 122,162 0 930 635Rayma C. Page Elementary 14.00 112,365 0 836 639River Hall Elementary 20.00 118,426 0 1,046 878San Carlos Park Elementary 23.00 114,496 0 1,081 878Skyline Elementary 20.00 136,686 960 1,398 1,052Spring Creek Elementary 21.00 90,737 7,488 897 762Sunshine Elementary 18.00 122,078 3,120 1,271 1,158Tanglewood Riverside Elementary 20.00 94,870 0 793 722The Sanibel School (K-8) 25.00 55,241 2,640 448 372Three Oaks Elementary 19.00 86,694 5,184 810 776Tice Elementary 21.00 70,443 8,640 699 583Trafalgar Elementary 25.00 86,988 0 977 875Treeline Elementary (Staged) 13.09 100,741 0 709 657Tropic Isles Elementary 20.00 110,590 2,960 1,087 936Veterans Park Academy (K-8) 20.00 196,574 0 1,768 1,553Villas Elementary 22.00 104,802 4,800 1,015 849
Elementary School Subtotal 956.17 4,865,281 146,431 43,295 36,297Alva Middle 13.00 81,826 4,320 633 583Bonita Springs Middle 16.00 120,723 0 876 607Caloosa Middle 20.00 132,060 0 1,005 887Challenger Middle 14.00 160,706 0 1,257 865Cypress Lake Middle 29.00 137,171 4,368 1,039 742Diplomat Middle 14.00 138,827 0 974 866Ft Myers Middle Academy 20.00 125,734 720 858 625Gulf Middle 30.00 126,599 4,416 1,002 978Lee Middle 20.00 145,535 4,320 986 587Lehigh Acres Middle 35.00 126,595 3,840 1,136 1,091Lexington Middle School 15.00 160,706 0 1,027 840Mariner Middle 16.00 134,668 0 1,141 924Paul Laurence Dunbar Middle 22.00 163,548 0 1,013 959Three Oaks Middle 25.00 137,880 0 1,027 783Trafalgar Middle 32.00 143,128 11,904 1,272 1,082Varsity Lakes Middle 14.00 150,722 0 1,024 977
Middle School Subtotal 335.00 2,186,428 33,888 16,270 13,396Cape Coral Sr High School 40.00 262,475 6,144 1,987 1,955Cypress Lake Sr High School 30.00 276,380 0 1,727 1,329Dunbar High School 52.00 202,324 0 1,176 834East Lee County High 45.92 300,307 0 1,928 1,449

School AcresPermanent
Sq. Feet PortableSq. Feet
FISH Capacity
2007/2008Enrollment
Lee County\SCHOOL IMPACT FEE STUDY duncan|associates August 27, 2008, Page 18
Estero Sr High School 64.00 273,777 0 1,932 1,481Ft Myers Sr High School 38.00 254,145 4,600 2,082 1,810Ida S. Baker High 40.00 299,696 0 2,030 1,995Island Coast High (Staged) 46.00 0 43,200 643 400Lehigh Sr High School 82.00 283,299 5,760 2,006 1,573Mariner Sr High School 104.00 253,905 12,288 2,054 1,841North Ft Myers Sr High School 35.00 254,877 12,960 2,181 1,896Riverdale High School (6-12) 40.00 238,328 7,872 2,147 1,932South Ft. Myers High 38.00 300,310 0 1,926 1,233
High School Subtotal 654.92 3,199,823 92,824 23,819 19,728Regular Facility Subtotal 1,946.09 10,251,532 273,143 83,384 69,421Alternative Learning Center West* 10.00 0 22,566 265 161Buckingham Exceptional Ctr 10.00 27,880 1,824 115 101Lee County High Tech Central 30.00 181,289 11,712 1,062 82New Directions School 15.00 141,483 0 665 570North Vo-Tech 15.00 61,927 0 324 76Royal Palm Exceptional 7.00 59,332 0 230 208Special Facility Subtotal 87.00 471,911 36,102 2,661 1,198Total of All Schools 2,033.09 10,723,443 309,245 86,045 70,619*Alternative Learning Center West staged in portables on the North Fort Myers Academy for the Arts campus in 2007-08. Source: Lee County School District; FISH Capacity from Lee County School District, 5-Year District Facilities Work Program for2007/2008 through 2011/2012, September 26, 2007; enrollment based on Cycle 7 (March, 2008); total enrollment excludes 196students in state-owned facilities and 321 public school students in other facilities not owned by the district (PACE Center for Girls,County-wide ESE, District PreK5 and Vince Smith Center).
Student-Capacity Ratio
The existing level of service will be measured as the ratio of students to FISH Capacity in permanentbuildings. Since the costs per student are calculated for permanent buildings, the FISH capacity will bereduced to reflect only the capacity in permanent buildings. The existing level of service for educationalfacilities in Lee County is summarized in Table 11. District-wide, the School District provides enoughclassrooms to meet the Classroom Size Reduction Amendment standards of maximum students perclassroom that it must provide by the 2010-2011 school year. Overall, the District has a surplus ofabout 8,985 permanent student stations, and is providing more than 100 percent of the permanentcapacity needed to meet post-amendment standards. Consequently, there are no existing deficiencies,and the impact fees will be based on the cost of providing one permanent student station per student.
Table 11EXISTING LEVEL OF SERVICE
FISH Capacity in Permanent Buildings, 2007/2008 79,604
Enrollment in District-Owned Facilities, 2007/2008 70,619
Current Permanent Student Station Surplus 8,985
FISH Capacity in Permanent Space per Student 1.127Source: FISH capacity based on 2007 FISH permanent student seats from Lee CountySchool District Cycle 7 Enrollment Report, March, 2008; enrollment from Table 10.
Lee County\SCHOOL IMPACT FEE STUDY duncan|associates August 27, 2008, Page 19
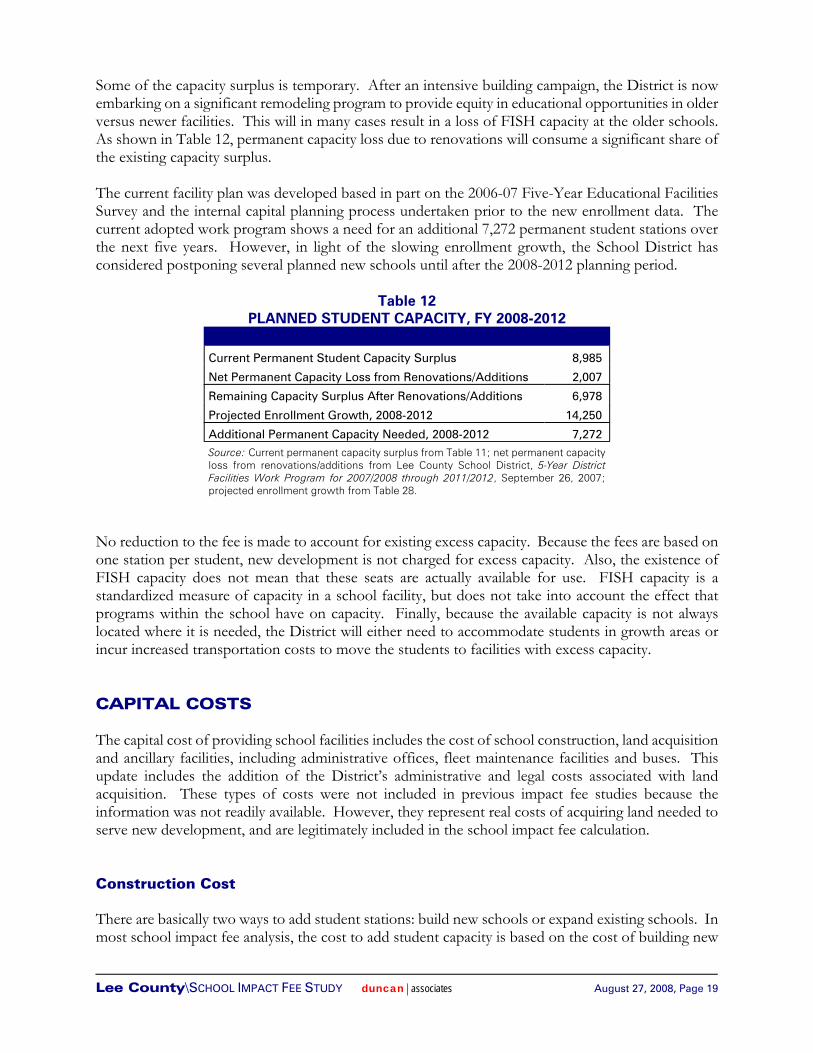
Some of the capacity surplus is temporary. After an intensive building campaign, the District is nowembarking on a significant remodeling program to provide equity in educational opportunities in olderversus newer facilities. This will in many cases result in a loss of FISH capacity at the older schools.As shown in Table 12, permanent capacity loss due to renovations will consume a significant share ofthe existing capacity surplus.
The current facility plan was developed based in part on the 2006-07 Five-Year Educational FacilitiesSurvey and the internal capital planning process undertaken prior to the new enrollment data. Thecurrent adopted work program shows a need for an additional 7,272 permanent student stations overthe next five years. However, in light of the slowing enrollment growth, the School District hasconsidered postponing several planned new schools until after the 2008-2012 planning period.
Table 12PLANNED STUDENT CAPACITY, FY 2008-2012
Current Permanent Student Capacity Surplus 8,985
Net Permanent Capacity Loss from Renovations/Additions 2,007
Remaining Capacity Surplus After Renovations/Additions 6,978
Projected Enrollment Growth, 2008-2012 14,250
Additional Permanent Capacity Needed, 2008-2012 7,272 Source: Current permanent capacity surplus from Table 11; net permanent capacityloss from renovations/additions from Lee County School District, 5-Year DistrictFacilities Work Program for 2007/2008 through 2011/2012, September 26, 2007;projected enrollment growth from Table 28.
No reduction to the fee is made to account for existing excess capacity. Because the fees are based onone station per student, new development is not charged for excess capacity. Also, the existence ofFISH capacity does not mean that these seats are actually available for use. FISH capacity is astandardized measure of capacity in a school facility, but does not take into account the effect thatprograms within the school have on capacity. Finally, because the available capacity is not alwayslocated where it is needed, the District will either need to accommodate students in growth areas orincur increased transportation costs to move the students to facilities with excess capacity.
CAPITAL COSTS
The capital cost of providing school facilities includes the cost of school construction, land acquisitionand ancillary facilities, including administrative offices, fleet maintenance facilities and buses. Thisupdate includes the addition of the District’s administrative and legal costs associated with landacquisition. These types of costs were not included in previous impact fee studies because theinformation was not readily available. However, they represent real costs of acquiring land needed toserve new development, and are legitimately included in the school impact fee calculation.
Construction Cost
There are basically two ways to add student stations: build new schools or expand existing schools. Inmost school impact fee analysis, the cost to add student capacity is based on the cost of building new

Lee County\SCHOOL IMPACT FEE STUDY duncan|associates August 27, 2008, Page 20
schools. This is true for several reasons. First, the cost of an expansion that adds classroom wingswithout expanding core facilities, such as cafeteria, gymnasium, library and administrative offices,generally does not include the full cost, either because the core facilities already had excess capacity thatwas constructed earlier, or else the core facilities are over-utilized and will need to be expanded in thefuture. Second, expansion projects often include extensive remodeling work, and it may be difficult tosort out what project costs are attributable to the added capacity.
State law provides maximum school construction costs per student station that may be incurred byschool districts. State construction cost standards were updated in 2006 and are based on Amendment9 enrollment standards. Section 1013.64(6)(b)1. reads as follows:
(b)1. A district school board, including a district school board of an academic performance-based charterschool district, must not use funds from the following sources: Public Education Capital Outlay andDebt Service Trust Fund; School District and Community College District Capital Outlay and DebtService Trust Fund; Classrooms First Program funds provided in s. 1013.68; effort index grant fundsprovided in s. 1013.73; nonvoted 2-mill levy of ad valorem property taxes provided in s. 1011.71(2);Classrooms for Kids Program funds provided in s. 1013.735; District Effort Recognition Programfunds provided in s. 1013.736; or High Growth District Capital Outlay Assistance Grant Programfunds provided in s. 1013.738 for any new construction of educational plant space with a total cost perstudent station, including change orders, that equals more than:
a. $17,952 for an elementary school,
b. $19,386 for a middle school, or
c. $25,181 for a high school,
(January 2006) as adjusted annually to reflect increases or decreases in the Consumer Price Index.
Not all of the costs incurred by the School District are counted in the construction cost caps set by theState. These include off-site costs, such as road improvements, that are not located on the school sitebut are necessitated by the construction of the school; items such as retention areas necessitated bywater management permits; land costs; costs for hardening the facility against hurricanes, for which theDistrict is reimbursed by Lee County Emergency Operations Center; and other costs for which theDistrict is reimbursed by other government agencies. Table 13 summarizes these additional non-construction costs for recent school construction projects in Lee County. The total add-on cost will besubtracted from total project cost to determine the construction cost for each school that is subject tothe State construction cost caps. Off-site, on-site permit items and land costs will be included asseparate components to the fee calculation. Hurricane upgrade and other reimbursements representcosts that are ultimately paid by other entities and are not included in the calculation of the impact fees.

Lee County\SCHOOL IMPACT FEE STUDY duncan|associates August 27, 2008, Page 21
Table 13NON-CONSTRUCTION COSTS
School Facility Off-Site
On-Site Permit Items Land Cost
HurricaneUpgrade
OtherReimburse-
ments
Total Add-on Costs
River Hall Elementary $415,677 $1,799,253 $0 $0 $202,348 $2,417,278
Manatee Elementary $1,382,395 $2,407,140 $1,768,560 $283,605 $250,000 $6,091,700
Patriot Elementary $1,408,395 $1,759,742 $0 $0 $0 $3,168,137
Treeline Elementary $2,007,187 $2,114,443 $0 $0 $0 $4,121,630
Heights Elementary $2,500,000 $2,862,000 $0 $0 $0 $5,362,000
Oak Hammock Middle $1,498,799 $4,230,200 $0 $278,300 $0 $6,007,299
Challenger Middle $1,548,697 $2,648,939 $8,600,000 $0 $0 $12,797,636
East Lee County High $1,113,127 $6,529,677 $1,437,688 $1,369,204 $0 $10,449,696
Island Coast High $2,182,298 $3,448,275 $1,008,632 $1,200,000 $2,182,298 $10,021,503
Total $14,056,575 $27,799,669 $12,814,880 $3,131,109 $2,634,646 $60,436,879Source: Lee County School District, February 18, 2008.
Table 14 shows total project cost for recently-constructed elementary, middle and high schools in theLee County School District. In order to calculate the average construction cost per student, the non-construction costs identified above are subtracted from the total project costs. The resulting schoolfacility construction costs are then divided by the FISH Capacity to determine the cost per student. Allnew schools constructed since January 2005 have been built to accommodate Amendment 9 class sizestandards as prescribed in the State Constitution and Florida Statutes. FISH Satisfactory StudentStations are computed by multiplying the core-curriculum classrooms for each grade grouping (PK-3,4-8 and 9-12) by the post-amendment maximum students per class and adding prescribed capacities forspecialized spaces such as gymnasiums, band rooms and exceptional student education classrooms.FISH Capacity used in this analysis takes into account DOE adopted utilization rates. The utilizationrates are: 100 percent of Satisfactory Student Stations for elementary schools, 90 percent for middleschools and 95 percent for high schools (with more than 1,500 Satisfactory Student Stations).

Lee County\SCHOOL IMPACT FEE STUDY duncan|associates August 27, 2008, Page 22
Table 14LOCAL CONSTRUCTION COSTS PER STUDENT
School FacilityContract
Date Total Cost Add-Ons Const. CostStudent
Capacity
Orig. Cost/
StudentCost
Factor
CurrentCost/
StudentRiver Hall Elementary 08/05 $19,346,837 $2,417,278 $16,929,559 1,046 $16,185 1.082 $17,512Manatee Elementary 04/06 $21,689,050 $6,091,700 $15,597,350 1,070 $14,577 1.051 $15,320Patriot Elementary 04/06 $21,926,628 $3,168,137 $18,758,491 1,070 $17,531 1.051 $18,425Treeline Elementary* 06/07 $24,630,000 $4,121,630 $20,508,370 1,034 $19,834 1.019 $20,211Heights Elem. Replacement* 06/07 $30,334,340 $5,362,000 $24,972,340 1,300 $19,209 1.014 $19,478Average Elementary School $17,467 $18,189
Oak Hammock Middle* 04/06 $37,318,810 $6,007,299 $31,311,511 1,224 $25,581 1.051 $26,886Challenger Middle 04/06 $41,910,358 $12,797,636 $29,112,722 1,257 $23,160 1.051 $24,341Average Middle School $24,371 $25,614
East Lee County High* 06/05 $51,726,731 $10,449,696 $41,277,035 1,928 $21,409 1.086 $23,250Island Coast High* 12/06 $63,013,720 $10,021,503 $52,992,217 2,004 $26,443 1.026 $27,131Average High School $23,926 $25,191
Total Construction Cost $251,459,595* school under construction, costs are estimates and student capacity based on planned FISH capacities.Source: Contract date, total cost information and capacity from Lee County School District, February 18, 2008 and July 15, 2008; add -on costsfrom Table 13; student capacity for existing schools based on FISH permanent student capacity from Table 10; cost factor is ratio of January 2008to contract date of the Engineering News-Record Building Cost Index.
The average construction costs per station calculated above are compared with the State-imposedmaximum construction costs per student station for the current year. As previously mentioned, theState cap is based on FISH Satisfactory Student Stations, while the local cost is based on FISH Capacity.In order to compare the State cap to the local cost used in this study, the State cap is adjusted bymultiplying the State cap figure by an inflation factor to determine the applicable cap for 2008, andfurther adjusted for middle and high schools to reflect the official utilization rates. These adjustmentsdetermine the State construction spending cap per student for FISH Capacity. As shown in Table 15,the District’s recent elementary and high school construction costs per student station are lower thanthe State caps. The average cost per station for the most recently-constructed middle schools issomewhat higher than the State cap.
Table 15STATE CONSTRUCTION CAPS VS. LOCAL COSTS PER STUDENT
Grade LevelState CapJan. 2006
CPI Factor
Adj. CapJan. 2008
Adjusted Cap/ Student Capacity
Local Cost
% of Cap
Elementary $17,952 1.0644 $19,108 $19,108 $18,189 95.2%
Middle $19,386 1.0644 $20,634 $22,927 $25,614 111.7%
High $25,181 1.0644 $26,803 $28,214 $25,191 89.3% Source: State cap is maximum construction cost per student station from Sec. 1013.64, Florida Statutes forJanuary 2006; CPI factor is ratio of Consumer Price Index, U.S. City Average, All Urban Consumers, All Items,1982-84 = 100 for Jan. 2008 to Jan. 2006; adjusted cap per student provides adjustment to FISH SatisfactoryStudent Station used in state caps by dividing adjusted cap for middle schools by utilization rate of 90 percentand high school by utilization rate of 95 percent; local cost from Table 14.

Lee County\SCHOOL IMPACT FEE STUDY duncan|associates August 27, 2008, Page 23
The cost per student for each grade level used in the impact fee calculations is the lower of the averagerecent local cost or the current State cap. The overall cost per student is weighted by current enrollmentto produce a weighted average construction cost per student capacity in permanent classrooms of$21,092, as shown in Table 16.
Table 16WEIGHTED CONSTRUCTION COST PER STUDENT STATION
Grade LevelNo. of
Students% of
EnrollmentCost/
StationWeighted
Cost/Student
Elementary 36,297 52.3% $18,189 $9,513
Middle 13,396 19.3% $22,927 $4,425
High 19,728 28.4% $25,191 $7,154
Total 69,421 100.0% $21,092 Source: Number of students in regular facilities from Table 10 (excludes special facilities);average construction cost per station based on State caps from Table 15.
Off-Site/Drainage Cost
In addition to on-site construction costs, many new school projects require off-site improvements, suchas improvements to adjoining streets and sidewalks, water and sewer infrastructure improvements anddrainage improvements. A major expense that is not counted in the State construction caps is on-siteretention and other on-site costs required to secure water management permits. Based on the SchoolDistrict’s experience with the last nine schools built, the cost of these improvements has averaged 16.6percent of construction cost, as reflected in Table 17.
Table 17OFF-SITE/DRAINAGE IMPROVEMENT COSTS
Off-Site Costs $14,056,575
On-Site Water Management Permit Costs $27,799,669
Total Off-Site/Drainage Costs $41,856,244
Total Construction Costs $251,459,595
Percent of Construction Costs 16.6%Source: Off-site and water management permit costs from Table 13; totalconstruction cost from Table 14.
Land Cost
The cost of land for new school sites must be added to construction costs. As part of this impact feeupdate, the consultant team retained a local real estate appraiser to determine an appropriate land costfor future school sites. The appraiser identified 23 sales throughout Lee County that were comparableto new school sites in size, location and suitability for development. The appraiser interviewed eitherthe buyer, seller or agent involved in each transaction to verify the selling price, financing, motivationto purchase and sell and any lease or income expense information. The sales prices were adjusted tocurrent dollars (October 2007). The adjustment reflects both the rapid growth in land values throughDecember 2005, and the subsequent real estate slow down. For sales prior to January 2006, the priceswere adjusted to reflect cost appreciation of 2 percent per month. A 15 percent downward adjustment

Lee County\SCHOOL IMPACT FEE STUDY duncan|associates August 27, 2008, Page 24
was made for 2006 to reflect the real estate slow down. The average cost per acre in each of the threechoice zones was then weighted by the anticipated percent of new schools to be built in each zone todetermine a county-wide weighted cost.
Lee County School District has acquired 26 tracts over the past three years. The land purchases rangedin value from $12,500 per acre to more than $425,000 per acre. The appraiser’s report found that theaverage acquisition cost over the past three years was $153,965 per acre, which was more than threetimes higher than the $54,000 per acre for sites acquired by the District between 2002 to 2004. However,most of the recent transactions occurred during the “boom cycle” of the recent real estate upturn of2004-2005, and the appraiser did not think the recent district land acquisition costs would be indicativeof future land costs. Since the appraisal study is forward looking, the appraisal used non-district landpurchases as the primary basis for determining the appropriate land cost.
In determining an appropriate land cost, the appraiser examined comparable historic land sales bySchool Choice Zone. The transactions analyzed for determining the land value primarily occurred sinceJanuary 2005. The choice of land transactions reflects site characteristics that meet future school needby zone and targeted areas where growth and school construction is expected. The future school needswere utilized to weigh the cost per acre derived for each zone to determine the equal average value peracre. The final county-wide value is estimated at $63,000 per acre. This is a 40-percent reduction fromthe average land cost of $105,000 used in the 2005 study, and is lower than the cost per acre used in theoriginal 2001 study.
Table 18LAND ACQUISITION COST PER ACRE
2001 Study 2005 Study 2008 Study
Land Acquisition Cost per Acre $87,000 $105,000 $63,000 Source: 2001 cost from Duncan Associates, School Impact Fee Study, November 2001; 2005cost from Duncan Associates, School Impact Fee Update Study, September 2005; 2008 costfrom Maxwell & Hendry Valuation Services, Inc., School Impact Fee Study (Land Component)for Lee County, Florida, October 15, 2007.
In addition to the raw land cost, the District’s acquisition costs include legal, administrative and duediligence costs. The legal costs for South Fort Myers High School, East Lee County High School, LeeCounty Public Education Center and Ida Baker High School all include costs related to eminent domainproceedings. As shown in Table 19, the legal and due diligence costs associated with recent landacquisitions cost approximately $4,005 per acre.

Lee County\SCHOOL IMPACT FEE STUDY duncan|associates August 27, 2008, Page 25
Table 19LEGAL AND DUE DILIGENCE COST PER ACRE
Property AcresDue
Diligence Legal Fees Total Fees Fees/AcrePalomino Ln./Skyport Ave (future school) 18.96 $37,855 $3,453 $41,308 $2,179 Treeline Avenue (future school) 23.94 $33,100 $6,143 $39,243 $1,639
Alpha Dr/Priscilla Ln. (future school) 18.00 $27,048 $8,014 $35,062 $1,948 Treeline Avenue (future school) 13.09 $1,761 $2,256 $4,017 $307 Rayma Page Elementary 13.60 $29,850 $23,428 $53,278 $3,918 Lee Co. Public Education Center 29.80 $47,195 $85,659 $132,854 $4,458 South Fort Myers High 38.49 $54,013 $170,338 $224,351 $5,829 Cape Coral (future school) 15.83 $27,475 $0 $27,475 $1,736 1st St. (future school) 13.00 $51,143 $2,070 $53,213 $4,093 19th Ave. (future school) 15.92 $33,325 $4,164 $37,489 $2,355 20th Ave. (future school) 30.77 $55,145 $3,056 $58,201 $1,891 Ida S. Baker High 40.00 $40,308 $2,124,633 $2,164,941 $54,124 Island Coast High 46.00 $27,259 $2,295 $29,554 $642 Patriot Elem./Challenger Middle 25.40 $29,200 $4,654 $33,854 $1,333 18th St. (future school) 37.89 $35,245 $8,368 $43,613 $1,151 Littleton Rd. (future school) 124.75 $40,000 $5,449 $45,449 $364 Birdsong Ln. (future school) 11.20 $30,263 $4,591 $34,854 $3,112 Tice St. (future school) 114.37 $36,393 $8,110 $44,503 $389 S. Olga Dr. (future school) 18.86 $31,153 $5,131 $36,284 $1,924 Gunnery Rd. (future school) 16.26 $26,579 $0 $26,579 $1,635 Joel Blvd./Tuckahoe (future school) 101.60 $43,325 $0 $43,325 $426 Redmont (future school) 12.60 $35,422 $4,485 $39,907 $3,167 Manatee Elem./Oak Hammock Middle 35.64 $41,313 $6,055 $47,368 $1,329 Riverhall Elementary 19.99 $32,450 $8,727 $41,177 $2,060 East Lee Co. High 45.92 $99,365 $145,828 $245,193 $5,340 East Zone Staging 10.67 $28,600 $19,199 $47,799 $4,480 Leonard Transport Facility 22.55 $31,300 $2,924 $34,224 $1,518 Total 915.10 $3,665,115 $4,005 Source: Parcel size, due diligence and legal fees from Lee County School District, School Support Division, November27, 2007.
The total land cost per acre includes both the raw land acquisition cost based on the appraisal reportand recent legal and administrative costs related to district land acquisition. The combined acquisitionand legal/administrative costs are $67,005 per acre, as shown in Table 20.
Table 20NET LAND COST PER ACRE
Land Acquisition Cost per Acre $63,000
Legal/Admin. Fee per Acre $4,005
Total Land Cost per Acre $67,005Source: Acquisition cost from Maxwell & HendryValuation Services, Inc., School Impact Fee Study (LandComponent) for Lee County, Florida, October 15, 2007;legal and administrative costs from Table 19.

Lee County\SCHOOL IMPACT FEE STUDY duncan|associates August 27, 2008, Page 26
The acreage occupied by existing schools is divided by school capacity to determine the acres of landrequired per student. This is multiplied by the cost per acre to derive the land cost per student, asshown in Table 21.
Table 21LAND COST PER STUDENT STATION
Total Acres 2,033.1
Current Permanent Capacity 79,604
Acres per Student 0.0255
Land Cost Per Acre $67,005
Land Cost Per Student $1,709Source: Total acres from Table 10; current permanent capacity from
Table 11; land cost per acre from Table 20.
Ancillary Facility Cost
In addition to schools themselves, the District provides ancillary facilities that must also be expandedas enrollment grows. These ancillary facilities include administration buildings, buses and fleetmaintenance facilities. Table 22 shows the building and land costs of the District’s ancillary facilities.The construction costs are calculated by multiplying the sum of the permanent square footage of allancillary facilities by the current estimated cost per square foot for Lee County. The land cost is basedon the same cost per acre as school sites. In the existing-level-of-service analysis, the ancillary facilitiesexclude the Hipps Building and Adams Buildings, since these old administrative buildings will be sold.In addition, this study only includes 70 percent of the Lee Public Education Center’s total square feetto reflect excess capacity associated with the un-used portion of the facility.

Lee County\SCHOOL IMPACT FEE STUDY duncan|associates August 27, 2008, Page 27
Table 22ANCILLARY FACILITY COSTS
Facility Square Feet Acres
Dunbar Athletics 478 4.00
Dunbar Community School 35,237 6.00
Gwynne Building 19,692 1.00
Lee Public Education Center* 257,019 30.00
Maintenance Department 65,419 10.00
Supply Department 18,038 1.00
Transportation Services East 1 6,568 10.00
Leonard Transportation Facility 0 11.00
Transportation Services North 20,907 10.00
Transportation Services South 1 26,965 23.00
Transportation Services South 2 2,160 5.00
Transportation Services, Canal St. 28,307 10.00
Transportation Services West 20,492 20.00
Total Area 501,282 141.00
Cost Per Sq. Foot/Acre $111 $67,005
Total Cost $55,642,302 $9,447,705 * Square feet includes 86% of 298,859 square feet in this building to reflect un-usedportion of facility and excess capacity. Source: Square feet of permanent buildings and acres of land based on FISH facility datafrom Lee County School District, November 27, 2007; cost per square foot based on costof Lee County Public Education Center (Metro Mall) cost of $102 per square foot per LeeCounty School District, School Support Division, July 21, 2005 adjusted based on BuildingCost Index as of February 2008 from Engineering News-Record; cost per acre from Table20.
Currently, the District has over 890 buses in active service. These includes buses on daily routes andspare buses. The spare buses are used for field trips and as substitute buses when the route buses arein for service. The current unit costs of new school buses are multiplied by the number of buses of eachtype to determine the total cost of the current bus fleet, as shown in Table 23.
Table 23EXISTING BUS FLEET COST
Bus Type Total Fleet Unit Cost Total Cost
Type A, Special Needs 25 $75,000 $1,875,000
Type C, 47-Passenger 102 $85,000 $8,670,000
Type C, 65-Passenger 372 $85,000 $31,620,000
Type D, 71-77-Passenger 394 $95,000 $37,430,000
Total Fleet 893 $79,595,000Source: Number of buses in fleet and unit costs from Lee County School District,September 11, 2007.
The total ancillary cost is the sum of all construction, land acquisition/site preparation andtransportation equipment costs, as shown in Table 24. The total cost is divided by the current numberof students to determine the ancillary capital cost per student.
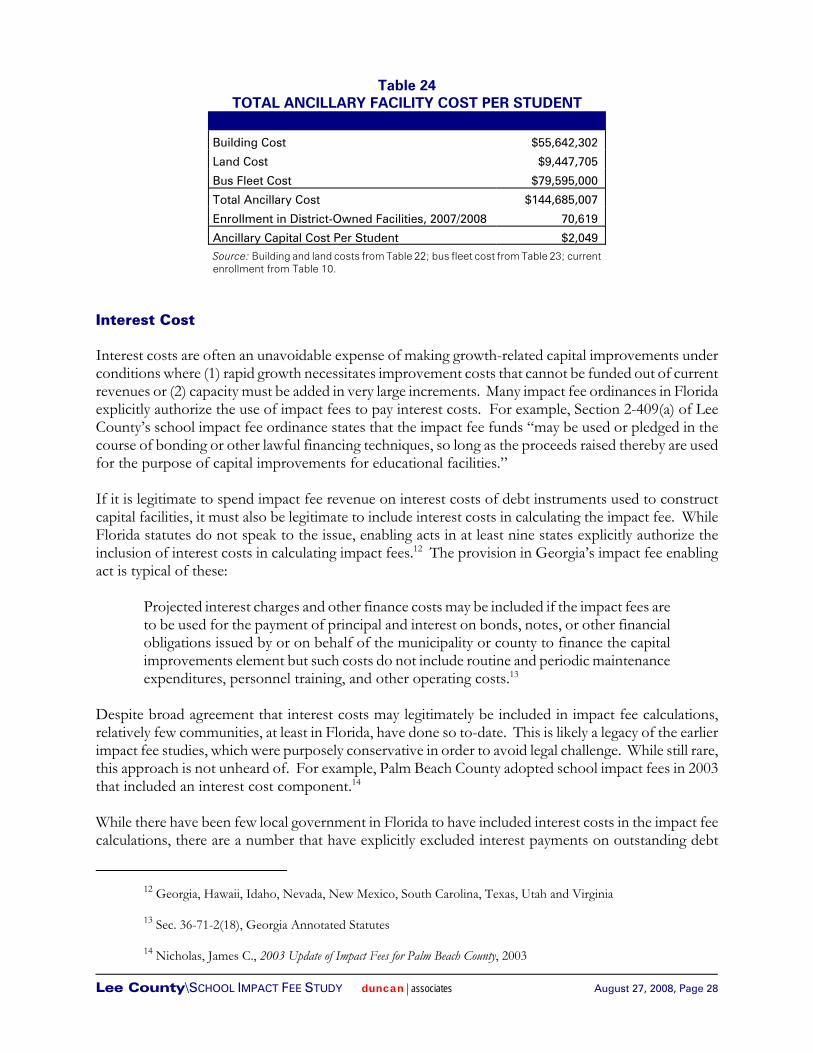
12 Georgia, Hawaii, Idaho, Nevada, New Mexico, South Carolina, Texas, Utah and Virginia
13 Sec. 36-71-2(18), Georgia Annotated Statutes
14 Nicholas, James C., 2003 Update of Impact Fees for Palm Beach County, 2003
Lee County\SCHOOL IMPACT FEE STUDY duncan|associates August 27, 2008, Page 28
Table 24TOTAL ANCILLARY FACILITY COST PER STUDENT
Building Cost $55,642,302
Land Cost $9,447,705
Bus Fleet Cost $79,595,000
Total Ancillary Cost $144,685,007
Enrollment in District-Owned Facilities, 2007/2008 70,619
Ancillary Capital Cost Per Student $2,049 Source: Building and land costs from Table 22; bus fleet cost from Table 23; currentenrollment from Table 10.
Interest Cost
Interest costs are often an unavoidable expense of making growth-related capital improvements underconditions where (1) rapid growth necessitates improvement costs that cannot be funded out of currentrevenues or (2) capacity must be added in very large increments. Many impact fee ordinances in Floridaexplicitly authorize the use of impact fees to pay interest costs. For example, Section 2-409(a) of LeeCounty’s school impact fee ordinance states that the impact fee funds “may be used or pledged in thecourse of bonding or other lawful financing techniques, so long as the proceeds raised thereby are usedfor the purpose of capital improvements for educational facilities.”
If it is legitimate to spend impact fee revenue on interest costs of debt instruments used to constructcapital facilities, it must also be legitimate to include interest costs in calculating the impact fee. WhileFlorida statutes do not speak to the issue, enabling acts in at least nine states explicitly authorize theinclusion of interest costs in calculating impact fees.12 The provision in Georgia’s impact fee enablingact is typical of these:
Projected interest charges and other finance costs may be included if the impact fees areto be used for the payment of principal and interest on bonds, notes, or other financialobligations issued by or on behalf of the municipality or county to finance the capitalimprovements element but such costs do not include routine and periodic maintenanceexpenditures, personnel training, and other operating costs.13
Despite broad agreement that interest costs may legitimately be included in impact fee calculations,relatively few communities, at least in Florida, have done so to-date. This is likely a legacy of the earlierimpact fee studies, which were purposely conservative in order to avoid legal challenge. While still rare,this approach is not unheard of. For example, Palm Beach County adopted school impact fees in 2003that included an interest cost component.14
While there have been few local government in Florida to have included interest costs in the impact feecalculations, there are a number that have explicitly excluded interest payments on outstanding debt

15 See, for example, Tischler & Associates, School Impact Fees Update Report, Pasco County, Florida, 2001 and DuncanAssociates, Road Impact Fee Update, Cape Coral, Florida, May 2005
Lee County\SCHOOL IMPACT FEE STUDY duncan|associates August 27, 2008, Page 29
from revenue credit calculations on the grounds that interest costs were not included on the cost sideof the equation.15 Lee County has historically excluded both interest costs and revenue credit for theinterest portion of debt service payments, and this approach is continued in this study.
Cost Summary
The sum of school construction costs, off-site/drainage costs, land costs and ancillary facility costsyields the total capital cost per student required to accommodate the District’s growing enrollment, aspresented in Table 25.
Table 25TOTAL CAPITAL COST PER STUDENT
Construction Cost per Student $21,092
Off-Site/Drainage Cost per Student $3,501
Land Cost per Student $1,709
Ancillary Facility Cost per Student $2,049
Total Capital Cost per Student $28,351Source: Construction cost per station from Table 16; non-construction costsbased on percent of construction cost from Table 17; land cost from Table 21;ancillary facility cost from Table 24.
REVENUE CREDITS
In addition to paying school impact fees, new development will also pay for school facilities throughfuture contributions to other capital funding sources that will be used to pay for expanding schoolcapacity. The impact fees will be reduced by the present value of those future contributions expectedto be made over the next 20 years in order to ensure that new development is not charged twice for thesame facilities.
Credit for future revenues, however, only needs to be given for funds that will be available for capacity-expanding improvements. As in the last update, the impact fee credit is based on the District’s officialfive-year Work Program submitted to the Florida Department of Education. The Work Program isused to estimate the percent of future capital funding likely to be received by the District over the next20 years that will be available to pay for capacity-expanding improvements. Capacity-expandingimprovements, which include 29 new schools, will cost an estimated $1.20 billion. Some of this will bepaid with school impact fees, other earmarked revenue, such as PECO New Construction, and non-recurring revenues, such as the fund balance.
The capital funding that the Lee County School Board expects to receive over the next five years, as setforth in the District’s five-year Work Program, is summarized in Table 26. The District’s major sourceof capital funding is the local Capital Improvement Tax (CIT). According to its adopted five-yearcapital plan, the District will raise $1.12 billion in CIT revenues out of a total non-earmarked recurringcapital budget of $1.25 billion. The addition of impact fees, other earmarked revenue and non-recurring

Lee County\SCHOOL IMPACT FEE STUDY duncan|associates August 27, 2008, Page 30
revenue brings the total capital funds anticipated to be available to $1.71 billion. The District does notplan to issue new debt or utilize proceeds from prior debt authorizations during this period.
Table 26PLANNED CAPITAL FUNDING, FY 2008-2012
Capital Improvement Tax (CIT) $1,121,650,394
Capital Outlay & Debt Service (CO&DS) $4,758,060
Classrooms For Kids $95,776,033
Interest and Miscellaneous $28,136,291
Total Non-Earmarked Recurring Revenue $1,250,320,778
Impact Fees $100,000,000
Allocated Fund Balance $310,206,630
PECO New Construction Revenue $29,502,142
PECO Maintenance $24,472,774
Total Revenue Available $1,714,502,324Source: Lee County School District, 5-Year District Facilities WorkProgram for Fiscal Years 2007/2008 through 2011/2012, September 26,2007.
School impact fees must be used solely for capacity-expanding improvements. The District’s capitalplan also programs revenue from other one-time sources, such as debt and fund balances, for capacityimprovements. Maintenance and rehabilitation of existing facilities are funded from recurring annualrevenue sources, such as the CIT property tax. Recurring funding that is not needed for non-capacitypurposes is available for expenditure on capacity improvements.
Debt service for outstanding Certificates of Participation (COPs), which function much like bonds, isanticipated to consume about 20 percent of the District’s CIT revenues. Payment of the principal onthis debt service, to the extent that it was used for capacity-expanding improvements, will be treated asa capacity-expanding improvement. However interest costs, which were not included on the cost sideof the fee calculations, are excluded from the definition of capacity improvements on the credit side forconsistency (see discussion on page 28).
According to the District’s five-year plan, 63.3 percent of non-recurring, non-earmarked capital revenuewill be used for capacity-expanding capital improvements, as shown in Table 27. This percentage willbe used in developing the State funding and Capital Improvement Tax revenue credits in the remainderof this section.

Lee County\SCHOOL IMPACT FEE STUDY duncan|associates August 27, 2008, Page 31
Table 27PLANNED CAPITAL EXPENDITURES, FY 2008-2012
Total Capacity Non-CapacityNew Schools $878,173,912 $878,173,912 $0Additions $21,400,000 $21,400,000 $0Replacement $30,002,738 $14,036,503 $15,966,235Land Purchases $75,050,021 $75,050,021 $0Bus/Vehicle Purchases $52,120,581 $9,975,527 $42,145,054New Administrative Complex $2,748,477 $1,574,804 $1,173,673Capital Outlay Equipment $38,973,365 $38,973,365 $0Ancillary Transportation Depots $523,328 $523,328 $0Debt Service for s.1011 Loans $0 $0 $0Debt Service for COPs $233,029,355 $143,346,443 $89,682,912Minor Maintenance/Repair $55,000,000 $0 $55,000,000District-wide Maintenance $49,659,231 $0 $49,659,231School Improvements/Construction $7,543,402 $0 $7,543,402Non-Capacity Capital Outlay Projects $1,897,490 $0 $1,897,490Document Imaging $13,005 $0 $13,005Safety and Inspections $1,060,516 $0 $1,060,516Capitalized Personnel $10,825,338 $0 $10,825,338Construction Technology $17,455,628 $17,455,628 $0Insurance Contingency Funds $8,591,079 $0 $8,591,079Survey Recommends (Reconfigure Schools) $17,631,625 $0 $17,631,625County-Wide Roof Replacement $16,911,275 $0 $16,911,275Rent/Lease Relocatables (Portables) $15,490,549 $0 $15,490,549Upgrade Technology $57,594,325 $0 $57,594,325District Software Systems $11,085,366 $0 $11,085,366County-wide HVAC $54,725,436 $0 $54,725,436Safety to Life Corrections $12,271,150 $0 $12,271,150Rent/Lease Energy Management Equipment $2,028,432 $0 $2,028,432Total Expenditures $1,671,805,624 $1,200,509,531 $471,296,093Impact Fees $100,000,000 $100,000,000 $0Fund Balance $310,206,630 $307,135,467 $3,071,163COPs Proceeds $0 $0 $0PECO New Construction $29,502,142 $29,502,142 $0PECO Maintenance $24,472,774 $0 $24,472,774Paid with Non-Earmarked Recurring Revenue $1,207,624,078 $763,871,922 $443,752,156Percent 100.0% 63.3% 36.7%Source: Lee County School District, 5-Year District Facilities Work Program for Fiscal Years 2007/2008 through 2011/2012, September26, 2007; capacity share of replacement facilities based on increase in Heights Elementary capacity from 695 to 1,306 studentstations; capacity share of buses is based on projected enrollment growth over work program period from 70,619 to 84,135 COFTE,non-capacity share are replacement buses; non-capacity share of new administrative complex cost is based on the ratio of squarefootage of existing administrative buildings to square footage of new complex per July 8, 2005 memorandum; non-capacity shareof fund balance based on non-capacity apportionment of the new administrative complex and non-capacity capital outlay projectsthat will be funded by the fund balance; non-capacity COPs debt service estimated at 38.5%, based on 30.5% of debt service tointerest per Lee County School District, 2007-08 Final Budget, “Future Annual Requirements to Retire Debt,” p. 136, June 30, 2007and 11.5% of outstanding COPs principal used for replacement schools based on data provided by Lee County School District,November 30, 2007.

Lee County\SCHOOL IMPACT FEE STUDY duncan|associates August 27, 2008, Page 32
State Capital Funding
The State of Florida provides limited funding for capital improvements. The Capital Outlay and DebtService (CO&DS) has diminished in recent years and is no longer a significant source of capital funding.PECO new construction revenues had declined in prior years; however, the School District has beenable to receive additional funding from this source for new construction in the current five-year plan.Classrooms for Kids is the most significant source of State funding for new schools. The Classroomsfor Kids program is funded by the Florida Lottery and provides funding for the construction of newschools and additions to help public school districts meet the class size standards prescribed in theFlorida Constitution and Section 1003.03, Florida Statutes. However, future PECO New Constructionand Classroom for Kids revenues are expected to be significantly lower in future years than in thecurrent year. Consequently, average State capital funding per student is based on the four yearsremaining in the capital plan, excluding the current fiscal year. Anticipated funding over the next fouryears is $201.71 per student per year, as shown in Table 28. The total State funding has increased sincethe last update, which assumed an average funding of $24 per student.
Table 28PLANNED STATE CAPITAL FUNDING, FY 2008-2012
FY 2007/08 FY 2008/09 FY 2009/10 FY 2010/11 FY 2011/12 4-Year Avg.
PECO New Construction $15,925,949 $4,237,782 $2,310,272 $3,395,962 $3,632,177 $3,394,048
Enrollment (non-charter) 70,619 74,401 77,196 80,624 84,869 n/a
PECO Funding per Student $225.52 $56.96 $29.93 $42.12 $42.80 $42.95
CO&DS Bond Proceeds $951,612 $951,612 $951,612 $951,612 $951,612 $951,612
Classrooms for Kids $35,776,033 $15,000,000 $15,000,000 $15,000,000 $15,000,000 $15,000,000
Total Other State Funding $36,727,645 $15,951,612 $15,951,612 $15,951,612 $15,951,612 $15,951,612
Enrollment (non-charter) 70,619 74,401 77,196 80,624 84,869 n/a
Other Funding per Student $520.08 $214.40 $206.64 $197.85 $187.96 $201.71Source: Lee County School District, 5-Year District Facilities Work Program for Fiscal Years 2007/2008 through 2011/2012, September26, 2007; enrollment estimates based on non-charter public school enrollment in District-owned facilities for March 2008 from Table10 and 2008/2009 to 2011/2012 projected enrollment from Work Program.
The State funding credit is based on the present value of the PECO funding and other capital fundingper student that are utilized for capacity expansion. The present value of PECO funding over the next20 years is $546. The present value of other future State capital funding over the next 20 years is about$2,566 per student, which is reduced to account for the percent of capital funding available for capacityexpansion. The total State capital funding available for capacity expansion over the next 20 years is theequivalent to a current payment of $2,170 per student, as shown in Table 29. This amount will bededucted from the total cost per student.

Lee County\SCHOOL IMPACT FEE STUDY duncan|associates August 27, 2008, Page 33
Table 29STATE FUNDING CREDIT
Average Annual PECO New Construction per Student, FY 2007/08-2011/12 $42.95
Present Value Factor (20 Years @ 4.76%) 12.72
PECO New Construction Credit per Student $546
Average Annual Other Capital Funding per Student, FY 2007/08-2011/12 $201.71
Present Value Factor (20 Years @ 4.76%) 12.72
Net Present Value of Future Other Capital Funding per Student $2,566
Percent of Capital Funding Available for Capacity Expansion 63.3%
Other Funding Credit per Student $1,624
Total State Funding Credit per Student $2,170Source: Average annual State capital funding per student from Table 28; net present value factor basedon discount rate of 4.76%, which is average Interest rate on state and local bonds for the last threemonths (2/2008 through 4/2008) from the Federal Reserve at http://www.federalreserve.gov/releases/h15/data/m/slbond.txt; percent of capital funding available for capacity expansion from Table 27.
Capital Improvement Tax
School districts in Florida are authorized to impose a property tax for capital improvements known asthe Capital Improvement Tax (CIT). New residential developments that will send children to Districtschools will also pay the CIT. A credit will be calculated to reflect what new developments will paytoward their school capital needs through their annual CIT payments.
The CIT millage rate assessed by the Lee County School District has been at what was the maximumlevel of $2.00 per $1,000 of taxable value. However, HB 5083, which was passed by the Floridalegislature and took effect on July 1, 2008, amends Sec. 1011.71(2), Florida Statutes, to reduce themaximum CIT millage rate from 2.00 to 1.75. Applying this tax rate to the taxable value per studentyields an annual payment per new student. Applying the percentage of capital funding available forcapacity expansion yields the annual CIT capacity payment per student that can be expected from newdevelopment, as shown in Table 30.
Table 30ANNUAL CAPITAL IMPROVEMENT TAX PER STUDENT
Total Lee County Residential Taxable Value, 2007 $48,443,311,840 Lee County Public School Enrollment, 2007 70,619 Average Taxable Value per Student $685,981 Capital Millage Rate (per $1,000) $1.75 Annual Tax Payments Per Student $1,200
Percent of Capital Funding Available for Capacity Expansion 63.3%
Annual CIT Payments for Capacity per Student $760 Source: Total taxable value of residential property in Lee County in 2007 from Lee County PropertyAppraiser, August 28, 2007; non-charter public school enrollment for October 2007 from Table 10;percent of capital funding available for capacity expansion from Table 27.
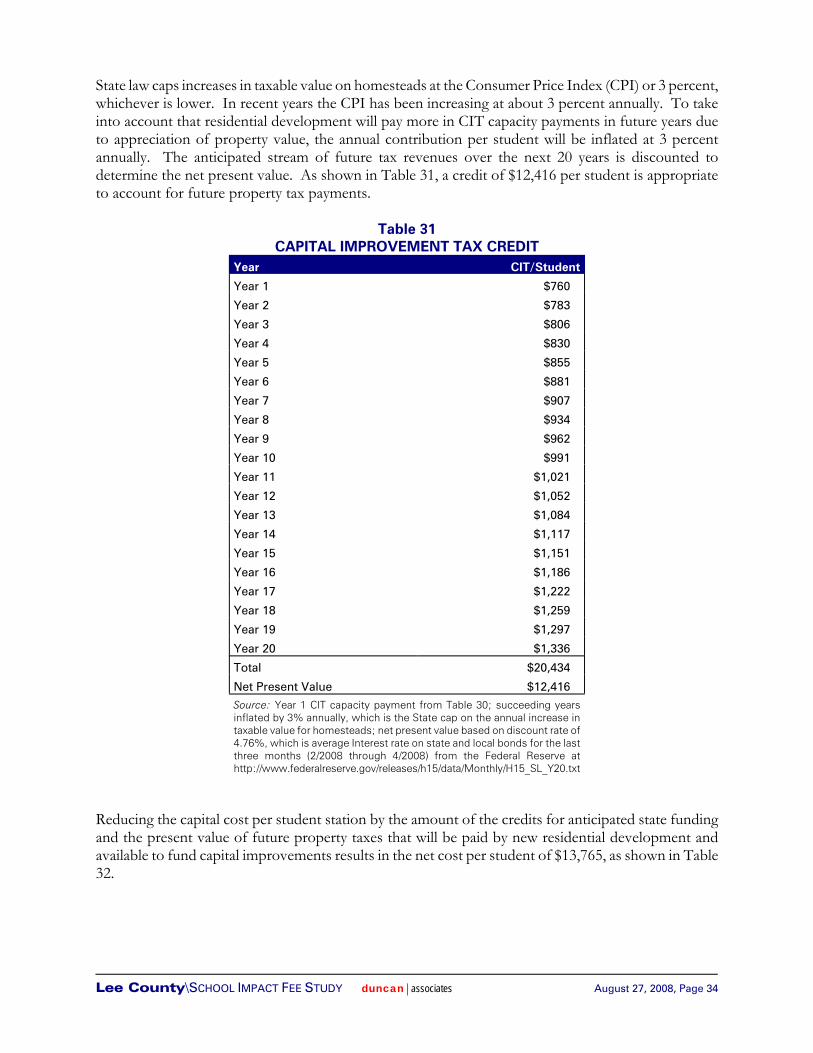
Lee County\SCHOOL IMPACT FEE STUDY duncan|associates August 27, 2008, Page 34
State law caps increases in taxable value on homesteads at the Consumer Price Index (CPI) or 3 percent,whichever is lower. In recent years the CPI has been increasing at about 3 percent annually. To takeinto account that residential development will pay more in CIT capacity payments in future years dueto appreciation of property value, the annual contribution per student will be inflated at 3 percentannually. The anticipated stream of future tax revenues over the next 20 years is discounted todetermine the net present value. As shown in Table 31, a credit of $12,416 per student is appropriateto account for future property tax payments.
Table 31CAPITAL IMPROVEMENT TAX CREDIT
Year CIT/Student
Year 1 $760
Year 2 $783
Year 3 $806
Year 4 $830
Year 5 $855
Year 6 $881
Year 7 $907
Year 8 $934
Year 9 $962
Year 10 $991
Year 11 $1,021
Year 12 $1,052
Year 13 $1,084
Year 14 $1,117
Year 15 $1,151
Year 16 $1,186
Year 17 $1,222
Year 18 $1,259
Year 19 $1,297
Year 20 $1,336
Total $20,434
Net Present Value $12,416 Source: Year 1 CIT capacity payment from Table 30; succeeding yearsinflated by 3% annually, which is the State cap on the annual increase intaxable value for homesteads; net present value based on discount rate of4.76%, which is average Interest rate on state and local bonds for the lastthree months (2/2008 through 4/2008) from the Federal Reserve athttp://www.federalreserve.gov/releases/h15/data/Monthly/H15_SL_Y20.txt
Reducing the capital cost per student station by the amount of the credits for anticipated state fundingand the present value of future property taxes that will be paid by new residential development andavailable to fund capital improvements results in the net cost per student of $13,765, as shown in Table32.
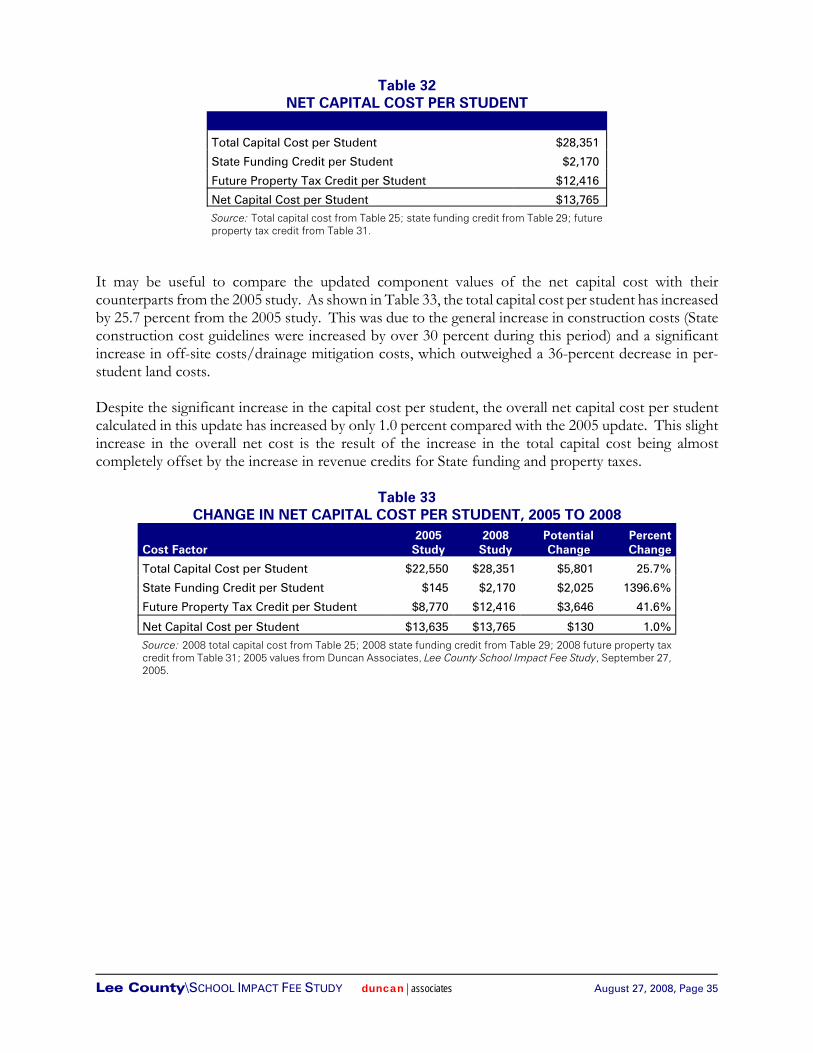
Lee County\SCHOOL IMPACT FEE STUDY duncan|associates August 27, 2008, Page 35
Table 32NET CAPITAL COST PER STUDENT
Total Capital Cost per Student $28,351
State Funding Credit per Student $2,170
Future Property Tax Credit per Student $12,416
Net Capital Cost per Student $13,765 Source: Total capital cost from Table 25; state funding credit from Table 29; futureproperty tax credit from Table 31.
It may be useful to compare the updated component values of the net capital cost with theircounterparts from the 2005 study. As shown in Table 33, the total capital cost per student has increasedby 25.7 percent from the 2005 study. This was due to the general increase in construction costs (Stateconstruction cost guidelines were increased by over 30 percent during this period) and a significantincrease in off-site costs/drainage mitigation costs, which outweighed a 36-percent decrease in per-student land costs.
Despite the significant increase in the capital cost per student, the overall net capital cost per studentcalculated in this update has increased by only 1.0 percent compared with the 2005 update. This slightincrease in the overall net cost is the result of the increase in the total capital cost being almostcompletely offset by the increase in revenue credits for State funding and property taxes.
Table 33CHANGE IN NET CAPITAL COST PER STUDENT, 2005 TO 2008
Cost Factor2005
Study 2008
Study PotentialChange
PercentChange
Total Capital Cost per Student $22,550 $28,351 $5,801 25.7%
State Funding Credit per Student $145 $2,170 $2,025 1396.6%
Future Property Tax Credit per Student $8,770 $12,416 $3,646 41.6%
Net Capital Cost per Student $13,635 $13,765 $130 1.0%Source: 2008 total capital cost from Table 25; 2008 state funding credit from Table 29; 2008 future property taxcredit from Table 31; 2005 values from Duncan Associates, Lee County School Impact Fee Study, September 27,2005.

Lee County\SCHOOL IMPACT FEE STUDY duncan|associates August 27, 2008, Page 36
NET COST SCHEDULES
The net cost per dwelling unit is the product of the number of public school students that, on average,can be expected to be generated from the type of unit and the net cost per student calculated in thisreport. The resulting net costs shown in Table 34 represent the maximum school impact fees that canbe justified based on the analysis contained in this study.
Table 34SCHOOL NET COST PER DWELLING UNIT
Type of UnitStudents/
UnitNet Cost/Student
Net Cost/Unit
Single-Family Detached 0.299 $13,765 $4,116
Multi-Family 0.118 $13,765 $1,624
Mobile Home 0.068 $13,765 $936 Source: Students per unit from Table 9; net cost per student from Table 32.
The potential impact fees shown above represent a decrease of about 4.6 percent from the current fees,as shown in Table 35. This decline is due to a 1.0-percent increase in the net cost per student and a 5.4-percent reduction in the student generation rates.
Table 35POTENTIAL CHANGE IN SCHOOL IMPACT FEES
Type of UnitPotential
Fee Current
Fee PotentialChange
PercentChange
Single-Family Detached $4,116 $4,309 ($193) -4.5%
Multi-Family $1,624 $1,704 ($80) -4.7%
Mobile Home $936 $982 ($46) -4.7% Source: Potential fees from Table 34.
In summary, the maximum school impact fees calculated in this report are, on average, about 4.6 percentlower than those that were calculated three years ago. The following factors resulted in this decline: (1)construction cost increases outweighed reduced land costs, resulting in a 25.7-percent increase in thecost per student; (2) the increase in the cost per student was mostly counter-balanced by the increasein the revenue credit per student, resulting in a 1.0-percent increase in the net cost per student; (3)finally, student generation rates declined by 5.4 percent, resulting in a fee decrease of about 4.6 percent.