Embed Size (px)
Citation preview
DOCUMENT RESUME
ED 026 461 VT 003 810
By-Lowe, James L.The Northwest Missouri State College Studies; Volume XXVII, Number 3, Educational and OccupationalAsprations of High School Seniors, Part 1.
Northwest Missouri State Coll., Marpille,Pub Date 1 Aug 63Note-56p.Available from-Library, Northwest Missouri State College, Maryville, Missouri 64468 ($0.50)Journal Cit-Northwest Missour State College f3ylletin; v57 n12 Aug 1963EMS Price MF-$025 HC-$2.90Descriptors-*Academic Aspirotion, Achievement, Family Influence, *High School Students, *OccupationalAspiration, Parent Attitudes, *Parent Influence, *Seniors, Socioeconomic Influences
Identifiers-Trenton Missouri High SchoolThe purpose of this study was to explore a social-psychological aspect of
mobility-levels of aspiration. The investigation centered on the relationship betweenaspirations of high school seniors and the social status of their parents, the extentto which children remain in the same social status as their parents and to what extentthey rise or fall in status. Answers were sought by the following questions: What arethe levels of aspiration of adolescents located at different status levels? How areattitudes and valves of parents and the children related? What reWionships existbetween aspirations and achievements? The subjects of the study were 98 seniors ofTrenton High School class of 1956 and their parents. The 1960 seniors were alsoincluded but not their parents. Data were collected from school records, yearbooks,school papers, and interviews. The findings revealed evidence of upward socialmobility and contain implications for use by educational and vocational guidancecounselors. A related document is VT 003 811. (CH)
ei
THE
NORTHWEST MISSOURI
STATE COLLEGE STUDIES
EDUCATIONAL AND OCCUPATIONAL ASPIRATI1OF HIGH SCHOOL SENIORS ,
PART # %
JAMES L, LOWF, Pu.D,Aisoclate Pro essor of Sociology
alitatto.
Volt! e August 1, 19.3 other 3
S ngle Copies: Fifty CentsI'ugjstitu AT THE NOIVIIIIVEST NIISSOVIII STATE COLLEOF
NIAIWVILLP, ,NlIssomS. 11111111111116
NORTHWEST Mg:WWII STATE COLLEGE 13CLIETINIVolume LVII, Number 11 f
"rq Entered as Seemul Class Matter. April 4, 191)71, at Maryville. Mo.
CO Issued under Art of Congreis a/ August 21. 1912
E-4
7
7.f

INE411114gliiiINIPMEMailW
U.S. DEPARTMENT Of HEALTH, EDUCATION & W4FARE
OFFICE Of EDUCATION
THIS DOCUMENT HAS PEEN REPRODUCED EXACTLY AS RECEIVED FROM THE
PERSON OR ORGANIZATION ORIGINATING IT, POINTS Of VIEW OR OPINIONS
STATED DO NOT NECUSARILY REPRESENT OFFICIAL OFFICE Of EDUCATION
POSITION OR POLICY,
THENORTHWEST MISSOURI
STATE COLLEGESTUDIES
VOLUME XXVIII NUMBER 3
"PERMISSION TO REPRODUCE THIS
COPYRIGHTED MATERIAL HAS BEEN GRANTED
10 ERIC AND ORGANIZATIONS OPERATING
UNDER AGREEMENTS WITH THE U.S. OFFICE Of
EDUCATION. FURTHER REPRODUCTION OUTSIDE
THE ERIC SYSTEM REQUIRES PERMISSION Of
THE COPYRIGHT OWNER."Corinwirr, 1903, BY
COMMIT= ON TnE NORTHWEST MISSOURISTATE COLLEGE STUDIES
IRENE M. MUELLER., ChairmanEARL D. 13RAGDON
FRANK W. CRUDEKATHRYN RIDDLE

Address all Communicrolons to
j. W. JONES, President
NORTHWEST Mum= STATE COLLEGE
Mmwmix, Missount
Entered a.7 Second Class Matter, April 4, 1906, at Maryville, Mo.Issued under Act of Congress of August 24, 1922
Printed by RUSH PRINTING COMPANYMAlirlILLU) Missouni
:
EDUCATIONAL AND OCCUPATIONAL ASPIRATIONSOF HIGH SCHOOL SENIORS1
PART I
jimes L. LOW% Ph,D,
INTRODUCTION
I. THE RESEARCH PROBLEM
This study is concerned with certain aspects of intergenerationalsecial mobility To what extent do children remain in the samesocial status as their parents and to what extent do they rise or fallin status? How is social mobility or the lack of mobility explained?The purpose in this study is to explore a social-psychological aspectof mobilitylevels of aspiration. The investigation is centered on astudy of the relationship between aspirations of high school seniorsand the social status of their parents. Attempts will be made to iindanswers for the following questions: What aro the levels of aspira-
tion of adolescents located at different status levels? How are atti-tudes and values of parents and children related? What relation-ships exist between aspirations and achievements?2
In any scientific study, theory should guide the investigation.
1. This publication consists of the body of the dissertation "Educational andOccupational Aspirations of High School4Seniors" by James L. Lowe and waspresented to the Depnriment of Sociology, University of Missouri, 1902, in par-tial fulfillment of the requirements for the degree of Doctor of Philosophy inSociology. It will be _published in two parts.
The superintendent of schools, S. NI, Ilissler, end the high school principal,E. D. Coyer, at Trenton, Missouri, were most cooperative In permitting thestudy to be conducted in the Trenton school system, Mr. C. F. -Russel, Cukl-mice Director, supplied valuable scholastic Information about the students. Theauthor also wishes to express his deep appreciation to the Trenton seniors ofthe 1050 and 1980 classes and the parents of the 1958 doss who provided thedata for this investigation.
2. An extensive literature on educational and occupational aspirations isaccumulating. However, ft review of the published studies in this area will potbe made in this report. Interested persons may consult the numerous articleswhich have appeared In sociological fournals. The strong interest now prevalentcan be noted-by the fact that three sectional meetings at the American Sociolo-gical Association meetings in Los Angeles, California, August 20-28, 1903, weredevoted to this sublect.
AL-
4 NORTLIWEff MISSOURI STATE COLLEGE STUDIES
In sociology, general theory is still in an undeveloped state, Some
generalizations, however, concerning stratification and social class
can be found in sociological literature. It is proposed to discuss gen-
eral prineiples of stratification and then from these generalizations,specific propositions in the nature of hypotheses will be deduced for
testing. These propositions will relate the independent variable,
social status, to the dependent variables, attitudes and values of par-
ents and aspirations and achievements of children,Principle Number 1: All societies are stratified, It seems to be
universally accepted by sociologists that all human societies are
stratified.3 Variation exists in the degree of stratification. Small
simple societies are not differentiated as aro the modern industrial
societies, but even in the most primitive societies certain roles are
evaluated and ranked as superior and inferior. Where societiesdevelop more complex economic and social organization, there
tends to be greater stratification, Groups of people occupy about the
same social and economic positions In the society. Stratification
may vary from an approximation of a caste system to an open class
system.Principle Number 2: The various strata develop ways of life
appropriate to their positions or level in the society. In more rigid
societies, the position in the social structure may be designated of-
ficially and legally by certain marks or signs which individuals may
wear or exhibit. In more open societies, the distinctions may be less
obvious and more subtle. The strata vary not only in their physical
possessions such as homes, furniture and clothes but also in lan-
guage, customs, and attitudes. Living under different conditions,
persons in these strata develop different "styles of life."
Principle Number 3: Primary groups, particularly the family,
aro important in transmitting to children the attitudes, values, and
understandings of the society. In all societies the socialization of
children is in large part the function of the family. Family organiza-
t on may vary in different societies, but everywhere children to
some extent are under the control and direction of the family, espe-
cially during the first years of life. As societies become more corn-
3. Whilo there is agreement that societies are stratified there is disagree-and controversy over the nature of stratification. 'There are differences of
n with regard to theories of stratification and methods of investigation,questions involved are theses Is stratification a continuum or oro there
to clones? Is strotilleation unklimonsional? Con stratification be analyzed
lained boat by a functional approach or by some other means?
meritopiatesomedimeand ex

ASP ATIONS OF 1110ff SCUOOL SENIORS: PART I
plex, special organizations are usually instituted to train childrenfor their places in the larger society. Schools thus become significantinfluences in shaping young people's lives. The adolescent peergroup also seems to play a part in the formation of attitudes andvalues.
Principle Number 4; Social mobility exists more or less in allsocieties. In a caste society very little social mobility occuis. A per-son's place is fairly well fixed for life, but some movement takesplace. In open-class societies considerable movement between strataoccurs. Upward mobility may be possible through channels of re-ligious, military, and political institutions. In a modem industrial-ized society, economic and educational Institutions offer opportuni-
ties for mobility.Principle Number 5: Individuals in different social strata are
presumably differentially motivated to assume higher status roles inthe society. Higher status roles tend to be filled in greater propor-tions by persons whose parents occupy higher positions in the so-cietal hierarchy. Some positions are filled by ascription. The son ofa king succeeds to the kingship. Other positions can be achievedthrough individual effort. The social position of the family intowhich one is born influences the position to which one aspires andreaches as well as opportunities for realizing them.
Having discussed general principles of stratification, we nowpropose to formulate specific hypotheses or propositions for testing.
If societies are stratified, it is logical to believe that parents in higherstatus positions are able to give their children greater advantagesand opportunities. The parents should have some understanding oftheir positions and of the channels of mobility. Therefore, these par-ents' behavior would be directed toward raising the social status of
their children or at least toward seeing that it was not lowered. Thehigher status parents would know the importance of education for
social mobility in an industrialized, technical society and would have
the means to provide higher education for their children.The following propositions relating to parents will be tested.
Proposition 1. Parents at higher socio-economic levels willtake a greater interest in the school progress oftheir children than parents on lower levels.
Proposition 2. Parents in higher socio-economic categorieswill be more positive fn encouraging their chit-
6 NORTHWEST MISSOURI sTivre COLLEGE STUDIES
dren to attend college than parents in lowersocial categories.
Proposition 3. Parents at h4her status levels will expect theirchildren to enter higher status occupations.
If societies are stratified and the motives, attitudes, and valuesare transmitted by parents to children, the following general hypo-thesis will logically follow: Educational and occupational aspire-tions of high school seniors are related to the social status of theirparents.
In light of this general hypothesis, children of parents in higherstatus occupations would be expected to acquire the general view-points of their parents. Their aspirations with regard to educationand occupations should be higher than those of children at lowerlevels. Children on lower socio-economic levels would be morelimited in their outlook and in their aspirations. It would be ex-pected that achievements of children at the higher levels would begreater than those at lower levels.
Specific propositions drawn from the general principles can bestated further as follows:
Proposition 4.
Proposition 5.
Proposition 6.
Proposition 7.
Proposition a
Proposition 9.
The proportion of high school seniors aspiringto attend college increases as the socio-eco-nomic status of their parents goes up.
The proportion of students aspiring to higheroccupations increases with higher socio-eco-nomic status of parents.
Students In lower socio-economic groups willbe more undecided as to their educational andoccupational aspirations then those in highersocio-economic groups.
The difference between aspirations and expec-tations is greater in the lower socio-economiclevels.
Students at higher status levels will receivehigher grades and participate more in schoolactivities than students at lower status levels.
The proportion of high school seniors who at-tend college increases as the socio-economicstatus goes up.

MPII1ATIONS OF 111011 SCHOOL SENIORS, FART 1 7
2. P110=1.711E3
It was decided to include in the study all seniors in one highschool in the school year 1955-1956 and their parents. Later theseniors from the same school in the graduating class of 1960 wereadded to the investigation. Two interview schedules covering theareas of interest were prepared. Ono schedule of eight pages wasprepared for students and a shorter one of three pages wasdesigned for the parents.
In most instances the students were interviewed at school dur-ing study hall periods. A few seniors were interviewed before theschool year began as they came to school to enroll. Two boys werevisited in their own homes. Almost all parents were questioned intheir own homes although three parents came to the writer's homefor this purpose.
Data were also cellected from school records, year books, andschool papers. In some Instances English themes of an autobi-ographical nature were obtained from the English teacher. There wasalso occasion to observe and talk with the students during the schoolyear. A file which included interview material, school records, andother information was maintained on each student.
Because of the small number in the senior class of 1956 andespecially in the semi-skilled and unskilled category, it was laterdecided to have the senior class of 1060 complete the schedule formas a questionnaire in order to augment the number in the sample. It
was realized that there might be some variation in replies given in
an interview and answers written on a printed form. However, itwas believed that the results would be substantially the same. Theparents of the 1960 class were not interviewed.
DESCRIPTION OF SETTING AND SUBJECTS
Trenton, the county seat of 'Grundy County, is located in northcentral Missouri about forty miles from the Iowa line. GrundyCounty was organized in 1841, after baying been a part of othercounties. Trenton was incorporated in 1857 by an act of the statelegislature although it had been the county seat under a differentname since the organization of the county. A centennial celebrationwas held in 1957 to observe the one hundredth birthday of Trenton.
8 NORT W. T MISSOUIU STATE COLLEGE STINNES
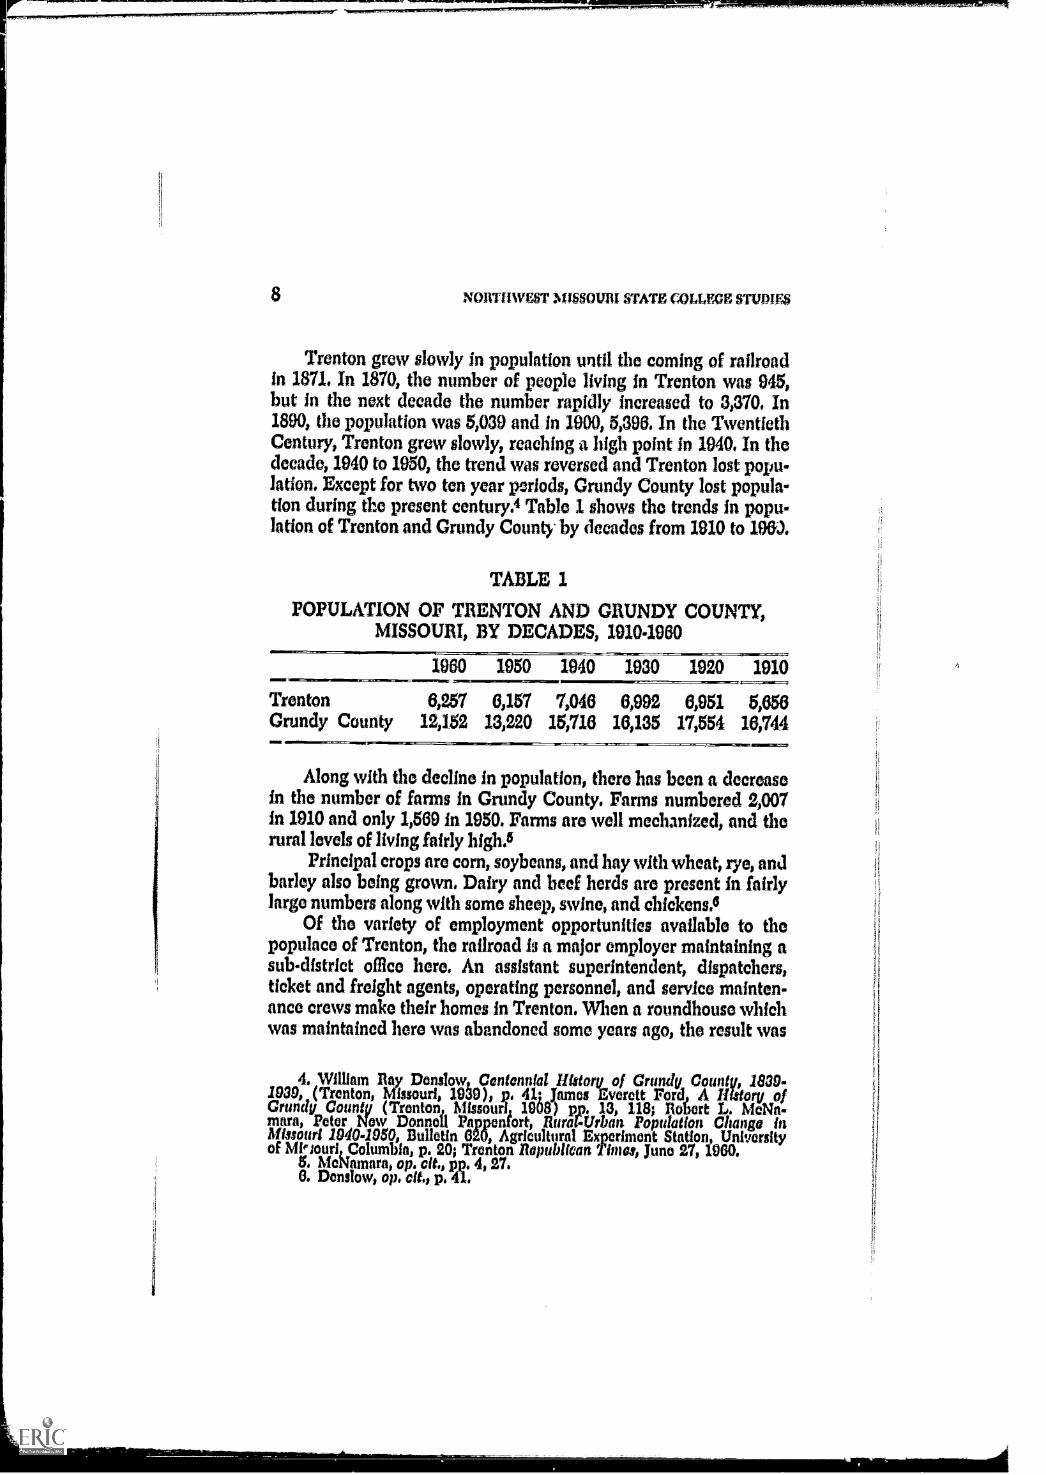
Trenton grew slowly in population until the coming of railroadin 187L In 1870, the number of people living in Trenton was 945,but in the next decade the number rapidly increased to 3,370, In1890, the population was 5,039 and in 1900, 5,396, In the TwentiethCentury, Trenton grew slowly, reaching a high point in 1940. In thedecade, 1940 to 1950, the trend was reversed and Trenton lost popu-lation. Except for two ten year periods, Grundy County lost popula-tion during the present century.4 Table 1 shows the trends in popu-lation of Trenton and Grundy County by decades from 1910 to 1961
TABLE 1
POPULATION OF TRENTON AND GRUNDY COUNTY,MISSOURI, BY DECADES, 1910-1960
4MININ
1960 1950 1940 1930 1920 1910
Trenton 6,257 6,157 7,046 6,992 6,951 5,656Grundy County 12,152 13,220 15,716 16,135 17,554 16,744
Along with the decline in population, there has been a decreasein the number of farms in Grundy County. Farms numbered 2,007In 1910 and only 1,569 in 1950. Farms are well mechanized, and therural levels of living fairly high.5
Principal crops arc corn, soybeans, and hay with wheat, rye, andbarley also being grown. Dairy and beef herds arc present in fairlylargo numbers along with some sheep, swine, and chickens.5
Of the variety of employment opportunities available to thepopulace of Trenton, the railroad is a major employer maintaining asub-district office here, An assistant superintendent, dispatchers,ticket and freight agents, operating personnel, and service mainten-ance crews make their homes in Trenton, When a roundhouse whichwas maintained here was abandoned some years ago, the result was
4. William Ray Denslow, Centennial History of Grundy County, 1820-1039, (Trenton, Missouri, 1939), p. 41; James Everett Ford, A Mimi ofGrundy County (Trenton, Missouri, 1008) pp. 13, 118; Robert L. McNa-mara, Peter New Donnell Pappenfort, RurakIrban Population Change inMissouri 1040400, Bulletin 020, Agricultural Experiment Station, Unhiersityof Mhouri,Columbia, p. 20; Trenton Republican Times, June 27, 1960.
5. MeNanuira, op. cit., pp. 4, 27.0. Denslow, op.

ASPIRATIONS OF HIGH SCH001, SENIORS; TWIT 1 9
not only the elimination of jobs for several hundred men, but also aloss to the community as a whole.
A food canning and processing plant employs from 300 to 400persons who are recruited from Trenton and the surrounding ruralarea and from other nearby communities. A smaller company pur-chases milk for the processing of butter and dehydrated milk. A fer-tilizer mixing plant operated for a time, but after merging with an-other concern, the mixiag operations ceased and the building nowserves as a warehouse for fertilizer.
Trenton is a center for supplying goods and services to the ad-jacent area. A few wholesale houses and numerous retail stores pro-vide employment for a number of persons. The public utilitieselectricity, gas, water, and telephonemust be staffed. Federal andstate agencies as well as local government offices give work to a con-siderable number of people. Professions are represented by doctors,lawyers, ministers, nurses, and teachers. Thus, the town and adja-cent rural area with a rather broad representation of occupationalgroups provides an apt locale for studying aspirations of parents andchildren.
The subjects of the study were the 1956 seniois of Trenton HighSchool and their parents. The 1960 seniors were also included butnot their parents. The 1956 students comprised ninety-eightyoung people who were classified as seniors for the academic year1955-1956; fifty were male and forty-eight were female. Two boyswould have graduated in the year previous except that one boy wasoat of school one semester and the other boy foiled a course. One6ay did not graduate in May, 1956, because he failed a course. Hecontinued in school in the 1956-1957 academic year and received hisdiploma. One boy dropped out of school during the year and did notgraduate. A girl who was married in the first part of the senior yearattended school the first semester but withdrew at the beginning ofthe second semester. Another female student who lived in Trentonduring her elementary school years attended a private high schoolin another community but returned to Trenton for the second se-mester of her senior year. One boy and one girl moved to the com-munity from another town to complete the senior year.
All 1956 seniors in the study were native-born, white Ameri-cans. The author knew of only one foreign-born student in the en-tire school system. Over half the students were born in Grundy
NORTI-INVEST MISSOURI STATE COLLEGE STUDIES
County, and about one-fifth were bow in other counties in Missouri.One-fifth of the seniors' were not natives of Missouri.
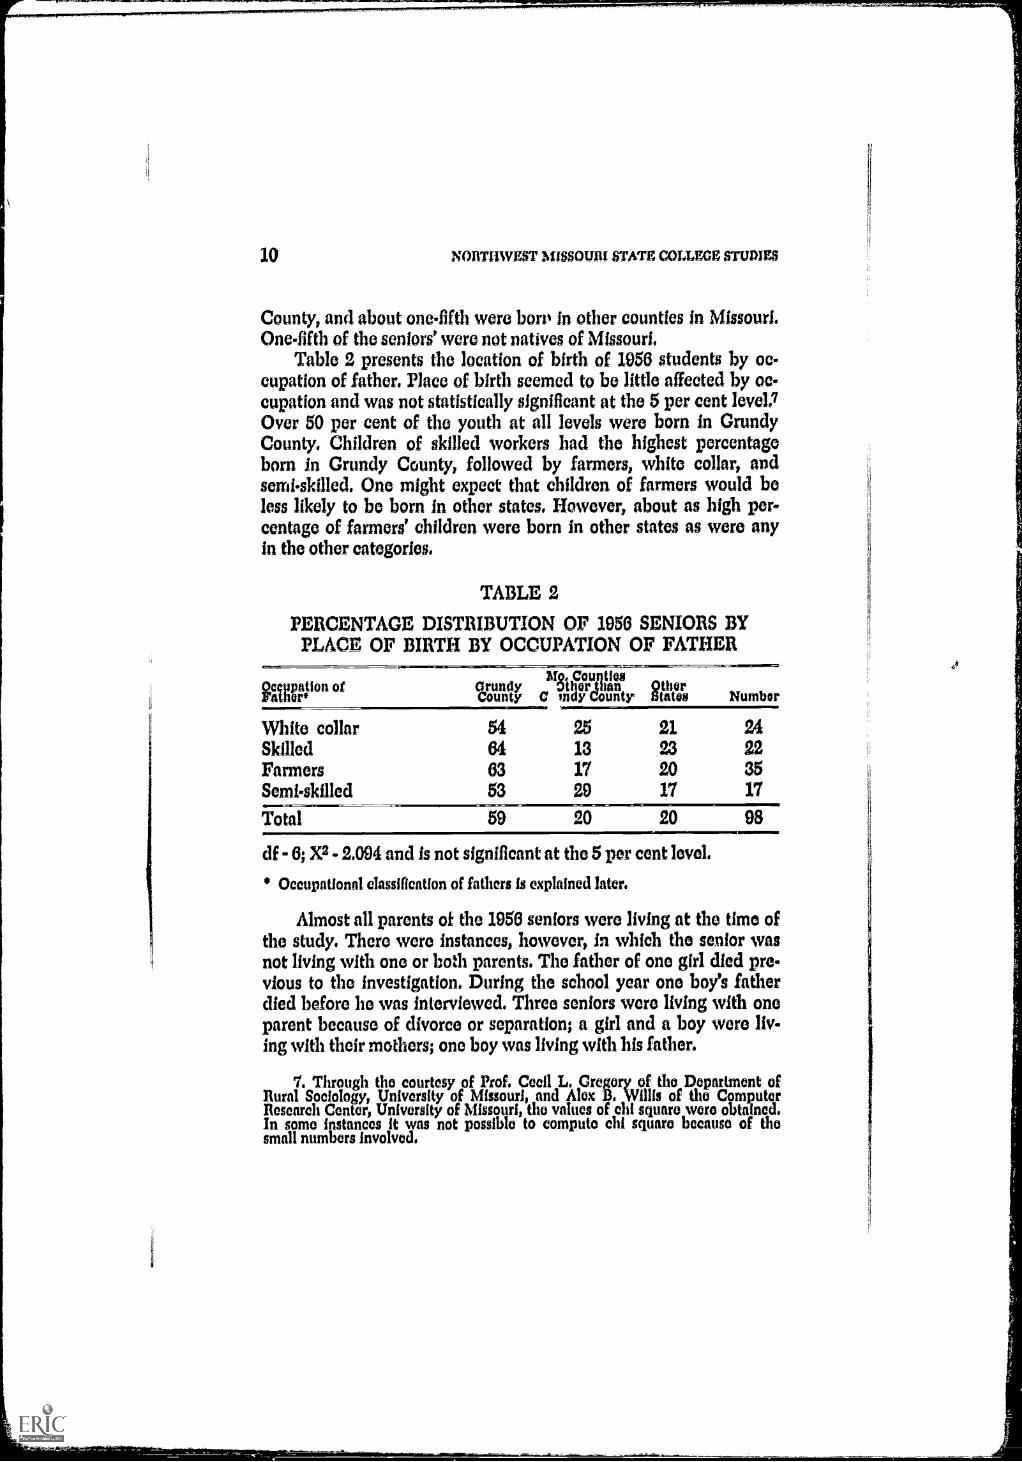
Table 2 presents the location of birth of 1956 students by oc-cupation of father. Place of birth seemed to be little affected by oc-cupation and was not statistically significant at the 5 per cent level.7Over 50 per cent of the youth at all levels were born in GrundyCounty. Children of skilled workers had the highest percentageborn in Grundy County, followed by farmers, white collar, andsemi-skilled. One might expect that children of farmers would beless likely to be born in other states. However, about as high per-centage of farmers' children were born in other states as were anyin the other categories.
TABLE 2
PERCENTAGE DISTRIBUTION OF 1956 SENIORS BYPLACE OF BIRTH BY OCCUPATION OF FATHER
ROI" ofWhite collarSkilledFarmers
Total
GrundyCounty
Mg, CountiesutberAnan tiler
C may county Les Number
54 25 21 2464 13 23 2263 17 20 3553 29 17 17
59 20 20 98ININIII1111111.
df - 6; X2 - 2.094 and is not significant at the 5 per cent level.
Occupational classification of fathers is explained later.
Almost all parents of the 1956 seniors were living at the time ofthe study. There were instances, however, in which the senior wasnot living with one or both parents. The father of ono girl died pre-vious to the investigation. During the school year one boy's fatherdied before he was interviewed. Three seniors were living with oneparent because of divorce or separation; a girl and a boy were liv-ing with their mothers; one boy was living with his father.
7. Through the courtesy of Prof. Cecil L. Gregory of the Department ofRural Sociology, University of Missouri, and Alex B. Willis of the ComputerResearch Center, University of Missouri, the values of chl square were obtained.In some instances It was not possible to compute chl square because of thesmall numbers Involved.
ASPIRATIONS OP BIM WHOM SENIORS/ PART I
Four students were living with their mothers and stepfatherswith three of the latter being Interviewed and included as fathers.Two seniors were being reared by aunts and uncles. Since the par-ents of one girl lived in Nebraska, no contact was made with them;
the parents of the other girl were divorced and resided in othertowns. No communication was had with these parents. The auntsand uncles were interviewed and included as parents.
One student was living with his grandparents who were in-cluded in the statistics as parents. The mother, divorced and roman.ried, lived in another community. In another case the mother andfather were separated with the father residing in an adjoining state.Two children were adoptedone at a very young age, several weeks
old, and another at a later age. Two sets of brothers were subjectsin the study: one set were twins; the other set differed in age by a
year.Ninety-eight seniors of the 1956 class, fifty girls and forty-eight
boys svere included in the investigation. There were ninety-sixmothers since there were two pairs of brothers, and all the mothers
were Interviewed. Only ninety-two fathers were interviewedtherewere two pairs of brothers; two fathers were dead; one father livedIn another state and was not contacted. Another father was not in-cluded although several attempts were made to speak with him.
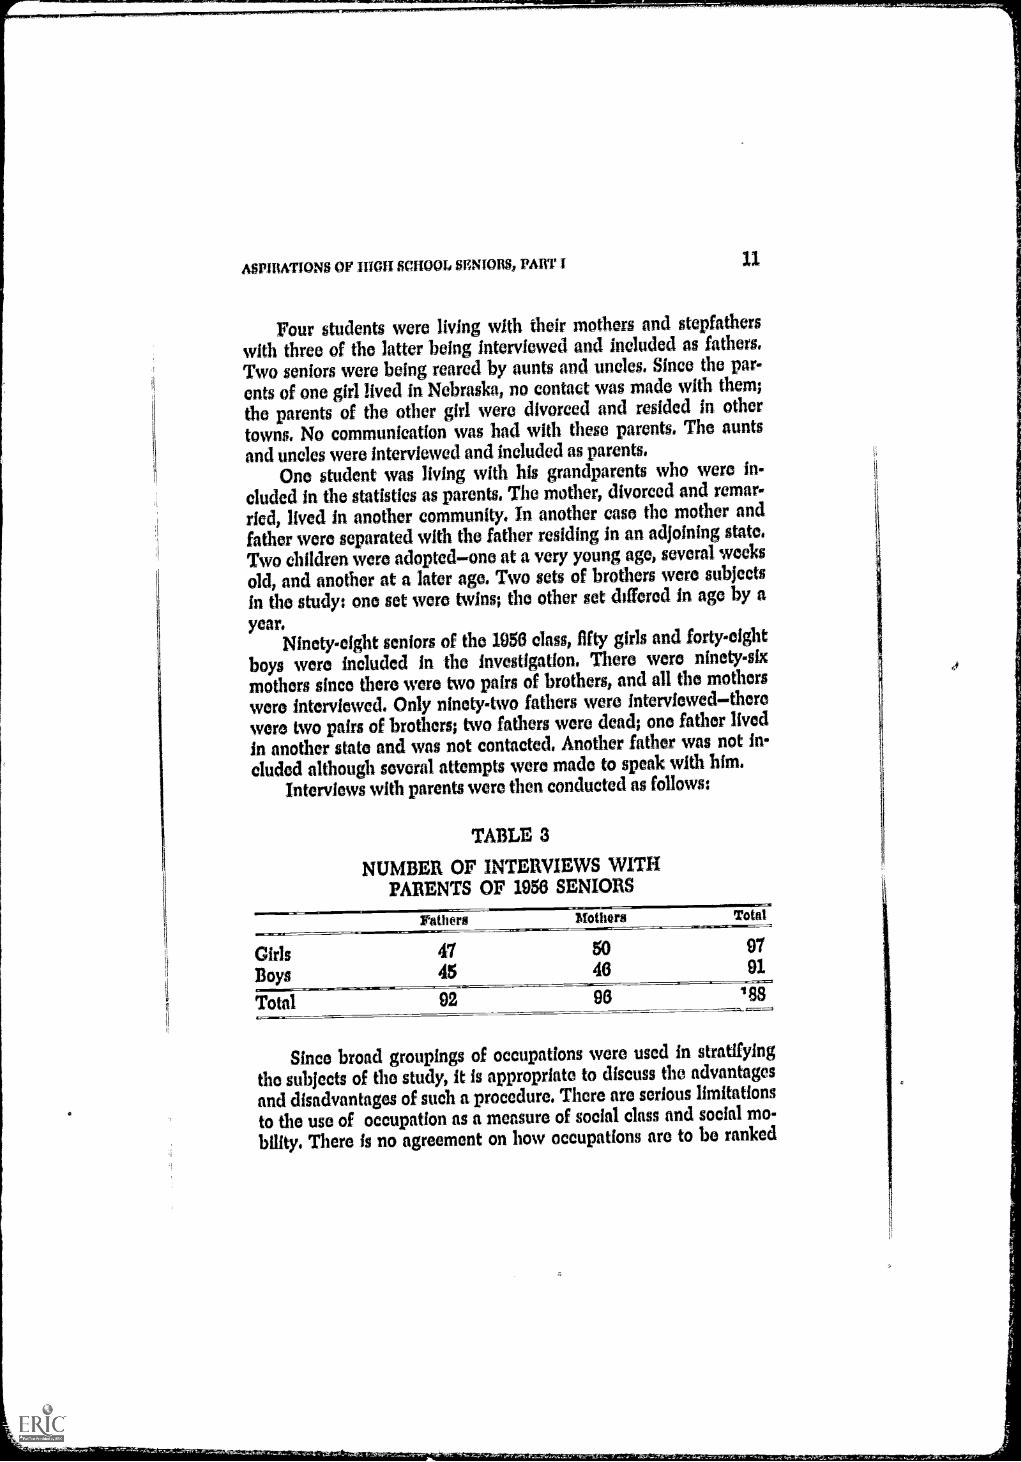
Interviews with parents were then conducted as follows:
TABLE 3
NUMBER OF INTERVIEWS WITHPARENTS OF 1956 SENIORS
rather§ lot nt
Girls 47 50 97
Boys 45 46 91
Total 92 96 188
Since broad groupings of occupations were used in stratifyingthe subjects of the study, It Is appropriate to discuss the advantagesand disadvantages of such a procedure. There are serious limitations
to the use of occupation as a measure of social class and social mo-
bility. There is no agreement on how occupations are to be ranked

12 NORTHWEST MISSOURI STATE COLLEGE STUDIES
and categorized. Cap low, in discussing the problems involved, rec-ognized that occupational position was an important factor in thedetermination of individual prestige and in the allocation of socialprivileges; however, he questioled the possibility of constructinga single dimensional rating of occupational status.8 He asserted thatsome callings, such as salesmen and farmer, covered a wide rangeof status and could not be assigned to any one point. Occupationsalso differed in definiteness, and it was difficult to place or classifysome vocations. Caplow analyzed a number of scales and pointedout the inconsistencies in the ratings; there was general agreementat the top and bottom but there was considerable inconsistency ofrating in the middle occupations.
Reissman stated that the principal objection to the use of occu-pation as a measure of social class could be phrased by a question;What is the relationship between an occupational index and class?Ho contended that stratification studies did not face up to this ques-tion. Type of employment tended to be equated with socifil class;reference was made to social class but the data presented in supportof conclusions depended upon some occupational measure. It wasagreed that there was some relationship between vocation and hier-archies of stratification such as income, education, and life style, butthe precise relationships have not been worked out. Occupationswore not social classes.9
As a matter of actual practice, most social mobility studies useoccupational status as a measure of social position. In the theoriesand methods of studying class which have been advanced, few havebeen conducive to the investigation of social mobility, and there arecertain advantages in the use of occupations in mobility studies, Ac-cording to Reissman, vocation has a social reality; it is a real cate-gory of social classification. Non-professionals as well as social scien-
tists recognize mode of employment as an index of social position.Type of work is an indicator of other class chrtrdaeristies, especiallyincome and education, which in turn also reflect upon other classcharacteristics such as life styles and attitude patterns. Occupationoccupies an important place in stratification theories which havebeen constructed by social scientists.
8, Theodore Cap low, The Sociology of Work (Minneapolis, 1054), pp.30-37. Cap low listed three consecutive items on an occupational scale as "Huck-sters, hunters, and hypnotists."
0. Leonard Reisman_ ,n Class in American Society (Free Press, Glencoe,Illinois, 1969), pp. 160-164,

ASPIRATIONS OP 10011 SCHOOL, SENIORS) PM1T I 13
In methodology, using types of employment as class indicators
has advantages. Occupations are objective and can be ascertained
with directness and without difficulty. Vocation can be used within
limits on comparisons through time and from place to place. Com-
parisons in life pursuits can be made between fathers and sons and
between persons in different countries. Studies can be undertaken at
the community level and at the national level and have meaning.10
In an effort to discover the relationship between nineteen indi-
cators and indices of social status, Kahl and Davis by statistical
means calculated the intercorrelation among nineteen different strat-
ification measures. Relatively high positive correlations were found,
and after continued statistical analysis, they concluded that two
common factors accounted for most of the variance of the original
indices: the ,iirst was occupation and the second consisted of ecolo-
gical measures.11Mayer stated that the use of occupational mobility as a measure
of social mobility appeared to be justified since occupational status
is closely related to amount and source of income, to education, and
to prestige and authority; and occupational information is more pre-
cise and more available than other relevant data.12The occupations of the fathers of the 1950 seniors were classi-
fled in categories as given in Table 4. In the professional classifica-
tion were a doctor and a minister. One office manager was in the
proprietor and manager category while the others fathers owned
and operated businesses. In the clerical and sales classification were
clerks (bookkeeper, parts man), sales persons (bulk gas, beer,
tractor, hatchery, store, insurance), mail clerks, mail carriers, and
conductors.In the craftsmen category were railway engineers and firemen,
brakemen, a welder, mechanics, electricians, a carpenter, and a
radio-television repairman. There was one foreman.
10. Rciuman, op. cit., pp. 188-160. Rciuman summarized his view by
fitatings "In short, the defense of occupational measures of class is almostunanimous and most formidable and impressive." p. 158.
11. Joseph A. Kahl and jamas A. Davis, "A Comparison of Indexes ofSocio-Economio Status," American Sociological Review, 20 (June, 1955) pp.
317-325; also see John liner, "Predictive Utility of Five Indices of Social Strafill-
cation," Amerkan Sociological &Nieto, 22 (October, 1957),pp. 541-540.12, Kurt B. Mayer, Class and Society, (New York, 1955), p. 69.

14 NORTHWaT M5OU1U STATE COLLEGE STUMM
TABLE 4
CLASSIFICATION OF OCCUPATIONS OF THEFATHERS OF 1956 SENIORS
Maga unitror ofPanora Interview@ci
Professional 2 2Proprietors and managers 6 6Clerical and sales 16 15Craftsmen and foremen 21 20Farmers 33 33Operatives and semi-skilled 10 10Labor and farm labor 6 6
Farmers included farm owners and farm renters. In the opera-tives and semi-skilled category were electric linemen, truck drivers,and factory workers. Labor and farm labor comprised section hand,rock quarry worker (retired), and dairy and milk plant workers. Thewidow of the deceased farmer resided on the farm but worked as aclerk in a store. The woman whose husband lived in another stateand was classified as sales and clerical worked as an operative in afood processing plant.
In a few instances there was difficulty in assigning persons to oc-cupational categories. Those persons who had been engaged infarming and then had taken other work were difficult to classify.Also some persons farmed and were employed at other Jobs.
Several illustrations of problems in placing persons in occupa-tional categories will be given. Mr. A. began work as a farm laborerin the 1920's. In 1941 when the war began, he went to Kansas City towork during the war years. In 1947 he purchased a farm on whichhe worked until 1953. In 1954 he moved to Trenton and operated asmall service station. At the time of the study he stated that be hadcome to town to put his children through high school, that he pre-ferred to farm and would return to his 120 acre farm when his chil-dren finished school. He was classified as a farmer.
Mr. B. worked as a farmereither owned or rented a farm from1932 to 1952. In 1952 he became manager of a service station. Hestated that he "might end up on the farm again." He apparently pre-ferred to live on a farm but perhaps because of economic condi-

ASPIRWON5 OF MOH 5M0014 5MOB5, PART 1 15
tions had been forced off the farm. He was classified as a farmer.
Mr. C. farmed from 1935 to 1950. In 1950 he became a salesman,
liked his work, and did not plan to return to the farm, He was
classified as white collar.Mr. D., who was reared on a farm, drove a tractor for the high-
way department for about seven years, and worked for a feed com-
pany for ten years. In 1946 he rented a farm and continued farming
until about 1955. For several years he had worked in a salesbarn
and lumber-yard in addition to farming. At the time of the study, he
was not farming but was working In the barn and lumber-yard. He
was classified in the semiskilled category.Mr. E. began work as a laborer for the Rock Island Railroad
and then moved up to "machinist" in the roundhouse. When the
roundhouse was eliminated, he refueled and serviced diesel engines.
Ho was classified In the skilled category.Because of the small numbers in some classifications, It was de-
ckled to combine the occupational categories In making the analysis
of data. Tho combined classification of occupations as used in the
study Is listed in Table 5.
TABLE 5
CLASSIFICATION AND PERCENTAGE OF FATHERS
(1956) IN EACH OCCUPATIONAL CATEGORY
aftWitglith tb.Marlow%
White Collar 23 25
ProfessionalProprietors and managersClerical and sales
Craftsmen and foremen (Skilled) 20 21.7
Farmers 33 35,8
Semi-skilled 16 17.4
OperativesLaborFarm labor
The percentages in the occupational categories in Table 5 differ
from the percentages in the national occupational classes. Particular-

10 NORTHWEST MISSOURI STATE COLLEGE STUDIES
ly to be noticed is the higher proportion of farmers than is found in
the general population. With larger samples, it would have been
possible to divide the white collar, craftsmen, and farmers into Bev-
eral subcategories.In order to have a larger sample, the Trenton seniors of 1960
were included in the study. The seniors of 1956 and 1960 were
classified into categories on the basis of their fathers' occupations.
Table 6 presents the number and percentage of seniors in 0h clas-sification by year and by both years combined, It was previously ex-
plained that the 1956 seniors were interviewed while the 1960 sen-
krs filled out the schedule in a class meeting. Some 1060 seniors
wore absent from school on the day the questionnaire Was admin-
istered, and a few completed forms were not usable; the responses
for only eighty-one subjects were available for analysis.
TABLE 6
CLASSIFICATION OF 1956 AND 1960 SENIORSBY OCCUPATION OF FATHER
8icii.grgnr
White color 24 25 22 27 46 26
Girls 13 15 28
Boys 11 7 18
Skilled 22 22 26 32 48 27
Girls 12 15 27
Boys 10 11 21
Farmers 35 36 21 26 56 31
Girls 15 9 24
Boys 20 12 32
17 17 12 15 29 16
Girls 10 5 15
Boys 7 7 14
1956Girls 50Boys 48
0111/11.111110111111.
98
1960Girls 44Boys 37
81
TotalGirls 94Boys 85
179

ASPIRATIONS OP HIGH SCII0014 8BNIORSI PART 1 17
The proportions at the white collar and semi-skilled levels forboth years were about the same. The 1960 class had a larger per-centage at the skilled level, and the 1956 class had a larger propor-tion at the farmer level. Overall, a little more than one-fourth of thestudents were in the white collar category and about the same in theskilled classification, Almost one-third of the students were farmyouth, while about one-sixth were in the semkkilled classification.
It is of interest to note the occupational level of the student?fathers' fathersin others words, the seniors' grandfathers. Table 7presents the occupational classification of the students' grandfathers.The differences in vocation between the seniors' fathers and grand-fathers are significant at the 1 per cent level. The seniors' fathersoriginated in homes by socio-economic level not by chance but inrelation to the type of work followed by the grandfathers.
As might be expected, the largest percentage of seniors' grand-fathers in each occupational category originated in farm homes. Itcan be pointed out, however, that nearly one-third of the fathers inthe white collar classification had fathers who were white collarworkers. Almost none of the fathers in other categories came fromwhite collar homes. None of the fathers classified as white collarhad fathers engaged in semi-skilled or laboring work, 28 per centcame from homes of skilled workers.
TABLE 7
PERCENTAGE DISTRIBUTION OF OCCUPATIONSOF 1956 SENIORS' GRANDFATHERS
O ocupatIon ofSenior's fathom
WhHoOrcupatIonsof onion' grandfatho
collar BUM Farmer skiltod
White collar 29 28 43 0
Skilled 0 39 51 10
Farmer 0 13 82 4Semi-skilled 3 6 84 6
df - 6; X2 - 59.599 and is significant at the 1 per cent level.Combined skilled and semi-skilled categories for computation.
A considerable number of the seniors' mothers regularly workedoutside the home. Table 8 presents the proportions of 1956 seniors'

18 NORTHWEST MIS OURI STATE COLLEGE STUDIES
mothers who regularly worked outskie the home. The largest per-centage of the working women were wives of men in the semi-skilled category. Next in order were the wives of men in white collarwork, farmers, and skilled workers. The overall differences are sta-tistically significant at the 1 per cent level.
TABLE 8
PERCENTAGE DISTRIBUTION OF 1956 SENIORS'MOTHERS REGULARLY WORKING OUTSIDE THE HOME
liZEMECIIIMOMCMCIffMCC4.
Occupationof Iluebanci
12.1111=6.1111..11
Number
White collar 38 24Skilled 14 21
Farmers 20 35Semi-skilled 62 16
df - 3; X2 - 12.774 and is significant at the 1 per cent level.
Most working wives in the white collar classification were em-ployed in clerical or sales work. Other occupations included teacher,waitress, beautician, and operative in a food processing plant. In ad-dition three other wives worked part timetwo gave music lessonsat home and one clerked in a retail store when needed on special oc-casions. If these three were added to the number working, the per-centage would be fifty. One wife was separated from her husbandand probably worked because of necessity.
Three wives of skilled workers were regularly employed; theyworked as a waitress, hotel clerk, and clerk in a retail store. In addi-tion two wives worked in retail stores when needed on special occa-sions. If dime latter two were added to the working wives, the per-centage working would be twenty-three. One woman in this groupwas divorced.
Seven wives of farmers were regularly employed outside thehome. The fobs these women held were: waitress, tax collector andschool bus driver, teacher, and saleswork.
Ten wives of men in the semi-skilled classification were work-ing regularly. Two were clerks in retail stores; three worked as op-eratives in a food processing plant; one was a registered nurse; and
ASPInaioNs OF nrci M sErliORS) PART I 19
one acted as a practical nurse in a rest home for the aged. One wife
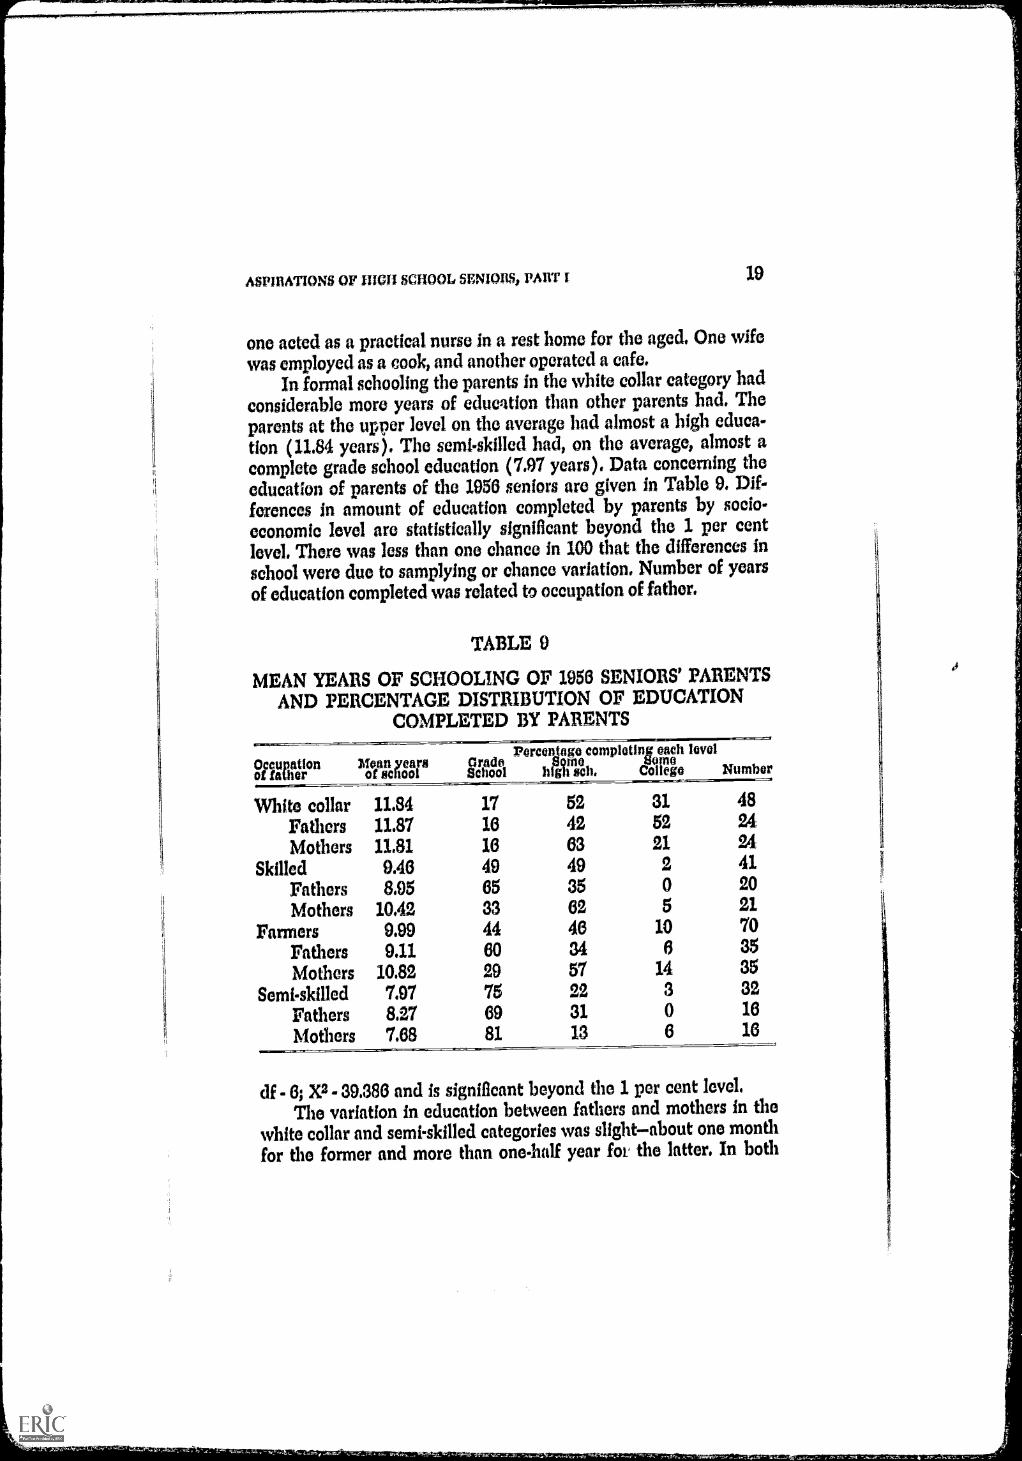
was employed as a cook, and another operated a cafe.In formal schooling the parents in the white collar category had
considerable more years of education than other parents had. Theparents at the upper level on the average had almost a high educa-tion (11.84 years). The semi-skilled had, on the average, almost acomplete grade school education (7.97 years). Data concerning theeducation of parents of the 1956 seniors are given in Table 9. Dif-ferences in amount of education completed by parents by socio-economic level are statistically significant beyond the 1 per centlevel. There was less than one chance in 100 that the differences inschool were due to samplying or chance variation. Number of yearsof education completed was related to occupation of father.
TABLE 9
MEAN YEARS OF SCHOOLING OF 1956 SENIORS' PARENTSAND PERCENTAGE DISTRIBUTION OF EDUCATION
COMPLETED BY PARENTS
Percentage complain" each level
tglitolegiton Moofalf Cr &TA hlilinech. ollogo Numberomo
White collar 11.84 17 52 31 48
Fathers 11.87 16 42 52 24
Mothers 11.81 16 63 21 24
Skilled 9.46 49 49 2 41
Fathers 8.95 65 35 0 20
Mothers 10.42 33 62 5 21
Farmers 9.99 44 46 10 70
Fathers 9.11 60 34 6 35
Mothers 10.82 29 57 14 35
Semi-skilled 7.97 76 22 3 32
Fathers 8.27 69 31 0 16
Mothers 7.68 81 13 6 167=1.
df - 6; X2 - 39.386 and is significant beyond the 1 per cent level.The variation in education between fathers and mothers in the
white collar and semi-skilled categories was slightabout one monthfor the former and more than one-half year for the latter. In both
20 NORTHWEST MISSOURI STATE COLLEGE STUDIES
instances the fathers averaged more education. In contrast, the
mothers, among skilled workers and farmers, had more schooling
than the fathers, and the differences were greaternearly' one and a
half years more for the wives of skilled workers and nearly one and
three-fourths year in favor of the farm wives.In analyzing education of parents from the standpoint of per-
centage having grade school, some high school, and some college,
the differences in amount of higher education are brought out more
strikingly. The proportion of parents who received some college edu-
cation was greater in the white collar category followed by the
farmers, skilled and unskilled. Over half of the fathers and one-fifth
of the mothers in the white collar classification had some college edu-
cation. In all other categories, the mothers had more years of college
training. Fourteen per cent of the farm women bad been to college,
or its equivalent, as compared with 6 per cent of the farm fathers.
Only one mother among the skilled and one among the unskilled
had college training or its equivalent, while no father in these two
categories went beyond high school.The greater amount of education among the mothers in the
skilled category is shown by the fact that the mothers' education
exceeded the fathers' in eleven instances while the fathers' education
exceeded the mothers' in only two instances. The farm mothers had
more education than their husbands in twenty-two out of thirty-five
cases, while the fathers lutd more education in only four cases.The setting for the study was a small city typical of many in the
rural midwest where a declining population forced many young
people to face a serious problem of finding employment.The subjects of the investigation were homogeneous in race and
nationality and consisted of high school seniors and their parents.
The seniors of 1956 along with their parents were interviewed, and
the seniors of 1960 filled out a questionnaire. The fathers of the stu-
dents were stratified into broad occupational categories which were
the basis for analyzing aspirations and attitudes of the subjects.
ATTITUDES OF PARENTS: EDUCATION
Numerous scientific investigations as well as popular writings
have attested to the influence of parents and homo on adolescents.
Sociologists have pointed to the family as the most important pri-

ASPIRATIONS OF HIGH SCHOOL SENIORS, PART I 21
mary group in the socialization of children. Much stress has beenplaced on the influence of the family in child rearing.
If parents do influence their children, the attitude and values of
parents toward education should have a bearing on the views of the
children toward school and on their progress through school. It wasdeemed important to investigate the outlook of the parents toward
education and to find out the hopes and plans of the adults for the
education of their children.Data were collected to test the following hypotheses or propo-
sitions concerning the parents:
I. Parents at higher socioeconomic levels will take a greaterinterest in the school progress of their children than par-ents on lower levels.
2. Parents in higher social categories will be more positive inencouraging their childrcn to attend college than parentsin lower social categories.
An indication of the interest of parents in school and in the edu-
cational progress of their children may be membership in Parents
and Teachers Msociation and attendance at meetings. The parentshave an opportunity to meet with the high school teachers and dis-
cuss school problems. Opportunities are also afforded to meet in-formally with the teacher and to discuss the education of their
children.It is a common observation that membership in Parents and
Teachers Association declines as the children reach the senior high
school. Membership by those parents who do remain may be a more
crucial test of parents' interest in the progress of their children. It
may be pointed out that dues in the Parents and Teachers Associa-
tion were lowfifty cents or less per person for a year, and hence
were no obstacle to membership.A question asked the parents of the 1950 seniors13 was, "Are you
a member of the school Parents and Teachers Association?" The re-
sponses are given in Table 10. Differences in membership in Parents
and Teachers Association, by occupational class, are statistically sig-
nificant beyond the 1 per cent level, A very high significance is rep-
resented by the value of chi squtite obtained. There is very little
likelihood that the differences in membership are due to chance
variation.
13. Data on attitudes of parents concern only the 1950 seniors and tbekparents.
if

22 NORTHWEST MISSOURI STATE COLLEGE STUDIES
TABLE 10
PERCENTAGE DISTRIBUTION OF PARENTS OF 1956
SENIORS WHO WERE MEMBERS OF
PARENTS-TEACHERS ASSOCIATION
ecupatkm ofMune fathers Number
White collarSkilledFarmersSemi-skilled
643916
4741es32
df - 3; X2 - 46.814 and is significant beyond the 1 per cent level.
Membership in the parents organization is related to socio-
economic position. Nearly two-thirds of the white collar parents and
more than one-third of the parents in the skilled category were mem-
bers of the high school Parents and Teachers Association. Few
farmers indicated that they joined the organization, and no parents
at the semi-skilled level signified that they were members.
In order to learn of participation by parents, they were asked,
"Did you attend any P.T.A. meetings last year?" Since many par-
ents were contacted in the fall of the year, it was decided to inquire
about the attendance at meetings for the previous yearthe stu-dents' junior year In high school. The responses are given in Table
11. Attendance at Parents and Teachers Association meetings, by
occupational class, is statistically significant beyond the 1 per cent
level. The value of chi square in Table 11 is not quite so high as that
in Table 10 but is very significant.Attendance by parents at the faculty and school patrons organ!.
Itation is related to social status. The parents In the white collar
chtegory at inded meetings in greater proportions than did other
parents, followed by the parents in the skilled and farmer categories.
A comparison of Tables 10 and 11 reveals that a proportion of
the parents in the white collar and skilled categories joined the Par-
ents and Teachers Association but did not attend. These parents
might send their membership dues by their children or pay it to the
officers. If the farmers belonged to the parents' organization, they
were likely to attend some meetings. The mothers and fathers in the
ASPIRATIONS OF 111011 SCHOOL SENIORS, PMIT I 23
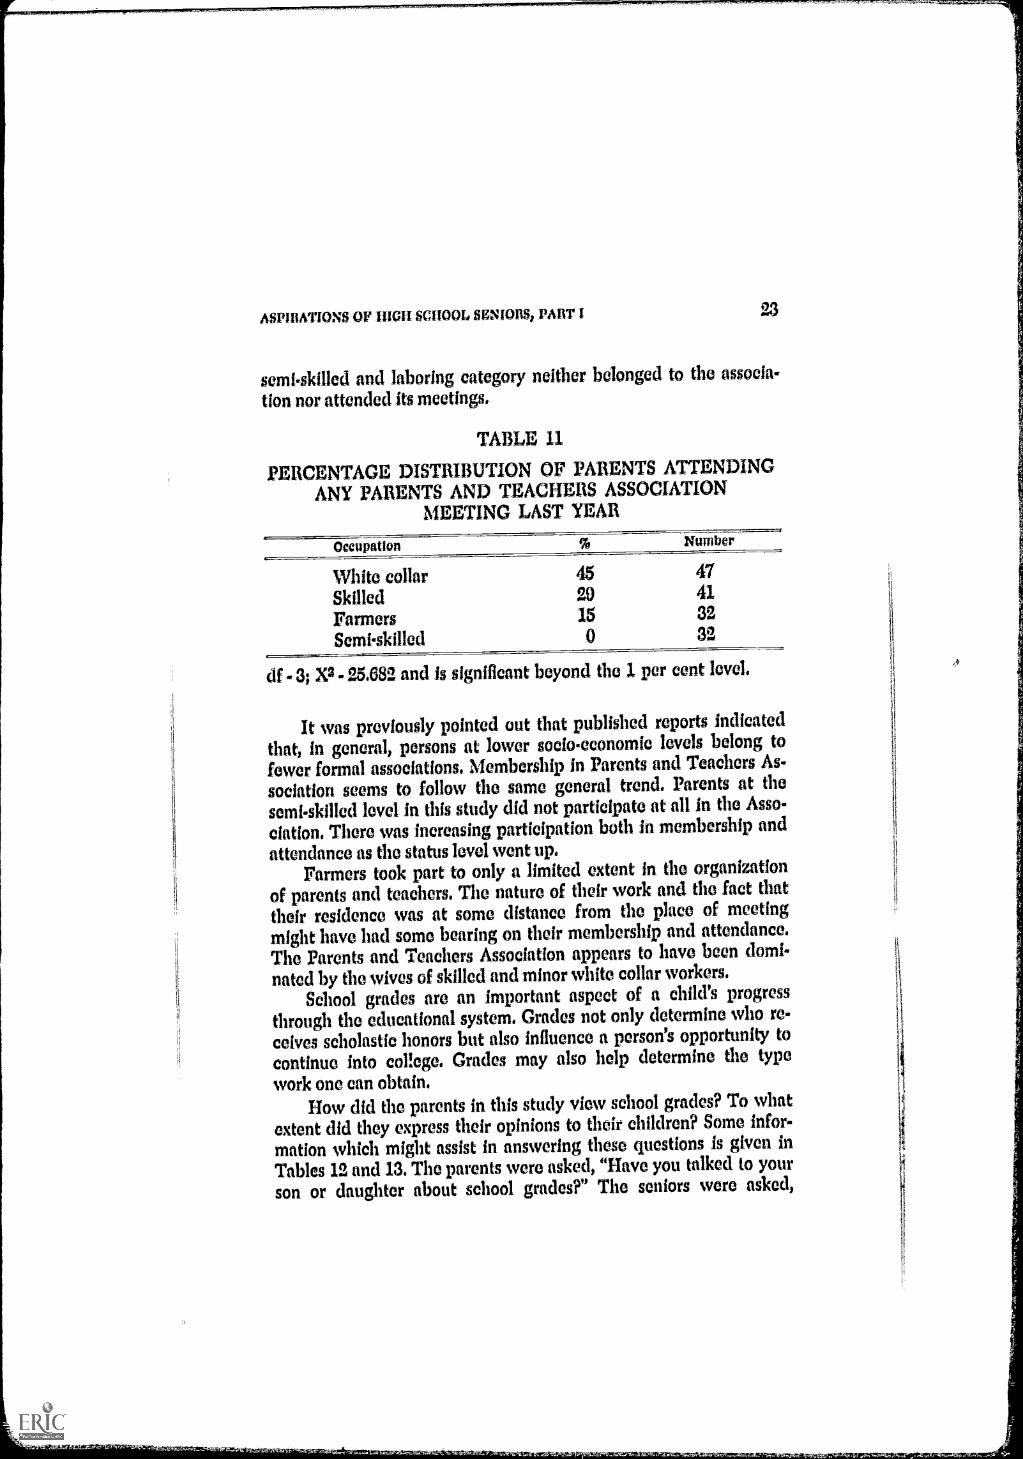
semi-skilled and laboring category neither belonged to the associa-tion nor attended its meetings.
TABLE 11
PERCENTAGE DISTRIBUTION OF PARENTS ATTENDINGANY PARENTS AND TEACHERS ASSOCIATION
MEETING LAST YEAR
OccuputIon Number
White collar 45 47
Skilled 20 41
Farmers 15 32
Semi-skilled 0 32
df - 3; X2 - 25.682 and is significant beyond the 1 per cent level.
It was previously pointed out that published reports indicatedthat, in general, persons at lower socio-economic levels belong tofewer formal associations. Membership in Parents and Teachers As-sociation seems to follow the same general trend. Parents at thesemi-skilled level in this study did not participate at all in the Asso-ciation. There was increasing participation both in membership andattendance as the status level went up.
Farmers took part to only a limited extent in the organizationof parents and teachers. The nature of their work and the fact thattheir residence was at some distance from the place of meetingmight have had some bearing on their membership and attendance.The Parents and Teachers Association appears to have been domi-nated by the wives of skilled and minor white collar workers.
School grades are an important aspect of a child's progressthrough the educational system. Grades not only determine who re-ceives scholastic honors but also influence a person's opportunity tocontinue into college. Grades may also help determine the typework one can obtain.
How did the parents in this study view school grades? To what
extent did they express their opinions to their children? Some infor-
mation which might assist in answering these questions is given inTables 12 and 13. The parents were asked, "Have you talked to your
son or daughter about school grades?" The seniors were asked,
24 NORTi MST tissourn FMB COLLECH RUPIES
'Have your father and mother discussed school grades with you?"
Computation of chi square revealed that discussion of school grades
by occupational category was not statistically significant at the 5 per
cent level in either Table 12 or Table 13,14 Differences could be ac-
counted for by chance variation in twenty times in a hundred in
Table 12 and about seventy times out of a hundred in Table 13.
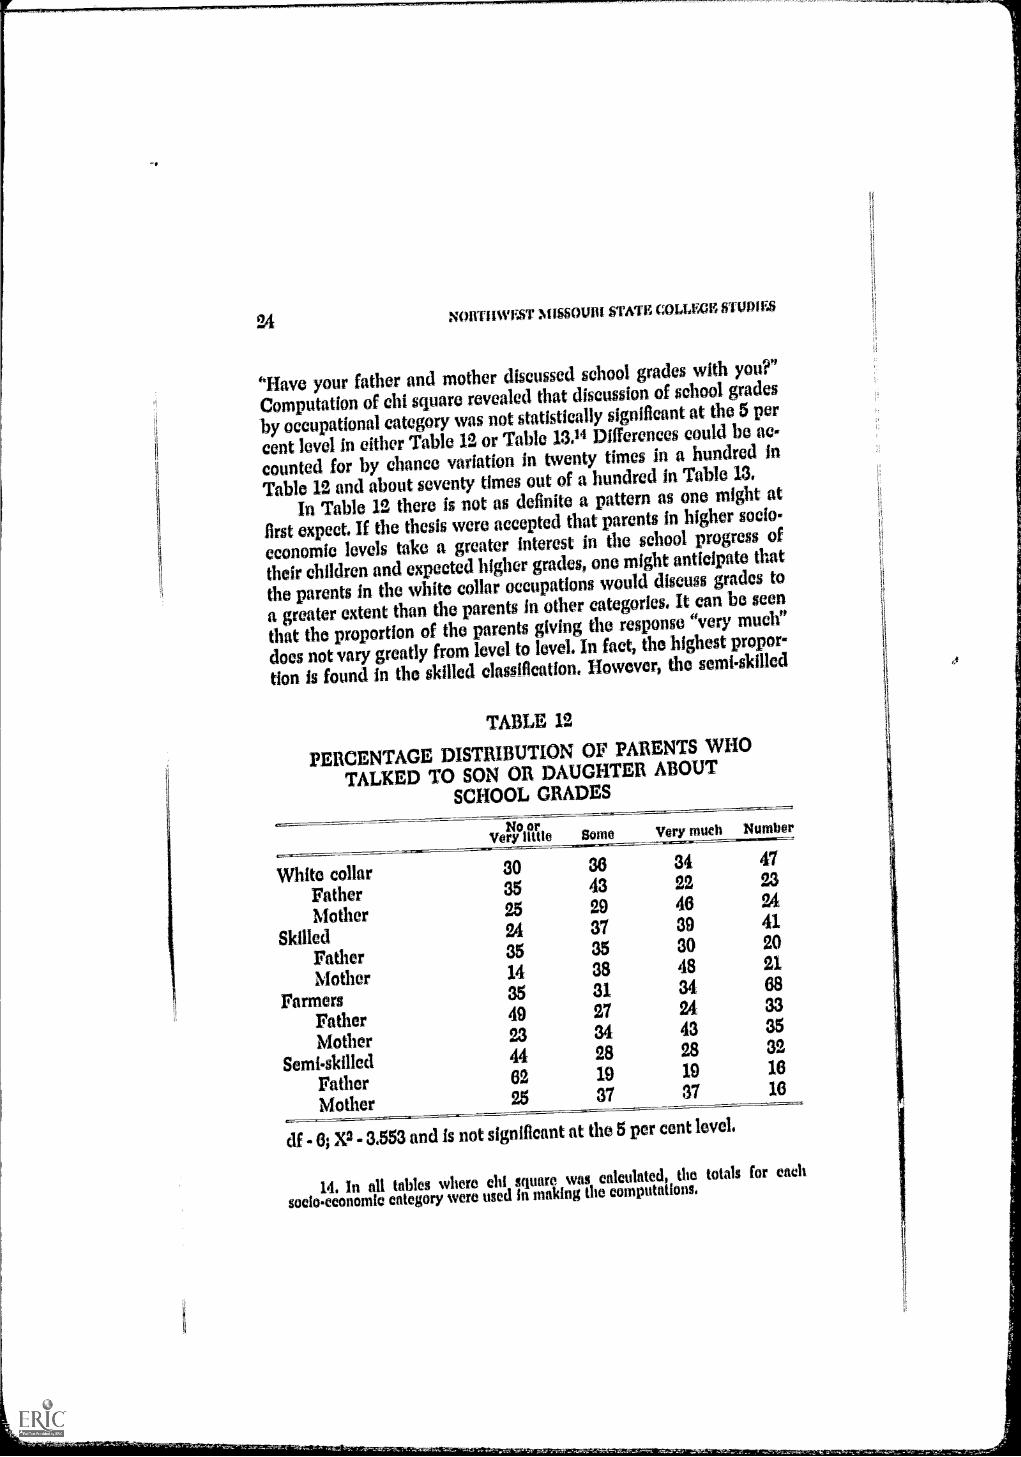
In Table 12 there is not as definite a pattern as one might at
first expect. If the thesis were accepted that parents in higher socio-
economic levels take a greater interest in the school progress of
their children and expected higher grades, one might anticipate that
the parents in the white collar occupations would discuss grades to
a greater extent than the parents In other categories. It can be seen
that the proportion of the parents giving the response "very much"
does not vary greatly from level to level. In fact, the highest propor-
tion is found in the skilled classification, However, the semi-skilled
TABLE 12
PERCENTAGE DISTRIBUTION OF PARENTS WHO
TALKED TO SON OR DAUGHTER ABOUT
SCHOOL GRADES
No orVery nitle some ry muc Number
White collar 30 36 34 47
Father 35 43 22 23
Mother 25 29 46 94
Skilled 24 37 39 41
Father 35 35 30 20
Mother 14 38 48 21
Farmers 35 31 34 68
Father 49 27 24 33
Mother 23 34 43 35
Semi-skilled 44 28 28 32
Father 62 19 19 16
Mother 25 37 37 16
df 6; X2 - 3.553 and is not significant at the 5 per cent level,
14. In all tables where chi square was calculated, the totals for each
socio-economic category were used in maldng the computations.

ASPIRATIONS OP HIGH SCHOOL, SENIORS, PART 1 25
category had the largest proportion stating "no" or "very little" andthe smallest proportion giving the response "very much."
TABLE 13
PERCENTAGE DISTRIBUTION OF SENIORS WHOREPORTED PARENTS TALKED TO THEM
ABOUT SCHOOL GRADES
tureen Vory littho?vr rothor Motor MhBomoo!, Mother
Very MtWhtither Motor
White collar 54 29 42 29 38 33 17 33 25Girls 61 15 31 38 8 46Boys 30 0 30 40 40 60
Skilled 45 9 27 27 50 39 27 41 34Girls 58 17 25 58 17 25Boys 30 30 40 40 60
Farmers 47 28 38 35 37 36 17 34 26Girls 64 40 14 40 22 20Boys 35 20 50 35 15 45
Semi-skilled 41 24 32 59 53 56 0 24 12Girls 60 30 40 40 0 30Boys 14 14 86 71 14
df.- 6; X - 8,361 and is not significant at the 5 per cent level.
As will be shown later, the students at the upper levelsgenerally received higher grades so it may not be so necessaryfor the parents to 'leap after" their children about grades. For ex-ample, two parents in the white collar category responded "verylittle." The father remarked that ho "had top compliments for hisdaughter." The mother said, "We would rather have her have somefun; we think she has done good work." The girl, in fact, was amember of the National Honor Society. She confirmed that the par-ents talked to her "v Ty little" about grades, but stated, "They makeme practice my music." She added that it was her brother that theparents "got after" about grades.
At tho skilled level the parents probably realized the signifi-cance of grades and tried to impress their children, a number ofwhom were not especially concerned about studying, with the im-
26 NORTMVEST MISSOURI Min GM= SWIMS
porta= of making good grades. The boys, particularly, were not in-clined to be studious and the higher percentage of parents respond-ing "very much" probably reflects the desire of these parents tokeep the boy's grades up to average. A father of a boy who was notknown for good grades stated, "I raise hell with him every once in awhile about his grades."
The nearly 50 percent of the farm fathers responding "verylittle" probably reflected their lower interest in school and the atti-tude of not interfering too much with their children's lives. A fewmothers and fathers giving this response were satisfied with thesuperior grades which their children were making.
At the semi-skilled and labor level, the high proportion cr: thefathers responding "no" or "very little" probably reflected thelack of knowledge, greater permissiveness, and lower expectations.One father who responded that he did not say anything aboutgrades remarked, "I was not a valedictorian myself." Another fathersaid, "No, that is their business. I hardly ever look at the grade card.I know no more than a pig about the grades today."
The two tables generally tend to confirm each other at theskilled and farmer levels with greater difference in the responsesbetween parents and students in the white collar and semi-skilledcategories. The students indicated somewhat less pressure than theparents suggested in that the proportion of students responding"ne or "very little" was greater at every level except the skilled, andthe proportions responding "very much" were lower by the seniorsat every level. In the proportions responding "very much," the samepattern as that of the parents was followed: the highest proportionwas by the skilled, followed by the farmer and white collar withabout the same figure, and then the semi-skilled category.
The large proportion of senior boys at the semi-skilled levelwho reported that their parents talked to them "some" about schoolgrades was probably duo to the fact that these boys generally re-ceived low grades and they were conscious of their parents' desiresfor them to obtain the minimum for passing. Some parents in thiscategory were apparently not so much concerned that their childrenreceive high marks as they were simply to have the children finishhigh school.
Sons and daughters of white collar workers reported the leastpressure with 42 per cent giving the answer That their parents dis-cussed school grades with them "none" or "very little." These figures

ASPRIKTIONS OF Mott HMO 1.4 SENIORS, PART I 27
A
might be accounted for in that these students at the upper levels
generally received higher grades and were probably closer to their
parents' expectations so that there was less conflict over the school
reports. The parents might be stressing and wanting high grades,
but the students did not feel the pressure because they were fairly
well meeting the parents' expectations.The greater Interest by the mothers in school progress was gen-
erally shown at every status level in Tables 12 and 13 except that
a greater proportion of sons in the white collar classification in
Table 13 reported "very much" for their fathers than for their
mothers.Additional information is available in that the students were in-
terrogated as to who discussed grades more, the father or the
mother. The responses are given in Table 14. Differences by socio-
economic level were not significant at the 5 per cent level. In fact,
chance variation would explain the differences about 70 per cent of
the time. At every level it was indicated that the mother discussed
school grades more. There were other scx differences between the
TABLE 14
PERCENTAGE DISTRIBUTION OF STUDENTS' ASSESS-
MENT OF PARENTS' DISCUSSION OF SCHOOL GRADES
OvunstIonor Miler
About themo
rethermore
Mothermore
Did notask
Number
White collar 42 12 38 8 24
Girls 23 0 62 15 13
Boys 64 27 9 0 11
Skilled 32 14 54 0 22
Girls 25 17 58 0 12
Boys 40 10 50 0 10
Farmers 42 6 46 6 35
Girls 33 13 40 13 15
Boys 50 0 50 0 20
Semi-skilled 41 0 41 17 17
Girls 20 0 50 30 10
Boys 71 29 0 7
di 6; X2- 3.99 and was not significant at the 5 per cent level. In
computing chi square omitted category "Did not ask."

28 NORTHWEST MISSOURI STATE COLLEGE STUDIES
responses of the boys and girls. In every category the girls statedthat their mothers discussed scholastic matters with them more thandid their fathers. Very few girls indicated that their fathers talked tothem more about school marks. They did report one-fifth to one-third of their fathers talked "about the same" as the mothers.
Very few boys reported that their fathers talked to them morethan did the mothers about grades. The boys, however, in largerproportions than the girls reported parents who talked "about thesanio." Only in the white collar classification was there a larger per-centrze of fathers as opposed to mothers who discussed schoolmarks to a great extent. In no instance at the semi-skilled level wasthe father mentioned as talking about grades more than did themother.
Did the parents do more than urge their children to make highgrades? Were monetary inducements offered to the young personsfor scholastic achievements? Table 15 indicates that relatively fevparents rewarded their children in a material way N. making good
grades in high school. In all categories except skilled the proportionawarding materiel rewards was less then one-tenth; the portion inthe skilled classification was 23 per cent. Computation of chi squarerevealed that differences by status category were not significant atthe 5 per cent level with regard to rewards in high school but weresignificant at the 1 per cent level in past years in elementary or Junior
high school.Money was the usual inducement given for scholastic achieve-
ment. However, one girl was given a diamond ring by an aunt, and
several boys reported that they could have the use of a car. A num-ber of students reported that they were complimented or given "a
pat on the back"; however, compliments were not counted in thefigures. More parents gave material gifts for good grades in the pastin elementary and possibly junior high school. The parents in theskilled category still tended more to give rewards than the white
collar or the semi-skilled. Very few farm parents, only 6 per cent,were reported as giving some award for grades in a previous period.
The seniors whose fathers were in the skilled category reported
more often than those whose parents were in other classifications
that they wore given material rewards for high was at that timeand in the past. Evidently these parents realized the importance ofmaking high marks end wanted to encourage their children to obtain
better grades.

ASPII1ANIONS OF MOH SCHOOL, UNIONS, PART I 29
TABLE 15
RCENTAGE DISTRIBUTION OF STUDENTS REPORTINGMATERIAL REWARDS FOR SCHOOL GRADES
fttonttlenor father Recently
in thepast Number
White collar 8 33 24
Skilled 23 41 22
Farmers 6 6 35
Semi-skilled 6 24 17
(Recently) df - 3; X2 - 4.97 and is not significant at the 5 per centlevel.
(In past) di - 3; X2 - 1137 and is significant at the 1 per cent level.
The girls at the skilled level tended to be more specific as to theinducements given in the past. Instead of reporting money as most
did who received rewards, they stated "If in top ten, $20," "50 centsfor every 8," and "$1 or something for every grade raised."
Children may be encouraged to earn high marks in school andthey may be criticized or punished for receiving low grades. It canbe seen from Table 16 that the mothers criticized the adolescentsabout grades more than did the fathers in every category except inthe semi-skilled classification. The boys at this level mentioned repri-mands by mothers and fathers in equal proportions. Boys reportedmore criticism than did girls at every level except by the mothers inthe semi-skilled category. Apparently the boys who generally madelower grades than did the girls were urged to make higher ratings.
The percentage of seniors mentioning criticisms by their par-ents was about the same at each level except in the skilled category,which exceeded the others by some 20 per cent. Both boys and girls
in the skilled classification reported reprimands in more instancesthan did students in nny other category. Computation of chi squarerevealed that the differences by status category were significant at
the 5 per cent level.

30 NORTH%
PER
EST MISSOURI STATE COLLEGE trI1JDIES
TABLE 16
ENTAGE DISTRIBUTION OF STUDENTSEPORTING CRITICISM AT HOME FOR NOT
MAKING GOOD GRADES
tt?nuotionpother nther Mother
NuernthermbMahe
White collar 38 46 42 24 24 48
Girls 31 38 13 13
Boys 45 55 11 11
Skilled 59 73 66 22 22 44
Girls 42 67 12 12
Boys 80 80 10 10
Farmers 38 49 44 35 34 69
Girls 14 20 15 14
Boys 55 70 20 20
Semi-skilled 35 47 41 17 17 34
Girls 30 50 10 10
Boys 43 43 7 7
df - 3; X2- 7.8 and is significant at the 5 per cent level.
Table 17 indicates that from one-fifth to one-fourth of the
seniors reported punishment at home for "bad" grades. Boys stated
in slightly larger proportions than girls in every category except in
the white collar classification that there was punishment by parents.Boys usually receive lower marks than girls so are likely pressed to
make better ones. There was only a small difference in percentagepoints between occupational levels except for the skilled categorywhich had the highest percentage reporting punishment. Differences
by status classification were not significant at the 5 per cent level.
Differences could be accounted for ninety-ilve times out of a hun-
dred by chance variation.Most punishment consisted of remaining in at night. Some sem.
iors were directed to bring their books home to study. Several ado-
lescents in the skilled classification were "threatened" with beingforced to stay in at night unless the grades were raised.

ASPIRATIONS OP HIGH SCHOOL SENIORS, PATIT 1 31
TABLE 17
PERCENTAGE DISTRIBUTION OF STUDENTS REPORTINGPUNISHMENT AT HOME FOR NOT MAKING GOOD
GRADES OR FOR MAKING LOW GRADES
OccilpstIonof rather Number
White collar 21Girls 23 13Boys 18 11
Skilled 27 22
Girls 25 12Boys 30 10
Farmers 20 35Girls 13 15
Boys 25 20Semi-skilled 24 17
Girls 20 10
Boys 29 7
df 3; X2 - .46 and is not significant at the 5 per cent level.
The encouragement to do well in school and the Insistence thatstudents maintain high marks evidences Interest by parents in theeducational progress of their children. High scholastic standing maybe required for admittance to college. To what extent was collegeattendance a part of the plans and hopes of these parents for theirchildren? Table 18 indicates the parents' beliefs concerning theirchildren's future after graduating from high school. Differences byoccupational category were significant beyond the 1 per cent level.There was very little likelihood that the differences could be ex-plained by chance variation. As the socio-economic level went upparents stated that they thought their children should attend college.While about three-fourths of the fathers and mothers at the whitecAlar level recommended additional schooling, only a little morethan one-fifth in the semi-skilled category recommended college fortheir children.
As the occupational level went down, an increasing proportion ofthe parents gave the response, "What he wants, is up to him." One-

to
TA
BL
E 1
8
PER
CE
NT
AG
E D
IST
RIB
UT
ION
OF
WH
AT
PA
RE
NT
S T
HliN
K T
HE
IR C
HIL
DR
EN
SHO
UL
D D
O A
FTE
R G
RA
DU
AT
ING
FR
OM
HIG
H S
CH
OO
L
Occ
u pa
ti o
nFt
-Pht
ero
call:
ger
Whi
te c
olla
r70
Gir
ls67
Boy
s73
Skill
ed40
Gir
ls27
Eny
s56
Farm
..is
36G
irls
Boy
s42
Sem
i-sk
illed
19G
irls
20B
oys
17
'Wha
t he
wan
tsFa
ther
Mot
her
Don
't Im
owot
her
resp
onse
sFa
ther
Mot
her
Go
to V
ork
Fath
er M
othe
rN
umbe
rFa
ther
Mot
her
74M
1719
84
60
023
2425
150
00
012
1318
1817
90
011
1151
3014
oo25
19cm
55
520
2136
817
169
811
1299
9999
990
09
947
5237
4312
810
00
3335
5740
147
00
1415
4730
1010
00
1920
2275
M53
618
120
2512
1616
7010
1020
040
1010
8367
017
00
66
df -
6; X
2-29
.43
and
is s
igni
fica
nt b
eyon
d th
e 1
per
cvnt
leve
tIn
com
putin
g ch
i squ
are
com
bine
d ca
tego
ries
, "D
on't
lalo
w"
and
'Go
to w
ork.
"
a

ASPIRAVON5 OF HIM SCHOOL, SENIORS, PART J 33
half of the semi-skilled parents had a permissive attitude with re-gard to their children attending college; less than one-fourth of thewhite collar parents had this attitude. As will be set forth later, prac-tically all white collar parents expected their children to go tocollege.
Other responses to this question were "Don't know," "Will go towork," and "Will marry." All occupational categories other thanwhite collar had a sizable proportion of parents with these responses.In other words, the white collar v.rents tended to give a more defi-nite anssver. About one-fourth of the skilled and semi-skilled cate-gories were in the other responses.
Differences in opinions by parents by sex regarding higher edu-cation for their children were evidenced at every socio-economickvel. In each category a larger proportion of mothers than fathersstated that the children should go to college. On the other hand, thefathers at each status level were more permissive than the wives inregard to what the offspring should do after graduation from highschool. Also, in general, a higher percentage of mothers wanted theirdaughters to go to college than was true of their wishes for sons.A reversal took place in the desires of the fathers. At most levelsa larger proportion of the fathers stated that the sons should attendcollege than said that the daughters should enter higher educationalinstitutions.
After receiving answers to a question inquiring whet the par-ents thought their children should do after graduation from highschool, the fathers and mothers were asked specifically about highereducation, "What do you think about your son (or daughter) goingto college?" The responses are summarized in Table 19, and compu-tation of chi square gives a value which is significant beyond the 1per cent level. An extremely high significance is represented by thevalue obtained. There is very little likelihood that the differences inresponse can be accounted for by chance variation.
Table 18 and 19 are somewhat similar. However, there is animportant difference between them. Table 18 relates to what theparents thought that the offspring shouk1 do after getting out ofhigh school. Table 19 is concerned specifically with higher educa-tion. What did the adults think of the sons and daughters going tocollege? Was college attendance encouraged? In comparing Tables18 and 19, an increased percentage of parents in the white collar and
,

34 NORTI %inn MISSOURI STATE COLLEGE STUDIES
skilled categories encouraged their children to go to college (corn-pared with what they thought the seniors should do), while therewas a smaller proportion at the other two levels who encouragedtheir offspring to enter higher education, a slight decrease by thefarmers and a larger decrease at the semi-skilled level.
Inspection of Table 19 indicates that there was an increasedproportion of parents who encouraged their children to attend col-lege as the status level rose. Fifty per cent or more at every level ex-cept semi-skilled said that they encouraged their sons and daughtersto continue their schooling. As the socio-economic position declined,there was an increase in the proportion of adults who were permis-sive toward higher education and who mentioned the problem ofsecuring finances to send the young people to college.
Only 6 per cent of the parents in the semi-skilled classificationstated that they would encourage their children to attend college.Fifty-three per cent indicated that it would be up to the sons ordaughtero what they should do after finishing high school Thirty-four per cent mentioned the financial difficulties of trying to put theirchildren through college. Some persons in this category apparentlythought that their chikiren should go to college but were not goingto encourage them because of lack of finances. Some answers by thesemi-skilled indicating permissiveness were: "Let her make up herown mind," "Would like for her to go to college but it would be herchoice," and "It's up to her." Responses indicating the financial prob-lem were: "If she could work her way through," "We are not set upto put her through," "We are not qualified to send," "As far as cansend him," and "Will not be able to rake up what it takes."
About one-third of the farm parents were permissive in theirviews on college education for their children. Typical of these re-plies were: "Leave up to her," "Would not try to force if he did notwant to go," and "Have not encouraged college, she does not want."The lack of financial resources necessary to send children to collegewas also felt by some farmers. One father said, "If a person bad themeans, it would be all right. I don't think poor kids have the choiceto go." The mother commented, "Would like for her to go but do notsee any financial way to swing it."

TA
BL
E 1
9
PER
CE
NT
AG
E D
IST
RIB
UT
ION
OF
WH
AT
PA
RE
NT
ST
HO
UG
HT
AB
OU
T T
HE
IR C
HIL
DR
EN
CO
LN
G T
O C
OL
LE
GE
Occ
upat
ion
Fat
hert
iLao
rter
Wha
t he
ants
Fat
her
Mot
her
faire
InT
alo oh
er4
Oth
erre
spon
ses
Fat
her
Mot
he.r
Num
ber
Fat
her
Mot
her
Whi
te c
olla
rG
irls
Boy
sSk
illed G
irls
Boy
sFa
rmer
sG
irls
Boy
sSe
mi-
skill
edG
irls
Boy
s
8883
92 82 7160
67 78 5450
47 636
60 17
00
I"8
1523
2447
00
016
012
13
fi,f i
0 50 0
327 20
18 2824
11 2011 21
41
r4
90
2733
1112
ioz
00
1100
99
M9
89
99
833
3568
713
2114
1415
115
05
19a)
5344
2534
013
616
1632
4030
020
1010
5017
00
66
df 9
; X2-
84.
019
and
is s
igni
fica
ntbe
yond
the
1 pe
r ce
ntle
vel.
a

36 NORTIIWIM MISSOURI MU COLLEGE STUDIES
Table 20 gives the seniors' conceptions of the view their parentshad of their going to college. Differences in responses of students byoccupational classification are statistically significant beyond the 1per cent level. Table 20 follows the same general pattern as Table19 which gives the responses of the parents. There was greater en-couragement to attend college as the socio-economic status Me.There was greater permissiveness as the socio-economic level de-clined.
The students at all levels reported slightly greater encourage-ment to attend college than parental responses in Table 19 indicated.The greatest increase was at the semi-skilled level. A greater propor-tion of mothers in all classifications except for the skilled categorywas reported to have given more stimulation to enroll in higher eduecational institutions than did the fathers.
The parents were asked a general question about education inaddition to those directed specifically at their own children: "Abouthow much schooling does a young person need these days to got
TABLE 20
PERCENTAGE DISTRIBUTION OF PARENTS' REACTIONTO COLLEGE ATTENDANCE AS REPORTED
BY STUDENTS
EnCOUrages Not sold much obout
?Fag" Fother 14othercolic:me mice up to tim
other 'Mother Fother MotherNumber
White collar 88 96 92 12 4 8 24 24 48
Girls 92 100 8 0 13 13
Boys 82 91 18 9 11 11
Skilled 73 73 73 27 27 27 22 22 44
Girls 50 67 42 0 12 12
Boys 100 80 0 20 10 10
Farmers 41 63 52 59 37 48 34 35 69
Girls 29 60 71 40 14 15
Boys 50 65 50 35 20 20
Semi-skilled 35 47 41 65 53 59 17 17 34
Girls 40 60 60 40 10 10
Boys 28 28 71 71 7 7
df - 3; X2 - 31.523 and is significant beyond the 1 per cent level.
ASPHIATIO, IIWU ScHOOL SENIORS) mrrr 37
along in the worldr Responses to this question are listed in Table21. As the socio-economie status went up there was an increase inthe proportion of parents recommending a college degree.
It might be pointed out that in compiling Table 21 someanswers were particularly difficult to classify since the respondentsmight answer: "at least high school," 'high school and more if canget," and "college if able." Student reactions to the same questionasked the parents: "About how much schooling does a young personneed these days to get along well in the world?" are given inTable 22.
A pattern of replies was obtained somewhat similar to that ofTable 21 which gives the parents' responses to the same question.As the socioreconomic level rose there was an Increase in the per-centage of students recommending college training. As the socio-economic level went domi there was an increase in the proportionof students recommending high school. In Tables 21 and 22 calcula-tion of chi square gave values which were significant beyond the1 per cent level. There was very little likelihood that the differencesin either table could be accounted for by chance variation.
At the white collar and skilled levels the students recommendedcollege (some college or college degree) slightly stronger than theparents did. The farm parents recommended college educationslightly more than the farm children. At the semi-skilled level theparents (.50) indicated a stronger preference for the necessity ofcollege than did the seniors (.29).
The differences in views between parents and children on theneed for higher education are small except at the semi-skilled level.
Many children at the semi-skilled level were working and earningmoney. They did not like school particularly and did not see thenecessity for further education. They already had more formal edu-
cation than their parents obtained. The parents probably could see
that their positions were not so high as they might have been with
more education. They realized to an extent, at least, that collegeeducation was needed for higher socio-economic position.

TA
BL
E 2
1
PER
CE
NT
AG
E D
IST
RIB
UT
ION
OF
PAR
EN
TS'
BE
LIE
F O
F T
HE
NE
ED
FO
RE
DU
CA
TIO
N T
OD
AY
TO
"G
ET
AL
ON
G"
WE
LL
Occ
upat
ion
Fla
=F
iate
r :co
il la
et
Oth
erF
athe
r N
othe
rN
umbe
rF
athe
r M
othe
r
Whi
te c
olla
r
Skill
ed
F a
r m
e r
s
S e
m i
- s
l i l
l e d
17 50 49 5 6
13 19 49 4 4
15 34 4 9
5 0
30 20 3 0
31
29 43 23 5 0
30 32 2 6
41
48 25 2128
2513
6951 33
51 32
4 509
0 0
4 0 0
4 0 0
23 00 33 16
24 21 35 16
47 41 63 M
df -
6; X
2- 2
3.67
and
is s
igni
fica
nt b
eyon
d th
e 1
per
cent
leve
l.In
com
putin
g ch
i squ
are
omitt
ed c
ateg
ory
'Oth
er."

-4.
ASPIRATIONS OF MOH SCHOOL SENIORS, FART I 39
TABLE 22
PERCENTAGE DISTRIBUTION OF STUDENTS' BELIEFOF THE NEED FOR EDUCATION TODAY
TO "GET ALONG" WELL
Opupettenor tether
Highschool
Samecollege
Collegedegree Number
White collarGirls*Boys
SkilledGirlsBoys
FarmersGirlsBoys
Semi-skilledGirlsBoys
8 50 38 24s 40 3$ 139 55 30 11
27 36 36 2233 25 42 1220 so 30 1057 26 17 3553 40 7 15
so 15 25 2071 29 o 1780 20 0 1057 43 0 7
d - 6; X2 24.06 and is significant beyond the 1 per cent level.
One response of girl in white collar category not classified.
The mothers and fathers in the upper socio-economic classifica-
tion took a greater interest in school affairs by participating in theorganization of parents and teachers than did the parents at otherlevels. Of crucial importance was the stimulation of sons and daugh-ters to go to college. As the status went up, the parents not only puta higher value on college education but further stated that they en-couraged their children to enter college.
The fathers and mothers at the semi-skilled level placed a lowervalue on higher education than other parents and were permissivetoward their children attending college. The young people could goif they so desired and could earn their way. The parents did not seethe advantages of further education, nor did they see the possibilityof their children going to college. Higher education might be desir-able for some persons, but it was not in the picture for their children.
The attitudes and values of the parents in great degree was re-flected in the opinions of the sons and daughters. As the socio-eco-

40 NORTHWEST MISSOURI STATE COLLEGE STUDIES
nomic status rose, seniors placed a higher value on education andreported more pressure by their parents to continue their schooling.The children, as well as the parents, in the white collar category at-tached more importance to formal education. The youth in this clas-sification reported that the parents encouraged them to attend col-lege. At the semi-skilled level, the youth and their parents deemedhigher education of lesser importance. The children indicated thatthe fathers and mothers did not urge them to continue their educa-tion.
With the attitudes of the parents and the adoption of similarviews by the students, it is no surprise that youth at the white collarlevel attended college in larger proportions than did those in thesemi-skilled category.
PARENTS' ATIITUDES: OCCUPATION
In our society young people have a "free" choice of occupation.They are not legally bound to any Job or vocation. The father'sposition, however, serves as a starting place for his son. Since occu-pation is one of the important dOcrminants of social position, thetype of work of the father has consequences for the position of hischildren. Some families have the financial means to provide highereducation or to establish their children in business, while otherfamilies do not have these resources. Of very great importance alsoare values and attitudes which are transmitted to the children. Highaspirations end the motivations to achieve may be passed on insome families and not in others.
What attitudes do persons at different status levels have towardtheir Jobs? What plans do parents luwe for the occupational futureof their children? Do they encourage their children to aspire to ahigh position? Do they expect their children to occupy the samesoda-economic status as they do, or do they expect the children torise to a higher level? A discussion of the beliefs end attitudes of theparents about occupation and the vocational possibilities of theirchildren follows. Data bearing on the following proposition con-cerning parents are presented:
Proposition 3. Parents at higher status levels will expect theirchildren to enter higher status occupations.Hons.

ASPIRATIONS OF HIGH SCHOOL SENIORS, PART 1 41
To what extent are men satisfied with their work? Table 23gives the responses to the question, "Are you satisfied with the Job
you have, or would you like to have a different kind of job?" Inspec-tion of the table indicates that as the socio-economic level went upthere was greater satisfaction with the work, and as the socio-eco-nomic level decreased there was greater dissatisfaction with themeans of earning a livelihood. Chance variation would not likely ex-plain the differences in attitudes between status levels since compu-tation of chi square gave a value which was significant at the 5 percent level.
With higher prestige positions and, in general, with larger in-comes, the fathers at the white collar level overwhelmingly ex-pressed their liking for their work. Four-fifths in the skilled categoryand three-fourths of the farmers gave a similar response. Fewer thanhalf of the workers at the semi-skilled level were pleased with theirJobs. The semi-skilled and laboring worker had to do the heavy,dirty work, and he also received a smaller wage; it is not surprising,therefore, to find many of these persons dissatisfied with their posi-tions.
TABLE 23
PERCENTAGE DISTRIBUTION OFFATHERS SATISFIED WITH THEIR JOBS
Occupation Numbar
Mite collar 87 23Skilled 80 20Farmers 76 33Semi-skilled 44 16
df 3; X2 - 9,1 and is significant at the 5 per cent level.
The three fathers in the white collar category who were unhappywith their Jobs gave three different reasons for being dissatisfied. Onefather doing clerical work did not like this type of work and hatedespecially the government reports he had to 1111 out. During theyear he switched jobs and began to operate a cafe. Another father"would like to be making a little more money." The third father, aclerk thought his Job was a little "too easy." He previously had
42 NORTHWEST MISSOURI STATE COLLEGE STUDIES
been manager of a grocery store and had had to work harder physi-oily and mentally. He had supervised several employees. He had noone to supervise in his present job, and the work was routine. Pos-sibly, his present position was lower in status than the old one.
The three fathers in the skilled category who indicated thatthey were not satisfied with their jobs gave varied reasons. Onewould like to be "in the field as a representative of the company."Another said: "At my age would prefer something else; it is hardto get up and down." The third would lust as soon be doing some-thing else" but it is "hard to change." Several others who reportedthat they were satisfied, qualified this judgment by saying: "I like thejob but would like to be situated better so would not have to work
so many hours;" "It is the best I can do;" and "Am at the age wouldnot do me any good to try to do something else." One "sometimeswished for a better education so could better myself."
The farmers' objections to farming were primarily financial,and there was the wish for better things. "If there were anything init, would be satisfied;" "If had a good job would be better off; amsatisfied with the work if could make both ends meet." One farmernoted, "A fellow can get too old to farm, need white collar work anddraw a high salary for sitting." One would "like to mix farming withsomething else." One stated, "If I had it to do over again, I wouldtake mechanical engineering,"
At the semi-skilled level the fathers complained principallyabout the pay: "Wages are not very high; the work is all right;" and"It just don't pay enough; there is no chance for advancement." Onefather worked nights; the same work in the day would be all right.Ono would "d'ruther go out on the farm."
Relatively few men in the white collar and skilled categoriescomplained about their occupations. Some farmers who were suffer-ing under lower farm prices at this time voiced some complaints.Half the men at the semi-skilled level were not satisfied with theirjobs. The chief criticism was the income received. The pay of theseworkers was less than that of most other men interviewed. It wasapparent by the interviewer that the laborers lived in less preten-tious houses and owned fewer and less expensive house furnishings.It might be expected that these fathers would feel the need for moremoney.
The satisfaction or dissatisfaction with their jobs was reflected

TA
BL
E 2
4
PER
CE
NT
AG
E D
IST
RIB
UT
ION
OF
PAR
EN
TS
WA
NT
ING
TH
E S
ON
(SO
N-1
N-L
AW
)T
O F
OL
LO
W T
HE
FA
TH
ER
'SO
CC
UPA
TIO
N
Tes
Occ
upat
ion
Fath
er M
othe
rN
oFa
ther
Mot
her
Don
't kn
owIl
akes
no
clif
f.Fa
ther
Mot
her
Let
him
choo
seFa
ther
Mot
her
Num
ber
Fath
er M
othe
r
Whi
te c
olla
r30
4538
5745
519
56
44
423
24
(Son
-in-
law
) 17
2367
6917
90
012
13
(Son
)45
7345
180
09
911
11
Skill
ed15
3324
7557
665
107
50
220
21
(Son
-in-
law
) 0
17M
679
179
011
12
(Son
)33
5667
440
00
09
9
Farm
ers
3628
3148
4246
76
59
2618
(Son
-in-
law
) 14
,Z)
5740
77
093
1415
(Son
)53
3042
455
50
2019
20
Sem
i-sl
illed
019
975
5666
1919
196
66
1616
(Son
-in-
law
) 0
3060
4030
2010
1010
10
(Son
)0
010
083
017
00
66
df -
9; X
2-22
301
and
is s
igni
fica
nt a
t the
1 pe
r ce
nt le
veL
44 NORTMVEST MISSOURI STATE COLLEGE STUDIES
only in part in the desire of the fathers at different socio-economiclevels for their sons to follow in the father's occupation. The parentswere asked, "Would you want your son to follow the same occupa-lion you do?" In phrasing this question, the words "son-in-law" wereused when the parents had a daughter, and the wives were asked inreference to their husbands' occupations. The responses are givenin Table 24. Differences in replies by occupational categories aresignificant at the 1 per cent level. Chance variation does not ac-count for the differences in responses.
Fewer than half of the parents wanted their children to followin the same occupation as their fathers'. The parents in the whitecollar category bad the largest percentage approving their sons orsons-in-law taking up the fathers' vocations. Next in order were thefarmers, who might be expected to have a high continuity in familyoccupation. Farming traditionally has been handed down from fa-ther to son. The farm children are taught to work at an early ageand feel that this is one occupation they understand. The farm ma-chinery can be bequeathed to one or more children. However, onlyabout one-third of the farm parents were desirous that their childrenbecome farmers. The farm parents had the largest proportion whowere permissive to allowing their children to choose their own oc-cupations.
The parents in the semi-skilled classification bad the lowest per-centage desiring the children to follow in the fathers' footsteps. Thethree favorable responses were by mothers in regard to their pros-pective sons-in-law. A sizeable proportion of semi-skilled responseswere "don't know" or "makes no difference."
At the professional and managerial level, the fathers were moreinclined to favor the son following in the fathers' occupation or tobe pleased if the son would take up the fathers' vocation. At theminor white collar level, such as clerical workers, there was agreater tendency for the fathers not to want the son to enter thefathers' occupations.
The reasons given by the white collar parents for not wantingthe son or son-in-law to follow the father's occupations were varied.Some answers indicated a desire for improvement"Hope son-in-law has a better education and follows something other than ---;""It's a blind alley job:" "With education could do better;" and "Notenough future in it." Some other responses were "Been a lot of hardwork;" "Easier way to make a living;" and "Not very much time at

ASPIRATIONS OF HIGH SCHOO14 SENIORS, PART I 45
home." One or two fathers commented th t "Times have changed;the small fellow is crowded out."
The responses among the skilled for not wanting the sons to fol-low the fathers' work tended more to emphasize the conditions ofwork: "Too dirty," "Not healthy," "It is too dirty a job," "A hard job,""There is easier ways to earn a living," and "My job is too hazard-ous." A few responses indicated a desire for advancement; "Hewould be better educated," "Just a mechanic, would prefer a littlemorer "Better fields with more money," and "It is a headache andnot much chance for advancement,"
The farmers not wanting the sons to follow farming tended topoint out the difficulties of getting started in farming today and thepoor economic conditions. "Takes too much to start," "It takes II-nances to start," "Farming is not what is used to ber and "Not theway conditions are today," "Too much of a gamble:" "Would starveto death," and "Too long hours for the returns." Not many parentssuggested the possibility for advancement. One mother did say"Today, need to be a banker, lawyer, a college graduate." Duringthe period when the interviews were made, farm prices were down,and some farmers tended to be discouraged.
The parents in the semi-skilled category realized the hard workinvolved in their jobs. "Too God dang long hours," "Pretty roughdeal," `E'l'oo rough," "It is dangerous," "I had it the rough wayr"Has not been too good for me and looks like it will get worse,""Just ain't no future In the occupation I have to dor and "LikeClaude and me, hard work is about all we can do. I would hate tosee anyone follow in my footsteps."
A few semi-skilled parents hoped for advancement for theirchildren, The father's job was "not enough pay and not much chancefor advancement." One father stated that he hoped the son woulddo "a little better, that is why I am getting him through highschool:" and "Don't make enough money; he can get something thatwill be easier and draw more pay,"
Except for the farmers there was an increase in the proportionof parents wanting their sons to follow in the fathers' occupationsas the socio-economic level rose. However, even in the white collarcategory less than half of the parents desired the sons to enter thefathers' positions. A large proportion at each socio-economic leveldid not want the sons to take up the fathers' work. The chief ob-jection seemed to be economic. Apparently many parents bad the

46 NORTHWEST MISSOURI STATE COM= STUDIES
wish that the sons rise in status and enter work which would havegreater economic rewards or have more opportunity for advance-ment.
To what extent did the seniors want to continue in their fa-thers' occupational position? The boys were asked, "Would you liketo follow your father's occupation?" The girls were asked, "Wouldyou want your husband to follow your father's eccupation?" Table25 contains the responses by status level. Calculation of chi squaregave a value which was significant at the 5 per cent level. Therewas good likelihood that the differences by vocational class couldnot be accounted for by chance variation. A larger proportion offarm youth preferred to follow in the occupations of their fathersthan did children at any uther socio-economic level. Farming is anoccupation which is traditionally handed down through the family.
TABLE 25
PERCENTAGE DISTRIBUTION OF BOYS WANTING TOFOLLOW FATHERS' OCCUPATION AND OF GIRLS
WANTING THEIR HUSBANDS TO FOLLOWFATHERS' OCCUPATION
OecupstIonor father No
Yes,to someextent
very muchDon't know
makes nodifference Number
White collar 62 21 17 24Girls 54 15 31 13Boys 73 27 0 11
Skilled 54 24 22 22Girls 50 8 41 12Boys 60 40 0 10
Farmers 37 54 9 35Girls 33 47 20 15Boys 40 60 0 20
Semi-slcilled 76 24 6 17Girls 80 20 10 10Boys 71 28 0 7
df - 6; X2 - 14.6 and is significant at the 5 per cent level.

%SPIMTLONS OP MIT WHOM, SENIORS) PM1T t 47
At most socioeconomie levels, a considerable percentage of thegirls were willing to leave the choice of their husband's occupationto tilt-, husband or asserted that it made no difference to them whattheir husbands dkl. Thirty-three per cent of the skilled, 22 per centof the white collar, and 20 per cent of the farm girls gave this risponse,
The highest proportion of the seniors stating that they did notwant to follow in the father's occupation was at the semi-skilledlevel, followed by the white collar, and skilled,
The reasons advanced by the boys in the white collar categoryfor not desiring to follow in the father's occupation seemed to bepersonal inclinations of not liking the work: "A lot of pressure onyou; I do not want to work with the mass of peopler "Just do notlike that kind of workr "Lord no; do not see myself behind a deskpushing a pencil;" "Would rather be something else, I reckon;""There are other things I would rather do."
The daughters of white collar workers objected to their futurehusbands following their fathers' work: "A person should do thatjob which is best suited for him;" "It is not too clean workr "justdo not like the beer business;" and "It is so irregular." One girlthought that her husband "could find something better."
The sons and daughters of skilled workers tended to reflectsome parents' attitudes for not wanting to follow In the father's job.The reasons were primarily concerned with the conditions of work:"Work around tho clock," "Oct up in the middle of the night;" "Irregular hours makes him crossr "It Is a dirty job, there Is alwaysgrease, kinda dangerous," "Electric work scares me." One boy re-ported thnt he did not care for the work, One girl stated that ft "paystoo little."
The farm boys not wanting to go into farming gave variedreasons: "Hardly any time off; there Is something to do all thetimer three boys had no reason except to go ;nto another occupa-tion (lawyer, veterinarian); one boy would rather do somethingelse, "cannot make much money farming." Two boys did not likethe work: "Do not care for it" and "Not fond of farming?'
One farm girl said that her "boy friend does not like the farm."Another one stated that she would not want her husband to be afarmer "unless he likes It like my father did." Another girl said thatshe did not want her husband to be a "big farmer" like her father,who had too much to do.
48 NORTHWEST MISSOURI STATE COLLEGE STUDIES
At the semi-skilled level the boys who did not prefer to followthe vocation of their fathers gave reasons concerned with thework or pay renumeration, "Does not pay enough," "Not good pay-ing job; work at different hours," "Do not like ittoo dirty and every-thing," "Do not like the smell of milk," and "Never did like farming,"
The girls at the semi-skilled level had somewhat the same ob-jections to their husbands doing the same work as their fathers. Con-
ditions of work were noted: "It is too dangerous," "Would not wanthim around on hot wires," and "Has to lift heavy separators, would
be too heavy." The pay was objected to by two girls: "He does notmake too much money," and "It does not pay off."
The seniors tended to follow somewhat the same pattern astheir parents with regard to entering their fathers' occupations, with
a large proportion of the young people at each level not desiringto be in the fathers' work. In the white collar group the objections
raised to entering the parents' vocations tended to be personal rea-
sons of not liking the typo of work. The young persons preferredwhite collar work but not the particular one In which the fatherwas engaged.
At the skilled and semi-skilled levels and to some extent amongthe farm boys, the objections were the bard, dangerous work andthe low pay. Apparently many young persons in these categorieswished to enter an occupation above their fathers' in that the work
would not be so physically difficult and hazardous, and the remuner-ation would be higher.
What possibility did the parents see for opportunities for in-
come mobility? Table 26 presents the responses to the question: "Do
you think that it is possible today for an ambitious young person to
work himself up to a higher jobsay $10,000?" The differences in
response by occupational classification were significant beyond the
1 per cent level.Only one father thought that it would not be possible for an
ambitious young person to work himself up to 610,000 a year. A few
parents did not know whether it could be done, In giving answers
many parents gave qualifications so that it was difficult to place the
responses. Some statements were: "Depends on what he was doing,"
"If has ambition and zip," "Fairly easy if had education:" and "If
bad more push than the average."The parents in the white collar category had the highest per.

TA
BL
E 2
6
PER
CE
NT
AG
E D
IST
RIB
UT
ION
OF
DE
GR
EE
TO
WH
ICH
PA
RE
NT
ST
HO
UG
HT
IT
V
POSS
IBL
E F
OR
AN
AM
BIT
IOU
S'Y
OU
NG
PE
RSO
N T
O W
OR
KU
P T
O$1
0,00
0 A
YE
AR
Occ
upat
ion
FaV
erri
iteot
Ter
Dif
ficu
ltFa
ther
Mot
her
Ver
y di
ffic
ult
Fath
er M
othe
rO
ther
Fath
er M
othe
rN
umbe
rFa
ther
Mot
her
Whi
te c
olla
r44
2131
3938
3813
3826
44
523
24Sk
illed
3014
2245
5349
2033
270
2021
Farm
ers
185
1249
5451
3032
313
96
3335
S e
m i
- s
k i l
l e
d6
1 3
1 0
3812
2 5
5 6
7 5
6 5
00
016
16
df -
6; X
2-22
.52
and
is s
igni
fica
nt b
eyon
dth
e 1
per
cent
leve
t,
In c
ompu
ting
chi s
quar
e om
itted
cat
egor
yO
ther
."

50 NORTHWEST MISSOUBI STATE COLL= STUDIES
centage stating that they thought that it would be fairly easy for anambitious young person to reach $10,000, and there was abouta 10 per cent drop from each socio-economic level to the next low-est. One white collar mother said that it would be fairly easy if the
person had "the right job and pull." A white collar father thoughtthat it would be easy since he paid one of his men $400 per month.
At evety level except the semi-skilled, the highest percentagewas at the "difficult" response. The semi-skilled had the largest pro-portion at the "very difficult" response. Some answers of the semi-skilled were: "If I thought that it were easy, I would be working onit;" "That would be a big jump;" "Could work up but do not know
if could reach $10,000;" "Can be done but not many do;" and "Pretty
damned hard pull."The parents were asked what occupations they wanted their
children to enter and what occupations they expected them to enter.The results are given in Tables 27 and 28. The values of chi squarein both tables were high and were significant beyond the 1 per centlevel, There was very little likelihood that the differences between
socio tconomie categories could be explained by chance variation.
Most parents presumably were willing to give their childrenconsiderable latitude in choosing occupations. The parents in thewhite collar and farmer categories were the most liberal in this re-gard with about two-thirds stating that they would leave the deci-
sion of occupation to the children. Nearly half of the parents in thesemi-skilled category and 37 per cent of the skilled categoryanswered "What be wants;" "It's their choice," etc. The parents atthe semi-skilled level had the highest percentage of "don't know"
responses.Although many parents answered "What be wants" or "Let him
choose" to the question, "What occupation do you want your son(daughter) to enter?" they really did not mean that the child wasfree to select any occupation. In a few instances, to test the response,
"What he wants," some parents were asked a hypothetical question,"What if your child said that he had considered many jobs and hadfinally reached a decision to become a ditch digger?" It was found
that the parents did not want the child to become a ditch digger.
The child should enter a "better" occupation. Presumably, the par-
ents bad a range of acceptable occupations, and the children should
choose from among them,

ASPIRATIONS OP HIGH SCHOOL SENIORS, PAM' I 51
TABLE 27PERCENTAGE DISTRIBUTION 1)1? OCCUPATIONAL
CLASSES WHICH PARENTS WANT THEIRCHILDREN TO ENTER
Occupationof Father
WhiteCollar Skilled Fernier
Don'tKnow
What heWants
TotalNo.
White collar 28 0 0 4 68 47Skilled 44 2 0 17 37 41Farmers 18 3 3 10 66 68Semi-skilled 16 9 0 28 47 32
df - 9; X2 - 27.78 and is significant beyond the 1 per cent level,
A larger proportion of parents in the skilled category than atany other level wanted their children to go into white collar voca-tions, For the girls, tho positions largely represented secretarial oroffice work rather than professional occupations. Next in order camethe parents of white collar workers, farmers, and semi-skilled.
Only a few parents gave other responses. One parent in theskilled category desired a skilled occupation for his son. Two par-ents in the fanner category wanted their children in skilled voca-tions and two desired farming for their children, Three parents inthe semi-skilled category preferred that their children go intoskilled occupations.
TABLE 28PERCENTAGE DISTRIBUTION OF OCCUPATIONAL
CLASSES WHICH PARENTS EXPECTED THEIRCHILDREN TO ENTER
Occupationof Father
WhiteCollar Skilled Farmers
Married(UMW
Don'tKnow Other Number
White collar 47 2 0 2 49 0 47Skilled 31 7 0 17 37 5 41Farmers 25 10 15 3 35 11 68Semi-skilled 9 9 0 9 70 3 32
cif - 9; X2- 36.12 and is significant beyond the 1 per cent level. Incomputing chi square combined the categories, "Don't know" and"Other."

52 NOBTJflVEST MISSOURI STATE COLLEGE STUDIES
Table 28 indicates that a changed pattern of responses emerged
when the parents were asked what occupations they expected their
children to enter. Nearly half of the parents in the white collar
category expected their children to go into white collar work and
about half responded, "Do not know." In comparison with Table
27, there is an increase in the percentage expecting their children to
enter white collar occupations only at the white collar level but
there is a decrease in the proportion expecting white collar work at
every other levelskilled, farmer, and semi-skilled.
Over two-thirds of the parents at the semi-skilled level re-sponded, "Don't know." The problem to these parents might becharacterized by the statement of one father who stated, "Lord, I
don't know. I don't know if she knows or not."
To what extent was there communication between parents and
children concerning occupations? The students were asked whether
they had discussed their intended occupations with their mothers
and fathers and with whom they had most discussed this subject.
Calculation of chi square for the responses in Table 29 gave a value
which is not significant at the 5 per cent level. It is likely that the
responves by socio-economic level can be accounted for by chancevariation. Most seniors at every level reported that they had dis-
cussed their desired vocations with their parents. The smallest pro-
portion who stated that they had not talked about their intendedoccupations with their parents was at the white collar level and the
highest percentage was at the semi-skilled level. More boys than girls
stated that they had not discussed occupations at all with their par-
ents in the white collar, skilled, and farmer categories.
The replies to the question with regard to the parent who talked
most to the adolescents concerning occupation did not seem to form
a pattern along socio-economic lineq. The skilled and white collar
categories had the smallest proportion talking to the father, and the
farmer and semi-skilled classifications had the highest percentage
talking to the father. Discussing occupation more with the mother
were the seniors in the semi-Ailled category, followed by the skilled,
white collar, and farmers. The sons and daughters of white collar
workers had the largest proportion discussing occupation "about the
same" with both parents, followed by farmers, skilled, and semi-
skilled categories.As might be expected there was a difference between the boys

ASPIRATIONS OF IUGU CHOW, SRNIORS, PART 1 53
and girls as to which parent he or she discussed occupation with the
most. The girls talked more with the mothers and the boys more
with the fathers. The boys in the semi-skilled, skilled, and farmer
categories had a higher percentage than the girls who discussed vo-
cation "about the same" while in the white collar classification the
girls in larger proportion talked about occupation about the same
with either parent.
TABLE 29
PERCENTAGE DISTRIBUTION OF STUDENTS' ESTIMATE
OF WHICH PARENT DISCUSSED INTENDEDOCCUPATION MORE WITH THEM
Occupationof father
Notdismal,
FMhermore
Mothermore
About thesame
Did notask Number
White collar 8 8 29 54 0 24
Girls 0 0 38 62 0 13
Boys 18 18 18 45 0 11
Skilled 14 4 32 41 9 22
Girls 8 0 42 33 17 12
Boys 20 10 20 50 0 10
Farmers 14 17 22 46 0 35
Girls 7 7 47 40 0 15
Boys 20 25 5 50 0 20
Semi-Skilled 18 12 41 24 6 17
Girls 30 0 60 10 0 10
Boys 0 29 14 43 14
tlf - 9; X2 - 7.9 and is not significant at the 5 per cent level.
In coniputing chi square combined the categories "Did not discuss"
and "Did riot ask."
The seniors reported that very few parents disapproved of their
choice of future life work. Table 30 gives the seniors' responses to
the question "Does your father (mother) approve of your choice of
occupation?" Parents approval of seniors choices of occupation by
status level was statistically signifkant at the 2 per cent level. A
mother in the white collar category was reported as telling her
daughter, "She believed I could do something better." A mother at
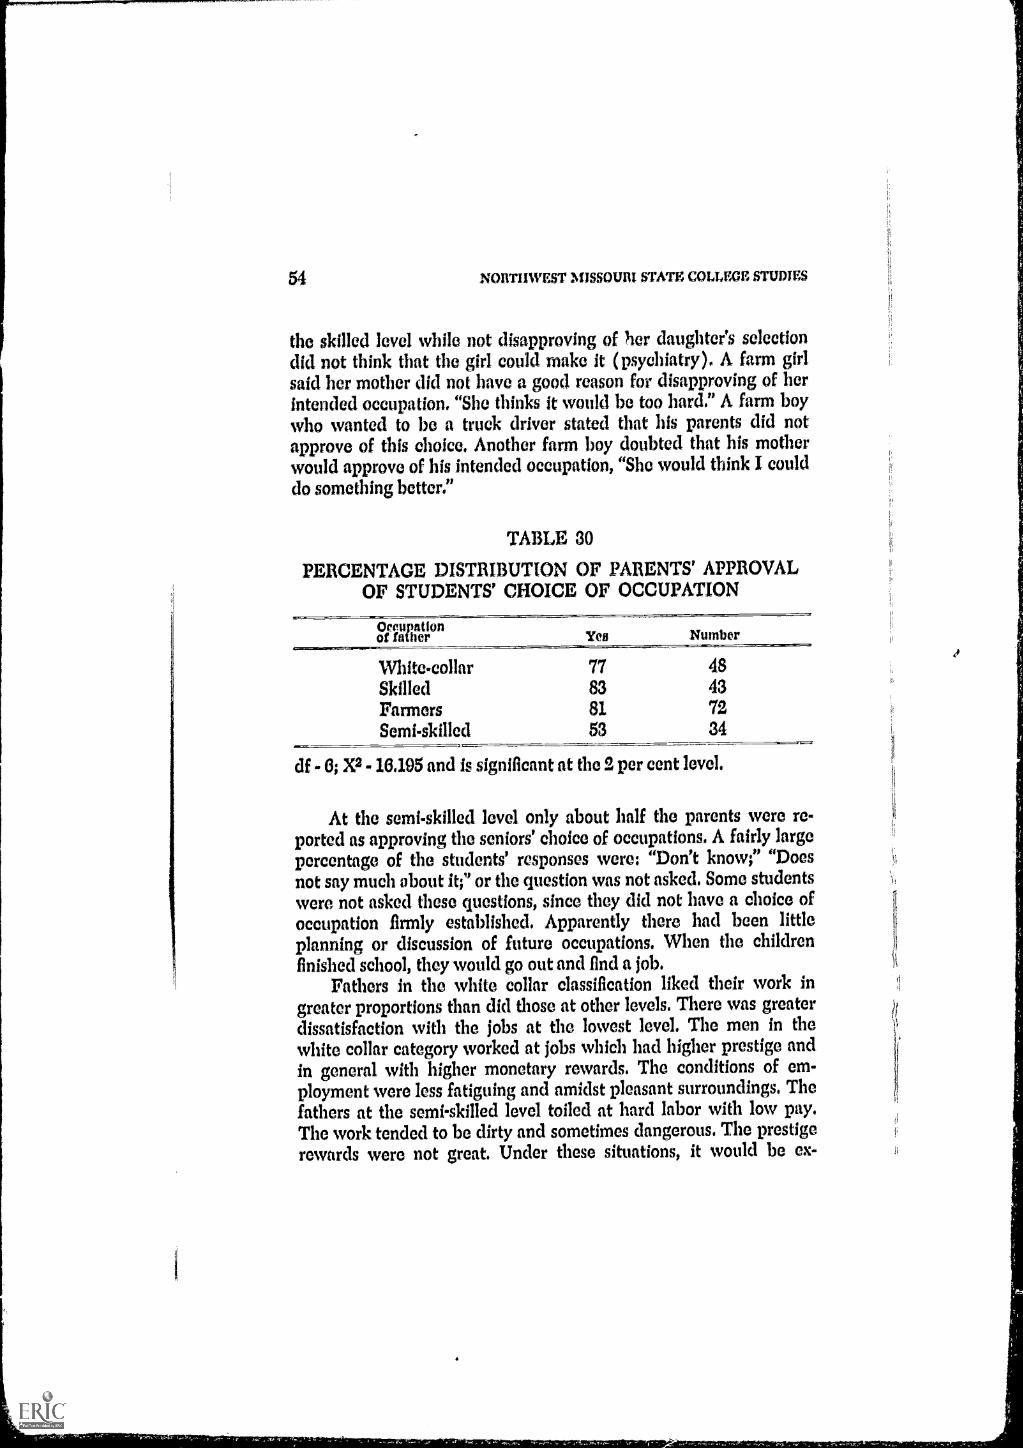
54 NORTHWEST MISSOURI STATE COLLEGE STUDIES
the skilled level while not disapproving of her daughter's selectiondid not think that the girl could make it (psychiatry), A farm girlsaid her mother did not have a good reason for disapproving of herintended occupation, "She thinks it would be too hard." A farm boywho wanted to be a truck driver stated that his parents did notapprove of this choice, Another farm boy doubted that his motherwould approve of his intended occupation, "She would think I coulddo something better."
TABLE 30
PERCENTAGE DISTRIBUTION OF PARENTS' APPROVALOF STUDENTS' CHOICE OF OCCUPATION
OceupotIonof father Yes Number
White-collar 77 48Skilled 83 43Farmers 81 72
53 34
df 6; X2 - 16.195 and is significant at the 2 per cent level.
At the semi-skilled level only about half the parents were re-ported as approving the seniors' choice of occupations. A fairly largepercentage of the students' responses were: "Don't know;" "Doesnot say much about it;" or the question was not asked. Some studentswere not asked these questions, since they did not have a choice ofoccupation firmly established. Apparently there had been littleplanning or discussion of future occupations. When the childrenfinished school, they would go out and find a job.
Fathers in the white collar classification liked their work ingreater proportions than did those at other levels. There was greaterdissatisfaction with the jobs at the lowest level. The men in thewhite collar category worked at jobs which bad higher prestige andin general with higher monetary rewards. The conditions of em-ployment were less fatiguing and amidst pleasant surroundings. Thefathers at the semi-skilled level toiled at hard labor with low pay.The work tended to be dirty and sometimes dangerous. The prestigerewards were not great. Under these situations, it would be ex-

ASPJRATIONS OP BIM SCHOOL SENIORS, PART 1 55
pected that persons at the higher level would tend to be more satis.fled with their work than those at lower statuses.
Although fathers at the white collar level had greatest satisfac.tion in their work, they were not inclined to want their sons to fol.low the same occupation. In fact relatively few parents desired theirsons to enter the same vocations as the fathers'. However, as thesocio-economic level went down there was a decline in the percent.age of parents who preferred that their sons folio w in the fathers'footsteps.
Many young people did not want to follow the occupationalmodel set by the father. As one might expect the strongest prefer-ewe for taking up the father's work was by farm youth. The largestpercentage not desiring to take up the vocation of the father was atthe semi-skilled level.
In the white collar category the parents, although not overtlysetting the occupational goals for their children, did have expecta-tions that their sons and daughters would enter higher occupationssince they did urge the children to attend college. At this level therewas more planning for college and occupation. The parents werelikely to make suggestions or to bring home material pertaining tovocations. The parents in the white collar classification were morelikely to believe that it was possible for young persons to advance tohigher income positions than did the parents at lower levels.
While the mothers and fathers in the semi-skilled classificationwere wishing that their sons would not follow in the same jobs asthe fathers, they did not have definite plans for the occupational ad.vancement of the children. The parents did not encourage theirchildren to further their education beyond the high school. Theyhoped the boys would find a "good job," a position which was betterthan the father's. There was desire for social mobility, but this asp',ration for upward movement was limited in that the educationallevel was limited.