Embed Size (px)
Citation preview
The impact of variable demand upon the performance of a combined cycle gasturbine (CCGT) power plant
Robert J. Bass, Weeratunge Malalasekera*, Peter Willmot, Henk K. VersteegWolfson School of Mechanical and Manufacturing Engineering, Loughborough University, Loughborough, Leics, LE11 3TU, UK
a r t i c l e i n f o
Article history:Received 30 October 2009Received in revised form23 August 2010Accepted 18 September 2010Available online 25 October 2010
Keywords:CCGTEnergyElectricity demandWind energy integration
a b s t r a c t
This paper presents experimentally measured data showing the impact of variable demand on a modern800 MW CCGT plant. The results contrasting the performance of the plant when operating underoptimum conditions with those measured when modulating the output to match dispatch instructions ispresented and compared. These contrasts include the impact of step changes, continual modulation andboth hot and cold starts of the plant. The results indicate the changes in fuel used per MWh, CO2 emittedper MWh and the NOx emissions under different operating modes. From the subsequent analysissignificant increases were recorded in both fuel used and CO2 emitted when the plant departs fromoptimum operating conditions. When the plant is requested to cease generating due to over capacity onthe system, major increases in the emissions of NOx, when required to restart generation together withlarge increases in the fuel used and CO2 emitted per MWh, can be observed.
! 2010 Elsevier Ltd. All rights reserved.
1. Introduction
Now that there is a clear understanding of the impact of climatechange due to the release of CO2 into the atmosphere [1] from thecombustion of fossil fuels, there is a world wide drive to replacefossil fuels by sources of renewable energy. Required levels of greenhouse gas reduction have been identified through research andthese requirements have been documented [2,3]. Many countriesworld wide have set targets to reduce green house emissions andincrease efficiency of current generation systems. Compared to1990 levels the European Union for example aim to reduce greenhouse gases emissions by 20%, increase energy efficiency by 20%and increase the amount of renewable energy use by 20% [4,5] bythe year 2020. The is known as the 20-20-20 target to be achievedby the year 2020. The UK has set itself a more ambitious target toachieve a 60% reduction by the year 2050 [5e7]. Bio-fuel, onshorewind, offshore wind, tidal, wave, geothermal, hydroelectric andsolar are some of the renewable or ‘green’ energy sources which areconsidered to be alternatives to fossil fuel based energy for thefuture [7]. European Union also aims to achieve higher renewableenergy targets by the year 2050 [8]. However, many of thesealternative sources are either variable and unpredictable or variablebut predictable and therefore introduce increased volatility into thesupply-balancing requirement.
Modern industrial countries are dependent upon a secure supplyof electricity to function efficiently. Until recent times the bulk ofthis power has come from fossil fuel and nuclear power sources. Inthe light of the need to increase the proportion of renewable energyuse various countries have adopted different approaches. The mainfactors which determine the energy policy of a country are (1)pathways to cut carbon dioxide emissions by internationally agreedamounts; (2) to maintain reliable energy supplies; (3) to maintaineconomic growth and to improve productivity; and (4) heating andother household energy needs are adequately maintained [7]. Addto this the way energy is used in transport infra-structures are alsoexpected to change from direct fossil fuels to other modes of energysuch as hydrogen, fuel cells and electric/hybrid. Therefore the typesof energyavailability to support these changeswill also be a factor indetermining energy policies. A number of papers in the literaturehave discussed different approached adopted bydifferent countries.Laird and Stefes [9], for example, have discussed how Germany andUnited States have different policies for supporting renewableenergy. The paper describes how Germany and United States havestarted with very similar policies for renewable energy after theenergy crisis of the 1970’s but by the year 2000 were on verydifferent policy paths. Today Germany appears to be well ahead ofthe United States in terms of installed capacity and highly successfulexport markets. UK energy policy for the present and the future isdescribed in details in BERR 2003 [5] and BERR 2007 [10]. In theinterest of security of supply and considering the need to reducegreen house emission, UK has considered the possibility ofincreasing the nuclear power capacity in the future as part of its
* Corresponding author. Fax: !44 1509227648.E-mail address: [email protected] (W. Malalasekera).
Contents lists available at ScienceDirect
Energy
journal homepage: www.elsevier .com/locate/energy
0360-5442/$ e see front matter ! 2010 Elsevier Ltd. All rights reserved.doi:10.1016/j.energy.2010.09.020
Energy 36 (2011) 1956e1965
energy policy [10,11]. However short term power needs requirea combination of other power generation technologies. Patterssonand Soderholm [4] have discussed in detail the impact of climatepolicy and technology learning from future investments in theSwedish power sector. The paper suggests that renewable powerwill benefit from existing EU climate policy measures and overalladditional policy instruments are needed to stimulate the diffusionof renewable power. Østergaard [12] using western Denmark as anexample has reviewed a number of possible optimisation criteria forthe design of energy systems with large share of fluctuatingrenewable energy sources. The analysis demonstrates that whetherthe system in question ismodelled as operated in islandmode or nothas a larger impact on the definition of the optimal wind powerlevel. The study shows that the optimisation criteria need to beclearly defined as different optimisation criteria can renderdifferentresults. Mamlook et al. [13] have used a neuro-fuzzy logic approachto determine the most suitable option or options for electricityproduction for Jordon. This approach allows to condense a largeamount of data into small sets of variable rules and uses a neuralnetwork approach to reach decisions. Based on cost-to-benefitratios, the results show that solar, wind and hydropower which arerenewable energies are considered best systems for electricitypower generation in Jordon. The study also shows that nuclear is theworst option followed by fossil fuel for power generation. Similarneural networks approach has been used by Ekonomou [14] toanalyse Greek long term energy consumption and such tools arevery useful in determining how renewables could be integrated intolong term energy policies. Chen et al. [15] have discussed solutionsinvolving fuel cells, renewable energy sources and hydrogen infra-structure for sustainable development of islands and remote regionsof EU. This paper concludes that the global development of newrenewable energy technologies can assure sustainable supply ofpower for islands. He et al. [16] have analysed the co-benefits ofenergy policies in China. The study shows through analysis andmodelling that the policies formulated to improve energy efficiencyare also effective in abating emissions resulting in substantialenvironmental benefits. There are many other studies dealing withvarious individual circumstances of each country [17e22]. Thearticle by Jacobson andDelucchi [23] has discussed the possibility ofobtaining all the world energy from wind, water and solar power.The authors argue that all what is required is sensible energy poli-cies and large capital investment for developing required gridnetworks and resources. Lund [24] has also discussed in detail theperspective of renewable energy (wind, solar, wave and biomass)with respect to making strategies for sustainable development.Major technological changes indentified in this analysis are energysavings on the demand side, efficiency improvements in the energyproduction and replacement of fossil fuels by renewables which areexactly the long term goals of the European Union energy policy.Based on the case of Demark this paper discuss the problems andperspective of converting present energy systems to 100% renew-able energy systems and concludes that such achievement ispossible only with the advancement of technologies. Technologyadvancements will take time and need considerable resource allo-cations. Under present world economic climate resource allocationsand development of new technologies will take considerably moretime. Until a major portion of the power is produced by renewablesexisting and current fossil fuel based generating systemwill have tooperatewithmaximumpossible efficiencyandmodernCCGTpowerplants will continue to play a major role in many countries. Thepaper by Silveira et al. [25] highlights benefits of CCGT plants interms of pollutant emissions, ecological efficiency and costs.
Energy on demand is a requirement of any modern powersupply infrastructure. As the demand for power varies over ona daily, weekly and seasonal basis [26], it is necessary to balance the
output from the supply side to match the demand instantaneously.The amount of renewable energy on national grid systems isincreasing significantly, most of it supplied by wind power,although there is an expectation that both wave power and tidalpower will be contributing increasing amounts in the future. Windand wave sources of energy are unable to deliver a secure supply ofenergy as they are unpredictable and variable by nature. Tidalenergy, although predictable delivers just two pulses of powerevery 24 h, which vary in quantity as the lunar cycle changes [27].
We now have a degree of unpredictable and variable input onthe supply side and a degree of variability on the demand side ofthe balancing equation which must be accommodated to ensurea stable electricity network. In the absence of stored energy, most ofthe supplymodulationwill be required to come from the remainingfossil-fuelled power plants, assuming that any nuclear capacity isrestricted to supplying base load. To perform this balancing serviceCCGT power plants will have to depart from their optimum oper-ating conditions not just to accommodate the variability of demandbut the variability of input due to increasing renewable energysupply sector.
This paper reports the findings of experiments to measure theeffect of variability upon a modern CCGT power plant as it isrequired to operate under conditions, that depart from optimumoperation and analyses the consequential environmental impact.The analysis is based on the demand profile in the UK, it is,however, equally valid for any industrial nation with high elec-tricity consumption and highly variable peak demand.
2. The advance of CCGT technology
In the UK following the Electricity Act (1989) [28], privatisingthe electricity industry and the ‘Vesting’ of the generating anddistribution assets into the hands of a number of publicly quotedcompanies, the industry has selected gas fired technology toprovide most new sources of power. Between 1991 and 2005 some40,000 MW of new capacity has been constructed. It includes justone nuclear station (Sizewell B) and one small CHP coal fired plant(a total of 1400 MW). The bulk of the new capacity is based uponthe CCGT (Combined Cycle Gas Turbine) process, which offers manybenefits.
The CCGT process delivers thermal efficiencies of up to 60%,whilst the old coal fired stations deliver efficiencies between 30 and36% and emit much higher pollution levels of CO2, NOx and SOx. GT(gas turbine) plants are quicker and cheaper to build, easier tofinance and achieve high levels of availability. Further details ofCCGT advantages in operational conditions are described in [25,29].
In a standard gas turbine cycle [30], the gases exit the turbine atapproximately 600 "C. In the CCGT plants the energy in the exhaustgas is used to raise steam in a HRSG (Heat Recovery Steam Gener-ator). The gas turbine cycle and steam cycle combine together toraise the overall thermal efficiency in the latest generating plants toabout 58e60%. The latest GTs are designed to produce a constantoutput of 280MWwith a gross electrical efficiency of 38%. A typicalCCGT station will consist of two GTs and one steam turbine (ST). Toallow each GT to operate independently at different output levels,each GT exhausts into a separate HRSG.
As the thermal efficiency of the GT is increased with a rise in thecombustion temperature, there is continual competition to upgradethe hot gas path of the GT. This has enabled higher and highercombustion temperatures to be achieved by using exotic materialsfor the combustion chambers and turbine blades. However, theseblade coatings and combustion chamber materials are not suitablefor some fuels and the most efficient machines are limited to firingon natural gas.
R.J. Bass et al. / Energy 36 (2011) 1956e1965 1957
The operation of the turbines requires careful control of the rateof change of temperature throughout the hot path. A particularlyimportant period of control occurs when the turbines are startedfrom stationary. Internal temperatures of the STs dictate the speedwith which any power plant reaches its full capacity from a start. A‘Hot Start’ may be achieved within 2e3 h where a ‘Cold Start’ maytake 4e8 h.
The CCGT plants produce their highest thermal efficiencieswhen working at their MER (maximum economic rating). Anydeparture from this output power level causes an increase in thefuel consumed and effluent gases emitted per unit of powerexported.
The swings of power delivered from both Group 1 and Group 2renewable energy sources [31] will need to be counterbalanced byvarying the output from the fossil fuel fired power stations. As windpower is the most developed source of renewable energy, easy toinstall and supported by public subsidies, it is likely to be thetechnology which will provide the major share of the requiredrenewable energy input during the next 15e20 years. It will benecessary to have sufficient back-up as standby generating capacityto provide the power matching required to balance the stochasticnature of the wind power input. By 2020 the gas fired CCGT powerstations are the plants most likely to be available to respond andgenerate the ‘In Fill’ power by varying their output.
3. Transmission stability and the UK national grid code
3.1. The grid code
The SO (System Operator), a division of the National GridCompany, controls the electricity transmission network. The dutiesinclude electrical safety, quality and continuity of supply. The SOuses the measure of frequency response to balance the continu-ously changing demand on the high voltage network to contain itwithin #1% of the nominal setting of 50 Hz. The balance betweenthe total load demand and the total generation output determinesthe system frequency at any specific moment.
There are statutory requirements placed upon the SO to main-tain the system frequency within specific levels centred on 50 Hz.In order to achieve the requirements generators and distributioncompanies are required to follow the NGCGrid Operating code [32].The SO has to ensure that there is sufficient generation capacity anddemand side response held in readiness to manage any crediblesystem contingency. Sudden increases in demand cannot be metfrom the wind, wave and solar sources of renewable energy. Powerdelivered from these systems matches the instantaneous energyinput and therefore cannot respond to meet the requirements ofthe Grid Code.
3.2. GT plant operation
As a large percentage of the coal fired generating plants aregradually retired from the UK system, the frequency responseservice will be increasingly provided by the CCGT stations. Thisassumes that any of the remaining or new nuclear stations willhave derogation from the National Grid code to relieve them frommany of these duties.
The compliant generators must maintain their output powerflow as the frequency falls from 50 Hz to 49.5 Hz without reducingthe power output level. From 49.5 Hz to 47 Hz the code allowsa linear fall in output, such that at 47 Hz the power flow is not lessthan 95% of the capacity being delivered at 50 Hz. This requirementis onerous; many of the latest GTs suffer dangerous rises incombustion temperature during frequency correction incidents.
Some GTmanufacturers achieve the code requirements by sprayingwater into the air intakes of the turbine.
The Code also requires that a plant must operate on a contin-uous basis between 95% and 104% of the set frequency but maydisconnect automatically from the network after 20 s when thefrequency is between 94% and 95%. Most CCGT gas turbines plantscan meet the code requirements when the ambient temperature is0 "C, but as the external air temperature rises, the compressoroperatingmargin of the GT falls and at 25 "C substantial amounts ofextra fuel is needed to deliver the power. The situation can berecovered by over firing the turbine to achieve compliance with thecode but this causes an increase in the combustion temperature ofapproximately 160 "C. At these temperatures there is concern aboutcombustion stability, compliance with the emission regulationsand potential damage to the hot path components such as theturbine blade coatings and the rotor.
Each GT is equipped with a water spray to wash the compressorblades. It is this wash system, that is used during times of lowfrequency operation to reduce the combustion temperature duringover firing.
Other important factors that result from the interaction of theCCGT plant with the demands of the SO are:
(a) Start-up times and fuel used in the start-up and shut-downcycles;
(b) The ramp rates during start-up and power output changes;(c) The part-load capability;(d) Pollution emitted as a result of generating at levels below the
optimum output;(e) The impact upon plant maintenance times and costs;(f) The Impact upon fixed overheads;(g) The impact upon the return on capital investment.
The SO has three forms of generating reserve that can bepurchased to meet the obligations.
(a) Spinning reserve (part-loaded plant, which can be ordered toincrease or decrease output as required).
(b) Plant on hot standby (whilst not connected to the transmissionsystem, it can be brought into service with a minimum ofdelay).
(c) Plant on Cold standby (This plant is awaiting orders tocommence the process of warming the plant prior tocommencing synchronising routine).
This study has approached the issue from a different position. Inorder to meet the power supply and balancing requirements by2020, it is predicted that a number of CCGT plants will be installed.The plants are inherently more efficient than OCGT (Open Cycle gasTurbine) plants as the waste heat from the GTs is used to adda steam cycle to the process and generate further power (Thermalefficiencies of 58e60% are achieved using the combined cyclewhere as the open cycle can only achieve efficiencies of 36e38%).Both plants can deliver the necessary load following required tomatch the customer daily variations and the stochastic input fromthe increasing wind turbine capacity. However, the CCGT plants aremore efficient in the use of fuel and are therefore capable ofdelivering lower emission levels even when they are operating onpart-load.
In order to examine the potential of the CCGT to fulfil thebalancing duties in practice, datawas collected from a new800MW(nominal) CCGT plant over a period of 4 months. This has enabledan analysis of fuel usage and gas emission levels to be presented forhot and cold start-up, load step changes and continual modulation.The results were then compared with the results obtained when
R.J. Bass et al. / Energy 36 (2011) 1956e19651958
the plant was operating at or near its optimum (i.e., the plant MER).It should be noted that the data for each case considered belowhave been taken from a single run operating under the consideredmode.
4. Experimental investigations
The experimental data was collected from an operating CCGTplant, which has the following specifications:
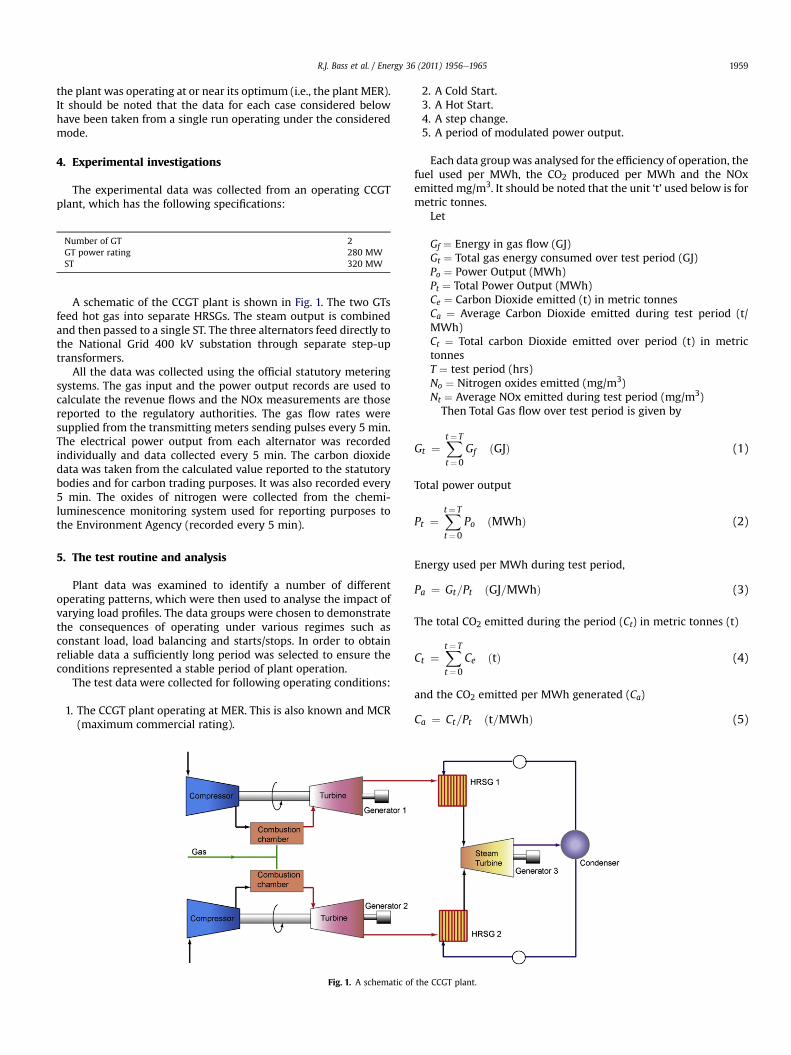
A schematic of the CCGT plant is shown in Fig. 1. The two GTsfeed hot gas into separate HRSGs. The steam output is combinedand then passed to a single ST. The three alternators feed directly tothe National Grid 400 kV substation through separate step-uptransformers.
All the data was collected using the official statutory meteringsystems. The gas input and the power output records are used tocalculate the revenue flows and the NOx measurements are thosereported to the regulatory authorities. The gas flow rates weresupplied from the transmitting meters sending pulses every 5 min.The electrical power output from each alternator was recordedindividually and data collected every 5 min. The carbon dioxidedata was taken from the calculated value reported to the statutorybodies and for carbon trading purposes. It was also recorded every5 min. The oxides of nitrogen were collected from the chemi-luminescence monitoring system used for reporting purposes tothe Environment Agency (recorded every 5 min).
5. The test routine and analysis
Plant data was examined to identify a number of differentoperating patterns, which were then used to analyse the impact ofvarying load profiles. The data groups were chosen to demonstratethe consequences of operating under various regimes such asconstant load, load balancing and starts/stops. In order to obtainreliable data a sufficiently long period was selected to ensure theconditions represented a stable period of plant operation.
The test data were collected for following operating conditions:
1. The CCGT plant operating at MER. This is also known and MCR(maximum commercial rating).
2. A Cold Start.3. A Hot Start.4. A step change.5. A period of modulated power output.
Each data groupwas analysed for the efficiency of operation, thefuel used per MWh, the CO2 produced per MWh and the NOxemitted mg/m3. It should be noted that the unit ‘t’ used below is formetric tonnes.
Let
Gf $ Energy in gas flow (GJ)Gt $ Total gas energy consumed over test period (GJ)Po $ Power Output (MWh)Pt $ Total Power Output (MWh)Ce $ Carbon Dioxide emitted (t) in metric tonnesCa $ Average Carbon Dioxide emitted during test period (t/MWh)Ct $ Total carbon Dioxide emitted over period (t) in metrictonnesT $ test period (hrs)No $ Nitrogen oxides emitted (mg/m3)Nt $ Average NOx emitted during test period (mg/m3)Then Total Gas flow over test period is given by
Gt $Xt$ T
t$0Gf %GJ& (1)
Total power output
Pt $Xt$ T
t$0Po %MWh& (2)
Energy used per MWh during test period,
Pa $ Gt=Pt %GJ=MWh& (3)
The total CO2 emitted during the period (Ct) in metric tonnes (t)
Ct $Xt$ T
t$0Ce %t& (4)
and the CO2 emitted per MWh generated (Ca)
Ca $ Ct=Pt %t=MWh& (5)
Fig. 1. A schematic of the CCGT plant.
Number of GT 2GT power rating 280 MWST 320 MW
R.J. Bass et al. / Energy 36 (2011) 1956e1965 1959
All the following tests were carried out using data collectedfrom an 800 MW CCGT plant (hereafter known as Plant C), whichis connected to the UK electricity grid system. It is supplied withnatural gas from the national gas transmission system. It shouldbe noted that each test represents a separate period of operationsof Plant C. The data was extracted from the CCGT plant onoccasions when the market demand and the operation of theplant was such that it met the test conditions we wished toexamine namely, Hot Start, Cold Start, Constant Output (at MER),Load Step Change and two occasions when the power deliveredby the plant was modulated between 100% of full load and 50%full load.
The observations were made during January 2005 and April2005 when access to the plant was granted. As the plant was oftenrequired to change output before a stable period of operation couldbe said to exist, the datawas selected when the plant demonstratedthe characteristic being investigated e.g., Step Change. The ambientconditions during the test werewinter conditions in the UK. Duringthe months in question the mean temperature was 5.7 "C.
6. Results
6.1. Operating at maximum economical rating (MER)
The first test was used to establish the optimum operating casefor this power plant (MER). A period of constant operation at fullload was selected. The gas flow, electrical output from each alter-nator and emission levels of NOx mg/m3, and CO2 t/MWh wererecorded.
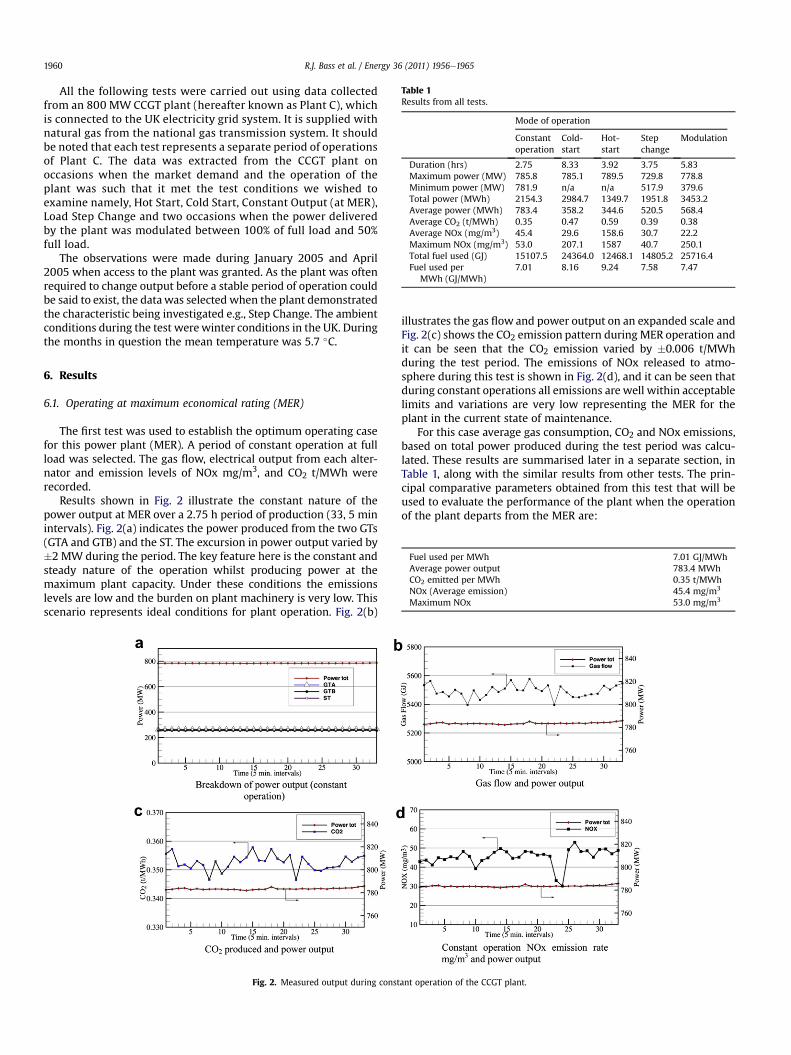
Results shown in Fig. 2 illustrate the constant nature of thepower output at MER over a 2.75 h period of production (33, 5 minintervals). Fig. 2(a) indicates the power produced from the two GTs(GTA and GTB) and the ST. The excursion in power output varied by#2 MW during the period. The key feature here is the constant andsteady nature of the operation whilst producing power at themaximum plant capacity. Under these conditions the emissionslevels are low and the burden on plant machinery is very low. Thisscenario represents ideal conditions for plant operation. Fig. 2(b)
illustrates the gas flow and power output on an expanded scale andFig. 2(c) shows the CO2 emission pattern during MER operation andit can be seen that the CO2 emission varied by #0.006 t/MWhduring the test period. The emissions of NOx released to atmo-sphere during this test is shown in Fig. 2(d), and it can be seen thatduring constant operations all emissions are well within acceptablelimits and variations are very low representing the MER for theplant in the current state of maintenance.
For this case average gas consumption, CO2 and NOx emissions,based on total power produced during the test period was calcu-lated. These results are summarised later in a separate section, inTable 1, along with the similar results from other tests. The prin-cipal comparative parameters obtained from this test that will beused to evaluate the performance of the plant when the operationof the plant departs from the MER are:
Fig. 2. Measured output during constant operation of the CCGT plant.
Table 1Results from all tests.
Mode of operation
Constantoperation
Cold-start
Hot-start
Stepchange
Modulation
Duration (hrs) 2.75 8.33 3.92 3.75 5.83Maximum power (MW) 785.8 785.1 789.5 729.8 778.8Minimum power (MW) 781.9 n/a n/a 517.9 379.6Total power (MWh) 2154.3 2984.7 1349.7 1951.8 3453.2Average power (MWh) 783.4 358.2 344.6 520.5 568.4Average CO2 (t/MWh) 0.35 0.47 0.59 0.39 0.38Average NOx (mg/m3) 45.4 29.6 158.6 30.7 22.2Maximum NOx (mg/m3) 53.0 207.1 1587 40.7 250.1Total fuel used (GJ) 15107.5 24364.0 12468.1 14805.2 25716.4Fuel used per
MWh (GJ/MWh)7.01 8.16 9.24 7.58 7.47
Fuel used per MWh 7.01 GJ/MWhAverage power output 783.4 MWhCO2 emitted per MWh 0.35 t/MWhNOx (Average emission) 45.4 mg/m3
Maximum NOx 53.0 mg/m3
R.J. Bass et al. / Energy 36 (2011) 1956e19651960
6.2. Cold-start operation
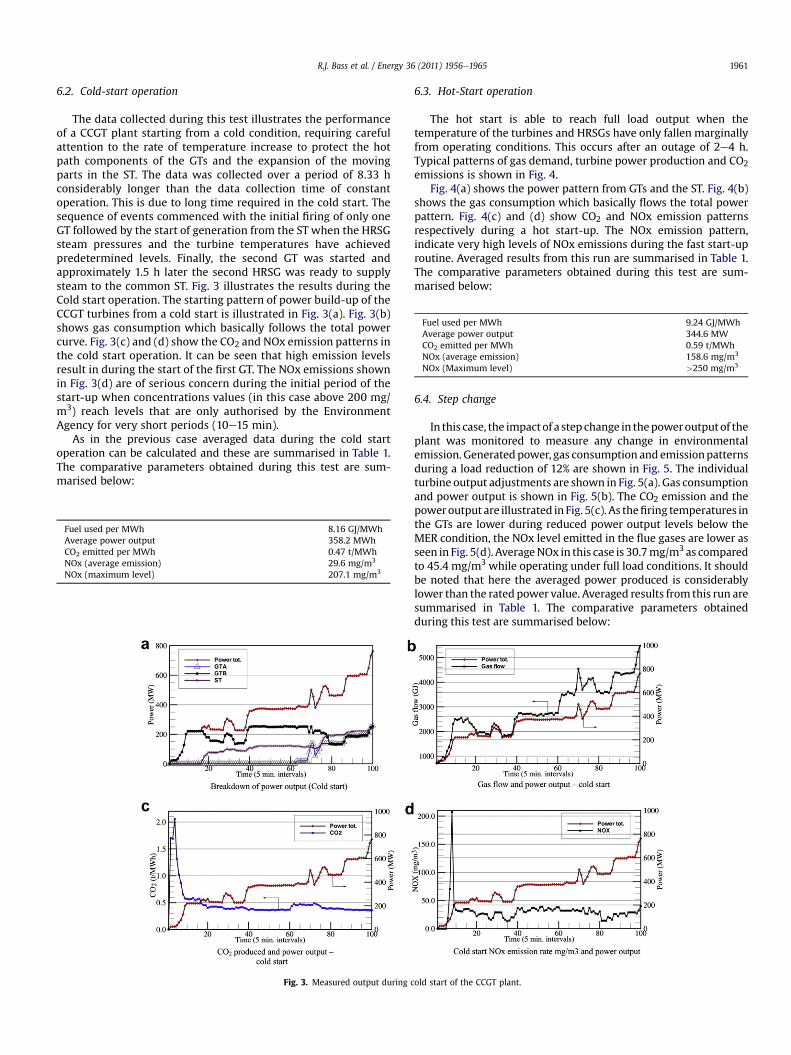
The data collected during this test illustrates the performanceof a CCGT plant starting from a cold condition, requiring carefulattention to the rate of temperature increase to protect the hotpath components of the GTs and the expansion of the movingparts in the ST. The data was collected over a period of 8.33 hconsiderably longer than the data collection time of constantoperation. This is due to long time required in the cold start. Thesequence of events commenced with the initial firing of only oneGT followed by the start of generation from the ST when the HRSGsteam pressures and the turbine temperatures have achievedpredetermined levels. Finally, the second GT was started andapproximately 1.5 h later the second HRSG was ready to supplysteam to the common ST. Fig. 3 illustrates the results during theCold start operation. The starting pattern of power build-up of theCCGT turbines from a cold start is illustrated in Fig. 3(a). Fig. 3(b)shows gas consumption which basically follows the total powercurve. Fig. 3(c) and (d) show the CO2 and NOx emission patterns inthe cold start operation. It can be seen that high emission levelsresult in during the start of the first GT. The NOx emissions shownin Fig. 3(d) are of serious concern during the initial period of thestart-up when concentrations values (in this case above 200 mg/m3) reach levels that are only authorised by the EnvironmentAgency for very short periods (10e15 min).
As in the previous case averaged data during the cold startoperation can be calculated and these are summarised in Table 1.The comparative parameters obtained during this test are sum-marised below:
6.3. Hot-Start operation
The hot start is able to reach full load output when thetemperature of the turbines and HRSGs have only fallen marginallyfrom operating conditions. This occurs after an outage of 2e4 h.Typical patterns of gas demand, turbine power production and CO2emissions is shown in Fig. 4.
Fig. 4(a) shows the power pattern from GTs and the ST. Fig. 4(b)shows the gas consumption which basically flows the total powerpattern. Fig. 4(c) and (d) show CO2 and NOx emission patternsrespectively during a hot start-up. The NOx emission pattern,indicate very high levels of NOx emissions during the fast start-uproutine. Averaged results from this run are summarised in Table 1.The comparative parameters obtained during this test are sum-marised below:
6.4. Step change
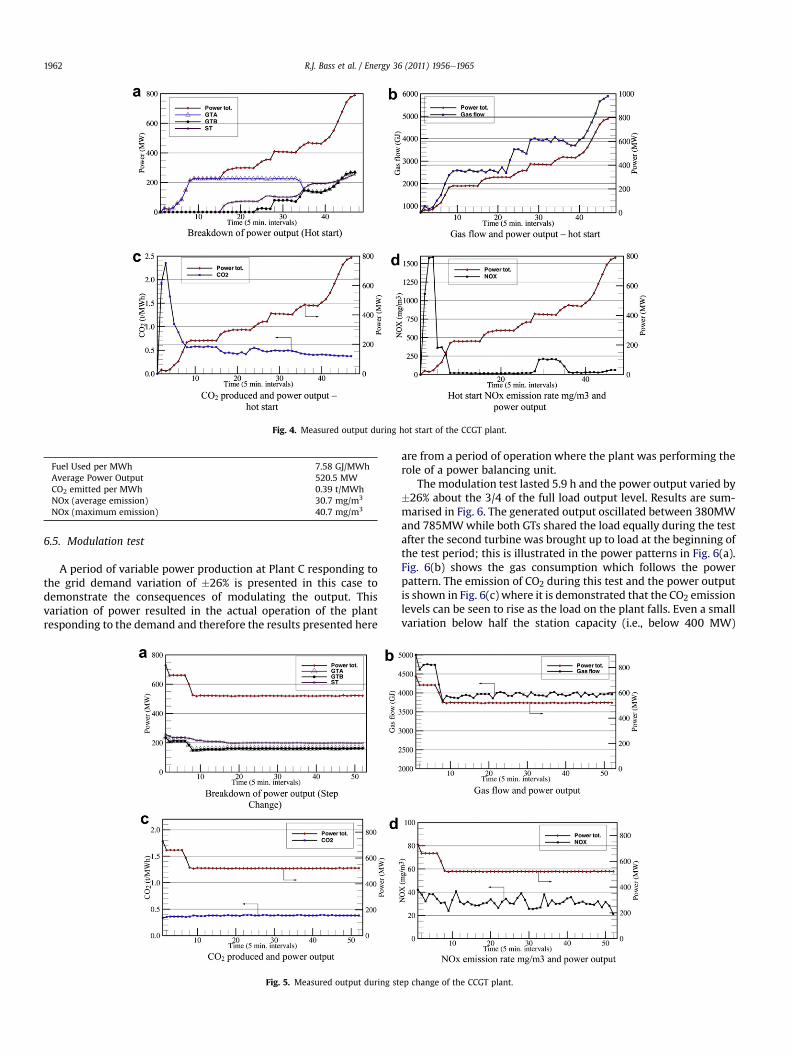
In this case, the impactof a step change in thepoweroutputof theplant was monitored to measure any change in environmentalemission. Generatedpower, gas consumption and emissionpatternsduring a load reduction of 12% are shown in Fig. 5. The individualturbine output adjustments are shown in Fig. 5(a). Gas consumptionand power output is shown in Fig. 5(b). The CO2 emission and thepoweroutput are illustrated in Fig. 5(c). As thefiring temperatures inthe GTs are lower during reduced power output levels below theMER condition, the NOx level emitted in the flue gases are lower asseen in Fig. 5(d). AverageNOx in this case is 30.7mg/m3 as comparedto 45.4 mg/m3 while operating under full load conditions. It shouldbe noted that here the averaged power produced is considerablylower than the rated power value. Averaged results from this run aresummarised in Table 1. The comparative parameters obtainedduring this test are summarised below:
Fig. 3. Measured output during cold start of the CCGT plant.
Fuel used per MWh 8.16 GJ/MWhAverage power output 358.2 MWhCO2 emitted per MWh 0.47 t/MWhNOx (average emission) 29.6 mg/m3
NOx (maximum level) 207.1 mg/m3
Fuel used per MWh 9.24 GJ/MWhAverage power output 344.6 MWCO2 emitted per MWh 0.59 t/MWhNOx (average emission) 158.6 mg/m3
NOx (Maximum level) >250 mg/m3
R.J. Bass et al. / Energy 36 (2011) 1956e1965 1961
6.5. Modulation test
A period of variable power production at Plant C responding tothe grid demand variation of #26% is presented in this case todemonstrate the consequences of modulating the output. Thisvariation of power resulted in the actual operation of the plantresponding to the demand and therefore the results presented here
are from a period of operation where the plant was performing therole of a power balancing unit.
The modulation test lasted 5.9 h and the power output varied by#26% about the 3/4 of the full load output level. Results are sum-marised in Fig. 6. The generated output oscillated between 380MWand 785MWwhile both GTs shared the load equally during the testafter the second turbine was brought up to load at the beginning ofthe test period; this is illustrated in the power patterns in Fig. 6(a).Fig. 6(b) shows the gas consumption which follows the powerpattern. The emission of CO2 during this test and the power outputis shown in Fig. 6(c) where it is demonstrated that the CO2 emissionlevels can be seen to rise as the load on the plant falls. Even a smallvariation below half the station capacity (i.e., below 400 MW)
Fig. 4. Measured output during hot start of the CCGT plant.
Fig. 5. Measured output during step change of the CCGT plant.
Fuel Used per MWh 7.58 GJ/MWhAverage Power Output 520.5 MWCO2 emitted per MWh 0.39 t/MWhNOx (average emission) 30.7 mg/m3
NOx (maximum emission) 40.7 mg/m3
R.J. Bass et al. / Energy 36 (2011) 1956e19651962
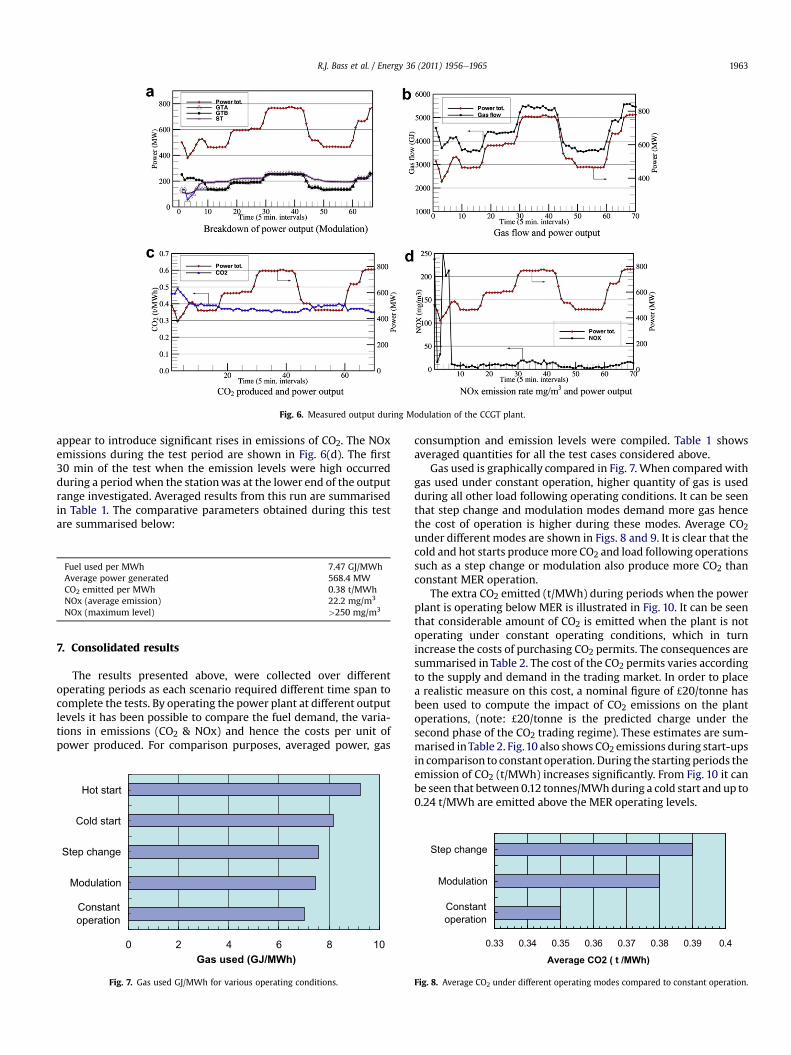
appear to introduce significant rises in emissions of CO2. The NOxemissions during the test period are shown in Fig. 6(d). The first30 min of the test when the emission levels were high occurredduring a period when the stationwas at the lower end of the outputrange investigated. Averaged results from this run are summarisedin Table 1. The comparative parameters obtained during this testare summarised below:
7. Consolidated results
The results presented above, were collected over differentoperating periods as each scenario required different time span tocomplete the tests. By operating the power plant at different outputlevels it has been possible to compare the fuel demand, the varia-tions in emissions (CO2 & NOx) and hence the costs per unit ofpower produced. For comparison purposes, averaged power, gas
consumption and emission levels were compiled. Table 1 showsaveraged quantities for all the test cases considered above.
Gas used is graphically compared in Fig. 7. When compared withgas used under constant operation, higher quantity of gas is usedduring all other load following operating conditions. It can be seenthat step change and modulation modes demand more gas hencethe cost of operation is higher during these modes. Average CO2under different modes are shown in Figs. 8 and 9. It is clear that thecold and hot starts producemore CO2 and load following operationssuch as a step change or modulation also produce more CO2 thanconstant MER operation.
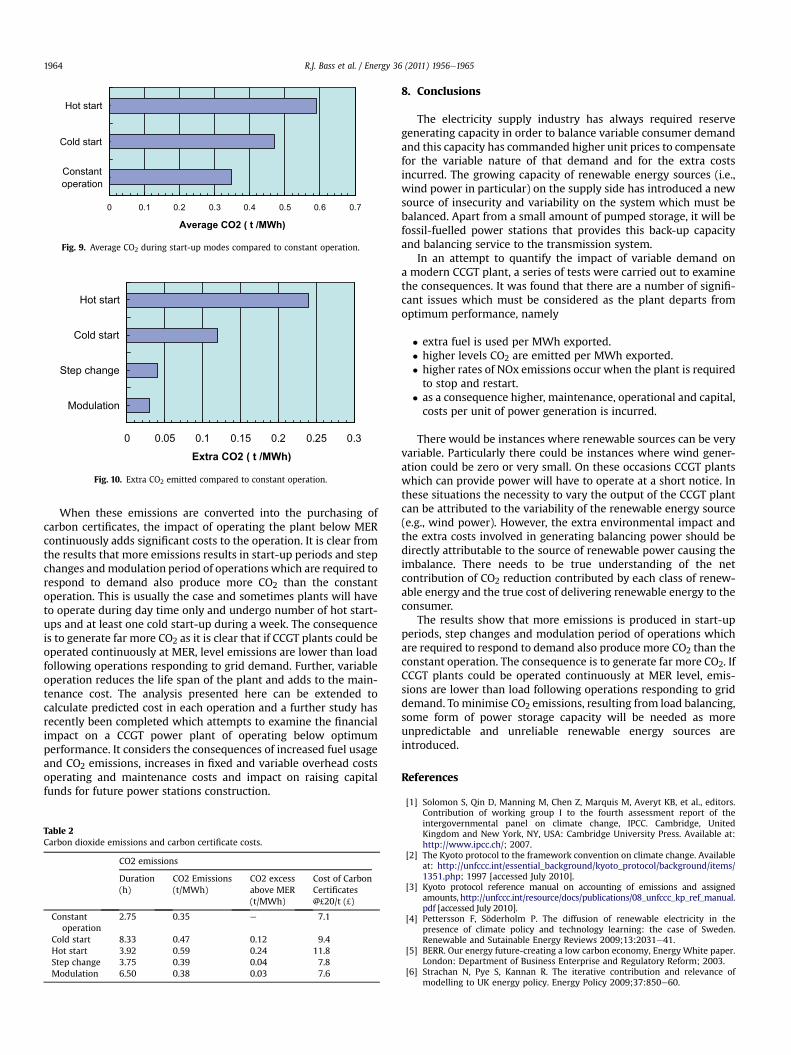
The extra CO2 emitted (t/MWh) during periods when the powerplant is operating below MER is illustrated in Fig. 10. It can be seenthat considerable amount of CO2 is emitted when the plant is notoperating under constant operating conditions, which in turnincrease the costs of purchasing CO2 permits. The consequences aresummarised in Table 2. The cost of the CO2 permits varies accordingto the supply and demand in the trading market. In order to placea realistic measure on this cost, a nominal figure of £20/tonne hasbeen used to compute the impact of CO2 emissions on the plantoperations, (note: £20/tonne is the predicted charge under thesecond phase of the CO2 trading regime). These estimates are sum-marised inTable 2. Fig.10 also shows CO2 emissions during start-upsin comparison to constant operation. During the starting periods theemission of CO2 (t/MWh) increases significantly. From Fig. 10 it canbe seen that between 0.12 tonnes/MWhduring a cold start and up to0.24 t/MWh are emitted above the MER operating levels.
Fig. 6. Measured output during Modulation of the CCGT plant.
0 2 4 6 8 10
Constantoperation
Modulation
Step change
Cold start
Hot start
Gas used (GJ/MWh)
Fig. 7. Gas used GJ/MWh for various operating conditions.
Fuel used per MWh 7.47 GJ/MWhAverage power generated 568.4 MWCO2 emitted per MWh 0.38 t/MWhNOx (average emission) 22.2 mg/m3
NOx (maximum level) >250 mg/m3
0.33 0.34 0.35 0.36 0.37 0.38 0.39 0.4
Constantoperation
Modulation
Step change
Average CO2 ( t /MWh)
Fig. 8. Average CO2 under different operating modes compared to constant operation.
R.J. Bass et al. / Energy 36 (2011) 1956e1965 1963
When these emissions are converted into the purchasing ofcarbon certificates, the impact of operating the plant below MERcontinuously adds significant costs to the operation. It is clear fromthe results that more emissions results in start-up periods and stepchanges andmodulation period of operations which are required torespond to demand also produce more CO2 than the constantoperation. This is usually the case and sometimes plants will haveto operate during day time only and undergo number of hot start-ups and at least one cold start-up during a week. The consequenceis to generate far more CO2 as it is clear that if CCGT plants could beoperated continuously at MER, level emissions are lower than loadfollowing operations responding to grid demand. Further, variableoperation reduces the life span of the plant and adds to the main-tenance cost. The analysis presented here can be extended tocalculate predicted cost in each operation and a further study hasrecently been completed which attempts to examine the financialimpact on a CCGT power plant of operating below optimumperformance. It considers the consequences of increased fuel usageand CO2 emissions, increases in fixed and variable overhead costsoperating and maintenance costs and impact on raising capitalfunds for future power stations construction.
8. Conclusions
The electricity supply industry has always required reservegenerating capacity in order to balance variable consumer demandand this capacity has commanded higher unit prices to compensatefor the variable nature of that demand and for the extra costsincurred. The growing capacity of renewable energy sources (i.e.,wind power in particular) on the supply side has introduced a newsource of insecurity and variability on the system which must bebalanced. Apart from a small amount of pumped storage, it will befossil-fuelled power stations that provides this back-up capacityand balancing service to the transmission system.
In an attempt to quantify the impact of variable demand ona modern CCGT plant, a series of tests were carried out to examinethe consequences. It was found that there are a number of signifi-cant issues which must be considered as the plant departs fromoptimum performance, namely
' extra fuel is used per MWh exported.' higher levels CO2 are emitted per MWh exported.' higher rates of NOx emissions occur when the plant is requiredto stop and restart.
' as a consequence higher, maintenance, operational and capital,costs per unit of power generation is incurred.
There would be instances where renewable sources can be veryvariable. Particularly there could be instances where wind gener-ation could be zero or very small. On these occasions CCGT plantswhich can provide power will have to operate at a short notice. Inthese situations the necessity to vary the output of the CCGT plantcan be attributed to the variability of the renewable energy source(e.g., wind power). However, the extra environmental impact andthe extra costs involved in generating balancing power should bedirectly attributable to the source of renewable power causing theimbalance. There needs to be true understanding of the netcontribution of CO2 reduction contributed by each class of renew-able energy and the true cost of delivering renewable energy to theconsumer.
The results show that more emissions is produced in start-upperiods, step changes and modulation period of operations whichare required to respond to demand also produce more CO2 than theconstant operation. The consequence is to generate far more CO2. IfCCGT plants could be operated continuously at MER level, emis-sions are lower than load following operations responding to griddemand. To minimise CO2 emissions, resulting from load balancing,some form of power storage capacity will be needed as moreunpredictable and unreliable renewable energy sources areintroduced.
References
[1] Solomon S, Qin D, Manning M, Chen Z, Marquis M, Averyt KB, et al., editors.Contribution of working group I to the fourth assessment report of theintergovernmental panel on climate change, IPCC. Cambridge, UnitedKingdom and New York, NY, USA: Cambridge University Press. Available at:http://www.ipcc.ch/; 2007.
[2] The Kyoto protocol to the framework convention on climate change. Availableat: http://unfccc.int/essential_background/kyoto_protocol/background/items/1351.php; 1997 [accessed July 2010].
[3] Kyoto protocol reference manual on accounting of emissions and assignedamounts, http://unfccc.int/resource/docs/publications/08_unfccc_kp_ref_manual.pdf [accessed July 2010].
[4] Pettersson F, Söderholm P. The diffusion of renewable electricity in thepresence of climate policy and technology learning: the case of Sweden.Renewable and Sutainable Energy Reviews 2009;13:2031e41.
[5] BERR. Our energy future-creating a low carbon economy, Energy White paper.London: Department of Business Enterprise and Regulatory Reform; 2003.
[6] Strachan N, Pye S, Kannan R. The iterative contribution and relevance ofmodelling to UK energy policy. Energy Policy 2009;37:850e60.
0 0.1 0.2 0.3 0.4 0.5 0.6 0.7
Constantoperation
Cold start
Hot start
Average CO2 ( t /MWh)
Fig. 9. Average CO2 during start-up modes compared to constant operation.
0 0.05 0.1 0.15 0.2 0.25 0.3
Modulation
Step change
Cold start
Hot start
Extra CO2 ( t /MWh)
Fig. 10. Extra CO2 emitted compared to constant operation.
Table 2Carbon dioxide emissions and carbon certificate costs.
CO2 emissions
Duration(h)
CO2 Emissions(t/MWh)
CO2 excessabove MER(t/MWh)
Cost of CarbonCertificates@£20/t (£)
Constantoperation
2.75 0.35 e 7.1
Cold start 8.33 0.47 0.12 9.4Hot start 3.92 0.59 0.24 11.8Step change 3.75 0.39 0.04 7.8Modulation 6.50 0.38 0.03 7.6
R.J. Bass et al. / Energy 36 (2011) 1956e19651964

[7] 2050 pathways analysis report, http://www.decc.gov.uk/en/content/cms/what_we_do/lc_uk/2050/2050.aspx [accessed July 2010].
[8] Rethinking 2050, A 100% renewable energy vision for the European Union.Brussels, Belgium: European Renewable Energy Council; April 2010.
[9] Laird FN, Stefes C. The diverging paths of German and United States policiesfor renewable energy: sources of difference. Energy Policy 2009;37:2619e29.
[10] BERR. Meeting the energy challenge: a white paper on energy policy, May2007. Department of Trade and Industry, http://www.berr.gov.uk/files/file39387.pdf; 2007 [accessed July 2010].
[11] The role of nuclear power in a low carbon UK economy, consultation docu-ment. UK: Department of Trade and Industry, http://www.berr.gov.uk/files/file39197.pdf; May 2007 [accessed July 2010].
[12] Østergaard PA. Reviewing optimisation criteria for energy systems analysis ofrenewable integration. Energy 2009;34:1236e45.
[13] Mamlook R, Akash BA, Mohsan MS. A neuro-fuzzy program approach forevaluating electric generation systems. Energy 2001;26:619e32.
[14] Ekonomou L. Greek long-term energy consumption prediction using artificialneural networks. Energy 2010;35:512e7.
[15] Chen F, Duic N, Alves LM, Carvalho MG. RenewislandsdRenewable energysolutions for islands. Renewable and Sustainable Energy Reviews2007;11:1888e902.
[16] He K, Lei Y, Pan X, Zhang Y, Zhang Q, Chen D. Co-benefits from energy policiesin China. Energy 2009, in press, doi:10.1016/j.energy.2008.07.021.
[17] Parikh KS, Karandikar V, Rana A, Dani P. Projecting India’s energy require-ments for policy formulation. Energy 2009;34:928e41.
[18] Ulutas BH. Determination of the appropriate energy policy for Turkey. Energy2005;30:1146e61.
[19] Al-Mofleh A, Taib S, Mujeebu MA, Salah W. Analysis of sectoral energyconservation in Malaysia. Energy 2009;34:733e9.
[20] Streimikiene D. The role of nuclear energy in Lithuania under various post-Kyoto climate change mitigation regimes. Energy 2008;33:1005e14.
[21] Schenk NJ, Moll HC, Potting J, Benders RMJ. Wind energy, electricity andhydrogen in the Netherlands. Energy 2007;32:1960e71.
[22] Dui!c N, Lerer M, Carvalho MG. Increasing the supply of renewable energysources in island energy systems. International Journal of Sustainable Energy2003;23(4):177e86.
[23] Jacobson MZ, Delucchi MA. A path to sustainable energy by 2030. ScientificAmerican Nov 2009;301(5):58e65.
[24] Lund H. Renewable energy strategies for sustainable development. Energy2007;32:912e9.
[25] Silveira JL, de Carvalho Jr A, de Castro Villela IA. Combined cycle versus onethousand diesel power plants; pollutants emissions, ecological efficiency andeconomic analysis. Renewable andSustainable EnergyReviews 2007;11:524e35.
[26] UK national grid data, http://www.nationalgrid.com/uk/Electricity/Data/Demand!Data/ [accessed Oct 2009].
[27] Boyle G. Renewable energy. 2nd ed. Oxford University Press; 2004.[28] Electricity Act 1989, http://www.opsi.gov.uk/ACTS/acts1989/ukpga_198900
29_en_1 [accessed October 2009].[29] Sims Ralph EH, Rogner Hans-Holger, Gregory K. Carbon emission and miti-
gation cost comparisons between fossil fuel, nuclear and renewable energyresources for electricity generation. Energy Policy 2003;31:1315e26.
[30] Saravanamuttoo HIH, Rogers GFC, Cohen H, Straznicky P. Gas turbine theory.6th ed. Pearson Education Limited; 2009.
[31] Bass RJ. The Potential Benefits of Strategically Located Energy Storage and theIntegration of Power from Renewable Sources, Ph.D. Thesis, LoughboroughUniversity; 2008.
[32] UK national grid code, http://www.nationalgrid.com/uk/Electricity/Codes/gridcode/gridcodedocs/ [accessed October 2009].
R.J. Bass et al. / Energy 36 (2011) 1956e1965 1965