Embed Size (px)
Citation preview
Science Approach Document:
Ecological Risk Classification of Inorganic Substances
Environment and Climate Change Canada
Updated January 2020
Synopsis
Environment and Climate Change Canada (ECCC) has characterized inorganic substances from the third phase of the Chemicals Management Plan (CMP) for their potential to cause ecological harm. The ecological risk classification of inorganic substances (ERC-I) was applied to a broad group of inorganic substances. These substances either met the categorization criteria under subsection 73(1) of the Canadian Environmental Protection Act, 1999 (CEPA) or were considered a priority on the basis of other human health concerns.
This updated Science Approach Document presents the ERC-I approach and the results of its application only to inorganic substances identified as having a low level of ecological concern. Inorganic substances not identified as being of low ecological concern by the ERC-I approach will be subject to a more refined analysis in other publications. A period of consultation on the Science Approach Document was provided in advance of the use of this information in screening assessments to allow the public to comment and provide additional information. Publication of the ERC-I approach and its results in this updated Science Approach Document will assist the government in addressing substances in a more efficient manner.
The ERC-I involved the use of empirical, measured, and modelled data to classify inorganic substances as warranting further evaluation of their potential to cause harm to the environment or as having a low likelihood of causing ecological harm. Preliminary predicted no-effect concentrations (PNEC) were identified or derived to characterize hazard. The preliminary PNECs derived for ERC-I, while providing an adequately conservative basis for ecological risk classification, are not intended to be used for other purposes. Predictive models using input from multiple sources and water quality monitoring data from federal and provincial programs were used to characterize exposure and identify predicted environmental concentrations (PECs). Risk quotients comparing PECs to PNECs were calculated, and multiple statistical metrics were applied to derive preliminary classifications for both predictive modelling and water quality monitoring. A risk matrix was used to assign a low, moderate or high classification of potential ecological concern for each substance or group on the basis of the outcome of the modelling and monitoring profiles. Inorganic substances classified as having high ecological concern were generally those characterized as having larger and more frequent PECs exceeding the PNECs. Substances classified as being of low ecological concern would generally be associated with smaller magnitude and infrequent, if any, PECs exceeding the PNECs in both modelled and measured datasets.
Considering inherent hazard properties, current use patterns and quantities in commerce, as well as the analysis of water quality monitoring datasets, 80 substances were classified as being of low ecological concern. Substances that were classified as being of low ecological concern primarily on the basis of current low exposures may be subject to follow-up or tracking of use pattern information to inform future priority-setting.

Science Approach Document - ERC-Inorganics
Table of Contents
Synopsis ......................................................................................................................... i Introduction ............................................................................................................... 3
Basis of approach to ecological risk classification of inorganic substances ..... 4
Data collection and generation ................................................................................ 7
Profiling ...................................................................................................................... 9
Hazard profiling ................................................................................................... 9
4.1.1 Previous risk assessments ....................................................................... 9
4.1.2 Established water quality guidelines ....................................................... 11
4.1.3 Deriving new PNECs .............................................................................. 11
Exposure profiling .............................................................................................. 12
4.2.1 Background ranges ................................................................................. 12
4.2.2 Predictive modelling: quantities in commerce ......................................... 13
4.2.3 Predictive modelling: National Pollutant Release Inventory .................... 14
4.2.4 Water quality monitoring ......................................................................... 15
Preliminary classification ....................................................................................... 16
Risk classification criteria ................................................................................... 17
5.1.1 Predictive modelling classification .......................................................... 17
5.1.2 Water quality monitoring classification .................................................... 19
Combined risk classification .................................................................................. 21
Ecological risk classification results ..................................................................... 21
Assessment of risk classification uncertainty ..................................................... 22
Conclusion ............................................................................................................... 23
References ................................................................................................................... 25
Appendix A. Exposure data availability for substances classified as being of low ecological concern by the ERC-I approach. .............................................................. 29
Appendix B. Summary of local exposure screening scenarios .............................. 34
Appendix C. Substances classified as being of low ecological concern ............... 36
List of Tables and Figures
Figure 2-1. Framework for the ecological risk classification of inorganic substances (ERC-I) .......................................................... Error! Bookmark not defined.
Table 3-1. Summary of federal and provincial water quality monitoring programs and repositories informing the ERC-I approach .................................................... 8
Table 4-1. Alignment with previous hazard assessments .............................................. 10
Table 4-2. Alignment with established water quality guidelines ..................................... 11
Table 4-3. Derivation of aquatic PNEC values .............................................................. 12
Table 4-4. ERC-I substances and groups reportable to the NPRI ................................. 15
Table 5-1. Predictive modelling results for ERC-I substances and groups .................... 17
Table 5-2. Metrics for individual water quality monitoring datasets ............................... 19
Science Approach Document - ERC-Inorganics
Table 5-3. Classifying individual monitoring datasets .................................................... 19
Table 6-1. Risk matrix according to modelling and monitoring classifications ............... 21
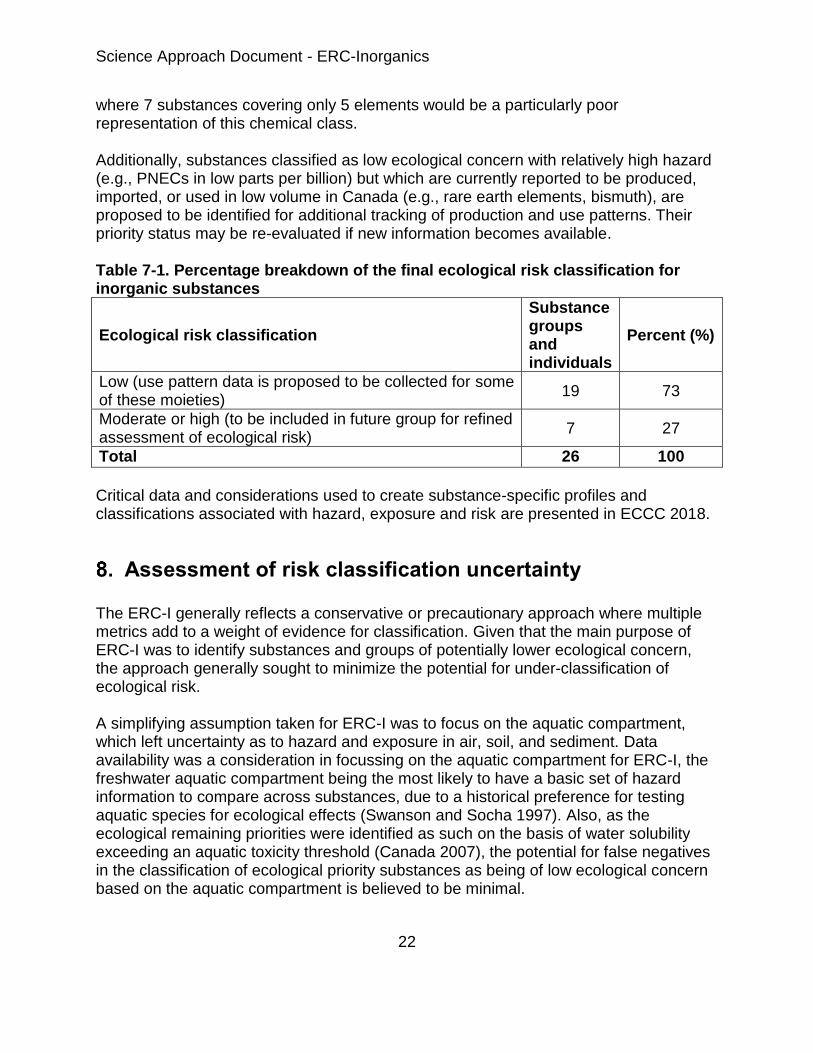
Table 7-1. Percentage breakdown of the final ecological risk classification for inorganic substances................................................................................................... 22
Table B-1. Parameters used in near-field scenario........................................................ 34
Science Approach Document - ERC-Inorganics
3
Introduction
Following categorization of substances on the Domestic Substances List (DSL), which was completed in 2006, approximately 4 300 of the 23 000 substances on the DSL were identified for additional assessment activity. These substances met the categorization criteria for persistence or bioaccumulation and inherent toxicity to human or non-human organisms or for greatest potential for exposure to humans under subsection 73(1) of Canadian Environmental Protection Act, 1999 (CEPA) (Canada 1999) or were identified as having health effects of concern based on classifications by other national or international agencies for carcinogenicity, genotoxicity, developmental toxicity or reproductive toxicity. The ecological risk classification of inorganic substances (ERC-I) approach described in this report was applied broadly to inorganic substances identified as remaining priorities for the third phase of the Chemicals Management Plan (CMP). However, this report presents detailed results only for the 80 substances that were classified by ERC-I as being of low ecological concern (hereafter referred to as “ERC-I substances”). Substances classified as being of moderate or high ecological concern will undergo further assessment of ecological considerations in other publications. Although the classifications apply to individual Chemical Abstracts Service Registry Numbers (CAS RN1), many of the 80 substances discussed in this report have been further sub-grouped on the basis of common inorganic moieties2 of potential concern.
The purpose of this Science Approach Document was to give stakeholders and the public the opportunity to review and comment on the ERC-I approach and the results of its application to the substances classified as being of low ecological concern prior to the use of these results—in conjunction with any other relevant information that becomes available after the publication of the Science Approach Document—as the basis for conclusions of screening assessments to be published under section 68 or 74 of CEPA. The publication of the scientific approach and results in the updated Science Approach Document will assist the government in addressing substances that may be of low concern to either human health or to the environment in a more efficient manner and identifies substances of relatively higher concern that require more detailed evaluation.
The ERC-I approach includes consideration of information on ecological hazards, uses and exposure. The ERC-I was applied using data collected during DSL categorization, through information submitted in response to surveys issued pursuant to CEPA section 71 noticest, and from federal and provincial water quality monitoring programs, the
1 The Chemical Abstracts Service Registry Number (CAS RN) is the property of the American Chemical Society, and
any use or redistribution, except as required in supporting regulatory requirements and/or for reports to the Government of Canada when the information and the reports are required by law or administrative policy, is not permitted without the prior written permission of the American Chemical Society.
2 For the purpose of this document, “moiety” signifies a part of a molecule. A moiety is a discrete chemical entity, identified from a parent compound or its transformation products, that is expected to have toxicological significance.
Science Approach Document - ERC-Inorganics
4
National Pollutant Release Inventory (NPRI), and other sources. The approach involved the use of empirical, measured, and modelled data to identify the relative likelihood of substances to cause ecological harm. Preliminary PNECs were compared to PECs from predictive modelling approaches using input from several data sources as well as water quality monitoring data from federal and provincial programs. Risk quotients were calculated, and multiple statistical metrics were applied to derive preliminary classifications for predictive modelling and water quality monitoring. These preliminary classifications were combined to reach the overall ecological risk classification for each substance.
Engineered nanomaterial forms of these substances were not explicitly considered in the exposure scenarios of the ERC-I approach. While measured concentrations in the environment could include engineered nanomaterial forms of these substances, engineered nanomaterial forms may be subject to separate assessment considering their unique properties.
This approach focusses on information critical to determining whether or not a substance is likely to cause ecological harm. For the 80 substances identified by ERC-I as having a low likelihood of causing ecological harm, these results are intended to form the basis for the ecological portion of the screening assessments that will be published in conjunction with the assessment of potential human health risks. The basis of the classification pertaining to some of the substances in ERC-I may be subsequently updated and new data considered as part of future assessments.
This document was prepared by staff in the CEPA Risk Assessment Program at Environment and Climate Change Canada and incorporates input from other programs within the department. The document has undergone external written peer review and consultation. Comments on the technical portions of the document were received from Dr. Peter Campbell (Institut national de la recherche scientifique, INRS), Mr. Geoff Granville (GCGranville Consulting Corp.), Dr. Carrie Rickwood (Natural Resources Canada), and Dr. Kevin Wilkinson (Université de Montréal). Additionally, the draft of this screening assessment (published May 4, 2018) was subject to a 60-day public comment period. While external comments were taken into consideration, the final content and outcome of the report remain the responsibility of Environment and Climate Change Canada.
Basis of approach to ecological risk classification of inorganic substances
The ERC-I is a risk-based approach that employs multiple metrics for both hazard and exposure in a weighted consideration of multiple lines of evidence. A simplifying assumption for hazard and exposure characterization in ERC-I is a focus on the aquatic compartment. Hazard characterization was based on a survey of past domestic and international assessment predicted no-effect concentrations (PNECs) and water quality
Science Approach Document - ERC-Inorganics
5
guidelines for inorganic moieties. When no PNEC or water quality guideline was found, hazard endpoint data were collected and, depending on data availability, either a species sensitivity distribution (SSD) or an assessment factor (AF) approach was taken to derive a preliminary PNEC (section 4.1). PNECs for individual remaining priority substances were based on the PNEC identified for the related inorganic moiety.
Exposure profiling considered two approaches: predictive modelling (sections 4.2.2 and 4.2.3) and measured concentrations (section 4.2.4). For predictive modelling, a generic near-field exposure model was used to generate predicted environmental concentrations (PECs) with input data from the NPRI, information submitted in response to surveys issued pursuant to CEPA section 71 notices, Canada Border Services Agency (CBSA) import data, and third-party market research reports. For measured concentrations, an analysis of measured environmental concentrations for inorganic moieties collected by federal and provincial water quality monitoring programs and the Environmental Effects Monitoring (EEM) Program was conducted. Monitoring datasets for inorganic moieties were used as a conservative estimate of the exposure to individual inorganic substances in the aquatic environment.
Risk quotients (RQ) were calculated by comparing modelled and measured PECs to the PNECs identified during hazard profiling. Multiple statistical metrics were used to classify the potential for ecological risk, considering the magnitude and frequency of observing PNEC exceedances (i.e., RQ greater than 1) and their spatial and temporal distributions. Detection frequency and the natural background ranges (section 4.2.1) were also taken into account in the analysis of measured data. The various lines of evidence were then compared to decision criteria to identify the relative ecological risk of substances and preliminary results for the low ecological concern substances are presented in section 5. This approach reduces the overall uncertainty with risk classification compared to one that relies on a single metric for classification.
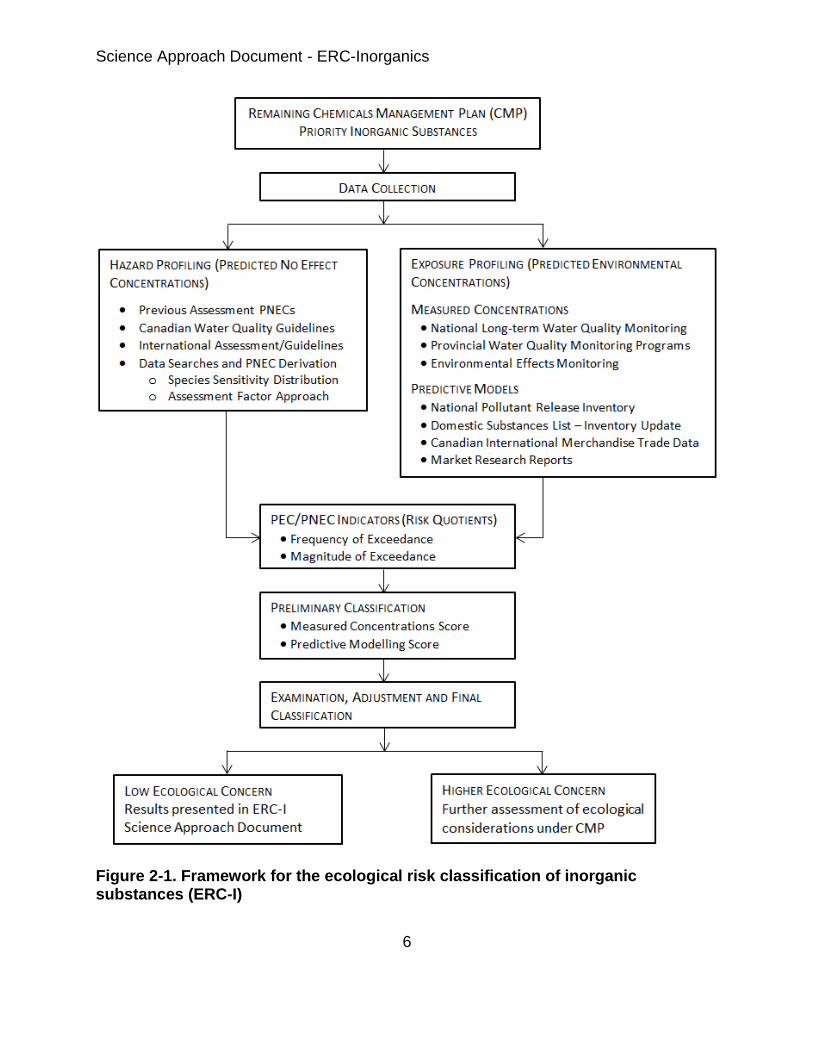
The conceptual model for ERC-I is illustrated in Figure 2.1. The preliminary classifications for modelling and monitoring were examined and were adjusted according to specific rules and use of judgement. The final results of ERC-I are then discussed (section 7), along with a summary of uncertainties (section 8).
Critical data and considerations used to create profiles and classifications associated with hazard, exposure and risk are presented in ECCC 2018.
Science Approach Document - ERC-Inorganics
6
Figure 2-1. Framework for the ecological risk classification of inorganic substances (ERC-I)
Science Approach Document - ERC-Inorganics
7
Data collection and generation
Substance identity information from past assessment activities was updated with available scientific literature and databases such as National Chemical Inventories (NCI 2015) and SciFinder (2016). For substances with unknown or variable composition, complex reaction products, or biological materials (UVCBs), a chemical structure was chosen to represent the substance. Representative chemical structures to represent an entire UVCB substance (e.g., where variation of the UVCB components was predictable) were selected in a conservative manner by potentially overestimating the percentage weight of the inorganic moiety within the UVCB substance. These percentage weights were subsequently used in predictive modelling calculations.
Ecological hazard information was first collected through a review of recent domestic and international risk assessments. Water quality guidelines, standards and criteria of Canadian federal and provincial governments and other jurisdictions were also considered as ecological hazard data sources where these were available for substances or groups. A comprehensive literature search was conducted for specific substance groups (Ba, Li, Te, Ti, Tl) (Nautilus Environmental 2016), and targeted searches of the ECOTOX database (2016) and European Chemicals Agency (ECHA) registration dossiers (2016) were conducted for substances in the ERC-I approach. In the absence of more recent information, the assumptions used in the 2006 categorization of the DSL were also considered (Canada 2007).
Chemical import and manufacture volumes in Canada and associated use information were collected from information submitted in response to surveys issued pursuant to CEPA section 71 notices for the reporting years 2008 and 2011, respectively (Canada 2009; Canada 2012). For substances where this information was unavailable, trade merchandise data were obtained as direct or surrogate import quantities in Canada. Confidential data to the 10-digit level of the Harmonized System (HS) code were obtained for the years 2010 to 2013 (CBSA 2016). HS 10-digit code descriptions were evaluated for their relationship to ERC-I substances. For example, there is a high correlation between the HS code 2849.20.000, “Silicon carbide,” and the remaining priority silicon carbide (CAS RN 409-21-2), and the trade data was taken as direct import quantity for this substance. In another example, data for the HS code 2827.60.1000, “Manganous iodide; potassium iodide; sodium iodide,” was taken as a conservative surrogate import quantity, as only potassium iodide (CAS RN 7681-11-0) and sodium iodide (CAS RN 7681-82-5) are remaining priority substances. The Canadian International Merchandise Trade (CIMT) online database, which provides summary data to the HS 6-digit level, was consulted to see if there were significant changes to import quantities in more recent years (CIMT 2016). Where a substance was not included in a CEPA section 71 notice, third party market research reports were also obtained as a source of import, manufacture, and use information in Canada (CEH 2014a; CEH 2014b; CEH 2016; MRC 2016).
Science Approach Document - ERC-Inorganics
8
While import, manufacture, and use information for substances were collected for the purpose of modelling releases to the aquatic environment, reported release data were also available from the NPRI for certain substances or groups of substances (e.g., lithium carbonate and antimony and its compounds) (NPRI 2016). NPRI data for groups of substances (e.g., antimony and its compounds) were conservatively considered applicable to subsets that are remaining priorities (e.g., 11 antimony-containing substances).
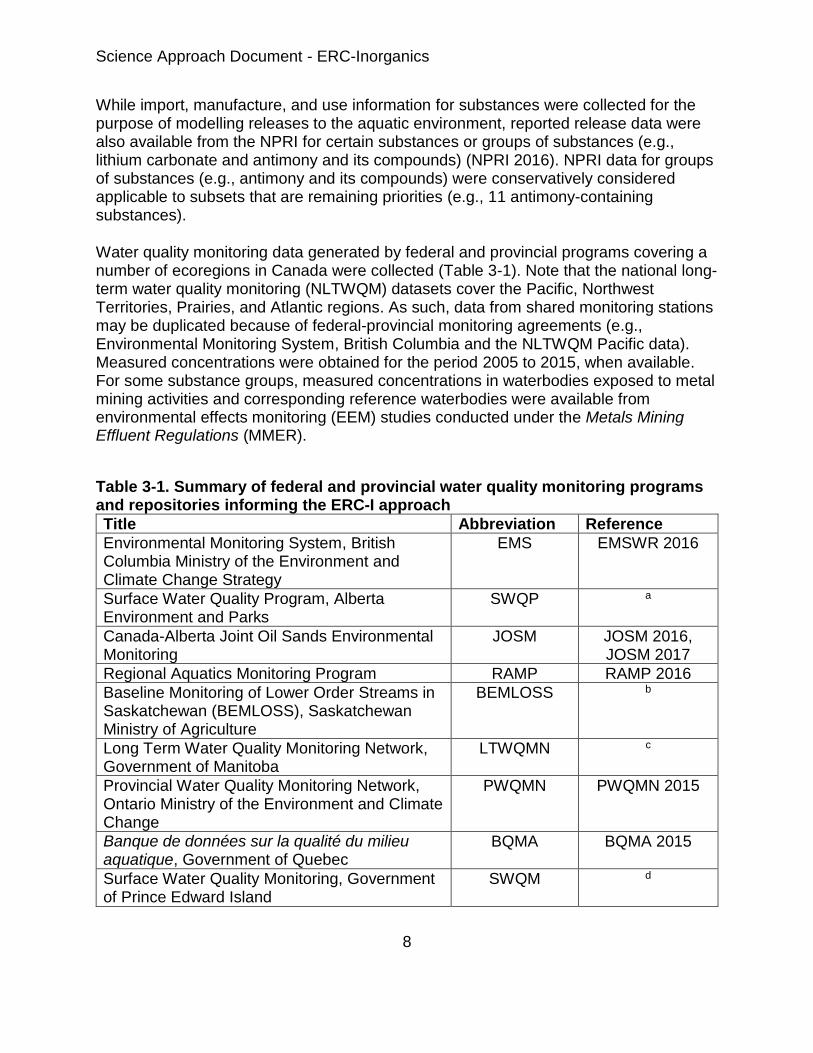
Water quality monitoring data generated by federal and provincial programs covering a number of ecoregions in Canada were collected (Table 3-1). Note that the national long-term water quality monitoring (NLTWQM) datasets cover the Pacific, Northwest Territories, Prairies, and Atlantic regions. As such, data from shared monitoring stations may be duplicated because of federal-provincial monitoring agreements (e.g., Environmental Monitoring System, British Columbia and the NLTWQM Pacific data). Measured concentrations were obtained for the period 2005 to 2015, when available. For some substance groups, measured concentrations in waterbodies exposed to metal mining activities and corresponding reference waterbodies were available from environmental effects monitoring (EEM) studies conducted under the Metals Mining Effluent Regulations (MMER).
Table 3-1. Summary of federal and provincial water quality monitoring programs and repositories informing the ERC-I approach
Title Abbreviation Reference
Environmental Monitoring System, British Columbia Ministry of the Environment and Climate Change Strategy
EMS EMSWR 2016
Surface Water Quality Program, Alberta Environment and Parks
SWQP a
Canada-Alberta Joint Oil Sands Environmental Monitoring
JOSM JOSM 2016, JOSM 2017
Regional Aquatics Monitoring Program RAMP RAMP 2016
Baseline Monitoring of Lower Order Streams in Saskatchewan (BEMLOSS), Saskatchewan Ministry of Agriculture
BEMLOSS b
Long Term Water Quality Monitoring Network, Government of Manitoba
LTWQMN c
Provincial Water Quality Monitoring Network, Ontario Ministry of the Environment and Climate Change
PWQMN PWQMN 2015
Banque de données sur la qualité du milieu aquatique, Government of Quebec
BQMA BQMA 2015
Surface Water Quality Monitoring, Government of Prince Edward Island
SWQM d
Science Approach Document - ERC-Inorganics
9
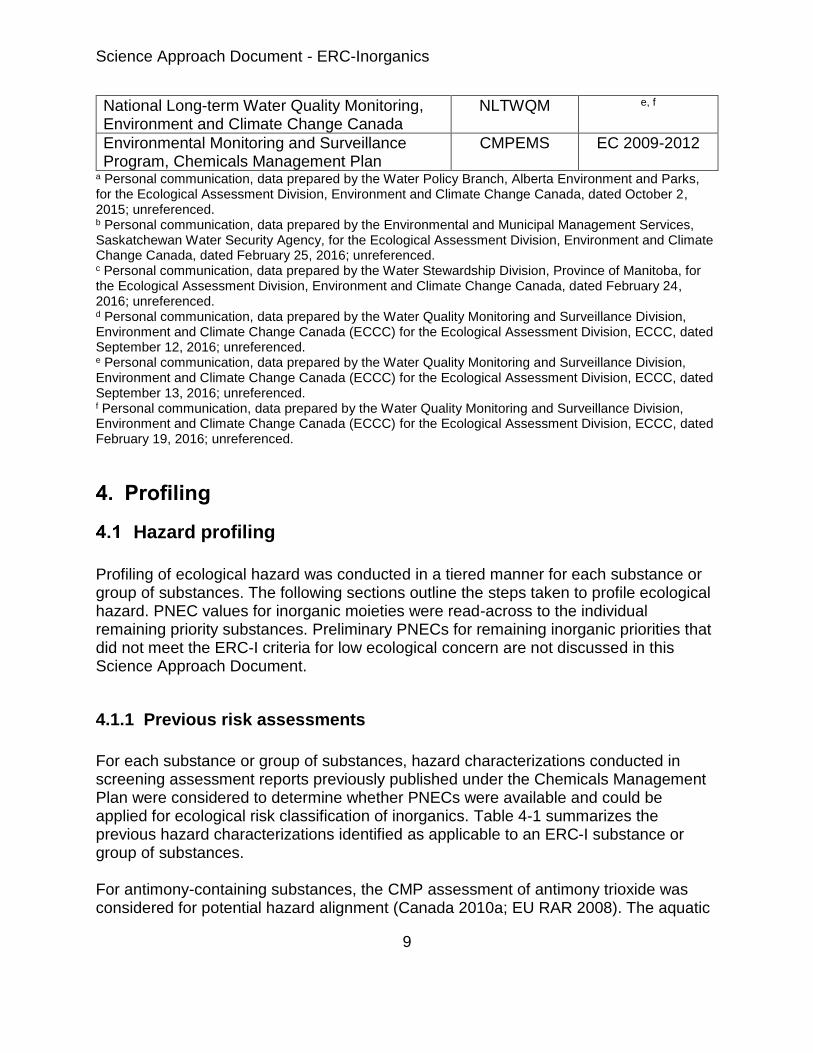
National Long-term Water Quality Monitoring, Environment and Climate Change Canada
NLTWQM e, f
Environmental Monitoring and Surveillance Program, Chemicals Management Plan
CMPEMS EC 2009-2012
a Personal communication, data prepared by the Water Policy Branch, Alberta Environment and Parks, for the Ecological Assessment Division, Environment and Climate Change Canada, dated October 2, 2015; unreferenced. b Personal communication, data prepared by the Environmental and Municipal Management Services, Saskatchewan Water Security Agency, for the Ecological Assessment Division, Environment and Climate Change Canada, dated February 25, 2016; unreferenced. c Personal communication, data prepared by the Water Stewardship Division, Province of Manitoba, for the Ecological Assessment Division, Environment and Climate Change Canada, dated February 24, 2016; unreferenced. d Personal communication, data prepared by the Water Quality Monitoring and Surveillance Division, Environment and Climate Change Canada (ECCC) for the Ecological Assessment Division, ECCC, dated September 12, 2016; unreferenced. e Personal communication, data prepared by the Water Quality Monitoring and Surveillance Division, Environment and Climate Change Canada (ECCC) for the Ecological Assessment Division, ECCC, dated September 13, 2016; unreferenced. f Personal communication, data prepared by the Water Quality Monitoring and Surveillance Division, Environment and Climate Change Canada (ECCC) for the Ecological Assessment Division, ECCC, dated February 19, 2016; unreferenced.
Profiling
Hazard profiling
Profiling of ecological hazard was conducted in a tiered manner for each substance or group of substances. The following sections outline the steps taken to profile ecological hazard. PNEC values for inorganic moieties were read-across to the individual remaining priority substances. Preliminary PNECs for remaining inorganic priorities that did not meet the ERC-I criteria for low ecological concern are not discussed in this Science Approach Document.
4.1.1 Previous risk assessments
For each substance or group of substances, hazard characterizations conducted in screening assessment reports previously published under the Chemicals Management Plan were considered to determine whether PNECs were available and could be applied for ecological risk classification of inorganics. Table 4-1 summarizes the previous hazard characterizations identified as applicable to an ERC-I substance or group of substances. For antimony-containing substances, the CMP assessment of antimony trioxide was considered for potential hazard alignment (Canada 2010a; EU RAR 2008). The aquatic
Science Approach Document - ERC-Inorganics
10
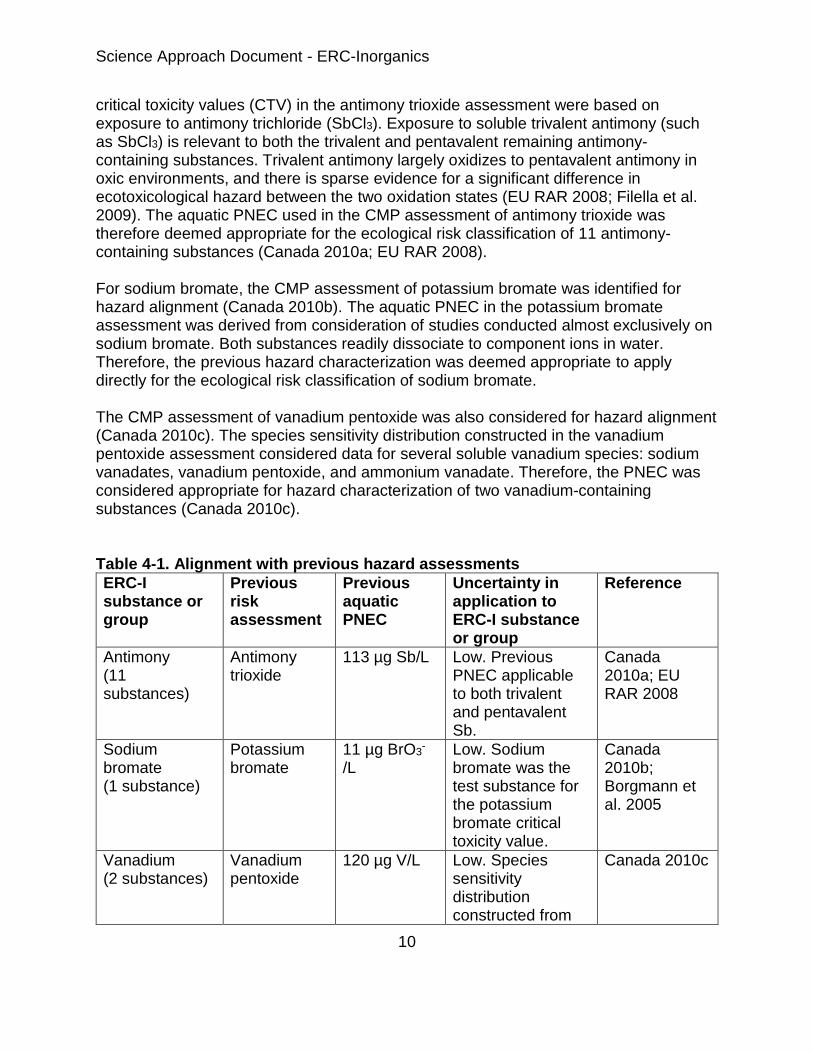
critical toxicity values (CTV) in the antimony trioxide assessment were based on exposure to antimony trichloride (SbCl3). Exposure to soluble trivalent antimony (such as SbCl3) is relevant to both the trivalent and pentavalent remaining antimony-containing substances. Trivalent antimony largely oxidizes to pentavalent antimony in oxic environments, and there is sparse evidence for a significant difference in ecotoxicological hazard between the two oxidation states (EU RAR 2008; Filella et al. 2009). The aquatic PNEC used in the CMP assessment of antimony trioxide was therefore deemed appropriate for the ecological risk classification of 11 antimony-containing substances (Canada 2010a; EU RAR 2008). For sodium bromate, the CMP assessment of potassium bromate was identified for hazard alignment (Canada 2010b). The aquatic PNEC in the potassium bromate assessment was derived from consideration of studies conducted almost exclusively on sodium bromate. Both substances readily dissociate to component ions in water. Therefore, the previous hazard characterization was deemed appropriate to apply directly for the ecological risk classification of sodium bromate. The CMP assessment of vanadium pentoxide was also considered for hazard alignment (Canada 2010c). The species sensitivity distribution constructed in the vanadium pentoxide assessment considered data for several soluble vanadium species: sodium vanadates, vanadium pentoxide, and ammonium vanadate. Therefore, the PNEC was considered appropriate for hazard characterization of two vanadium-containing substances (Canada 2010c). Table 4-1. Alignment with previous hazard assessments
ERC-I substance or group
Previous risk assessment
Previous aquatic PNEC
Uncertainty in application to ERC-I substance or group
Reference
Antimony (11 substances)
Antimony trioxide
113 µg Sb/L Low. Previous PNEC applicable to both trivalent and pentavalent Sb.
Canada 2010a; EU RAR 2008
Sodium bromate (1 substance)
Potassium bromate
11 µg BrO3-
/L Low. Sodium bromate was the test substance for the potassium bromate critical toxicity value.
Canada 2010b; Borgmann et al. 2005
Vanadium (2 substances)
Vanadium pentoxide
120 µg V/L Low. Species sensitivity distribution constructed from
Canada 2010c
Science Approach Document - ERC-Inorganics
11
multiple pentavalent vanadium species.
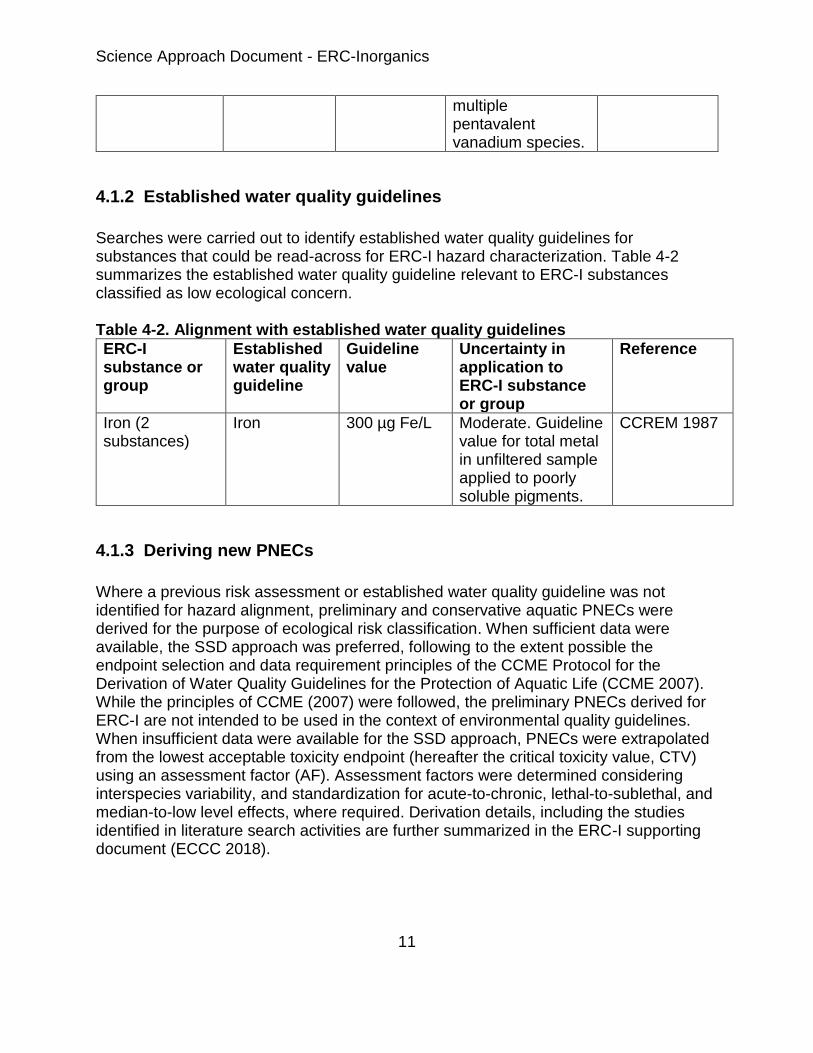
4.1.2 Established water quality guidelines
Searches were carried out to identify established water quality guidelines for substances that could be read-across for ERC-I hazard characterization. Table 4-2 summarizes the established water quality guideline relevant to ERC-I substances classified as low ecological concern. Table 4-2. Alignment with established water quality guidelines
ERC-I substance or group
Established water quality guideline
Guideline value
Uncertainty in application to ERC-I substance or group
Reference
Iron (2 substances)
Iron 300 µg Fe/L Moderate. Guideline value for total metal in unfiltered sample applied to poorly soluble pigments.
CCREM 1987
4.1.3 Deriving new PNECs
Where a previous risk assessment or established water quality guideline was not identified for hazard alignment, preliminary and conservative aquatic PNECs were derived for the purpose of ecological risk classification. When sufficient data were available, the SSD approach was preferred, following to the extent possible the endpoint selection and data requirement principles of the CCME Protocol for the Derivation of Water Quality Guidelines for the Protection of Aquatic Life (CCME 2007). While the principles of CCME (2007) were followed, the preliminary PNECs derived for ERC-I are not intended to be used in the context of environmental quality guidelines. When insufficient data were available for the SSD approach, PNECs were extrapolated from the lowest acceptable toxicity endpoint (hereafter the critical toxicity value, CTV) using an assessment factor (AF). Assessment factors were determined considering interspecies variability, and standardization for acute-to-chronic, lethal-to-sublethal, and median-to-low level effects, where required. Derivation details, including the studies identified in literature search activities are further summarized in the ERC-I supporting document (ECCC 2018).
Science Approach Document - ERC-Inorganics
12
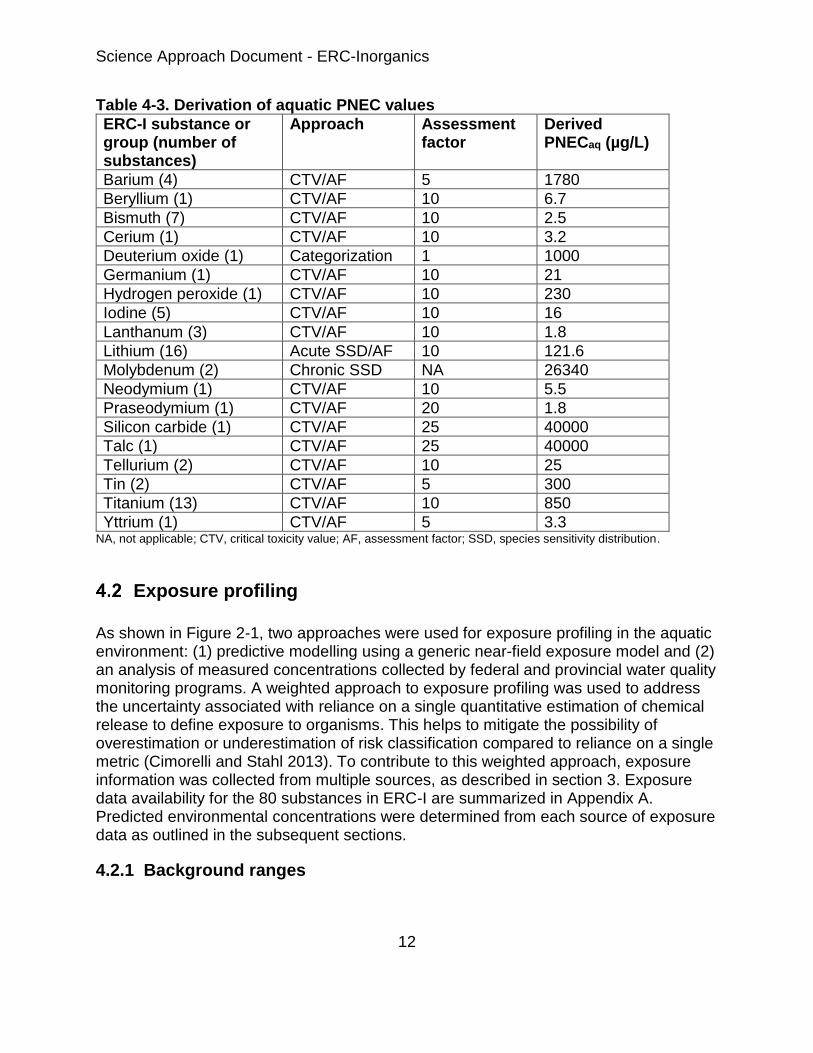
Table 4-3. Derivation of aquatic PNEC values
ERC-I substance or group (number of substances)
Approach Assessment factor
Derived PNECaq (µg/L)
Barium (4) CTV/AF 5 1780
Beryllium (1) CTV/AF 10 6.7
Bismuth (7) CTV/AF 10 2.5
Cerium (1) CTV/AF 10 3.2
Deuterium oxide (1) Categorization 1 1000
Germanium (1) CTV/AF 10 21
Hydrogen peroxide (1) CTV/AF 10 230
Iodine (5) CTV/AF 10 16
Lanthanum (3) CTV/AF 10 1.8
Lithium (16) Acute SSD/AF 10 121.6
Molybdenum (2) Chronic SSD NA 26340
Neodymium (1) CTV/AF 10 5.5
Praseodymium (1) CTV/AF 20 1.8
Silicon carbide (1) CTV/AF 25 40000
Talc (1) CTV/AF 25 40000
Tellurium (2) CTV/AF 10 25
Tin (2) CTV/AF 5 300
Titanium (13) CTV/AF 10 850
Yttrium (1) CTV/AF 5 3.3 NA, not applicable; CTV, critical toxicity value; AF, assessment factor; SSD, species sensitivity distribution.
Exposure profiling
As shown in Figure 2-1, two approaches were used for exposure profiling in the aquatic environment: (1) predictive modelling using a generic near-field exposure model and (2) an analysis of measured concentrations collected by federal and provincial water quality monitoring programs. A weighted approach to exposure profiling was used to address the uncertainty associated with reliance on a single quantitative estimation of chemical release to define exposure to organisms. This helps to mitigate the possibility of overestimation or underestimation of risk classification compared to reliance on a single metric (Cimorelli and Stahl 2013). To contribute to this weighted approach, exposure information was collected from multiple sources, as described in section 3. Exposure data availability for the 80 substances in ERC-I are summarized in Appendix A. Predicted environmental concentrations were determined from each source of exposure data as outlined in the subsequent sections.
4.2.1 Background ranges
Science Approach Document - ERC-Inorganics
13
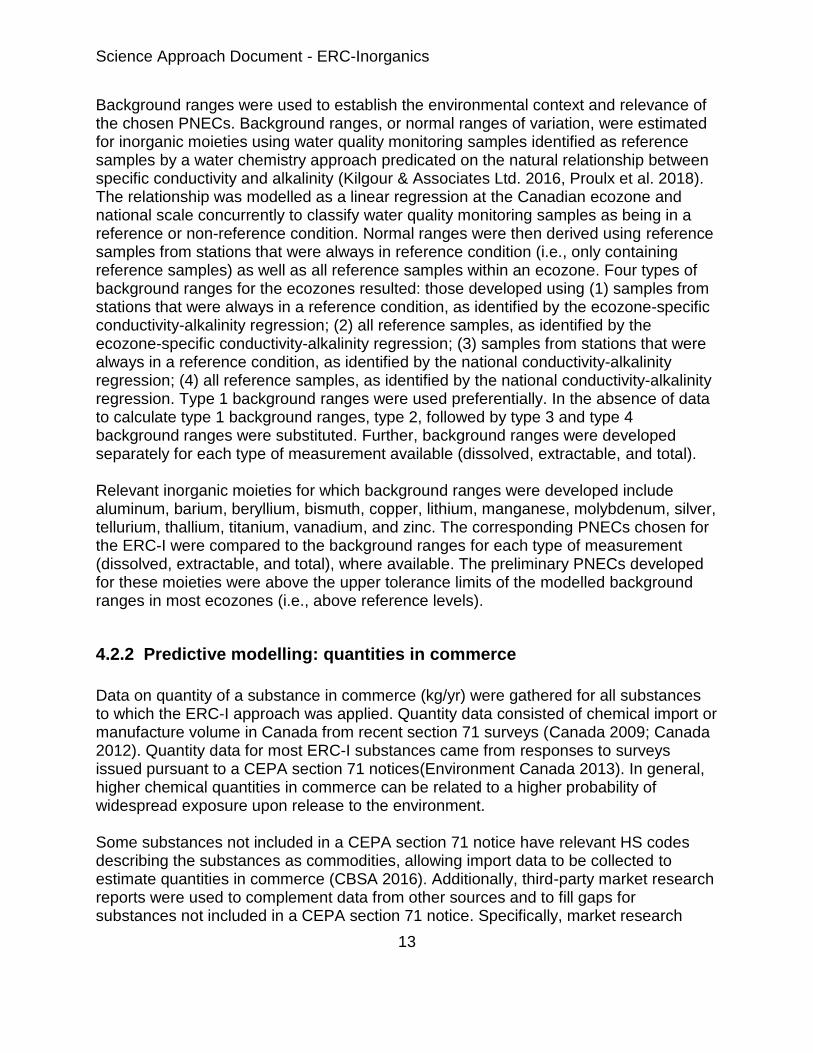
Background ranges were used to establish the environmental context and relevance of the chosen PNECs. Background ranges, or normal ranges of variation, were estimated for inorganic moieties using water quality monitoring samples identified as reference samples by a water chemistry approach predicated on the natural relationship between specific conductivity and alkalinity (Kilgour & Associates Ltd. 2016, Proulx et al. 2018). The relationship was modelled as a linear regression at the Canadian ecozone and national scale concurrently to classify water quality monitoring samples as being in a reference or non-reference condition. Normal ranges were then derived using reference samples from stations that were always in reference condition (i.e., only containing reference samples) as well as all reference samples within an ecozone. Four types of background ranges for the ecozones resulted: those developed using (1) samples from stations that were always in a reference condition, as identified by the ecozone-specific conductivity-alkalinity regression; (2) all reference samples, as identified by the ecozone-specific conductivity-alkalinity regression; (3) samples from stations that were always in a reference condition, as identified by the national conductivity-alkalinity regression; (4) all reference samples, as identified by the national conductivity-alkalinity regression. Type 1 background ranges were used preferentially. In the absence of data to calculate type 1 background ranges, type 2, followed by type 3 and type 4 background ranges were substituted. Further, background ranges were developed separately for each type of measurement available (dissolved, extractable, and total). Relevant inorganic moieties for which background ranges were developed include aluminum, barium, beryllium, bismuth, copper, lithium, manganese, molybdenum, silver, tellurium, thallium, titanium, vanadium, and zinc. The corresponding PNECs chosen for the ERC-I were compared to the background ranges for each type of measurement (dissolved, extractable, and total), where available. The preliminary PNECs developed for these moieties were above the upper tolerance limits of the modelled background ranges in most ecozones (i.e., above reference levels).
4.2.2 Predictive modelling: quantities in commerce
Data on quantity of a substance in commerce (kg/yr) were gathered for all substances to which the ERC-I approach was applied. Quantity data consisted of chemical import or manufacture volume in Canada from recent section 71 surveys (Canada 2009; Canada 2012). Quantity data for most ERC-I substances came from responses to surveys issued pursuant to a CEPA section 71 notices(Environment Canada 2013). In general, higher chemical quantities in commerce can be related to a higher probability of widespread exposure upon release to the environment. Some substances not included in a CEPA section 71 notice have relevant HS codes describing the substances as commodities, allowing import data to be collected to estimate quantities in commerce (CBSA 2016). Additionally, third-party market research reports were used to complement data from other sources and to fill gaps for substances not included in a CEPA section 71 notice. Specifically, market research
Science Approach Document - ERC-Inorganics
14
reports were obtained for hydrogen peroxide, lithium, and rare earth elements (CEH 2014a; CEH 2014b; CEH 2016; MRC 2016). A near-field risk-based evaluation of all substances was performed to address the higher concentrations that may occur close to the point of discharge of a substance in the aquatic environment. In general, a conservative (precautionary) near-field scenario similar to that used in the rapid screening approach (EC, HC 2013; EC, HC 2014; ECCC, HC 2016) was employed to calculate PECs as described below. The aquatic release scenario for near-field exposure involved applying a generic scenario to estimate local aquatic exposure. The equation and parameters used in this scenario are given in Appendix B. While the generic aquatic exposure scenario has been developed to be conservative overall, the level of conservatism applied to individual parameters was selected to be moderate, since it is recognized that:
a high level of conservatism applied to each parameter can easily compound into an excessively conservative overall exposure scenario;
it is very unlikely that each parameter would be “worst case” at the same time; and
interdependence of some parameters exists. In brief, the scenario estimates exposure (PECs) in the aquatic environment using releases from an assumed, representative industrial facility that is manufacturing or using the substance. From the use codes and North American Industry Classification System (NAICS) codes provided in response to CEPA section 71 surveys, a generic emission factor of 2% (low), 25% (medium) or 100% (high) was assigned to the industrial activity. In order to do so, all use codes and NAICS were rated on the basis of professional judgement for their potential release to water. All undefined codes (U999) were rated manually after reviewing the description provided by the notifier. Assigned emission factors for each of the NAICS and use codes are independent of substance identity and are the same as those used for the ecological risk classification of organic substances (ECCC 2016a). Wastewater removal rates were by default the same value used in the rapid screening approach (EC, HC 2013; EC, HC 2014; ECCC, HC 2016), or they were replaced with median removal rates estimated from CMP Monitoring and Surveillance wastewater influent and effluent data (ECCC 2016b), where available, or with read-across information from other assessments. Refined removal rates were available for the inorganic moieties Bi, Ge, Mo, Sb, and V.
4.2.3 Predictive modelling: National Pollutant Release Inventory
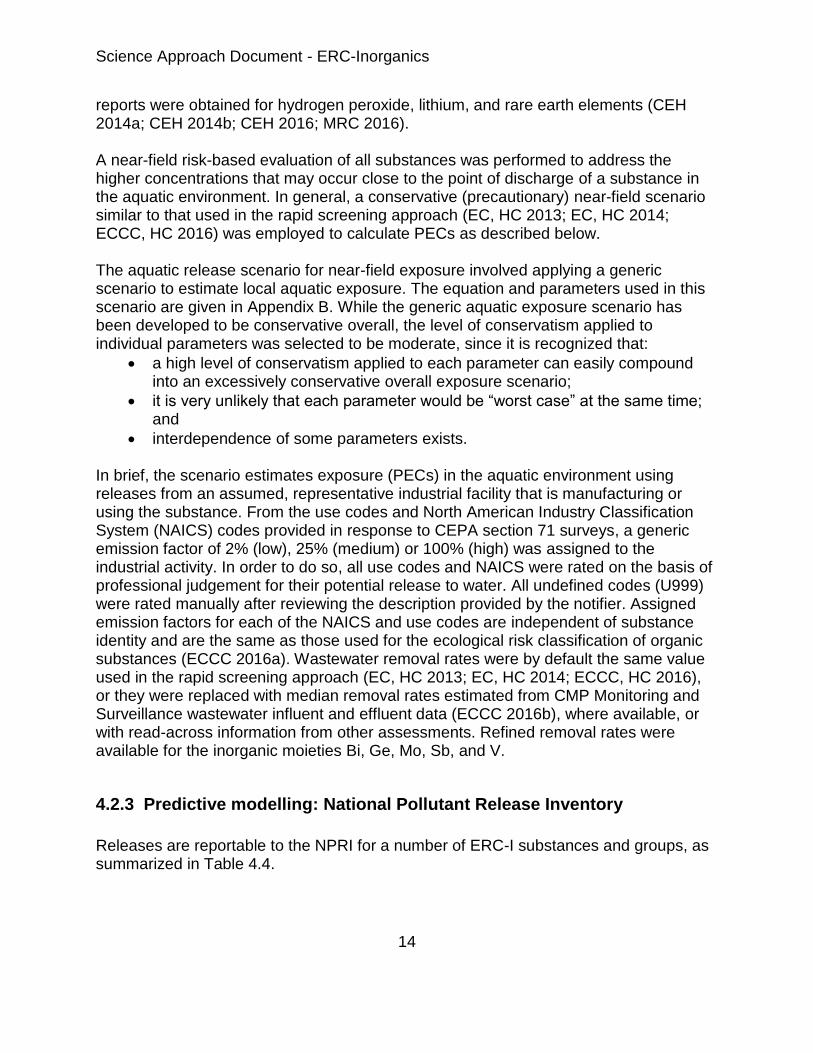
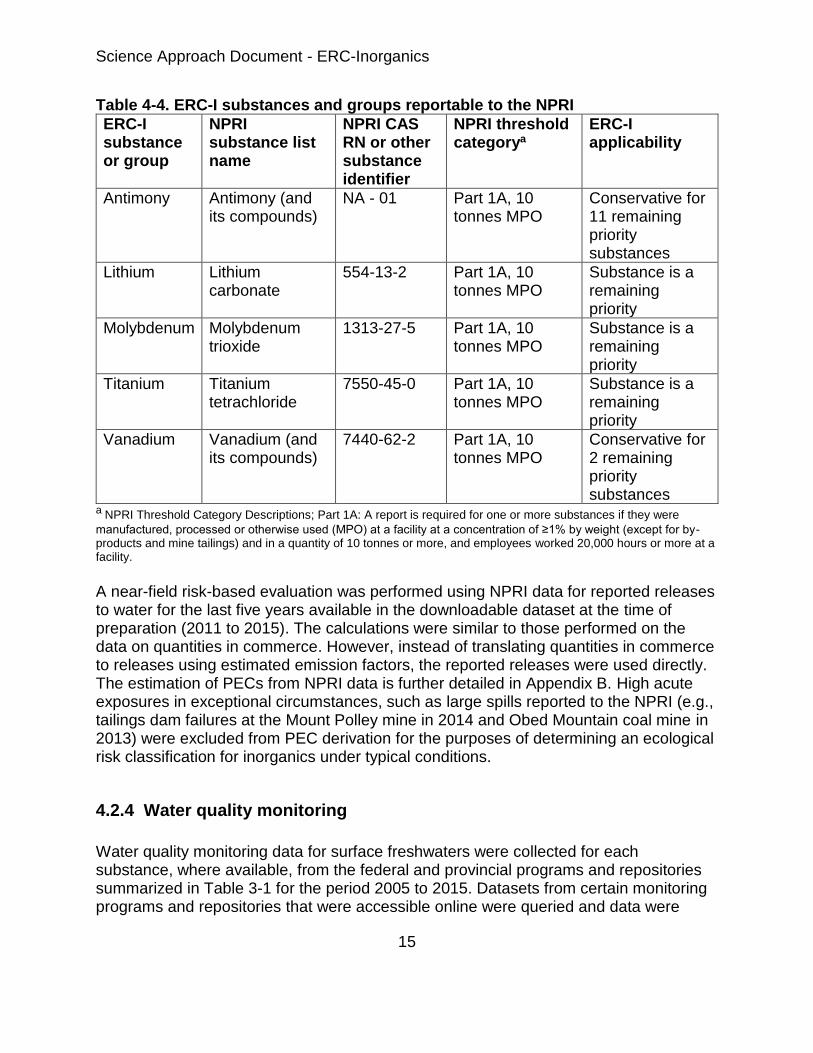
Releases are reportable to the NPRI for a number of ERC-I substances and groups, as summarized in Table 4.4.
Science Approach Document - ERC-Inorganics
15
Table 4-4. ERC-I substances and groups reportable to the NPRI
ERC-I substance or group
NPRI substance list name
NPRI CAS RN or other substance identifier
NPRI threshold categorya
ERC-I applicability
Antimony Antimony (and its compounds)
NA - 01 Part 1A, 10 tonnes MPO
Conservative for 11 remaining priority substances
Lithium Lithium carbonate
554-13-2 Part 1A, 10 tonnes MPO
Substance is a remaining priority
Molybdenum Molybdenum trioxide
1313-27-5 Part 1A, 10 tonnes MPO
Substance is a remaining priority
Titanium Titanium tetrachloride
7550-45-0 Part 1A, 10 tonnes MPO
Substance is a remaining priority
Vanadium Vanadium (and its compounds)
7440-62-2 Part 1A, 10 tonnes MPO
Conservative for 2 remaining priority substances
a NPRI Threshold Category Descriptions; Part 1A: A report is required for one or more substances if they were
manufactured, processed or otherwise used (MPO) at a facility at a concentration of ≥1% by weight (except for by-products and mine tailings) and in a quantity of 10 tonnes or more, and employees worked 20,000 hours or more at a facility.
A near-field risk-based evaluation was performed using NPRI data for reported releases to water for the last five years available in the downloadable dataset at the time of preparation (2011 to 2015). The calculations were similar to those performed on the data on quantities in commerce. However, instead of translating quantities in commerce to releases using estimated emission factors, the reported releases were used directly. The estimation of PECs from NPRI data is further detailed in Appendix B. High acute exposures in exceptional circumstances, such as large spills reported to the NPRI (e.g., tailings dam failures at the Mount Polley mine in 2014 and Obed Mountain coal mine in 2013) were excluded from PEC derivation for the purposes of determining an ecological risk classification for inorganics under typical conditions.
4.2.4 Water quality monitoring
Water quality monitoring data for surface freshwaters were collected for each substance, where available, from the federal and provincial programs and repositories summarized in Table 3-1 for the period 2005 to 2015. Datasets from certain monitoring programs and repositories that were accessible online were queried and data were
Science Approach Document - ERC-Inorganics
16
downloaded directly (EMS, JOSM, RAMP, PWQMN, and BQMA). Datasets from other sources were provided via direct request from program officials (SWQP, BEMLOSS, LTWQMN, SWQM, NLTWQM, and CMPEMS). The federal and provincial programs and repositories included in the ERC-I approach were chosen in order to maximize coverage of the Canadian aquatic environment. These monitoring programs, including those captured by data repositories (e.g., EMS), may not have common mandates (e.g., to monitor waterbodies with shared political boundaries or to monitor waterbodies to gauge watershed health). While monitoring programs may serve different purposes, it appears that the majority of sampling locations were selected to monitor water quality under normal circumstances (i.e., not monitoring contamination from spills). Where available, data from programs monitoring sectors (e.g., EEM from the MMER and wastewater effluent from the CMPEMS) were also included. All datasets were processed individually in the following manner: field blanks, lab blanks, and suspected processing measurements (e.g., effluent measurements) were removed, and all units were converted to µg/L. Non-detects were substituted with half of the corresponding method detection limit (1/2 MDL). This is a standard but potentially over-conservative approach to addressing non-detects in monitoring data, and it still leaves uncertainty in the interpretation of non-detect data. This was considered in developing the profiling metrics and will be discussed further in the uncertainty section.
Preliminary classification Predictive modelling risk quotients were calculated for each theoretical facility from commercial quantity data (section 4.2.2) and for each facility reporting to the NPRI (section 4.2.3) by comparing calculated PECs with the PNECs derived in section 4.1. Measured concentration (section 4.2.4) risk quotients were similarly calculated using the PNECs described in section 4.1. For PNECs that are functions of water quality parameters, paired water quality measurements were used when available, followed by station central tendencies (geomeans for [H+], hardness and dissolved organic carbon), then by provincial central tendencies. All data related to dissolved, extractable, and total measurements of the substances were included for analysis. Through the calculated risk quotients, the hazard and exposure profiles for each inorganic substance were compared to decision criteria in order to assign an ecological risk classification. A qualitative score of low (L), moderate (M), or high (H) was given to each substance to represent lower, moderate, and higher levels of ecological risk potential from both predictive modelling and measured concentrations. These scores were then combined into a final classification. As previously indicated, the ERC-I science approach document only presents results with a final ecological risk
Science Approach Document - ERC-Inorganics
17
classification of “low”. Ecological risks of “not-low” remaining priorities are subject to further evaluation of ecological considerations under the third phase of the CMP.
Risk classification criteria
Ecological risk was classified by considering predictive modelling results from each data source and measured concentrations from each water quality monitoring dataset. The predictive modelling and measured concentrations were treated as two lines of evidence and combined in an overall risk classification ranking for each substance or group. Strength of each line of evidence varied for a given substance or group depending on data availability. Measured concentration scores were typically qualitatively weighted higher than predictive modelling scores. The specific metrics are discussed below.
5.1.1 Predictive modelling classification
Ecological risk classifications for predictive modelling results were assigned to substances and groups of substances accounting for both the frequency and magnitude of PNEC exceedances (i.e., RQ greater than 1), for each data source (i.e., DSL-IU, NPRI, CBSA, and market research reports) according to the following criteria:
High (H): More than one risk quotient (i.e., theoretical or real facility) > 10;
Moderate (M): One risk quotient > 10 or More than one risk quotient between 1 and 10; or
Low (L): At most one risk quotient between 1 and 10.
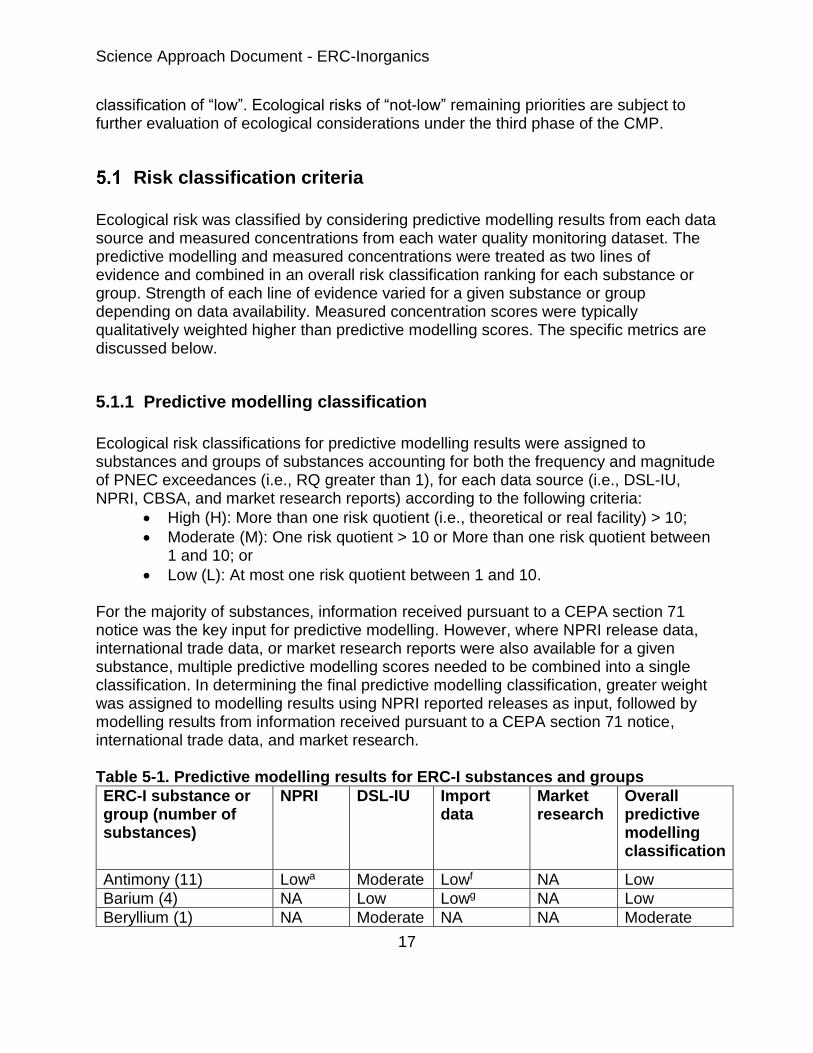
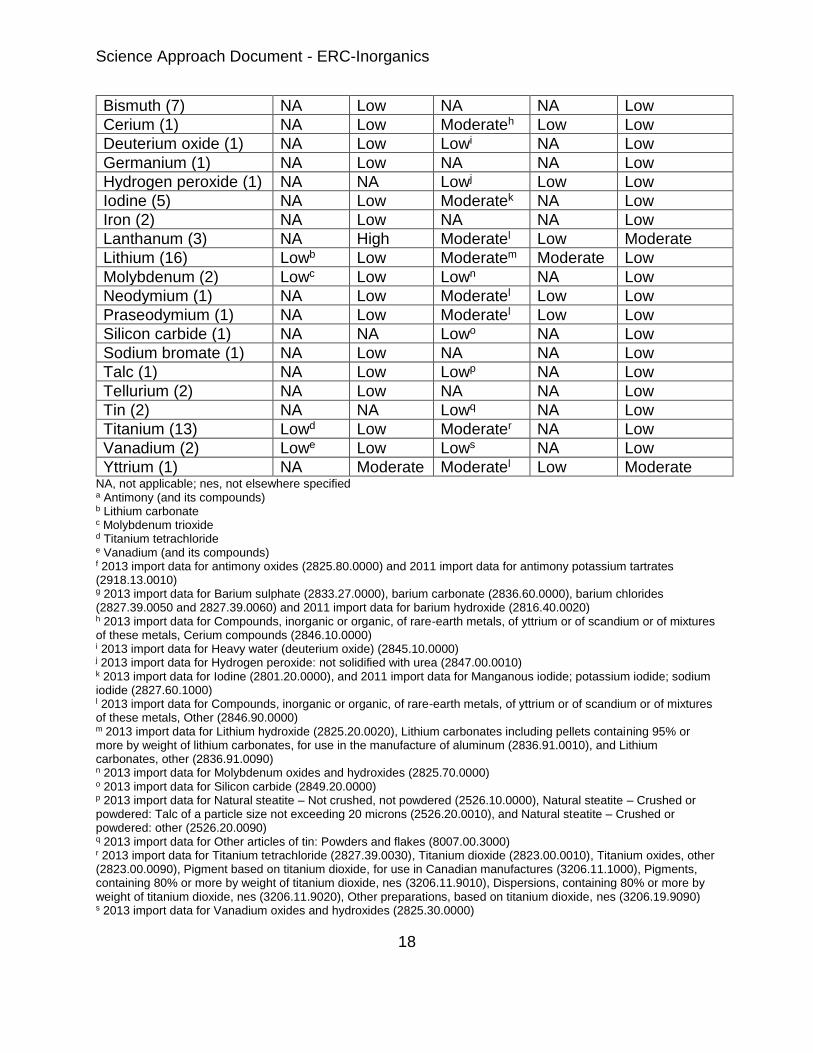
For the majority of substances, information received pursuant to a CEPA section 71 notice was the key input for predictive modelling. However, where NPRI release data, international trade data, or market research reports were also available for a given substance, multiple predictive modelling scores needed to be combined into a single classification. In determining the final predictive modelling classification, greater weight was assigned to modelling results using NPRI reported releases as input, followed by modelling results from information received pursuant to a CEPA section 71 notice, international trade data, and market research. Table 5-1. Predictive modelling results for ERC-I substances and groups
ERC-I substance or group (number of substances)
NPRI DSL-IU Import data
Market research
Overall predictive modelling classification
Antimony (11) Lowa Moderate Lowf NA Low
Barium (4) NA Low Lowg NA Low
Beryllium (1) NA Moderate NA NA Moderate
Science Approach Document - ERC-Inorganics
18
Bismuth (7) NA Low NA NA Low
Cerium (1) NA Low Moderateh Low Low
Deuterium oxide (1) NA Low Lowi NA Low
Germanium (1) NA Low NA NA Low
Hydrogen peroxide (1) NA NA Lowj Low Low
Iodine (5) NA Low Moderatek NA Low
Iron (2) NA Low NA NA Low
Lanthanum (3) NA High Moderatel Low Moderate
Lithium (16) Lowb Low Moderatem Moderate Low
Molybdenum (2) Lowc Low Lown NA Low
Neodymium (1) NA Low Moderatel Low Low
Praseodymium (1) NA Low Moderatel Low Low
Silicon carbide (1) NA NA Lowo NA Low
Sodium bromate (1) NA Low NA NA Low
Talc (1) NA Low Lowp NA Low
Tellurium (2) NA Low NA NA Low
Tin (2) NA NA Lowq NA Low
Titanium (13) Lowd Low Moderater NA Low
Vanadium (2) Lowe Low Lows NA Low
Yttrium (1) NA Moderate Moderatel Low Moderate NA, not applicable; nes, not elsewhere specified a Antimony (and its compounds) b Lithium carbonate c Molybdenum trioxide d Titanium tetrachloride e Vanadium (and its compounds) f 2013 import data for antimony oxides (2825.80.0000) and 2011 import data for antimony potassium tartrates (2918.13.0010) g 2013 import data for Barium sulphate (2833.27.0000), barium carbonate (2836.60.0000), barium chlorides (2827.39.0050 and 2827.39.0060) and 2011 import data for barium hydroxide (2816.40.0020) h 2013 import data for Compounds, inorganic or organic, of rare-earth metals, of yttrium or of scandium or of mixtures of these metals, Cerium compounds (2846.10.0000) i 2013 import data for Heavy water (deuterium oxide) (2845.10.0000) j 2013 import data for Hydrogen peroxide: not solidified with urea (2847.00.0010) k 2013 import data for Iodine (2801.20.0000), and 2011 import data for Manganous iodide; potassium iodide; sodium iodide (2827.60.1000) l 2013 import data for Compounds, inorganic or organic, of rare-earth metals, of yttrium or of scandium or of mixtures of these metals, Other (2846.90.0000) m 2013 import data for Lithium hydroxide (2825.20.0020), Lithium carbonates including pellets containing 95% or more by weight of lithium carbonates, for use in the manufacture of aluminum (2836.91.0010), and Lithium carbonates, other (2836.91.0090) n 2013 import data for Molybdenum oxides and hydroxides (2825.70.0000) o 2013 import data for Silicon carbide (2849.20.0000) p 2013 import data for Natural steatite – Not crushed, not powdered (2526.10.0000), Natural steatite – Crushed or powdered: Talc of a particle size not exceeding 20 microns (2526.20.0010), and Natural steatite – Crushed or powdered: other (2526.20.0090) q 2013 import data for Other articles of tin: Powders and flakes (8007.00.3000) r 2013 import data for Titanium tetrachloride (2827.39.0030), Titanium dioxide (2823.00.0010), Titanium oxides, other (2823.00.0090), Pigment based on titanium dioxide, for use in Canadian manufactures (3206.11.1000), Pigments, containing 80% or more by weight of titanium dioxide, nes (3206.11.9010), Dispersions, containing 80% or more by weight of titanium dioxide, nes (3206.11.9020), Other preparations, based on titanium dioxide, nes (3206.19.9090) s 2013 import data for Vanadium oxides and hydroxides (2825.30.0000)
Science Approach Document - ERC-Inorganics
19
5.1.2 Water quality monitoring classification
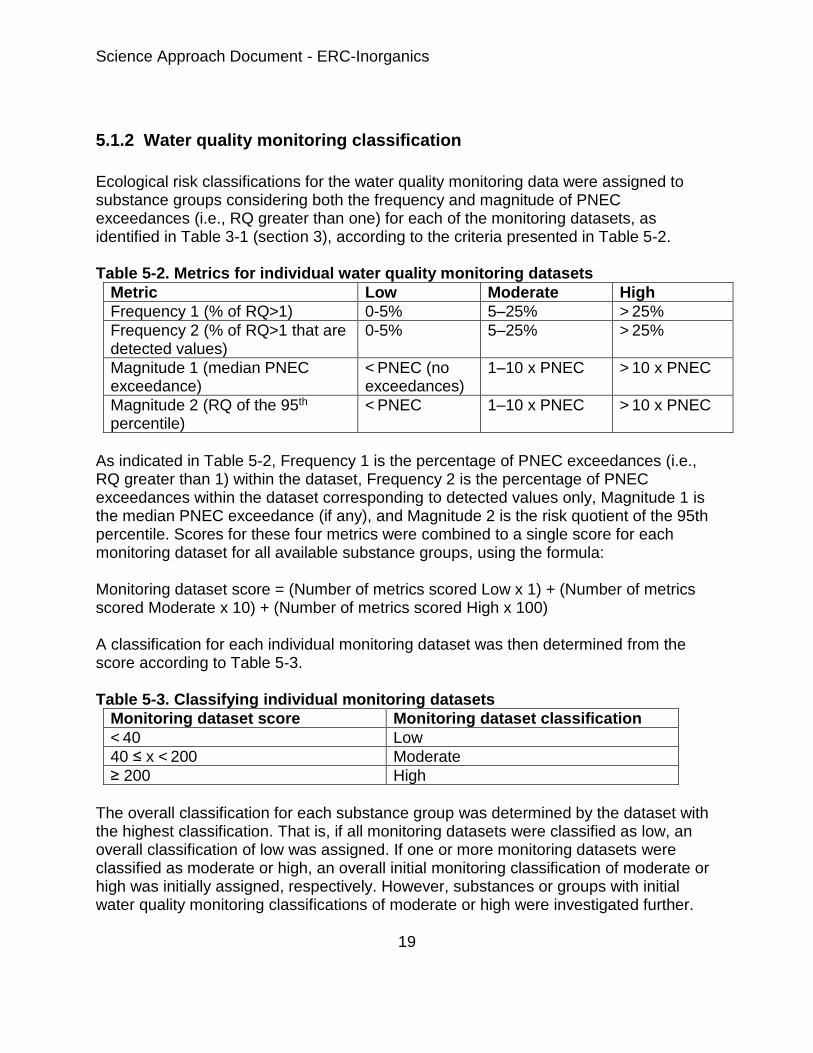
Ecological risk classifications for the water quality monitoring data were assigned to substance groups considering both the frequency and magnitude of PNEC exceedances (i.e., RQ greater than one) for each of the monitoring datasets, as identified in Table 3-1 (section 3), according to the criteria presented in Table 5-2. Table 5-2. Metrics for individual water quality monitoring datasets
Metric Low Moderate High
Frequency 1 (% of RQ>1) 0-5% 5–25% > 25%
Frequency 2 (% of RQ>1 that are detected values)
0-5% 5–25% > 25%
Magnitude 1 (median PNEC exceedance)
< PNEC (no exceedances)
1–10 x PNEC > 10 x PNEC
Magnitude 2 (RQ of the 95th percentile)
< PNEC 1–10 x PNEC > 10 x PNEC
As indicated in Table 5-2, Frequency 1 is the percentage of PNEC exceedances (i.e., RQ greater than 1) within the dataset, Frequency 2 is the percentage of PNEC exceedances within the dataset corresponding to detected values only, Magnitude 1 is the median PNEC exceedance (if any), and Magnitude 2 is the risk quotient of the 95th percentile. Scores for these four metrics were combined to a single score for each monitoring dataset for all available substance groups, using the formula: Monitoring dataset score = (Number of metrics scored Low x 1) + (Number of metrics scored Moderate x 10) + (Number of metrics scored High x 100) A classification for each individual monitoring dataset was then determined from the score according to Table 5-3. Table 5-3. Classifying individual monitoring datasets
Monitoring dataset score Monitoring dataset classification
< 40 Low
40 ≤ x < 200 Moderate
≥ 200 High
The overall classification for each substance group was determined by the dataset with the highest classification. That is, if all monitoring datasets were classified as low, an overall classification of low was assigned. If one or more monitoring datasets were classified as moderate or high, an overall initial monitoring classification of moderate or high was initially assigned, respectively. However, substances or groups with initial water quality monitoring classifications of moderate or high were investigated further.
Science Approach Document - ERC-Inorganics
20
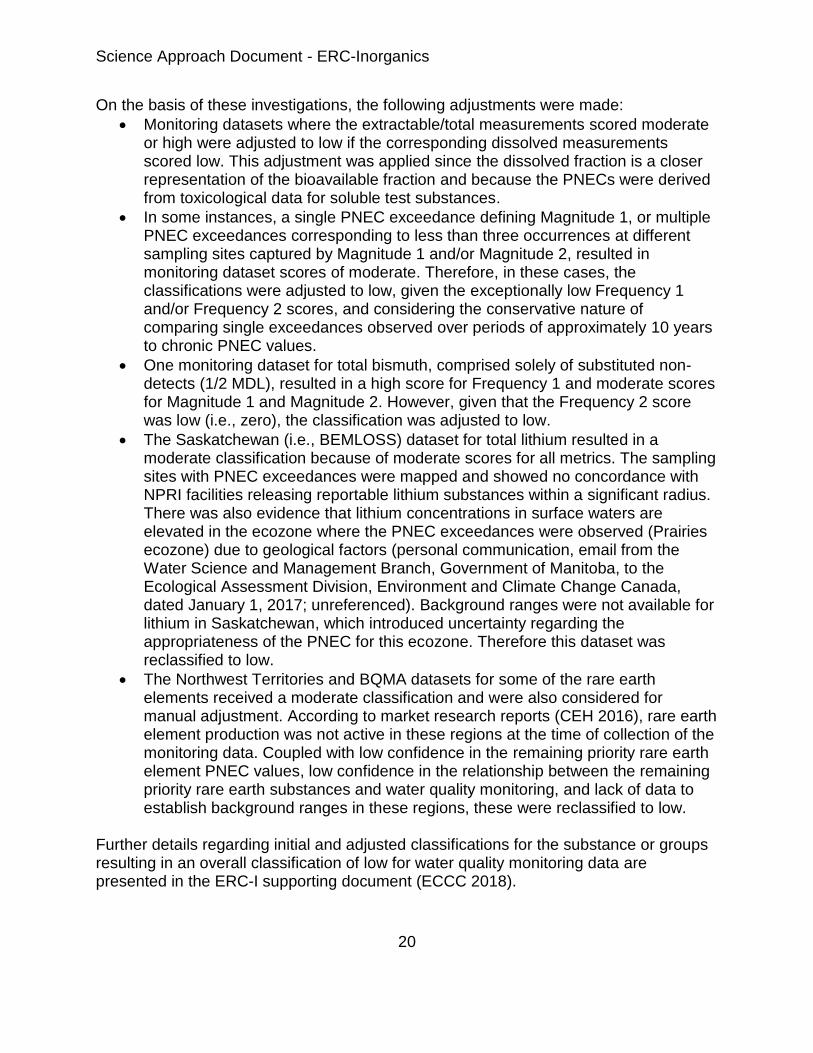
On the basis of these investigations, the following adjustments were made:
Monitoring datasets where the extractable/total measurements scored moderate or high were adjusted to low if the corresponding dissolved measurements scored low. This adjustment was applied since the dissolved fraction is a closer representation of the bioavailable fraction and because the PNECs were derived from toxicological data for soluble test substances.
In some instances, a single PNEC exceedance defining Magnitude 1, or multiple PNEC exceedances corresponding to less than three occurrences at different sampling sites captured by Magnitude 1 and/or Magnitude 2, resulted in monitoring dataset scores of moderate. Therefore, in these cases, the classifications were adjusted to low, given the exceptionally low Frequency 1 and/or Frequency 2 scores, and considering the conservative nature of comparing single exceedances observed over periods of approximately 10 years to chronic PNEC values.
One monitoring dataset for total bismuth, comprised solely of substituted non-detects (1/2 MDL), resulted in a high score for Frequency 1 and moderate scores for Magnitude 1 and Magnitude 2. However, given that the Frequency 2 score was low (i.e., zero), the classification was adjusted to low.
The Saskatchewan (i.e., BEMLOSS) dataset for total lithium resulted in a moderate classification because of moderate scores for all metrics. The sampling sites with PNEC exceedances were mapped and showed no concordance with NPRI facilities releasing reportable lithium substances within a significant radius. There was also evidence that lithium concentrations in surface waters are elevated in the ecozone where the PNEC exceedances were observed (Prairies ecozone) due to geological factors (personal communication, email from the Water Science and Management Branch, Government of Manitoba, to the Ecological Assessment Division, Environment and Climate Change Canada, dated January 1, 2017; unreferenced). Background ranges were not available for lithium in Saskatchewan, which introduced uncertainty regarding the appropriateness of the PNEC for this ecozone. Therefore this dataset was reclassified to low.
The Northwest Territories and BQMA datasets for some of the rare earth elements received a moderate classification and were also considered for manual adjustment. According to market research reports (CEH 2016), rare earth element production was not active in these regions at the time of collection of the monitoring data. Coupled with low confidence in the remaining priority rare earth element PNEC values, low confidence in the relationship between the remaining priority rare earth substances and water quality monitoring, and lack of data to establish background ranges in these regions, these were reclassified to low.
Further details regarding initial and adjusted classifications for the substance or groups resulting in an overall classification of low for water quality monitoring data are presented in the ERC-I supporting document (ECCC 2018).
Science Approach Document - ERC-Inorganics
21
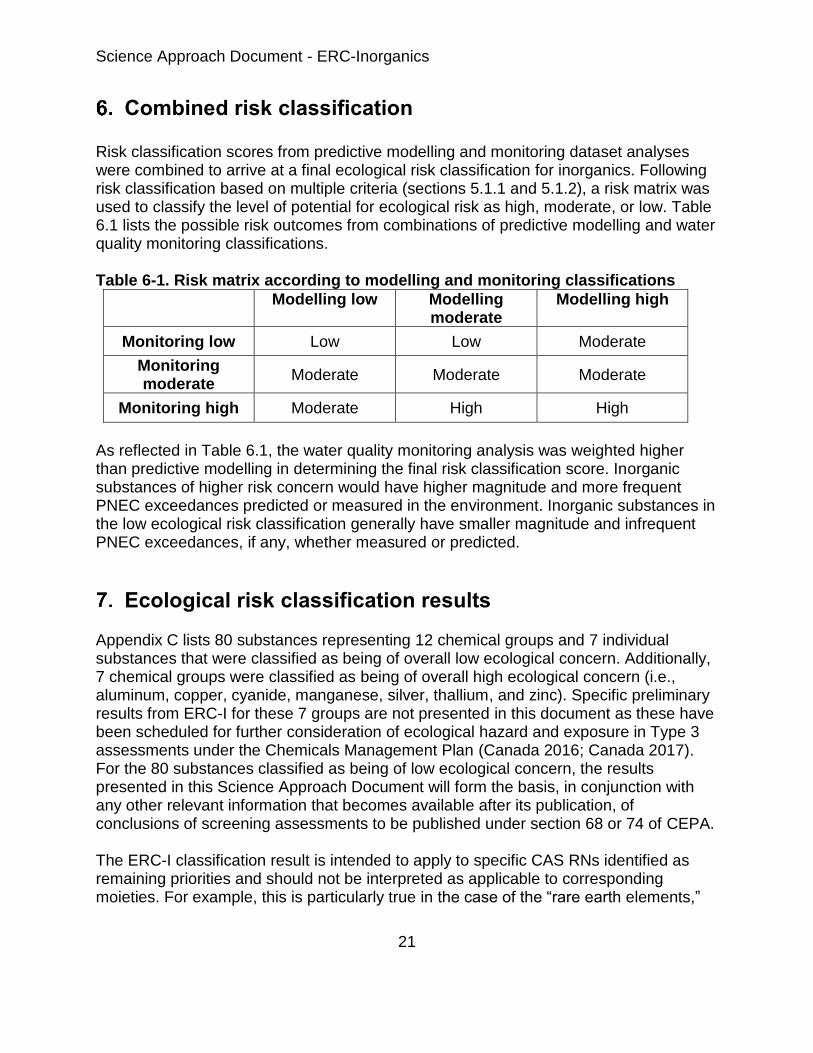
Combined risk classification Risk classification scores from predictive modelling and monitoring dataset analyses were combined to arrive at a final ecological risk classification for inorganics. Following risk classification based on multiple criteria (sections 5.1.1 and 5.1.2), a risk matrix was used to classify the level of potential for ecological risk as high, moderate, or low. Table 6.1 lists the possible risk outcomes from combinations of predictive modelling and water quality monitoring classifications. Table 6-1. Risk matrix according to modelling and monitoring classifications
Modelling low Modelling moderate
Modelling high
Monitoring low Low Low Moderate
Monitoring moderate
Moderate Moderate Moderate
Monitoring high Moderate High High
As reflected in Table 6.1, the water quality monitoring analysis was weighted higher than predictive modelling in determining the final risk classification score. Inorganic substances of higher risk concern would have higher magnitude and more frequent PNEC exceedances predicted or measured in the environment. Inorganic substances in the low ecological risk classification generally have smaller magnitude and infrequent PNEC exceedances, if any, whether measured or predicted.
Ecological risk classification results Appendix C lists 80 substances representing 12 chemical groups and 7 individual substances that were classified as being of overall low ecological concern. Additionally, 7 chemical groups were classified as being of overall high ecological concern (i.e., aluminum, copper, cyanide, manganese, silver, thallium, and zinc). Specific preliminary results from ERC-I for these 7 groups are not presented in this document as these have been scheduled for further consideration of ecological hazard and exposure in Type 3 assessments under the Chemicals Management Plan (Canada 2016; Canada 2017). For the 80 substances classified as being of low ecological concern, the results presented in this Science Approach Document will form the basis, in conjunction with any other relevant information that becomes available after its publication, of conclusions of screening assessments to be published under section 68 or 74 of CEPA. The ERC-I classification result is intended to apply to specific CAS RNs identified as remaining priorities and should not be interpreted as applicable to corresponding moieties. For example, this is particularly true in the case of the “rare earth elements,”
Science Approach Document - ERC-Inorganics
22
where 7 substances covering only 5 elements would be a particularly poor representation of this chemical class. Additionally, substances classified as low ecological concern with relatively high hazard (e.g., PNECs in low parts per billion) but which are currently reported to be produced, imported, or used in low volume in Canada (e.g., rare earth elements, bismuth), are proposed to be identified for additional tracking of production and use patterns. Their priority status may be re-evaluated if new information becomes available. Table 7-1. Percentage breakdown of the final ecological risk classification for inorganic substances
Ecological risk classification
Substance groups and individuals
Percent (%)
Low (use pattern data is proposed to be collected for some of these moieties)
19 73
Moderate or high (to be included in future group for refined assessment of ecological risk)
7 27
Total 26 100
Critical data and considerations used to create substance-specific profiles and classifications associated with hazard, exposure and risk are presented in ECCC 2018.
Assessment of risk classification uncertainty The ERC-I generally reflects a conservative or precautionary approach where multiple metrics add to a weight of evidence for classification. Given that the main purpose of ERC-I was to identify substances and groups of potentially lower ecological concern, the approach generally sought to minimize the potential for under-classification of ecological risk. A simplifying assumption taken for ERC-I was to focus on the aquatic compartment, which left uncertainty as to hazard and exposure in air, soil, and sediment. Data availability was a consideration in focussing on the aquatic compartment for ERC-I, the freshwater aquatic compartment being the most likely to have a basic set of hazard information to compare across substances, due to a historical preference for testing aquatic species for ecological effects (Swanson and Socha 1997). Also, as the ecological remaining priorities were identified as such on the basis of water solubility exceeding an aquatic toxicity threshold (Canada 2007), the potential for false negatives in the classification of ecological priority substances as being of low ecological concern based on the aquatic compartment is believed to be minimal.
Science Approach Document - ERC-Inorganics
23
Hazard profiling involved the review for applicability and alignment or derivation of chronic aquatic PNECs for inorganic substances and groups. Conservative assumptions made in the near-field exposure modelling (e.g., the use of generic emissions rates) reduced the potential for under-classifying ecological risk. The use of water quality monitoring data collected over approximately 10 years increased the confidence in the datasets. This led to the attribution of higher weight to the water quality monitoring dataset analyses in determining the final ecological risk classification. Another consideration would be the wide geographical and seasonal diversity captured in the water quality monitoring datasets, compared to the fixed conservative values of the near-field exposure scenario. Exposure profiling included the use of commercial data (quantity and use) from a number of sources. Information received in response to a CEPA section 71 notice was inherently specific to the individual remaining priority substances that were surveyed. However, international trade data is collected on the basis of HS Codes, which introduced uncertainty in relating the information to remaining priority CAS RNs. HS Codes may encompass multiple CAS RNs for related substances, not all of which are remaining priorities. For example, the HS Code 2827.60.1000 has the 2011 consolidated description “manganous iodide; potassium iodide; sodium iodide,” but only potassium iodide and sodium iodide are remaining priority substances. In these situations, relating the import data from the broader HS Code to the priority substances reduces the possibility of under-classifying risk. Similarly, the water quality monitoring data considered in ERC-I included dissolved, extractable, and total measurements, reflecting multiple exposures to moieties of potential concern. This introduced an inconsistency when applying results from the water quality monitoring datasets, which are moiety-based, to the subset of remaining priority substances. However, these comparisons are conservative from the perspective of the remaining priority substances, which further reduces the possibility of under-classifying risk. Non-detect values in the water quality monitoring datasets were substituted with half the corresponding detection limit (1/2 MDL). This is a standard but potentially over-conservative approach to addressing non-detects in monitoring data. The Frequency 2 metric was introduced to reduce the weight assigned to non-detect measurements in exceedance of PNECs. Finally, water quality monitoring data were not available from every data source for every substance in ERC-I. This may introduce some bias toward substances which are measured and reported more frequently. However, it was deemed appropriate to use all identifiable data rather than limit the approach to substances with rich monitoring datasets. In addition, the IRAP provides a mechanism to revisit currently data-poor substances if data becomes available.
Conclusion On the basis of inherent hazard properties, current use patterns, quantities in commerce, available release data, and an analysis of federal and provincial water
Science Approach Document - ERC-Inorganics
24
quality monitoring data, 80 substances were classified as being of low ecological concern. Taking into account current information, the 80 substances of low ecological concern are not expected to pose an ecological risk. The approach and results for these 80 substances will form the basis, in conjunction with any other relevant information that becomes available after the publication of this Science Approach Document, for the conclusions in screening assessments that will be published at a later time. Further follow-up or tracking of information may be done for substances that were classified as low concern primarily on the basis of current low exposures, to determine whether further activity is required in the future.
Science Approach Document - ERC-Inorganics
25
References [BQMA] Banque de Données sur la Qualité du Milieu Aquatique. 1979- . Quebec (Canada): Government of Quebec [accessed 2015 Nov 5]. Datasets for all stations monitoring metals were downloaded. [available in French only] Borgmann U, Couillard Y, Doyle P, Dixon G. 2005. Toxicity of sixty-three metals and metalloids to Hyalella azteca at two levels of water hardness. Environ Toxicol Chem. 24:641-652. Canada. 1999. Canadian Environmental Protection Act, 1999. S.C. 1999, c. 33. Canada Gazette Part III, vol. 22, no. 3. Canada. 2007. Categorization of substances on the Domestic Substances List (DSL). Ottawa (ON): Government of Canada. [accessed 2016 Sep]. Canada. 2009. Canadian Environmental Protection Act, 1999: Notice with respect to certain inanimate substances (chemicals) on the Domestic Substances List (PDF). Canada Gazette, Part 1, vol. 143, no. 40, p. 2945-2956. Canada. 2010a. Screening assessment for the Challenge: Antimony trioxide (antimony oxide): Chemical Abstracts Service Registry Number 1309-64-4. Ottawa (ON): Government of Canada. [accessed 2016 Feb]. Canada. 2010b. Screening assessment for the Challenge: Bromic acid, potassium salt (potassium bromate): Chemical Abstracts Service Registry Number 7758-01-2. Ottawa (ON): Government of Canada. [accessed 2016 Feb]. Canada. 2010c. Screening assessment for the Challenge: Vanadium oxide (vanadium pentoxide): Chemical Abstracts Service Registry Number 1314-62-1. Ottawa (ON): Government of Canada. [accessed 2016 Feb]. Canada. 2012. Canadian Environmental Protection Act, 1999: Notice with respect to certain inanimate substances (chemicals) on the Domestic Substances List. Canada Gazette, Part 1, vol. 146, No. 48, Supplement. Canada. 2016. Chemicals Management Plan Risk Assessment toolbox. Ottawa (ON): Government of Canada. [accessed 2016 Feb]. Canada. 2017. Chemicals Management Plan implementation table at a glance – 2016 to 2021. Ottawa (ON): Government of Canada. [accessed 2016 Feb]. [CBSA] Canada Border Services Agency. 2016. Information on imports corresponding to the HS Codes 2526.10.0000, 2526.20.0010, 2526.20.0090, 2801.20.0000, 2816.40.0020, 2823.00.0010, 2823.00.0090, 2825.20.0020, 2825.30.0000, 2825.70.0000, 2825.80.0000, 2827.30.0060, 2827.39.0030, 2827.39.0050, 2827.60.1000, 2833.27.0000, 2836.60.0000, 2836.90.0090, 2836.91.0010, 2845.10.0000, 2846.10.0000, 2846.90.0000, 2847.00.0010, 2849.20.0000, 2918.13.0010, 3206.11.1000, 3206.11.9010, 3206.11.9020, 3206.19.9090, and 8007.30.3000. Ottawa (ON): CBSA, Commercial and Trade Operations Division. Confidential information received by Environment and Climate Change Canada for calendar years 2010-2013. [CCME] Canadian Council of Ministers of the Environment. 2007. A Protocol for the Derivation of Water Quality Guidelines for the Protection of Aquatic Life. PN 1452. Winnipeg (MB): Canadian Council of Ministers of the Environment (PDF) [accessed 2016 Sep].
Science Approach Document - ERC-Inorganics
26
[CCREM] Canadian Council of Resource and Environment Ministers. 1987. Canadian Water Quality Guidelines. [PDF] [accessed 2016 Sep]. [CEH] Chemical Economics Handbook. 2014a. Hydrogen peroxide. Schlag S, Funada C, Gao A. IHS Markit. [accessed 2017 Feb 20]. [restricted access]. [CEH] Chemical Economics Handbook. 2014b. Lithium, Lithium Minerals, and Lithium Chemicals. Wietlisbach S, Glauser J. IHS Markit. [accessed 2016 Mar 20]. [restricted access]. [CEH] Chemical Economics Handbook, 2016. Rare Earth Minerals and Products. Wietlisbach S, Gao A. IHS Markit. [accessed 2016 Nov 30]. [restricted access]. Cimorelli A, Stahl C. 2013. Avoiding “proofiness”: Addressing uncertainty in environmental characterization. Integr Environ Assess Manag. 10(1):138-144. [ECCC] Environment and Climate Change Canada. 2016a. Gatineau (QC): ECCC. Assigned emission factors for NAICS and Substance Function Codes. Information in support of Ecological Risk Classification of Organic Substances. Available from: [email protected]. [ECCC] Environment and Climate Change Canada. 2016b. Reports on Metals and Metalloids in Canadian Municipal Wastewater and Biosolids. Unpublished Reports. Burlington (ON): Environment and Climate Change Canada, CMP Research and Monitoring Section. [ECCC] Environment and Climate Change Canada. 2018. Supporting documentation: Ecological Risk Classification of Inorganic Substances. Gatineau (QC): ECCC. Available from: [email protected]. [ECCC, HC] Environment and Climate Change Canada. Health Canada. 2016. Rapid screening of substances identified from phase two of the Domestic Substances List inventory update: results of the screening assessment. Ottawa (ON): Government of Canada. [ECOTOX] ECOTOXicology database [database]. 2016. Ver. 4. Washington (DC): US Environmental Protection Agency, Office of Research and Development; National Health and Environmental Effects Research Laboratory; Mid-Continent Ecology Division [accessed 2016 Sep]. Environment Canada. 2009-2012. Wastewater treatment plant data collected under the Chemicals Management Plan Environmental Monitoring and Surveillance Program. Unpublished data, Gatineau (QC): Environment Canada. Environment Canada. 2013. DSL Inventory Update data collected under the Canadian Environmental Protection Act, 1999, section 71: Notice with respect to certain substances on the Domestic Substances List. Data prepared by: Environment Canada, Health Canada; Existing Substances Program. [EC, HC] Environment Canada, Health Canada. 2013. Rapid screening of substances of lower concern: results of the screening assessment. Ottawa (ON): Government of Canada. [EC, HC] Environment Canada, Health Canada. 2014. Rapid screening of substances from phase one of the Domestic Substances List inventory update: results of the final screening assessment. Ottawa (ON): Government of Canada. [EMS WR] Environmental Monitoring System Web Reporting. 2016. Victoria (BC): British Columbia Ministry of the Environment. [accessed 2016 Jan 12]. [registration required]. Queried parameters
Science Approach Document - ERC-Inorganics
27
applicable to dissolved and total measurements for purpose type 1 and 2 surface water sources from 2005 to 2015. [ECHA] European Chemicals Agency. Registered substances database. Helsinki (FI): ECHA [accessed 2016 Sep]. [EU] European Union. 2008. European Union Risk Assessment Report (RAR): Diantimony Trioxide. [DOC]. [accessed 2016 Sep]. [JOSM] Canada-Alberta Joint Oil Sands Environmental Monitoring. 2016. Gatineau (QC): Environment and Climate Change Canada. [accessed 2016 Sep 19]. Datasets for surface water quality monitoring on the Athabasca River and Expanded Geographic Area. [JOSM] Canada-Alberta Joint Oil Sands Environmental Monitoring. 2017. Gatineau (QC): Environment and Climate Change Canada. [accessed 2017 Jul 4]. Datasets for surface water quality monitoring on the Tributaries. Kilgour & Associates Ltd. 2016. Estimating background concentration ranges data to inform ecological chemical risk assessments. Unpublished report. Gatineau (QC): Environment and Climate Change Canada, Ecological Assessment Division. (manuscript in preparation). [MRC] Merchant Research & Consulting Ltd. 2016, Hydrogen peroxide market in Canada: 2016-2020 Review. 63 pp. Nautilus Environmental. 2016. Effects characterization of selected inorganic moieties. Unpublished report. Gatineau (QC): Environment and Climate Change Canada, Ecological Assessment Division. [NCI] National Chemical Inventories [database on CD-ROM]. 2015. Issue 2. Columbus (OH): American Chemical Society, Chemical Abstracts Service. [accessed 2016 Sep]. [NPRI] National Pollutant Release Inventory. 2016. NPRI Datasets: Bulk data (1994 to present). Ottawa (ON): Government of Canada. [accessed 2016 Sep].
[OECD] QSAR Toolbox [Read-across tool]. 2016. Version 3.4. Paris (FR): Organisation for Economic
Cooperation and Development, Environment Directorate. Proulx CL, Kilgour BW, Francis AP, Bouwhuis RF, Hill JR. 2018. Using a conductivity-alkalinity relationship as a tool to identify surface waters in reference condition across Canada. Water Quality Research Journal. 53(4): 231-240. [PWQMN] Provincial Water Quality Monitoring Network. 2015. Ontario Ministry of the Environment and Climate Change. [accessed 2015 Nov 17]. Annual datasets for 2005 to 2012. [RAMP] Regional Aquatics Monitoring Program Water Quality Data. 2016. Regional Aquatics Monitoring Program. [accessed 2016 Sep 13]. Queried all parameters under conventional variables, dissolved metals, extractable metals, field, major ions, and total metals for 2005 to 2015. SciFinder [database]. 2016. Columbus (OH): American Chemical Society, Chemical Abstracts Service. [accessed 2016 Sep]. Swanson MB, Socha AC, editors. 1997. Chemical Ranking and Scoring: Guidelines for Relative Assessments of Chemicals. Pensacola (FL): SETAC Press. 186 p.

Science Approach Document - ERC-Inorganics
28
Science Approach Document - ERC-Inorganics
29
Appendices
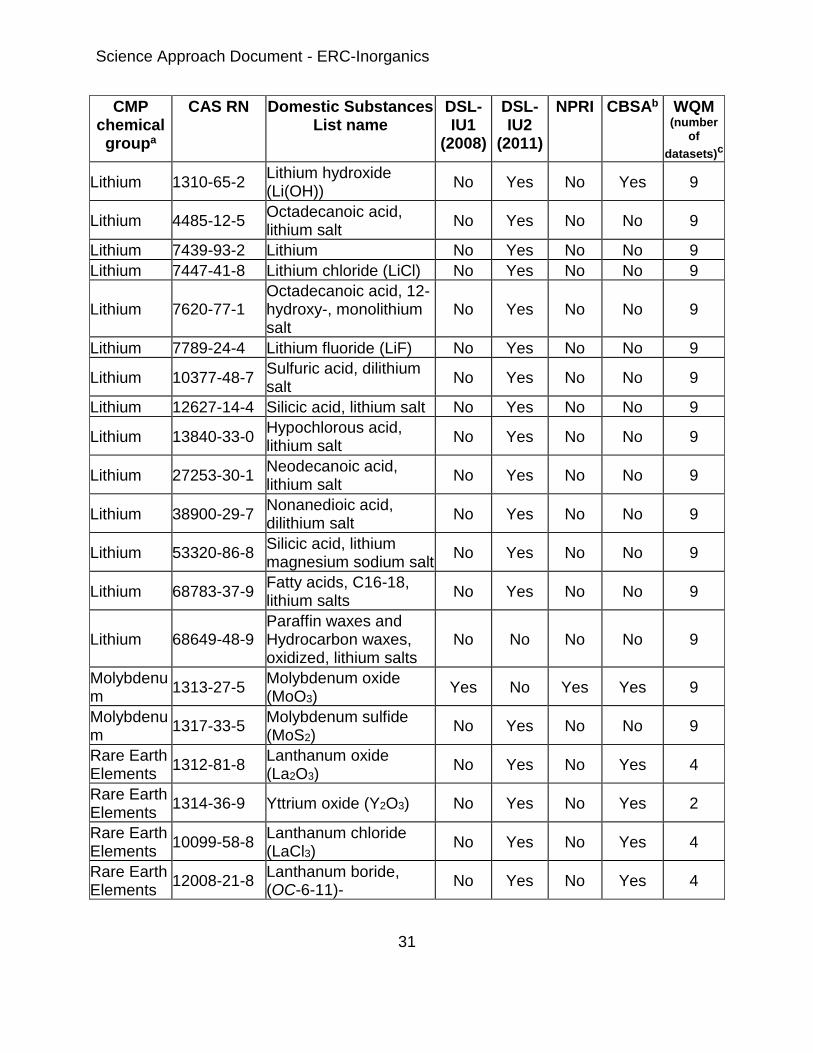
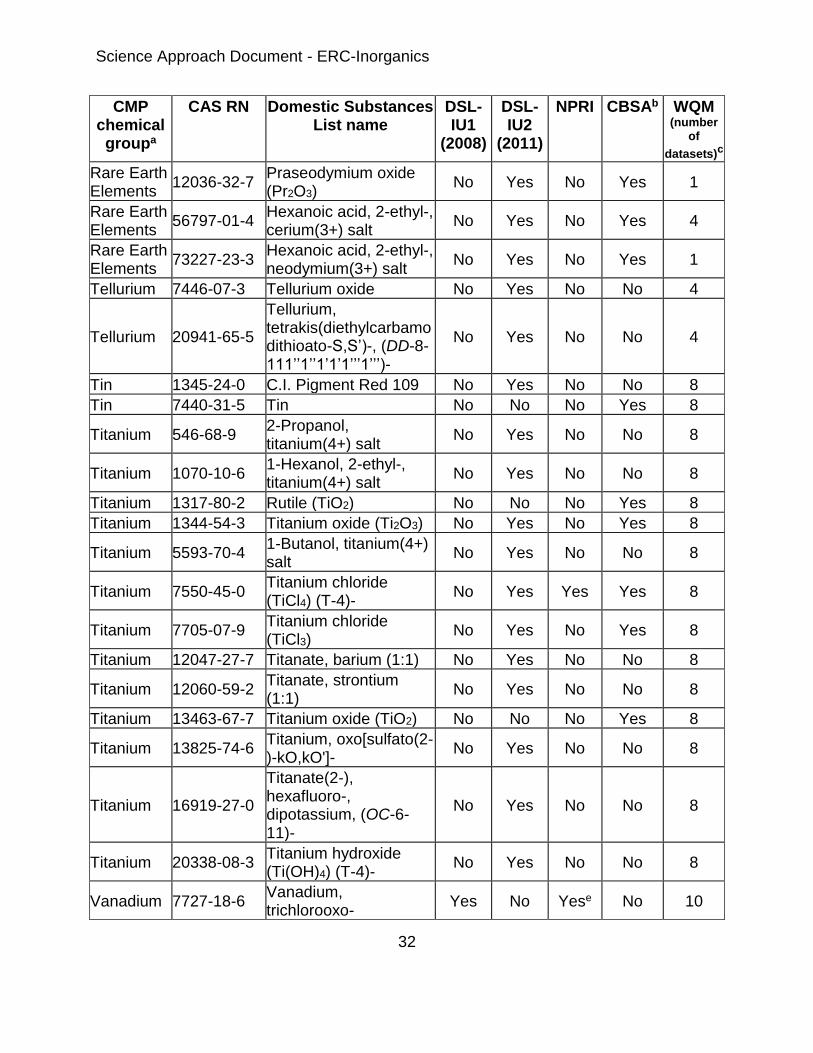
Appendix A. Exposure data availability for substances classified as being of low ecological concern by the ERC-I approach
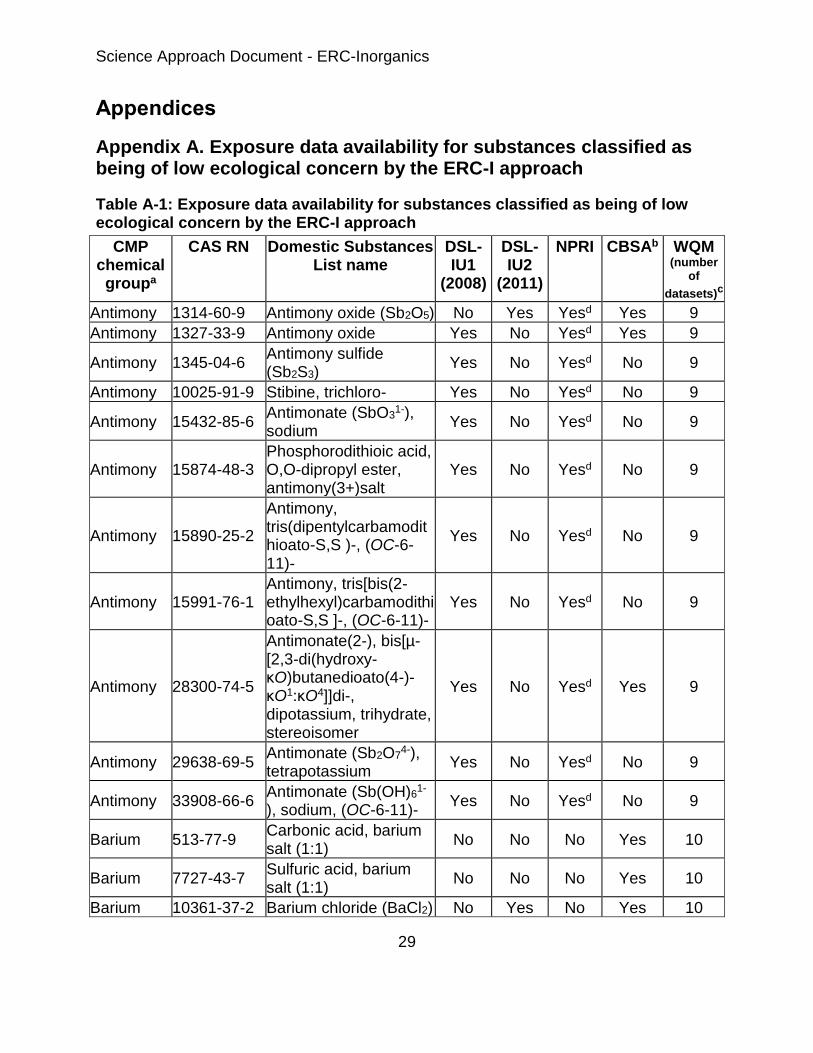
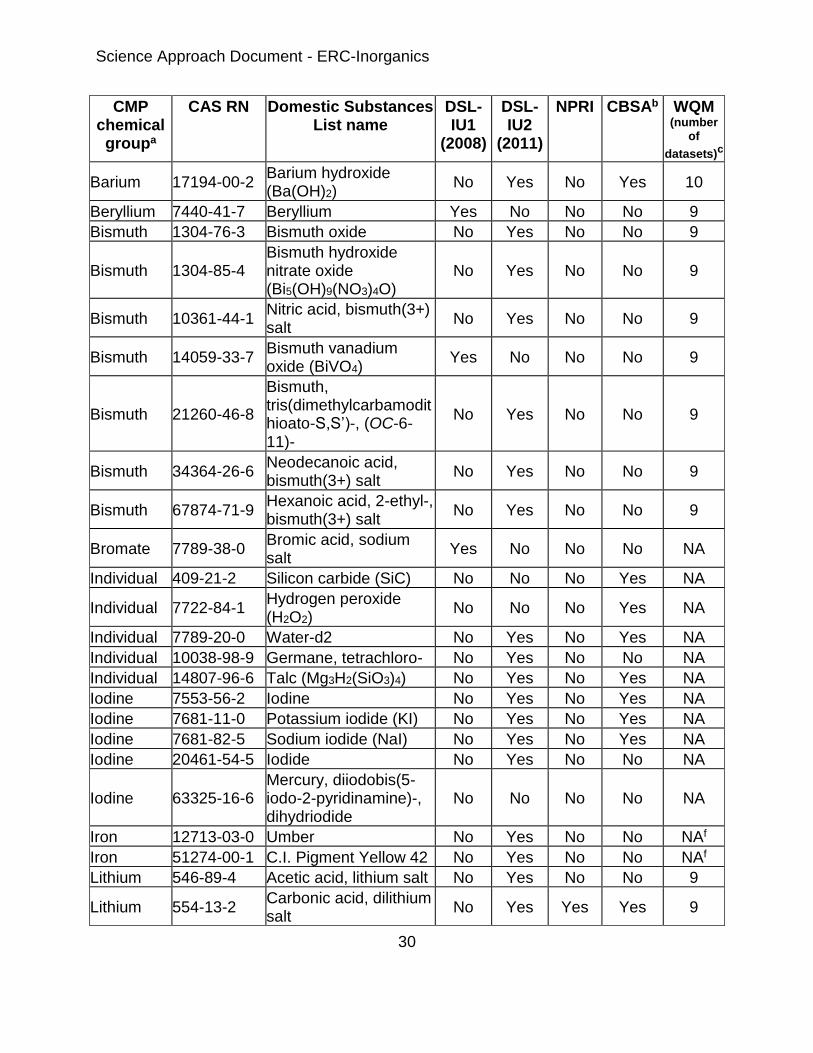
Table A-1: Exposure data availability for substances classified as being of low ecological concern by the ERC-I approach
CMP chemical groupa
CAS RN Domestic Substances List name
DSL-IU1
(2008)
DSL-IU2
(2011)
NPRI CBSAb WQM (number
of
datasets)c
Antimony 1314-60-9 Antimony oxide (Sb2O5) No Yes Yesd Yes 9
Antimony 1327-33-9 Antimony oxide Yes No Yesd Yes 9
Antimony 1345-04-6 Antimony sulfide (Sb2S3)
Yes No Yesd No 9
Antimony 10025-91-9 Stibine, trichloro- Yes No Yesd No 9
Antimony 15432-85-6 Antimonate (SbO3
1-), sodium
Yes No Yesd No 9
Antimony 15874-48-3 Phosphorodithioic acid, O,O-dipropyl ester, antimony(3+)salt
Yes No Yesd No 9
Antimony 15890-25-2
Antimony, tris(dipentylcarbamodithioato-S,S )-, (OC-6-11)-
Yes No Yesd No 9
Antimony 15991-76-1 Antimony, tris[bis(2-ethylhexyl)carbamodithioato-S,S ]-, (OC-6-11)-
Yes No Yesd No 9
Antimony 28300-74-5
Antimonate(2-), bis[µ-[2,3-di(hydroxy-κO)butanedioato(4-)-κO1:κO4]]di-, dipotassium, trihydrate, stereoisomer
Yes No Yesd Yes 9
Antimony 29638-69-5 Antimonate (Sb2O7
4-), tetrapotassium
Yes No Yesd No 9
Antimony 33908-66-6 Antimonate (Sb(OH)6
1-
), sodium, (OC-6-11)- Yes No Yesd No 9
Barium 513-77-9 Carbonic acid, barium salt (1:1)
No No No Yes 10
Barium 7727-43-7 Sulfuric acid, barium salt (1:1)
No No No Yes 10
Barium 10361-37-2 Barium chloride (BaCl2) No Yes No Yes 10
Science Approach Document - ERC-Inorganics
30
CMP chemical groupa
CAS RN Domestic Substances List name
DSL-IU1
(2008)
DSL-IU2
(2011)
NPRI CBSAb WQM (number
of
datasets)c
Barium 17194-00-2 Barium hydroxide (Ba(OH)2)
No Yes No Yes 10
Beryllium 7440-41-7 Beryllium Yes No No No 9
Bismuth 1304-76-3 Bismuth oxide No Yes No No 9
Bismuth 1304-85-4 Bismuth hydroxide nitrate oxide (Bi5(OH)9(NO3)4O)
No Yes No No 9
Bismuth 10361-44-1 Nitric acid, bismuth(3+) salt
No Yes No No 9
Bismuth 14059-33-7 Bismuth vanadium oxide (BiVO4)
Yes No No No 9
Bismuth 21260-46-8
Bismuth, tris(dimethylcarbamodithioato-S,S’)-, (OC-6-11)-
No Yes No No 9
Bismuth 34364-26-6 Neodecanoic acid, bismuth(3+) salt
No Yes No No 9
Bismuth 67874-71-9 Hexanoic acid, 2-ethyl-, bismuth(3+) salt
No Yes No No 9
Bromate 7789-38-0 Bromic acid, sodium salt
Yes No No No NA
Individual 409-21-2 Silicon carbide (SiC) No No No Yes NA
Individual 7722-84-1 Hydrogen peroxide (H2O2)
No No No Yes NA
Individual 7789-20-0 Water-d2 No Yes No Yes NA
Individual 10038-98-9 Germane, tetrachloro- No Yes No No NA
Individual 14807-96-6 Talc (Mg3H2(SiO3)4) No Yes No Yes NA
Iodine 7553-56-2 Iodine No Yes No Yes NA
Iodine 7681-11-0 Potassium iodide (KI) No Yes No Yes NA
Iodine 7681-82-5 Sodium iodide (NaI) No Yes No Yes NA
Iodine 20461-54-5 Iodide No Yes No No NA
Iodine 63325-16-6 Mercury, diiodobis(5-iodo-2-pyridinamine)-, dihydriodide
No No No No NA
Iron 12713-03-0 Umber No Yes No No NAf
Iron 51274-00-1 C.I. Pigment Yellow 42 No Yes No No NAf
Lithium 546-89-4 Acetic acid, lithium salt No Yes No No 9
Lithium 554-13-2 Carbonic acid, dilithium salt
No Yes Yes Yes 9
Science Approach Document - ERC-Inorganics
31
CMP chemical groupa
CAS RN Domestic Substances List name
DSL-IU1
(2008)
DSL-IU2
(2011)
NPRI CBSAb WQM (number
of
datasets)c
Lithium 1310-65-2 Lithium hydroxide (Li(OH))
No Yes No Yes 9
Lithium 4485-12-5 Octadecanoic acid, lithium salt
No Yes No No 9
Lithium 7439-93-2 Lithium No Yes No No 9
Lithium 7447-41-8 Lithium chloride (LiCl) No Yes No No 9
Lithium 7620-77-1 Octadecanoic acid, 12-hydroxy-, monolithium salt
No Yes No No 9
Lithium 7789-24-4 Lithium fluoride (LiF) No Yes No No 9
Lithium 10377-48-7 Sulfuric acid, dilithium salt
No Yes No No 9
Lithium 12627-14-4 Silicic acid, lithium salt No Yes No No 9
Lithium 13840-33-0 Hypochlorous acid, lithium salt
No Yes No No 9
Lithium 27253-30-1 Neodecanoic acid, lithium salt
No Yes No No 9
Lithium 38900-29-7 Nonanedioic acid, dilithium salt
No Yes No No 9
Lithium 53320-86-8 Silicic acid, lithium magnesium sodium salt
No Yes No No 9
Lithium 68783-37-9 Fatty acids, C16-18, lithium salts
No Yes No No 9
Lithium 68649-48-9 Paraffin waxes and Hydrocarbon waxes, oxidized, lithium salts
No No No No 9
Molybdenum
1313-27-5 Molybdenum oxide (MoO3)
Yes No Yes Yes 9
Molybdenum
1317-33-5 Molybdenum sulfide (MoS2)
No Yes No No 9
Rare Earth Elements
1312-81-8 Lanthanum oxide (La2O3)
No Yes No Yes 4
Rare Earth Elements
1314-36-9 Yttrium oxide (Y2O3) No Yes No Yes 2
Rare Earth Elements
10099-58-8 Lanthanum chloride (LaCl3)
No Yes No Yes 4
Rare Earth Elements
12008-21-8 Lanthanum boride, (OC-6-11)-
No Yes No Yes 4
Science Approach Document - ERC-Inorganics
32
CMP chemical groupa
CAS RN Domestic Substances List name
DSL-IU1
(2008)
DSL-IU2
(2011)
NPRI CBSAb WQM (number
of
datasets)c
Rare Earth Elements
12036-32-7 Praseodymium oxide (Pr2O3)
No Yes No Yes 1
Rare Earth Elements
56797-01-4 Hexanoic acid, 2-ethyl-, cerium(3+) salt
No Yes No Yes 4
Rare Earth Elements
73227-23-3 Hexanoic acid, 2-ethyl-, neodymium(3+) salt
No Yes No Yes 1
Tellurium 7446-07-3 Tellurium oxide No Yes No No 4
Tellurium 20941-65-5
Tellurium, tetrakis(diethylcarbamodithioato-S,S’)-, (DD-8-111’’1’’1’1’1’’’1’’’)-
No Yes No No 4
Tin 1345-24-0 C.I. Pigment Red 109 No Yes No No 8
Tin 7440-31-5 Tin No No No Yes 8
Titanium 546-68-9 2-Propanol, titanium(4+) salt
No Yes No No 8
Titanium 1070-10-6 1-Hexanol, 2-ethyl-, titanium(4+) salt
No Yes No No 8
Titanium 1317-80-2 Rutile (TiO2) No No No Yes 8
Titanium 1344-54-3 Titanium oxide (Ti2O3) No Yes No Yes 8
Titanium 5593-70-4 1-Butanol, titanium(4+) salt
No Yes No No 8
Titanium 7550-45-0 Titanium chloride (TiCl4) (T-4)-
No Yes Yes Yes 8
Titanium 7705-07-9 Titanium chloride (TiCl3)
No Yes No Yes 8
Titanium 12047-27-7 Titanate, barium (1:1) No Yes No No 8
Titanium 12060-59-2 Titanate, strontium (1:1)
No Yes No No 8
Titanium 13463-67-7 Titanium oxide (TiO2) No No No Yes 8
Titanium 13825-74-6 Titanium, oxo[sulfato(2-)-kO,kO']-
No Yes No No 8
Titanium 16919-27-0
Titanate(2-), hexafluoro-, dipotassium, (OC-6-11)-
No Yes No No 8
Titanium 20338-08-3 Titanium hydroxide (Ti(OH)4) (T-4)-
No Yes No No 8
Vanadium 7727-18-6 Vanadium, trichlorooxo-
Yes No Yese No 10
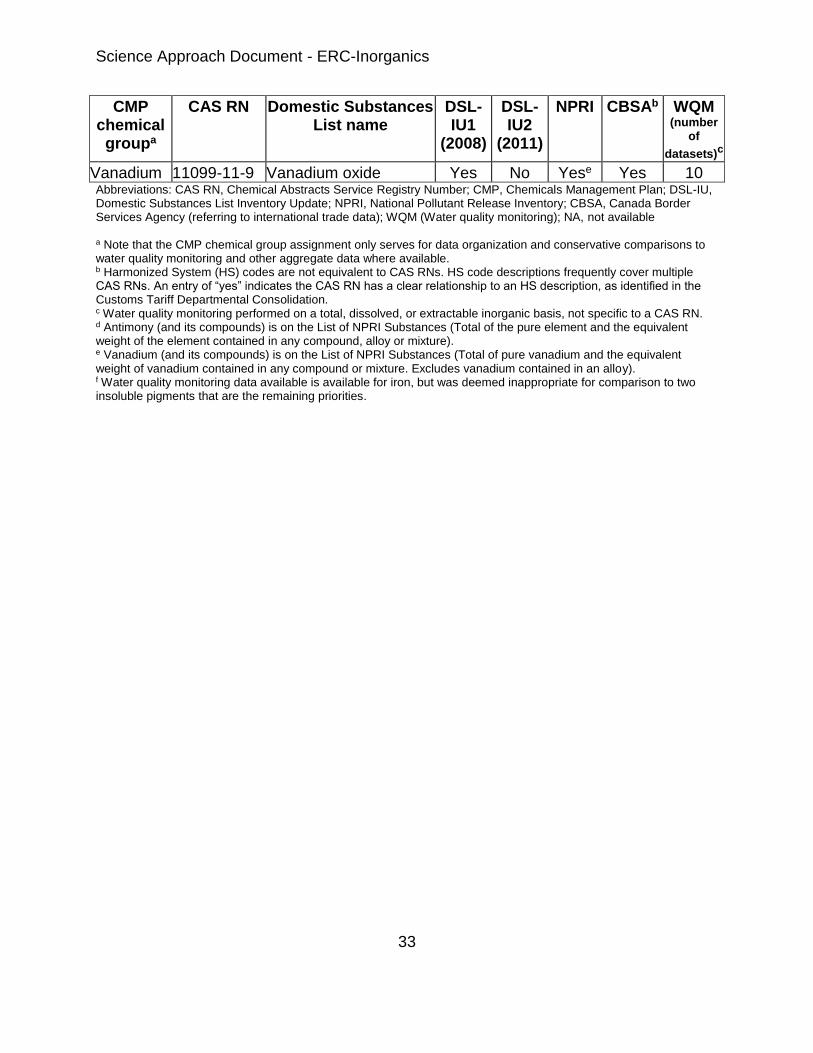
Science Approach Document - ERC-Inorganics
33
CMP chemical groupa
CAS RN Domestic Substances List name
DSL-IU1
(2008)
DSL-IU2
(2011)
NPRI CBSAb WQM (number
of
datasets)c
Vanadium 11099-11-9 Vanadium oxide Yes No Yese Yes 10 Abbreviations: CAS RN, Chemical Abstracts Service Registry Number; CMP, Chemicals Management Plan; DSL-IU, Domestic Substances List Inventory Update; NPRI, National Pollutant Release Inventory; CBSA, Canada Border Services Agency (referring to international trade data); WQM (Water quality monitoring); NA, not available
a Note that the CMP chemical group assignment only serves for data organization and conservative comparisons to water quality monitoring and other aggregate data where available. b Harmonized System (HS) codes are not equivalent to CAS RNs. HS code descriptions frequently cover multiple CAS RNs. An entry of “yes” indicates the CAS RN has a clear relationship to an HS description, as identified in the Customs Tariff Departmental Consolidation. c Water quality monitoring performed on a total, dissolved, or extractable inorganic basis, not specific to a CAS RN. d Antimony (and its compounds) is on the List of NPRI Substances (Total of the pure element and the equivalent weight of the element contained in any compound, alloy or mixture). e Vanadium (and its compounds) is on the List of NPRI Substances (Total of pure vanadium and the equivalent weight of vanadium contained in any compound or mixture. Excludes vanadium contained in an alloy). f Water quality monitoring data available is available for iron, but was deemed inappropriate for comparison to two insoluble pigments that are the remaining priorities.
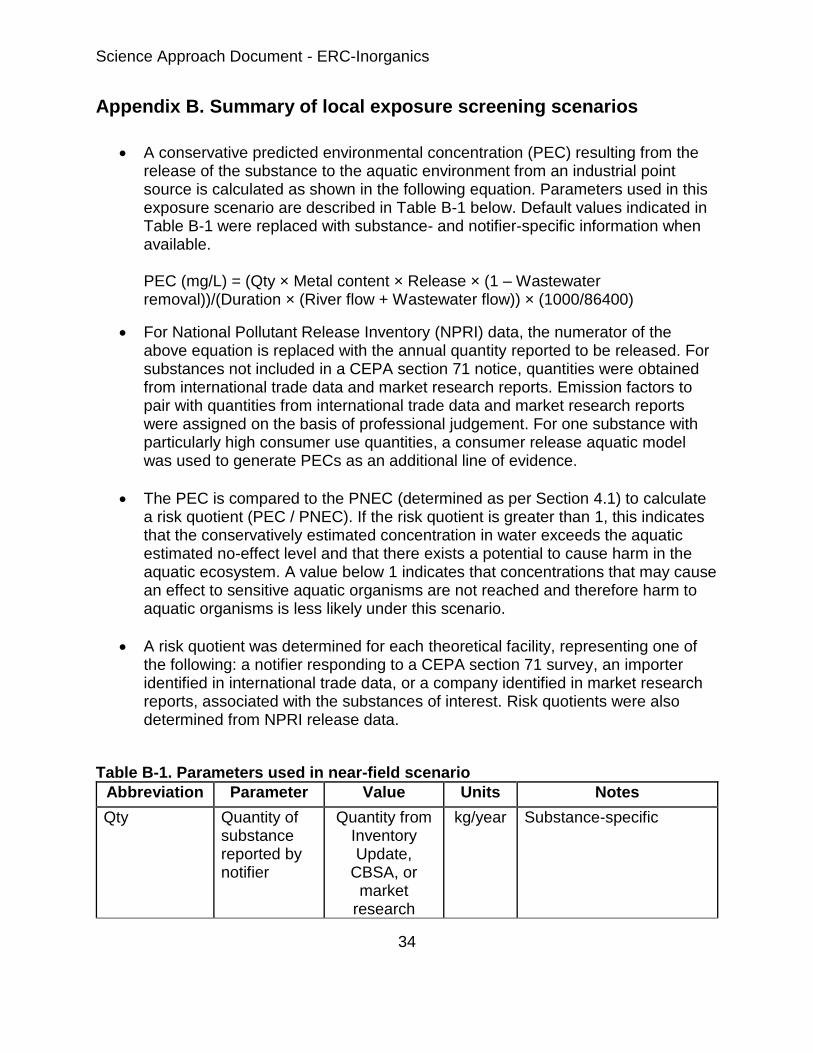
Science Approach Document - ERC-Inorganics
34
Appendix B. Summary of local exposure screening scenarios
A conservative predicted environmental concentration (PEC) resulting from the release of the substance to the aquatic environment from an industrial point source is calculated as shown in the following equation. Parameters used in this exposure scenario are described in Table B-1 below. Default values indicated in Table B-1 were replaced with substance- and notifier-specific information when available. PEC (mg/L) = (Qty × Metal content × Release × (1 – Wastewater removal))/(Duration × (River flow + Wastewater flow)) × (1000/86400)
For National Pollutant Release Inventory (NPRI) data, the numerator of the above equation is replaced with the annual quantity reported to be released. For substances not included in a CEPA section 71 notice, quantities were obtained from international trade data and market research reports. Emission factors to pair with quantities from international trade data and market research reports were assigned on the basis of professional judgement. For one substance with particularly high consumer use quantities, a consumer release aquatic model was used to generate PECs as an additional line of evidence.
The PEC is compared to the PNEC (determined as per Section 4.1) to calculate a risk quotient (PEC / PNEC). If the risk quotient is greater than 1, this indicates that the conservatively estimated concentration in water exceeds the aquatic estimated no-effect level and that there exists a potential to cause harm in the aquatic ecosystem. A value below 1 indicates that concentrations that may cause an effect to sensitive aquatic organisms are not reached and therefore harm to aquatic organisms is less likely under this scenario.
A risk quotient was determined for each theoretical facility, representing one of the following: a notifier responding to a CEPA section 71 survey, an importer identified in international trade data, or a company identified in market research reports, associated with the substances of interest. Risk quotients were also determined from NPRI release data.
Table B-1. Parameters used in near-field scenario
Abbreviation Parameter Value Units Notes
Qty Quantity of substance reported by notifier
Quantity from Inventory Update,
CBSA, or market
research
kg/year Substance-specific
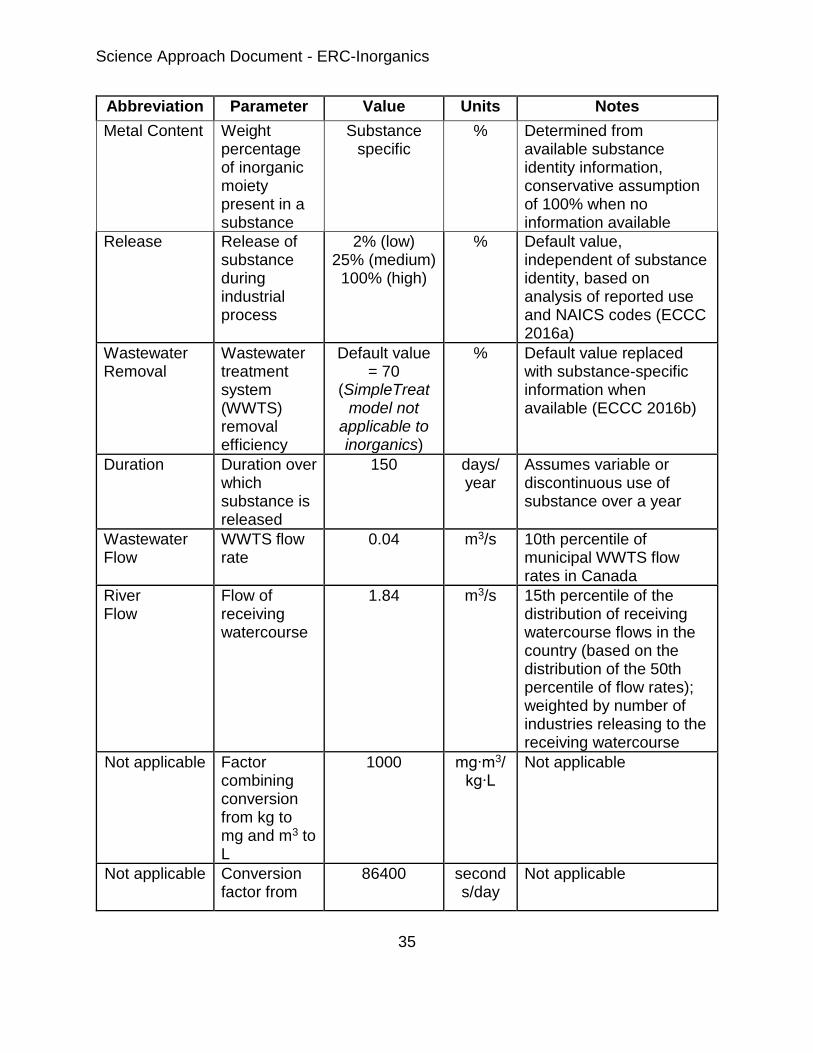
Science Approach Document - ERC-Inorganics
35
Abbreviation Parameter Value Units Notes
Metal Content Weight percentage of inorganic moiety present in a substance
Substance specific
% Determined from available substance identity information, conservative assumption of 100% when no information available
Release Release of substance during industrial process
2% (low) 25% (medium)
100% (high)
% Default value, independent of substance identity, based on analysis of reported use and NAICS codes (ECCC 2016a)
Wastewater Removal
Wastewater treatment system (WWTS) removal efficiency
Default value = 70
(SimpleTreat model not
applicable to inorganics)
% Default value replaced with substance-specific information when available (ECCC 2016b)
Duration Duration over which substance is released
150 days/ year
Assumes variable or discontinuous use of substance over a year
Wastewater Flow
WWTS flow rate
0.04 m3/s 10th percentile of municipal WWTS flow rates in Canada
River Flow
Flow of receiving watercourse
1.84 m3/s 15th percentile of the distribution of receiving watercourse flows in the country (based on the distribution of the 50th percentile of flow rates); weighted by number of industries releasing to the receiving watercourse
Not applicable Factor combining conversion from kg to mg and m3 to L
1000 mg∙m3/ kg∙L
Not applicable
Not applicable Conversion factor from
86400 seconds/day
Not applicable
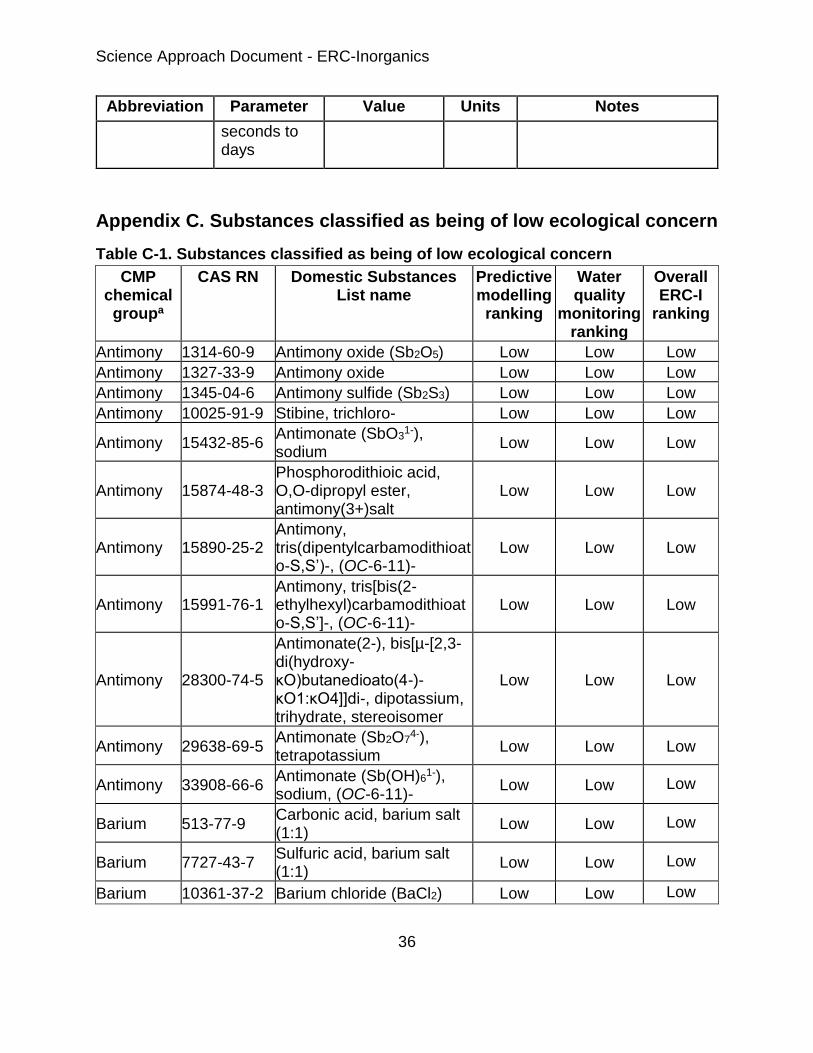
Science Approach Document - ERC-Inorganics
36
Abbreviation Parameter Value Units Notes
seconds to days
Appendix C. Substances classified as being of low ecological concern
Table C-1. Substances classified as being of low ecological concern
CMP chemical groupa
CAS RN Domestic Substances List name
Predictive modelling
ranking
Water quality
monitoring ranking
Overall ERC-I
ranking
Antimony 1314-60-9 Antimony oxide (Sb2O5) Low Low Low
Antimony 1327-33-9 Antimony oxide Low Low Low
Antimony 1345-04-6 Antimony sulfide (Sb2S3) Low Low Low
Antimony 10025-91-9 Stibine, trichloro- Low Low Low
Antimony 15432-85-6 Antimonate (SbO3
1-), sodium
Low Low Low
Antimony 15874-48-3 Phosphorodithioic acid, O,O-dipropyl ester, antimony(3+)salt
Low Low Low
Antimony 15890-25-2 Antimony, tris(dipentylcarbamodithioato-S,S’)-, (OC-6-11)-
Low Low Low
Antimony 15991-76-1 Antimony, tris[bis(2-ethylhexyl)carbamodithioato-S,S’]-, (OC-6-11)-
Low Low Low
Antimony 28300-74-5
Antimonate(2-), bis[µ-[2,3-di(hydroxy-κO)butanedioato(4-)-κO1:κO4]]di-, dipotassium, trihydrate, stereoisomer
Low Low Low
Antimony 29638-69-5 Antimonate (Sb2O7
4-), tetrapotassium
Low Low Low
Antimony 33908-66-6 Antimonate (Sb(OH)6
1-), sodium, (OC-6-11)-
Low Low Low
Barium 513-77-9 Carbonic acid, barium salt (1:1)
Low Low Low
Barium 7727-43-7 Sulfuric acid, barium salt (1:1)
Low Low Low
Barium 10361-37-2 Barium chloride (BaCl2) Low Low Low
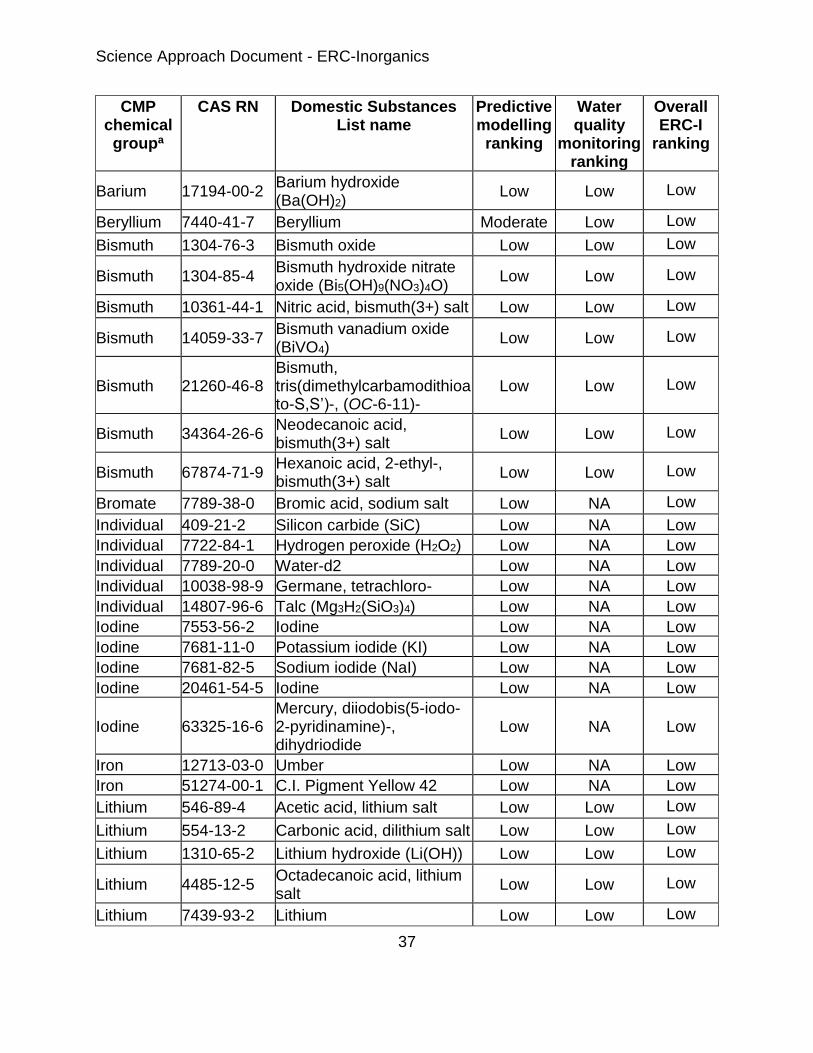
Science Approach Document - ERC-Inorganics
37
CMP chemical groupa
CAS RN Domestic Substances List name
Predictive modelling
ranking
Water quality
monitoring ranking
Overall ERC-I
ranking
Barium 17194-00-2 Barium hydroxide (Ba(OH)2)
Low Low Low
Beryllium 7440-41-7 Beryllium Moderate Low Low
Bismuth 1304-76-3 Bismuth oxide Low Low Low
Bismuth 1304-85-4 Bismuth hydroxide nitrate oxide (Bi5(OH)9(NO3)4O)
Low Low Low
Bismuth 10361-44-1 Nitric acid, bismuth(3+) salt Low Low Low
Bismuth 14059-33-7 Bismuth vanadium oxide (BiVO4)
Low Low Low
Bismuth 21260-46-8 Bismuth, tris(dimethylcarbamodithioato-S,S’)-, (OC-6-11)-
Low Low Low
Bismuth 34364-26-6 Neodecanoic acid, bismuth(3+) salt
Low Low Low
Bismuth 67874-71-9 Hexanoic acid, 2-ethyl-, bismuth(3+) salt
Low Low Low
Bromate 7789-38-0 Bromic acid, sodium salt Low NA Low
Individual 409-21-2 Silicon carbide (SiC) Low NA Low
Individual 7722-84-1 Hydrogen peroxide (H2O2) Low NA Low
Individual 7789-20-0 Water-d2 Low NA Low
Individual 10038-98-9 Germane, tetrachloro- Low NA Low
Individual 14807-96-6 Talc (Mg3H2(SiO3)4) Low NA Low
Iodine 7553-56-2 Iodine Low NA Low
Iodine 7681-11-0 Potassium iodide (KI) Low NA Low
Iodine 7681-82-5 Sodium iodide (NaI) Low NA Low
Iodine 20461-54-5 Iodine Low NA Low
Iodine 63325-16-6 Mercury, diiodobis(5-iodo-2-pyridinamine)-, dihydriodide
Low NA Low
Iron 12713-03-0 Umber Low NA Low
Iron 51274-00-1 C.I. Pigment Yellow 42 Low NA Low
Lithium 546-89-4 Acetic acid, lithium salt Low Low Low
Lithium 554-13-2 Carbonic acid, dilithium salt Low Low Low
Lithium 1310-65-2 Lithium hydroxide (Li(OH)) Low Low Low
Lithium 4485-12-5 Octadecanoic acid, lithium salt
Low Low Low
Lithium 7439-93-2 Lithium Low Low Low
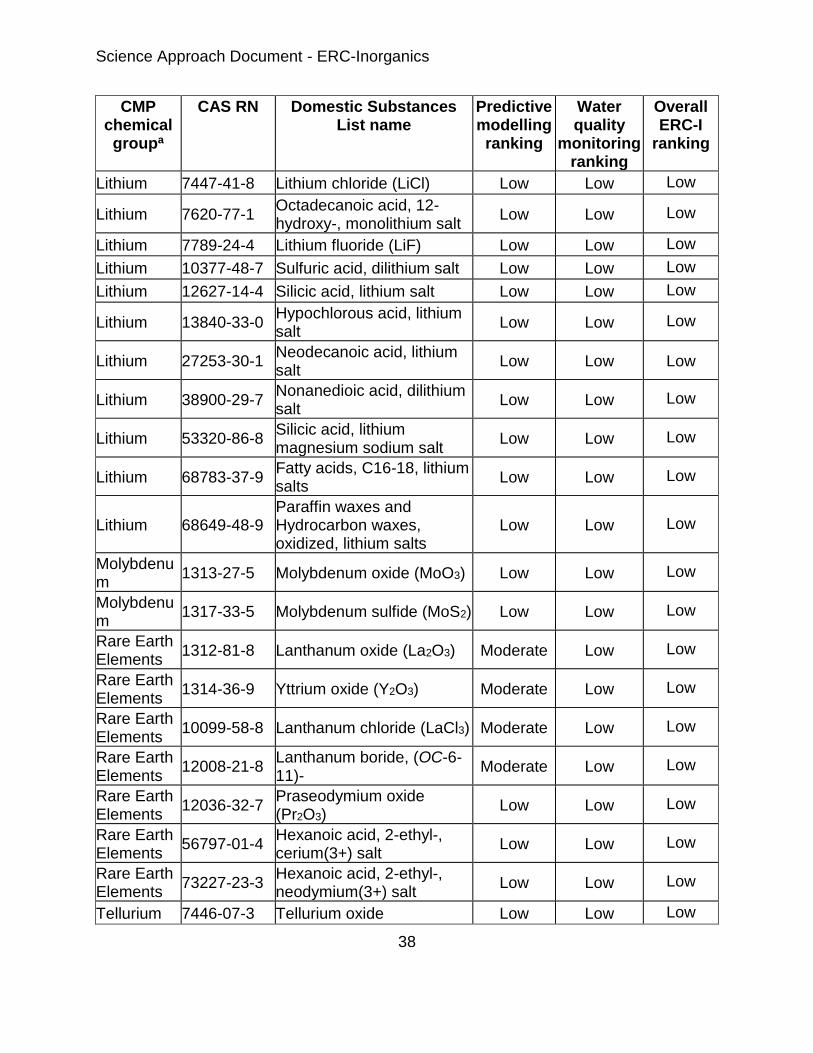
Science Approach Document - ERC-Inorganics
38
CMP chemical groupa
CAS RN Domestic Substances List name
Predictive modelling
ranking
Water quality
monitoring ranking
Overall ERC-I
ranking
Lithium 7447-41-8 Lithium chloride (LiCl) Low Low Low
Lithium 7620-77-1 Octadecanoic acid, 12-hydroxy-, monolithium salt
Low Low Low
Lithium 7789-24-4 Lithium fluoride (LiF) Low Low Low
Lithium 10377-48-7 Sulfuric acid, dilithium salt Low Low Low
Lithium 12627-14-4 Silicic acid, lithium salt Low Low Low
Lithium 13840-33-0 Hypochlorous acid, lithium salt
Low Low Low
Lithium 27253-30-1 Neodecanoic acid, lithium salt
Low Low Low
Lithium 38900-29-7 Nonanedioic acid, dilithium salt
Low Low Low
Lithium 53320-86-8 Silicic acid, lithium magnesium sodium salt
Low Low Low
Lithium 68783-37-9 Fatty acids, C16-18, lithium salts
Low Low Low
Lithium 68649-48-9 Paraffin waxes and Hydrocarbon waxes, oxidized, lithium salts
Low Low Low
Molybdenum
1313-27-5 Molybdenum oxide (MoO3) Low Low Low
Molybdenum
1317-33-5 Molybdenum sulfide (MoS2) Low Low Low
Rare Earth Elements
1312-81-8 Lanthanum oxide (La2O3) Moderate Low Low
Rare Earth Elements
1314-36-9 Yttrium oxide (Y2O3) Moderate Low Low
Rare Earth Elements
10099-58-8 Lanthanum chloride (LaCl3) Moderate Low Low
Rare Earth Elements
12008-21-8 Lanthanum boride, (OC-6-11)-
Moderate Low Low
Rare Earth Elements
12036-32-7 Praseodymium oxide (Pr2O3)
Low Low Low
Rare Earth Elements
56797-01-4 Hexanoic acid, 2-ethyl-, cerium(3+) salt
Low Low Low
Rare Earth Elements
73227-23-3 Hexanoic acid, 2-ethyl-, neodymium(3+) salt
Low Low Low
Tellurium 7446-07-3 Tellurium oxide Low Low Low
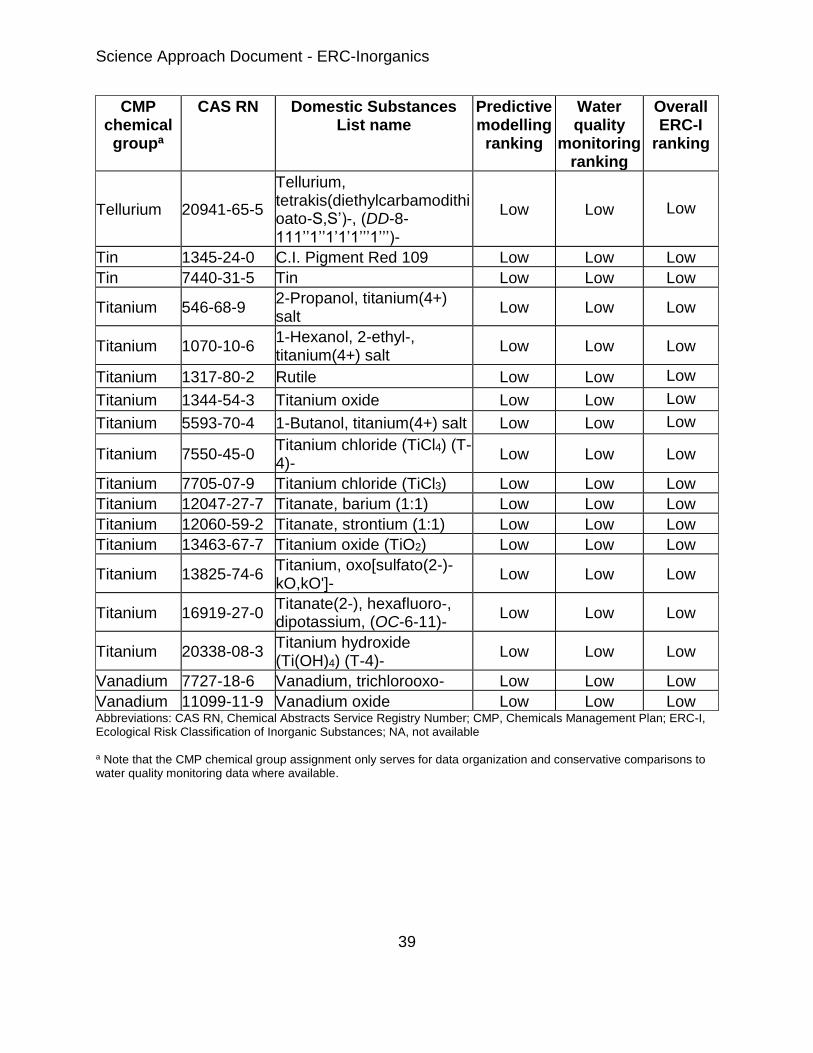
Science Approach Document - ERC-Inorganics
39
CMP chemical groupa
CAS RN Domestic Substances List name
Predictive modelling
ranking
Water quality
monitoring ranking
Overall ERC-I
ranking
Tellurium 20941-65-5
Tellurium, tetrakis(diethylcarbamodithioato-S,S’)-, (DD-8-111’’1’’1’1’1’’’1’’’)-
Low Low Low
Tin 1345-24-0 C.I. Pigment Red 109 Low Low Low
Tin 7440-31-5 Tin Low Low Low
Titanium 546-68-9 2-Propanol, titanium(4+) salt
Low Low Low
Titanium 1070-10-6 1-Hexanol, 2-ethyl-, titanium(4+) salt
Low Low Low
Titanium 1317-80-2 Rutile Low Low Low
Titanium 1344-54-3 Titanium oxide Low Low Low
Titanium 5593-70-4 1-Butanol, titanium(4+) salt Low Low Low
Titanium 7550-45-0 Titanium chloride (TiCl4) (T-4)-
Low Low Low
Titanium 7705-07-9 Titanium chloride (TiCl3) Low Low Low
Titanium 12047-27-7 Titanate, barium (1:1) Low Low Low
Titanium 12060-59-2 Titanate, strontium (1:1) Low Low Low
Titanium 13463-67-7 Titanium oxide (TiO2) Low Low Low
Titanium 13825-74-6 Titanium, oxo[sulfato(2-)-kO,kO']-
Low Low Low
Titanium 16919-27-0 Titanate(2-), hexafluoro-, dipotassium, (OC-6-11)-
Low Low Low
Titanium 20338-08-3 Titanium hydroxide (Ti(OH)4) (T-4)-
Low Low Low
Vanadium 7727-18-6 Vanadium, trichlorooxo- Low Low Low
Vanadium 11099-11-9 Vanadium oxide Low Low Low Abbreviations: CAS RN, Chemical Abstracts Service Registry Number; CMP, Chemicals Management Plan; ERC-I, Ecological Risk Classification of Inorganic Substances; NA, not available a Note that the CMP chemical group assignment only serves for data organization and conservative comparisons to water quality monitoring data where available.