Embed Size (px)
Citation preview
Review ArticleVolume 2 Issue 2 - March 2017DOI: 10.19080/IJESNR.2017.02.555581
Int J Environ Sci Nat ResCopyright © All rights are reserved by Sophia Barinova
On the Classification of Water Quality from an Ecological Point of View*Sophia BarinovaInstitute of Evolution, University of Haifa, Israel
Submission: March 22, 2017; Published: March 31, 2017
*Corresponding author: Sophia Barinova, Institute of Evolution, University of Haifa, Mount Carmel, 199 Abba Khoushi Ave, Haifa 3498838, Israel, Email:
IntroductionWith the development of industry and agriculture, the
quality of surface water is becoming increasingly important and requires attention for the assessment and conservation of water resources. The maintenance of water quality at a high level is of considerable importance. For the most part the water intake comes from natural sources, including rivers, lakes, and reservoirs. The quality of water should be not only assessed, but also predicted. Under natural conditions, water quality depends on river basin and on the ecosystem of the water body. Considering that water quality assessment is rather expensive, elaboration of express-methods of its assessment is an urgent problem.
The bio-indication analysis is based on the hierarchic organization of the biotic community, which is described by the model of trophic pyramid [1]. However, in the natural ecosystem relationship between the levels is more complicated [2]. The distribution of the groups of organisms or species over the intervals of the environmental factors is also of considerable importance.
Aquatic Ecosystem State AssessmentPollution in the freshwater aquatic objects is complicated
system of problems and methods for dissolved of which needs more understanding for ecosystem structure and relevancy of methods for its state assessment. Figure 1 present our system
of matter transformation in the aquatic ecosystem. The methods and indices that can be used for assessment of pollution impact on the natural water bodies are based on the ecological point of view to the water and biota relationships. As can be seen in the model, the basic level is represented by nutrients, i.e. dissolved matters, which can be used for proteins creation by mechanisms of photosynthesis as well as with heterotrophic way. In any case in the production of proteins is involved at the level of primary producers, that assume that algae can be used as bio-indicators of pollution impact (Figure 1).
Figure 1: The Model of trophic cascade in aquatic ecosystems.
Aquatic ecosystems of fresh and brackish water bodies are heavily prevalent on the Earth’s surface. The relationships
Int J Environ Sci Nat Res 2(2): IJESNR.MS.ID.555581 (2017) 0038
Abstract
In the base of our experience we are presented the most continually system of the water quality classification. The system included chemical, physical, and biological variables that ranged into five or even six Classes of water quality and nine ranks. The system covers the entire range of environmental indicators in which the existence of an aquatic ecosystem is possible. At the heart of the classification is Vladimir Sladechek’s model, which covers all possible types of water that exist in nature. In the presented classification, only one quadrant describing natural aquatic habitats with photosynthetic in the basis of the trophic pyramid is mentioned. The WESI index calculated on the basis of this classification of the index of saprobitys and the concentration of trophic elements in water is also presented. The index reflects the degree of toxic effects of the environment on the photosynthetic process in the ecosystem.
Keywords: Water Quality; Classification; Aquatic ecosystem; Nutrients; Toxicity; Self-purification
How to cite this article: Barinova S. On the Classification of Water Quality from an Ecological Point of View. Int J Environ Sci Nat Res. 2017;2(2): 555581.DOI: 10.19080/IJESNR.2017.02.555581.039
International Journal of Environmental Sciences & Natural Resources
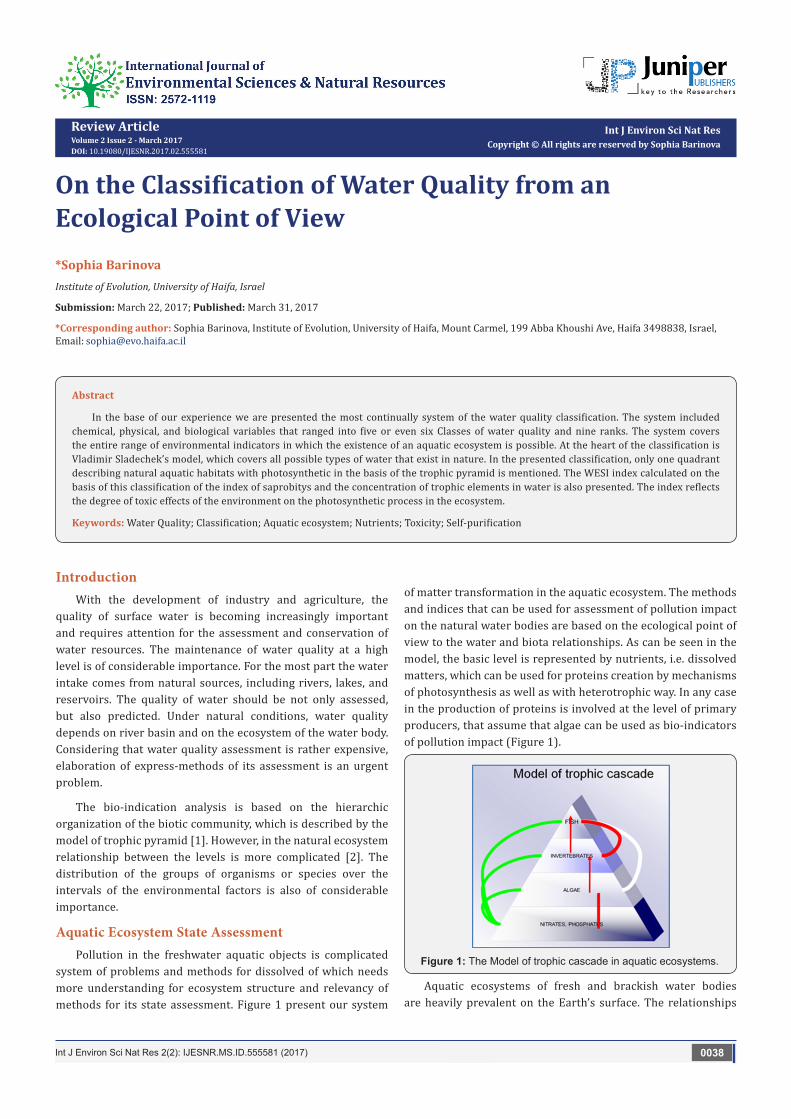
between algal biodiversity and environmental conditions are determined by adaptation level of the species and the community as a whole. Bioindication is based on the principal of congruence between community composition and complexity of environmental factors. However, it is still a problem to define the role of particular environmental variables as well as to predict the community’s response to environmental change. Nevertheless, it is the problem of how to summarize information about environment and biota that can be classified for pollution impact assessment. The mutual influence of the diversity of freshwater algae and their habitat ecology of the species is determined, developing in the study community. The basis of the principle is of bio-indication compliance the community composition to the parameters of its habitat. However, to identify the role of certain environmental factors in the formation of algae, as well as assess the community response to environmental changes, still presents difficulties [3,4]. We developed our system for assessment of ecosystem state that included not only environmental variables but also biotic components. Figure 2 represent system of assessment approach that can at the end gives trophic state and toxicity impact in the studied ecosystem [3,4], (Figure 2).
Figure 2: Aquatic Ecosystem State Assessment model.
For the purpose of ecosystem state assessment we can do two steps in the left pathway of the model for chemical variables classification and for the biotic diversity and bio-indication assessment in the right pathway of the model.
Figure 3: Dynamic of biological and related nutrients concentration over Water Quality Ranks.
As known, the natural aquatic object water chemical variables are very diverse and we classified it for natural and anthropogenic pollutants. Both groups are impacted of the biotic diversity developing but correlated each other with ecosystem state. Figures 3 & 4 present dynamic of few major chemical and biotic variables in the trend of natural object pollution increasing (Figures 3 & 4).
Figure 4: Dynamic of chemical pollutants concentration over Water Quality Class.
Figure 5: Dynamic of algal cells abundance over water pollution increasing.
Bio-indication methods are based on the ecological preferences of each species of algae in the environmental gradients. Figure 5 represent bio-indication amplitude and optimums of two species with different ecological preferences (Figure 5). In this case, the bio-indication method consisting of the analysis of biota response to changes in the environmental conditions takes on great significance. It should be noted that bio-indication differs from bioassay.
The major methods of pollution impact assessment can be divided into three different groups:
a. Methods of bio-indication on the base of species ecology that occupied studied natural habitat.
b. Methods of bio-test that based on the organisms respond to the environment in which it is inserted and.
c. Methods that are based on the chemical variables only for calculation of the Water Quality Index, WQI [5].

How to cite this article: Barinova S. On the Classification of Water Quality from an Ecological Point of View. Int J Environ Sci Nat Res. 2017;2(2): 555581.DOI: 10.19080/IJESNR.2017.02.555581.040
International Journal of Environmental Sciences & Natural Resources
The first method can be used for the natural water resources assessment as a part of the aquatic ecosystem state analysis. The second method can give best results when we need water toxicity assessment in the water sample from any object. Third method used without correlation of biotic and environmental variables. The aim of present study was given to the first, the bio-indication method and the water variables ranking in aquatic ecosystem of the surface water bodies.
Methods and ApproachesChemistry and Toxicity Methods
Figure 6: Saprobity model.
All the pollutants and nutritional elements entering the water object affect the biotic component of ecosystem, starting with algae as the primary producers, and disruptors of the biotic/a biotic equilibrium [1] (Figure 6). Figure 6 Saprobity model based on [1]. The arrows on the model represent the ideal index of saprobitys amplitude of analyzed aquatic ecosystem as in [3]. Each quadrant (Katarobity, Limnosaprobity, Eusaprobity, and Transsaprobity) symbolize four main groups of variables with respect to purity and pollution of all freshwaters [1]. The symbols: x, o, β, α, p, denote the self-purification zones, which, in turn, are used to determine Classes of water quality I-V, (Table 1).Table 1: Water Quality Class, Index of Saprobitys, and Zones of self-purification.
Water Quality
Class
Self-purification
zoneRank Index
Saprobitys Saprobity zone
1 1 1 0-0.5 xenosaprobity
2 2a 2 0.5-1.0 β-oligo-saprobity
2 2b 3 1.1-1.5 α-oligo-saprobity
3 3a 4 1.6-2.0 β’-meso-saprobity
3 3b 5 2.1-2.5 β’’-meso-saprobity
4 4a 6 2.6-3.0 α’-alpha-meso-saprobity
4 4b 7 3.1-3.5 α’’- alpha-meso-saprobity
5 5a 8 3.6-4.0 β-polysaprobity
5 5b 9 >4.0 α-polysaprobity
The main attention to the Sladecek [1] model should be given to the quadrant 1, the upper left one. Here, the parameters of aquatic ecosystems, which are based on the trophic pyramid photosynthetic organisms, are reflected. That is, the parameters of the environment and biota from this quadrant are continually describing natural aquatic ecosystems in full range of its existing. Therefore the Sladecek’s model gives us base for the water chemical data continual classification as well as the some related biotic parameters also. Therefore, the main points of our approach are:
1) All range of the living aquatic ecosystem existence, and
2) Continual classification in the frame of the full range parameters.
Estimates of water quality include four major approaches, namely:
a. Complete chemical analysis;
b. Useofindicatoror ganism ssuccessful in the given environment;
c. Partialchemical analysis including the mostsignifi cantvariables;
d. Bio-testing with a selected test organism sensitive to chemical pollution.
Insofar as the complete analysis is rather expensive, effective approaches to monitoring aquatic objects are based on selected indicator systems, in particular the biotic ones, giving an integral estimate of water quality [6]. Of the available bio-monitoring methods, those based on primary producer components, such as freshwater algae, are the most promising [7]. Three approaches are internationally recognized based on:
i. Organisms responses;
ii. Population responses;
iii. Integral biotic community responses.
In the first case, a critical variable is the intensity of photosynthesis under stressful conditions. In the second case, it is the dynamics of morphophysiological variations, and in the third one the density and diversity of all the constitutive elements of the biotic community. The latter approach is commonly recognized as the most informative, reflecting the self-purification ability of the water ecosystem in combination with bio-testing; it is the ideal tool for monitoring aquatic objects.
Water Quality ClassificationFrom many classification systems of monitoring parameters
that are used in European countries, we find a more uniform

How to cite this article: Barinova S. On the Classification of Water Quality from an Ecological Point of View. Int J Environ Sci Nat Res. 2017;2(2): 555581.DOI: 10.19080/IJESNR.2017.02.555581.041
International Journal of Environmental Sciences & Natural Resources
and continual classification over all the parameters in the system which was created on the base of international inter-calibration expeditions and applied in river monitoring in Russia, the Former Soviet Union countries [8], and France [3] (Table 1) as a part of system. In Europe a system using several standard parameters for river monitoring can be found. However, for many countries such Israel, this methodology is applied for the first time. The results are presented [9] as a scale
of water quality along the rivers using bio-indication methods. The relationship between the saprobity’s index and the water quality category [3] is presented in (Tables 1 & 2). The water in the water bodies’ classification from ecological point of view is given in followed (Tables 1-6) [3]. The water quality for different purposes required fewer standards than for the natural aquatic objects and in the Natural Conservation and Reserves areas. Color standards scale given in (Table 7) (Tables 1-7).
Table 2: Ecological water quality classification.
Water quality Class Rank
NH4+
mg N/L
NO2-
mg N/L
NO3-
mg N/L
PO43-
mg P/LO2% Conductivity,
µsm/cmSladecek’s
saprobitys
I - very pure 1 < 0.05 0 < 0.05 < 0.005 100 < 400 <0.5
II -pure 2 0.05-0.10 0.001-0.002 0.05-0.20 0.005-0.015 91-100 400-700 0.5-1.0
II -pure 3 0.11-0.20 0.003-0.005 0.21-0.50 0.016-0.030 81-90 400-700 1.0-1.5
III -moderate 4 0.21-0.30 0.006-0.010 0.51-1.00 0.031-0.050 71-80 700-1100 1.5-2.0
III - moderate 5 0.31-0.50 0.011-0.020 1.01-1.50 0.051-0.100 61-70 700-1100 2.0-2.5
IV - polluted 6 0.51-1.00 0.021-0.050 1.51-2.00 0.101-0.200 51-60 1100-1300 2.5-3.0
IV - polluted 7 1.01-2.50 0.051-0.100 2.01-2.50 0.201-0.300 31-50 1100-1300 3.0-3.5
V -very polluted 8 2.51-5.00 0.101-0.300 2.51-4.00 0.301-0.600 10-30 1300-1600 3.5-4.0
V -very polluted 9 > 5.00 > 0.300 > 4.00 > 0.600 > 10 > 1600 >4.0
Table 3: Ecological water quality classification, biological variables.
Water quality Class Rank
BOD
mg О2/L
Phytoplan-kton
biomass,
mg/L
Filamen-tous algae biomass,
kg/m2
Primary Production ,
g О2 m-2х day-1
Bacterio-plankton
abundance, 106 cells/mL
Saprotrophic bacteria
abundance,
103 cells./L
E. coli, 103 cells/L
I 1 <0.4 <0.1 <0.1 <1.50 <0.3 <0.1 <0.003
II 2 0.4-0.7 0.1-0.5 0.1-0.2 1.55-3.0 0.3-0.5 0.1-0.5 0.003-0.5
II 3 0.8-1.2 0.6-1.0 0.3-0.5 3.05-4.50 0.6-1.6 0.6-1.0 0.6-2.0
III 4 1.3-1.6 1.1-2.0 0.6-1.0 4.55-6.0 1.6-2.5 1.1-3.0 2.1-6.0
III 5 1.7-2.1 2.1-5.0 1.1-1.5 6.05-7.50 2.6-5.0 3.1-5.0 6.1-10.0
IV 6 2.2-4.0 5.1-10.0 1.6-2.0 7.55-9.0 5.1-7.0 5.1-7.0 11.0-50.0
IV 7 4.1-7.0 10.1-50.0 2.1-2.5 9.05-10.50 7.1-10.0 7.1-10.0 51.0-100.0
V 8 7.0-10.0 50.1-100.0 2.6-3.0 10.55-12.0 10.1-20.0 10.1-100.0 110-1000
V 9 >10.0 > 100 >3.0 >12.0 >20.0 >100.0 >1000
Table 4: Quality standards of flow surface water from the ecological point of view.
VariableWater Quality Class
I II III IV V VI
А. Environmental inorganic variables
Temperature, ºС < 20 25 25 30 30 > 30
pH 6.5-8.0 6.5-8.5 6.5-8.5 6.0-8.5 6.0-9.0 6.0-9.0
Oxygen Dissolved, mg/L > 8 6 5 4 2 < 2
Oxygen Saturation, % > 90 75 60 40 20 < 20
Conductivity, µSm/cm < 400 400-700 700-1100 1100-1300 1300-1600 > 1600
TDS, mg/L < 300 500 800 1000 1200 > 1200
TSS, mg/L < 20 30 50 100 200 > 200
Total Hardness, Н° < 15 20 30 40 50 > 50
Cl-, mg/L < 50 150 200 300 500 > 500

How to cite this article: Barinova S. On the Classification of Water Quality from an Ecological Point of View. Int J Environ Sci Nat Res. 2017;2(2): 555581.DOI: 10.19080/IJESNR.2017.02.555581.042
International Journal of Environmental Sciences & Natural Resources
Sulphates, mg/L < 50 150 200 300 400 > 400
Fetot., mg/L < 0.5 1 1 5 10 > 10
Mntot, mg/L < 0.5 0.1 0.3 0.8 1.5 > 1.5
N-NH4+, mg/L < 0.1 0.2 0.5 2.0 5.0 > 5.0
N-NO2-, mg/L < 0.002 0.005 0.02 0.05 0.1 > 0.1
N-NO3-, mg/L < 1 3 5 10 20 > 20
PO4, mg/L < 0.025 0.2 0.5 1.0 2.0 > 2.0
Ptot., PO4, mg/L < 0.5 0.4 1.0 2.0 3.0 > 3.0
B. Organic pollutants
COD (KMnO4), mg О2/L < 5 10 20 30 40 > 40
COD (K2CrO4), mg О2/L < 15 25 50 70 100 > 100
BOD, mg О2/L < 2 4 8 15 25 > 25
C org., mg/L < 3 5 8 12 20 > 20
Extractives, mg/L < 0.2 0.5 1.0 3.0 5.0 > 5.0
N org., mg/L < 0.5 1.0 2.0 5.0 10.0 > 10.0
C. Inorganic industrial pollutants
Hg, mkg/L < 0.1 0.2 0.5 1 5 > 5
Cd, mkg/L < 3 5 10 20 30 > 30
Pb, mkg/L < 10 20 50 100 200 > 200
As, mkg/L < 10 20 50 100 200 > 200
Cu, mkg/L < 20 50 100 200 500 > 500
Cr (total) mkg/L < 20 50 100 200 500 > 500
Cr (3+), mkg/L < 20 100 200 500 1000 > 1000
Cr (6+), mkg/L 0 20 20 50 100 > 100
Co, mkg/L < 10 20 50 100 500 > 500
Ni, mkg/L < 20 50 100 200 500 > 500
Zn, mg/L < 0.2 1.0 2.0 5.0 10.0 > 10.0
CN, light, mg/L 0 0 0.05 0.1 0.2 > 0.2
CN total, mg/L 0 0 0.5 1.0 2.0 > 2.0
F-, mg/L < 0.2 0.5 1.0 1.5 3.0 > 3.0
Cl2, mg/L 0 0 0 0.05 0.1 > 0.1
SO3-, mg/L 0 0 0 0.01 0.02 > 0.02
D. Organic industrial pollutants
Detergents, mg/L 0 0.5 1.0 2.0 3.0 > 3.0
Phenols, light, mg/L < 0.002 0.01 0.05 0.1 1.0 > 1.0
Oil, mg/L 0 0.05 0.1 0.3 1.0 > 1.0
E. Biological variables
Index Saprobitys S < 1.0 1.5 2.5 3.5 4.0 > 4.0
Self-purification zone Xeno- Oligo- Beta-meso- Alpha-meso- Poly- Hyper-
E. coli 1 0.1 0.01 0.001 0.001 < 0.001
Bacterioplankton, total abundance < 5 105 < 106 < 3 106 < 5 106 < 107 < 107
Reducing the intensity of biochemical transformation 0 0 < 10% < 30% < 70% >70%
How to cite this article: Barinova S. On the Classification of Water Quality from an Ecological Point of View. Int J Environ Sci Nat Res. 2017;2(2): 555581.DOI: 10.19080/IJESNR.2017.02.555581.043
International Journal of Environmental Sciences & Natural Resources
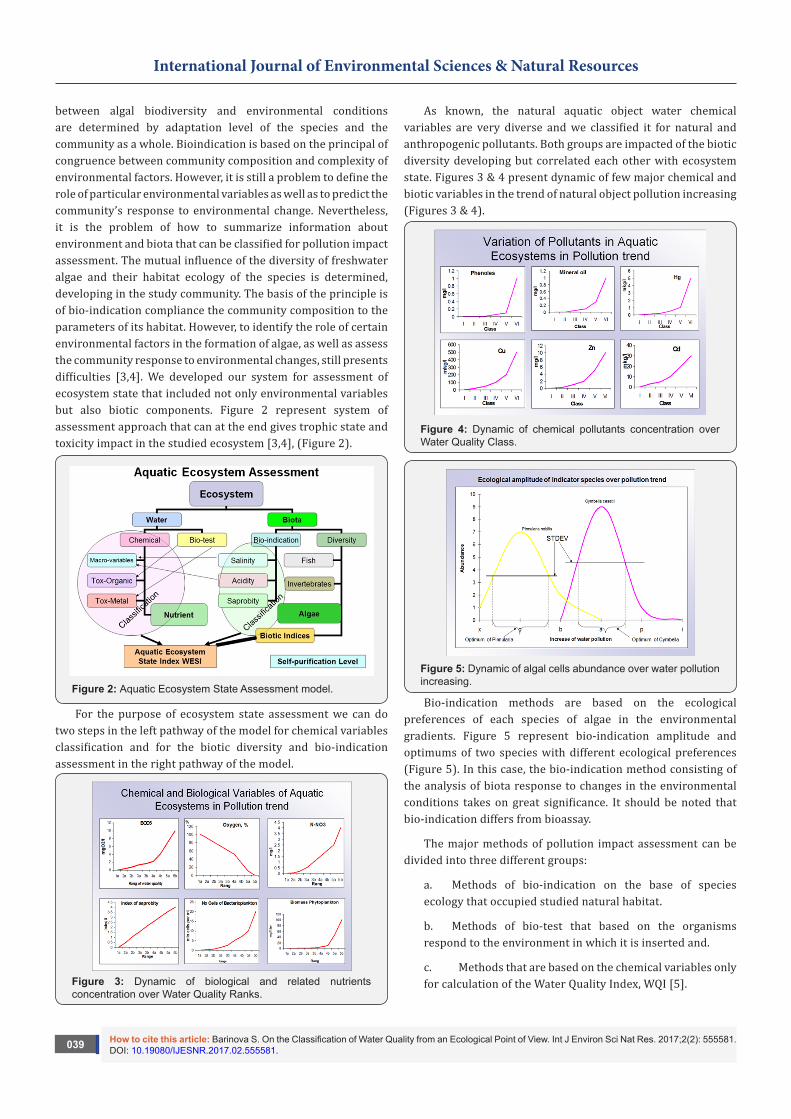
Table 5: Variables and quality standards of stagnant water.
Variable SeasonClass of Water Quality
I II III IY Y YI
Average oxygen saturation, % Peak summer stagnation, hypolimnion ≥60 ≥20 ≥10 ≥0 0 0
Dissolved oxygen, mg О2/L Peak summer stagnation, at the bottom ≥4 ≥2 ≥1 ≥0 0 0
Table 6: The quality of water used for various purposes.
VariableValue
Preferred Permissible
I. Water used for drinking water supply
Group А
Temperature, °С 15 20
рН 6.6-8.0 6.5-8.5
TDS, mg/L 400 800
Hardness 15 20
Cl-, mg/L 100 300
SO42-, mg/L 100 400
Fe (total)*4, mg/L 0.3 0.5
Mn (total)*4, mg/L 0.05 0.1
N-NH4+, mg/L 0.05 1.0
N-NO2-*5, mg/L 0 0.002
N-NO3-*5, mg/L 5 10
Group B
COD (KMnO4), mg О2/L 5 10
COD (K2CrO4), mg О2/L 15 25
BOD, mg О2/L 3-4 5
Extractives, ССl, mg/L 0.2 0.5
Group C
Hg, mkg/L - 1
Cd, mkg/L - 10
Pb, mkg/L - 50
As, mkg/L - 50
Cu, mkg/L - 1000
Cr (total), mkg/L - -
Ni, mkg/L - 100
Zn, mg/L - 5
CN, light, mg/L - 0.05
CN total, mg/L - -
F-, mg/L 1.0 1.5
Group D
Anionicdetergents, mg/L - -
Phenols, light, mg/L - -
Oil and derivates, mg/L - -
Specific variables
Color, vuPt/L 10 20 - 30
Odor - -
Ba, mg/L 0.1 1.0 - 4.0
B, mg/L 0.5 1.0

How to cite this article: Barinova S. On the Classification of Water Quality from an Ecological Point of View. Int J Environ Sci Nat Res. 2017;2(2): 555581.DOI: 10.19080/IJESNR.2017.02.555581.044
International Journal of Environmental Sciences & Natural Resources
Se, mkg/L - 10.0
Ag, mkg/L - 50.0
V, mkg/L - -
II. Water used for irrigation and livestock watering
Group А
рН 6.0-8.5 5.0-9.0
TDS, mg/L 500 1200
Cl-, mg/L 300 400
Fe (total), mg/L 1.5 10
Mn (total), mg/L 0.2 0.8
Table 7: Relationship between biotic index, Saprobity index, and Class of water quality.
Class of water quality Biotic index Saprobic zone Color code Water quality
I 10-9 Xeno- Blue Slightly polluted or unpolluted
II 8-7 Oligo- Green Slightly polluted
III 6-5 β-Meso- Yellow Moderately polluted - a critical situation
IV 4-3 α-Meso- Orange Heavily polluted
V 2-0 Poly Red Very heavily polluted
VI 0 Hyper-Poly- Black The study is not possible, the complete absence of bioindicators
Aquatic Ecosystem Sustainability Index (WESI)The Photosynthetic process in the aquatic environment
is subjected to the influence of stress factors, including many toxicants. As a result of the stress, the communities of autotrophic organisms gave way to the communities of heterotrophic organisms. This process influences the composition and abundance of algal species in the community. In this case, the concentration of nutrients remains rather high. Thus, the degree of the influence of the stress factor on aquatic ecosystem can be assessed from the comparison of the saprobic indices and the content of nutrients. In this case, the number of the S rank should be divided by the number of the rank of nitrate or phosphate content (the WESI –Aquatic Ecosystem State Index). The integral index of aquatic ecosystem sustainability (WESI) was constructed based on the results of our studies [3]. It is based on the water quality ranges (Table 2) as determined by Sladecek’s saprobity indices and nitrate (or phosphates) concentrations. The resulting WESI index reflects the self-purification capacities of the river system [3], and is calculated from equation 1:
WESI = Rank S / Rank N-NO3 (Eq. 1)
Where:
Rank S – the rank of water quality according to the range of the Sladecek’s saprobity indices (Table 2) calculated for the sampling station.
Rank N-NO3– water quality rank according to the range of nitric-nitrogen concentrations scale (Table 2).
The WESI index varies from 0 to 5. At WESI ≥ 1, the photosynthetic level is positively correlated with the level of nitrate concentration. At WESI < 1, photosynthesis is suppressed (presumably due to a toxic disturbance). In the water bodies slightly contaminated by toxicants, autotrophic, myxotrophic, and heterotrophic species are registered in the community.
Why Index SAs the last sentence, can be described why we are chosen
Index saprobitys from many others that were calculated practically in each country. First, that because the Index S is a part of continual system of Sladecek. This index is covered all ranks of living ecosystem variables and therefore can be classified with them synchronously. Second, many other indices of saprobitys are created for the water variables that are presented in the water bodies of the particular country-developer. Therefore, particular indices cannot represent some ranks of water variables in other regions or countries with the exception of Index S. Third, the vast majority of indices are developed on the species of diatoms. It would seem, why not, if this group is so well-studied with respect to taxonomy and morphology. But there is a problem that diatoms are well represented in the aquatic communities of European countries-developers, related to the boreal zone. When we explore communities in the more southern regions, such as Ukraine, Turkey, Pakistan, India or Israel, we are faced with the fact that diatoms represents only a relatively small part of the communities, but green algae and cyanobacteria are more widely represented. Thus, the use of indices developed on diatoms becomes difficult in the southern regions but the Index
How to cite this article: Barinova S. On the Classification of Water Quality from an Ecological Point of View. Int J Environ Sci Nat Res. 2017;2(2): 555581.DOI: 10.19080/IJESNR.2017.02.555581.045
International Journal of Environmental Sciences & Natural Resources
S is occupied at all aquatic taxa. In our experience of the last years activity in the aquatic ecosystem water quality assessment with implementation of given above classification system and indices, we have many positive examples for the diverse aquatic objects in Eurasia [3,4].
Acknowledgement
This work has been partly supported by the Israeli Ministry of Absorption.
References1. Sladecek V (1973) System of water quality from the biological point of
view. Arch Hydrobiol 7: 1-218.
2. UNEP/IPCS (2006) Training Module No 3 Section C Ecological Risk Assessment. Prepared by The Edinburgh Centre for Toxicology. WHO, Geneva, Switzerland.
3. Barinova SS, Medvedeva LA, Anissimova OV (2006) Diversity of algal indicators in environmental assessment. Tel Aviv Pilies Studio, Russia.
4. Barinova S (2011) Algal diversity dynamics, ecological assessment, and monitoring in the river ecosystems of the eastern Mediterranean. Nova Science Publishers, New York, USA, pp. 363.
5. Mitchell KM, Stapp WB (1996) Field Manual for Water Quality Monitoring. IA Hunt Publishers, Dubuque, USA, pp. 304.
6. European Parliament (2000) Directive 2000/60/EC of the European Parliament and of the Council establishing a framework for community action in the field of water policy. CELEX EUR Official Journal 327: 1-72.
7. Whitton BA, Roth E, Friedrich G (1991) Use of algae for monitoring rivers. Institut fur Botanik Univ Press, Innsbruck 78(2): 200.
8. Romanenko VD, Oksijuk OP, Zhukinsky VN, Stolberg FV, Lavrik VI (1990) Ecological impact assessment of hydro technical constructions on water bodies. Kijev, Naukova Dumka, Russia, pp. 291.
9. Barinova SS, Tavassi M, Nevo E (2010) Microscopic algae in monitoring of the Yarqon River (Central Israel). LAP Lambert Academic Publishing, Saarbrucken, Germany, pp. 187.
Your next submission with Juniper Publishers will reach you the below assets
• Quality Editorial service• Swift Peer Review• Reprints availability• E-prints Service• Manuscript Podcast for convenient understanding• Global attainment for your research• Manuscript accessibility in different formats
( Pdf, E-pub, Full Text, Audio) • Unceasing customer service
Track the below URL for one-step submission https://juniperpublishers.com/online-submission.php
This work is licensed under CreativeCommons Attribution 4.0 LicensDOI: 10.19080/IJESNR.2017.02.555581