Embed Size (px)
Citation preview
1
Science Fair Packet 2010-2011
Mrs. Guartafierro Sacred Heart School
2
A NOTE TO STUDENTS
So you want to be in the Science Fair? Great idea! But what are you
going to get out of it? What is the point of science fairs anyway? Well, you
will learn how to think scientifically, how to reason logically, how to make
observations, how to perform experiments and draw conclusions, how to
make an intelligent guess in advance as to what those conclusions might be,
and how to determine whether the guess was supported, rejected, or left
unanswered. Try to think of this project as an educational and fun experience
rather than work to be done for a grade. If you are not going to enjoy doing
the project, it may be better to not do one at all. This manual was prepared
especially for you. It will be your guide from the moment you choose a topic
to the point at which you present your findings to visitors at the fair. You
will find a selection of potential topics --arranged by grade level -- from
which to choose. You will also find a number of resources (books,
periodicals, etc.) for preparing your project or choosing a topic or area to
investigate. If you have additional questions, please do not hesitate to
contact your classroom teacher, the librarian at the Heywood Library, or
other public libraries in our area. What follows is a list of important
questions for you to consider as you think about selecting a project for the
science fair.
3
THINGS TO CONSIDER
1. Does the topic interest you?
2. Do you have the ability to do the experiment?
3. Do you have the time to do the experiment?
4. Can you find enough information on the topic?
5. What materials will you need for the experiment?
6. Can you financially afford the experiment? (Try to avoid spending a great
amount of money to perform the experiment)
7. What kind of presentation is best for the experiment?
SELECTING A TOPIC
Choosing a topic for the science fair will probably be the most difficult part
of the entire process. You will probably find that making a decision is a
time-consuming and mind-boggling experience because there are so many
options available to you. For example, your topic can fall in one of the three
majors areas of science: life science, earth and space science, and physical
science. Your topic can also be grouped into one of five categories:
experiments, demonstrations, research, collections and apparatus.
4
CONDUCTING AN EXPERIMENT FROM START TO FINISH
WHAT IS THE SCIENTIFIC METHOD?
Scientists look at problems the same way that you do. They call it scientific
method. When something puzzles them, they use scientific method to try to
solve the problem.
Here, in a nutshell, is how they do an experiment:
1. Their first step is to identify a problem through observation. They narrow
their choices from many potential topics to a specific one they can explore.
2. Their next step is to do some background research in their chosen area to
understand their selected field.
3. The third step scientists take -- and a very key one -- is to ask a specific
question focused on what they will investigate and the variables they will
observe. They state their problem as a question that can be tested.
4. They then form a hypothesis (make a guess or prediction) about what is
causing the problem and how it might be solved.
5. They experiment or test their hypothesis to see if it solves the problem. As
they experiment, they gather information and record observations. If one
guess is not correct, they make another. They check and recheck their
experiments to see what happens, and then they form a conclusion or state
an answer to their problem. Finding an answer to one question brings up a
new question, and they repeat the experiment all over again.
6. Record and organize the data, then analyze the data in the form of a graph
or data table that displays the results of the data.
7. State the results of the data and state whether the hypothesis was correct
or incorrect in the conclusion, a brief summary of the experiment.
5
HOW TO PERFORM AN EXPERIMENT IN DETAIL
CHOOSE YOUR TOPIC
Pick a topic that is interesting to you.
ASK THE BEST QUESTIONS
The best science investigation question:
• can be answered by selecting on from a few possible answers.
• has a topic that you can find lots of information about.
• is about something that is easily observed and measured.
• leads to an investigation you can perform with available materials and
equipment.
RESEARCH YOUR TOPIC
• Search the school and public libraries first. Be sure to check with the
librarian about your topic. He or she may be able to guide you to more
information.
• Use indexes, encyclopedias and almanacs.
• If you need more information, you can go to the university library for
primary journal articles and abstract journals.
• Fill out reference cards while searching on the Internet.
MAKE YOUR HYPOTHESIS
Even though many forms of scientific method are used, all science
investigations are based on hypotheses that are tested in order to answer
questions about the world.
TEST YOUR HYPOTHESIS
Descriptive Studies
Describe the way things are without trying to explain their causes.
Correlation Studies
Make a connection between two separate observations without establishing
any causes.
Experimental Studies
Use scientific method to design and set up a controlled experiment to test a
hypothesis.
Scientific Method:
• Ask a question
• Review what is known
• Form a hypothesis
• Design an experiment to test the hypothesis
• Observe the experiment and organize the results
• Share the results with others
• Analyze the results and draw conclusions
6
PROJECT PROPOSAL
Experiment design:
• Include a description of exactly what needs to be done to complete your
investigation. Close attention must be paid to every detail in writing up these
exact procedures. Make sure the experiment can be repeated.
• How did you test the hypothesis?
PRESENTING YOUR RESULTS
The data you obtain from your experiment is the most important
information.
Your data can be recorded using:
• Tables – to record raw data
• Bar graphs – to compare totals
• Line graphs – to show how two factors change in relation to one another
• Pie charts – to show percentages of many observations
• What does your data tell you?
MAKING YOUR OWN CONCLUSIONS
• The main conclusion of any science investigation is a statement that either
supports or rejects the hypothesis of the project.
• Did you answer the question?
WRITING YOUR PAPERS
• Introduction – topic question to be explored, hypothesis and experiment
• Methods and Materials – the essential steps that were completed and
equipment and other supplies that were used
• Results – Data from the experiment is summarized
• Conclusions and Discussion – an explanation of why you accept or reject
the hypothesis and a list of possible flaws
• Citation List – all of the sources you made direct reference to in your
paper
• Reference List – sources that you read that may have influenced your
investigation
PUTTING IT ALL TOGETHER
Neatly and attractively display your research and results on a display board.
7
SCIENCE FAIR PROJECT IDEAS
• Food preference in gerbils
• Does adding salt to water change the temperature at which it boils?
• The effect of temperature on how long a soap bubble lasts
• The effect of different light intensities on the growth of sunflower plants
• The effect of light on the growth of bread mold
• Which bird feed do birds like best?
• A comparison of calories in five different kinds of peanuts
• The effect of acid rain on the growth of fast plants
• The effect of acid rain on the germination of apple seeds
• Using black walnut juice and marigolds to prevent weeds in your garden
• The effect of sugar water on the survival of cut flower stems
• The effect of salt on the growth of bean plants
• Hummingbird color preferences at feeders
• Bird feed consumption at different colored bird feeders
• Bacterial growth in apple juice and apple cider
• Does auxin affect seed germination?
• Can magnesium affect seed germination?
• The effect of surface area on fuel burn time
• Does the life of a light bulb depend on its wattage?
• Sudsy soaps
• The effect of wire coils on the strength of an electromagnet
• Packaging eggs and shock resistance
• The effect of friction on velocity
• The effect of temperature on golf ball performance
• The effect of temperature on the rate of water absorption in cut carnations
• The antibiotic effects of bread mold on bacteria
• The effect of the color of light on the growth of sunflowers
• The feeding habits of winter birds
• Hydroponics: growth for the future
• A comparison of the heat conduction abilities of different metals
• Iron in your food
• Prejudices in children: When do they start?
• The effects of a classroom seating arrangement on student performance
• The golden ration and its effect on heart rate
• The effects of a small magnetic field on the movement and behavior of
laboratory mice
• The effect of paper airplane design on flight distance and flight time
• A comparison of the water content of different kinds of fruit
• The amount of fat in fast foods and store bought hamburgers
8
• The effects of car exhaust fumes on the growth of plants
• An investigation of bacteria and fingernails
• The effects of the amount of water on the number of stomata in peas
• Acid rain: how it affects plant growth
• The effects of wing shape on lift
• Does light affect population growth rate in euglena?
• The effects of radiation on pea seeds
• Are soap bubbles good for anything but a bath?
• Learning styles and memory retention
• The effects of car exhaust on seed germination
• Why do rocks sink and supertankers float?
• A study of bridge construction
• Which brand of gum is the most viscous?
• The effect of design on efficiency of a propeller
• The effects of ultraviolet light on the photosynthetic rate of soybeans
• The fermentation of yeast: optimal temperature and pH
• The effects of water flow on a water wheel
• Day or night: When do amaryllis plants grow more?
• The effects of stress on the germination of corn seedlings
• Comparing the tensile strength of different metals
• A study of a goldfish’s ability to learn a maze
• The effects of microwave radiation on seed germination
• How does watching fish affect people’s blood pressure?
• The effects of distractions on memory and learning
• The effects of music on the ability to memorize nonsense syllables
• The design and construction of a rigid sail model for all vessels
• An analysis of the nutrient content of breakfast cereals
• The use of pitfall traps to determine insect diversity
• An analysis of the relationship between music and plant growth response
• An investigation into the effects of irradiation in the seed stage on the
growth and development of marigolds
• Osage oranges: determination of a natural cricket repellent
• The effects of nicotine on the cell shape and survival of euglena
• The amount of vitamin C present in ordinary foods
• The effects of electric currents on germinating seeds
• Comparing the effects of antibacterial soap on bacterial growth
• The antibacterial effect of common sauces
• Particulates in the air
• Is the purity of bottled water consistent with the claims that distributors
make?
9
• A study of the effects of the plant hormone, auxin, on the growth of bean
plants
• The effects of eye dominance on task performance
• Multiple intelligences in the career world
• The fungi around us
• The effects of acidity on metals
• Which form of insulation is the most effective?
• How terraces help stop soil erosion
• Determination of vitamin C in aging fruit
• Gender-based memory
• An investigation of the lung capacity of smokers and nonsmokers
10
Notebook Requirements-Science Fair
1. Your Science Fair folder and must contain, in the following order, the
following sections:
a. Abstract 20 pts
b. Table of Contents 3 pts
c. Title Page 2 pts
d. Hypothesis 5 pts
e. Problem 3 pts
f. Purpose 3 pts
g. Materials & Procedure 10 pts
h. Graphs & Data Table 10 pts
i. Results 8 pts
j. Conclusion 8 pts
k. Background Report (must be 1 ½ to 2 typed pages in length. Size 12
font, must be in your words, no photocopies) 20 pts
l. Bibliography (Use your handouts for correct formats. At least six sources
must be cited. Search engines are not resources: Google, ask.com,
Wikipedia, etc.) 6 pts
m. Acknowledgements (anyone who helped you) 2 pts
n. Information (photocopies or printouts of all the information you
collected throughout your experiment. Must be at least 25 pages long. 5 pts
2. Every paper in your folder MUST be typed and double-spaced using 12-
font. Every page must include a page number on the bottom right which
you’ll use in your Table of Contents. Each page should contain a centered
title on top, except for the title page.
3. Graphs and data table must be computer generated.
4. This is a major and important part of your 3rd
semester Science grade.
The completed project is worth 105 pts.
11
Writing the Project Report
The purpose of the science fair report, and any scientific paper, is to
persuade the reader that the conclusions you have drawn are correct. This
goal can be accomplished if you write clearly and concisely.
Your project report must be typed and double-spaced using 12-font.
Margins should be 1 ½ inches on the left and 1 inch on the top, bottom, and
right.
In this specific order, your project must include:
� Abstract
� Table of Contents
� Title Page
� Hypothesis
� Problem
� Purpose
� Materials and Procedure
� Graphs and Data Table
� Results
� Conclusion
� Background Report
� Bibliography
� Acknowledgements
� Information Notes
Each section must begin on a separate page. The contents of each of these
sections and specifications for writing them are as follows.
Abstract: A 250 word summary of your entire project. Attached is a
worksheet explaining in detail.
Table of Contents: A table listing the page numbers of the entire project
report. Your title page should be page one. The abstract and table of contents
do not have page numbers.
Title Page: The title page should be centered on the page. No identification
of the student or school should appear.
Hypothesis: The hypothesis of the project is the scientist’s prediction and
must be in an “If and then, because….” format. This is a single sentence.
Problem: A single sentence stated as a question that describes what you’re
trying to solve.
Purpose: A single sentence that states what the purpose of your experiment
is.
Materials & Procedure: The materials and procedure should be listed in
bulleted format. Use past tense, passive voice (e.g., “the solution was
12
mixed”, not “I mixed the solution.”) The scientific point of view is
impersonal. Avoid the use of first person pronouns (I, me, and mine).
Graphs & Data Table: The data table and graphs must be computer
generated. Hand drawn graphs won’t be allowed.
Results & Analysis: The results and analysis will be written after the
experiment is completed. Use past tense, passive voice “Measurements of
the stem diameter were taken…” not, “I measured the diameter of the
stems.”)
Conclusion: The conclusion explains how you interpreted your results and
statistical analysis. The conclusion should first be stated in one sentence that
parallels your hypothesis in content and structure. Several paragraphs can
then be used to further explain your conclusions. References should be made
to similarities and differences between your findings and interpretations.
Background Report: A summary of everything you learned while
researching your project. This is a summary of your 25 pages of notes. It’s
not a summary of your experiment.
Bibliography: The bibliography should be written in the formats used in
Write Source 2000. At least six sources are needed.
Acknowledgements: This section gives the names of all the people who
helped with your project. Last names should be left out.
Information: Photocopies and/or printouts of all the information you
collected throughout your experiment. Must be at least 25 pages long.
13
Help with Selecting a Topic & Brainstorming Ideas
During this phase you will:
� Brainstorm five possible subjects
� Come up with two questions to solve per possible topic
� Consult with parents, partner and teacher about project possibilities
� Choose a topic that can be experimented with
� Choose a topic that sparks your interest
You will have until October 1st to find five possible topics with two
questions per topic.
Your Journal: All of your rough draft work will be completed in your
journal.
Your journal will be collected on each of the dates previously listed to make
sure you are completing the assignments on time. All notes that you take or
collect should be written in this journal and dated. The point of keeping a
science fair journal is that it’s an easy way to keep all of your information in
one place. It also makes it easy to turn in and hand back out. Keep you
journal in a safe place and put your name inside the back cover. The first
page of your journal should be a list of your five project ideas with two
questions per idea. Brainstorming Topics: Brainstorming topics is an easy way to narrow
down the idea running through your head. Start with a general area that
interests you, such as Biology or Chemistry and then start finding projects
that would fall into that topic area.
Before you add your five ideas into your journal, brainstorm as many ideas
as possible and write them down in a list. Don’t limit your list to ideas that
interest you, write down everything at first. You never know when an idea
that didn’t catch your eye initially turns out to be the project you decide to
go with. Remember, the more ideas you have, the more likely it is that you
will come up with an idea that you’ll enjoy experimenting with.
Enjoy yourself: A project of this magnitude can take a lot out of you. You’ll
be working on this project over the next three to four months, so make sure
you pick a topic that generally interests you. This is your opportunity to
choose what you want to learn, so take advantage of this and pick something
14
that you want to learn more about. Nobody said that doing school work had
to be boring. Make it fun; get your family and friends involved.
Getting Started
Finding Topic Ideas: Many students get their ideas from the internet,
books, magazines, family, or friends. All of these are valid resources, so
make sure you start researching your ideas as early as possible. Even though
you are doing your own project, it’s highly unlikely that your experiment has
never been done before. It’s alright to pick a topic that’s been used in the
past and it’s actually preferred. Your goal is to research a topic that interests
you and find as much information concerning your topic as possible.
Don’t pick a topic that you know you’re going to have a hard time with.
Finding something that suits you will make the experience much easier.
Two Questions per Idea: Once you have written out your five possible
topics, you need to come up with two questions per topic. These are related
questions about what you are trying to discover with each experiment. If my
topic was, “How different liquids affect mint plants”, my two questions
would relate to that topic. For example,
“What liquid keeps mint plants alive the longest” or “What liquid causes
mint plants to sprout quicker”, are two questions that you would write under
the main idea.
Teacher Feed Back: Once you come up with five topics and two questions
per topic, write them down in your journal. When all of the journals are
collected, the teacher will read through everyone’s ideas and try to eliminate
topics that multiple students wrote down. A science fair would not be fun to
conduct if ten students did the same project. Projects that are circled will be
the topics that the teacher has approved of and you can pick which one
you’d like to do from there. If the teacher crosses off an idea that you were
highly interested in, make an appointment to discuss your concerns.
Remember, this is your project, so make sure you pick something that
interests you and have fun with it.
15
Variable Types
Independent Variable
The cause of the change in your research is the independent variable. In your
experimentation, you will vary one factor to observe what will happen. This
thing you vary is the independent variable. This is the cause.
Dependent Variable
You change one factor to observe what will happen to something else. The
“something else” is the dependent variable. This is the effect.
Control Groups
Controlled experiments are designed to determine cause and effect. There
must be a standard to which the experimental data can be compared. A
control group is free of any change. The classic control group is the mint
plant given no liquid compared to the experimental groups that received
various liquids. You must have a control group in order to compare the
results of the experimental groups. This also means that the conditions must
be equal for all groups involved in the experiment. If one mint plant is being
grown outside, then all of them need to be grown outside. If one mint plant
is being grown in the garage, then all mint plants should be grown in the
garage, unless you are testing environment changes.
Remember to list the sources of all materials and equipment. Keep in mind
that all good scientific research is flexible enough to allow for changes and
that some of the best learning comes through encountering and overcoming
difficulties.
16
Developing your Topic
Once you have decided on a topic, you need to transform that idea into an
experiment. A science fair project is experimental in nature and deals with
implementing the steps of the scientific method. In order to develop your
topic into an experiment, you’ll need to discover the projects independent
and dependent variables.
As listed on the previous page, the independent variable is called the cause,
and the dependent variable is called the effect. In a science fair project, there
is generally one independent variable. For example, if you are growing mint
plants, the independent variable might be the type of liquid the plant is
given, where the plant is grown, or the amount of sun the plant is given. The
dependent variable, or effect, would be how the plant reacts. For example,
how much it grew, how fast it grew, or how long it stayed alive. When
conducting your experiment, the independent variable will be the only thing
you change. All other conditions must stay the same throughout. If you are
giving mint plants different liquids to determine growth rates, only the
liquids should be different.
All the plants need to be mint, all the plants need to be given the same
amount of liquid, and all plants should be kept in the same environment.
****The second page of your journal should include the topic you decided
on and the independent and dependent variables related to your topic. List
your variables in your journal as shown below.
Independent Variable: Dependent Variables:
a.________________ 1._______________
b.________________ 2.__________________
c.________________ 3.___________________
4.___________________
17
Writing your Hypothesis
A hypothesis is an educated guess concerning the results of your experiment.
It is written before you start experimenting and your final results will
determine if your hypothesis was right or wrong. All science fair projects
must have a hypothesis and all scientific research in general must have a
hypothesis.
A hypothesis is stated in one sentence. No more, no less. All hypotheses
should be written in an “If……, then …….because……” format. If you
have a difficult time summarizing your hypothesis into one sentence, then
it’s clear that you need to narrow down your study. Here are a few examples:
1. If mint plants are given water, tea, apple juice and soda over a five week
period, then the mint plant being fed water will grow the fastest, because
water grows plants faster.
2. If mint plants are grown in a garage, a closet, a greenhouse, and outdoors,
then the mint plant grown in a greenhouse will grow the tallest, because it
will have more sunlight in the greenhouse.
A hypothesis needs to be detailed and specific. The word “I” must not be
included in your hypothesis and your hypothesis can only be one sentence
long. Remember, it’s not important whether or not your hypothesis turns out
to be right or wrong. Either way, you will be explaining why you came up
with the results you did.
Problem and Purpose
All science fair projects include a problem and a purpose. The problem in
your experiment will only be one complete sentence. The problem and
purpose are very similar to the hypothesis, but the wording is different. The
problem asks a questions which can be answered by your experiment. It is
the question that you are trying to solve throughout your project. Example;
What liquid helps mint plants grow the fastest?
The purpose of your project is a statement that provides the reader with a
reason for doing this experiment. Write a sentence that describes what you
want to do. This should also be one complete sentence. Example;
The purpose of this experiment is to determine the most effective way to
grow mint plants.
The problem and purpose need to be on their own separate pages, just like
everything else through this project.
18
Materials & Procedure
When conducting a science experiment, it is important to document all of the
materials used and provide a detailed summary of the steps taken throughout
the experiment. Make your report detailed to the point that when someone
goes over your science fair work, they could repeat the project exactly the
way you did.
The materials and procedure should be listed in bulleted format.
Simply list the materials you used with bullets and list your procedure steps
with numbers. Use past tense when writing out the procedure steps because
these should be steps that you already completed (e.g., “the plant was given
tea”, not “I am giving the plant tea”). Always avoid using first person
language, such as “I”, “me”, or “We”. Use “the scientist(s)” or reword the
sentence so you can avoid using either. Here are some examples:
Materials
o Mint plants
o 8 oz. of Mama Pat’s Ice Tea
o 8 oz. of Water
Procedure
1. Bought materials at store
2. Set up mint plant in greenhouse
3. Gave them 8 oz. of separate liquids everyday at 10:00am &
5:00pm
Results & Analysis
The purpose of a science fair project is to determine if there is a relationship
between the independent and dependent variables tested in the experiment.
Once you have done your experiment and collected all of your data, you will
need to summarize your findings and report them in your results and
analysis section. You will simply take all of the data written down in the
research journal over the time it took you to finish your experiment and
convert that information into a paper that describes in detail what your
results were. If feeding mint plants different liquids was the study, listing
how much each of the plants grew and how long it took them to grow would
be information that is listed in the results section. The key to this section is
detail. Be specific. A few extra words can be the difference in a well written
paper. Once all of the information collected is written down and recorded in
the results section, determining the reasons for those results is next.
19
Conclusion
The conclusion includes how the results were interpreted. The conclusion
should start with a single sentence that directly parallels the hypothesis. For
example, the hypothesis for this project was proven wrong because……
Several paragraphs can then be used to support your beliefs.
This section is reserved for your thoughts. Why did you come up with the
results you did? Were there any differences or similarities between your
findings and the findings of others? Is there anything you would do
differently the next time around? Did anything surprise you as you did this
experiment?
All of those questions are worth answering for any scientific experiment.
Once again, this section needs to be detailed and specific.
Convince the reader that your results prove something. Convince the reader
that you proved something to be true or false. Pretend that the person
reading this has no previous knowledge on this subject and that it is your job
to provide them with accurate information.
Writing the Abstract
The abstract is a 250 word summary of your entire project. It is the last thing
you will write and the first thing everyone will read. The abstract should
start with your hypothesis statement. From there make sure to include a brief
explanation of your experimental procedure, your results, and your
conclusion. Do not include any of your background information.
This brief 250 word summary needs to wrap up your entire project.
When writing your abstract make sure it is written in past tense, passive
voice. Never use the word “I” or “we”. Write “The mint plants were watered
for two weeks,” not “I watered the mint plants for two weeks.”
Since this is the last thing you will write, make sure everything is completed
before writing it. Do not start writing your abstract if you have not finished
your conclusion yet.
A 250 word summary can fill-up very quickly. Be careful how you word
your sentences because you want to get as much detail in this section as
possible, using limited space. You want your abstract to interest the reader
and persuade them that your research is valuable. Your abstract is like the
cover to a book. When it looks and sounds interesting, the reader will be
enticed to read more.
20
Graphs & Data Tables
Your graphs and data tables must be computer generated. Hand drawn work
will not be accepted and you will receive a zero for this section as a result.
All information that you collect and write about in your results section will
also be represented in a graph and a data table. Your results, graphs and data
tables will include the same information throughout, but the information will
be displayed in different ways. Providing the reader with graphs and data
tables makes it easier to understand the relationship between your
independent and dependent variables. The types of graphs you use are your
decision but all graphs need to be properly labeled.
Below are a few types of graphs with a brief description of each. Each of
these graphs can be made using a computer and various examples of each
can be found online.
Bar graphs: Used when comparing different types of data. Each bar
represents a different group or object.
Line graphs: Used when you want to show how the dependent variable is
affected by changes in the independent variable. Also used to show how data
changes over time.
Pie Charts: Used when showing percentages. A round chart that shows
various pie slices. Each slice represents a group and percent.
A data table holds the same information as a graph but is displayed in a
different manner. Just as it sounds, a data table is simply a table containing
information. It documents data in an easy to view format and helps the
reader find relative information.
Display Boards
Before you put your science fair display board together, you need to sketch
out what you have planned in your journal. By doing this you can give
yourself an idea of what your board will look like and have a rough draft to
follow. Your display board sketch will be the last item collected by your
teacher before the actual science fair.
Handing in the sketch allows your teacher to look over your ideas and
provide any last minute advice. Once the sketch is returned, you are
welcome to start putting your board together. Remember that the purpose of
the display board is to visually summarize your project.
Science fair display boards can be purchase at various locations. Stores such
as Target, Wal-Mart, Michaels, and teacher supply stores usually keep them
in-stock. The color of the board and how you decide to design it is
completely up to you. Make your board appealing. Make it stand out. An
21
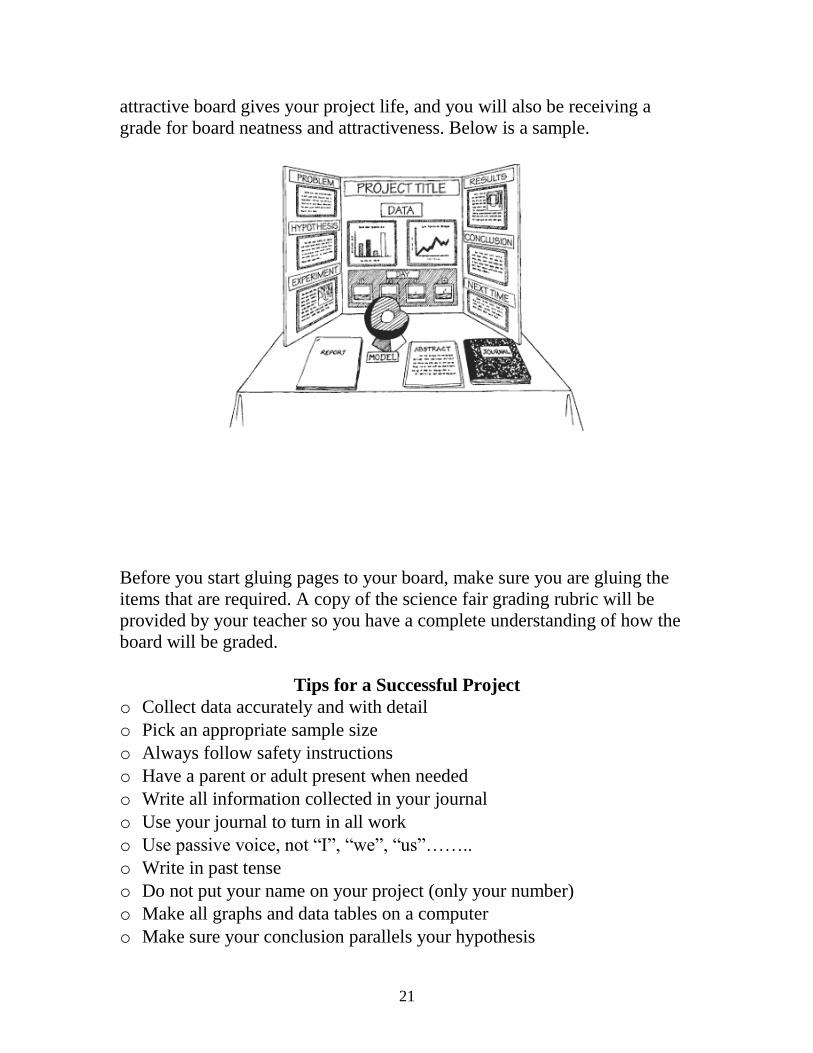
attractive board gives your project life, and you will also be receiving a
grade for board neatness and attractiveness. Below is a sample.
Before you start gluing pages to your board, make sure you are gluing the
items that are required. A copy of the science fair grading rubric will be
provided by your teacher so you have a complete understanding of how the
board will be graded.
Tips for a Successful Project
o Collect data accurately and with detail
o Pick an appropriate sample size
o Always follow safety instructions
o Have a parent or adult present when needed
o Write all information collected in your journal
o Use your journal to turn in all work
o Use passive voice, not “I”, “we”, “us”……..
o Write in past tense
o Do not put your name on your project (only your number)
o Make all graphs and data tables on a computer
o Make sure your conclusion parallels your hypothesis
22
o Test more than one subject
o Run multiple tests if needed
o Do not wait until the last second to start
o Document everything you do
o Do not use any live animals
o All volunteers you use need to fill out a permission slip
o Have your teacher and parent(s) approve your experiment
o Be detailed when describing the relationship(s) between your
independent and dependent variables
Research Journal Checklist
Use this checklist to make sure your journal meets these requirements.
The boxes below are for your use only. Do not turn in this paper. Just turn in
your journal and it will be checked to see if it meets the requirements.
o Three-holed journal
o Research journal written on cover
o Written in ink
o Notes are dated
o Notes are eligible
o Information is relevant to your topic
o Your name in written on the inside of the back cover (only)
Resources
You need to have a minimum of six resources for your project. All of your
resources can be found online, but books and magazines can also be used.
When you find a resource, read through it and highlight information relevant
to your project. When citing a resource it needs to be written in the proper
format. Use your handouts to properly cite your resources.
Someone you know is not an acceptable resource. If you are having trouble
properly formatting your sources, look up APA formats online and use those
as a template.
23
Background Information
Write 1 ½ to 2 pages of background information. Explain every concept,
scientific principle, etc., that you used or referred to in your project.
These explanations must be complete and detailed. The background
information is not a summary of your experiment. It is a summary of
everything you learned while researching your project. When you found
your six resources, you should have highlighted the information you found
useful. The information from those resources is what you will use to write
your background information. You are basically summarizing what you
learned from your resources in a short essay.
Besides the 1 1/2 to 2 page paper, you will turn in at least twenty-five pages
of notes. Every page you print from a website or photocopied from a
book/magazine is considered one page. Having a minimum of six resources
allows you to collect twenty-five pages of notes easily. These twenty-five
pages will be used to write your background information page. Remember,
twenty-five full pages minimum. Half-pages do not count as one page of
notes.
24
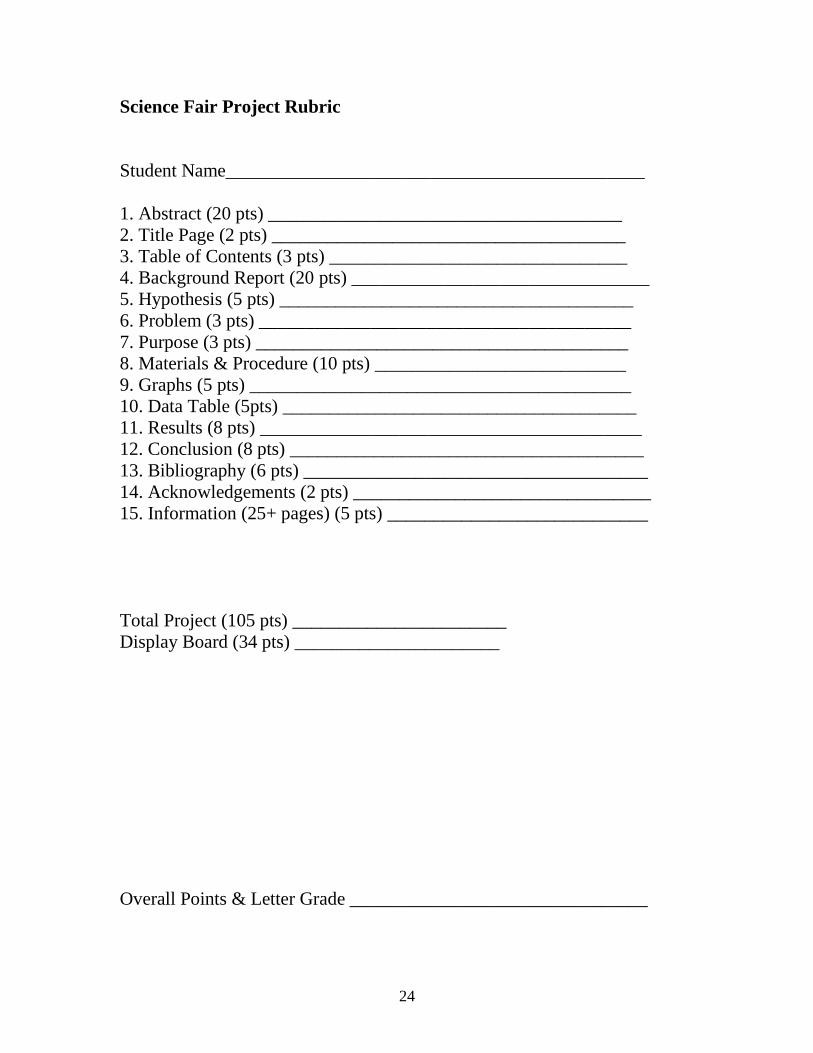
Science Fair Project Rubric
Student Name_____________________________________________
1. Abstract (20 pts) ______________________________________
2. Title Page (2 pts) ______________________________________
3. Table of Contents (3 pts) ________________________________
4. Background Report (20 pts) ________________________________
5. Hypothesis (5 pts) ______________________________________
6. Problem (3 pts) ________________________________________
7. Purpose (3 pts) ________________________________________
8. Materials & Procedure (10 pts) ___________________________
9. Graphs (5 pts) _________________________________________
10. Data Table (5pts) ______________________________________
11. Results (8 pts) _________________________________________
12. Conclusion (8 pts) ______________________________________
13. Bibliography (6 pts) _____________________________________
14. Acknowledgements (2 pts) ________________________________
15. Information (25+ pages) (5 pts) ____________________________
Total Project (105 pts) _______________________
Display Board (34 pts) ______________________
Overall Points & Letter Grade ________________________________
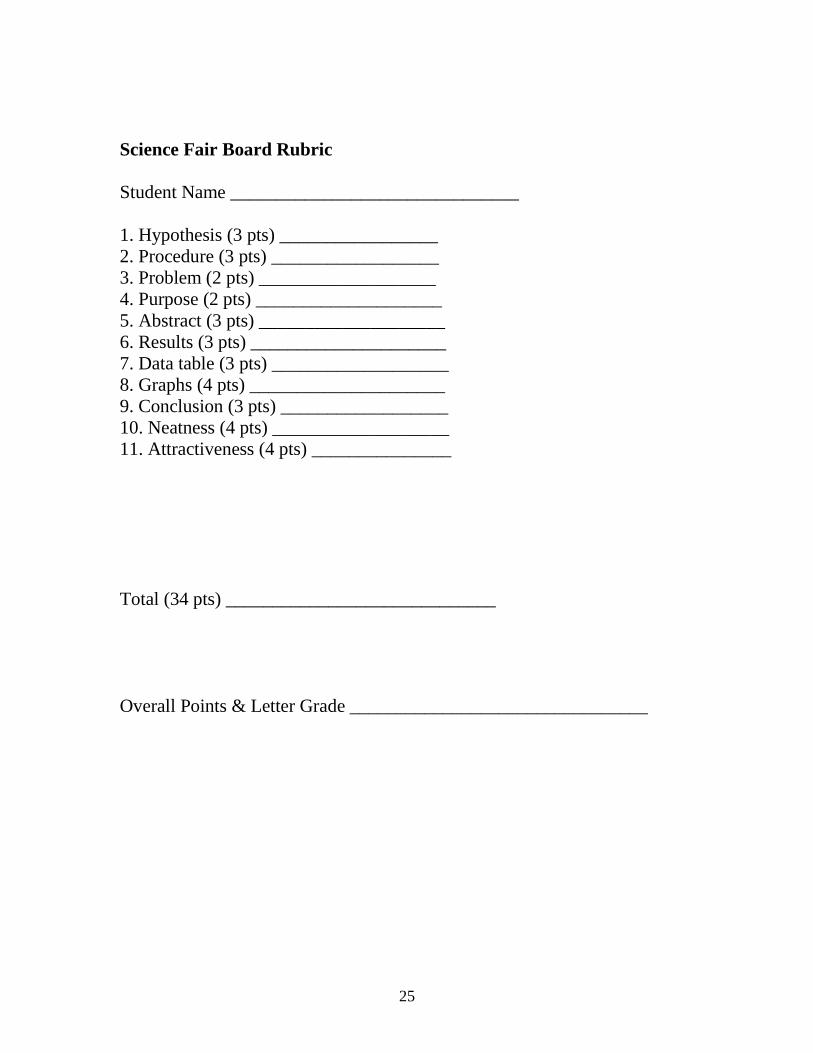
25
Science Fair Board Rubric
Student Name _______________________________
1. Hypothesis (3 pts) _________________
2. Procedure (3 pts) __________________
3. Problem (2 pts) ___________________
4. Purpose (2 pts) ____________________
5. Abstract (3 pts) ____________________
6. Results (3 pts) _____________________
7. Data table (3 pts) ___________________
8. Graphs (4 pts) _____________________
9. Conclusion (3 pts) __________________
10. Neatness (4 pts) ___________________
11. Attractiveness (4 pts) _______________
Total (34 pts) _____________________________
Overall Points & Letter Grade ________________________________
26
August 24, 2010
Dear Parents,
We will be having a judged Science Fair on March 23, 2011. The
winners from grades 5-8 will be going to the Diocesan Science Fair in May.
I have looked at the packet that has been given out in the past and have
altered the content so students and parents have a better understanding of the
requirements and assessment of the Science Fair. Included in the packet is
an explanation of the Scientific Method and what I require for each part of
the Science Fair (SF). Students will not have a chance to work on the SF in
class. So please stress to your child that they will need to pick a partner
that they can meet with outside of school.
I have also included the rubric of the point system for each part that
the student needs to hand in. There will be a part of the SF due every
couple of weeks, so they will be receiving grades throughout the year. They
will be graded on the poster board in March. The rubric for the poster board
is included in the packet. I will be including a timeline for the students
when the SF date has been determined. This timeline will need to be signed
by both the student and parent/guardian and returned to me.
This packet needs to be read in full by both the student and
parent/guardian. Please sign the bottom of this page and return by Thursday,
September 30th. This will be counted as part of the overall SF grade, please
return as soon as possible.
If you have any questions, please write me a note or email me at
Sincerely,
Susan Guartafierro
--------------------------------------------------------------------------------------------
Science Fair Packet
Student Signature and Date
Parent/Guardian Signature and Date


![[PPT]PowerPoint Presentation - Henry County Schools / …schoolwires.henry.k12.ga.us/cms/lib08/GA01000549... · Web viewTeacher Info Print the UK, Italy, Germany, & Russia graphic](https://img.pdfslide.net/doc/110x75/5ad9a9bf7f8b9a6d318ba617/pptpowerpoint-presentation-henry-county-schools-viewteacher-info-print.jpg)