Embed Size (px)
Citation preview

SReleased Set for Eighth Grade
R E P E A T1999
TIMSS••
TIMSS 1999 SCIENCE ITEMS
scienceitems

TIMSS 1999
IEA’s Repeat of the Third International Mathematics and Science Study at the Eighth Grade
TIMSS 1999 Science Items:
Released Set for Eighth Grade
Overview of TIMSS
timss
1999
represents the continuation of a long series of studies con-ducted by the International Association for the Evaluation of Educational Achievement (
iea
). Since its inception in
1959
, the
iea
has conducted more than
15
studies of cross-national achievement in the curricular areas of mathematics, science, language, civics, and reading. The Third Interna-tional Mathematics and Science Study (
timss
), conducted in
1995-1996
, was the largest and most complex
iea
study to date, and included both mathematics and science at third and fourth grades, seventh and eighth grades, and the final year of secondary school.
In
1999
,
timss
again assessed eighth-grade students in both mathematics and science to measure trends in student achievement since
1995
. This study was also known as
timss
-Repeat, or
timss-r
. The results of
timss
1999
were published in two companion volumes,
TIMSS
1999
International Mathe-matics Report
(Mullis, Martin, Gonzalez, Gregory, Garden, O’Connor, Chros-towski, and Smith,
2000
) and
TIMSS
1999
International Science Report
(Martin, Mullis, Gonzalez, Gregory, Smith, Chrostowski, Garden, and O’Connor,
2000
).
timss
1999
also included a voluntary Benchmarking Study including
13
United States of America states and
14
districts and consortia. The results were published in
Mathematics Benchmarking Report
TIMSS
1999
- Eighth Grade: Achievement for U. S. States and Districts in an International Context
(Mul-lis, Martin, Gonzalez, O’Connor, Chrostowski, Gregory, Garden and Smith,
2001
) and
Science Benchmarking Report
TIMSS
1999
- Eighth Grade: Achievement for U. S. States and Districts in an International Context
(Martin, Mullis, Gonza-lez, O’Connor, Chrostowski, Gregory, Smith and Garden,
2001
).
Participants in TIMSS 1999
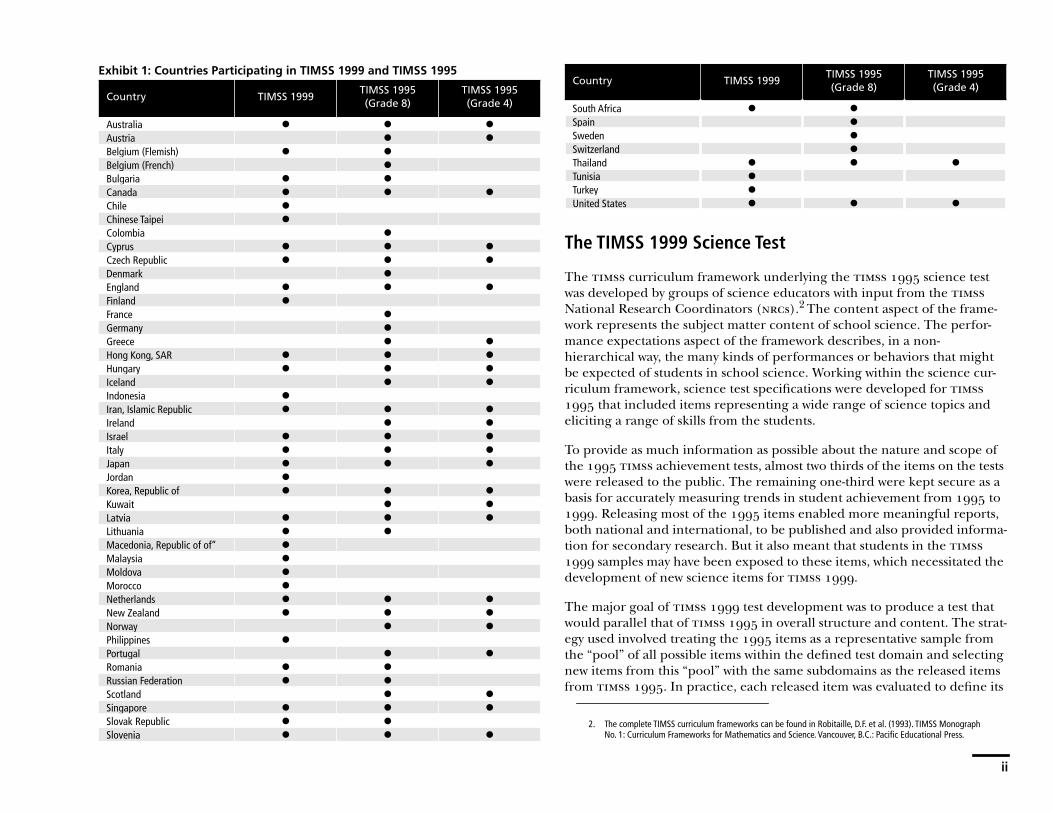
Of the
42
countries that participated in
timss
1
at the eighth grade in
1995
,
26
availed themselves of the opportunity to measure changes in the achieve-ment of their students by also taking part in
1999
(see Exhibit
1
). Twelve additional countries participated in
1999
, for a total of
38
countries. Of those taking part in
1999
,
19
had also participated in
1995
at the fourth grade.
Since fourth-grade students in
1995
were in eighth grade in
1999
, these countries can compare their eighth-grade performance with their per-formance at the fourth grade, as well as with the eighth-grade performance of students in other countries.
1. Results for 41 countries are reported in the 1995 international reports; Italy also completed the 1995 test-ing, but too late to be included.
ii
Exhibit 1: Countries Participating in TIMSS 1999 and TIMSS 1995
The TIMSS 1999 Science Test
The
timss
curriculum framework underlying the
timss
1995
science test was developed by groups of science educators with input from the
timss
National Research Coordinators (
nrc
s).
2
The content aspect of the frame-work represents the subject matter content of school science. The perfor-mance expectations aspect of the framework describes, in a non-hierarchical way, the many kinds of performances or behaviors that might be expected of students in school science. Working within the science cur-riculum framework, science test specifications were developed for
timss
1995
that included items representing a wide range of science topics and eliciting a range of skills from the students.
To provide as much information as possible about the nature and scope of the
1995
timss
achievement tests, almost two thirds of the items on the tests were released to the public. The remaining one-third were kept secure as a basis for accurately measuring trends in student achievement from
1995
to
1999
. Releasing most of the
1995
items enabled more meaningful reports, both national and international, to be published and also provided informa-tion for secondary research. But it also meant that students in the
timss
1999
samples may have been exposed to these items, which necessitated the development of new science items for
timss
1999
.
The major goal of
timss
1999
test development was to produce a test that would parallel that of
timss
1995
in overall structure and content. The strat-egy used involved treating the
1995
items as a representative sample from the “pool” of all possible items within the defined test domain and selecting new items from this “pool” with the same subdomains as the released items from
timss
1995
. In practice, each released item was evaluated to define its
Country TIMSS 1999TIMSS 1995(Grade 8)
TIMSS 1995(Grade 4)
Australia
● ● ●
Austria
● ●
Belgium (Flemish)
● ●
Belgium (French)
●
Bulgaria
● ●
Canada
● ● ●
Chile
●
Chinese Taipei
●
Colombia
●
Cyprus
● ● ●
Czech Republic
● ● ●
Denmark
●
England
● ● ●
Finland
●
France
●
Germany
●
Greece
● ●
Hong Kong, SAR
● ● ●
Hungary
● ● ●
Iceland
● ●
Indonesia
●
Iran, Islamic Republic
● ● ●
Ireland
● ●
Israel
● ● ●
Italy
● ● ●
Japan
● ● ●
Jordan
●
Korea, Republic of
● ● ●
Kuwait
● ●
Latvia
● ● ●
Lithuania
● ●
Macedonia, Republic of of”
●
Malaysia
●
Moldova
●
Morocco
●
Netherlands
● ● ●
New Zealand
● ● ●
Norway
● ●
Philippines
●
Portugal
● ●
Romania
● ●
Russian Federation
● ●
Scotland
● ●
Singapore
● ● ●
Slovak Republic
● ●
Slovenia
● ● ●
Country TIMSS 1999TIMSS 1995(Grade 8)
TIMSS 1995(Grade 4)
South Africa
● ●
Spain
●
Sweden
●
Switzerland
●
Thailand
● ● ●
Tunisia
●
Turkey
●
United States
● ● ●
2. The complete TIMSS curriculum frameworks can be found in Robitaille, D.F. et al. (1993). TIMSS Monograph No. 1: Curriculum Frameworks for Mathematics and Science. Vancouver, B.C.: Pacific Educational Press.
iii
subdomain (mathematics or science content, performance expectation, item format, and difficulty level), and a set of potential replacement items from the same subdomain was then created. This method ensured that the final test, comprising the nonreleased and replacement items, covered the same test domain as in
timss
1995
.
The tests were developed through an international consensus involving input from experts in science and measurement specialists.
3
The
timss
Sub-ject Matter Item Committee, which included distinguished scholars from
10
countries, ensured that the test reflected current thinking and priorities within the field of science. The items underwent an iterative development and review process with one pilot testing effort involving
31
countries. Every effort was made to help ensure that the tests represented the curricula of the participating countries and that the items did not exhibit any bias towards or against particular countries. The final forms of the test were endorsed by the
nrc
s of all the participating countries. The resulting test for the
timss
1999
students (eighth grade in many countries) contained
146
science items representing a range of science topics and skills.
Approximately one-fourth of the
timss
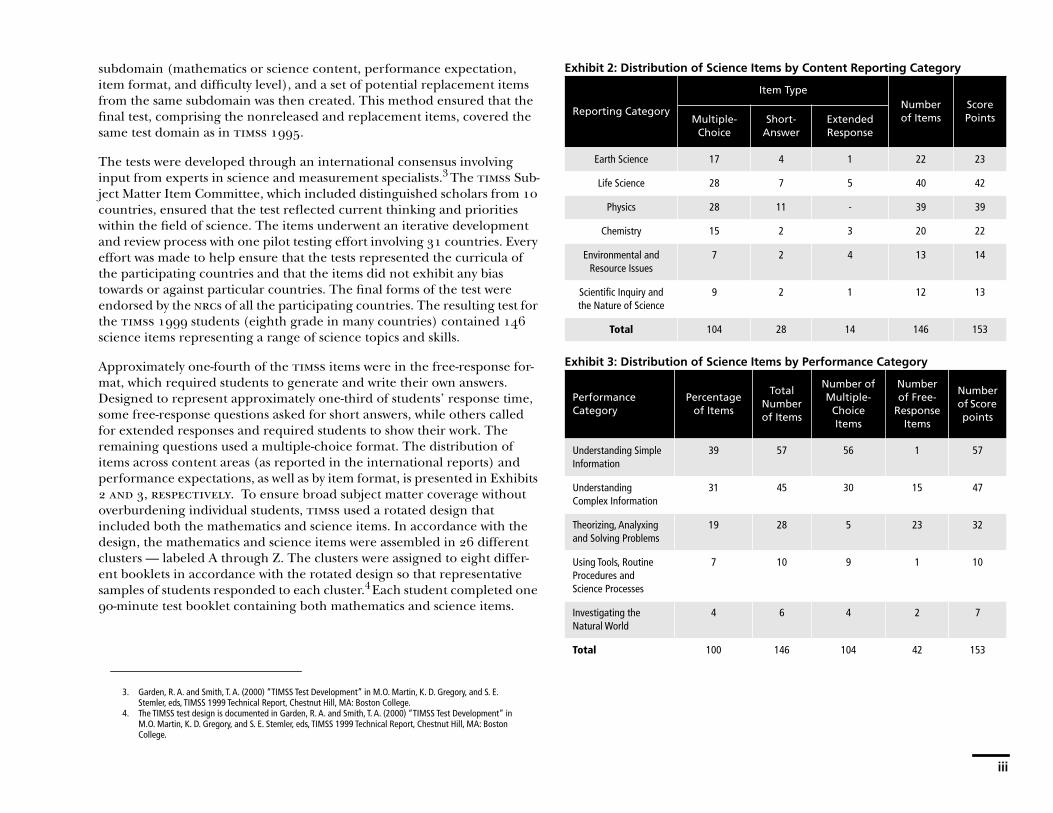
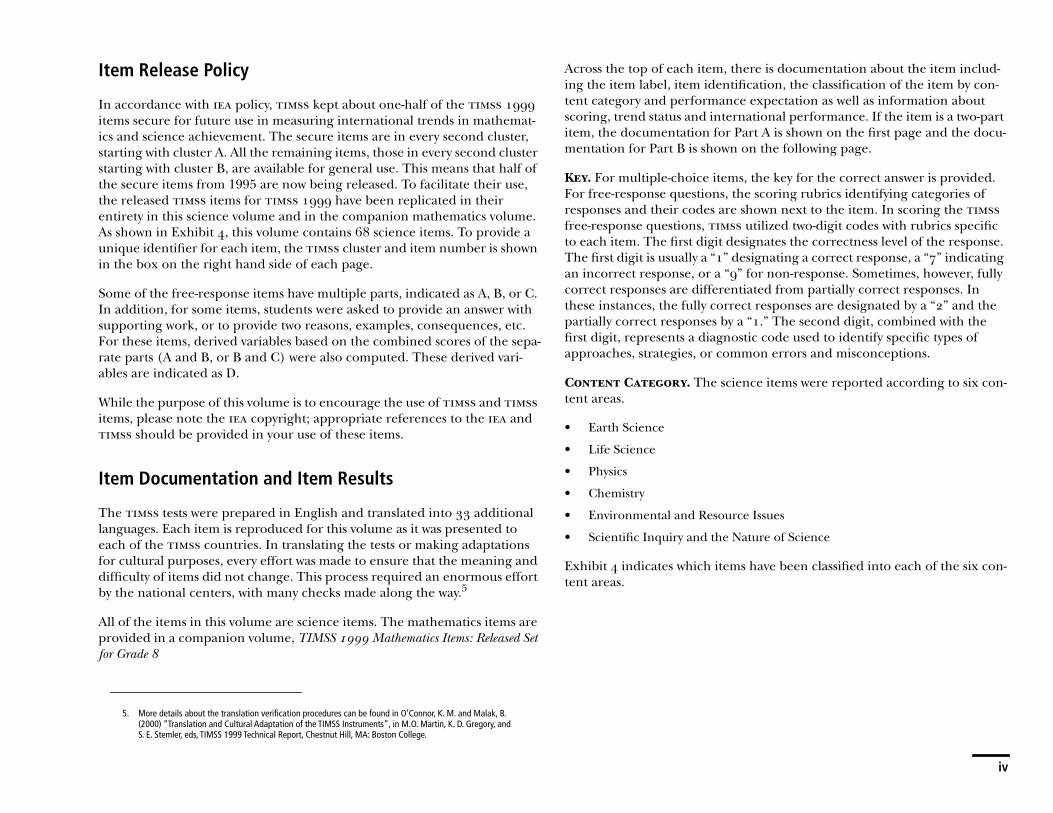
items were in the free-response for-mat, which required students to generate and write their own answers. Designed to represent approximately one-third of students’ response time, some free-response questions asked for short answers, while others called for extended responses and required students to show their work. The remaining questions used a multiple-choice format. The distribution of items across content areas (as reported in the international reports) and performance expectations, as well as by item format, is presented in Exhibits
2 and 3, respectively
. To ensure broad subject matter coverage without overburdening individual students,
timss
used a rotated design that included both the mathematics and science items. In accordance with the design, the mathematics and science items were assembled in
26
different clusters — labeled A through Z. The clusters were assigned to eight differ-ent booklets in accordance with the rotated design so that representative samples of students responded to each cluster.
4
Each student completed one
90-minute test booklet containing both mathematics and science items.
Exhibit 2: Distribution of Science Items by Content Reporting Category
Exhibit 3: Distribution of Science Items by Performance Category
3. Garden, R. A. and Smith, T. A. (2000) “TIMSS Test Development” in M.O. Martin, K. D. Gregory, and S. E. Stemler, eds, TIMSS 1999 Technical Report, Chestnut Hill, MA: Boston College.
4. The TIMSS test design is documented in Garden, R. A. and Smith, T. A. (2000) “TIMSS Test Development” in M.O. Martin, K. D. Gregory, and S. E. Stemler, eds, TIMSS 1999 Technical Report, Chestnut Hill, MA: Boston College.
Reporting Category
Item TypeNumber of Items
Score PointsMultiple-
ChoiceShort-
AnswerExtended Response
Earth Science 17 4 1 22 23
Life Science 28 7 5 40 42
Physics 28 11 - 39 39
Chemistry 15 2 3 20 22
Environmental and Resource Issues
7 2 4 13 14
Scientific Inquiry and the Nature of Science
9 2 1 12 13
Total 104 28 14 146 153
Performance Category
Percentage of Items
Total Number of Items
Number of Multiple-
Choice Items
Number of Free-
Response Items
Number of Score points
Understanding Simple Information
39 57 56 1 57
Understanding Complex Information
31 45 30 15 47
Theorizing, Analyxing and Solving Problems
19 28 5 23 32
Using Tools, Routine Procedures and Science Processes
7 10 9 1 10
Investigating the Natural World
4 6 4 2 7
Total 100 146 104 42 153
iv
Item Release Policy
In accordance with iea policy, timss kept about one-half of the timss 1999 items secure for future use in measuring international trends in mathemat-ics and science achievement. The secure items are in every second cluster, starting with cluster A. All the remaining items, those in every second cluster starting with cluster B, are available for general use. This means that half of the secure items from 1995 are now being released. To facilitate their use, the released timss items for timss 1999 have been replicated in their entirety in this science volume and in the companion mathematics volume. As shown in Exhibit 4, this volume contains 68 science items. To provide a unique identifier for each item, the timss cluster and item number is shown in the box on the right hand side of each page.
Some of the free-response items have multiple parts, indicated as A, B, or C. In addition, for some items, students were asked to provide an answer with supporting work, or to provide two reasons, examples, consequences, etc. For these items, derived variables based on the combined scores of the sepa-rate parts (A and B, or B and C) were also computed. These derived vari-ables are indicated as D.
While the purpose of this volume is to encourage the use of timss and timss items, please note the iea copyright; appropriate references to the iea and timss should be provided in your use of these items.
Item Documentation and Item Results
The timss tests were prepared in English and translated into 33 additional languages. Each item is reproduced for this volume as it was presented to each of the timss countries. In translating the tests or making adaptations for cultural purposes, every effort was made to ensure that the meaning and difficulty of items did not change. This process required an enormous effort by the national centers, with many checks made along the way.5
All of the items in this volume are science items. The mathematics items are provided in a companion volume, TIMSS 1999 Mathematics Items: Released Set for Grade 8
Across the top of each item, there is documentation about the item includ-ing the item label, item identification, the classification of the item by con-tent category and performance expectation as well as information about scoring, trend status and international performance. If the item is a two-part item, the documentation for Part A is shown on the first page and the docu-mentation for Part B is shown on the following page.
Key. For multiple-choice items, the key for the correct answer is provided. For free-response questions, the scoring rubrics identifying categories of responses and their codes are shown next to the item. In scoring the timss free-response questions, timss utilized two-digit codes with rubrics specific to each item. The first digit designates the correctness level of the response. The first digit is usually a “1” designating a correct response, a “7” indicating an incorrect response, or a “9” for non-response. Sometimes, however, fully correct responses are differentiated from partially correct responses. In these instances, the fully correct responses are designated by a “2” and the partially correct responses by a “1.” The second digit, combined with the first digit, represents a diagnostic code used to identify specific types of approaches, strategies, or common errors and misconceptions.
Content Category. The science items were reported according to six con-tent areas.
• Earth Science
• Life Science
• Physics
• Chemistry
• Environmental and Resource Issues
• Scientific Inquiry and the Nature of Science
Exhibit 4 indicates which items have been classified into each of the six con-tent areas.
5. More details about the translation verification procedures can be found in O’Connor, K. M. and Malak, B. (2000) “Translation and Cultural Adaptation of the TIMSS Instruments”, in M.O. Martin, K. D. Gregory, and S. E. Stemler, eds, TIMSS 1999 Technical Report, Chestnut Hill, MA: Boston College.
v
Performance Expectation. Items were classified into the following per-formance expectations.
• Understanding Simple Information
• Understanding Complex Information
• Theorizing, Analyzing, and Solving Problems
• Using Tools, Routine Procedures, and Science Processes
• Investigating the Natural World
International Average Percentage of Eighth Grade Students Responding Correctly. The percent of students responding correctly to the item reflects the international average across the countries participating in timss 1999. That is, first the percentage of students responding correctly to the item was calculated for each country. Next, an average was calculated across the 38 countries. For items using a partial credit scoring scheme, the percentages given are for students responding with fully correct answers.
For More Information About TIMSS
For more details about the timss 1999 results and procedures, please see the following reports:
Martin, M.O., Mullis, I.V.S., Gonzalez, E.J., Gregory, K.D., Smith, T.A., Chrostowski, S.J., Garden, R.A., & O’Connor, K.M. (2000). TIMSS 1999 International Science Report: Findings from IEA’s Repeat of the Third International Mathematics and Science Study at the Eighth Grade. Chestnut Hill, MA: Boston College.
Mullis, I.V.S., Martin, M.O., Gonzalez, E.J., Gregory, K.D., Garden, R.A., O’Connor, K.M., Chrostowski, S.J., & Smith, T.A. (2000). TIMSS 1999 Inter-national Mathematics Report: Findings from IEA’s Repeat of the Third International Mathematics and Science Study at the Eighth Grade. Chestnut Hill, MA: Boston College.
Martin, M.O., Gregory, K.D., and Stemler, S.E., eds., (2000), TIMSS 1999 Technical Report, Chestnut Hill, MA: Boston College.
Martin, M.O., Mullis, I.V.S., Gonzalez, E.J., O’Connor, K.M., Chrostowski, S.J., Gregory, K. D., Garden, R. A. & Smith, T.A. (2001). Science Benchmark-ing Report TIMSS 1999 - Eighth Grade: Achievement for U. S. States and Districts in an International Context. Chestnut Hill, MA: Boston College.
Mullis, I.V.S., Martin, M.O., Gonzalez, E.J., O’Connor, K.M., Chrostowski, S.J., Gregory, K. D., Smith, T.A. & Garden, R. A. (2001). Mathematics Bench-marking Report TIMSS 1999 - Eighth Grade: Achievement for U. S. States and Dis-tricts in an International Context. Chestnut Hill, MA: Boston College.
vi
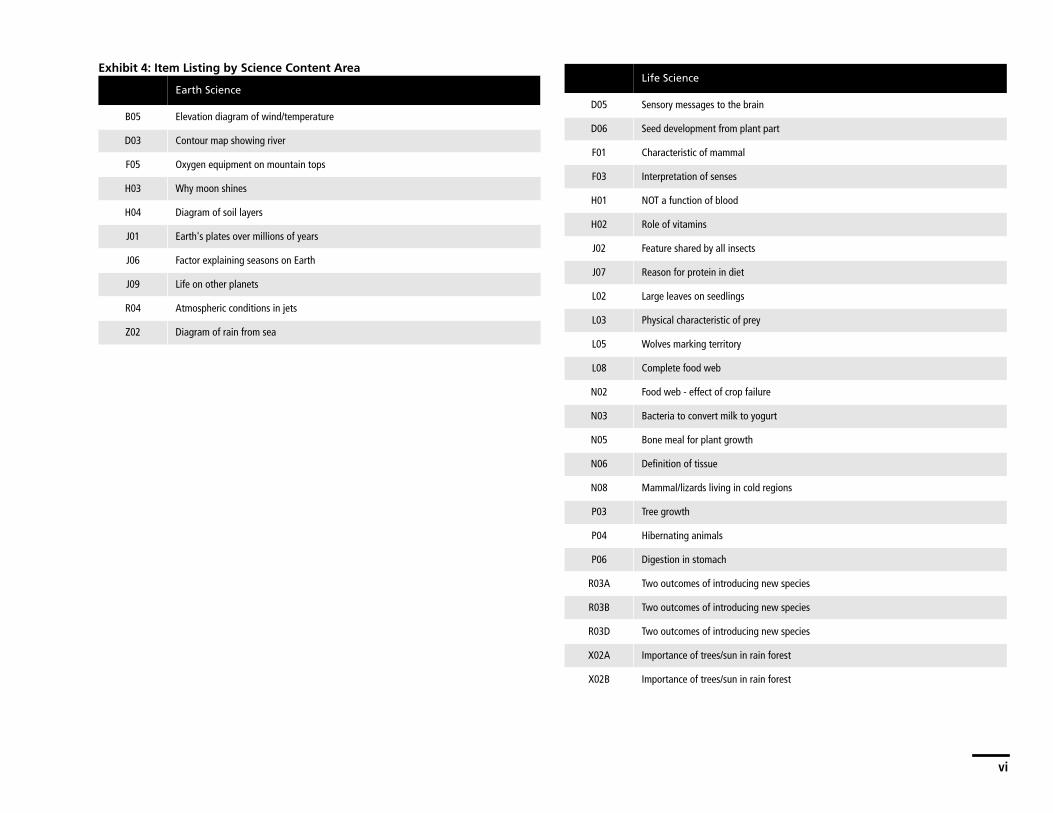
Exhibit 4: Item Listing by Science Content Area
Earth Science
B05 Elevation diagram of wind/temperature
D03 Contour map showing river
F05 Oxygen equipment on mountain tops
H03 Why moon shines
H04 Diagram of soil layers
J01 Earth's plates over millions of years
J06 Factor explaining seasons on Earth
J09 Life on other planets
R04 Atmospheric conditions in jets
Z02 Diagram of rain from sea
Life Science
D05 Sensory messages to the brain
D06 Seed development from plant part
F01 Characteristic of mammal
F03 Interpretation of senses
H01 NOT a function of blood
H02 Role of vitamins
J02 Feature shared by all insects
J07 Reason for protein in diet
L02 Large leaves on seedlings
L03 Physical characteristic of prey
L05 Wolves marking territory
L08 Complete food web
N02 Food web - effect of crop failure
N03 Bacteria to convert milk to yogurt
N05 Bone meal for plant growth
N06 Definition of tissue
N08 Mammal/lizards living in cold regions
P03 Tree growth
P04 Hibernating animals
P06 Digestion in stomach
R03A Two outcomes of introducing new species
R03B Two outcomes of introducing new species
R03D Two outcomes of introducing new species
X02A Importance of trees/sun in rain forest
X02B Importance of trees/sun in rain forest
vii
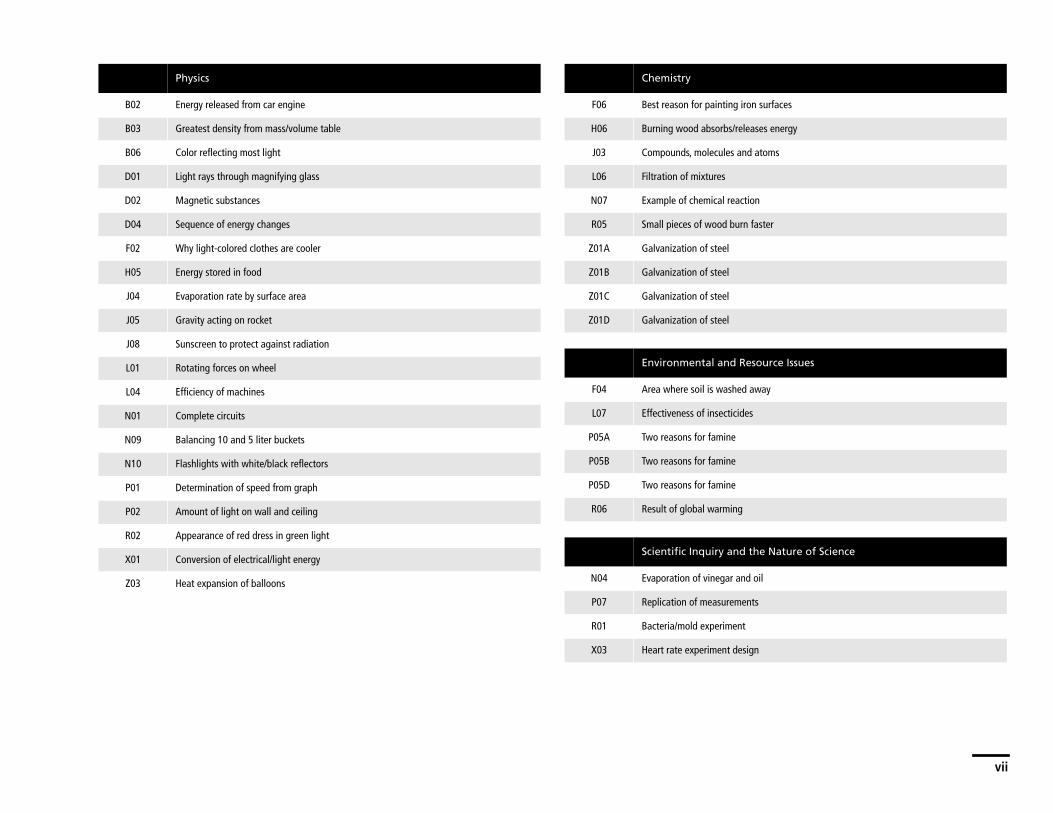
Physics
B02 Energy released from car engine
B03 Greatest density from mass/volume table
B06 Color reflecting most light
D01 Light rays through magnifying glass
D02 Magnetic substances
D04 Sequence of energy changes
F02 Why light-colored clothes are cooler
H05 Energy stored in food
J04 Evaporation rate by surface area
J05 Gravity acting on rocket
J08 Sunscreen to protect against radiation
L01 Rotating forces on wheel
L04 Efficiency of machines
N01 Complete circuits
N09 Balancing 10 and 5 liter buckets
N10 Flashlights with white/black reflectors
P01 Determination of speed from graph
P02 Amount of light on wall and ceiling
R02 Appearance of red dress in green light
X01 Conversion of electrical/light energy
Z03 Heat expansion of balloons
Chemistry
F06 Best reason for painting iron surfaces
H06 Burning wood absorbs/releases energy
J03 Compounds, molecules and atoms
L06 Filtration of mixtures
N07 Example of chemical reaction
R05 Small pieces of wood burn faster
Z01A Galvanization of steel
Z01B Galvanization of steel
Z01C Galvanization of steel
Z01D Galvanization of steel
Environmental and Resource Issues
F04 Area where soil is washed away
L07 Effectiveness of insecticides
P05A Two reasons for famine
P05B Two reasons for famine
P05D Two reasons for famine
R06 Result of global warming
Scientific Inquiry and the Nature of Science
N04 Evaporation of vinegar and oil
P07 Replication of measurements
R01 Bacteria/mold experiment
X03 Heart rate experiment design
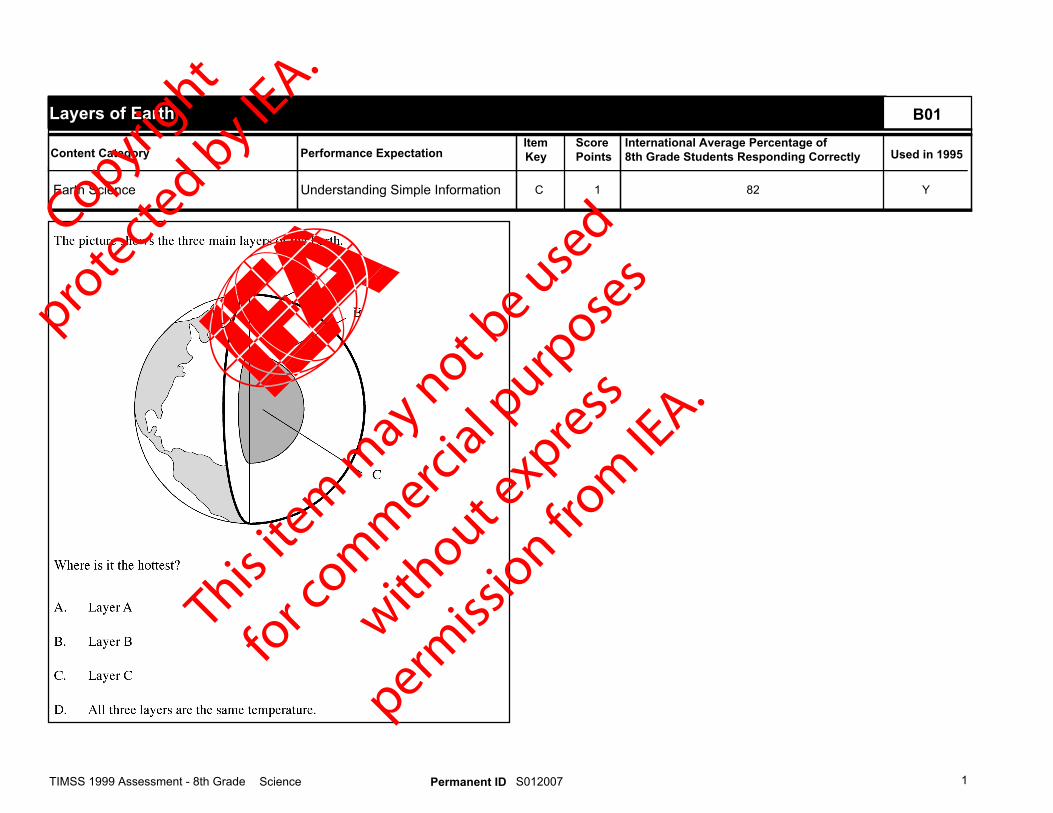
B01
Understanding Simple Information 1
Layers of Earth
C 82
Performance ExpectationItemKey
International Average Percentage of8th Grade Students Responding Correctly
Y
Used in 1995ScorePointsContent Category
Earth Science
TIMSS 1999 Assessment - 8th Grade 1Science S012007Permanent ID
Copyright
prote
cted by IE
A.
This ite
m m
ay not be use
d
for c
omm
ercial p
urpose
s
without e
xpress
permiss
ion from
IEA.

B02
Understanding Simple Information 1
Energy released from car engine
B 58
Performance ExpectationItemKey
International Average Percentage of8th Grade Students Responding Correctly
Y
Used in 1995ScorePointsContent Category
Physics
TIMSS 1999 Assessment - 8th Grade 2Science S012008Permanent ID
Copyright
prote
cted by IE
A.
This ite
m m
ay not be use
d
for c
omm
ercial p
urpose
s
without e
xpress
permiss
ion from
IEA.
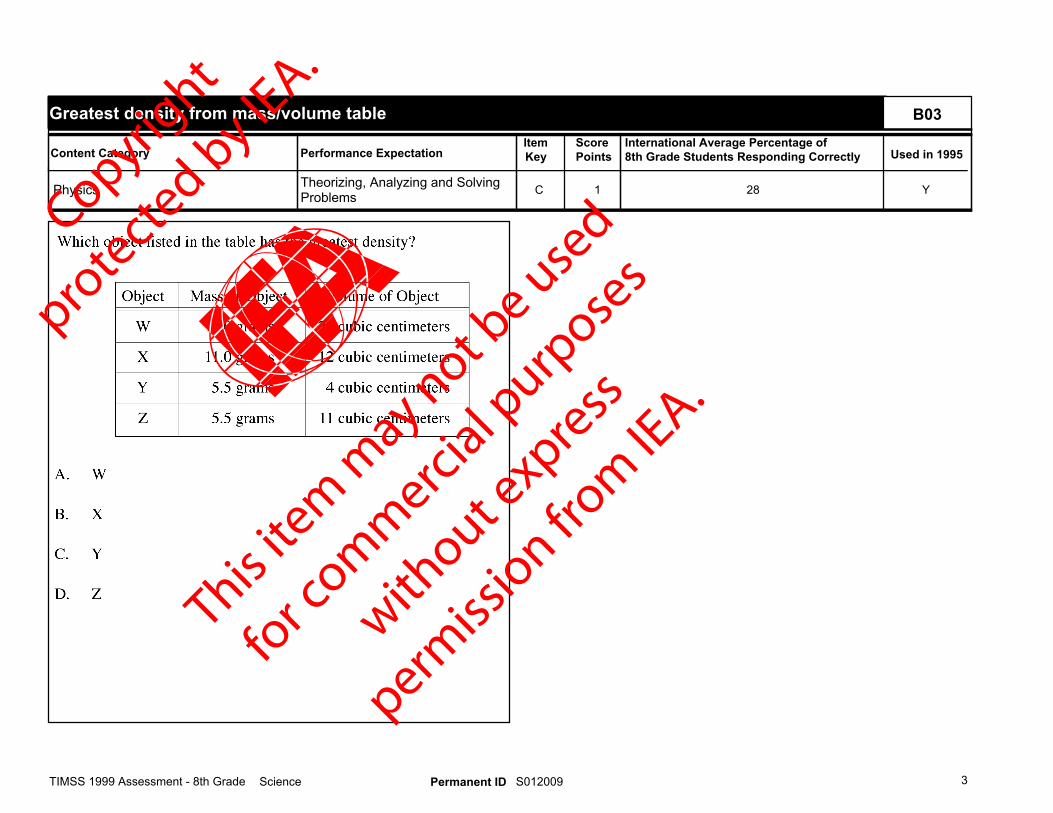
B03
Theorizing, Analyzing and SolvingProblems 1
Greatest density from mass/volume table
C 28
Performance ExpectationItemKey
International Average Percentage of8th Grade Students Responding Correctly
Y
Used in 1995ScorePointsContent Category
Physics
TIMSS 1999 Assessment - 8th Grade 3Science S012009Permanent ID
Copyright
prote
cted by IE
A.
This ite
m m
ay not be use
d
for c
omm
ercial p
urpose
s
without e
xpress
permiss
ion from
IEA.

B04
Understanding ComplexInformation 1
Pulse/breathing rate after exercise
C 87
Performance ExpectationItemKey
International Average Percentage of8th Grade Students Responding Correctly
Y
Used in 1995ScorePointsContent Category
Life Science
TIMSS 1999 Assessment - 8th Grade 4Science S012010Permanent ID
Copyright
prote
cted by IE
A.
This ite
m m
ay not be use
d
for c
omm
ercial p
urpose
s
without e
xpress
permiss
ion from
IEA.
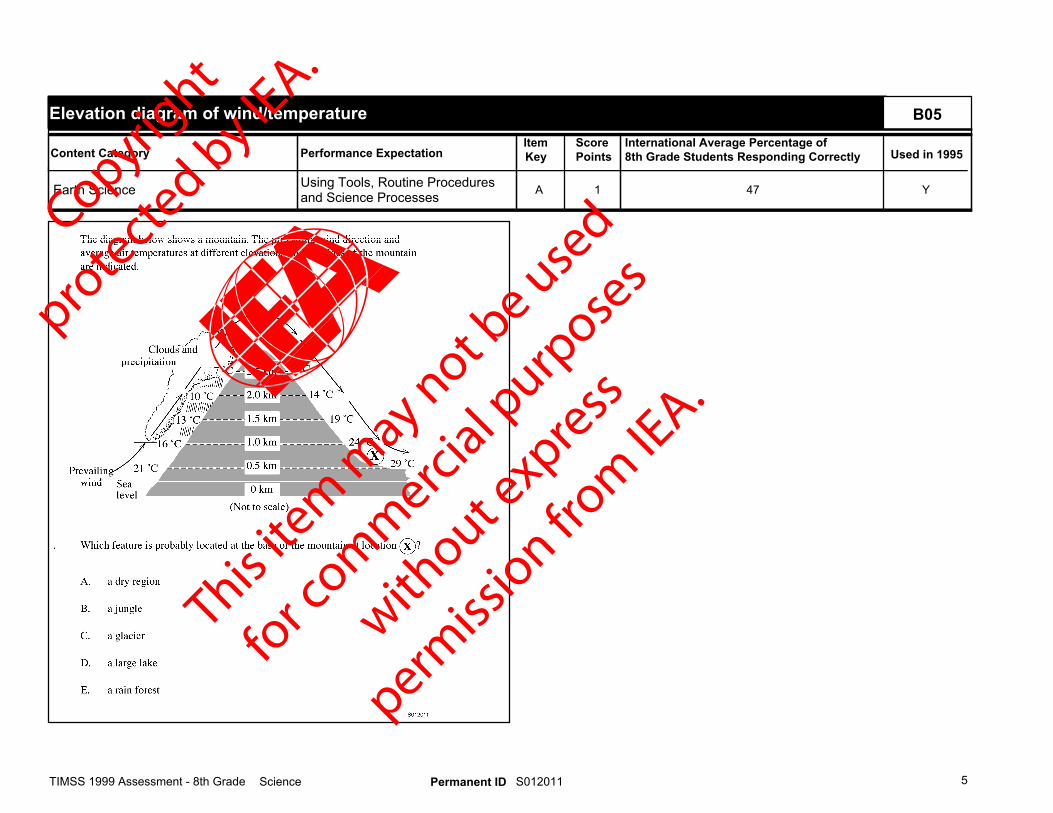
B05
Using Tools, Routine Proceduresand Science Processes 1
Elevation diagram of wind/temperature
A 47
Performance ExpectationItemKey
International Average Percentage of8th Grade Students Responding Correctly
Y
Used in 1995ScorePointsContent Category
Earth Science
TIMSS 1999 Assessment - 8th Grade 5Science S012011Permanent ID
Copyright
prote
cted by IE
A.
This ite
m m
ay not be use
d
for c
omm
ercial p
urpose
s
without e
xpress
permiss
ion from
IEA.

B06
Understanding Simple Information 1
Color reflecting most light
A 82
Performance ExpectationItemKey
International Average Percentage of8th Grade Students Responding Correctly
Y
Used in 1995ScorePointsContent Category
Physics
TIMSS 1999 Assessment - 8th Grade 6Science S012012Permanent ID
Copyright
prote
cted by IE
A.
This ite
m m
ay not be use
d
for c
omm
ercial p
urpose
s
without e
xpress
permiss
ion from
IEA.

D01
Understanding ComplexInformation 1
Light rays through magnifying glass
B 42
Performance ExpectationItemKey
International Average Percentage of8th Grade Students Responding Correctly
Y
Used in 1995ScorePointsContent Category
Physics
TIMSS 1999 Assessment - 8th Grade 7Science S012019Permanent ID
Copyright
prote
cted by IE
A.
This ite
m m
ay not be use
d
for c
omm
ercial p
urpose
s
without e
xpress
permiss
ion from
IEA.

D02
Understanding ComplexInformation 1
Magnetic substances
C 72
Performance ExpectationItemKey
International Average Percentage of8th Grade Students Responding Correctly
Y
Used in 1995ScorePointsContent Category
Physics
TIMSS 1999 Assessment - 8th Grade 8Science S012020Permanent ID
Copyright
prote
cted by IE
A.
This ite
m m
ay not be use
d
for c
omm
ercial p
urpose
s
without e
xpress
permiss
ion from
IEA.
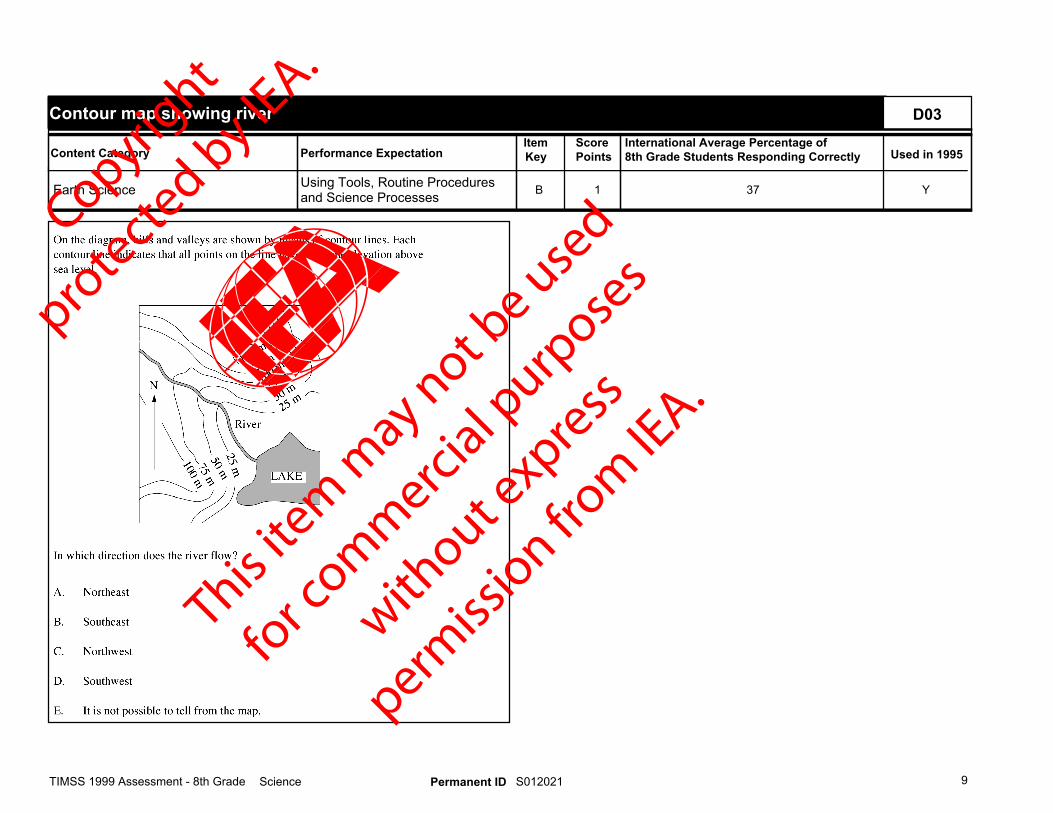
D03
Using Tools, Routine Proceduresand Science Processes 1
Contour map showing river
B 37
Performance ExpectationItemKey
International Average Percentage of8th Grade Students Responding Correctly
Y
Used in 1995ScorePointsContent Category
Earth Science
TIMSS 1999 Assessment - 8th Grade 9Science S012021Permanent ID
Copyright
prote
cted by IE
A.
This ite
m m
ay not be use
d
for c
omm
ercial p
urpose
s
without e
xpress
permiss
ion from
IEA.

D04
Understanding ComplexInformation 1
Sequence of energy changes
C 59
Performance ExpectationItemKey
International Average Percentage of8th Grade Students Responding Correctly
Y
Used in 1995ScorePointsContent Category
Physics
TIMSS 1999 Assessment - 8th Grade 10Science S012022Permanent ID
Copyright
prote
cted by IE
A.
This ite
m m
ay not be use
d
for c
omm
ercial p
urpose
s
without e
xpress
permiss
ion from
IEA.

D05
Understanding Simple Information 1
Sensory messages to the brain
C 69
Performance ExpectationItemKey
International Average Percentage of8th Grade Students Responding Correctly
Y
Used in 1995ScorePointsContent Category
Life Science
TIMSS 1999 Assessment - 8th Grade 11Science S012023Permanent ID
Copyright
prote
cted by IE
A.
This ite
m m
ay not be use
d
for c
omm
ercial p
urpose
s
without e
xpress
permiss
ion from
IEA.

D06
Understanding Simple Information 1
Seed development from plant part
A 71
Performance ExpectationItemKey
International Average Percentage of8th Grade Students Responding Correctly
Y
Used in 1995ScorePointsContent Category
Life Science
TIMSS 1999 Assessment - 8th Grade 12Science S012024Permanent ID
Copyright
prote
cted by IE
A.
This ite
m m
ay not be use
d
for c
omm
ercial p
urpose
s
without e
xpress
permiss
ion from
IEA.

F01
Understanding Simple Information 1
Characteristic of mammal
B 70
Performance ExpectationItemKey
International Average Percentage of8th Grade Students Responding Correctly
Y
Used in 1995ScorePointsContent Category
Life Science
TIMSS 1999 Assessment - 8th Grade 13Science S012031Permanent ID
Copyright
prote
cted by IE
A.
This ite
m m
ay not be use
d
for c
omm
ercial p
urpose
s
without e
xpress
permiss
ion from
IEA.

F02
Understanding ComplexInformation 1
Why light-colored clothes are cooler
A 65
Performance ExpectationItemKey
International Average Percentage of8th Grade Students Responding Correctly
Y
Used in 1995ScorePointsContent Category
Physics
TIMSS 1999 Assessment - 8th Grade 14Science S012032Permanent ID
Copyright
prote
cted by IE
A.
This ite
m m
ay not be use
d
for c
omm
ercial p
urpose
s
without e
xpress
permiss
ion from
IEA.

F03
Understanding Simple Information 1
Interpretation of senses
A 65
Performance ExpectationItemKey
International Average Percentage of8th Grade Students Responding Correctly
Y
Used in 1995ScorePointsContent Category
Life Science
TIMSS 1999 Assessment - 8th Grade 15Science S012033Permanent ID
Copyright
prote
cted by IE
A.
This ite
m m
ay not be use
d
for c
omm
ercial p
urpose
s
without e
xpress
permiss
ion from
IEA.

F04
Understanding ComplexInformation 1
Area where soil is washed away
D 68
Performance ExpectationItemKey
International Average Percentage of8th Grade Students Responding Correctly
Y
Used in 1995ScorePointsContent Category
Environmental and Resource Issues
TIMSS 1999 Assessment - 8th Grade 16Science S012034Permanent ID
Copyright
prote
cted by IE
A.
This ite
m m
ay not be use
d
for c
omm
ercial p
urpose
s
without e
xpress
permiss
ion from
IEA.

F05
Understanding ComplexInformation 1
Oxygen equipment on mountain tops
A 79
Performance ExpectationItemKey
International Average Percentage of8th Grade Students Responding Correctly
Y
Used in 1995ScorePointsContent Category
Earth Science
TIMSS 1999 Assessment - 8th Grade 17Science S012035Permanent ID
Copyright
prote
cted by IE
A.
This ite
m m
ay not be use
d
for c
omm
ercial p
urpose
s
without e
xpress
permiss
ion from
IEA.

F06
Understanding Simple Information 1
Best reason for painting iron surfaces
E 67
Performance ExpectationItemKey
International Average Percentage of8th Grade Students Responding Correctly
Y
Used in 1995ScorePointsContent Category
Chemistry
TIMSS 1999 Assessment - 8th Grade 18Science S012036Permanent ID
Copyright
prote
cted by IE
A.
This ite
m m
ay not be use
d
for c
omm
ercial p
urpose
s
without e
xpress
permiss
ion from
IEA.

H01
Understanding Simple Information 1
NOT a function of blood
A 70
Performance ExpectationItemKey
International Average Percentage of8th Grade Students Responding Correctly
Y
Used in 1995ScorePointsContent Category
Life Science
TIMSS 1999 Assessment - 8th Grade 19Science S012043Permanent ID
Copyright
prote
cted by IE
A.
This ite
m m
ay not be use
d
for c
omm
ercial p
urpose
s
without e
xpress
permiss
ion from
IEA.

H02
Understanding Simple Information 1
Role of vitamins
D 78
Performance ExpectationItemKey
International Average Percentage of8th Grade Students Responding Correctly
Y
Used in 1995ScorePointsContent Category
Life Science
TIMSS 1999 Assessment - 8th Grade 20Science S012044Permanent ID
Copyright
prote
cted by IE
A.
This ite
m m
ay not be use
d
for c
omm
ercial p
urpose
s
without e
xpress
permiss
ion from
IEA.
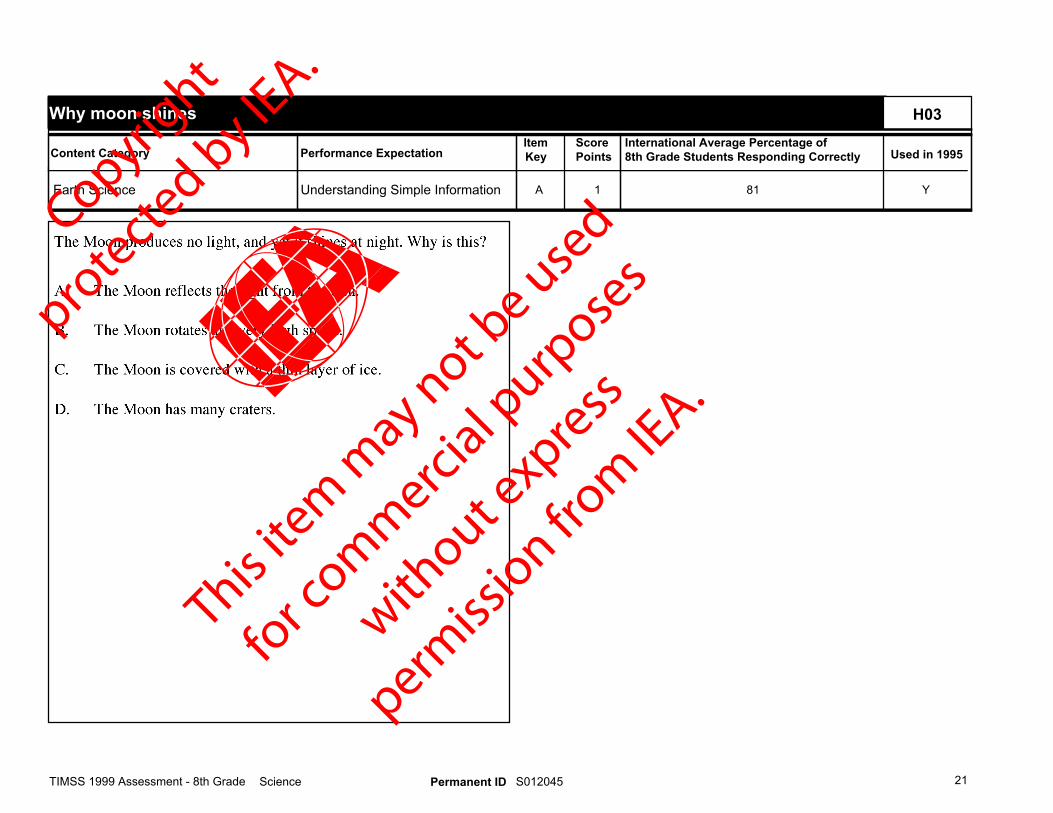
H03
Understanding Simple Information 1
Why moon shines
A 81
Performance ExpectationItemKey
International Average Percentage of8th Grade Students Responding Correctly
Y
Used in 1995ScorePointsContent Category
Earth Science
TIMSS 1999 Assessment - 8th Grade 21Science S012045Permanent ID
Copyright
prote
cted by IE
A.
This ite
m m
ay not be use
d
for c
omm
ercial p
urpose
s
without e
xpress
permiss
ion from
IEA.
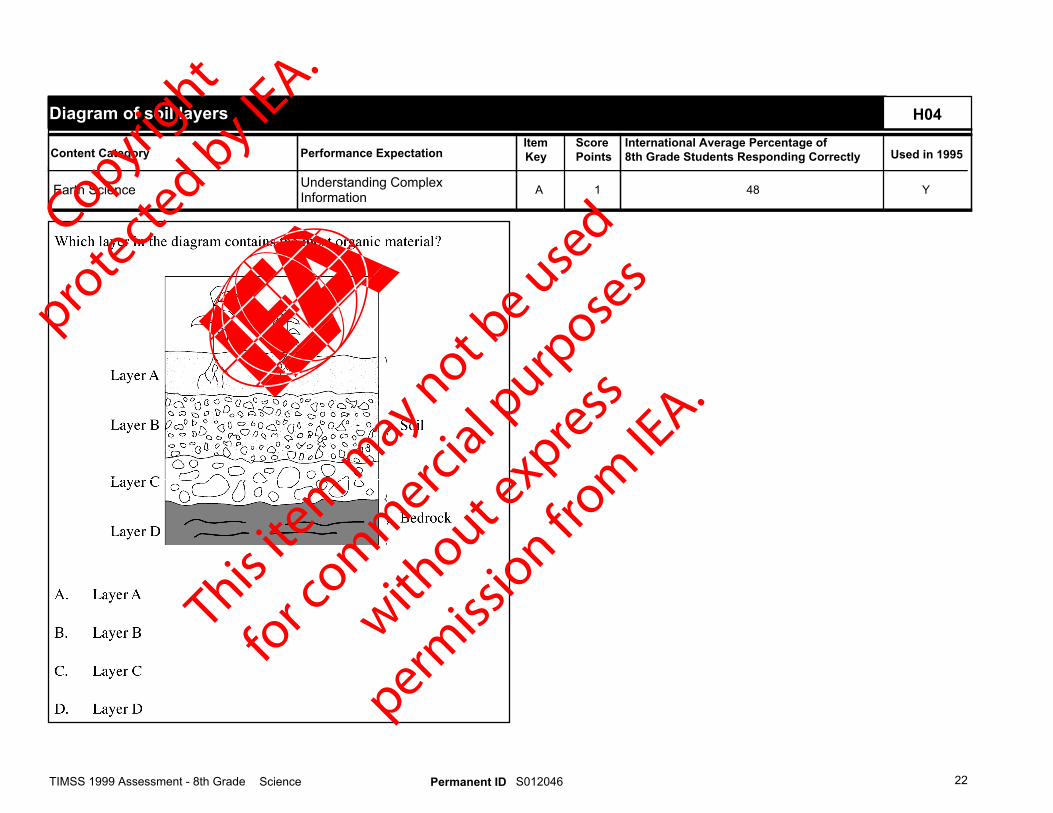
H04
Understanding ComplexInformation 1
Diagram of soil layers
A 48
Performance ExpectationItemKey
International Average Percentage of8th Grade Students Responding Correctly
Y
Used in 1995ScorePointsContent Category
Earth Science
TIMSS 1999 Assessment - 8th Grade 22Science S012046Permanent ID
Copyright
prote
cted by IE
A.
This ite
m m
ay not be use
d
for c
omm
ercial p
urpose
s
without e
xpress
permiss
ion from
IEA.

H05
Understanding Simple Information 1
Energy stored in food
B 24
Performance ExpectationItemKey
International Average Percentage of8th Grade Students Responding Correctly
Y
Used in 1995ScorePointsContent Category
Physics
TIMSS 1999 Assessment - 8th Grade 23Science S012047Permanent ID
Copyright
prote
cted by IE
A.
This ite
m m
ay not be use
d
for c
omm
ercial p
urpose
s
without e
xpress
permiss
ion from
IEA.

H06
Understanding Simple Information 1
Burning wood absorbs/releases energy
A 55
Performance ExpectationItemKey
International Average Percentage of8th Grade Students Responding Correctly
Y
Used in 1995ScorePointsContent Category
Chemistry
TIMSS 1999 Assessment - 8th Grade 24Science S012048Permanent ID
Copyright
prote
cted by IE
A.
This ite
m m
ay not be use
d
for c
omm
ercial p
urpose
s
without e
xpress
permiss
ion from
IEA.

J01
Understanding Simple Information 1
Earth's plates over millions of years
C 75
Performance ExpectationItemKey
International Average Percentage of8th Grade Students Responding Correctly
N
Used in 1995ScorePointsContent Category
Earth Science
TIMSS 1999 Assessment - 8th Grade 25Science S022073Permanent ID
Copyright
prote
cted by IE
A.
This ite
m m
ay not be use
d
for c
omm
ercial p
urpose
s
without e
xpress
permiss
ion from
IEA.

J02
Understanding Simple Information 1
Feature shared by all insects
A 49
Performance ExpectationItemKey
International Average Percentage of8th Grade Students Responding Correctly
N
Used in 1995ScorePointsContent Category
Life Science
TIMSS 1999 Assessment - 8th Grade 26Science S022099Permanent ID
Copyright
prote
cted by IE
A.
This ite
m m
ay not be use
d
for c
omm
ercial p
urpose
s
without e
xpress
permiss
ion from
IEA.

Code Response Item: S022174
Correct Response
10 Compounds - Molecules - Atoms
Incorrect Response
70 Compounds - Atoms - Molecules
71 Molecules - Atoms - Compounds
79 Other incorrect (including crossed out/erased, stray marks, illegible, or off task).
Nonresponse
99 BLANK
J03
Understanding ComplexInformation 1
Compounds, molecules and atoms
Rubric 46
Performance ExpectationItemKey
International Average Percentage of8th Grade Students Responding Correctly
N
Used in 1995ScorePointsContent Category
Chemistry
TIMSS 1999 Assessment - 8th Grade 27Science S022174Permanent ID
Copyright
prote
cted by IE
A.
This ite
m m
ay not be use
d
for c
omm
ercial p
urpose
s
without e
xpress
permiss
ion from
IEA.

J04
Understanding ComplexInformation 1
Evaporation rate by surface area
C 84
Performance ExpectationItemKey
International Average Percentage of8th Grade Students Responding Correctly
N
Used in 1995ScorePointsContent Category
Physics
TIMSS 1999 Assessment - 8th Grade 28Science S022009Permanent ID
Copyright
prote
cted by IE
A.
This ite
m m
ay not be use
d
for c
omm
ercial p
urpose
s
without e
xpress
permiss
ion from
IEA.
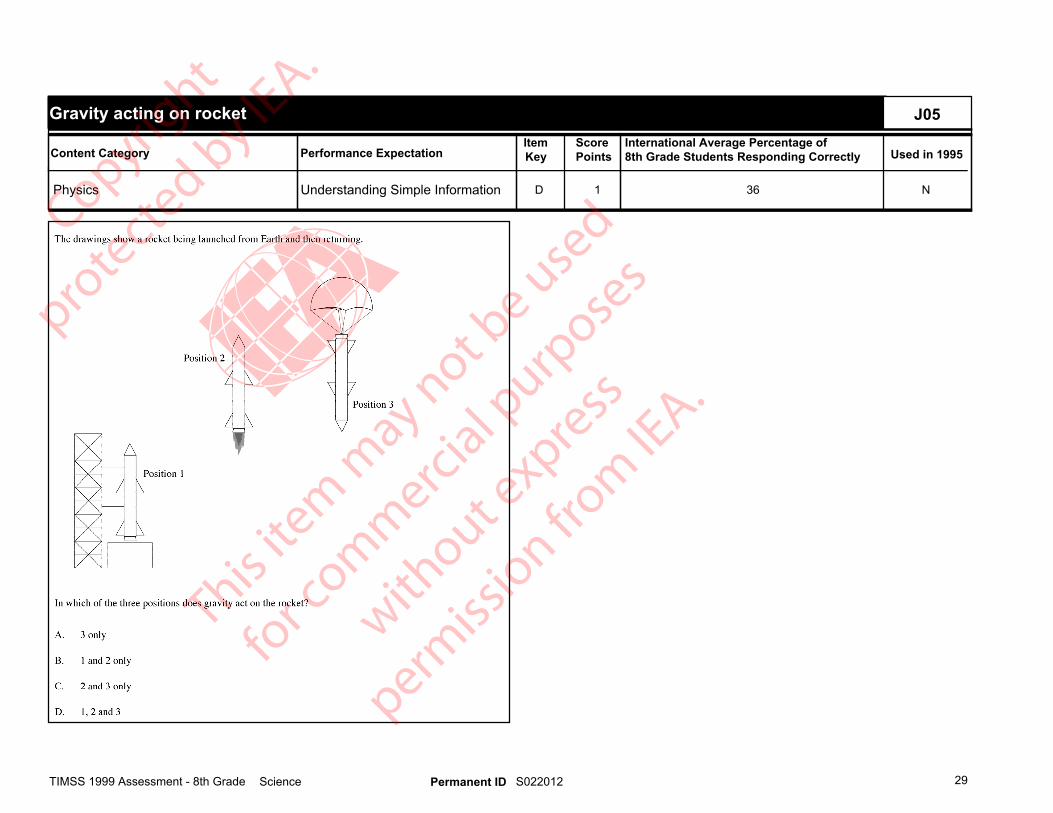
J05
Understanding Simple Information 1
Gravity acting on rocket
D 36
Performance ExpectationItemKey
International Average Percentage of8th Grade Students Responding Correctly
N
Used in 1995ScorePointsContent Category
Physics
TIMSS 1999 Assessment - 8th Grade 29Science S022012Permanent ID
Copyright
prote
cted by IE
A.
This ite
m m
ay not be use
d
for c
omm
ercial p
urpose
s
without e
xpress
permiss
ion from
IEA.

J06
Understanding ComplexInformation 1
Factor explaining seasons on Earth
C 26
Performance ExpectationItemKey
International Average Percentage of8th Grade Students Responding Correctly
N
Used in 1995ScorePointsContent Category
Earth Science
TIMSS 1999 Assessment - 8th Grade 30Science S022082Permanent ID
Copyright
prote
cted by IE
A.
This ite
m m
ay not be use
d
for c
omm
ercial p
urpose
s
without e
xpress
permiss
ion from
IEA.

J07
Understanding Simple Information 1
Reason for protein in diet
C 33
Performance ExpectationItemKey
International Average Percentage of8th Grade Students Responding Correctly
N
Used in 1995ScorePointsContent Category
Life Science
TIMSS 1999 Assessment - 8th Grade 31Science S022094Permanent ID
Copyright
prote
cted by IE
A.
This ite
m m
ay not be use
d
for c
omm
ercial p
urpose
s
without e
xpress
permiss
ion from
IEA.

J08
Understanding Simple Information 1
Sunscreen to protect against radiation
D 62
Performance ExpectationItemKey
International Average Percentage of8th Grade Students Responding Correctly
N
Used in 1995ScorePointsContent Category
Physics
TIMSS 1999 Assessment - 8th Grade 32Science S022278Permanent ID
Copyright
prote
cted by IE
A.
This ite
m m
ay not be use
d
for c
omm
ercial p
urpose
s
without e
xpress
permiss
ion from
IEA.
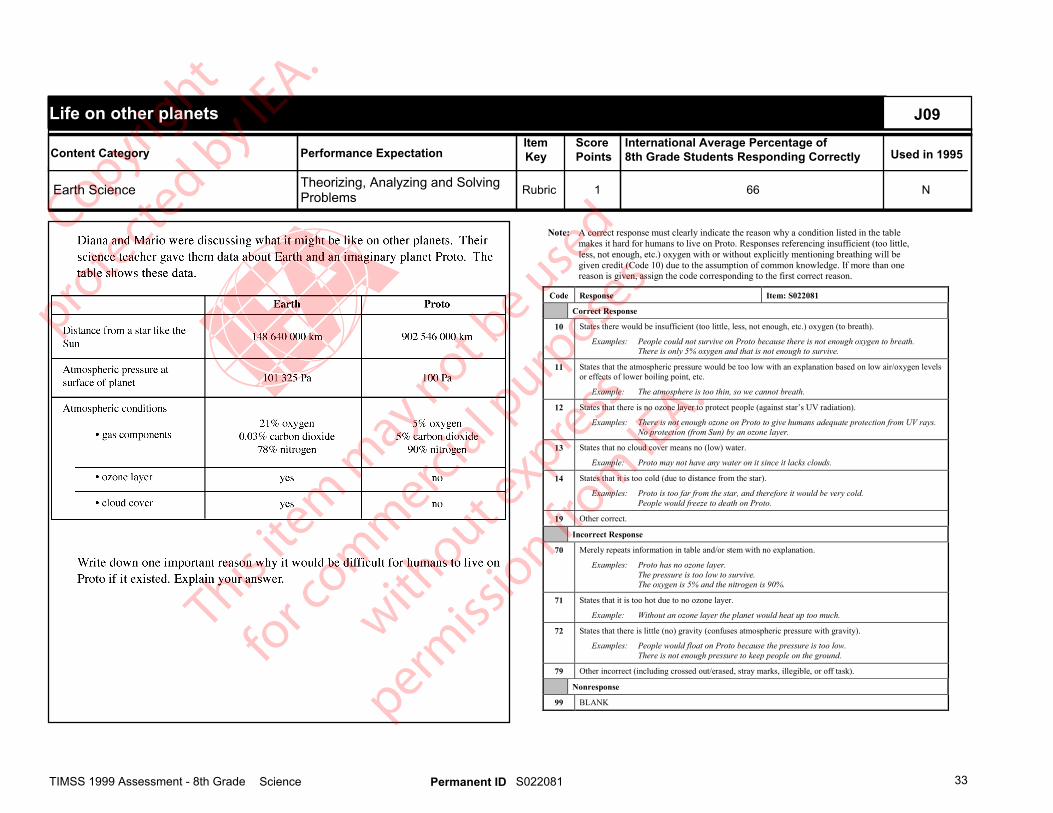
Note: A correct response must clearly indicate the reason why a condition listed in the tablemakes it hard for humans to live on Proto. Responses referencing insufficient (too little,less, not enough, etc.) oxygen with or without explicitly mentioning breathing will begiven credit (Code 10) due to the assumption of common knowledge. If more than onereason is given, assign the code corresponding to the first correct reason.
Code Response Item: S022081
Correct Response
10 States there would be insufficient (too little, less, not enough, etc.) oxygen (to breath).
Examples: People could not survive on Proto because there is not enough oxygen to breath.There is only 5% oxygen and that is not enough to survive.
11 States that the atmospheric pressure would be too low with an explanation based on low air/oxygen levelsor effects of lower boiling point, etc.
Example: The atmosphere is too thin, so we cannot breath.
12 States that there is no ozone layer to protect people (against star’s UV radiation).
Examples: There is not enough ozone on Proto to give humans adequate protection from UV rays.No protection (from Sun) by an ozone layer.
13 States that no cloud cover means no (low) water.
Example: Proto may not have any water on it since it lacks clouds.
14 States that it is too cold (due to distance from the star).
Examples: Proto is too far from the star, and therefore it would be very cold.People would freeze to death on Proto.
19 Other correct.
Incorrect Response
70 Merely repeats information in table and/or stem with no explanation.
Examples: Proto has no ozone layer.The pressure is too low to survive.The oxygen is 5% and the nitrogen is 90%.
71 States that it is too hot due to no ozone layer.
Example: Without an ozone layer the planet would heat up too much.
72 States that there is little (no) gravity (confuses atmospheric pressure with gravity).
Examples: People would float on Proto because the pressure is too low.There is not enough pressure to keep people on the ground.
79 Other incorrect (including crossed out/erased, stray marks, illegible, or off task).
Nonresponse
99 BLANK
J09
Theorizing, Analyzing and SolvingProblems 1
Life on other planets
Rubric 66
Performance ExpectationItemKey
International Average Percentage of8th Grade Students Responding Correctly
N
Used in 1995ScorePointsContent Category
Earth Science
TIMSS 1999 Assessment - 8th Grade 33Science S022081Permanent ID
Copyright
prote
cted by IE
A.
This ite
m m
ay not be use
d
for c
omm
ercial p
urpose
s
without e
xpress
permiss
ion from
IEA.
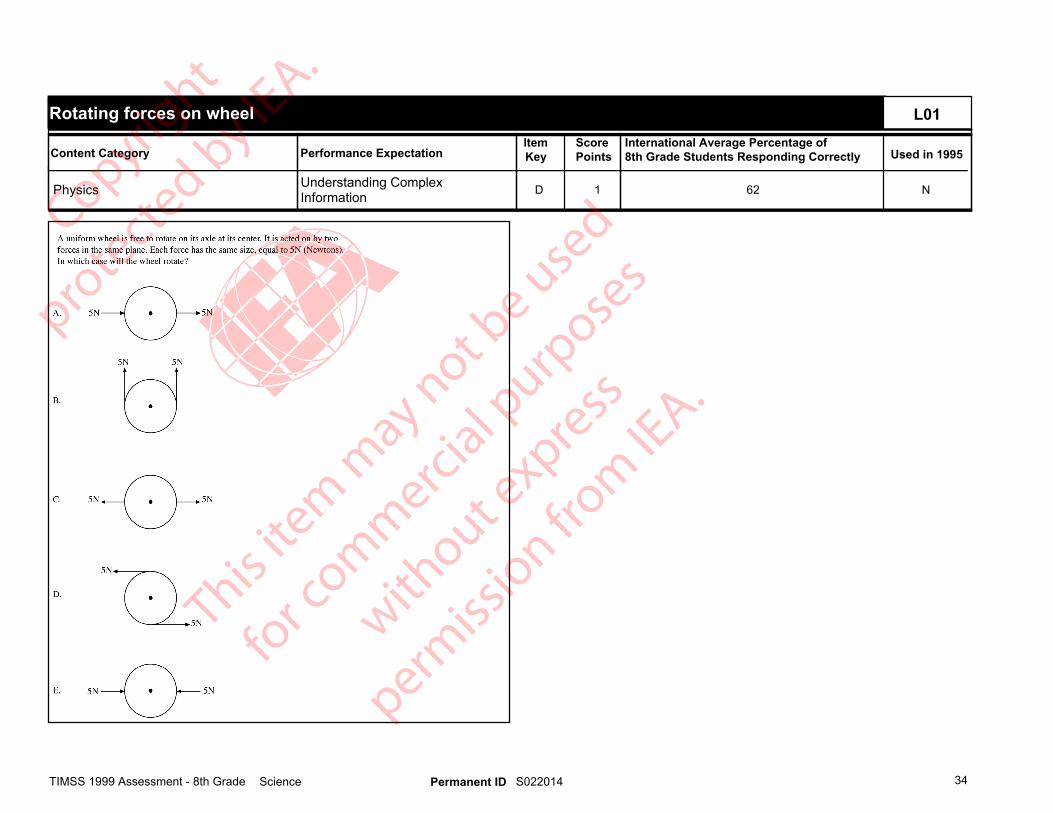
L01
Understanding ComplexInformation 1
Rotating forces on wheel
D 62
Performance ExpectationItemKey
International Average Percentage of8th Grade Students Responding Correctly
N
Used in 1995ScorePointsContent Category
Physics
TIMSS 1999 Assessment - 8th Grade 34Science S022014Permanent ID
Copyright
prote
cted by IE
A.
This ite
m m
ay not be use
d
for c
omm
ercial p
urpose
s
without e
xpress
permiss
ion from
IEA.

L02
Understanding ComplexInformation 1
Large leaves on seedlings
D 72
Performance ExpectationItemKey
International Average Percentage of8th Grade Students Responding Correctly
N
Used in 1995ScorePointsContent Category
Life Science
TIMSS 1999 Assessment - 8th Grade 35Science S022131Permanent ID
Copyright
prote
cted by IE
A.
This ite
m m
ay not be use
d
for c
omm
ercial p
urpose
s
without e
xpress
permiss
ion from
IEA.

L03
Understanding ComplexInformation 1
Physical characteristic of prey
A 37
Performance ExpectationItemKey
International Average Percentage of8th Grade Students Responding Correctly
N
Used in 1995ScorePointsContent Category
Life Science
TIMSS 1999 Assessment - 8th Grade 36Science S022132Permanent ID
Copyright
prote
cted by IE
A.
This ite
m m
ay not be use
d
for c
omm
ercial p
urpose
s
without e
xpress
permiss
ion from
IEA.
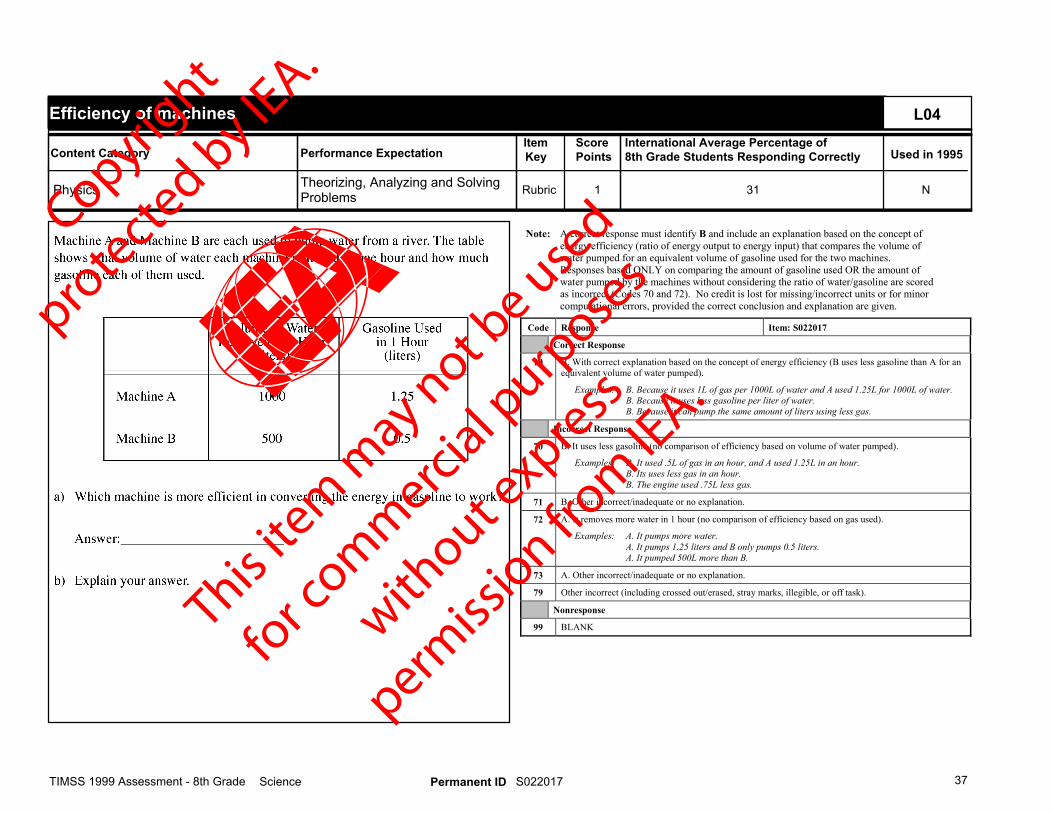
Note: A correct response must identify B and include an explanation based on the concept ofenergy efficiency (ratio of energy output to energy input) that compares the volume ofwater pumped for an equivalent volume of gasoline used for the two machines.Responses based ONLY on comparing the amount of gasoline used OR the amount ofwater pumped by the machines without considering the ratio of water/gasoline are scoredas incorrect (Codes 70 and 72). No credit is lost for missing/incorrect units or for minorcomputational errors, provided the correct conclusion and explanation are given.
Code Response Item: S022017
Correct Response
10 B. With correct explanation based on the concept of energy efficiency (B uses less gasoline than A for anequivalent volume of water pumped).
Examples: B. Because it uses 1L of gas per 1000L of water and A used 1.25L for 1000L of water.B. Because it uses less gasoline per liter of water.B. Because it can pump the same amount of liters using less gas.
Incorrect Response
70 B. It uses less gasoline (no comparison of efficiency based on volume of water pumped).
Examples: B. It used .5L of gas in an hour, and A used 1.25L in an hour.B. Its uses less gas in an hour.B. The engine used .75L less gas.
71 B. Other incorrect/inadequate or no explanation.
72 A. It removes more water in 1 hour (no comparison of efficiency based on gas used).
Examples: A. It pumps more water.A. It pumps 1.25 liters and B only pumps 0.5 liters.A. It pumped 500L more than B.
73 A. Other incorrect/inadequate or no explanation.
79 Other incorrect (including crossed out/erased, stray marks, illegible, or off task).
Nonresponse
99 BLANK
L04
Theorizing, Analyzing and SolvingProblems 1
Efficiency of machines
Rubric 31
Performance ExpectationItemKey
International Average Percentage of8th Grade Students Responding Correctly
N
Used in 1995ScorePointsContent Category
Physics
TIMSS 1999 Assessment - 8th Grade 37Science S022017Permanent ID
Copyright
prote
cted by IE
A.
This ite
m m
ay not be use
d
for c
omm
ercial p
urpose
s
without e
xpress
permiss
ion from
IEA.

L05
Understanding Simple Information 1
Wolves marking territory
C 60
Performance ExpectationItemKey
International Average Percentage of8th Grade Students Responding Correctly
N
Used in 1995ScorePointsContent Category
Life Science
TIMSS 1999 Assessment - 8th Grade 38Science S022295Permanent ID
Copyright
prote
cted by IE
A.
This ite
m m
ay not be use
d
for c
omm
ercial p
urpose
s
without e
xpress
permiss
ion from
IEA.

L06
Using Tools, Routine Proceduresand Science Processes 1
Filtration of mixtures
B 39
Performance ExpectationItemKey
International Average Percentage of8th Grade Students Responding Correctly
N
Used in 1995ScorePointsContent Category
Chemistry
TIMSS 1999 Assessment - 8th Grade 39Science S022194Permanent ID
Copyright
prote
cted by IE
A.
This ite
m m
ay not be use
d
for c
omm
ercial p
urpose
s
without e
xpress
permiss
ion from
IEA.

L07
Understanding ComplexInformation 1
Effectiveness of insecticides
B 48
Performance ExpectationItemKey
International Average Percentage of8th Grade Students Responding Correctly
N
Used in 1995ScorePointsContent Category
Environmental and Resource Issues
TIMSS 1999 Assessment - 8th Grade 40Science S022118Permanent ID
Copyright
prote
cted by IE
A.
This ite
m m
ay not be use
d
for c
omm
ercial p
urpose
s
without e
xpress
permiss
ion from
IEA.
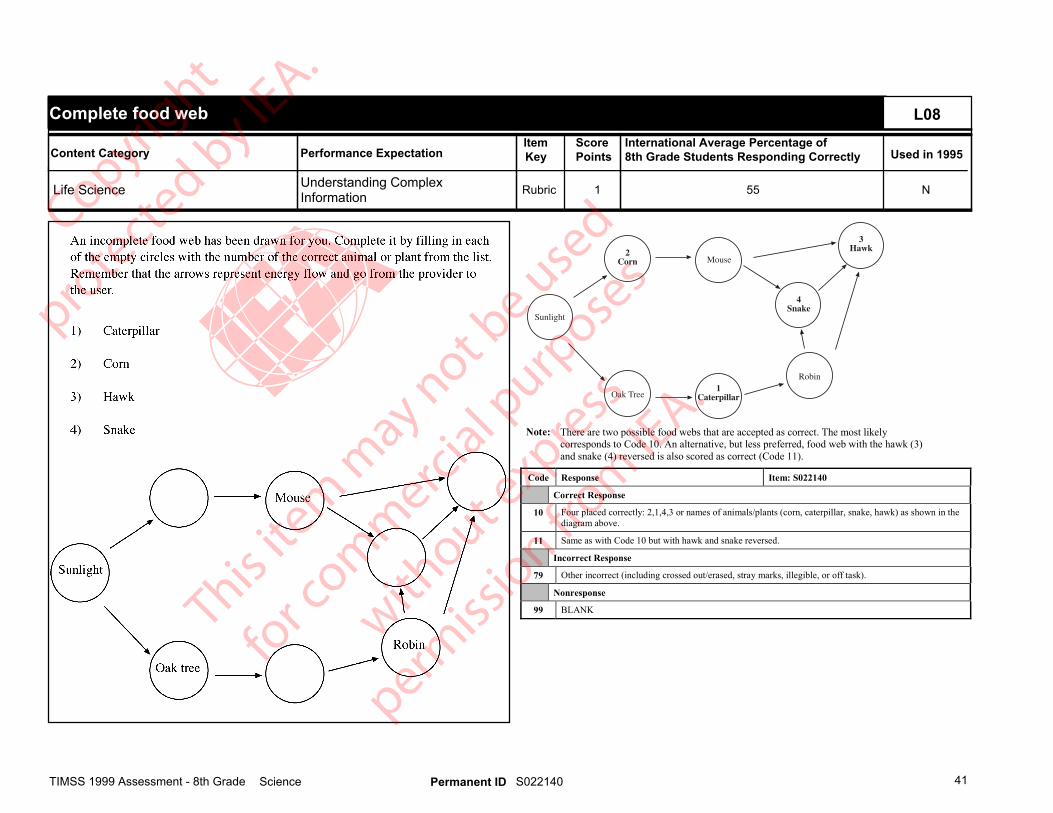
Note: There are two possible food webs that are accepted as correct. The most likelycorresponds to Code 10. An alternative, but less preferred, food web with the hawk (3)and snake (4) reversed is also scored as correct (Code 11).
Code Response Item: S022140
Correct Response
10 Four placed correctly: 2,1,4,3 or names of animals/plants (corn, caterpillar, snake, hawk) as shown in thediagram above.
11 Same as with Code 10 but with hawk and snake reversed.
Incorrect Response
79 Other incorrect (including crossed out/erased, stray marks, illegible, or off task).
Nonresponse
99 BLANK
L08
Understanding ComplexInformation 1
Complete food web
Rubric 55
Performance ExpectationItemKey
International Average Percentage of8th Grade Students Responding Correctly
N
Used in 1995ScorePointsContent Category
Life Science
TIMSS 1999 Assessment - 8th Grade 41Science S022140Permanent ID
Copyright
prote
cted by IE
A.
This ite
m m
ay not be use
d
for c
omm
ercial p
urpose
s
without e
xpress
permiss
ion from
IEA.
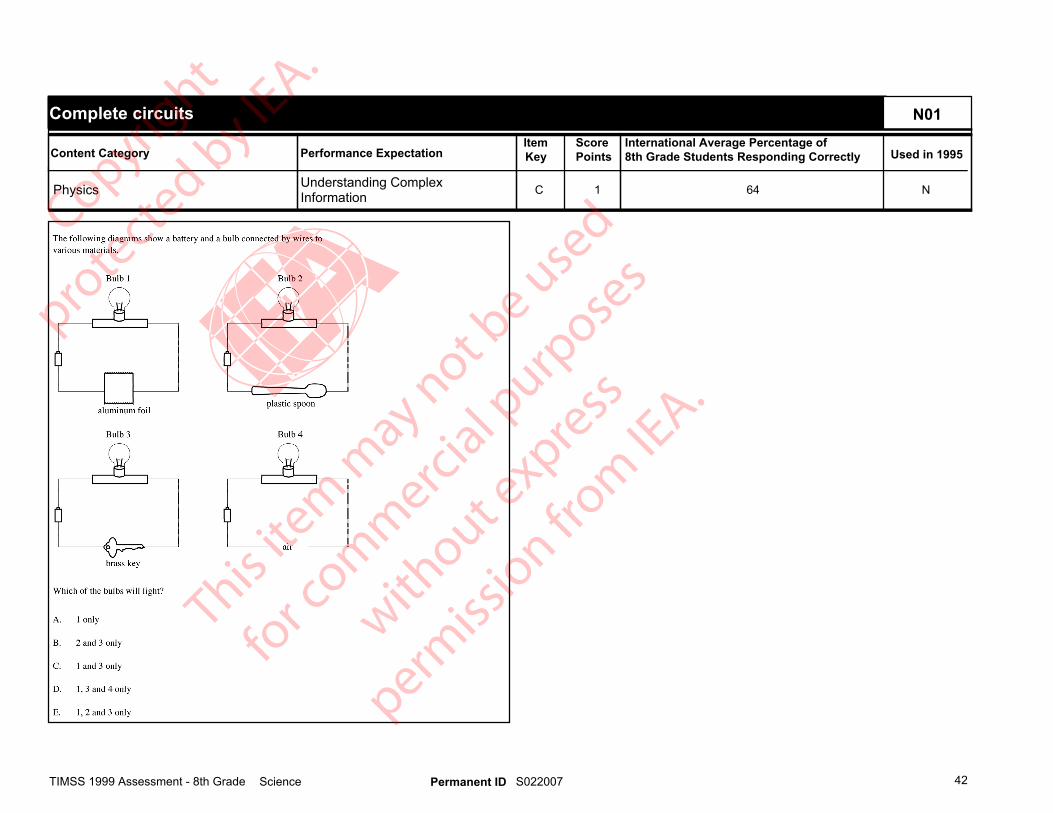
N01
Understanding ComplexInformation 1
Complete circuits
C 64
Performance ExpectationItemKey
International Average Percentage of8th Grade Students Responding Correctly
N
Used in 1995ScorePointsContent Category
Physics
TIMSS 1999 Assessment - 8th Grade 42Science S022007Permanent ID
Copyright
prote
cted by IE
A.
This ite
m m
ay not be use
d
for c
omm
ercial p
urpose
s
without e
xpress
permiss
ion from
IEA.
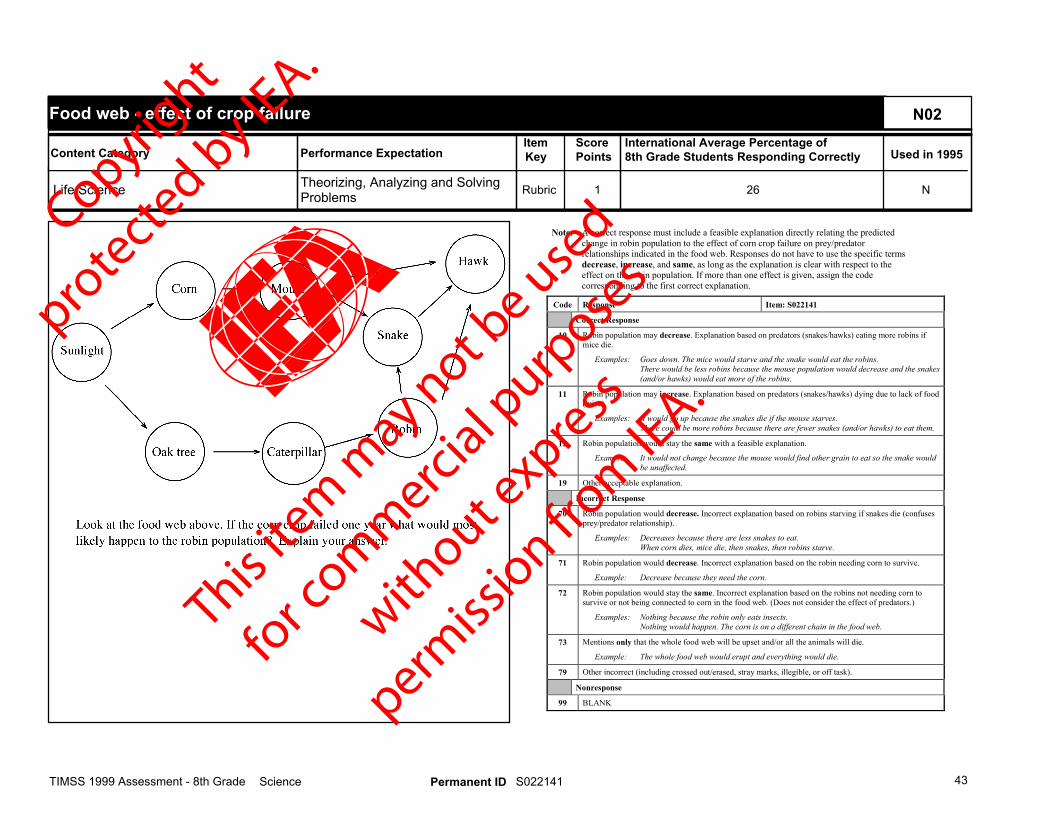
Note: A correct response must include a feasible explanation directly relating the predictedchange in robin population to the effect of corn crop failure on prey/predatorrelationships indicated in the food web. Responses do not have to use the specific termsdecrease, increase, and same, as long as the explanation is clear with respect to theeffect on the robin population. If more than one effect is given, assign the codecorresponding to the first correct explanation.
Code Response Item: S022141
Correct Response
10 Robin population may decrease. Explanation based on predators (snakes/hawks) eating more robins ifmice die.
Examples: Goes down. The mice would starve and the snake would eat the robins.There would be less robins because the mouse population would decrease and the snakes(and/or hawks) would eat more of the robins.
11 Robin population may increase. Explanation based on predators (snakes/hawks) dying due to lack of food(mice).
Examples: It would go up because the snakes die if the mouse starves.There could be more robins because there are fewer snakes (and/or hawks) to eat them.
12 Robin population would stay the same with a feasible explanation.
Example: It would not change because the mouse would find other grain to eat so the snake wouldbe unaffected.
19 Other acceptable explanation.
Incorrect Response
70 Robin population would decrease. Incorrect explanation based on robins starving if snakes die (confusesprey/predator relationship).
Examples: Decreases because there are less snakes to eat.When corn dies, mice die, then snakes, then robins starve.
71 Robin population would decrease. Incorrect explanation based on the robin needing corn to survive.
Example: Decrease because they need the corn.
72 Robin population would stay the same. Incorrect explanation based on the robins not needing corn tosurvive or not being connected to corn in the food web. (Does not consider the effect of predators.)
Examples: Nothing because the robin only eats insects.Nothing would happen. The corn is on a different chain in the food web.
73 Mentions only that the whole food web will be upset and/or all the animals will die.
Example: The whole food web would erupt and everything would die.
79 Other incorrect (including crossed out/erased, stray marks, illegible, or off task).
Nonresponse
99 BLANK
N02
Theorizing, Analyzing and SolvingProblems 1
Food web - effect of crop failure
Rubric 26
Performance ExpectationItemKey
International Average Percentage of8th Grade Students Responding Correctly
N
Used in 1995ScorePointsContent Category
Life Science
TIMSS 1999 Assessment - 8th Grade 43Science S022141Permanent ID
Copyright
prote
cted by IE
A.
This ite
m m
ay not be use
d
for c
omm
ercial p
urpose
s
without e
xpress
permiss
ion from
IEA.
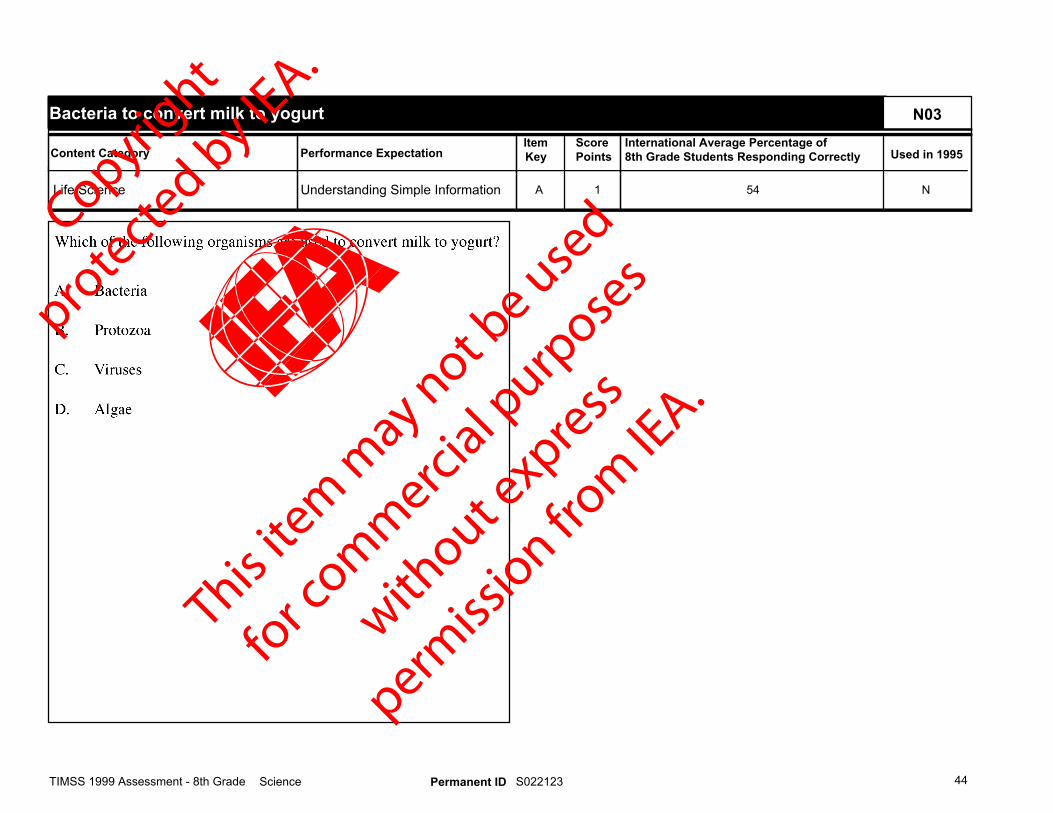
N03
Understanding Simple Information 1
Bacteria to convert milk to yogurt
A 54
Performance ExpectationItemKey
International Average Percentage of8th Grade Students Responding Correctly
N
Used in 1995ScorePointsContent Category
Life Science
TIMSS 1999 Assessment - 8th Grade 44Science S022123Permanent ID
Copyright
prote
cted by IE
A.
This ite
m m
ay not be use
d
for c
omm
ercial p
urpose
s
without e
xpress
permiss
ion from
IEA.

N04
Investigating the Natural World 1
Evaporation of vinegar and oil
C 48
Performance ExpectationItemKey
International Average Percentage of8th Grade Students Responding Correctly
N
Used in 1995ScorePointsContent Category
Scientific Inquiry and the Nature ofScience
TIMSS 1999 Assessment - 8th Grade 45Science S022238Permanent ID
Copyright
prote
cted by IE
A.
This ite
m m
ay not be use
d
for c
omm
ercial p
urpose
s
without e
xpress
permiss
ion from
IEA.

N05
Understanding Simple Information 1
Bone meal for plant growth
B 56
Performance ExpectationItemKey
International Average Percentage of8th Grade Students Responding Correctly
N
Used in 1995ScorePointsContent Category
Life Science
TIMSS 1999 Assessment - 8th Grade 46Science S022145Permanent ID
Copyright
prote
cted by IE
A.
This ite
m m
ay not be use
d
for c
omm
ercial p
urpose
s
without e
xpress
permiss
ion from
IEA.

N06
Understanding Simple Information 1
Definition of tissue
A 41
Performance ExpectationItemKey
International Average Percentage of8th Grade Students Responding Correctly
N
Used in 1995ScorePointsContent Category
Life Science
TIMSS 1999 Assessment - 8th Grade 47Science S022293Permanent ID
Copyright
prote
cted by IE
A.
This ite
m m
ay not be use
d
for c
omm
ercial p
urpose
s
without e
xpress
permiss
ion from
IEA.

N07
Understanding Simple Information 1
Example of chemical reaction
C 49
Performance ExpectationItemKey
International Average Percentage of8th Grade Students Responding Correctly
N
Used in 1995ScorePointsContent Category
Chemistry
TIMSS 1999 Assessment - 8th Grade 48Science S022178Permanent ID
Copyright
prote
cted by IE
A.
This ite
m m
ay not be use
d
for c
omm
ercial p
urpose
s
without e
xpress
permiss
ion from
IEA.

N08
Understanding ComplexInformation 1
Mammal/lizards living in cold regions
D 40
Performance ExpectationItemKey
International Average Percentage of8th Grade Students Responding Correctly
N
Used in 1995ScorePointsContent Category
Life Science
TIMSS 1999 Assessment - 8th Grade 49Science S022137Permanent ID
Copyright
prote
cted by IE
A.
This ite
m m
ay not be use
d
for c
omm
ercial p
urpose
s
without e
xpress
permiss
ion from
IEA.
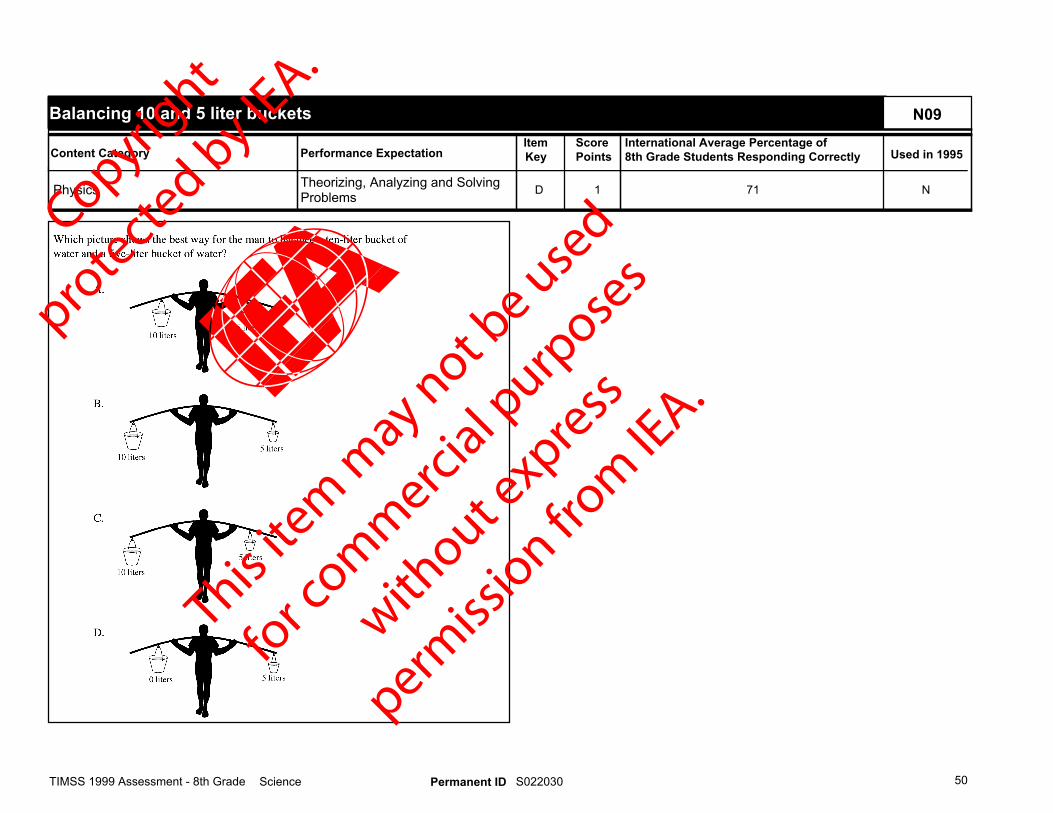
N09
Theorizing, Analyzing and SolvingProblems 1
Balancing 10 and 5 liter buckets
D 71
Performance ExpectationItemKey
International Average Percentage of8th Grade Students Responding Correctly
N
Used in 1995ScorePointsContent Category
Physics
TIMSS 1999 Assessment - 8th Grade 50Science S022030Permanent ID
Copyright
prote
cted by IE
A.
This ite
m m
ay not be use
d
for c
omm
ercial p
urpose
s
without e
xpress
permiss
ion from
IEA.
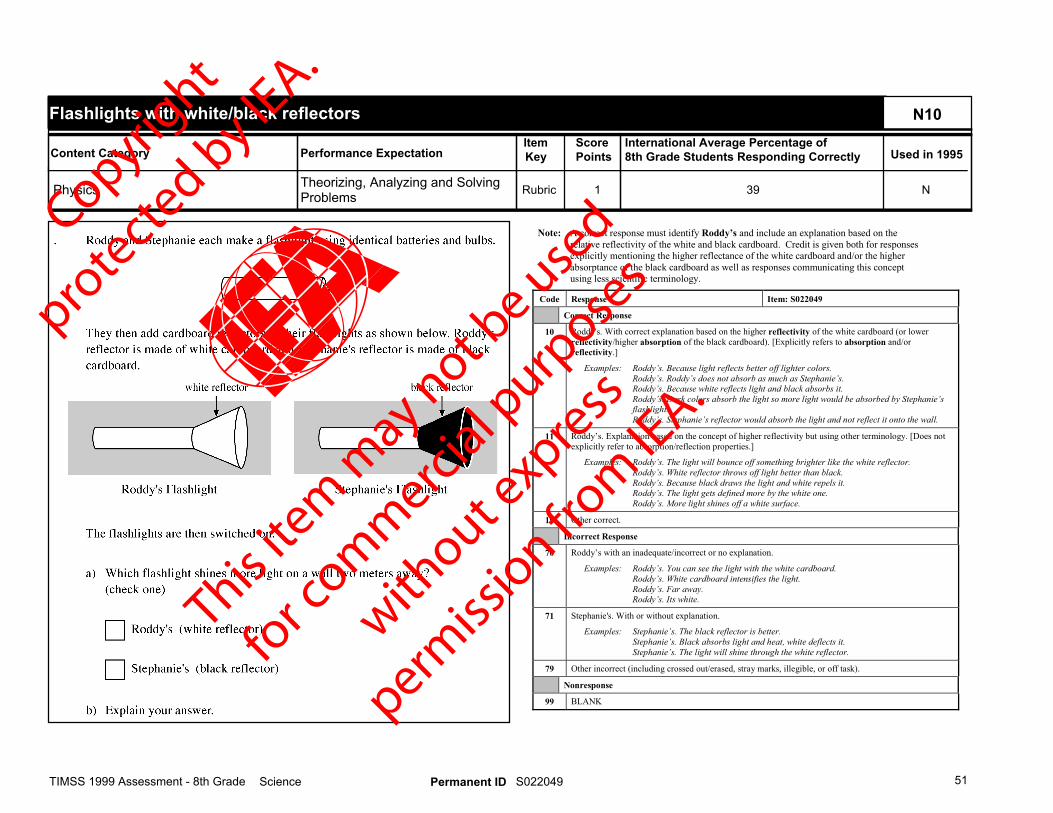
Note: A correct response must identify Roddy’s and include an explanation based on therelative reflectivity of the white and black cardboard. Credit is given both for responsesexplicitly mentioning the higher reflectance of the white cardboard and/or the higherabsorptance of the black cardboard as well as responses communicating this conceptusing less scientific terminology.
Code Response Item: S022049
Correct Response
10 Roddy's. With correct explanation based on the higher reflectivity of the white cardboard (or lowerreflectivity/higher absorption of the black cardboard). [Explicitly refers to absorption and/orreflectivity.]
Examples: Roddy’s. Because light reflects better off lighter colors.Roddy’s. Roddy’s does not absorb as much as Stephanie’s.Roddy’s. Because white reflects light and black absorbs it.Roddy’s. Dark colors absorb the light so more light would be absorbed by Stephanie’sflashlight.Roddy’s. Stephanie’s reflector would absorb the light and not reflect it onto the wall.
11 Roddy’s. Explanation based on the concept of higher reflectivity but using other terminology. [Does notexplicitly refer to absorption/reflection properties.]
Examples: Roddy’s. The light will bounce off something brighter like the white reflector.Roddy’s. White reflector throws off light better than black.Roddy’s. Because black draws the light and white repels it.Roddy’s. The light gets defined more by the white one.Roddy’s. More light shines off a white surface.
19 Other correct.
Incorrect Response
70 Roddy’s with an inadequate/incorrect or no explanation.
Examples: Roddy’s. You can see the light with the white cardboard.Roddy’s. White cardboard intensifies the light.Roddy’s. Far away.Roddy’s. Its white.
71 Stephanie's. With or without explanation.
Examples: Stephanie’s. The black reflector is better.Stephanie’s. Black absorbs light and heat, white deflects it.Stephanie’s. The light will shine through the white reflector.
79 Other incorrect (including crossed out/erased, stray marks, illegible, or off task).
Nonresponse
99 BLANK
N10
Theorizing, Analyzing and SolvingProblems 1
Flashlights with white/black reflectors
Rubric 39
Performance ExpectationItemKey
International Average Percentage of8th Grade Students Responding Correctly
N
Used in 1995ScorePointsContent Category
Physics
TIMSS 1999 Assessment - 8th Grade 51Science S022049Permanent ID
Copyright
prote
cted by IE
A.
This ite
m m
ay not be use
d
for c
omm
ercial p
urpose
s
without e
xpress
permiss
ion from
IEA.

P01
Theorizing, Analyzing and SolvingProblems 1
Determination of speed from graph
D 54
Performance ExpectationItemKey
International Average Percentage of8th Grade Students Responding Correctly
N
Used in 1995ScorePointsContent Category
Physics
TIMSS 1999 Assessment - 8th Grade 52Science S022280Permanent ID
Copyright
prote
cted by IE
A.
This ite
m m
ay not be use
d
for c
omm
ercial p
urpose
s
without e
xpress
permiss
ion from
IEA.
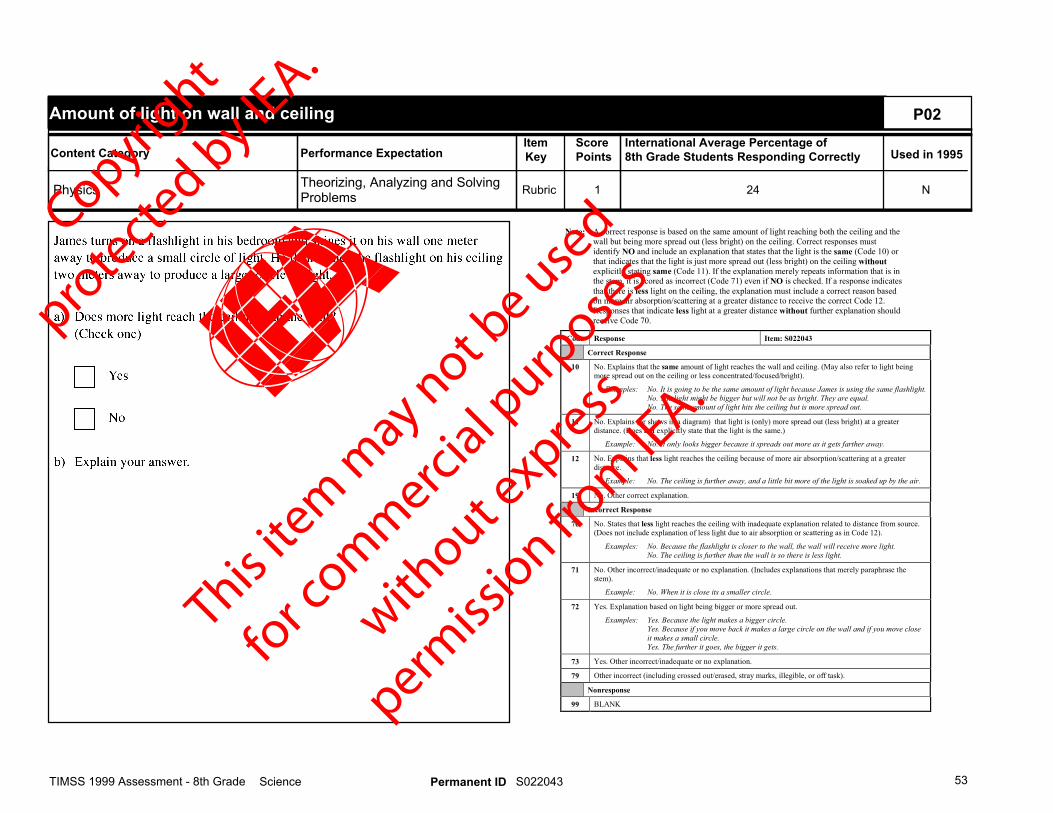
Note: A correct response is based on the same amount of light reaching both the ceiling and thewall but being more spread out (less bright) on the ceiling. Correct responses mustidentify NO and include an explanation that states that the light is the same (Code 10) orthat indicates that the light is just more spread out (less bright) on the ceiling withoutexplicitly stating same (Code 11). If the explanation merely repeats information that is inthe stem, it is scored as incorrect (Code 71) even if NO is checked. If a response indicatesthat there is less light on the ceiling, the explanation must include a correct reason basedon more air absorption/scattering at a greater distance to receive the correct Code 12.Responses that indicate less light at a greater distance without further explanation shouldreceive Code 70.
Code Response Item: S022043
Correct Response
10 No. Explains that the same amount of light reaches the wall and ceiling. (May also refer to light beingmore spread out on the ceiling or less concentrated/focused/bright).
Examples: No. It is going to be the same amount of light because James is using the same flashlight.No. The light might be bigger but will not be as bright. They are equal.No. The same amount of light hits the ceiling but is more spread out.
11 No. Explains (or shows in a diagram) that light is (only) more spread out (less bright) at a greaterdistance. (Does not explicitly state that the light is the same.)
Example: No. It only looks bigger because it spreads out more as it gets farther away.
12 No. Explains that less light reaches the ceiling because of more air absorption/scattering at a greaterdistance.
Example: No. The ceiling is further away, and a little bit more of the light is soaked up by the air.
19 No. Other correct explanation.
Incorrect Response
70 No. States that less light reaches the ceiling with inadequate explanation related to distance from source.(Does not include explanation of less light due to air absorption or scattering as in Code 12).
Examples: No. Because the flashlight is closer to the wall, the wall will receive more light.No. The ceiling is further than the wall is so there is less light.
71 No. Other incorrect/inadequate or no explanation. (Includes explanations that merely paraphrase thestem).
Example: No. When it is close its a smaller circle.
72 Yes. Explanation based on light being bigger or more spread out.
Examples: Yes. Because the light makes a bigger circle.Yes. Because if you move back it makes a large circle on the wall and if you move closeit makes a small circle.Yes. The further it goes, the bigger it gets.
73 Yes. Other incorrect/inadequate or no explanation.
79 Other incorrect (including crossed out/erased, stray marks, illegible, or off task).
Nonresponse
99 BLANK
P02
Theorizing, Analyzing and SolvingProblems 1
Amount of light on wall and ceiling
Rubric 24
Performance ExpectationItemKey
International Average Percentage of8th Grade Students Responding Correctly
N
Used in 1995ScorePointsContent Category
Physics
TIMSS 1999 Assessment - 8th Grade 53Science S022043Permanent ID
Copyright
prote
cted by IE
A.
This ite
m m
ay not be use
d
for c
omm
ercial p
urpose
s
without e
xpress
permiss
ion from
IEA.
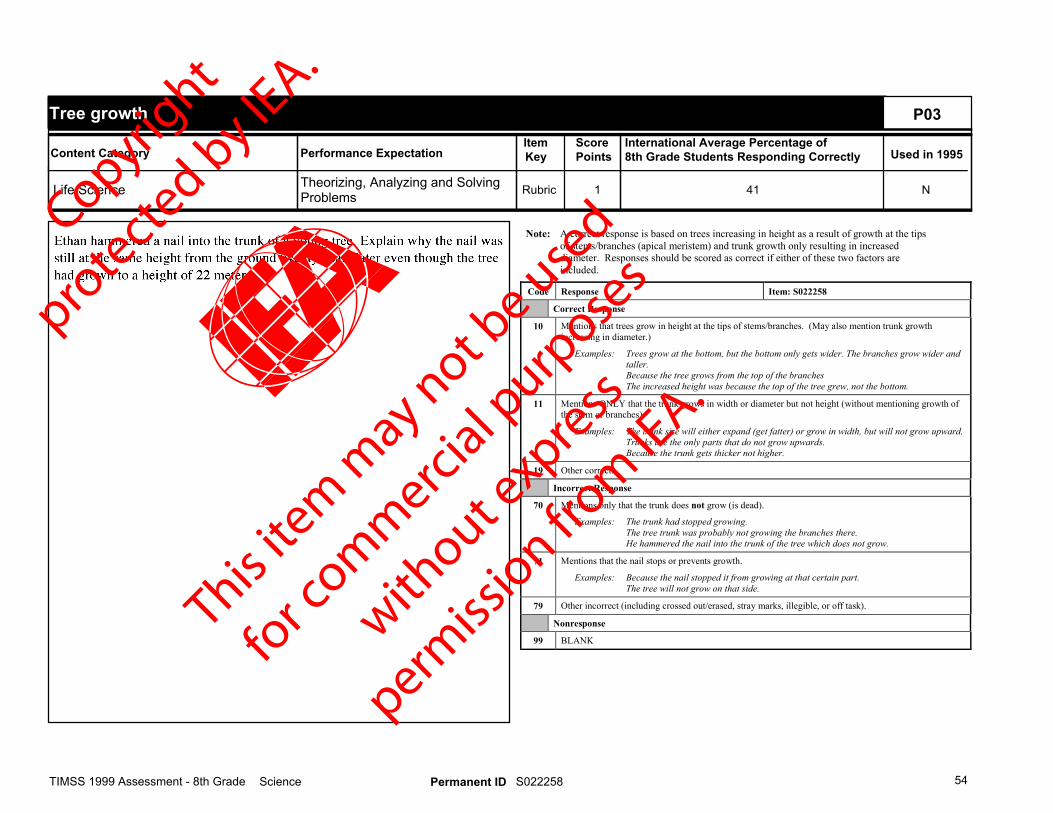
Note: A correct response is based on trees increasing in height as a result of growth at the tipsof stems/branches (apical meristem) and trunk growth only resulting in increaseddiameter. Responses should be scored as correct if either of these two factors areincluded.
Code Response Item: S022258
Correct Response
10 Mentions that trees grow in height at the tips of stems/branches. (May also mention trunk growthincreasing in diameter.)
Examples: Trees grow at the bottom, but the bottom only gets wider. The branches grow wider andtaller.Because the tree grows from the top of the branchesThe increased height was because the top of the tree grew, not the bottom.
11 Mentions ONLY that the trunk grows in width or diameter but not height (without mentioning growth ofthe stem or branches).
Examples: The trunk size will either expand (get fatter) or grow in width, but will not grow upward.Trunks are the only parts that do not grow upwards.Because the trunk gets thicker not higher.
19 Other correct.
Incorrect Response
70 Mentions only that the trunk does not grow (is dead).
Examples: The trunk had stopped growing.The tree trunk was probably not growing the branches there.He hammered the nail into the trunk of the tree which does not grow.
71 Mentions that the nail stops or prevents growth.
Examples: Because the nail stopped it from growing at that certain part.The tree will not grow on that side.
79 Other incorrect (including crossed out/erased, stray marks, illegible, or off task).
Nonresponse
99 BLANK
P03
Theorizing, Analyzing and SolvingProblems 1
Tree growth
Rubric 41
Performance ExpectationItemKey
International Average Percentage of8th Grade Students Responding Correctly
N
Used in 1995ScorePointsContent Category
Life Science
TIMSS 1999 Assessment - 8th Grade 54Science S022258Permanent ID
Copyright
prote
cted by IE
A.
This ite
m m
ay not be use
d
for c
omm
ercial p
urpose
s
without e
xpress
permiss
ion from
IEA.

P04
Understanding ComplexInformation 1
Hibernating animals
D 48
Performance ExpectationItemKey
International Average Percentage of8th Grade Students Responding Correctly
N
Used in 1995ScorePointsContent Category
Life Science
TIMSS 1999 Assessment - 8th Grade 55Science S022157Permanent ID
Copyright
prote
cted by IE
A.
This ite
m m
ay not be use
d
for c
omm
ercial p
urpose
s
without e
xpress
permiss
ion from
IEA.
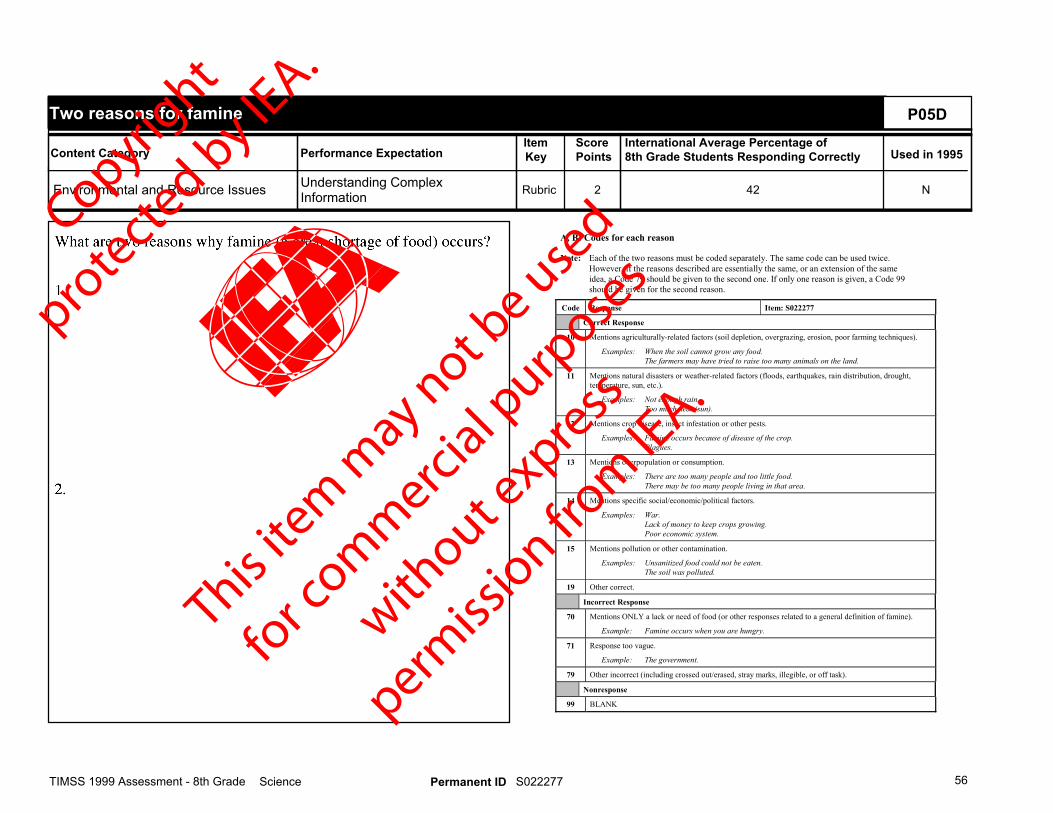
A, B: Codes for each reason
Note: Each of the two reasons must be coded separately. The same code can be used twice.However, if the reasons described are essentially the same, or an extension of the sameidea, a Code 79 should be given to the second one. If only one reason is given, a Code 99should be given for the second reason.
Code Response Item: S022277
Correct Response
10 Mentions agriculturally-related factors (soil depletion, overgrazing, erosion, poor farming techniques).
Examples: When the soil cannot grow any food.The farmers may have tried to raise too many animals on the land.
11 Mentions natural disasters or weather-related factors (floods, earthquakes, rain distribution, drought,temperature, sun, etc.).
Examples: Not enough rain.Too much heat (sun).
12 Mentions crop disease, insect infestation or other pests.
Examples: Famine occurs because of disease of the crop.Plagues.
13 Mentions overpopulation or consumption.
Examples: There are too many people and too little food.There may be too many people living in that area.
14 Mentions specific social/economic/political factors.
Examples: War.Lack of money to keep crops growing.Poor economic system.
15 Mentions pollution or other contamination.
Examples: Unsanitized food could not be eaten.The soil was polluted.
19 Other correct.
Incorrect Response
70 Mentions ONLY a lack or need of food (or other responses related to a general definition of famine).
Example: Famine occurs when you are hungry.
71 Response too vague.
Example: The government.
79 Other incorrect (including crossed out/erased, stray marks, illegible, or off task).
Nonresponse
99 BLANK
P05D
Understanding ComplexInformation 2
Two reasons for famine
Rubric 42
Performance ExpectationItemKey
International Average Percentage of8th Grade Students Responding Correctly
N
Used in 1995ScorePointsContent Category
Environmental and Resource Issues
TIMSS 1999 Assessment - 8th Grade 56Science S022277Permanent ID
Copyright
prote
cted by IE
A.
This ite
m m
ay not be use
d
for c
omm
ercial p
urpose
s
without e
xpress
permiss
ion from
IEA.

Note: To receive code 10 or 11, a response must name a specific digestive substance found inthe stomach (enzyme, hydrochloric acid, or gastric juices) with or without a fulldescription of its function. A general response related to “acid” will be accepted ascorrect (code 12), but an incorrect acid will be scored as incorrect (code 70).
Code Response Item: S022158
Correct Response
10 Names enzyme, hydrochloric acid or gastric juices with an explanation based on breaking down food(particles) or protein.
Example: The enzymes in the stomach dissolve the food so it can be absorbed.There is hydrochloric acid in the stomach that breaks down the food.The gastric juices break the food into smaller pieces.
11 Names enzyme, hydrochloric acid or gastric juices without a complete explanation.
12 Names acid with or without a complete explanation (does not explicitly name hydrochloric acid).
19 Other correct.
Incorrect Response
70 Names an incorrect acid not involved in digestion in stomach (lactic acid, amino acid, sulfuric acid, etc.).
71 Names a substance (or body part) not found in the stomach but involved in digestion (saliva, bile salts,bacteria, intestines, etc.).
72 Mentions digesting (breaking down) food but no specific substance or body part is named.
79 Other incorrect (including crossed out/erased, stray marks, illegible, or off task).
Nonresponse
99 BLANK
P06
Understanding ComplexInformation 1
Digestion in stomach
Rubric 41
Performance ExpectationItemKey
International Average Percentage of8th Grade Students Responding Correctly
N
Used in 1995ScorePointsContent Category
Life Science
TIMSS 1999 Assessment - 8th Grade 57Science S022158Permanent ID
Copyright
prote
cted by IE
A.
This ite
m m
ay not be use
d
for c
omm
ercial p
urpose
s
without e
xpress
permiss
ion from
IEA.

P07
Understanding Simple Information 1
Replication of measurements
C 40
Performance ExpectationItemKey
International Average Percentage of8th Grade Students Responding Correctly
N
Used in 1995ScorePointsContent Category
Scientific Inquiry and the Nature ofScience
TIMSS 1999 Assessment - 8th Grade 58Science S022245Permanent ID
Copyright
prote
cted by IE
A.
This ite
m m
ay not be use
d
for c
omm
ercial p
urpose
s
without e
xpress
permiss
ion from
IEA.

R01
Investigating the Natural World 1
Bacteria/mold experiment
B 35
Performance ExpectationItemKey
International Average Percentage of8th Grade Students Responding Correctly
N
Used in 1995ScorePointsContent Category
Scientific Inquiry and the Nature ofScience
TIMSS 1999 Assessment - 8th Grade 59Science S022264Permanent ID
Copyright
prote
cted by IE
A.
This ite
m m
ay not be use
d
for c
omm
ercial p
urpose
s
without e
xpress
permiss
ion from
IEA.
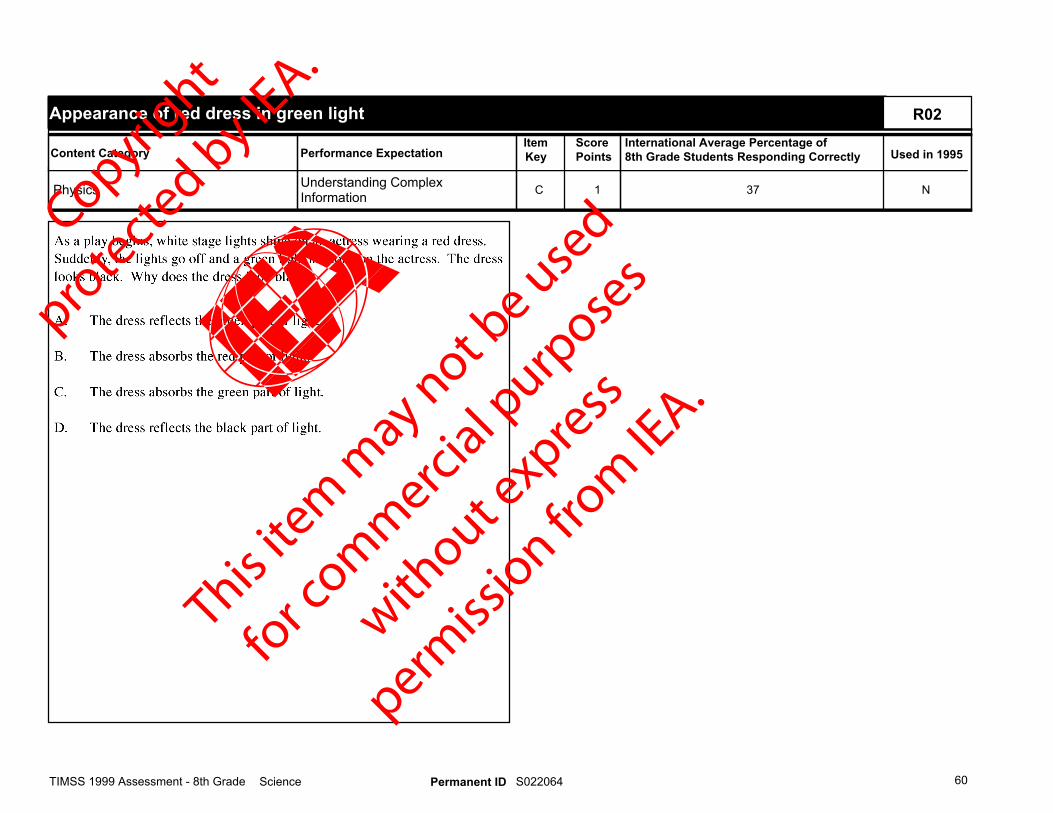
R02
Understanding ComplexInformation 1
Appearance of red dress in green light
C 37
Performance ExpectationItemKey
International Average Percentage of8th Grade Students Responding Correctly
N
Used in 1995ScorePointsContent Category
Physics
TIMSS 1999 Assessment - 8th Grade 60Science S022064Permanent ID
Copyright
prote
cted by IE
A.
This ite
m m
ay not be use
d
for c
omm
ercial p
urpose
s
without e
xpress
permiss
ion from
IEA.
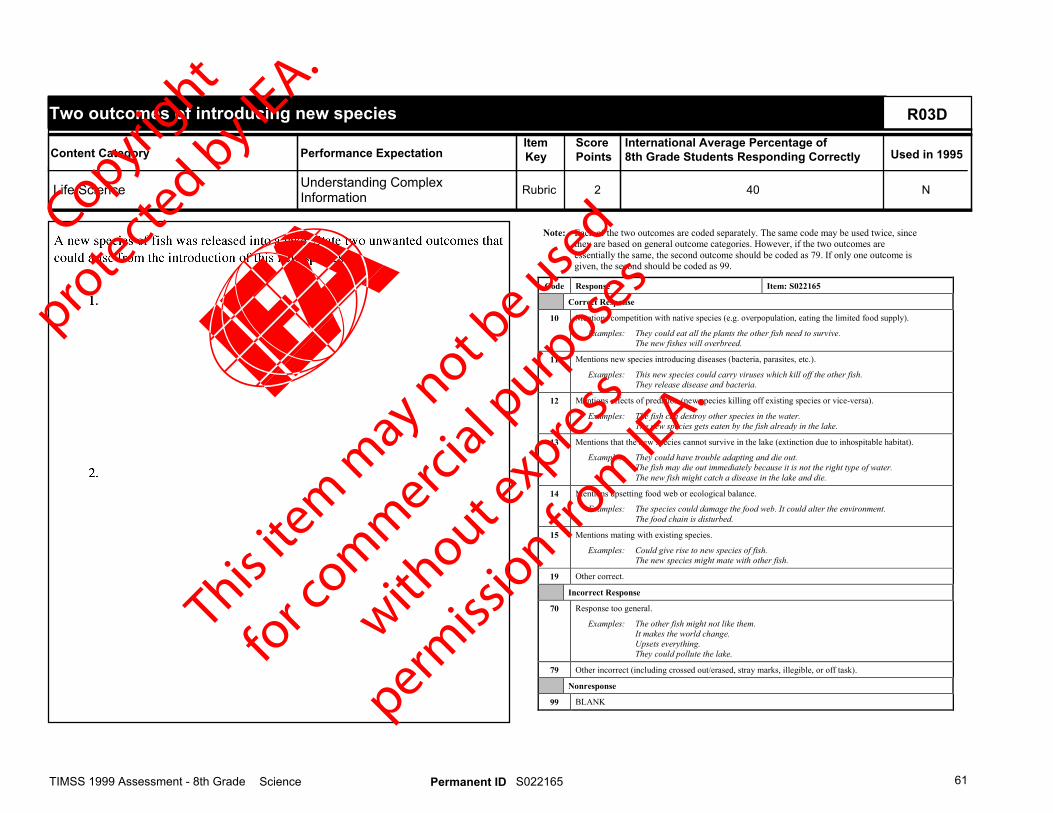
Note: Each of the two outcomes are coded separately. The same code may be used twice, sincethey are based on general outcome categories. However, if the two outcomes areessentially the same, the second outcome should be coded as 79. If only one outcome isgiven, the second should be coded as 99.
Code Response Item: S022165
Correct Response
10 Mentions competition with native species (e.g. overpopulation, eating the limited food supply).
Examples: They could eat all the plants the other fish need to survive.The new fishes will overbreed.
11 Mentions new species introducing diseases (bacteria, parasites, etc.).
Examples: This new species could carry viruses which kill off the other fish.They release disease and bacteria.
12 Mentions effects of predation (new species killing off existing species or vice-versa).
Examples: The fish can destroy other species in the water.The new species gets eaten by the fish already in the lake.
13 Mentions that the new species cannot survive in the lake (extinction due to inhospitable habitat).
Examples: They could have trouble adapting and die out.The fish may die out immediately because it is not the right type of water.The new fish might catch a disease in the lake and die.
14 Mentions upsetting food web or ecological balance.
Examples: The species could damage the food web. It could alter the environment.The food chain is disturbed.
15 Mentions mating with existing species.
Examples: Could give rise to new species of fish.The new species might mate with other fish.
19 Other correct.
Incorrect Response
70 Response too general.
Examples: The other fish might not like them.It makes the world change.Upsets everything.They could pollute the lake.
79 Other incorrect (including crossed out/erased, stray marks, illegible, or off task).
Nonresponse
99 BLANK
R03D
Understanding ComplexInformation 2
Two outcomes of introducing new species
Rubric 40
Performance ExpectationItemKey
International Average Percentage of8th Grade Students Responding Correctly
N
Used in 1995ScorePointsContent Category
Life Science
TIMSS 1999 Assessment - 8th Grade 61Science S022165Permanent ID
Copyright
prote
cted by IE
A.
This ite
m m
ay not be use
d
for c
omm
ercial p
urpose
s
without e
xpress
permiss
ion from
IEA.
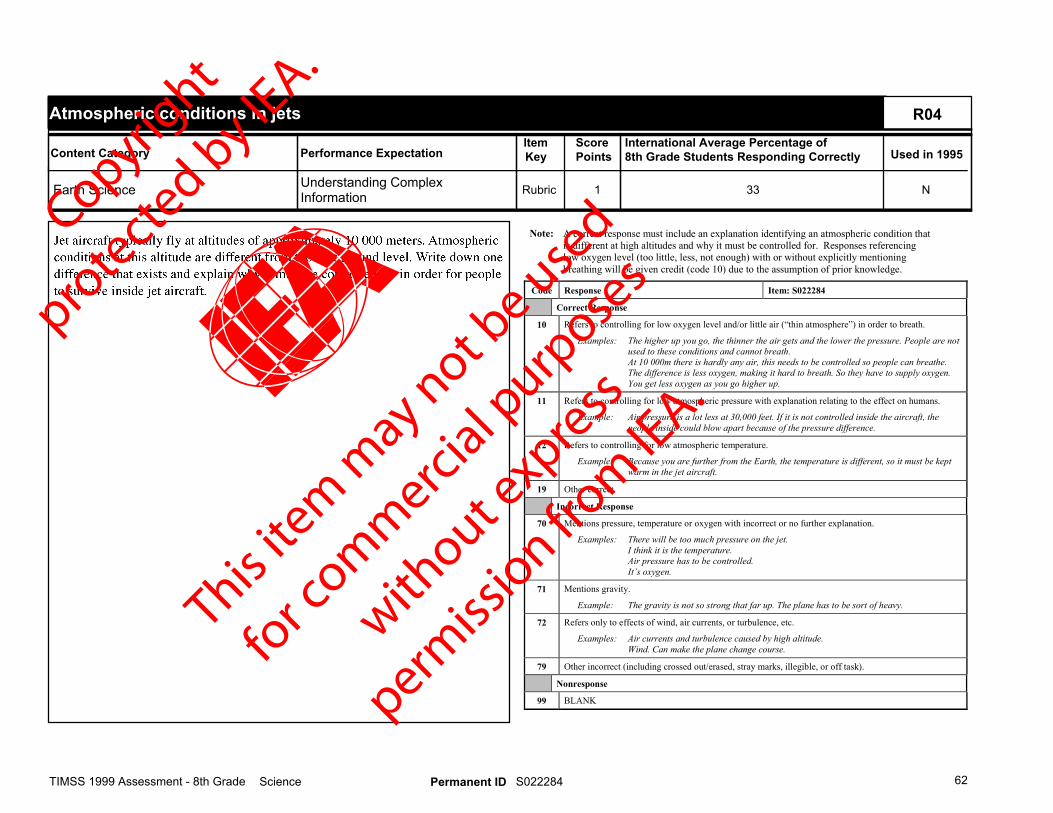
Note: A correct response must include an explanation identifying an atmospheric condition thatis different at high altitudes and why it must be controlled for. Responses referencinglow oxygen level (too little, less, not enough) with or without explicitly mentioningbreathing will be given credit (code 10) due to the assumption of prior knowledge.
Code Response Item: S022284
Correct Response
10 Refers to controlling for low oxygen level and/or little air (“thin atmosphere”) in order to breath.
Examples: The higher up you go, the thinner the air gets and the lower the pressure. People are notused to these conditions and cannot breath.At 10 000m there is hardly any air, this needs to be controlled so people can breathe.The difference is less oxygen, making it hard to breath. So they have to supply oxygen.You get less oxygen as you go higher up.
11 Refers to controlling for low atmospheric pressure with explanation relating to the effect on humans.
Example: Air pressure is a lot less at 30,000 feet. If it is not controlled inside the aircraft, thepeople inside could blow apart because of the pressure difference.
12 Refers to controlling for low atmospheric temperature.
Example: Because you are further from the Earth, the temperature is different, so it must be keptwarm in the jet aircraft.
19 Other correct.
Incorrect Response
70 Mentions pressure, temperature or oxygen with incorrect or no further explanation.
Examples: There will be too much pressure on the jet.I think it is the temperature.Air pressure has to be controlled.It’s oxygen.
71 Mentions gravity.
Example: The gravity is not so strong that far up. The plane has to be sort of heavy.
72 Refers only to effects of wind, air currents, or turbulence, etc.
Examples: Air currents and turbulence caused by high altitude.Wind. Can make the plane change course.
79 Other incorrect (including crossed out/erased, stray marks, illegible, or off task).
Nonresponse
99 BLANK
R04
Understanding ComplexInformation 1
Atmospheric conditions in jets
Rubric 33
Performance ExpectationItemKey
International Average Percentage of8th Grade Students Responding Correctly
N
Used in 1995ScorePointsContent Category
Earth Science
TIMSS 1999 Assessment - 8th Grade 62Science S022284Permanent ID
Copyright
prote
cted by IE
A.
This ite
m m
ay not be use
d
for c
omm
ercial p
urpose
s
without e
xpress
permiss
ion from
IEA.
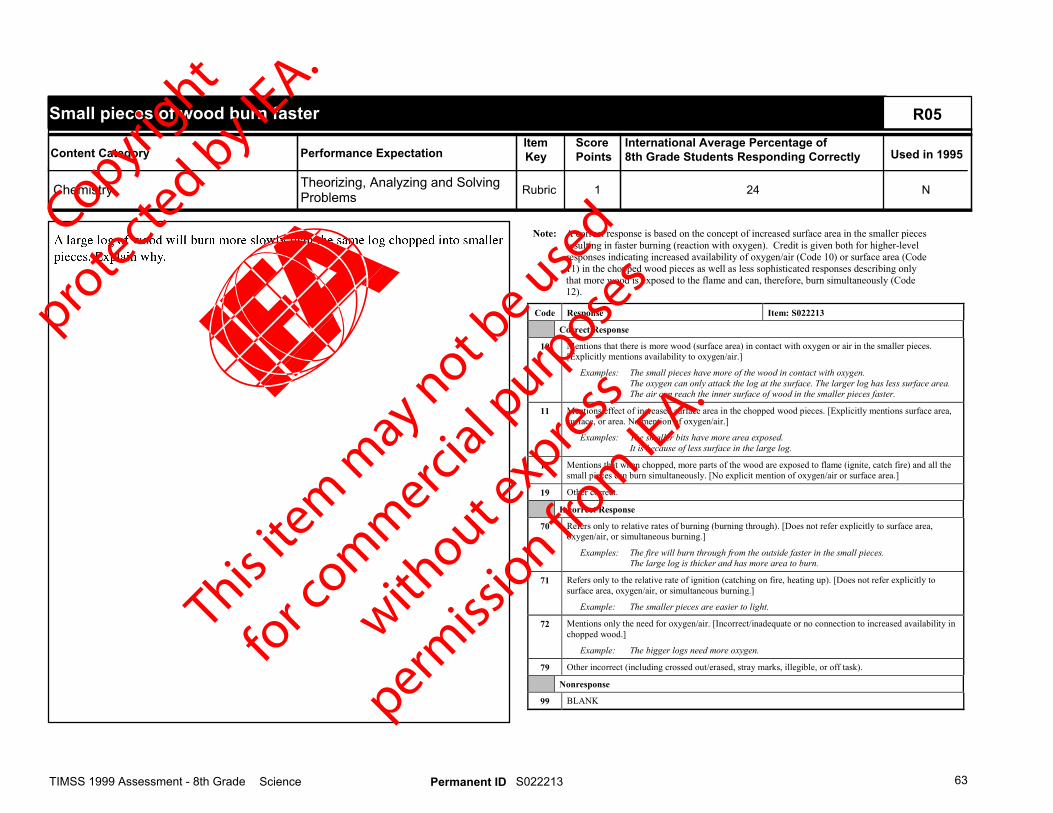
Note: A correct response is based on the concept of increased surface area in the smaller piecesresulting in faster burning (reaction with oxygen). Credit is given both for higher-levelresponses indicating increased availability of oxygen/air (Code 10) or surface area (Code11) in the chopped wood pieces as well as less sophisticated responses describing onlythat more wood is exposed to the flame and can, therefore, burn simultaneously (Code12).
Code Response Item: S022213
Correct Response
10 Mentions that there is more wood (surface area) in contact with oxygen or air in the smaller pieces.[Explicitly mentions availability to oxygen/air.]
Examples: The small pieces have more of the wood in contact with oxygen.The oxygen can only attack the log at the surface. The larger log has less surface area.The air can reach the inner surface of wood in the smaller pieces faster.
11 Mentions effect of increased surface area in the chopped wood pieces. [Explicitly mentions surface area,surface, or area. No mention of oxygen/air.]
Examples: The smaller bits have more area exposed.It is because of less surface in the large log.
12 Mentions that when chopped, more parts of the wood are exposed to flame (ignite, catch fire) and all thesmall pieces can burn simultaneously. [No explicit mention of oxygen/air or surface area.]
19 Other correct.
Incorrect Response
70 Refers only to relative rates of burning (burning through). [Does not refer explicitly to surface area,oxygen/air, or simultaneous burning.]
Examples: The fire will burn through from the outside faster in the small pieces.The large log is thicker and has more area to burn.
71 Refers only to the relative rate of ignition (catching on fire, heating up). [Does not refer explicitly tosurface area, oxygen/air, or simultaneous burning.]
Example: The smaller pieces are easier to light.
72 Mentions only the need for oxygen/air. [Incorrect/inadequate or no connection to increased availability inchopped wood.]
Example: The bigger logs need more oxygen.
79 Other incorrect (including crossed out/erased, stray marks, illegible, or off task).
Nonresponse
99 BLANK
R05
Theorizing, Analyzing and SolvingProblems 1
Small pieces of wood burn faster
Rubric 24
Performance ExpectationItemKey
International Average Percentage of8th Grade Students Responding Correctly
N
Used in 1995ScorePointsContent Category
Chemistry
TIMSS 1999 Assessment - 8th Grade 63Science S022213Permanent ID
Copyright
prote
cted by IE
A.
This ite
m m
ay not be use
d
for c
omm
ercial p
urpose
s
without e
xpress
permiss
ion from
IEA.

R06
Understanding Simple Information 1
Result of global warming
A 33
Performance ExpectationItemKey
International Average Percentage of8th Grade Students Responding Correctly
N
Used in 1995ScorePointsContent Category
Environmental and Resource Issues
TIMSS 1999 Assessment - 8th Grade 64Science S022254Permanent ID
Copyright
prote
cted by IE
A.
This ite
m m
ay not be use
d
for c
omm
ercial p
urpose
s
without e
xpress
permiss
ion from
IEA.
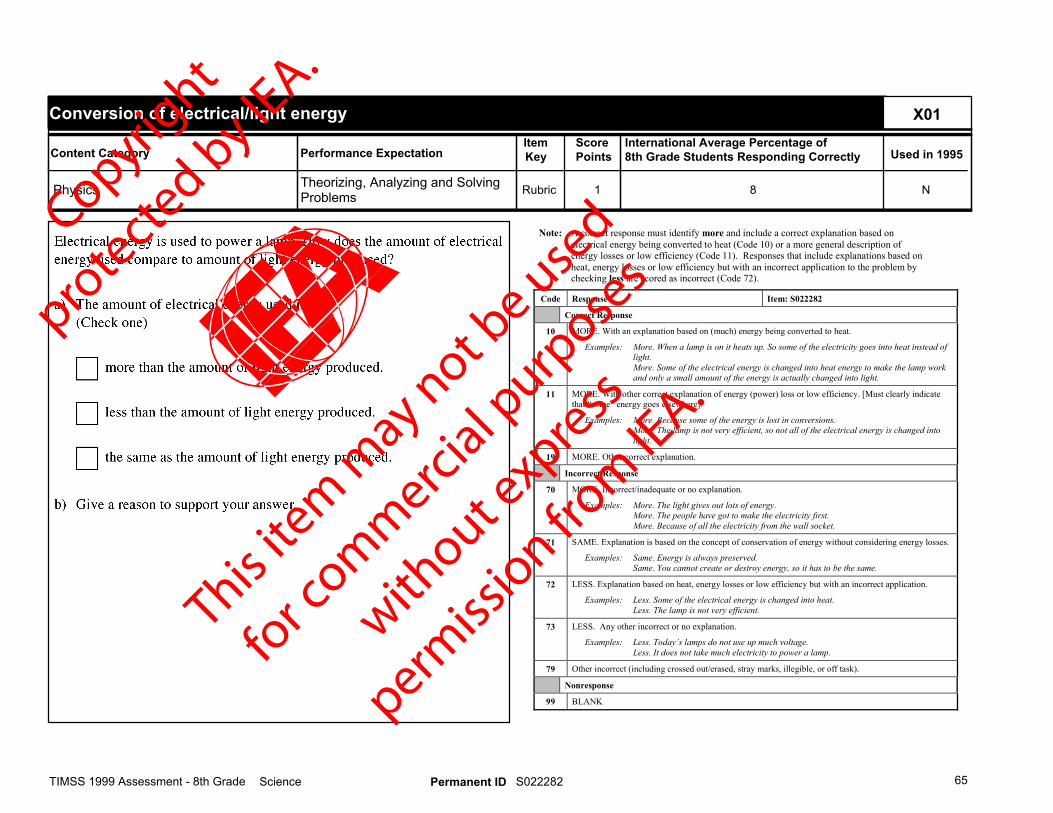
Note: A correct response must identify more and include a correct explanation based onelectrical energy being converted to heat (Code 10) or a more general description ofenergy losses or low efficiency (Code 11). Responses that include explanations based onheat, energy losses or low efficiency but with an incorrect application to the problem bychecking less are scored as incorrect (Code 72).
Code Response Item: S022282
Correct Response
10 MORE. With an explanation based on (much) energy being converted to heat.
Examples: More. When a lamp is on it heats up. So some of the electricity goes into heat instead oflight.More. Some of the electrical energy is changed into heat energy to make the lamp workand only a small amount of the energy is actually changed into light.
11 MORE. With other correct explanation of energy (power) loss or low efficiency. [Must clearly indicatethat “some” energy goes elsewhere].
Examples: More. Because some of the energy is lost in conversions.More. The lamp is not very efficient, so not all of the electrical energy is changed intolight.
19 MORE. Other correct explanation.
Incorrect Response
70 MORE. Incorrect/inadequate or no explanation.
Examples: More. The light gives out lots of energy.More. The people have got to make the electricity first.More. Because of all the electricity from the wall socket.
71 SAME. Explanation is based on the concept of conservation of energy without considering energy losses.
Examples: Same. Energy is always preserved.Same. You cannot create or destroy energy, so it has to be the same.
72 LESS. Explanation based on heat, energy losses or low efficiency but with an incorrect application.
Examples: Less. Some of the electrical energy is changed into heat.Less. The lamp is not very efficient.
73 LESS. Any other incorrect or no explanation.
Examples: Less. Today’s lamps do not use up much voltage.Less. It does not take much electricity to power a lamp.
79 Other incorrect (including crossed out/erased, stray marks, illegible, or off task).
Nonresponse
99 BLANK
X01
Theorizing, Analyzing and SolvingProblems 1
Conversion of electrical/light energy
Rubric 8
Performance ExpectationItemKey
International Average Percentage of8th Grade Students Responding Correctly
N
Used in 1995ScorePointsContent Category
Physics
TIMSS 1999 Assessment - 8th Grade 65Science S022282Permanent ID
Copyright
prote
cted by IE
A.
This ite
m m
ay not be use
d
for c
omm
ercial p
urpose
s
without e
xpress
permiss
ion from
IEA.

A: Codes for Trees
Note: If student response refers to oxygen/carbon dioxide cycle, use Code 10 even if otherreasons are given. If more than one reason is given, assign the code corresponding to thefirst correct reason, giving priority to Code 10.
Code Response Item: S022172a
Correct Response
10 Trees produce oxygen and/or use carbon dioxide.
Examples: Trees provide oxygen.Trees are important because the ecosystem needs the oxygen they give off.The trees take in carbon dioxide and give off oxygen which animals need.The trees help the rainforest by turning the carbon dioxide into oxygen.The trees recycle carbon dioxide which animals give out.
11 Trees provide food or energy.
Examples: Food energy for Earth.Trees provide fruit for the animals.Animals eat leaves on trees.Trees provide energy for the ecosystem.
12 Trees provide a place to hide/shelter.
Examples: Trees are important because they give a home for the animals.The trees provide a habitat (for animals).Trees are where the monkeys and birds live.
13 Trees provide shade or protection from the Sun.
Examples: Trees block sunlight to protect animals.It would get too hot in the forest without shade from trees.
19 Other correct.
Incorrect Response
70 Response too vague.
Examples: You need trees for the animals.They are part of the whole ecosystem.
79 Other incorrect (including crossed out/erased, stray marks, illegible, or off task).
Nonresponse
99 BLANK
X02A
Theorizing, Analyzing and SolvingProblems 1
Importance of trees/sun in rain forest
Rubric 72
Performance ExpectationItemKey
International Average Percentage of8th Grade Students Responding Correctly
N
Used in 1995ScorePointsContent Category
Life Science
TIMSS 1999 Assessment - 8th Grade 66Science S022172Permanent ID
Copyright
prote
cted by IE
A.
This ite
m m
ay not be use
d
for c
omm
ercial p
urpose
s
without e
xpress
permiss
ion from
IEA.
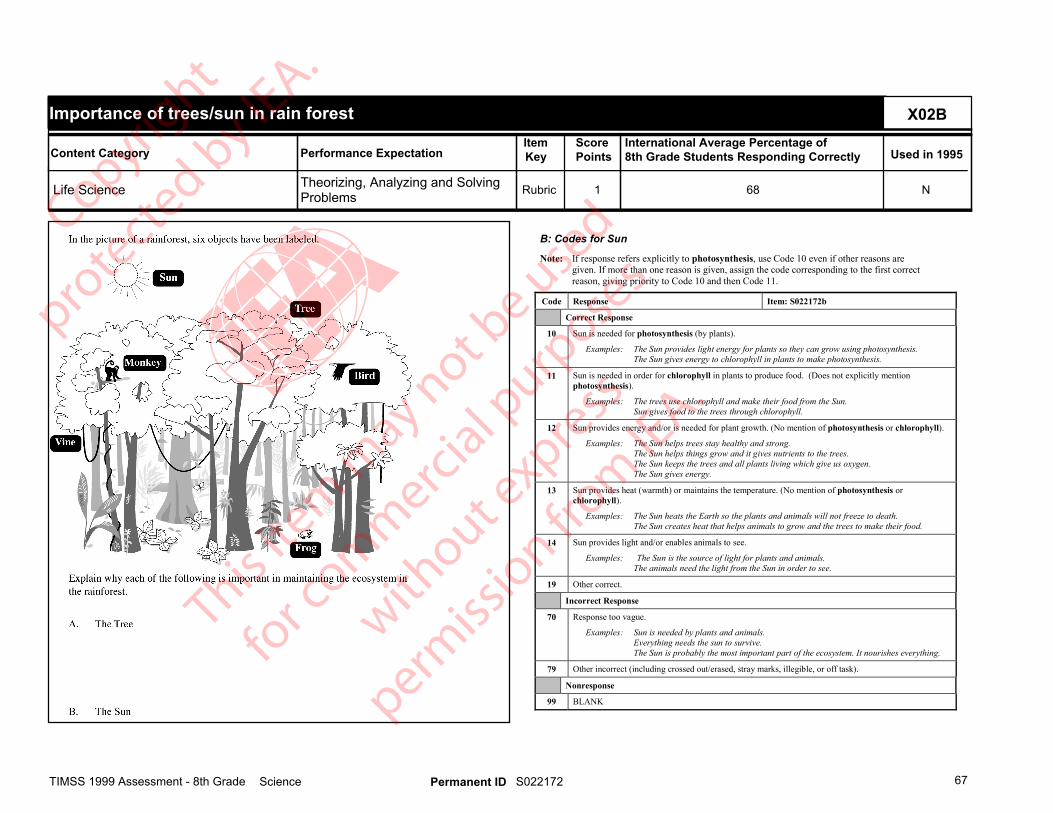
B: Codes for Sun
Note: If response refers explicitly to photosynthesis, use Code 10 even if other reasons aregiven. If more than one reason is given, assign the code corresponding to the first correctreason, giving priority to Code 10 and then Code 11.
Code Response Item: S022172b
Correct Response
10 Sun is needed for photosynthesis (by plants).
Examples: The Sun provides light energy for plants so they can grow using photosynthesis.The Sun gives energy to chlorophyll in plants to make photosynthesis.
11 Sun is needed in order for chlorophyll in plants to produce food. (Does not explicitly mentionphotosynthesis).
Examples: The trees use chlorophyll and make their food from the Sun.Sun gives food to the trees through chlorophyll.
12 Sun provides energy and/or is needed for plant growth. (No mention of photosynthesis or chlorophyll).
Examples: The Sun helps trees stay healthy and strong.The Sun helps things grow and it gives nutrients to the trees.The Sun keeps the trees and all plants living which give us oxygen.The Sun gives energy.
13 Sun provides heat (warmth) or maintains the temperature. (No mention of photosynthesis orchlorophyll).
Examples: The Sun heats the Earth so the plants and animals will not freeze to death.The Sun creates heat that helps animals to grow and the trees to make their food.
14 Sun provides light and/or enables animals to see.
Examples: The Sun is the source of light for plants and animals.The animals need the light from the Sun in order to see.
19 Other correct.
Incorrect Response
70 Response too vague.
Examples: Sun is needed by plants and animals.Everything needs the sun to survive.The Sun is probably the most important part of the ecosystem. It nourishes everything.
79 Other incorrect (including crossed out/erased, stray marks, illegible, or off task).
Nonresponse
99 BLANK
X02B
Theorizing, Analyzing and SolvingProblems 1
Importance of trees/sun in rain forest
Rubric 68
Performance ExpectationItemKey
International Average Percentage of8th Grade Students Responding Correctly
N
Used in 1995ScorePointsContent Category
Life Science
TIMSS 1999 Assessment - 8th Grade 67Science S022172Permanent ID
Copyright
prote
cted by IE
A.
This ite
m m
ay not be use
d
for c
omm
ercial p
urpose
s
without e
xpress
permiss
ion from
IEA.
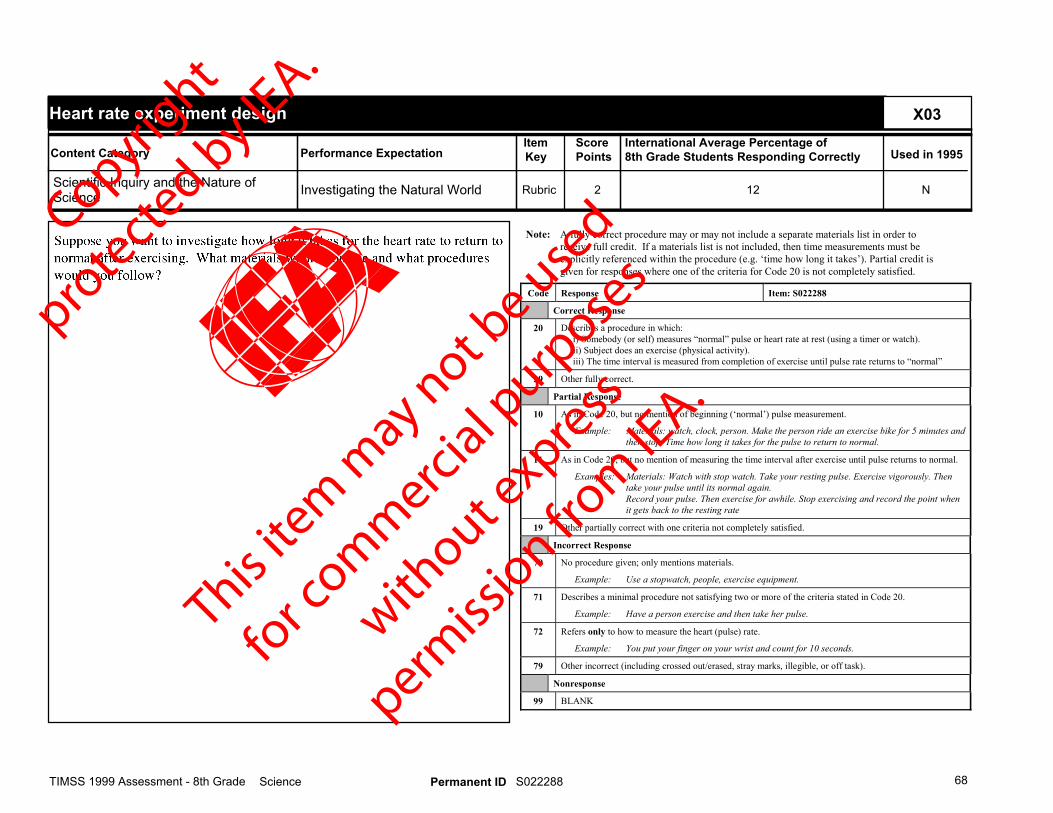
Note: A fully correct procedure may or may not include a separate materials list in order toreceive full credit. If a materials list is not included, then time measurements must beexplicitly referenced within the procedure (e.g. ‘time how long it takes’). Partial credit isgiven for responses where one of the criteria for Code 20 is not completely satisfied.
Code Response Item: S022288
Correct Response
20 Describes a procedure in which: i) Somebody (or self) measures “normal” pulse or heart rate at rest (using a timer or watch). ii) Subject does an exercise (physical activity). iii) The time interval is measured from completion of exercise until pulse rate returns to “normal”
29 Other fully correct.
Partial Response
10 As in Code 20, but no mention of beginning (‘normal’) pulse measurement.
Example: Materials: watch, clock, person. Make the person ride an exercise bike for 5 minutes andthen stop. Time how long it takes for the pulse to return to normal.
11 As in Code 20, but no mention of measuring the time interval after exercise until pulse returns to normal.
Examples: Materials: Watch with stop watch. Take your resting pulse. Exercise vigorously. Thentake your pulse until its normal again.Record your pulse. Then exercise for awhile. Stop exercising and record the point whenit gets back to the resting rate
19 Other partially correct with one criteria not completely satisfied.
Incorrect Response
70 No procedure given; only mentions materials.
Example: Use a stopwatch, people, exercise equipment.
71 Describes a minimal procedure not satisfying two or more of the criteria stated in Code 20.
Example: Have a person exercise and then take her pulse.
72 Refers only to how to measure the heart (pulse) rate.
Example: You put your finger on your wrist and count for 10 seconds.
79 Other incorrect (including crossed out/erased, stray marks, illegible, or off task).
Nonresponse
99 BLANK
X03
Investigating the Natural World 2
Heart rate experiment design
Rubric 12
Performance ExpectationItemKey
International Average Percentage of8th Grade Students Responding Correctly
N
Used in 1995ScorePointsContent Category
Scientific Inquiry and the Nature ofScience
TIMSS 1999 Assessment - 8th Grade 68Science S022288Permanent ID
Copyright
prote
cted by IE
A.
This ite
m m
ay not be use
d
for c
omm
ercial p
urpose
s
without e
xpress
permiss
ion from
IEA.
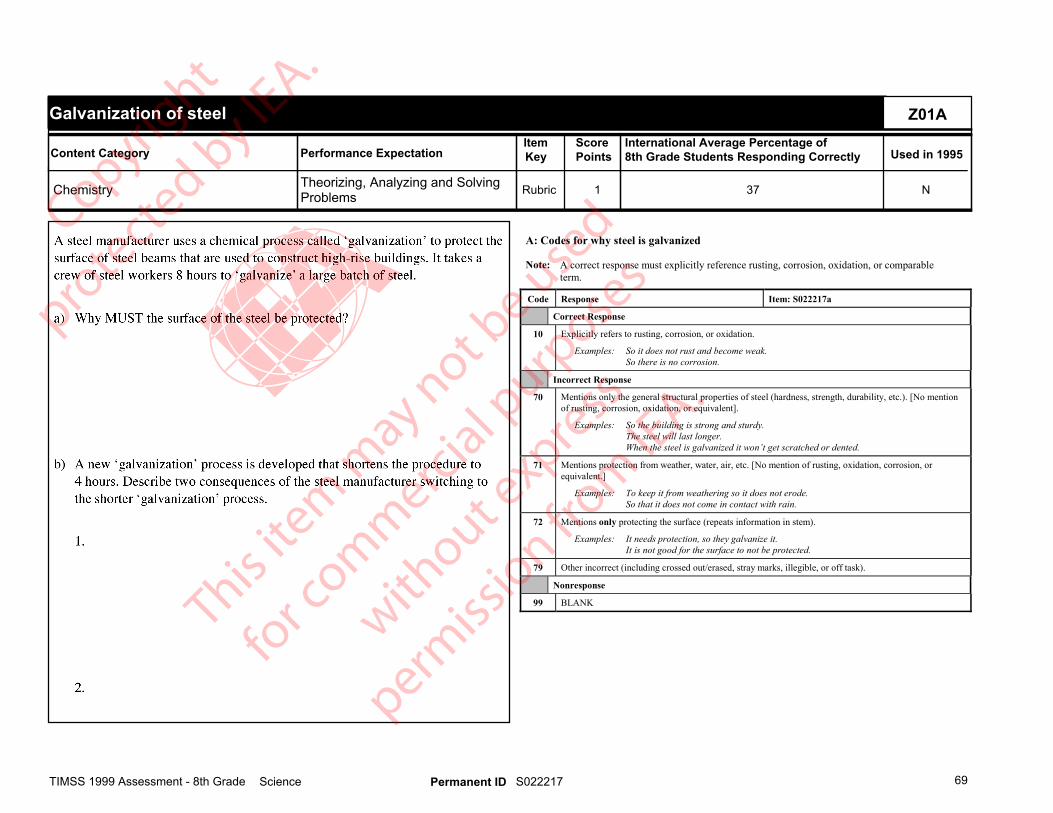
A: Codes for why steel is galvanized
Note: A correct response must explicitly reference rusting, corrosion, oxidation, or comparableterm.
Code Response Item: S022217a
Correct Response
10 Explicitly refers to rusting, corrosion, or oxidation.
Examples: So it does not rust and become weak.So there is no corrosion.
Incorrect Response
70 Mentions only the general structural properties of steel (hardness, strength, durability, etc.). [No mentionof rusting, corrosion, oxidation, or equivalent].
Examples: So the building is strong and sturdy.The steel will last longer.When the steel is galvanized it won’t get scratched or dented.
71 Mentions protection from weather, water, air, etc. [No mention of rusting, oxidation, corrosion, orequivalent.]
Examples: To keep it from weathering so it does not erode.So that it does not come in contact with rain.
72 Mentions only protecting the surface (repeats information in stem).
Examples: It needs protection, so they galvanize it.It is not good for the surface to not be protected.
79 Other incorrect (including crossed out/erased, stray marks, illegible, or off task).
Nonresponse
99 BLANK
Z01A
Theorizing, Analyzing and SolvingProblems 1
Galvanization of steel
Rubric 37
Performance ExpectationItemKey
International Average Percentage of8th Grade Students Responding Correctly
N
Used in 1995ScorePointsContent Category
Chemistry
TIMSS 1999 Assessment - 8th Grade 69Science S022217Permanent ID
Copyright
prote
cted by IE
A.
This ite
m m
ay not be use
d
for c
omm
ercial p
urpose
s
without e
xpress
permiss
ion from
IEA.
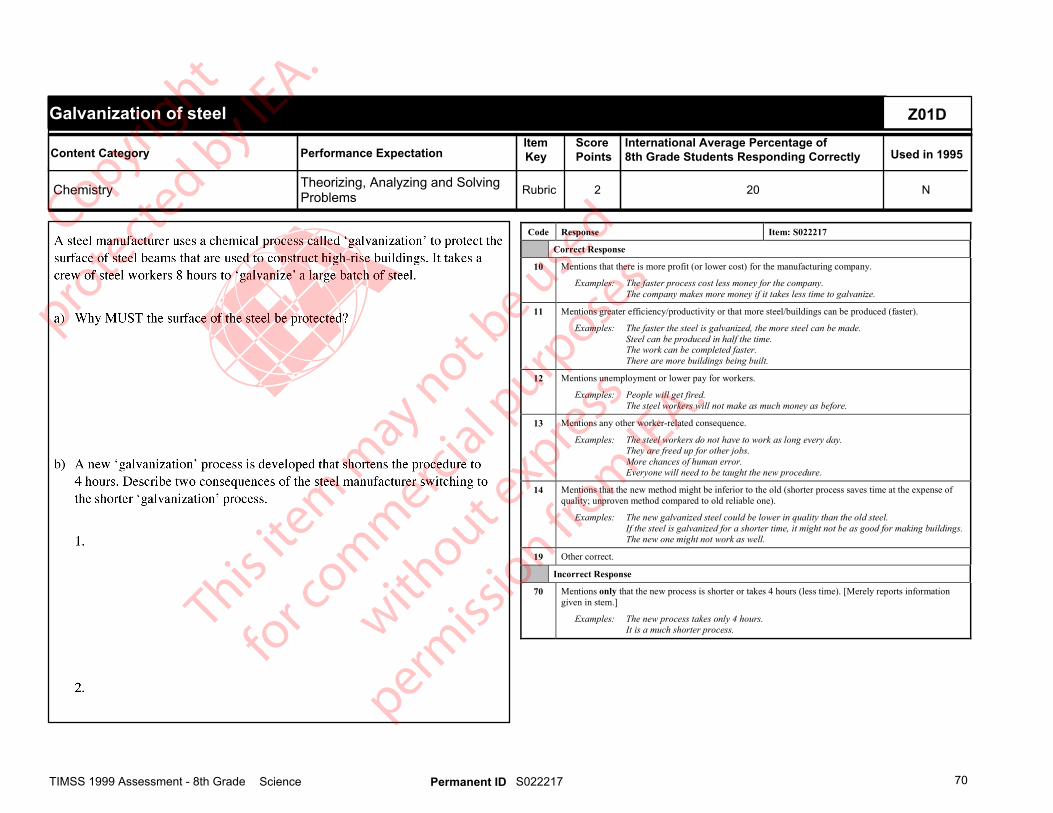
Code Response Item: S022217
Correct Response
10 Mentions that there is more profit (or lower cost) for the manufacturing company.
Examples: The faster process cost less money for the company.The company makes more money if it takes less time to galvanize.
11 Mentions greater efficiency/productivity or that more steel/buildings can be produced (faster).
Examples: The faster the steel is galvanized, the more steel can be made.Steel can be produced in half the time.The work can be completed faster.There are more buildings being built.
12 Mentions unemployment or lower pay for workers.
Examples: People will get fired.The steel workers will not make as much money as before.
13 Mentions any other worker-related consequence.
Examples: The steel workers do not have to work as long every day.They are freed up for other jobs.More chances of human error.Everyone will need to be taught the new procedure.
14 Mentions that the new method might be inferior to the old (shorter process saves time at the expense ofquality; unproven method compared to old reliable one).
Examples: The new galvanized steel could be lower in quality than the old steel.If the steel is galvanized for a shorter time, it might not be as good for making buildings.The new one might not work as well.
19 Other correct.
Incorrect Response
70 Mentions only that the new process is shorter or takes 4 hours (less time). [Merely reports informationgiven in stem.]
Examples: The new process takes only 4 hours.It is a much shorter process.
Z01D
Theorizing, Analyzing and SolvingProblems 2
Galvanization of steel
Rubric 20
Performance ExpectationItemKey
International Average Percentage of8th Grade Students Responding Correctly
N
Used in 1995ScorePointsContent Category
Chemistry
TIMSS 1999 Assessment - 8th Grade 70Science S022217Permanent ID
Copyright
prote
cted by IE
A.
This ite
m m
ay not be use
d
for c
omm
ercial p
urpose
s
without e
xpress
permiss
ion from
IEA.
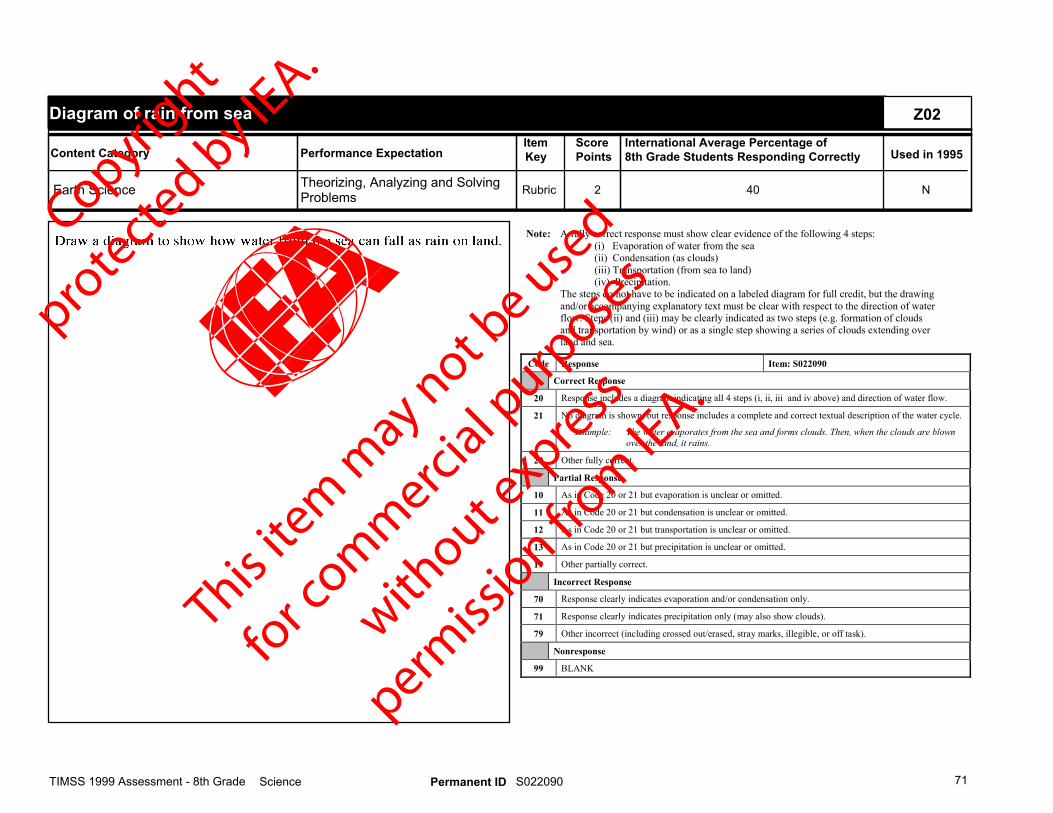
Note: A fully correct response must show clear evidence of the following 4 steps:(i) Evaporation of water from the sea(ii) Condensation (as clouds)(iii) Transportation (from sea to land)(iv) Precipitation.
The steps do not have to be indicated on a labeled diagram for full credit, but the drawingand/or accompanying explanatory text must be clear with respect to the direction of waterflow. Steps (ii) and (iii) may be clearly indicated as two steps (e.g. formation of cloudsand transportation by wind) or as a single step showing a series of clouds extending overland and sea.
Code Response Item: S022090
Correct Response
20 Response includes a diagram indicating all 4 steps (i, ii, iii and iv above) and direction of water flow.
21 No diagram is shown, but response includes a complete and correct textual description of the water cycle.
Example: The water evaporates from the sea and forms clouds. Then, when the clouds are blownover the land, it rains.
29 Other fully correct.
Partial Response
10 As in Code 20 or 21 but evaporation is unclear or omitted.
11 As in Code 20 or 21 but condensation is unclear or omitted.
12 As in Code 20 or 21 but transportation is unclear or omitted.
13 As in Code 20 or 21 but precipitation is unclear or omitted.
19 Other partially correct.
Incorrect Response
70 Response clearly indicates evaporation and/or condensation only.
71 Response clearly indicates precipitation only (may also show clouds).
79 Other incorrect (including crossed out/erased, stray marks, illegible, or off task).
Nonresponse
99 BLANK
Z02
Theorizing, Analyzing and SolvingProblems 2
Diagram of rain from sea
Rubric 40
Performance ExpectationItemKey
International Average Percentage of8th Grade Students Responding Correctly
N
Used in 1995ScorePointsContent Category
Earth Science
TIMSS 1999 Assessment - 8th Grade 71Science S022090Permanent ID
Copyright
prote
cted by IE
A.
This ite
m m
ay not be use
d
for c
omm
ercial p
urpose
s
without e
xpress
permiss
ion from
IEA.

Note: A correct response is based on an increase in gas volume (or internal gas pressure) as aresult of increased temperature. Credit is given for both higher-level responses relatingto the increased kinetic energy of helium atoms as a function of temperature (Code 10) aswell as more general responses relating to increased internal gas pressure and/or gasvolume (Code 11). An increase in temperature does not have to be explicitly mentionedin order to receive credit. Responses referring ONLY to the balloon expanding or to theeffect of temperature on the balloon without further explanation of the gas behavior arescored as incorrect.
Code Response Item: S022048
Correct Response
10 Mentions explicitly that (as the gas in the balloon heats up), the helium (gas) atoms (particles, molecules)move faster (collide more frequently) causing the pressure inside the balloon to increase and/or thevolume to increase (expand).
Examples: As helium is heated the particles move around faster and make the balloon expand.The gas molecules bounce around a lot more when heated, so the volume increases.
11 Mentions that the pressure of the gas inside the balloon increases and/or the volume of the gas increases(expands). (No mention of gas atoms/molecules).
Examples: The balloon expands because of the pressure building up inside.When the heat is added, the gas expands and the balloon stretches.As the temperature goes up, the pressure in the balloon becomes greater than theatmospheric pressure.The volume of gas goes up as the temperature goes up.
19 Other correct.
Incorrect Response
70 Mentions only that the sun heats the helium (gas) and/or causes the balloon to expand. [No reference tothe pressure/volume changes in the gas.]
Examples: The heat caused the balloon to expand.The sun heats up the helium and the rubber expands.
71 Mentions pressure and/or volume with inadequate explanation.
Examples: It is because of the great pressure.The volume changes.
72 Mentions only the effect of heat (from Sun) on the balloon material (rubber, latex).
Examples: The heat makes the rubber weaker.The rubber is melted by the sun.
73 Refers to (individual) atoms or molecules expanding (or growing).
Examples: The helium particles grow when they heat up.Because the gas atoms expanded.
79 Other incorrect (including crossed out/erased, stray marks, illegible, or off task).
Nonresponse
99 BLANK
Z03
Theorizing, Analyzing and SolvingProblems 1
Heat expansion of balloons
Rubric 26
Performance ExpectationItemKey
International Average Percentage of8th Grade Students Responding Correctly
N
Used in 1995ScorePointsContent Category
Physics
TIMSS 1999 Assessment - 8th Grade 72Science S022048Permanent ID
Copyright
prote
cted by IE
A.
This ite
m m
ay not be use
d
for c
omm
ercial p
urpose
s
without e
xpress
permiss
ion from
IEA.

TIMSS and PIRLS are copyrighted and are registered trademarks of IEA. Released items from TIMSS and PIRLS assessments are for non-commercial, educational, and research purposes only. Translated versions of items remain the intellectual property of IEA. Although the items are in the public domain, please print an acknowledgement of the source, including the year and name of the assessment you are using.

SReleased Set for Eighth Grade
R E P E A T1999
TIMSS••
TIMSS 1999 SCIENCE ITEMS
scienceitems