Embed Size (px)
Citation preview

An International Journal ofMINERALOGY, CRYSTALLOGRAPHY, GEOCHEMISTRY,ORE DEPOSITS, PETROLOGY, VOLCANOLOGYand applied topics on Environment, Archeometry and Cultural Heritage
DOI: 10.2451/2013PM0028Periodico di Mineralogia (2013), 82, 3, 477-487
PERIODICO di MINERALOGIAestablished in 1930
Scientific analyses beyond the excavation: studies for a non invasivepreliminary approach
Letizia Bonizzoni1,*, Valentina Brunello1 and Simone Caglio2
1 Dipartimento di Fisica, Università degli Studi di Milano, Via Celoria 16, Milano, Italy2 Freelance researcher, Via Matteotti 28, Carate Brianza (MB), Italy
*Corresponding author: [email protected]
Abstract
Domo is an archaeological site located in the Foreste Casentinesi National Park, near thetown of Bibbiena, in the province of Arezzo (Tuscany). Since the ’80, investigations at Domohave revealed a Roman domus with a Roman baths complex. Unfortunately, the richstratigraphy was almost completely lost during the first excavations. Since 2008 thearchaeological site was reopened by Archeodomani s.a.s., a company that deals withpromotion of cultural heritage, and it is still under summer excavation campaigns. In the futureperspective to try and solve doubts about the site phase sequence of the Roman baths complex,not easy to understand now for several use modifications of the different areas, we developedan analytical method that could allow a large scale investigation limiting the sampling. In thispaper, the preliminary results obtained for mortar are presented, both from the walls and fromthe binding of cocciopesto of the floor, with XRD (X Ray Diffraction) and ED-XRF (EnergyDispersive X-Ray Fluorescence) analysis on ground samples. XRD analysis was performedat ICVBC-CNR (Milan) and the diffraction data (Cu-Ka, 1.5418 Å) were collected on a J-JPanalytical X’Pert PRO diffractometer. Grounded samples were placed in aluminium sampleholder or dusted on frosted glass sample holder, depending on sample amount. XRFmeasurements were performed at Physics Department of Milan University using a portableEDXRF spectrometer (Assing Lithos 3000) exploiting polychromatic radiation from a Moanode X-ray tube. Both analyses were performed after preliminary observation of the samplesby stereo-microscope and the results obtained through XRF and XRD analyses were comparedto get more complete information about samples. Data were also submitted to multivariateanalysis (Hierarchical Clustering) to get material classification. The comparison between theclassification obtained and archaeological interpretation is still in progress; the collection ofanalytical data will go on in future excavation campaigns. The complete overview will be partof a project to promote the archaeological site through an online portal.
Key words: Mortar; XRD; ED-XRF; archaeology; multivariate analysis; in situ analysis.
bonizzoni _periodico 21/01/14 15:56 Pagina 477

478 L. Bonizzoni et al.Periodico di Mineralogia (2013), 82, 3, 477-487
Introduction
Mortars are materials resulting of thecombination of sand grains, a binder (for instance:lime, cement...) and water. Their characteristicsdepend on the nature of the binder component. Inthe same way, historic mortars are made ofcombinations at different proportions ofaggregates, binder and eventually some additives,too; with the consolidation of the Romancivilization, the use of lime mortars wasgeneralized and extended (Adam, 1989). Theaggregates are siliceous and carbonate from riversor crushed rock. Thus, the production of mortarsdepended on the availability of raw materials andhence the mineralogical composition is especiallyrelevant to establish direct correlation betweenprovenance and use. Moreover, the use of specificmaterials reflects the technological capabilitiesand developments of the society. Many analyticaltechniques are generally employed, each withparticular strengths and limitations; it is evidentthat combining together more of them, betterresults are achieved. Excluding photography andvisual inspections, sampling is always requiredfor mortar analyses, such as microscopy and thinsection observation, scanning electronmicroscope, gas chromatography, thermalanalysis and some others. Among these, XRDanalysis plays a fundamental role, sometimes inassociation with elemental chemicalcharacterization, for its ability to recognizemineralogical phases leaving samples undamagedfor further investigations. Along with XRD andseveral other analytical techniques, ED-XRFanalysis is often applied to get provenanceclassification of ceramics (Tite, 2008) on thebases of minor and trace elements. Moreover, thenew generation of portable spectrometers allowsa rapid and easy scan of large areas even if energyis not provided in situ.
In this work, ED-XRF measurements wereperformed to obtain the elemental compositionof the mortars and to attempt a classification of
the samples through HCA (hierarchical clustersanalysis), comparing results with XRD basedclassification, more widely used. This wouldallow, for the future, to perform large scalesinvestigations with portable XRF spectrometers,recognizing different typology of materials.Then, on the bases of the obtained results,sampling could be done according to recognizedgroups to deeper investigate the materialmorphology and mineralogical composition.
The archaeological site of Domo, in theForeste Casentinesi National Park, near the townof Bibbiena, in the province of Arezzo(Tuscany), come up to be suitable for testing thismethodology (Aranguren, 1999). In fact, its richstratigraphy was almost completely lost duringthe first excavations in the 80’s and the final aimof the research is to try and solve doubts aboutthe site phase sequence of the Roman bathscomplex, not easy to understand now for severaluse modifications of the different areas. Herepreliminary studies are presented, about thepossibilities to discriminate mortars species - butnot only - in situ with portable instrument so asto be able to perform a limited number oftargeted samples.
Methodological approach
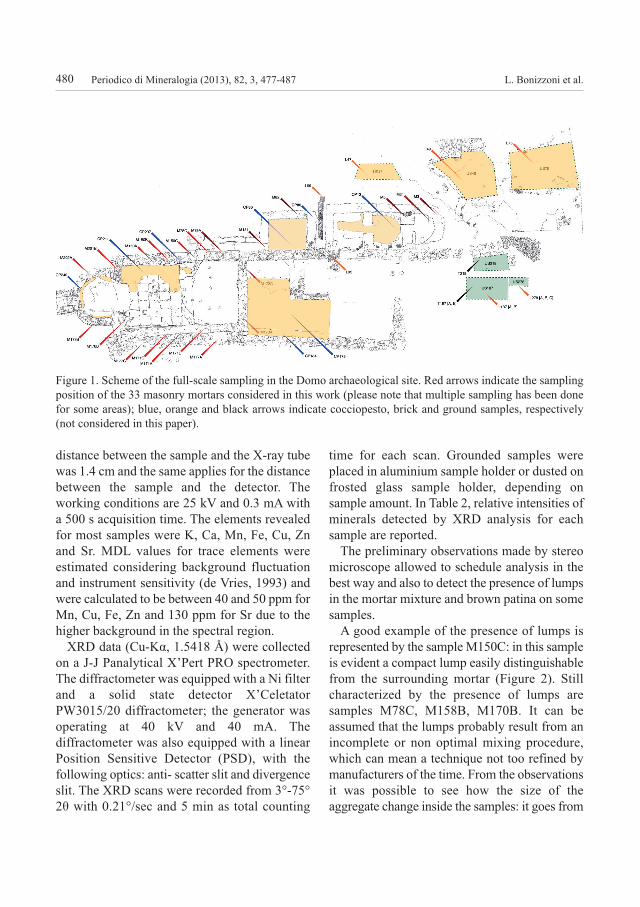
In this paper, the preliminary results on a setof 33 samples of masonry mortars, collected inthe site of Domo, are presented and discussed.Several Stratigraphic Units (SU) and differentrooms of the domus were concerned,contemplating areas supposed of differentbuilding periods. In Table 1, all the samples arereported, together with a brief description. InFigure 1 the scheme of the samplings is shown.
Non-destructive ED-XRF analysis has beenperformed on ground samples with a portablespectrometer (Assing Lithos 3000) equippedwith a low power X-ray tube with Mo anode anda Peltier cooled Si-PIN detector. The irradiatedarea on the sample was about 3.7 mm2; the
bonizzoni _periodico 21/01/14 15:56 Pagina 478

479Scientific analyses beyond the excavation: ...Periodico di Mineralogia (2013), 82, 3, 477-487
Table 1. List and description of samples considered in this work.
SAMPLE LOCATION AND DESCRIPTION
M82 Bed mortar collected from SU 82, wall NNE-SSW (Small Bath)
M151 Bed mortar from SU 151, wall NNE-SSW (Small Bath)
M21 Mortar from the cocciopesto’s floor from SU 21 (Small Bath)
M5 Bed mortar from SU 5. Collected from the wall of the SU 5 (Small Bath)
M3 Bed mortar from SU 3. Collected from the wall of the SU 3 (Small Bath)
M177C_b Bed mortar from SU 177, external wall, side W (Big Bath Tepidarium)
M177C_g Bed mortar from SU 177, external wall, side W (Big Bath Tepidarium)
M177A_g Bed mortar from SU 177, external wall, side W (Big Bath Tepidarium)
M177A_b Bed mortar from SU 177, external wall, side W (Big Bath Tepidarium)
M150C_g Bed mortar from SU 150, Hypocaustum (Big Bath)
M150C_b Malta (grumo) from SU 150, Hypocaustum (Big Bath Tepidarium)
M150A Bed mortar from SU 150, Hypocaustum (Big Bath)
M150B_g Bed mortar from SU 150, Hypocaustum (Big Bath)
M150B_b Malta (lump) from SU 150, Hypocaustum (Big Bath)
M178B Bed mortar from SU 178, external wall, side E (Big Bath)
M173A_b Bed mortar (lump) from SU 173, wall WWN-ESE (Big Bath)
M173A_g Bed mortar from SU 173, wall WWN-ESE (Big Bath)
M173C_g Bed mortar from SU 173, wall WWN-ESE (Big Bath)
M173C_b Bed mortar (lump) from SU 173, wall WWN-ESE (Big Bath)
M170B_g Bed mortar from SU 170 (Big Bath)
M170B_b Mortar (lump) from SU (Big Bath)
M202A Bed mortar from SU 202, corresponding to a wall, side W (Big Bath)
M201B Bed mortar from SU 201, external wall, WNW-ESE (Big Bath)
M171C Bed mortar from SU 171, wall NNE-SSW (Big Bath)
M171E Bed mortar from SU 171 wall NNE-SSW (Big Bath)
M171A_g Bed mortar from SU 171 wall NNE-SSW (Big Bath)
M171A_b Bed mortar from SU wall NNE-SSW (Big Bath)
M78C_g Bed mortar from SU 78, external wall (Big Bath)
M78C_b Bed mortar (lump) from SU 78, external wall (Big Bath)
M78C_b2 Bed mortar (lump) from SU 78, external wall (Big Bath)
M78A Bed mortar from SU 78, external wall (Big Bath)
M78A_2n Bed mortar from SU 78, external wall (Big Bath)
M78A_b Bed mortar from SU 78, external wall (Big Bath)
bonizzoni _periodico 21/01/14 15:56 Pagina 479
distance between the sample and the X-ray tubewas 1.4 cm and the same applies for the distancebetween the sample and the detector. Theworking conditions are 25 kV and 0.3 mA witha 500 s acquisition time. The elements revealedfor most samples were K, Ca, Mn, Fe, Cu, Znand Sr. MDL values for trace elements wereestimated considering background fluctuationand instrument sensitivity (de Vries, 1993) andwere calculated to be between 40 and 50 ppm forMn, Cu, Fe, Zn and 130 ppm for Sr due to thehigher background in the spectral region.
XRD data (Cu-Kα, 1.5418 Å) were collectedon a J-J Panalytical X’Pert PRO spectrometer.The diffractometer was equipped with a Ni filterand a solid state detector X’CeletatorPW3015/20 diffractometer; the generator wasoperating at 40 kV and 40 mA. Thediffractometer was also equipped with a linearPosition Sensitive Detector (PSD), with thefollowing optics: anti- scatter slit and divergenceslit. The XRD scans were recorded from 3°-75°2θ with 0.21°/sec and 5 min as total counting
time for each scan. Grounded samples wereplaced in aluminium sample holder or dusted onfrosted glass sample holder, depending onsample amount. In Table 2, relative intensities ofminerals detected by XRD analysis for eachsample are reported.
The preliminary observations made by stereomicroscope allowed to schedule analysis in thebest way and also to detect the presence of lumpsin the mortar mixture and brown patina on somesamples.
A good example of the presence of lumps isrepresented by the sample M150C: in this sampleis evident a compact lump easily distinguishablefrom the surrounding mortar (Figure 2). Stillcharacterized by the presence of lumps aresamples M78C, M158B, M170B. It can beassumed that the lumps probably result from anincomplete or non optimal mixing procedure,which can mean a technique not too refined bymanufacturers of the time. From the observationsit was possible to see how the size of theaggregate change inside the samples: it goes from
480 L. Bonizzoni et al.Periodico di Mineralogia (2013), 82, 3, 477-487
Figure 1. Scheme of the full-scale sampling in the Domo archaeological site. Red arrows indicate the samplingposition of the 33 masonry mortars considered in this work (please note that multiple sampling has been donefor some areas); blue, orange and black arrows indicate cocciopesto, brick and ground samples, respectively(not considered in this paper).
bonizzoni _periodico 21/01/14 15:56 Pagina 480

481Scientific analyses beyond the excavation: ...Periodico di Mineralogia (2013), 82, 3, 477-487
Table 2. List of samples with relative intensities of minerals detected by XRD analysis. Different colours referto different groups in HC analyses obtained by these data.
Samples
Qua
rtz
Cal
cite
Fe a
nd M
gca
rbon
ate
Ara
goni
te
Clin
ochl
ore
Mus
covi
te
Orth
ocla
se
Plag
iocl
ase
M3 100 34 5 8 6 24
M5 100 36 6 10 5 18
M21 73 100 2 6 2 17
M78A 100 32 5 7 3 33
M78A_2n 100 29 3 12 7 18
M78A_b 100 32 5 7 3 33
M78C_b 2 100 3
M78C_b2 8 100 2
M78C_g 100 30 5 8 5 13
M82 100 64 5 10 5 22
M150A 100 17 4 7 4 25
M150B_b 30 100 1 3 2 6
M150B_g 100 42 10 25 7 27
M150C_b 3 100
M150C_g 100 25 6 10 9 21
M151 100 63 6 12 7 14
M170B_b 7 100
M170B_g 100 28 4 6 5 30
M171A_b 37 100 25
M171A_g 100 30 3 4 4 22
M171C 100 16 4 6 6 19
M171E 100 54 3 6 7 23
M173A_b 3 100 7
M173A_g 100 45 7 14 11 30
M173C_b 14 100 1 3 1 5
M173C_g 100 23 4 5 4 20
M177A_b 40 100 1
M177A_g 100 83 2 4 3 15
M177C_b 4 100
M177C_g 100 24 8 17 5 19
M178B 100 26 6 11 5 17
M201B 100 32 5 7 6 19
M202A 100 22 6 13 4 27
bonizzoni _periodico 21/01/14 15:56 Pagina 481

dimensions of a few millimetres as in the sampleM150B, M171E and M201B (Figure 3), up toexceed largely the 5 mm as in M78C (Figure 4).
In addition it was possible to identify thepresence of some brown-black areas on a fewsamples, namely M170B, M173C and M78A(Figure 5). X-ray fluorescence analysis resultsallow to identify them as patinas, probably ofalteration, of iron and manganese.
As already said, the target of this work is toobtain a correct and rapid classification of thesamples in order to get a sensible but limited
sampling. So, using polychromatic radiation onlight samples, the authors preferred not toperform quantitative analysis, but to work on thespectrum shape comparison. The entire ED-XRFspectra were submitted to multivariate analysis(Hierarchical Clustering) to get materialclassification thus basically comparing theirshape and directly applying multivariate analysison the acquired XRF spectra (Freitas, 2010;Calza, 2007). Three spectra - 4056 channels -were acquired for each sample and then averagedto lower background. Then, before undergoing
482 L. Bonizzoni et al.Periodico di Mineralogia (2013), 82, 3, 477-487
Figure 2. Stereo microscope shot of sample M150C:a compact lump, easily distinguishable from thesurrounding mortar, is evident.
Figure 3. Stereo microscope shot of sample M150B:the size of the aggregate is few millimetres.
Figure 4. Stereo microscope shot of sample M78C: thesize of the aggregate largely exceed 5 mm.
Figure 5. Stereo microscope shot of sample M170B: itis possible to see a brown-black area identified as apatina (iron and manganese detected by XRF analysis).
bonizzoni _periodico 21/01/14 15:56 Pagina 482
483Scientific analyses beyond the excavation: ...Periodico di Mineralogia (2013), 82, 3, 477-487
to HC, they have been smoothed (average on 2nearest neighbors), normalised to coherentscattering peak and cut between 3 and 20 KeV(i.e. between K Kα and Mo Kα peaks). Then, asXRF peaks highly differ in intensity, logarithmicscale was used to make them comparable(Todeschini, 1998; Bonizzoni, 2013). Final plotswere obtained by XLStat software on elaboratedspectra.
XRD diffractograms were submitted tomultivariate analysis in two different ways. Thefirst try was to perform multivariate analysis ofsemi-quantitative proportional data (Table 2), butXRD diffractrograms are more complex thanXRF spectra, so hierarchical analysis create fakegroups, probably because of the inability toassess correctly the peaks with low intensity.Then to try to solve this problem and to ensureconsistency with the XRF analysis, the samestatistic treatment on entire diffractrograms wasapplied. The colour in Table 2 are referred to thegrouping obtained (see below) by HierachicalClustering analysis; the number in the namesrefers instead to the Stratigraphic Unit. As forXRF analysis, XRD diffractograms weresubmitted to Hierarchical Clustering analysisusing a logarithmic scale to prevent too highdifferences in peak intensity between primaryand secondary compounds.
In both cases dendrograms were createdexploiting Euclidean distance and Ward’slinkage method that minimize the Sum ofSquares of any two (hypothetical) clusters thatcan be formed at each step (Zhu, 2004).
Data analysis and results
Dendrogram obtained from the 33 acquiredXRD diffractograms and XRF spectra on groundsamples are shown in Figures 6 and 8, respectively.
Considering XRD diffractogram results, themain difference between the two biggest groups(named AD and BD) is the intensity of the peaksof quartz and calcite. The first two clusters
(highlighted in blue and named AD1 and AD2respectively) group samples that show moreintense peaks of quartz compared to the ones ofcalcite. All these spectra show in addition thepresence of chlorite, muscovite, plagioclase andorthoclase: all these minerals, together withquartz, are typical of sand, which is added tolime to produce mortar. The samples in the firstgroup (AD1 group) show instead low peaks ofcalcite and intense peaks of orthoclase, as wellas the presence of the other secondary minerals.On the opposite, the second group (AD2 group)is characterised by very low peaks of calcite andintense peaks of chlorite and muscovite, besidethe presence of minor minerals. On the otherhand, the big red group (indicated as BD) showsmore intense peaks of calcite, whereas the onesof quartz are lower, and a very low, or evenabsence, presence of secondary minerals.
Figure 7 shows the comparison between XRDspectra from two samples (namely M150C_band M150A), pertaining to the two clusterdescribed above. The two smaller sub-clusters(highlighted in yellow and orange, respectively)are exclusively due to the difference in thesignal/noise ratio of the spectra acquired.
The dendrogram obtained from XRF spectraanalysis shows clearly two groups: samplespertaining to the first group, the blue one (namedAF), and to the second group, the red one (BF),are the same of corresponding groups for XRDresults. Both groups are characterised mainly bythe presence of Ca and Fe, as well as othersecondary elements; the clustering derivesmainly from different relative concentration ofthese two elements: the blue group are richer inFe than in Ca, instead the red one has peaks ofCa more intense than the ones of Fe.
This corresponding is highly encouragingbecause it allows to discriminate between thetwo main type of mortar present in this site witha rapid and in situ non destructive XRFmeasuring campaign. In Figure 9 a comparisonbetween XRF spectra from sample M150C_b
bonizzoni _periodico 21/01/14 15:56 Pagina 483

484 L. Bonizzoni et al.Periodico di Mineralogia (2013), 82, 3, 477-487
Figure 6. Dendogram from XRD diffractogram analysis. For clusters description see in the text.
Figure 7. Comparison between XRD diffractograms of sample M150A and M150C_b. Diffractogram coloursare referred to belonging cluster. Only principal peaks are specified (Ca = Calcite, Cl = Chlorite, Q = Quartz,M = Muscovite, P/O = Plagioclase or Orthoclase).
bonizzoni _periodico 21/01/14 15:56 Pagina 484

Scientific analyses beyond the excavation: ... 485
(red group) and M150A (blue group) is reportedas an example.
From the data reported in Table 2, it is clearthan none of the secondary mineral revealedcontains iron, well detected in the XRF spectra,as evident in the spectra reported in Figure 9. Asgeneral remark, we must remember thatminimum detection limits for metals in XRF ismuch higher than those for minerals in XRD.Moreover, detection efficiency for Ca is muchlower than for Fe. This means than XRF candetect iron also when it is present in mineralswith too low concentration for XRD detection.On the other hand, ED-XRF portablespectrometer can detect chemical elements withatomic number above 18; so, Si, Al and Mg, forinstance, are not detected even if present in highconcentration. This gives a complementary pointof view from XRD and XRF analyses. It is veryinteresting to note that these independentanalytical techniques bring the same grouping ondifferent basis; this means that minority mineralsfrom XRD are associated to other minerals
which are possible present in a very lowconcentration, under 1%. Nonetheless, chemicalelements characterising these minerals can bedetected by XRF.
Conclusions and outlooks
Multivariate analysis was performed both on thespectra obtained by XRF and on XRDdiffractograms. The comparison between thegroups obtained by results of the two analyticaltechniques clearly show how both analyses lead tocreate two macroclusters characterised by thegreater presence of quartz (blue groups) or calcite(red groups) for the XRD analysis, and for adifferent level of reciprocal concentration of ironand calcium for XRF analysis. This two aspectsshow the great advantages to use severalindependent analytical techniques to get a morecomplete information. The elemental analysis maytherefore be useful in case it is necessary toexecute a first evaluation, directly in situ and for asubsequent sampling of the mortars to be subjected
Periodico di Mineralogia (2013), 82, 3, 477-487
Figure 8. Dendogram from XRF spectra analysis. For clusters description see in the text.
bonizzoni _periodico 21/01/14 15:56 Pagina 485

L. Bonizzoni et al.486
to further analysis, such as diffractometry. In ourcase, XRD measurements have produced twoadditional meaningful sub-clusters in the big blueone, characterised by a different relativeconcentration of secondary minerals. In the nextarchaeological campaign, XRF analysis on site onuntreated samples will be applied to verify the realpossibility on discriminating on line the twogroups detected. Then, an advised sampling willselect a few samples for chemical laboratoryanalyses to ensure the accuracy of the results.Compositional characterization of ceramics is alsoforeseen, together with termoluminescence (TL)dating. Considering works now in progress, alsoOSL dating of the mortar samples will be of greathelp (Goedicke, 2011; Panzeri, 2013). This largescale investigation should allow to get extendedinformation about building materials and tocompare them with the archaeological hypothesis.This will actually help to reconstruct the steps of
use and the changes that occurred in time to thebath complex and that are no longer directlydeducible from archaeological practice, clarifying,controverting or suggesting archaeologicalinterpretation.
The archaeological feedback are currently inprogress: the groups generated by the analysiswill be compared with the stratigraphichypothesis to reconstruct the phases of use andthe changes that occurred in time to the bathcomplex. At a preliminary observation, theanalyses show that probably the builders used thesame raw material for the bath complex althoughit was built in different times and even if somefeatures in the materials were foundcorresponding to anthropic actions aimed atchanging the intended use of the structures. Onlythe results of the forthcoming excavations willbe able to confirm or deny these preliminaryinterpretations.
Periodico di Mineralogia (2013), 82, 3, 477-487
Figure 9. Comparison between XRF spectra of sample M150A and M150C_b. spectra colour are referred tobelonging cluster. Only principal peaks are specified.
bonizzoni _periodico 21/01/14 15:56 Pagina 486

Scientific analyses beyond the excavation: ... 487
Ackwnoledgements
The authors would like to thank for theircollaboration: Lorenzo dell’Aquila, Archeodomanisas, and Alfredo Guarino for the coordination andscientific direction of the archaeologicalexcavation that took place in Bibbiena (AR);Claudia Conti e Marco Realini for mineralogicalanalysis carried out at ICVBC-CNR.
Two anonymous referees are thanked for theirhelp in improving the manuscript.
References
Adam J.P. (1989) - L’arte di cosruire presso i romani,materiali e tecniche, Ed. Longanesi & C.
Aranguren B.M., Brocchi L., Lari D., Ducci M. andFedeli L. (1999) - Gruppo ArcheologicoCasentinese G.A.C., Comunità montana delcasentino, Il Casentino dalla Preistoria al Medioevo,Profilo di una valle attraverso l’archeologia.
Bonizzoni L., Galli A., Gondola M. and Martini M.(2013) - Comparison between XRF, TXRF andPXRF analyses for provenance classification ofarchaeological bricks. X-Ray Spectrometry, 2013,42, 262-267.
Calza C., Anjos M.J., Bueno M.I.M.S., Mendonça deSouza S., Brancaglion A.Jr, Lima T.A. and LopesR.T. (2007) - XRF applications in archaeometry:analysis of Marajoara pubic covers and pigmentsfrom the sarcophagus cartonage of an Egyptianmummy. X-Ray Spectrometry, 36, 348-354.
De Vries J.L. and Vrebos B.A.R. (1993) - In:Handbook of X-ray Spectrometry. Methods andTechniques. (eds): R.E. Van Grieken and A.A.Markowic, Marcel Dekker, Inc., New York.
Freitas R.P., Calza C., Lima T.A., Rabello A. andLopes R.T. (2010) - EDXRF and multivariatestatistical analysis of fragments fromMarajoaraceramics. X-Ray Spectrometry, 39, 307-310.
Goedicke C. (2011) - Dating mortar by opticallystimulated luminescence: a feasibility study.Geochronometria, 38, 42-49.
Panzeri L. (2013) - Mortar and surface dating withOptically Stimulated Luminescence (OSL):Innovative techniques for the age determination ofbuildings. Il nuovo Cimento C, 36, 205-216.
Tite M.S. (2008) - Ceramics production, provenance,use - a review. Archaeometry, 50, 216-231.
Todeschini R. (1998) - Introduzione allaChemiometria, EdiSES: Napoli.
Zhu J., Shan J., Qiu P., Qin Y., Wang C., He D., SunB. and Tong P. (2004) - Wu S. The multivariatestatistical analysis and XRD analysis of pottery atXigongqiao site. Journal of Archaeological Science,31, 1685-1691.
Submitted, May 2013 - Accepted, November 2013
Periodico di Mineralogia (2013), 82, 3, 477-487
bonizzoni _periodico 21/01/14 15:56 Pagina 487