Embed Size (px)
Citation preview
SCIENTIFIC COMMITTEEELEVENTH REGULAR SESSION
Pohnpei, Federated States of Micronesia5-13 August 2015
Indicator-Based Analysis of the Status of Shortfin Mako Shark in the North Pacific OceanWCPFC-SC11-2015/ SA-WP-08
ISC1
1 International Scientific Committee for Tuna and Tuna-like Species in the North Pacific Ocean
7/29/15 SHARKWG
1
Annex 12
INDICATOR-BASED ANALYSIS OF THE STATUS
OF SHORTFIN MAKO SHARK IN THE NORTH
PACIFIC OCEAN
REPORT OF THE SHARK WORKING GROUP
International Scientific Committee for Tuna and Tuna-like Species in the North
Pacific Ocean
15-20 July 2015
Kona, Hawaii, U.S.A.
7/29/15 SHARKWG
2
Table of Contents
ACKNOWLEDGEMENTS .......................................................................................................................... 3
EXECUTIVE SUMMARY .......................................................................................................................... 4
1 INTRODUCTION ................................................................................................................................ 7
2 BIOLOGY BACKGROUND ............................................................................................................... 8
2.1 Stock structure and movement ...................................................................................................... 8
2.2 Habitat ........................................................................................................................................... 8
2.3 Reproduction ................................................................................................................................. 9
2.4 Growth .......................................................................................................................................... 9
3 DATA AND METHODS...................................................................................................................... 9
3.1 Catch ........................................................................................................................................... 10
3.2 Fishing effort ............................................................................................................................... 10
3.3 Indices of relative abundance ...................................................................................................... 10
3.4 Size frequency data ..................................................................................................................... 12
3.5 Prioritization of data components using simulation analyses ..................................................... 13
3.6 Prioritization of CPUE indices .................................................................................................... 13
4 RESULTS OF INDICATOR-BASED ANLYSES ............................................................................. 13
4.1 Proportion of positive sets........................................................................................................... 13
4.2 Indices of relative abundance ...................................................................................................... 14
4.3 Sex ratio ...................................................................................................................................... 16
4.4 Size .............................................................................................................................................. 16
5 STOCK STATUS ............................................................................................................................... 16
5.1 Synthesis of indicators and conclusions about stock status ........................................................ 16
5.2 Conservation and management advice ........................................ Error! Bookmark not defined.
6 RESEARCH RECOMMENDATIONS .............................................................................................. 17
7 LITERATURE CITED ....................................................................................................................... 18
TABLES ..................................................................................................................................................... 23
FIGURES .................................................................................................................................................... 24
7/29/15 SHARKWG
3
ACKNOWLEDGEMENTS
Completion of the shortfin mako shark indicator analysis was a collaborative effort by the ISC
Shark Working Group. Present and past Working Group members who contributed to the data
compilation and analysis include Suzanne Kohin (Chair), Alex Aires da-Silva, Chien-Pang Chin,
Felipe Carvalho, Fernando Márquez-Farías, Hiroaki Okamoto, Hui-hua Lee, Ignacio Fernández-
Méndez, Javier Tovar-Ávila, Joel Rice, Kevin Piner, Kotaro Yokawa, Kwang-Ming Liu,
Leonardo Castillo-Géniz, Luis González-Ania, Mikihiko Kai, Minoru Kanaiwa, Mioko Taguchi,
Norio Takahashi, Oscar Sosa-Nishizaki, Rosa Runcie, Seiji Ohshimo, Shelton Harley, Steve Teo,
Tim Sippel, Wen-Pei Tsai, William Walsh, Yasuko Semba, Yi Xu. Felipe Carvalho and Hui-hua
Lee took the lead on the simulation analyses. Tim Sippel, Felipe Carvalho, Hui-Hua Lee, Kevin
Piner and Suzy Kohin prepared and edited most of the report sections.
7/29/15 SHARKWG
4
EXECUTIVE SUMMARY
1. Stock Identification and Distribution
Shortfin makos are distributed throughout the pelagic, temperate North Pacific. Nursery
areas are found along the continental margins in both the western and eastern Pacific, and larger
subadults and adults are observed in greater proportions in the Central Pacific. A single stock of
shortfin mako sharks is assumed in the North Pacific Ocean based on evidence from genetics,
tagging studies, and lower catch rates of shortfin makos near the equator than in temperate areas.
However, within the North Pacific some regional substructure is apparent as the majority of
tagged makos have been recaptured within the same region where they were originally tagged,
and examination of catch records by size and sex demonstrates some regional and seasonal
segregation across the North Pacific.
2. Catch
Catch was estimated for many fleets and nations based on the best available information.
Catch estimates for each fishery were made based on effort, knowledge of the species
composition of catch, estimated catch per effort, and scientific knowledge of the operations and
catch history. These time series provide an idea of recent catch history for many of the main
fleets, but estimates of total catch for shortfin mako sharks in the North Pacific are incomplete.
Data are lacking for several significant fishing nations (e.g. Korea and China) and fleets (e.g.
Taiwan small-scale longline, Japan deep-set longline and Japan training vessel fleets). Estimates
are difficult to derive because discards are often not recorded and retained catch data are
available with low quality. Given that trends in catch cannot be derived from the incomplete
catch information provided, the catch time series were not considered for the purposes of
providing stock status information.
3. Indicator Data and Analysis
Simulation analyses were conducted to examine the effects of CPUE time series of varying
lengths and precision, of CPUE time series from predominately adult versus juvenile areas, and
of the contribution of trends in mean size versus CPUE in determining stock status. Results from
the simulations showed that time series of mean size are less informative regarding the current
stock condition (Bcur/Bmsy) than CPUE indices. Simulation results also showed that CPUE
indices that are derived from predominately adult areas provide better information on current
stock status than CPUE indices from recruitment areas.
Four types of indicators were developed for the north Pacific shortfin mako shark:
proportion of positive sets, abundance (CPUE) indices, sex-ratio and size compositions.
The proportion of positive sets, defined as set/trip where at least one shortfin mako sharks
is caught, is calculated for major fisheries. The trends for proportion of positive sets varied
across fisheries with the Japanese shallow-set longline fishery having the highest proportion of
7/29/15 SHARKWG
5
positive catch sets (approximately 75% in 2013, with the rate nearly tripling over the time
series).
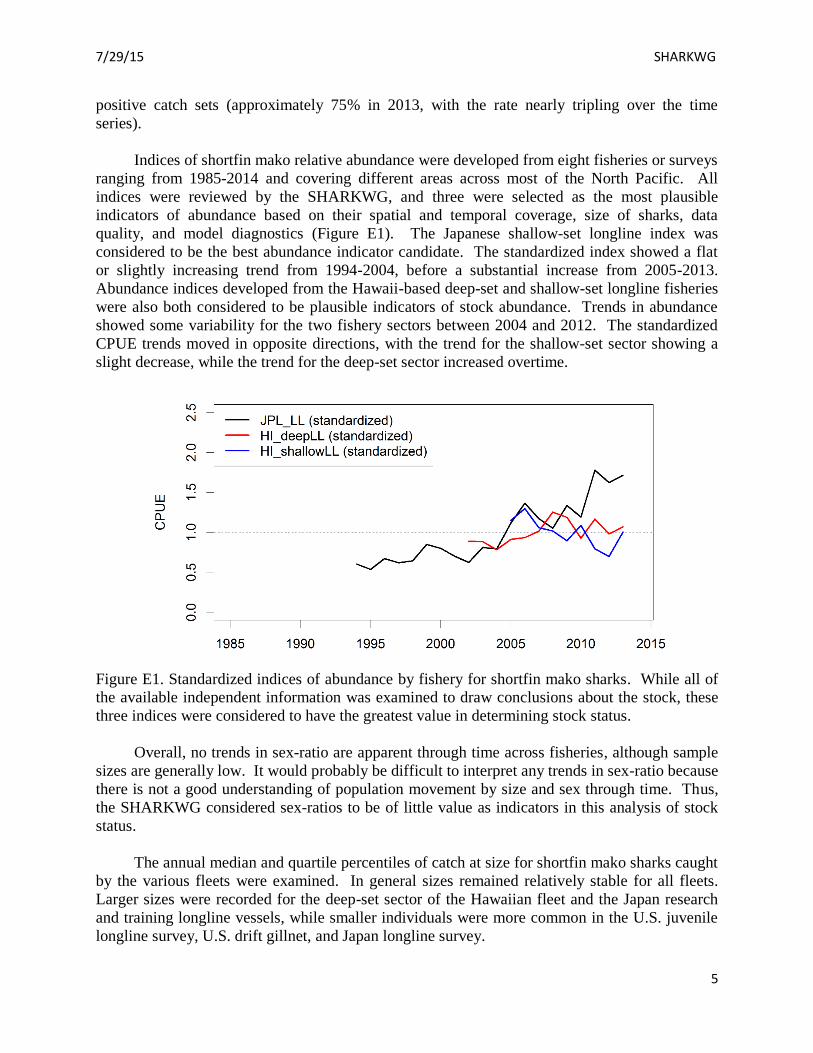
Indices of shortfin mako relative abundance were developed from eight fisheries or surveys
ranging from 1985-2014 and covering different areas across most of the North Pacific. All
indices were reviewed by the SHARKWG, and three were selected as the most plausible
indicators of abundance based on their spatial and temporal coverage, size of sharks, data
quality, and model diagnostics (Figure E1). The Japanese shallow-set longline index was
considered to be the best abundance indicator candidate. The standardized index showed a flat
or slightly increasing trend from 1994-2004, before a substantial increase from 2005-2013.
Abundance indices developed from the Hawaii-based deep-set and shallow-set longline fisheries
were also both considered to be plausible indicators of stock abundance. Trends in abundance
showed some variability for the two fishery sectors between 2004 and 2012. The standardized
CPUE trends moved in opposite directions, with the trend for the shallow-set sector showing a
slight decrease, while the trend for the deep-set sector increased overtime.
Figure E1. Standardized indices of abundance by fishery for shortfin mako sharks. While all of
the available independent information was examined to draw conclusions about the stock, these
three indices were considered to have the greatest value in determining stock status.
Overall, no trends in sex-ratio are apparent through time across fisheries, although sample
sizes are generally low. It would probably be difficult to interpret any trends in sex-ratio because
there is not a good understanding of population movement by size and sex through time. Thus,
the SHARKWG considered sex-ratios to be of little value as indicators in this analysis of stock
status.
The annual median and quartile percentiles of catch at size for shortfin mako sharks caught
by the various fleets were examined. In general sizes remained relatively stable for all fleets.
Larger sizes were recorded for the deep-set sector of the Hawaiian fleet and the Japan research
and training longline vessels, while smaller individuals were more common in the U.S. juvenile
longline survey, U.S. drift gillnet, and Japan longline survey.
7/29/15 SHARKWG
6
4. Summary of Indicators
Although our knowledge about shortfin mako life history is not complete, a general picture
of the dynamics of the assumed north Pacific stock has emerged: juvenile sharks are found in
both the eastern and western areas of the Pacific Ocean near continental land masses while older
sharks are found in greater numbers in the central Pacific. Like our knowledge of life history,
our compilation of fishery data is also incomplete.
Effort for the fisheries examined that catch shortfin makos throughout the North Pacific
seems to have declined overall, although effort estimates for several fisheries and nations were
unavailable. Of the available indices of relative abundance (CPUE), the Japanese shallow-set
longline and both Hawaiian longline indices (shallow- and deep-set) are considered good
candidates for representing stock trends. All three indices cover a large part of the Pacific where
mature sharks are found. Both the Japanese shallow-set and the Hawaiian deep-set indices
indicate non-negative trends and the Hawaiian shallow-set a negative trend. Although the
negative trend in the Hawaiian shallow-set should not be completely discounted, the variability
in the annual length distributions from this fishery suggests that the index selectivity/catchability
fluctuates which may invalidate the proportionality assumption. It should also be considered that
the rate of population increase described by the Japanese shallow-set post 2000 is likely too steep
to solely reflect the response of a Lamnidae species to a relaxation of fishing pressure.
5. Stock Status and Conservation Advice
Shortfin mako is a data poor species. Recognizing that information on important fisheries
is missing, the untested validity of indicators for determining stock status, and conflicts in
the available data, stock status (overfishing and overfished) could not be determined.
Managers should consider the undetermined stock status of shortfin mako shark in the
North Pacific when developing and implementing management measures.
The SHARKWG reviewed a suite of information to determine the stock status of shortfin
mako shark in the North Pacific. Of the three indices considered to have the greatest value
in providing stock status information, abundance trends in two of the series appear to be
stable or increasing, while the abundance trend in the third series appears to be declining.
It is recommended that data for missing fleets be developed for use in the next stock
assessment scheduled for 2018 and that available catch and CPUE data be monitored for
changes in trends. It is further recommended that data collection programs be
implemented or improved to provide species- specific shark catch data for fisheries in the
North Pacific.
7/29/15 SHARKWG
7
1 INTRODUCTION
The Shark Working Group (SHARKWG) of the International Scientific Committee for
Tuna and Tuna-like Species in the North Pacific Ocean (ISC) was established in 2010 and is
responsible for providing regular stock status assessments of pelagic sharks that interact with
international tuna and billfish fisheries in the North Pacific Ocean. The focus of the SHARKWG
to date has been on the two most commonly encountered pelagic sharks, the blue shark
(Prionace glauca) and shortfin mako shark (Isurus oxyrinchus). In order to assess population
status, SHARKWG members have been collecting biological and fisheries information on these
key shark species in coordination and collaboration with regional fishery management
organizations, national scientists and observers.
Shortfin mako shark is a highly migratory shark species and represents one of the largest
and fastest of pelagic sharks. Unlike for commercially targeted species of higher value, such as
tunas and billfish, a greater portion of shark fishing mortality is the result of bycatch or
incidental catch. Due to a lower reproductive potential as a result of slower growth, larger adult
size, later reproduction, and fewer offspring, sharks are generally more susceptible to overfishing
than teleosts and higher fecundity species (Branstetter 1990; Hoenig and Gruber 1990; Au et al.
2008). As largely non-targeted species, records of shark catches (retained and discarded) are
often of lower quality and quantity than for targeted species.
Without accurate recorded catch, it is difficult to produce traditional population dynamic
stock assessment models. Data poor models, such as catch free (Porch et al. 2007; Trenkel
2008) and index free models (Dick and MacCall 2010), have been developed on the basis of
strong assumptions and in some cases are not fully tested. Some regional management arenas
have used simpler fishery indicator analyses to provide general stock status advice from data
sources other than catch (Clarke et al. 2011a; Aires-da-Silva et al. 2014; Hinton et al. 2014;
Francis et al. 2014).
The SHARKWG has analyzed several sources of data for shortfin mako shark including
incomplete catch and effort data, size frequency data, fishery and survey relative abundance
indices, and sex ratio data. Fishery indicators, defined to be time series each characterizing a
single data source, were considered for their potential to provide information about the stock.
Simulation testing was developed to select indicators that provide more information on the stock
condition.
The nature of fishery indicator analyses is to consider all of the available independent
information and draw a congruous conclusion based on the most meaningful signals present in
the information. Based on results from the simulation analysis and the data themselves, the
SHARKWG concluded that some indicators have little or no value to inform stock status, while
others are meaningful in this regard. This report contains all the data that were taken into
consideration to provide context about how the stock status determination was formed, but the
conclusions are drawn from those indicators deemed to have the greatest value. Conclusions
regarding stock status are limited in simple indicator-based analyses due to missing information
on dynamic processes such as fishing mortality, selectivity and catchability. The results from the
7/29/15 SHARKWG
8
indicator analyses give a provisional identification of stock trends, however without the greater
confidence associated with a traditional dynamic assessment model.
2 BIOLOGY BACKGROUND
2.1 Stock structure and movement
A single stock of shortfin mako sharks is assumed in the North Pacific Ocean based on
evidence from genetics, tagging studies, and lower catch rates of shortfin makos near the equator
than in temperate areas. All but one shortfin mako tagged in the northern and southern Pacific
Ocean have been recaptured within the same hemisphere (Sippel et al. 2011; Urbisci et al. 2013;
Bruce 2013), and there is a distinct signal in mitochondrial DNA heterogeneity between the
North and South Pacific Ocean (Michaud et al. 2011; Taguchi et al. 2015). However, within the
North Pacific Ocean some regional substructure is apparent as the lion’s share of tagged makos
have been recaptured within the same region where they were originally tagged, and examination
of catch records by size and sex demonstrates some regional and seasonal segregation across the
North Pacific Ocean (Semba and Yokawa 2011; Sippel et al. 2015).
There remain uncertainties about shortfin mako shark stock structure, however.
Microsatellite DNA analyses reveal no differentiation between the North and South Pacific
Ocean, although the results are still being examined in order to determine the significance of the
findings with respect to population connectivity (Taguchi et al. 2015). In addition, one shortfin
mako shark tagged in the southwestern Pacific Ocean off Australia was reportedly recaptured
east of the Philippines (Bruce 2013). Given the preponderance of evidence currently supporting
limited connection between North and South Pacific shortfin mako populations, the SHARKWG
assumes distinct North and South Pacific stocks, although stock structure should be reconsidered
provided further information supporting alternative hypotheses.
2.2 Habitat
Shortfin makos are distributed throughout the pelagic, temperate North Pacific Ocean,
within which there are regions where young-of-the-year shortfin makos are more abundant,
suggestive of pupping and/or nursery areas. These areas are distributed along the continental
margins of the North Pacific Ocean, off the coast of U.S. and Mexico between about 27-35
degrees N in the eastern Pacific Ocean (Holts and Bedford 1993; Hanan et al. 1993; Sippel et al.
2015) and off the coast of Japan between about 30-40 degrees N (Semba and Yokawa 2011; Kai
et al. 2015a; Sippel et al. 2015). Larger subadults and adults are observed in greater proportions
in the Central Pacific Ocean (Sippel et al. 2015; Semba and Yokawa 2011). These observations
are based on fishery data and the effect of gear selectivity on the size composition of the catch is
unclear. Nevertheless, the data are suggestive that larger sharks tend to use more oceanic
habitats in the central North Ocean where they may meet to reproduce, and that large females
move toward the coastal areas to pup.
From the few electronic tagging studies conducted in the Pacific Ocean, shortfin makos
appear to spend most of their time in epipelagic waters remaining predominately in the upper
100-150 m (Sepulveda et al. 2004; Musyl et al. 2011; Stevens et al. 2010; Abascal et al. 2011;
Vetter et al. 2008; SWFSC unpublished) with occasional vertical excursions to beyond 500 m.
7/29/15 SHARKWG
9
They exhibit diurnal behavior generally remaining closer to the surface at night. The majority of
individuals studied have been juveniles and subadults.
2.3 Reproduction
The occurrence of reproductive sized shortfin mako sharks in fishery catch is rare, thus few
studies of the reproductive biology of Pacific shortfin mako sharks have been conducted (Mollet
et al. 2000; Joung and Hsu 2005; Semba et al. 2011). However, these studies have suggested
they reproduce every two to three years, with an estimated gestation of 12 to 25 months (Mollet
et al. 2000; Juong and Hsu 2005; Semba et al. 2011) followed by a “rest period” before the next
pregnancy begins. In the northern hemisphere, shortfin makos are thought to pup from late
winter to mid spring (Mollet et al. 2000; Juong and Hsu 2005; Semba et al. 2011; Kai et al.
2015a; Cailliet and Bedford 1983).
2.4 Growth
Age and growth studies have been limited by the scarcity of large specimens as well,
which has made it difficult to reliably estimate growth rates, life span and age at maturity of
shortfin mako sharks. In addition, for determining ages from vertebrae, there is uncertainty in
the band pair deposition rates across regions, ages and sexes for North Pacific shortfin mako
sharks. The periodicity of band pair deposition for shortfin mako in the Northeast Pacific Ocean
up to age five has been validated at two band pairs per year based on oxytetracycline tagging
(Wells et al. 2013) for sharks up to age 5, and one per year for a single adult male shark after age
5 (Kinney et al. 2014). Validation studies based on radio-bomb carbon suggest that one band
pair is deposited in vertebrae per year (Ardizzone et al. 2006), but that the data are not
inconsistent with a deposition rate of two per year for a few years.
Based on length frequency analysis and tag-recapture studies there is evidence of relatively rapid
growth in shortfin makos, both in the north Pacific (Wells et al. 2013; Kai et al. 2015a), and
elsewhere (Natanson et al. 2006; Bishop et al. 2006; Pratt and Casey 1983). In the northeast
Pacific, growth has been estimated at 28-29 cm between the first and second summer and 19-21
cm between the second and third summer (Wells et al. 2013), and even more rapid in the
northwest Pacific (Kai et al. 2015a). However, what may be the best growth models to use for
north Pacific shortfin makos is still uncertain as studies are generally limited to smaller size
classes, and results are not available for both sexes in all regions. The ISC SHARKWG is
conducting a collaborative study to address shortfin mako growth which includes cross reading
of reference vertebrae and a North Pacific-wide sampling plan to collect vertebrae from several
regions and all age classes.
3 DATA AND METHODS
Four types of data were reviewed prior to the analyses: 1) fishery-specific catch; 2) fishing
effort data; 3) relative indices of abundance; and 4) size and sex measurements. Data were either
lacking or incomplete for several significant fisheries in the North Pacific. Data for the Taiwan
small-scale longline fishery and for Korea’s and China’s longline fisheries were not available.
For Japan’s Research and Training Vessel (RTV) fishery and distant-water longline fishery,
7/29/15 SHARKWG
10
some data were provided, but not for all time series. Data sources and details of the data
reviewed are presented below.
3.1 Catch
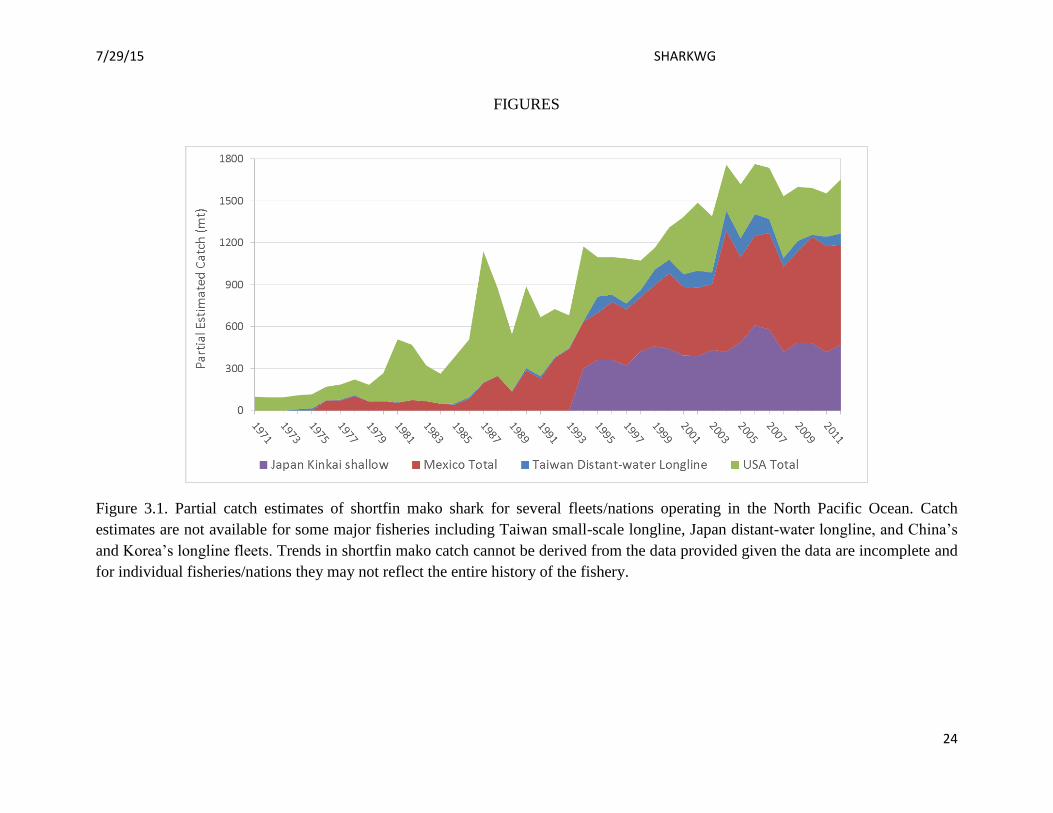
Catch was estimated for many fleets and nations based on the best available information.
Catch estimates for each fishery were made based on effort, knowledge of the species
composition of catch, estimated catch per effort, and scientific knowledge of the operations and
catch history. Methods are presented in the working papers describing each fleet’s/nation’s
catch. Estimated catch time series are available for the following nations/fleets and time periods
(Figure 3.1): Japan – Kinkai shallow longline, 1994-2013 (Kai et al. 2015b); Mexico – artisanal
gillnet and longline, medium size gillnet and longline, and large longline fleets, 1976-2013
(Sosa-Nishizaki et al. 2014); Taiwan – distant water longline, 1971-2012 (Tsai and Liu 2015);
U.S.A. – Hawaii-based longline, California based-longline, pelagic drift gillnet, recreational and
miscellaneous other, 1971-2013 (Sippel et al. 2014a).
These time series provide an idea of recent catch history for many of the main fleets, but
estimates of total catch for shortfin mako sharks in the North Pacific Ocean are incomplete. Data
are lacking for several significant fishing nations (e.g. Korea and China) and fleets (e.g. Taiwan
small-scale longline, Japan distant-water longline and Japan RTV). Estimates are difficult to
derive because discards are often not recorded and retained catch data are available with low
quality. Shark species were typically not identified to the species level until recent years. Given
that trends in catch cannot be derived from the incomplete catch information provided, the catch
time series were not considered for the purposes of providing stock status information.
3.2 Fishing effort
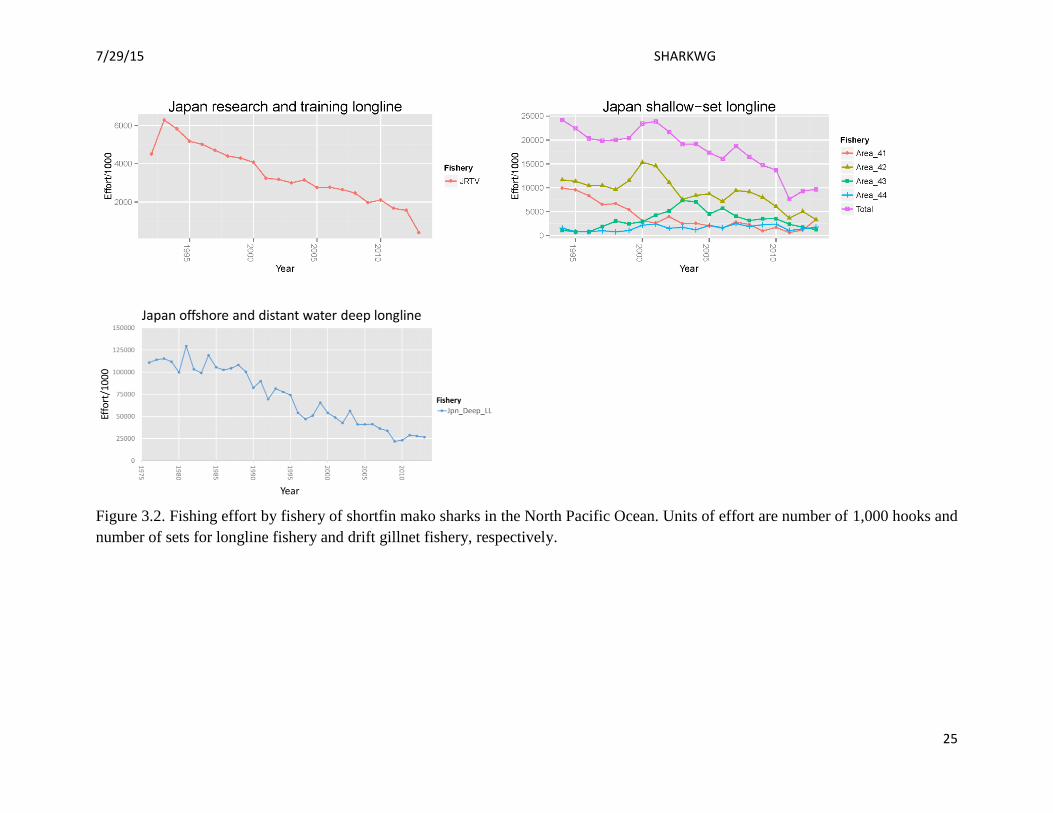
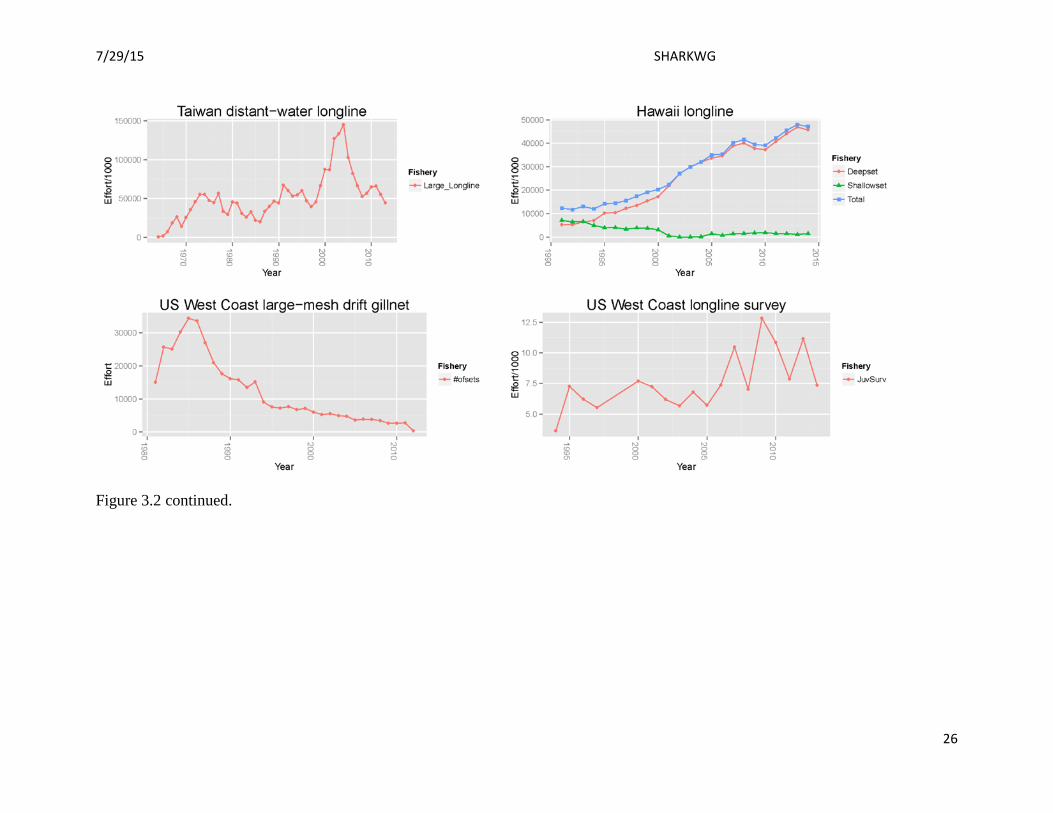
Fishing effort data were compiled for major longline fisheries (Japan Kinkai shallow-set,
Taiwan distant-water, Hawaii shallow- and deep-set), the U.S. West Coast drift gillnet fishery,
U.S. West Coast longline survey, and Japan RTV longline. Estimated effort does not represent
effort directed toward shortfin mako sharks, since the target species vary across fisheries, and
further analyses are needed to estimate effective effort. Of the data examined, effort has changed
over the years in the North Pacific Ocean (Figure 3.2). Note that effort data for China, Korea,
Mexico and the small-scale longline fishery of Chinese Taipei were not available.
3.3 Indices of relative abundance
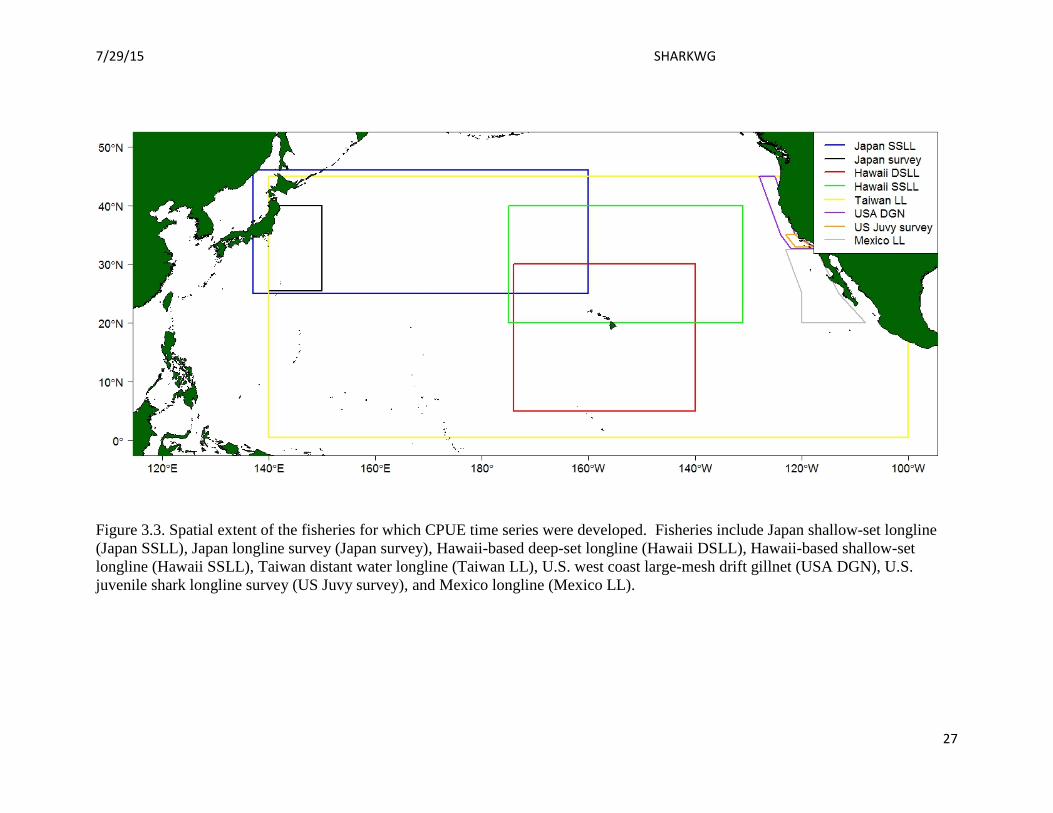
Catch and effort data were used to develop standardized catch-per-unit-of-effort (CPUE)
time series, which were assumed to be proportional to population size and were used as relative
indices of abundance. Catch-per-unit-of-effort was standardized for eight fisheries and surveys
across the North Pacific Ocean. Details of sources of data used to derive the indices are
described below and summarized in Table 3.1. The spatial extent of each fishery is shown in
Figure 3.3.
An index for the western North Pacific Ocean was developed for 1994-2013 using logbook
data from the Japanese shallow-set longline fishery. The fishery primarily catches juveniles and
7/29/15 SHARKWG
11
sub-adults (~60-200 cm precaudal length, PCL) in the western North Pacific Ocean (25-45 ̊N and
137 ̊E-160 ̊W). The standardized index was developed after applying two filters, one that cross-
checked the data against Japanese research and training vessel data and another that selected
specific vessels was based on reliability of the proportion of positive catch (positive catch ratio)
for each vessel. The standardization was conducted using a negative binomial model (Kai et al.
2015b).
An index was developed for a research survey in the western North Pacific Ocean (25-40°
N, 140-150° E) for 2000-2013 using the data from chartered research trips conducted by NRIFSF
(Ohshimo et al. 2014). Although the objectives of the survey were to develop and test mitigation
measures to reduce seabird and sea turtle bycatch and mortality, a large number of subtropical
and temperate pelagic sharks were caught. The size of shortfin makos caught in the fishery
ranges from ~60-150 cm PCL. The standardized CPUE was calculated using a GLM with
negative binomial errors.
For the Taiwanese distant water longline fishery which operates throughout most of the
North Pacific Ocean, logbook records for the period 2005-2012 were used to develop a relative
abundance index (Tsai and Liu 2015). The fishery predominately catches sub-adult and adult
sharks from ~100-280 cm PCL. Due to the high frequency of zero shortfin mako shark catch
sets, the index was standardized using a delta lognormal model, which included set type
(shallow- or deep-set) as a model factor (Tsai and Liu 2014; Tsai and Liu 2015). The final
models reviewed by the Working Group showed unsatisfactory diagnostics believed to be due to
differences in effort across the regions stratified. Therefore, for the indicator analyses, the
SHARKWG used the nominal CPUE time series for the two regions in the central North Pacific
that had the greatest and most consistent effort over time.
The Hawaii-based pelagic longline fishery operates in the central North Pacific Ocean,
with shallow-set operations targeting swordfish in more temperate areas and deep-set operations
targeting bigeye tuna in more subtropical areas. An abundance index was developed for the
deep-set fishery from 2002-2013 and for the shallow-set fishery from 2005-2013. The deep-set
fishery catches sub-adults and adults (~125-220 cm PCL) and the shallow-set fishery catches
juveniles and subadults (~65-210 cm PCL). Although the fisheries have been operating in the
North Pacific since the early 1990s, these datasets were truncated because observer coverage was
not adequately representative of the deep-set fishery prior to 2002 (Sippel et al. 2014b) and the
shallow-set fishery was heavily impacted by changes in operations and a fishery closure during
2001-2004. Indices of abundance for both fisheries were standardized with delta lognormal
models (Carvalho and DiNardo 2014).
Set-by-set logbook data from a large mesh drift gillnet fishery targeting swordfish along
the coast of California were used to develop a relative abundance index for 1985-2012. The
fishery catches primarily juveniles and subadults (~65-160 cm PCL). Due to bycatch concerns,
regulations have changed fishing operations substantially (annual effort, spatial extent and
fishing season) since logbook requirements were implemented in 1980. As result of these
operational changes, the index was split into two periods (1985-2000; 2001-2012), and due to the
high frequency of zero shortfin mako catch sets, the index was developed using a delta
lognormal model (Lee et al. 2014).
7/29/15 SHARKWG
12
Set-by-set data from an annual fishery-independent survey of juvenile sharks (~65-145 cm
PCL) for the 1994-2013 period were used to develop an index of relative abundance. The survey
is conducted in the Southern California Bight, covering a relatively limited area off Southern
California known to be a nursery area for shortfin makos. The index was developed using a
general linear model (Runcie et al. 2014).
Observer data from Mexico’s longline fishery operating off the coast of Baja California
were used to develop a juvenile and subadult (~60-170 cm PCL) abundance index for 2006-2014
(González-Ania et al. 2014). The primary target of the fishery is swordfish, and although the
fishery began as a drift gillnet fishery, it is now exclusively a longline fishery due to a ban on
gillnetting imposed in 2009. The index was based on the longline component of the fishery that
operates off the states of Baja California and Baja California Sur and was standardized using a
delta lognormal model due to the high frequency of zero mako catch sets (González-Ania et al.
2014).
3.4 Size frequency data
Spatially-explicit sex-specific size frequency data in precaudal length (PCL; cm) were
compiled from major longline fisheries (Japan, U.S.A.), a regional longline survey (Mexico), a
small-scale U.S. West Coast drift gillnet fishery and U.S.A. longline survey, which altogether
cover much of the North Pacific Ocean (Sippel et al. 2015). The SHARKWG reviewed spatio-
temporal analyses conducted on juvenile size and sex distribution. Sharks were sampled from
Japanese shallow-set longline and coastal driftnet fisheries in the western and central North
Pacific (Kai et al. 2015a) and across most of the North Pacific Ocean from Japanese shallow-
and deep-set longline fisheries, Hawaiian shallow- and deep-set longline fisheries, Mexican
longline, the U.S.A. large mesh drift gillnet fishery and small-scale domestic longline survey
(Sippel et al. 2015).
Additional size data that were neither spatially-explicit nor sex-specific were also reviewed
by the SHARKWG. These data were aggregated with the spatially explicit data described above
to investigate size trends by fishery through time and are provided in the results of this report.
The biological sampling programs that collected size data varied in scope and design.
Size data for the Hawaiian longline fisheries were collected through the Hawaiian observer
program. The observer program has been in operation since 1995, but through 2000 sampling
may have been biased due to low coverage rates and non-random assignment of observers to
fishing vessels. However, the program was redesigned in 2001 with increased coverage rates and
randomized design, thereby minimizing or removing potential sampling biases (Sippel et al.
2014b). The shallow-set fishery has always operated with 100% observer coverage, and all
sharks are measured, so sampling has been considered representative of the fishery catch.
Biological sampling for the U.S. West Coast drift gillnet fishery was conducted by port samplers
between 1980-1990 (Childers and Halko 1994) and thereafter by observers following a
statistically designed sampling program.
7/29/15 SHARKWG
13
Mexico’s size data come from their observer program that was first implemented in 2006
and has operated in both the longline and drift gillnet fisheries (Castillo-Géniz et al. 2014). The
assignment of observers to trips is not designated through a randomized design and coverage
rates have not been consistent through time, so sampling biases may occur.
Japanese size and sex data come from two fisheries. One is the Japanese shallow-set
longline fishery which operates primarily in the western and central North Pacific Ocean and the
size data are collected by port samplers (Ohshimo et al. 2014; Kai et al. 2015a). The second
source is from onboard size measurements taken in the Japan RTV fishery which operates
primarily around Hawaiian waters using deep-set longline gear (Clarke et al. 2011b).
Taiwan collects biological data from its longline fisheries through both onboard observers as
well as port sampling. While the quality of data collected by observers should be reliable,
sample sizes were low and protocols for at-sea sampling (e.g. randomization) were not described,
so caution should be exercised with respect to representativeness of these data. Taiwanese port
samples came from processed catch (frozen and with head, fins, and tail removed) unloaded at
docks.
3.5 Prioritization of data components using simulation analyses
The use of simulation analyses assisted in the prioritization of the data available to be used
as stock status indicators. Results from the simulation showed that time series of mean length
are less informative regarding the current stock condition (Bcur/Bmsy) than CPUE indices of
abundance (Lee et al. 2015).
3.6 Prioritization of CPUE indices
The simulation analyses showed that the effectiveness of CPUE as a stock status indicator
depends on the length of the time series as well as the precision of the estimates (Lee et al.
2015). The prediction power of any CPUE time series increases as the length of time between
the start of the time series and the unfished state decreases and when year to year variability is
lower. Relatively short CPUE time series (e.g. 5 years) seem to have almost no information
regarding the current stock status. Simulation results also showed that CPUE indices that are
derived from predominately adult areas provide better information on current stock status than
CPUE indices from recruitment areas.
4 RESULTS OF INDICATOR-BASED ANLYSES
Four types of indicators were developed for the North Pacific shortfin mako shark:
proportion of positive sets, abundance indices, sex-ratio and size compositions. These indicators
are presented here as annual time series and assessed for their utility in describing population
trends.
4.1 Proportion of positive sets
7/29/15 SHARKWG
14
The proportion of positive sets, defined as each set/trip where at least one shortfin mako
sharks was caught, was calculated for major fisheries. Summarizing the trends of this indicator
from multiple fisheries over space and time may indicate high abundance areas and/or efficiency
of fleets. However, this indicator should be interpreted with caution because it is confounded
with catchability and selectivity.
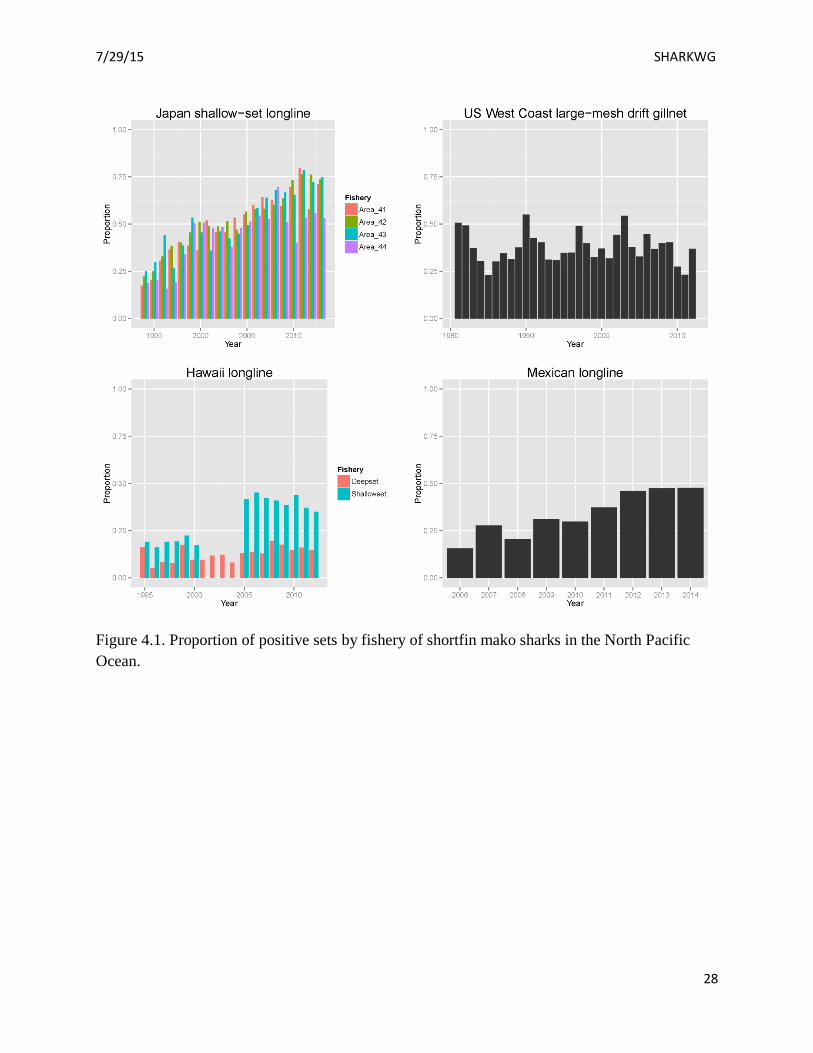
The trends for proportion of positive sets varied across fisheries and are shown in Figure
4.1. The proportion of positive sets increased steadily from 1994-2013 in the Japanese shallow-
set longline fishery; was variable without trend from 1992-2007 before declining from 2008-
2013 in the Japanese research and training vessel fishery; was variable without trend from 1995-
2004 before increasing from 2005-2012 in the Hawaii deep-set longline fishery; was flat without
trend from 1995-2000 before nearly doubling then slightly declining from 2005-2012 in the
Hawaii shallow-set longline fishery; was variable without trend from 1980-2012 U.S. West
Coast drift gillnet fishery; and increased steadily in Mexico’s longline fishery off Baja California
from 2006-2014. Across these fisheries, the Japanese shallow-set longline fishery has the
highest proportion of positive catch sets (approximately 75% in 2013, with the rate nearly
tripling over the time series).
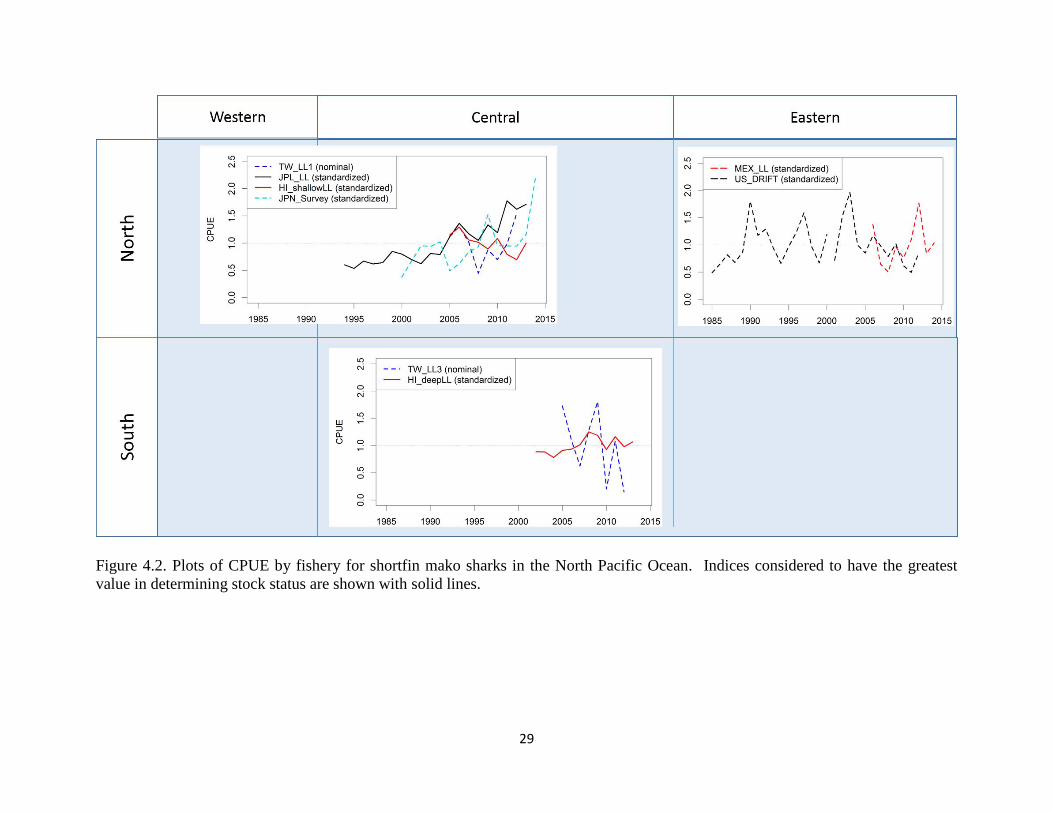
4.2 Indices of relative abundance
Indices of shortfin mako relative abundance were developed from eight fisheries or surveys
ranging from 1985-2014 and covering different areas across most of the North Pacific (Figure
4.2). All indices were reviewed by the SHARKWG, and three were selected as the most
plausible indicators of abundance based on their spatial and temporal coverage, size of sharks,
data quality, and model diagnostics. A summary of characteristics of the abundance indices
reviewed by the SHARKWG is in Table 3.1.
The Japanese shallow-set longline index was considered to be the best abundance indicator
candidate because of the large spatio-temporal coverage of the dataset, consistent catchability
through time, and the acceptable diagnostics of zero-inflated negative binomial model. The
standardized index showed a flat or slightly increasing trend from 1994-2004, before a
substantial increase from 2005-2013.
Abundance indices developed from the Hawaii-based longline fisheries were also both
considered to be plausible indicators of abundance. Data quality was considered to be good as
both indices were developed from data collected by onboard observers, with 100% observer
coverage in the shallow-set fishery over the 2005-2013, and 20% coverage in the deep-set
fishery during the 2002-2013. The SHARKWG deemed model diagnostics to be acceptable for
both indices. Both fisheries cover medium spatial extents when compared to the other indices
examined, although catchability may not have been constant in the shallow-set fishery because
bycatch mitigation measures imposed in 2006 and 2011 may have changed fishery behavior.
Trends in abundance showed some variability for the two fishery sectors between 2004 and
2012. The standardized CPUE trends moved in opposite directions, with the trend for the
shallow-set sector showing a slight decrease, while the trend for the deep-set sector increased
overtime.
7/29/15 SHARKWG
15
An index produced from the relatively small-scale Japanese longline survey in the
Northwest Pacific for 2000-2014 was considered to be less informative as a stock indicator.
Although the quality of data were considered good because it was a research survey, sample size
was fairly low with only 650 makos caught from a single vessel over the survey period. The
index indicated a mostly flat, but variable trend from 2000-2012, with a steep increase over 2013
and 2014.
The index developed for the U.S. West Coast drift gillnet fishery, 1985-2013, was also
considered to be less informative as a stock indicator. The time-series was split into two time
periods because bycatch mitigation regulations implemented in 2001 substantially changed the
spatio-temporal distribution and amount of effort in the fishery, thus catchability was likely
greatly affected. The fishery also catches primarily immature shortfin makos with only the
occasional larger adult. The index was derived from logbook data, with nearly 100% coverage
and verification through an observer program since 1990, so there was high confidence in data
quality. The resulting index indicated a slight overall increasing trend from 1985-2013 with
several brief increases and decreases over time.
The Taiwan distant-water longline fleet index for 2005-2012 was not considered a reliable
abundance index at this time, although the nominal CPUE data for two spatial areas were
believed to provide some useful information. The SHARKWG expressed some concerns about
the statistical soundness of the complete standardized model based on departures from normality
of model residuals and the low observed effort for certain areas and times. The overall fishery
does cover the largest spatial area of all fisheries however, and catchability was not thought to
have changed much through time. The non-uniform effort across the 4 spatial areas used in the
standardization led to consideration of the data and nominal CPUE trends for areas 1 and 3 only
for the stock indicator analysis. The nominal CPUE for area 3 showed a noisy but overall
declining abundance trend from 2005-2012, whereas the nominal CPUE in area 1 showed an
increasing trend from 2008-2012.
The abundance index developed for the Mexico longline fishery, 2006-2014, was deemed
to be less informative as a stock indicator as well. The time series is rather short, the fishery
occurs over a relatively small region of the EPO, and the catches are primarily juvenile shortfin
makos. The observer program from which the data came was not of a balanced design and likely
not representative of the overall fishery for all years (Castillo-Géniz et al. 2014). Furthermore,
changes in fishery management may have led to changing catchability through time. No clear
trend was apparent from the index due to its highly variable (noisy) pattern.
The SHARKWG reviewed an index from a fishery-independent survey of juvenile sharks
conducted off California in the EPO, 1994-2013. The index was not considered to be a
reasonable indicator of stock abundance and was not used in indicator analyses. The survey
covers the smallest area of all indices presented and targets juvenile sharks on a known nursery
area. The total number of sets was low. Although the data quality is good, the apparent
variability in catch rates is believed to reflect the changing distribution in space and time of
juveniles within the nursery that may only adequately be addressed with a larger scale or
adaptive survey.
7/29/15 SHARKWG
16
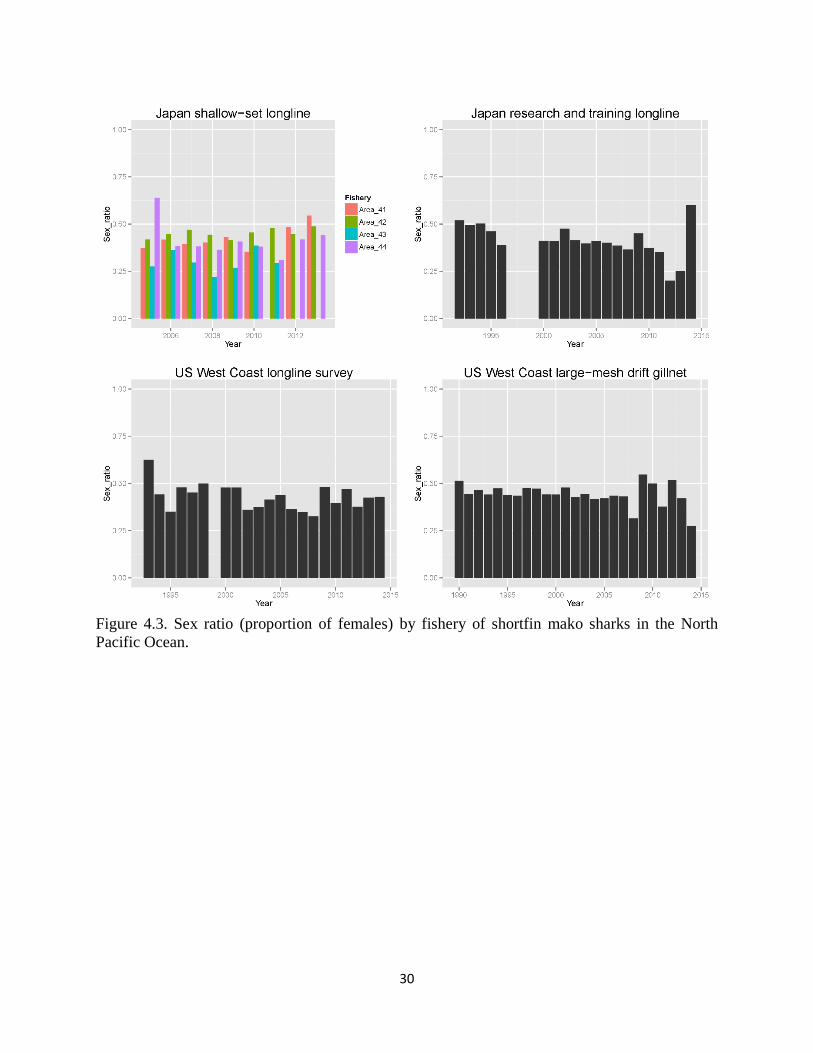
4.3 Sex ratio
The proportion of females is between 50-60% in the northwest Pacific Ocean, ranges from
20-60% in the central Pacific, with a small core of 50-60% east of the Hawaiian Islands, and
ranges from approximately 40-60% along the west coast of North America (Sippel et al. 2015).
Overall, no trends in sex-ratio are apparent through time across fisheries, although sample sizes
are generally low (Figure 4.3). It would probably be difficult to interpret any trends in sex-ratio
because there is not a good understanding of the dynamics of the population by size and sex
through time. Thus, the SHARKWG considered sex-ratios to be of little value as indicators in
this analysis of stock status.
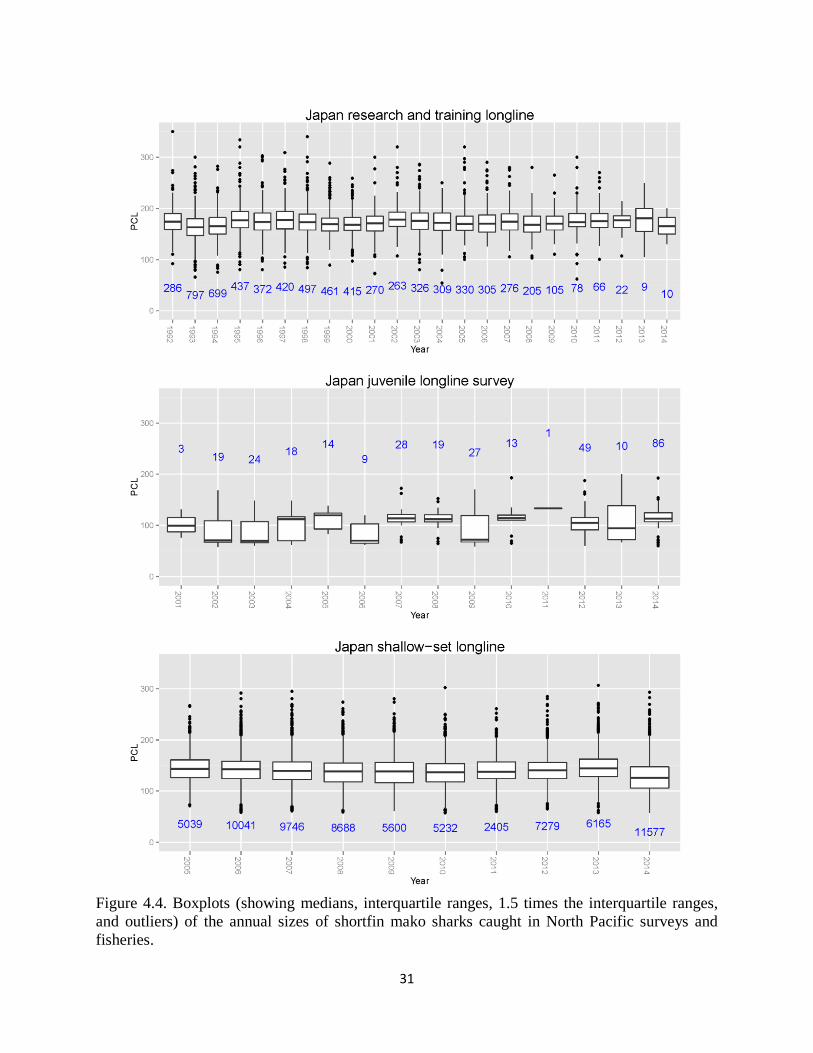
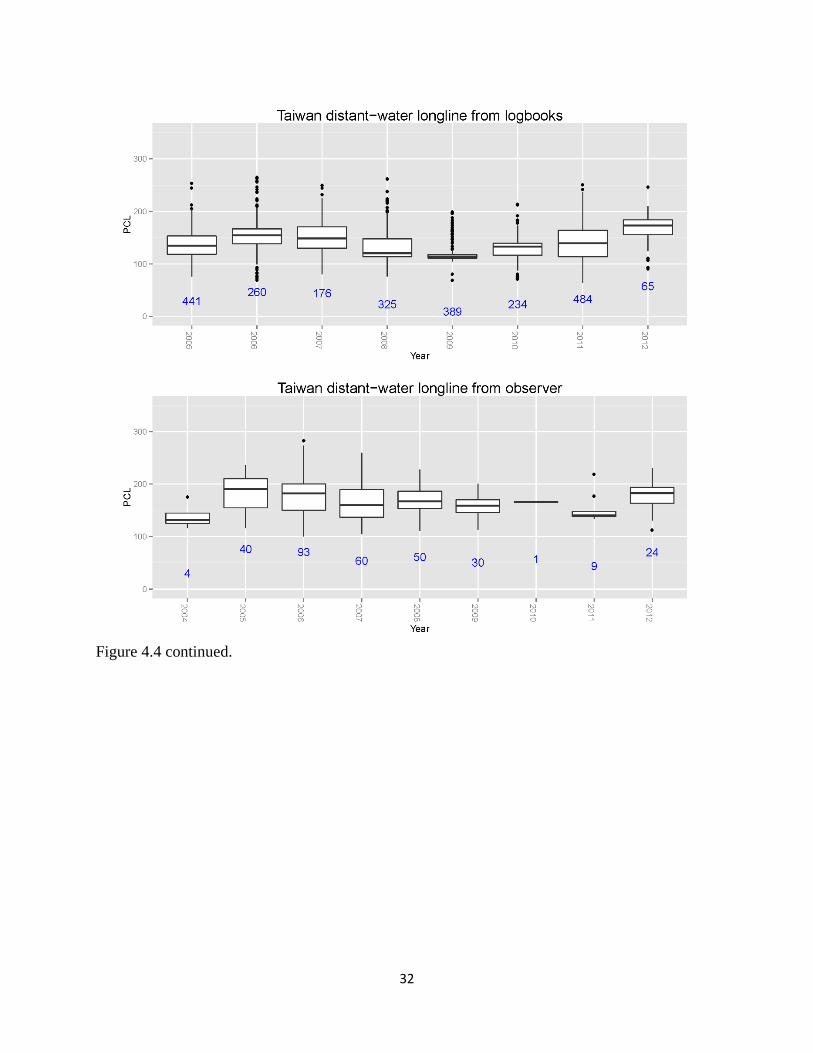
4.4 Size
Length measurements can be made quickly and easily and could provide useful stock
status indicators if collected in an unbiased manner across fisheries. In general, higher
exploitation rates result in removals of fish before they have a chance to reach larger sizes,
therefore generate a substantial reduction in the average and/or median size of fish being caught.
The annual median and quartile percentiles of catch at size in PCL (cm) for shortfin mako
sharks caught by the various fleets in the North Pacific Ocean are presented in Figure 4.4. In
general sizes remained relatively stable for all fleets. Larger sizes were recorded for the deep-set
sector of the Hawaiian fleet and the Japan research and training longline vessels, while smaller
individuals were more common in the U.S. juvenile longline survey, U.S. drift gillnet, and Japan
juvenile longline survey. High variability in the median sizes observed in many cases could be
due to small sample sizes. For example, median sizes for the Japan longline survey and U.S.
juvenile longline survey are variable and mainly represent just a few juvenile age classes. For
other fleets, like Taiwan’s distant-water longline and Hawaii’s shallow-set longline, median sizes
are also variable across years.
5 STOCK STATUS
5.1 Synthesis of indicators
Although our knowledge about shortfin mako life history is not complete, a general picture
of the dynamics of the assumed north Pacific stock has emerged. Juvenile sharks are found in
both the eastern and western areas of the Pacific Ocean near continental land masses. Older
sharks are increasingly found in the central Pacific where mating likely takes place. Under this
hypothesis, fisheries operating near the Japan and North America coastlines take young sharks
while those fisheries from the central Pacific catch older ages. Like other large pelagic sharks,
shortfin mako produce relatively few offspring, mature at older ages and are thus less
resilient/more susceptible to fishing pressure than the typical teleost.
Like our knowledge of life history, our compilation of fishery data is also incomplete.
However, a general conclusion regarding stock condition is also emerging from the information
examined. Effort for the fisheries examined that catch shortfin makos throughout the North
Pacific seems to have declined overall, although effort estimates for several fisheries and nations
7/29/15 SHARKWG
17
were unavailable. Of the available indices of relative abundance (CPUE), only the Japanese
shallow-set longline and both Hawaiian longline indices (shallow- and deep-set) are considered
good candidates for representing stock trends. All three indices cover a large part of the Pacific
where mature sharks are found. Both the Japanese shallow-set and the Hawaiian deep-set
indices indicate non-negative trends and the Hawaiian shallow-set a negative trend. Although
the negative trend in the Hawaiian shallow-set should not be completely discounted, the
variability in the annual length distributions from this fishery suggests that the index
selectivity/catchability fluctuates which may invalidate the proportionality assumption. It should
also be considered that the rate of population increase described by the Japanese shallow-set post
2000 is likely too steep to solely reflect the response of a Lamnidae species to a relaxation of
fishing pressure (Smith et al. 1998). The recent targeting of blue shark by this fleet may be
affecting the catch rates of shortfin mako, and analytical attempts to factor out this effect have
not been fully explored..
Simulation work has shown that time series of mean fish length are a poor predictor of
stock condition, but that indices of abundance that are proportional to stock size may be a good
predictor depending on the length of series (how close to unfished) and the precision of the
estimate. Therefore we consider the CPUE series as the best fishery indicators of stock
condition. However, all of the indices examined start at a time period far from the unfished
condition, making interpretation of these data regarding stock condition uncertain.
5.2 Stock Status and Conservation Advice
Shortfin mako is a data poor species. Recognizing that information on important fisheries
is missing, the untested validity of indicators for determining stock status, and conflicts in
the available data, stock status (overfishing and overfished) could not be determined.
Managers should consider the undetermined stock status of shortfin mako shark in the
North Pacific when developing and implementing management measures.
The SHARKWG reviewed a suite of information to determine the stock status of shortfin
mako shark in the North Pacific. Of the three indices considered to have the greatest value
in providing stock status information, abundance trends in two of the series appear to be
stable or increasing, while the abundance trend in the third series appears to be declining.
It is recommended that data for missing fleets be developed for use in the next stock
assessment scheduled for 2018 and that available catch and CPUE data be monitored for
changes in trends. It is further recommended that data collection programs be
implemented or improved to provide species- specific shark catch data for fisheries in the
North Pacific.
6 RESEARCH RECOMMENDATIONS
The SHARKWG offers the following priority research recommendations. Advice is given
in two sections: 1) recommendations to improve subsequent indicator analyses, and 2)
recommendations to move toward a more quantitative integrative stock assessment.
7/29/15 SHARKWG
18
Improve future indicator analyses
1. Improve data filtering and standardization for all CPUE indices. Improvements could
help explain some of the implausible rates of change in currently accepted series.
Other important series (notably the Taiwanese distant-water longline) could be
considered as suitable indicators with better statistical treatment of the data.
2. Improved summarization of indicator series. For CPUE data, investigate using state
space modeling to characterize trends. For size composition data, investigate
indicators (beyond average size) or methods of using the data for providing
information on stock condition.
Improve data compilation/collection to be able to conduct a full assessment
1. Full accounting of all catch and discarded mortality.
2. Explore methods to provide estimates of data from the historical period.
3. Continue to improve knowledge of the life history (e.g. age and growth, spawner-
recruit relationship, etc.) to move towards an age-structured assessment model.
7 LITERATURE CITED
Abascal, F.J., Quintans, M., Ramos-Cartelle, A., Mejuto, J. 2011. Movements and environmental
preferences of the shortfin mako, Isurus oxyrinchus, in the southeastern Pacific Ocean.
Marine biology, 158(5), 1175-1184.
Aires-da-Silva, A., Lennert-Cody, C., Maunder, M.N., Roman-Verdesoto M. 2014. Stock status
indicators for silky sharks in the eastern Pacific Ocean. SAC-05-11a.
Ardizzone, D., Cailliet, G.M., Natanson, L.J., Andrews, A.H., Kerr, L.A., Brown, T.A. 2006.
Application of bomb radiocarbon chronologies to shortfin mako (Isurus oxyrinchus) age
validation. Environmental Biology of Fishes 77, 355–366.
Au D.W., Smith, S.E., Show. C. 2008. Shark productivity and reproductive protection, and a
comparison with teleosts. In Sharks of the Open Ocean: Biology, Fisheries and Conservation
(eds. Camhi, M.D., Pikitch, E.K., Babcock, E.A.). Blackwell Publishing, Oxford, UK pp
298-308
Branstetter, S. 1990. Early life-history implications of selected carcharhinoid and lamnoid sharks
of the northwest Atlantic. NOAA Technical Report NMFS, 90, 17-28.
Bruce, B. 2013. Shark futures: A synthesis of available data on mako and porbeagle sharks in
Australasian waters - Current status and future directions. Fisheries Research and
Development Corporation and CSIRO Marine Research and Atmospheric Research. 151 p.
Cailliet, G.M., Bedford, D.W. 1983. The biology of three pelagic sharks from California waters,
and their emerging fisheries: a review. Report No. 24. CALCOFI
7/29/15 SHARKWG
19
Carvalho, F., DiNardo, G. 2014. Standardized catch rates of shortfin mako shark caught by the
Hawaii-based pelagic longline fleet (2002-2013). ISC/14/SHARKWG-3/10.
Castillo-Géniz, L., Godinez-Padilla, J., Ajas-Terriquez, H., Gonzalez-Ania, L. 2014. Catch data
for shortfin mako shark reported by fishery observers from Mexican shark longline and drift
gillnet fisheries in the North Pacific in 2006-2014. ISC/14/SHARKWG-3/02.
Childers, J., Halko, L. 1994. Length-frequency database description: California Department of
Fish and Game gill net market samples. NOAA Southwest Fisheries Science Center
Administrative Report LJ-94-01.
Clarke, S., Harley, S., Hoyle, S. Rice, J. 2011a. An indicator-based analysis of key shark species
based on data held by SPC-OFP. WCPFC-SC7-2011/EB-WP-01.
Clarke, S., Yokawa, K., Matsunaga, H., Nakano, H. 2011b. Analysis of North Pacific Shark Data
from Japanese Commercial Longline and Research/Training Vessel Records. WCPFC-SC7-
2011/EB-WP-02.
Dick, E.J., MacCall, A.D. 2010. Estimates of sustainable yield for 50 data-poor stocks in the
Pacific coast groundfish fishery management plan. NOAA Tech Memo SWFSC-460 June
2010.
Francis, M.P., Clarke, S.C., Griggs, L.H., Hoyle, S.D. 2014. Indicator based analysis of the status
of New Zealand blue, mako and porbeagle sharks. New Zealand Fisheries Assessment Report
2014/69. 109 p.
González-Ania, L., Fernández-Méndez, I., Castillo-Géniz, L. 2014. Standardized catch rates for
mako shark (Isurus oxyrinchus) in the 2006-2014 Mexican Pacific longline fishery based
upon a shark scientific observer program. ISC/14/SHARKWG-3/16.
Hinton, M., Maunder, M.N., Vogel, N., Olson, R., Lennert-Cody, C., Aires-da-Silva, A., Hall,
M. 2014. Stock status indicators for fisheries of the eastern Pacific Ocean. SAC-05-11c.
Hoenig, J.M., Gruber, S.H. 1990. Life-history patterns in the elasmobranchs: implications for
fisheries management. In Elasmobranchs as Living Resources: Advances in the Biology,
Ecology, Systematics, and the Status of the Fisheries (eds. Pratt Jr., H.L., Gruber, S.H.,
Taniuchi, T.). NOAA Tech Report 90.
Holts, D.B., Bedford, D.W. 1993. Horizontal and vertical movements of the shortfin mako shark,
Isurus oxyrinchus, in the Southern California Bight. Marine and Freshwater Research, 44(6),
901-909.
Joung, S.J., Hsu, H.H. 2005. Reproduction and embryonic development of the shortfin mako,
Isurus oxyrinchus Rafinesque, 1810, in the northwestern Pacific. Zoological Studies-Taipei-,
44(4), 487.
7/29/15 SHARKWG
20
Kai, M., Shiozaki, K., Ohshimo, S., Yokawa, K. 2015a. Growth and spatiotemporal distribution
of juvenile shortfin mako (Isurus oxyrinchus) in the western and central North pacific.
Marine and Freshwater Research, http://dx.doi.org/10.1071/MF14316
Kai, M., Shiozaki, K., Ohshimo, S., Yokawa, K., Takahashi, N., Kanaiwa, M. 2015b. CPUE and
catch of shortfin mako caught by Japanese shallow-set longliner in the western North Pacific
ISC/15/SHARKWG-1/02.
Kinney, M.J., Wells, R.J.D., Kohin, S. 2014. Oxytetracycline age validation of an adult shortfin
mako shark after six years at liberty. ISC/14/SHARKWG-3/06.
Lee, H.H., Piner, K., Teo, S., Kohin, S. 2014. Standardized catch rates of shortfin mako shark in
the U.S. West Coast drift gillnet fishery. ISC/14/SHARKWG-3/09.
Lee, H.H., Carvalho, F., Piner, K. 2015. Simulation testing of stock indicators
ISC/15/SHARKWG-1/06.
Michaud A., Hyde, J., Kohin, S., Vetter, R. 2011. Mitochondrial DNA sequence data reveals
barriers to dispersal in the highly migratory shortfin mako shark (Isurus oxyrinchus).
ISC/11/SHARKWG-2/03
Mollet, H.F., Cliff, G., Pratt, H.L., Stevens, J.D. 2000. Reproductive biology of the female
shortfin mako, Isurus oxyrinchus Rafinesque, 1810, with comments on the embryonic
development of lamnoids. Fishery Bulletin 98(2), 299-318.
Musyl, M.K., Brill, R.W., Curran, D.S., Fragoso, N.M., McNaughton, L.M., Nielsen, A.,
Kikkawa, B.S., Moyes C.D. 2011. Postrelease survival, vertical and horizontal movements,
and thermal habitats of five species of pelagic sharks in the central Pacific Ocean. Fishery
Bulletin, 109(4), 341-368.
Ohshimo, S., Fujinami, Y., Shiozaki, K., Kai, M., Semba, Y., Katsumata, N., Ochi, D.,
Matsunaga, H., Minami, H., Yokawa, K. 2014. Distribution, body length and abundance of
blue shark and shortfin mako shark in the Northwestern Pacific Ocean based on longline
research vessels from 2000 to 2014. ISC/14/SHARKWG-3/04.
Porch, C.E., Eklund, A.M., Scott, G.P. 2007. A catch-free stock assessment model with
application to goliath grouper (Epinephelus itajara) off southern Florida. Fish. Bull. 104: 89-
101.
Runcie, R., Xu, Y., Wraith, J., Kohin, S. 2014. Standardized abundance index of juvenile
shortfin mako shark (Isurus oxyrinchus) based on a fishery-independent survey in the
Southern California Bight (1994-2013). ISC/14/SHARKWG-3/08.
Semba, Y., Aoki, I., Yokawa, K. 2011. Size at maturity and reproductive traits of shortfin mako,
Isurus oxyrinchus, in the western and central North Pacific. Marine and Freshwater Research,
62(1), 20-29.
7/29/15 SHARKWG
21
Semba, Y., Yokawa, K. 2011. Preliminary analysis of sex-specific distributional pattern of
shortfin mako, Isurus oxyrinchus, in the western and central North Pacific.
ISC/11/SHARKWG-1/01.
Sepulveda, C.A., Kohin, S., Chan, C., Vetter, R., Graham, J.B. 2004. Movement patterns, depth
preferences, and stomach temperatures of free-swimming juvenile mako sharks, Isurus
oxyrinchus, in the Southern California Bight. Marine Biology, 145(1), 191-199.
Sippel, T., Wraith, J., Kohin, S., Taylor, V., Holdsworth, J., Taguchi, M., Matsunaga, H.,
Yokawa, K. 2011. A summary of blue shark (Prionace glauca) and shortfin mako shark
(Isurus oxyrinchus) tagging data available from the North and Southwest Pacific Ocean.
ISC/11/SHARKWG-2/04.
Sippel, T., Carvalho, F., Teo, S.L.H., Kohin, S. 2014a. Catches of mako sharks from U.S.
commercial and recreational fisheries in the North Pacific Ocean. ISC/14/SHARKWG-3/03.
Sippel, T., Nasby-Lucas, N., Kohin, S., 2014b. Description of the Hawaii longline observer
program. ISC/14/SHARKWG-3/1.
Sippel, T., Ohshimo, S., Yokawa, K., Kai, M., Carvalho, F., Liu, K.M., Castillo-Géniz, L.,
Kohin, S., 2015. Spatial and temporal patterns of shortfin mako shark size and sex in the
North Pacific Ocean. ISC/15/SHARKWG-1/04.
Smith, S.E., Au, D.W., Show, C. 1998. Intrinsic rebound potentials of 26 species of Pacific
Sharks. Mar. Fresh. Res. 49: 663-678.
Sosa-Nishizaki, O., Saldaña-Ruiz, L.E., Corro-Espinosa, D., Tovar-Ávila, J., Castillo-Géniz,
J.L., Santana-Hernández, H., Márquez-Farías, J.F. 2014. Estimations of the shortfin mako
shark (Isurus oxyrinchus) catches by Mexican Pacific fisheries (1976-2013).
ISC/14/SHARKWG-3/17.
Stevens, J.D., Bradford, R.W., West, G.J. 2010. Satellite tagging of blue sharks (Prionace
glauca) and other pelagic sharks off eastern Australia: depth behaviour, temperature
experience and movements. Marine Biology, 157(3), 575-591.
Taguchi, M., Ohshimo, S., Yokawa, K. 2015. Genetic stock structure of shortfin mako (Isurus
oxyrinchus) in the Pacific Ocean. ISC/15/SHARKWG-1/05.
Trenkel, V.M. 2008. A two-stage biomass random effects model for stock assessment without
catches: what can be estimated using only biomass indices? Can. J. Fish. Aquat. Sci. 65:
1024-1035.
Tsai, W.P., Liu, K.M. 2014. CPUE standardization and catch estimate of shortfin mako shark by
Taiwanese large-scale tuna longline fishery in the North Pacific Ocean. ISC/14/SHARKWG-
3/11.
7/29/15 SHARKWG
22
Tsai, W.P., Liu, K.M. 2015. Revised standardized catch rates and catch estimate of shortfin
mako shark by Taiwanese large-scale tuna longline fishery in the North Pacific Ocean.
ISC/15/SHARKWG-1/07.
Urbisci, L., Sippel, T., Teo, S., Piner, K., Kohin S. 2013. Size composition and spatial
distribution of shortfin mako sharks by size and sex in U.S. West Coast fisheries.
ISC/13/SHARKWG-3/01.
Vetter, R., Kohin, S., Preti, A. McClatchie, S., Dewar, H. 2008. Predatory interactions and niche
overlap between mako shark, Isurus oxyrinchus, and jumbo squid, Dosidicus gigas, in the
California Current. Calif Coop Ocean Fish Invest Rep, 49, 142-156.
Wells, R.J., Smith, S.E., Kohin, S., Freund, E., Spear, N., Ramon, D.A. 2013. Age validation of
juvenile shortfin mako (Isurus oxyrinchus) tagged and marked with oxytetracycline off
southern California. Fishery Bulletin 111(2), 147-160.
Yokawa, K., Kai, M., Shiozaki, K., Ohshimo, S. 2014. Blue shark catch and effort data collected
by Japanese research and training vessels. ISC/14/SHARKWG-1/03.
7/29/15 SHARKWG
23
TABLES
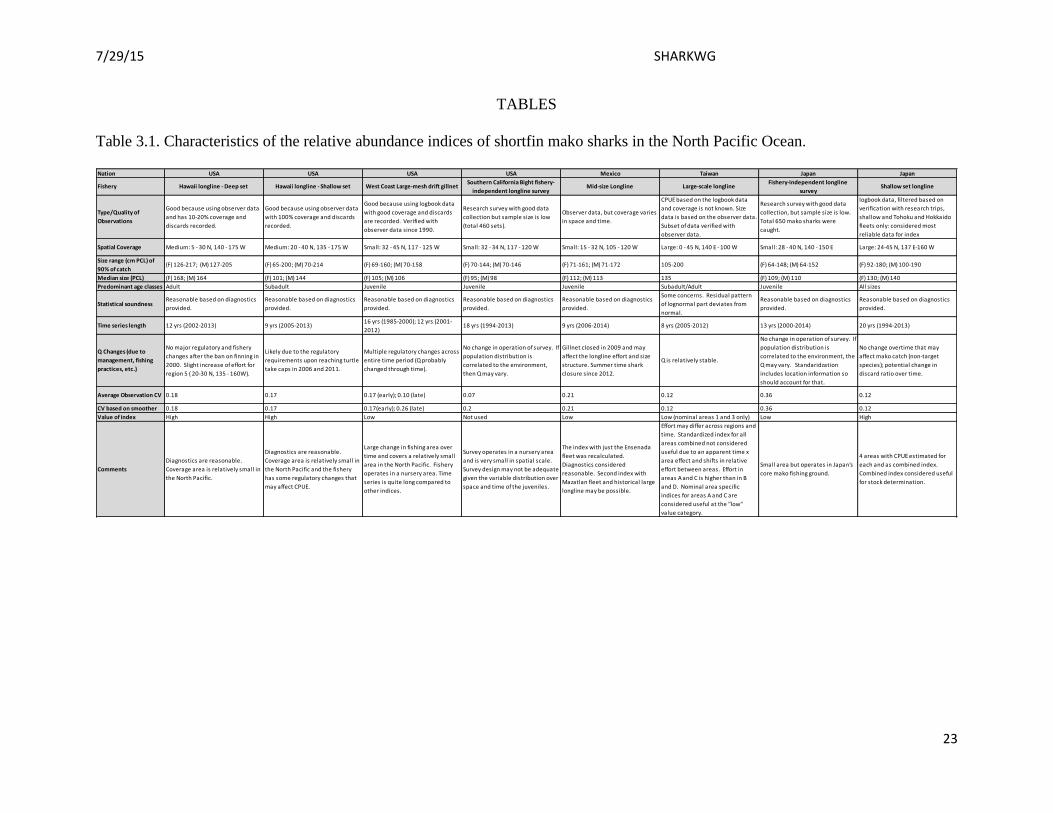
Table 3.1. Characteristics of the relative abundance indices of shortfin mako sharks in the North Pacific Ocean.
Nation USA USA USA USA Mexico Taiwan Japan Japan
Fishery Hawaii longline - Deep set Hawaii longline - Shallow set West Coast Large-mesh drift gillnetSouthern California Bight fishery-
independent longline surveyMid-size Longline Large-scale longline
Fishery-independent longline
surveyShallow set longline
Type/Quality of
Observations
Good because using observer data
and has 10-20% coverage and
discards recorded.
Good because using observer data
with 100% coverage and discards
recorded.
Good because using logbook data
with good coverage and discards
are recorded. Verified with
observer data since 1990.
Research survey with good data
collection but sample size is low
(total 460 sets).
Observer data, but coverage varies
in space and time.
CPUE based on the logbook data
and coverage is not known. Size
data is based on the observer data.
Subset of data verified with
observer data.
Research survey with good data
collection, but sample size is low.
Total 650 mako sharks were
caught.
logbook data, filtered based on
verification with research trips,
shallow and Tohoku and Hokkaido
fleets only: considered most
reliable data for index
Spatial Coverage Medium: 5 - 30 N, 140 - 175 W Medium: 20 - 40 N, 135 - 175 W Small: 32 - 45 N, 117 - 125 W Small: 32 - 34 N, 117 - 120 W Small: 15 - 32 N, 105 - 120 W Large: 0 - 45 N, 140 E - 100 W Small: 28 - 40 N, 140 - 150 E Large: 24-45 N, 137 E-160 W
Size range (cm PCL) of
90% of catch(F) 126-217; (M) 127-205 (F) 65-200; (M) 70-214 (F) 69-160; (M) 70-158 (F) 70-144; (M) 70-146 (F) 71-161; (M) 71-172 105-200 (F) 64-148; (M) 64-152 (F) 92-180; (M) 100-190
Median size (PCL) (F) 168; (M) 164 (F) 101; (M) 144 (F) 105; (M) 106 (F) 95; (M) 98 (F) 112; (M) 113 135 (F) 109; (M) 110 (F) 130; (M) 140
Predominant age classes Adult Subadult Juvenile Juvenile Juvenile Subadult/Adult Juvenile All sizes
Statistical soundnessReasonable based on diagnostics
provided.
Reasonable based on diagnostics
provided.
Reasonable based on diagnostics
provided.
Reasonable based on diagnostics
provided.
Reasonable based on diagnostics
provided.
Some concerns. Residual pattern
of lognormal part deviates from
normal.
Reasonable based on diagnostics
provided.
Reasonable based on diagnostics
provided.
Time series length 12 yrs (2002-2013) 9 yrs (2005-2013)16 yrs (1985-2000); 12 yrs (2001-
2012)18 yrs (1994-2013) 9 yrs (2006-2014) 8 yrs (2005-2012) 13 yrs (2000-2014) 20 yrs (1994-2013)
Q Changes (due to
management, fishing
practices, etc.)
No major regulatory and fishery
changes after the ban on finning in
2000. Slight increase of effort for
region 5 ( 20-30 N, 135 - 160W).
Likely due to the regulatory
requirements upon reaching turtle
take caps in 2006 and 2011.
Multiple regulatory changes across
entire time period (Q probably
changed through time).
No change in operation of survey. If
population distribution is
correlated to the environment,
then Q may vary.
Gillnet closed in 2009 and may
affect the longline effort and size
structure. Summer time shark
closure since 2012.
Q is relatively stable.
No change in operation of survey. If
population distribution is
correlated to the environment, the
Q may vary. Standaridzation
includes location information so
should account for that.
No change overtime that may
affect mako catch (non-target
species); potential change in
discard ratio over time.
Average Observation CV 0.18 0.17 0.17 (early); 0.10 (late) 0.07 0.21 0.12 0.36 0.12
CV based on smoother 0.18 0.17 0.17(early); 0.26 (late) 0.2 0.21 0.12 0.36 0.12
Value of index High High Low Not used Low Low (nominal areas 1 and 3 only) Low High
Comments
Diagnostics are reasonable.
Coverage area is relatively small in
the North Pacific.
Diagnostics are reasonable.
Coverage area is relatively small in
the North Pacific and the fishery
has some regulatory changes that
may affect CPUE.
Large change in fishing area over
time and covers a relatively small
area in the North Pacific. Fishery
operates in a nursery area. Time
series is quite long compared to
other indices.
Survey operates in a nursery area
and is very small in spatial scale.
Survey design may not be adequate
given the variable distribution over
space and time of the juveniles.
The index with just the Ensenada
fleet was recalculated.
Diagnostics considered
reasonable. Second index with
Mazatlan fleet and historical large
longline may be possible.
Effort may differ across regions and
time. Standardized index for all
areas combined not considered
useful due to an apparent time x
area effect and shifts in relative
effort between areas. Effort in
areas A and C is higher than in B
and D. Nominal area specific
indices for areas A and C are
considered useful at the "low"
value category.
Small area but operates in Japan's
core mako fishing ground.
4 areas with CPUE estimated for
each and as combined index.
Combined index considered useful
for stock determination.
7/29/15 SHARKWG
24
FIGURES
Figure 3.1. Partial catch estimates of shortfin mako shark for several fleets/nations operating in the North Pacific Ocean. Catch
estimates are not available for some major fisheries including Taiwan small-scale longline, Japan distant-water longline, and China’s
and Korea’s longline fleets. Trends in shortfin mako catch cannot be derived from the data provided given the data are incomplete and
for individual fisheries/nations they may not reflect the entire history of the fishery.
7/29/15 SHARKWG
25
Figure 3.2. Fishing effort by fishery of shortfin mako sharks in the North Pacific Ocean. Units of effort are number of 1,000 hooks and
number of sets for longline fishery and drift gillnet fishery, respectively.
7/29/15 SHARKWG
26
Figure 3.2 continued.
7/29/15 SHARKWG
27
Figure 3.3. Spatial extent of the fisheries for which CPUE time series were developed. Fisheries include Japan shallow-set longline
(Japan SSLL), Japan longline survey (Japan survey), Hawaii-based deep-set longline (Hawaii DSLL), Hawaii-based shallow-set
longline (Hawaii SSLL), Taiwan distant water longline (Taiwan LL), U.S. west coast large-mesh drift gillnet (USA DGN), U.S.
juvenile shark longline survey (US Juvy survey), and Mexico longline (Mexico LL).
7/29/15 SHARKWG
28
Figure 4.1. Proportion of positive sets by fishery of shortfin mako sharks in the North Pacific
Ocean.
29
Figure 4.2. Plots of CPUE by fishery for shortfin mako sharks in the North Pacific Ocean. Indices considered to have the greatest
value in determining stock status are shown with solid lines.
30
Figure 4.3. Sex ratio (proportion of females) by fishery of shortfin mako sharks in the North
Pacific Ocean.
31
Figure 4.4. Boxplots (showing medians, interquartile ranges, 1.5 times the interquartile ranges,
and outliers) of the annual sizes of shortfin mako sharks caught in North Pacific surveys and
fisheries.
32
Figure 4.4 continued.
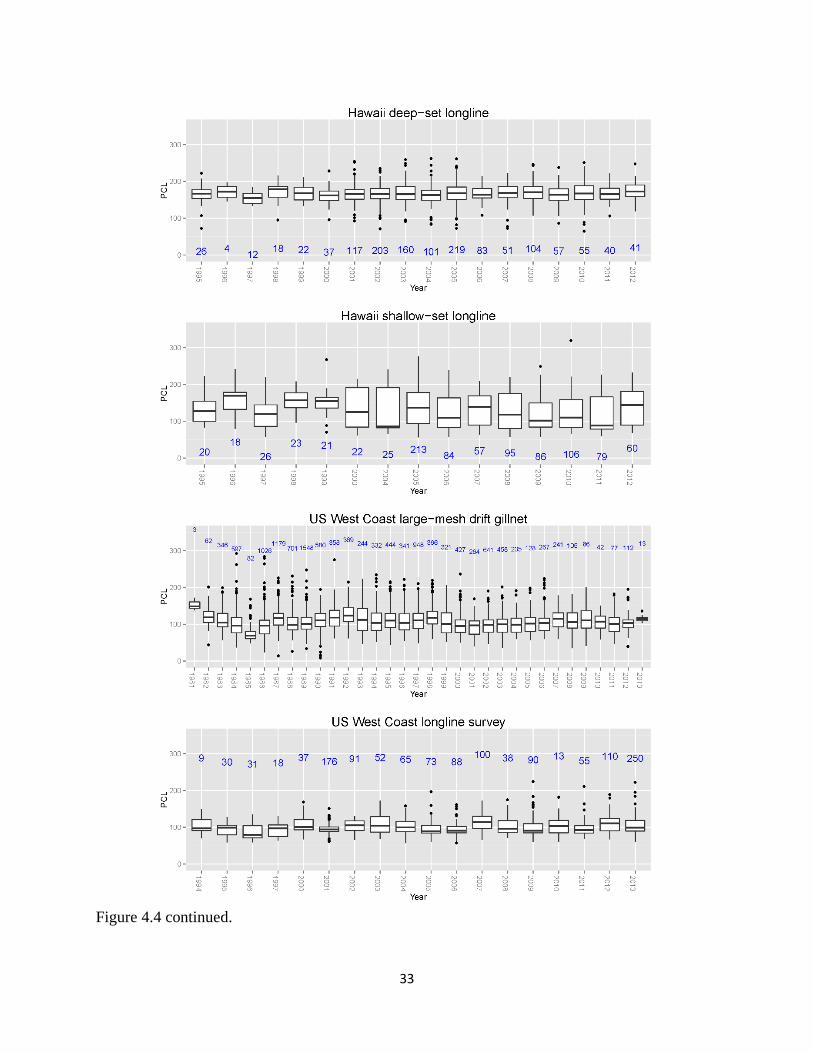
33
Figure 4.4 continued.