Embed Size (px)
Citation preview
WSRC-TR-99-O0373
Scoping Calculations for Potential Groundwater Impacts fromOperation of the APT Facility at SRS
by
J. J. Thibault
Westinghouse Savannah River Company
Savannah River SiteAiken, South Carolina 29808
D. E. Stephenson
J. Roberls
.,,
DOE Contract No. DE-AC09-96SR1 8500
This paper was prepared in connection with work done under the above contract number with the U. S,Department of Energy. By acceptance of this paper, the publisher ancVor recipient acknowledges the U. S.Government’s right to retain a nonexclusive, royalty-free license in and to any copyright covering this paper, alongwith the right to reproduce and to authorize othera to reproduce all or part of the copyrighted paper.
I
.
DISCLAIMER
~S report was prepared as an account of work SPOIISOIK@by UI agency of tie United StatesGovemmenL Neitherthe United States @vqent por IUIYagmcy tiemf, nor any of theiremployees, makes any warranty, express or ~Ph~ or =sumes. any legal liability orresponsibility for th.. accuracy, eompleo==s: or us~ess ?f WY ti~tion, apparatus,product, or- kloti q-m= ~ m uw would not *ge privately owned rights.Reference herein to any sptxafic commercd produc~ process, or s~ce by trade name,~ -~w~, q o~~se d~ not n-s~y COnS@* or IX@y its endorsementrecommendation, or favorxng by the United States Government or any agency ‘thereof. Theviews and opinions of authors expressed herein do not necessarily state or reflect those of theUnited States Government or any agency thereof.
This report has been reproduced directly from the best available copy.
Available to DOE and DOE contractor@om the Office of Scientific and Technical Information, ‘+P.O. Box 62, Oak Ridge, TN 37831; prices available fkom (615) 576-8401.
&iIable to the pubIic from the National TdnkaI Information Stxvice, U.S. Department ofmmercq 5285 Port Royal Ro@ Springfield VA 22161.

DISCLAIMER
Portions of this document may be illegiblein electronic image products. Images areproduced from the best available originaldocument.
SCOPING CALCULATIONS
FOR POTENTIAL GROUNDWATER IMPACTS
FROM OPERATION OF THE
ACCELERATOR PRODUCTION OF TRITIUM (APT) FACILITY
AT SAVANNAH RIVER SITE, SC
.,’
J. J. ThibauhD. E. Stephenson
Site Geotecluicai Services DepartmentWSRC/BSRI L
September 1998
TABLE OF CONTENTS
Abstract . . . . . . . . . . . . . . . . . . . . . . . . . . . . . . . . . . . .. . . . . . . . . . . . . . . . . .. . . . . . . . . . . . . . . . . . . . . . . . . . . . . ... . ... 1
Introduction●
. . . . . . . . . . . .. . .. . . . . . . . . . . . . . . . . . . . . . . . . . .. . . . . . . . . . . . . . . . . . . . . . . . . . . . . . . . . . . . . . . . . .. 1
Hydmgeologic Framework . . . . . . . . . . . .. . . . . . . . . . . . . . . . . . . . . . . .. . . . . . . . . . . . . . . . . . . . . . . . . . .. . . .3
Approach . . . . . . . . . . . . . . . . . . . . . . . .. . .. . . . . . . . . . . . . . . . . . . . .. . . . . . . . . . . . . . . . . . . . . . . .. . . . . .. . . . . .. . . .6
Model . . . . . . . . . . . . . . . . . . . . . . . . . . . . . . . . .. . . . . . . . . . . . . . . . . . . . . . . . . . .. . . . . . . . . . . . . . . . . .. . . . . . . . . . . ...6
Model Calibration . . . . . . . . . . . . . . . . . . . . . . . .. . .. . . . . . . . . . . . . . . . . .. . . . . . . . . . . . . . . . . . . . .. . . . . .. . . . . .7
ResultsFlow . . .. . . . . . . . . . . .. . . . . . . . . . . . . . . . . . . . . . . . . . .. . . . . . . . . . . . . . . . . .. . . . . . . . . . . . . . .. . . . . .. . . .9Transport . . . . . . . . . . . . . . . . . . . . .. . . . . . . . .. . . . . . . . . . . . . . . . . . . . .. . . . . . . . . . . . . . .. . .. . ...”.... 12
Conclusions . . . . . . . . . . . . . . . . . . . . . . . . . . .. . .. . . . . . . . . . . . . . . . . .. . . . . .. . . . . . . . . . . . . . . . . . . . . . . . . . . . . . 19 ~
References . . . . . .. . .. . . . . . . . . . . . . . . . . . . . . . . . . . .. . . . . . . . . . . . . . . . . . . . . . . . . . . . . . . . . . . . . . . . . . . . .. . ...20
Appendix . . . . . . . . . . . . . . . . . .. . . . . . . . . . . . . . . . . . . . .. . . . . .. . . . . . . . . . . . . . . . . . . . . . . . . . .. . . . . .. . . . . . . . .21
LIST OF TABLES.,.
I. Initial estimates of aquifer properties assigned to numerical model .. . . . . . . ...7
II. Calibration statistics for target residuals . . .. . . . . . . . . . . . . . . . . .. . . . . . . . . . . . . . . . . . . . ..8
III. Initial and calibration hydraulic conductivity for the flow model . . . . . .. . . . . ...9
LIST OF FIGURES
1
2
3
4
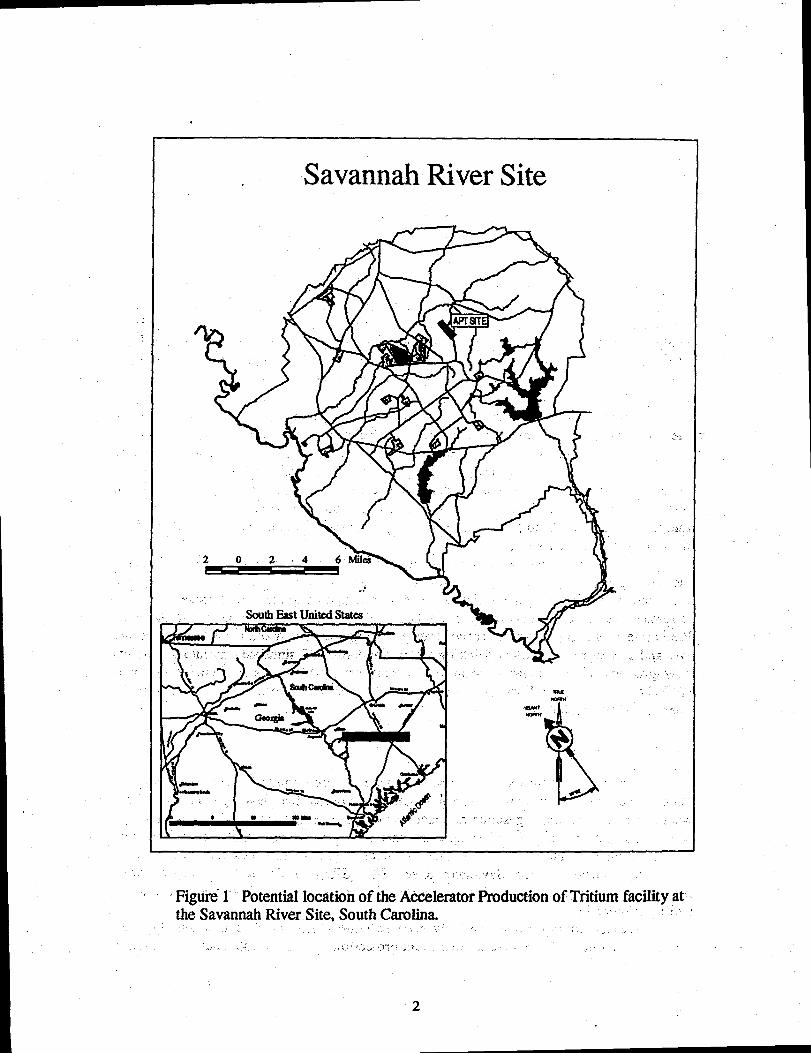
Potential location of the Accelerator Production of Tntium facility at theSavannah River Site, South Carolina . . ... . . . . . . . . . . . . . . . . . . . .. . . . . . . . . . . . . . . . . . . . .. . . . . .2
Geologic section of the watertable aquifer at the APT site based on a modelof the fkiction ratio as determined using the cone penetrometer .... . . . . . . . . . . .. . . . . ..5
Geologic map of the McQueen Branch-Mill Creek Divide (Prowell 1996) .. . . . ...5
Measured head versus model calculated head for calibration targets . . . . . . . . . . . . ...8
LIST OF FIGURES (Continued)
5 Upper Three Runs simulated water table and flow paths . . . . . . . . . . . . . . . . . . . . . . . . . . . 10
6 .Gordon Aquifer simulated potentiometric map and flow paths . . . . . . . . . . . . . . . . . .... 11
7 Tritium concentrations at modeled monitoring wells . . . . . .. . .. . . . . .. . . . . . . . . . . . . . ... 13
8 East-west profile through the target blanket building showing simulated tritiumactivation after 40 years of operation . . . . . . . . .. . . . . . . . . . . . . . . . . . . . . . . . . . . . . . . . . . . .. . ... 14
9 East-west pr&le 732 meters north of the target building showing simulatedtritium activation after 40 years of operation .. . . . . . . . . . . .. . . . . . . . . . . . . . . . . . . . . . . . . . ..15,
.10a,b Simulated extent of future tritium activation after 40 years of operation
11
12
based on an activation source of 1.56e+4 pCi/1, Upper Three Runs Aquifer,Gordon Cotilning Unit . . . . . . . . . . . . . . . . . . . . . . . . . . . . . . . . . . . .. . . . . .. . .. . .. . . . . . . . . . . .. 16
Simulated extent of future tritium activation after 40 years of operation basedonanactivation source of 1.56e+4pCi/1, Gordon Aquifer . . . . . .. . . . . . . . . . . . . . . . ...17 ;
Simulated extent of future tritium activation after 40 years of operationbased on ~ ,increased activation source of 2.0e+5 pCi/1 . . . . . .. . . . . . . . . . . . . . . . . . . . ..!!:.
,.!,
,.-.
,j ,.
“.
..’
.. . ‘
,.
ABSTRACT
The McQueen Branch-Mill Creek Divide has been designated
q?-au3 73
as the preferredpotential location for the proposed Accelerator Production of T;itium (APT) facility atthe Savannah River Site (SRS), South Carolina. This area is underlain ~y approximately91.4 m (300 R) of Tertiary age unconsolidated saqd, clay, and calcareous deposits, whichcomprise two aquifers and two aquitards. A three-dimensional, steady state, numericalmodel representing the Tertiary aquifer system was constructed to predict potential traveltimes and paths of the activation products in the groundwater.
The numerical model encompasses an area of approximately 30.3 km2 (1 1.7 mi2).The model has a uniform (61 m by 61 m (200 ft by 200 ft)), block centered finitedifference grid which consists of 100 rows, 82 columns, and 3 layers. The model wascalibrated to target values defined for 39 wells in the model area, based on visual andstatistical evaluations of simulatid and measured heads. Calibrated aquifer propertieswere in close agreement with those reported in the existing literature for thehydrogeologic units simulated.
Based on water budget analysis, inflow to the system is primarily via recharge tothe surtlcial aquwer, while ground-water discharge is to Ttier Creek the primaryground-water sink. Particle tracking analysis indicates that non-reactive particles releasedto the water table in the vic~ity of the proposed APT facility generally flow to thenorthwest and discharge to Tinker Creek Based on particle tracking, the travel time forparticle transport from source to surface discharge ranges from 80 to 175 years. This
~range is necessary due to the uncertainties of the numerical representation resulting fromthe limited dam available.
Additional modeling was performed to evaluate the fate and transport of tritium in -the groundwater produced by activation beneath the target bkmket building at the
-proposed ~. Tritium generation was represented as a continuous unit recharge source(approximated to be 1~:000 pCi/Vyr) appfi~ to the.water table for a period-of_@ years.‘Predictive modeling using ‘advective. transport” suggests that. “titium concentrations arelow and should remain.below drinkhig water standards at 3.simtilated monitoring points
... .
downgradient of the activation source. The transport modeling ~ults indicate that it isunlikely that tritium will be discharged to nearby surface streams within the 40 year‘operatioml life of the APT. . ..=’
,..
INTRODUCTION
The U.S. Department of Energy made a programmatic decision that the‘maintenance of the current weapons stockpiIe’ xequixes ‘“the development of a“ newweapons grade tritium, a gaseous radioactive isotope of hydrogen, production, source. Itwas stated that this action will ensure that this production source will present the leastpossible impact to the environment. The McQueen Branch-Mill Creek Divide located kthe central portion of the Savannah River Site (SRS) in South Carolina has beendesignated as the prefe~ potential location, for ,the @ele@or. Production Of Tritiumfacility (Figure 1). ,:‘k ,..
Because tritium has a relatively brief half-life (12.3 years), a new supply mustbecome. available by 2006- based on current pro~tions - to ensure that national defense
1
.-
SavannahRiver Site
n :“:MY -
.,’
.’ ..”.LJ$
,.,.
‘Vi ~ “ ‘“”““, southEastUr.lkdstates -’% 4-- “’Nolhcdln<t -i%
...!
w “;’<2’,..,.,,..,
%i?
1? ~ 2-* I - ~~~~~-’
~,., ,; ,, ‘1.F:, ‘“P4
It* I ● .
\ w- 1
; ‘Flguie’1 Potential location of the Aixelerator Production of Tritium facility atthe Savannah River Site, South Carolina.
.,, ,,, ,. ,,. . ..,. ... .{’.”>-...,.”:T’’!.. ,. .,, ‘., ,.-:
2
(2.&&- 7+qye O(J3 q=J
needs Me met. Several alternatives for the production of tritium have been explored,including construction of a New Production Reactor (NPR) at SRS. The NPR, initiallythe technology of choice, later was canceled.
Production of tritium in sufficient quantities can be accomplished only throughneutron capture by a stable isoto~, such as helium-3 (He-3) or lithium-6 (Li-6). In anaccelerator, these neutrons are produced fkom the high-speed collision of protons withheavy-metal nucle~ such as tungsten.
To produce tritium, the APT would use a high-powered linear accelerator togenerate neutrons. The neutrons would be therrnalized and captured by Helium-3 to yieldtritium, which would be separated and purifkd to yield weapons grade material.
As required by the DOE, the APT is designed to safely produce sufficientquantities of tritium to meet national defense needs. The performance criteria for the APTis to (1) produce up to 3 kilograms of tritium annuallfi (2) have an operational lifetime of40 years; (3) minimize public and worker exposure to radiologica~ nonradiologica~toxic, and other hazardous materials and conditions according to DOE and otherregulatory requirements; (4) meet DOE security-and-safeguards standards foraccountabilityy of tritium; and (5) reduce capital and operating costs with minimumtechrical risk.
The purpose of this study was to determine the potential travel thqes and paths ofthe postulated activated groundwater beneath the facility and to examine the fate andtransport of this activated groundwater. The study consisted of two phases; the fwst wasto model the flow to determine velocity, travel times, and possible flow paths within theexisting ground-water system. The second phase was to perform transport modeling toestimate tritium conaintration at downgradient boundaries to provide estimates of thepotential exposure to the environment during 40 years of operation estimated for the APTfacility.
J., :.’ ,,:
HYDROGEOLOGIC FRAMEWORK ‘.... ~ ., :.. ,,,.. . . . ... . .. :,.
~~w- The study area is located within the SRS in the updip portion of: the Atlantic......
“Coastal Plain,’ approxiinately 32.2 km (20 miles) southeast of the Fill Line. The SRS-isunderlain by a southeast thickening wedge of unconsolidated to poorly consolidated LateCretaceus and Tertiary sand, clay, and calcareous sediments+ w~ch are from 198.1 m‘(650 ft) to 426.7 m (1400 ft) thick (Fallaw (1995)). Deposition occurred during a series oftransgressions and regressions, and depositional environments ranged from fluvial tomarine and shallow marine. The Upper Cretaceus sediments nonconformably overliePaleozoic igneow’ and metamorphic basement rocks and Triassic red beds. ~
: L~”‘This investigation fbcuses on the shallow hydrogeologic system comprised of theTertiary sedimentk; as these shallow aquifers are more likely to be impacted by sitedeWopment “thanthe deeper aquifers. L&ally tha Sedimenti’are approximately 91.4 m(300 ft) thick and dip to the southeast at 3.41 m/km (18 ft/mile). This system is dividedinto two aquifer units and two confining units on the basis of lithology and hydrauliccharacteristics.
The stratigraphy used in this study is modilled horn that of Fallaw and I?rke(1995) and the hydrostratigraphy is taken from Aadland et. al. (1995). mehydrostratigraphic units are, fkom shallowest to deepest, the Upper Three Runs Aquifer
3
‘\ .t . \s.j.- -. ‘;.- ,
(UTRA), the Gordon Confining Unit (GCU), the Gordon Aquifer (GA), and the CrouchBranch Confining Unit (CBCU).
The UTRA is the primary water table aquifer at the study area and consists ofmedium to coarse, muddy quartz sands with few thin clay laminae present throughout theformation. The-hydraulic conductivity measured from pumping tests and slug te$s rangesfrom 1.22 to 3.96 rrdday (4 to 13 IVday). The average depth to the water table is 16.8 m(55 R). Recharge to this unit is primarily via infiltration of rainwater at the surface and isestimated by a separate study to be approximately 0.15 m/yT(6 in/yr) (Aadland 1995).
The (3CU serves to fidly confine the GA and is laterally continuous across thestudy area. At the core of this unit is a low permeability “green clay” unit. This, claysection comprises approximately 1.8 m (6 R) of the GCU while the entire thicknessaverages 6.1 m (20 ft) across the model area. Based on laboratory core analyses of theGCU, the average effective vertical hydraulic conductivity is 3.96e-5 m/day (1.3e-4ft/day). .,-
The GA is the primary water-bearing unit within the Tertiary section and iscomposed of approximately 24.38 m (80 ft) of clean, medium- to coarse-grained,moderately- to well-sorted quartz sand. The average hydraulic conductivity of this unit issignificantly greater than that of the overlying aquifer, and is estimated to be 9.14 m/day(30 ftlday) from pumping test results. In genera~ the unit is fully confined across thestudy area, except where it.has been incised by Tinker Creek along the northern boundaryof the Divide. .
The CBCU forms the base of the Tertiary hydrologic system and is assumed to beimpeqneable for modeling purposes. This unit @approximately 25.91 m (85 ft) thick andis composed of thick clays and clayey sands. The natural vertical gradient across this unitis very low, 0.11 to 0.05 measured across the model area. , ..
The depth to the water table surface averages 12 m (39.4 ft) below the”ghundsurface at the south end of the propbsed facility to about 18 m (59.1 fi) at the northernend. The water table aquifer discharges into Tinker Cqk to the now of. the @e and, tothe northeast to a tributary of Tinker CmelG Mill Creek. The movement of the groundwater within tie water .@b&aquifer”@ridsto follow the surface tomography to,the nearby
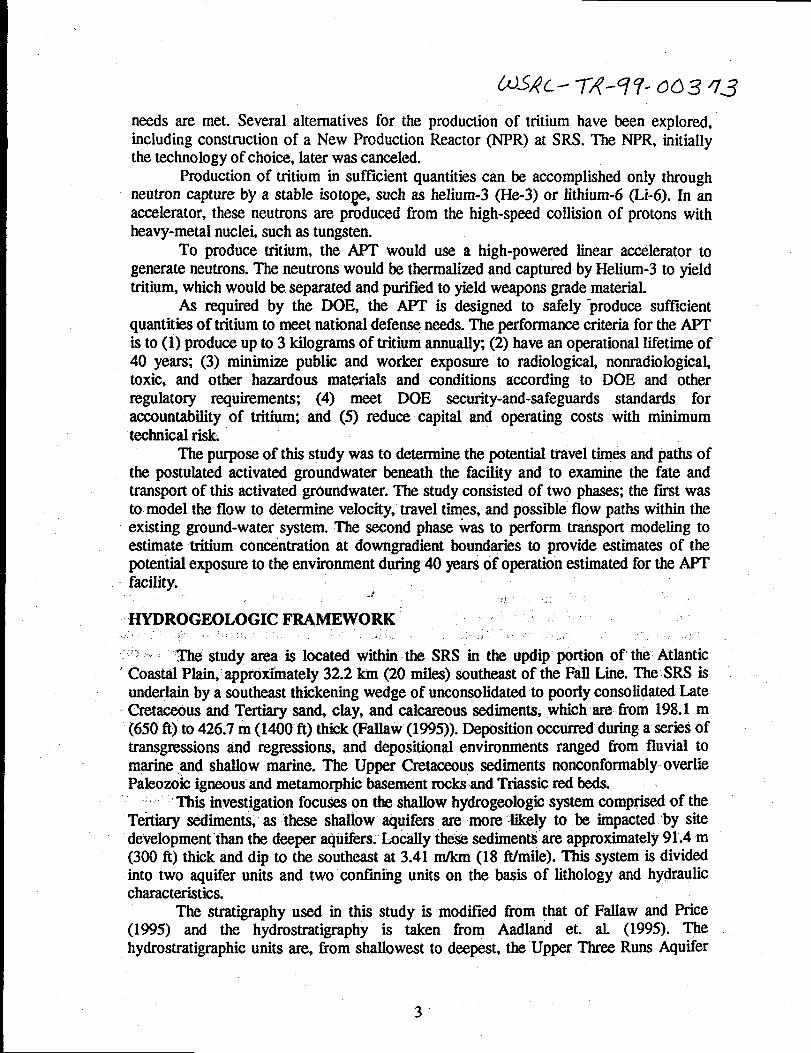
~”surface streams. The heteroge~us nature of tie water @b~ aquifer (Figm 2) affkcts thelocal movement of the groundwater. ~. --- ~ .. .
.,’. . A profient downward gradient results in the water wjthiq the upper most aquifer..mo-vingdown intQ the fmt confiied aqutier through the upper confining unit.. Below theproposed facility the groundwater flow within the GA the f~st confined aquifer, is
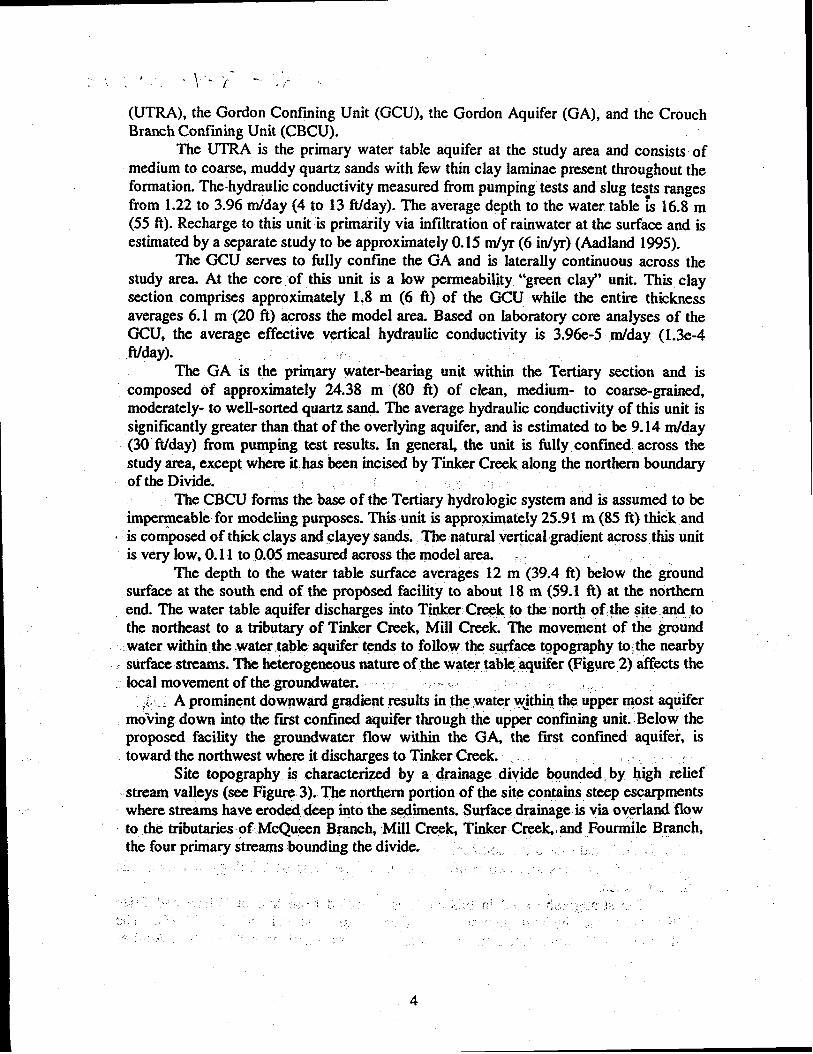
... toward the northwest where it discharges to Tinker Creek. . ~ TSite topography is characterized .by a drainage divide @unded, by, high relief
. stream valleys (see Figu~ 3). The northern portion of the site contains, steep escarpmentswhere stieams have erod~,deep iqto the .se@ments. Surface drainage is via overland flowto the tributaries of .McQu~n Branch, Mill Crec~ Tinker Creek, and Fourrnile Branch,the four primary streams bounding the divide. ~ ~,,. , ... ;..,,. ,:..’ ::, . ,., ,..
... .. .,.i,.;,, .,,,. .,, ‘-.”;.~i; , .. <,..,2.;~’ ..”. /...... . . ... .:. ”.: ,’,
“. -.. ,> ~ ,,. , ~! ..,.,’ ,., r, ... . ..-
4
,./.‘4’-----
-!-1ml --
50,-
7Q’.-
4c––
,’”. ..,,..
...,,.
-—....,~.,.. ..
I
I
Figure 2’ Geologic section of the water table aquifer at the APT Site based on a model ofthe fridtion ratio as determined using the cone penetrometer. I@tio valu”ixibetween 3 and10 are shown.”Generally speaking lighter colors and greater ratio values indicate higher
‘fines content. Existing wells lcicated Within the APT footprint are also visible.. ......‘...> .<?” <, .,,.
‘.’:,. . . . . ,., f:..
. .
.,’”.
,.
,; ‘...
-.
,.
>-
Figure 3 Geologic map of the MeQueen Branch-Mill Creek Divide (ProweIl 1996).
5
APPROACH
The primary objective of this study was to predict the direction of and potentialtritium concentration levels at postulated down grad~nt compliance points fromactivation of the groundwater below the T&get Blanket Building. These modeling resultswould then provide guidance as to the potential for impact to the environment due to the
●
operation of the facility.The modeling approach for the APT consisted of using the flow paths determined
from flow modeliig to locate postulated compliance points and then perform transportcalculations to model concentrations from facilit y operations.
Based on engineering design parameters, it was assumed that the tritium loadingof the groundwater due. to activation would amount to 10,000 pCi/1/yr over an area 20 m(65 ft) in diameter and approximately 0.5 m (1.5 ft) in depth (J. England, PersonalCommunication).’ It was “also assumed that the base of the target blanket building wasbelow the surface of the water table. This will result in a total activity of 1.57x10⁹ pCi/yrin the groundwater below the facility.
Steady-state numerical simulations of the ground-water flow were performedusing Groundwater Vistas (Rumbaugh (1995) and the U. S. Geological SurveyMODFLOW code (McDonald and Harbaugh (1988))) to evaluate flow directions andvelocities. Particle tracking (U. S. Geological Survey MODPATH code) was alsoperformed to predict travel times and directions associated with advective.transport.
The threedimensional finite difference code MODFLO~ (Duffield et a~,l.~7)‘was used in the contaminant transport analysis of this study. ~,e flow portion of thecontaminant transport modeling was reproduced using the input parameters andcalibration horn the flow analysis phase of this study (Thibault and Stephenson 1998).
In: order to examine the potent@ ‘&itiurn tion~ntrations in whit might beconsidered the wont c@e~-steady#e tiiiiditi~.~ wer&.asstim&deven though,a transientstate e*@. The tritium,..loading w~”assurn#ito~~maiy constaqtjorger~thci~~ear life of:“‘;.:;~+-,the fa$ity. .,;’ i~~ ~:,. ,“: ““’.:-~<’<.<:..~.:~$~?$g$~~$$;~~. ‘%-~i.~~~~$~~~~%,..:~~~;?
,!:..:.... ./:>.*+, .. ..-”*A ,.... ““cc<.*X.; -2s,>;,,.,y?f:,;.~,;,$:.,,:”?.‘Jy,,....?. ,..,;.. ~:,:Z%:”:<’.*::%%p?~a:.~:$iv;~;‘:%‘“?,,:y.,+;~~‘ . . . -.;...:..$%-,::. :,:>!:.,~:.*.=:+,;>,,%<;;.*MOD= ..[ .:.:-,,.,‘:’”>‘.,:;~:’:i::~’,:::”’:’:,;,::;: ;<.,..,,” ,:, :Y:.,:.,7:,,, ; ,.”;,’-’’:=:L@,.‘,f’
... .. . .~f...,T:4 .:. .,-:.,,,. .,.. .-. .:~”...+>7:..,. . ..>, :. ..2 ~,:...:,’,. ;-,... ,, ...,::,:l,?-.... ., ..... ~ .. T,:~.
;;;j:~e rnodehir&@ii &;iO&i&i&&$Ok qf.+e .@?&..~ sho$,i@ .Fi&~S 5 and6.”A udiioim “61m by ’’61-m ‘(20$)ft by 200 ft), bl&k’tit~@:u%~te”’d&emnee’ grid wasoriented to account for the”geome~ of the,- The model grid consists of 100 rows and82 columns covering .an areaof.approxitqately 30,3 km2.(<1,1.7.mi2)0Three layers wereused h” repres@ the.~pper, 2&e6=Runs. @@eri the’~o~on “~o$@~~’ Unit, and theGo~on Aquifer, model lajerk 1~2~‘fid 3-resx@yely.~e model structu~ w~.designedto be as simplified &:$p”&ible~ $e;- .n$@n sufflcierit ,de@ “’to’provide. meaningfulestiniations. ‘;-
.(y,;+z,.?jL<5..~ ,..~~.;:+’.ff:;..,+:;;;.$:$;..-“‘,‘;:=;.,+~~“ ;:-/. .~.~fi.4.(---,,.,.-..,.,:.,,...:..-.;:.::..“.,..:,,,.%!,. .......,+....+ ... .:.~..”... ..... “ .&>-r,:,;.~:’ *3:.>$,:,>.-y,-,.me top’”of thq h&~~gic-.syst~rn:~~~p~rit@ by.t@;.water @ble,”which is
contained almost entir@jwit@i @odel:la~~r,,,l ? ex~pt w~~~:,it ti:Al@n, :prnOV~ by
erosion in the stm’ti: cha~~.’” ~~:,,late@. ‘extent o.f tie wat@r~.tabl@?@,lafer 1 wasdetermina fiorn” -a @$onalf:wat&, tabld ‘&p ~&@e+u@i?@iiige&ll (19%)). Thiiboundary is repres&ted ~ @e ‘no@ ha~ of the ‘model~kg ‘@@tit”he~, cells. In thesouthern poition of the’“model’and’ whe~ seasonal str6arhs inter& the’ water table,
,
surface drain cells representing the streams and tributaries are used to bound the system.Drain node elevations were specit%d using surface elevations horn U. S. GeologicalSurvey 7.5-minute quadrangle maps. A small segment of the western and southernhundaries between Fourmile Branch and the head waters of McQueen Branch and MillCreek was defw@ as a no flow boundary, as were the lateral bounds of the GordonConfining Unit and the base of the Gordon Aquifer. The Gordon Ac@er was boundedlaterally using constant head cells to represent the potentiometric surface, as determinedfrom a regional potentiometric map for the Gordon Aquifer (Aadland (1995)). ~approach was necessary due to the lack of site spedlc potentiometric data available forthe Gordon Aquifer.
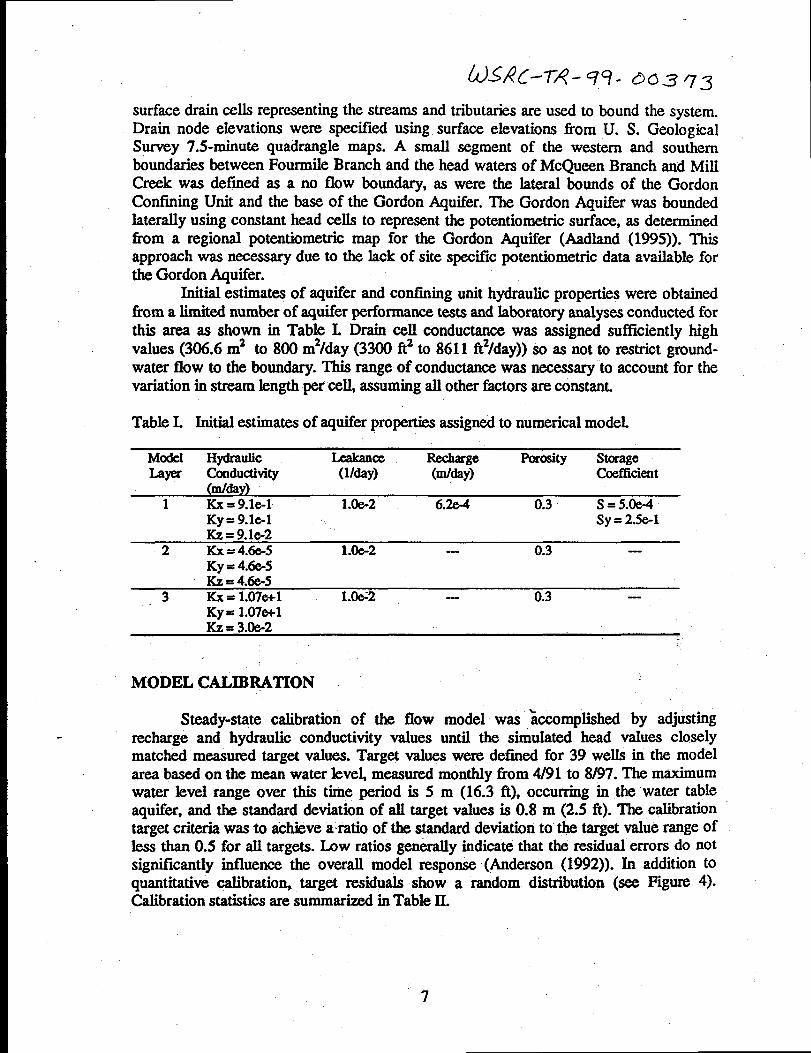
Initial estimates of aquifer and confining unit hydraulic properties were obtainedfrom a limited number of aquifer performance tests and laboratory analyses conducted forthis area as shown in Table I. Drain cell conductance was assigned sufficiently highvalues (306.6 m2 to 800 m2/day (3300 ft2 to 8611 ft2/day)) so as not to restrict ground-water flow to the boundary. This range of conductance was necessary ‘to account for thevariation in stream length per ceu assuming all other factors are constant.
TabIe I. Initial estimates of aquifer properties assigned to numerical modeL
Model Hydraulic Leakarm Recharge Porosity StorageLayer (hnductivity (l/&y) (m/day) coefficient
(In/day)1 Kx= 9.1e-1 l.oe-z 6.2A 0.3 s= 5.oe4
Ky= 9.1e-1 Sy= Z.Se-lIQ= 9.le_2
2 Kx= 4.6e-5 1.oe_2 — 0.3 —Ky= 4.&5I&= 4.6e5
.3 Kx= 1.07*1 1.o&2 -- 0.3 -.KY=1.07e+l
MODEL CtiIBR%l’10N
Steady-state’ calibration of the flow model was &xomplished by adjustingrecharge and hydraulic conductivity values until the simulated head values closelymatchd measured target values. Target values were defined for 39 wells in the modelarea based on the mean water leve~ measured monthly fkom 4/91 to 8/97. The maximumwater level range over this time period is 5 m (16.3 ft), occurring in ,@e water tableaquifer, and the standard deviation of all target values is 0.8 m (2.5 ft). The calibrationtarget criteria was 10 tihieve a-ratio of the standard deviation to the target value range ofless than ().5 for W targets. Low ratios gen~y indicate that the residual errors do notsigniilcantly influence the overall model response (Anderson (1992)). In addition toquantitative calibratio~ target residuals show a random distribution (see Figure 4).Calibration statistics are summarized in Table II.
7
“. ,. ..’
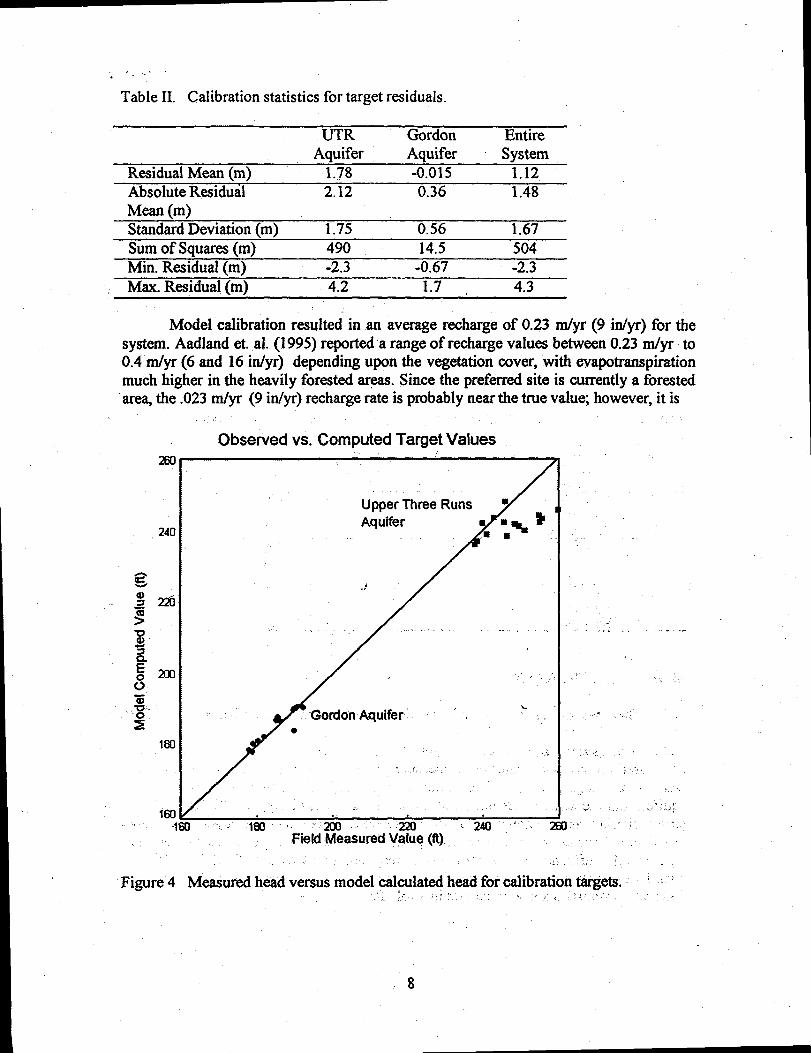
Table II. Calibration statistics for target residuals.
UTR Gordon EntireAquifer Aquifer System
Residual Mean (m) 1.78 -0.015 1.12Absolute Residual 2.12 0.36 1.48Mean (m)Standard Deviation (m) 1.75 0.56 1.67Sum of Squares (m) 490 14.5 504Min. Residual (m) -2.3 -0.67 -2.3Max. Residual (m) 4.2 1.7 4.3
Model calibration resulted in an average recharge of 0.23 ndyr (9 in/yr) for thesystem. Aadfand et. al. (1995) reported a range of recharge values between 0.23 rn/yr to0.4 ndyr (6 and 16 in/yr) depending upon the vegetation cover, “withevapotranspirationmuch higher in the heavily forested ar~. Since the prefemd site is cwrently a forestedarea, the .023 m/yr (9 irdyr) recharge rate is probably near the true valuq however, it is
260
240
160“1
,,
,.
Observed vs. Computed Target Values
.
Upper Three Rufis ■
Aquifer m
.,-
,.,
Gordon Aquifer’ = . .
....,
I “- 180 “: A .z& ’,’.: :
Field Measured ‘V%e (ft)
,.,,. . .
,:.:.,
. .
. . .,- .:,. ,.
Figure 4 Measured head versus model cal~lat+ head for calibration&gets: :., .?. .. . . .,., .,,. .’.,, ....;
8
(!09?c-774-q?- 60373
realized that construction of the facility will result in the area being cleared and likelyresult in a slight increase in recharge. In a previous study of the model area, (Thibault(1996)) performed a sensitivity study of the effects of increased recharge on the travel
time fid found a reduction of about 54 percent when the upper bound of 0.4 mlyr (16in/yr)wasused. . .
Model calibrated values of horizontal and vertical hydraulic conductivity are; 0.91and 0.09 mlday (3 and 0.3 iVday) for the Upper Time Runs Aquifer, 4.5e-5 and 4.5e-5rdday (1.5e-4 and 1.5e-4 ft/day) for the Gordon Confining Unit, and 10.7 and 0.03rnlday (35 and 0.1 ft/day) for the Gordon Aquifer, respectively. These values are similarto those reported in the literature for the hydrogeologic units simulated. Table III showsthe rdationship between initial input conductivity and final calibration conductivity. ““
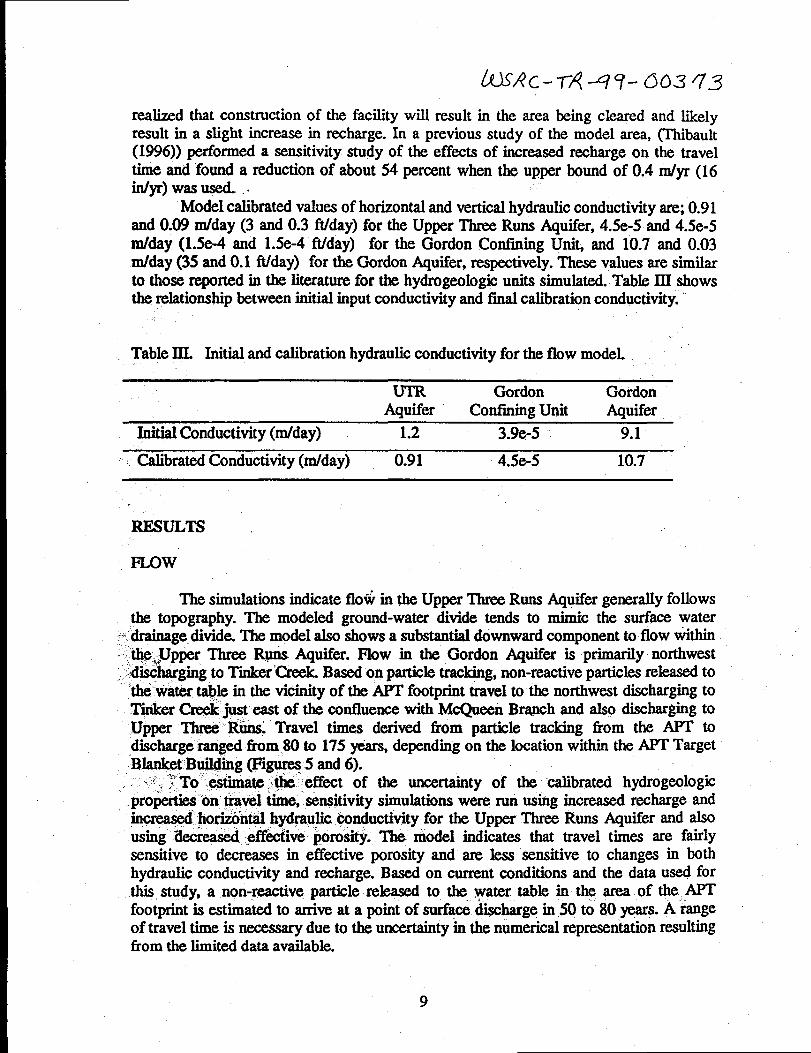
Table IIL Initial and calibration hydraulic conductivity for the flow modeL
Gordon GordonAquifer confining unit Aquifer
Initial Conductivity (m/day) 1.2 3.9e-5 9.1
. Calibrated Conductivity (m/day) 0.91 4.5e-5 10.7 “.
RESULTS ,.
FLow
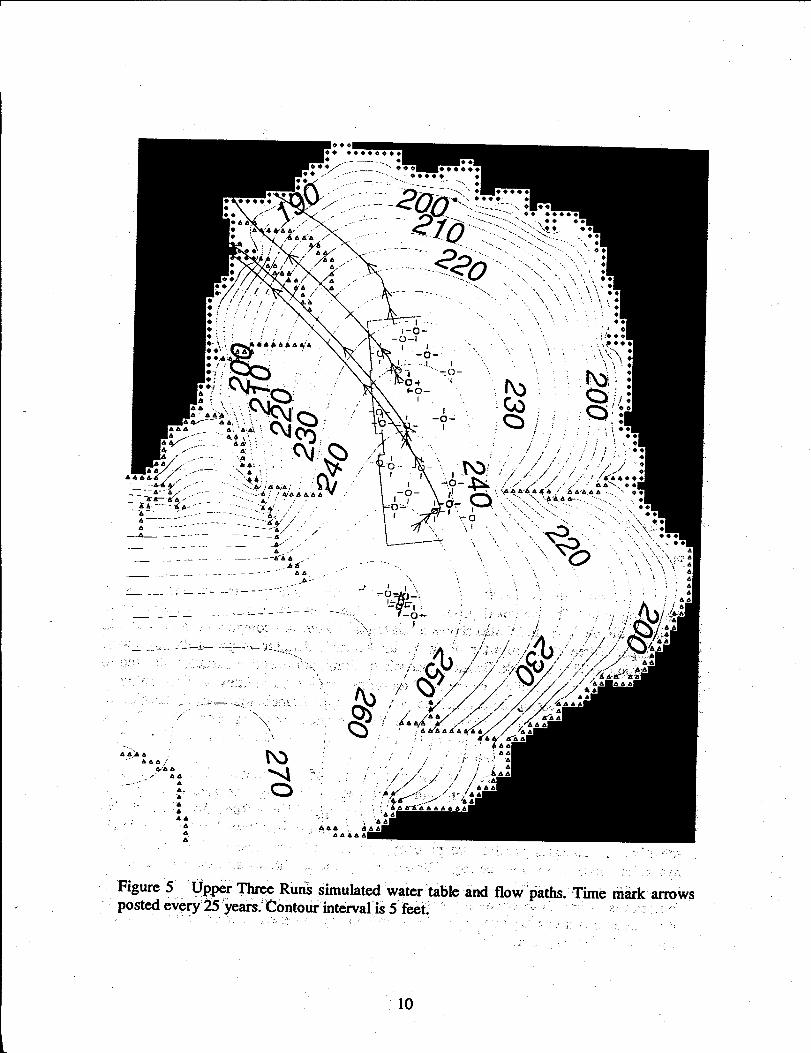
The simulations indicate flow in the Upper Three Runs Aquifer generaUy followsthe topography. The modeled ground-water divide tends to mimic the surface water
~.-drainagedi~d~ The model also shows a substantial downward component to flow within “: ~~.;,upw Three R@s A@fer. Flow in the .Gordon Aquifer is primarily northwest, $s@uirging to Tinker’Creek Based on particle tracl@ng,non-reactive particles released to
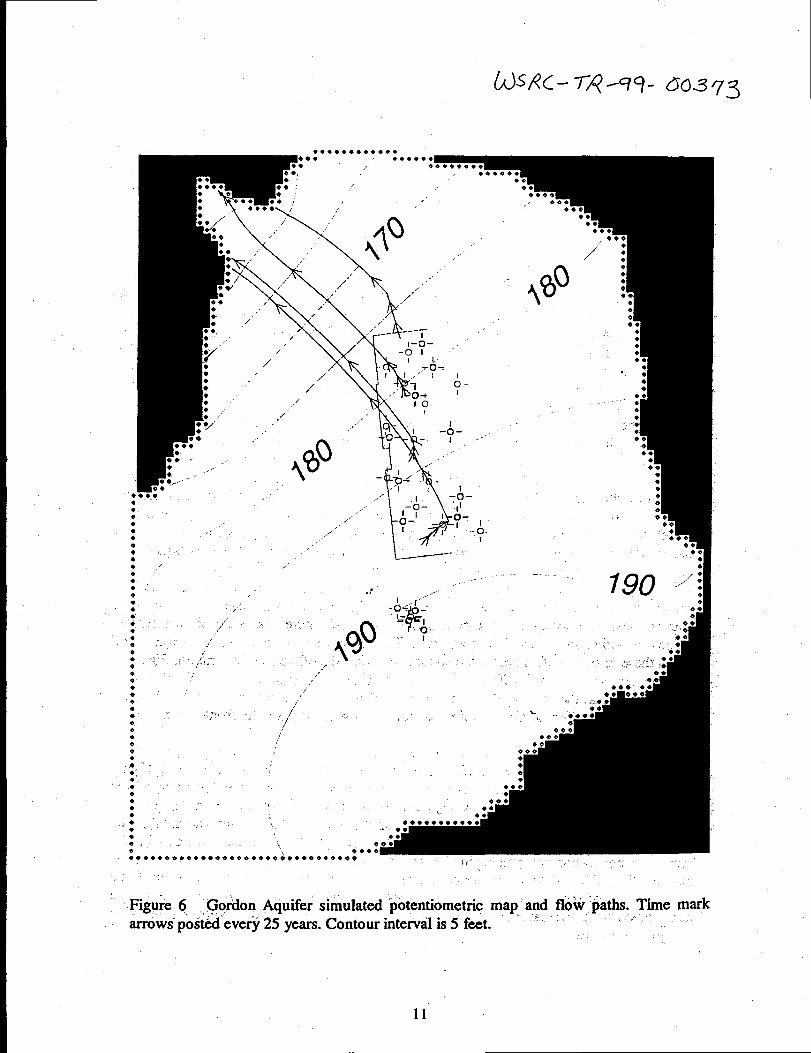
,* .~kr t@@ in the vicinity of the AFT footprint travel to the northwest discharging toTinker Creek just east of the confluence with MeQueen Branch and Z&Wdischarging toUpper Three Riins. Travel times derived from particle tracking from the APT todischarge rmiged fi-om 80 to 175 y6ars, depending on the location within the APT TargetBlank@ [email protected] @l@K?$5 and 6).
. . ~,..“~To -dir@e ‘@t effect of the uncertainty of the calibrated hydrogeologicproperties’on #avel time, sensitivity simulations were nui using increased rgdmrge andincn?a@ hori&niiil hy@@ic @nductivity for the Upper Three Runs Aquifer and also,.using “@cc*. eff’ve @rostiy. ~’ niodel indicates that travel times are fairlysensitive to decreases in effective porosity and are less ‘sensitive to changes in bothhydraulic conductivity and recharge. Based on current conditions and the data ~ forthis study, a non-reactive particle relea@ to the water table in the area of the APTfootprint is estimated to arrive at a point of s~a~ @charge in 50 to 80 years. A,’tigeof travel time is necessmy due to the uncertainty h the numerical representation resultingfrom the limited data available.
9
.-
9* ****O***
e* ,./ . .. . .. —..-
/’ ----- -“’- . .. ..J , e * ● o ● ● *
.. --— . . .-.. , .,
●:,:;:’.’ ~
~o----.hb,, ., : :
*AA . a., ‘.+ :
A&h
—-–d-.-b, .,.. -
:- Xa--&’b .z6—-d&--””– ----- ““
—h —~___ .; . . . . --
A----------
Nw0
.
,,..’.
.’
Figure 5 Upper Three Runs simulated water table and flow “paths. Time rnkk arrowspOStd every’25 ‘yetik.’Contoti inte~al’is 5 f=t~ ~-, ~: . . ~~~ ., .:. ”:..,
,. . . . .. ..... .,
/“’ . .
10
U-SRC- 77++- 00373
● **ee**O **e*
‘F404
● *
* ● ,
● .
** :
+: ““““*”*:-● ! , ,.** ,. ,.
\
/,.
/“’/
\
,/ \
. ..A%\x ,,.’ ‘ ..7
\\
--
/ 1-o- ,.,. -0 IL
,70--/“ ‘ “f I ...’ I
/ .1 -A-/ ---- O-t
&o,/’ I
.’
./’” ~,*
f
y -. -i- ..>.● **
● * .
~:*. ....-’*-*
:e Ie<
.,. :*eIe<
<
\
Ie’● ,. ‘*/
i6<4
● ✎✎✎✌
“\>’ 1
–15- ,1
e’ II./” 0- _ I o-
: ,, ./’” I –1!).●
● ✞● ~- ‘
1
.*O
.’●
790 // :J ...... ●
e
=,. .,.. ./
./’
,+’..,,- ,.. ,,,‘
,,,..
,,,
.~’..{/
e
:0
●
●
*
0
.,..,.....”&
4
4
.*:
.. .
.,,
,.
::“., 0 .’-”
e‘.$0**
...eooeooeeeeesve Oe O**
.,,
~lgu~ 6 .,Gorklon Aquifer simulated ‘potentiometiic map and flow paths. Time marktiws= postti eve~ 25 years. Contour interval is 5 f~t. ‘ ““L “’”, .‘ ~~ ,,
11
TRANSPORT
h the transport modeling phase, the source release was represented as a unitrecharge to the water table. This was assumed to o_wur only in the grid block locat@ atthe proposed location of the target blanket building. It is realized ht this area willbe anorder of magnitude larger than the actual facility. Advective transport with no decay wasused in the xnocieLMODFLOWT ran the flow portion in steady-state for a time period of40 years using the parameters from the flow modeling study. It then performed thetransport using one year time steps for 40 years. The model indicates that if the source isremoved tier the 40-year time period the activation will only decline. Because a conitantmass of tritium is being added to the system at the water table, the activation benedth thetiget blanket building appears to remain high even after the 40 years. On the ,other hand,.* model shows very low concentrations of tritium down gradient. This is likely then%ult of the tritium mass beiig diluted and dispersed by uncontaminated .g%idualgroundwater and recharge moving through the system. The transport modeling indicatesthat after only 40 years the tritium has not reached the streams. This is simihu to theparticle tracking results.
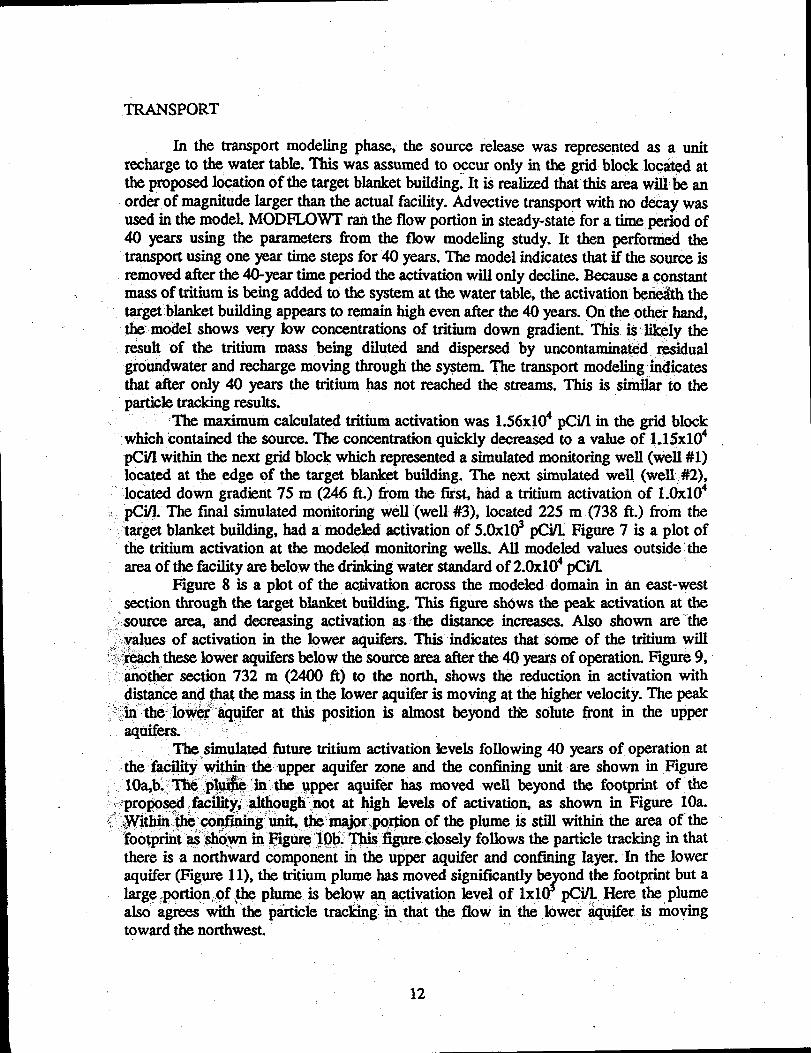
‘The maximum calculated tritium activation was 1.56x10⁴ pCi/1 in the grid blockwhich contained the source. The concentration quickly decreased to a value of 1.15x10⁴pCi/1 within the next grid block which represented a simulated monitoring well (well #1)located at the edge of the target blanket buildimg. ne next sfiu~ted we~ (wev #2),located down gradient 75 m (246 ft.) from the first, hiid a tritium activation of 1.0x10⁴
~~“~fl The final simulated monitoring well (well #3), located 225 m .(738 ft.) Ilom thetarget blanket building, had a modeled activation of 5.Oxl@ pCii FQure 7 is a plot ofthe tritium activation at the modeled monitoring wells. All modeled values outside ‘thearea of the facility are below the drinking water standard of 2.0x10⁴ pCi/L
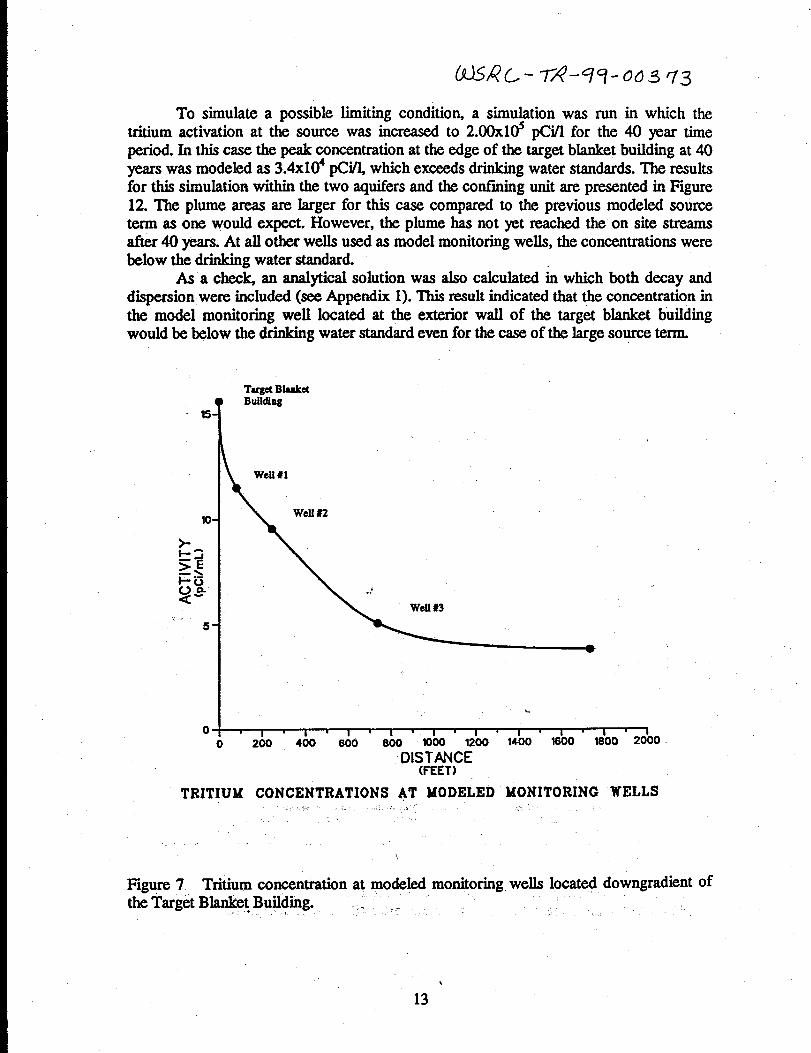
Figure 8 is a plot of the activation across the modeled domain in an east-west, section through the target blanket building. This figure shows the peak activation at the
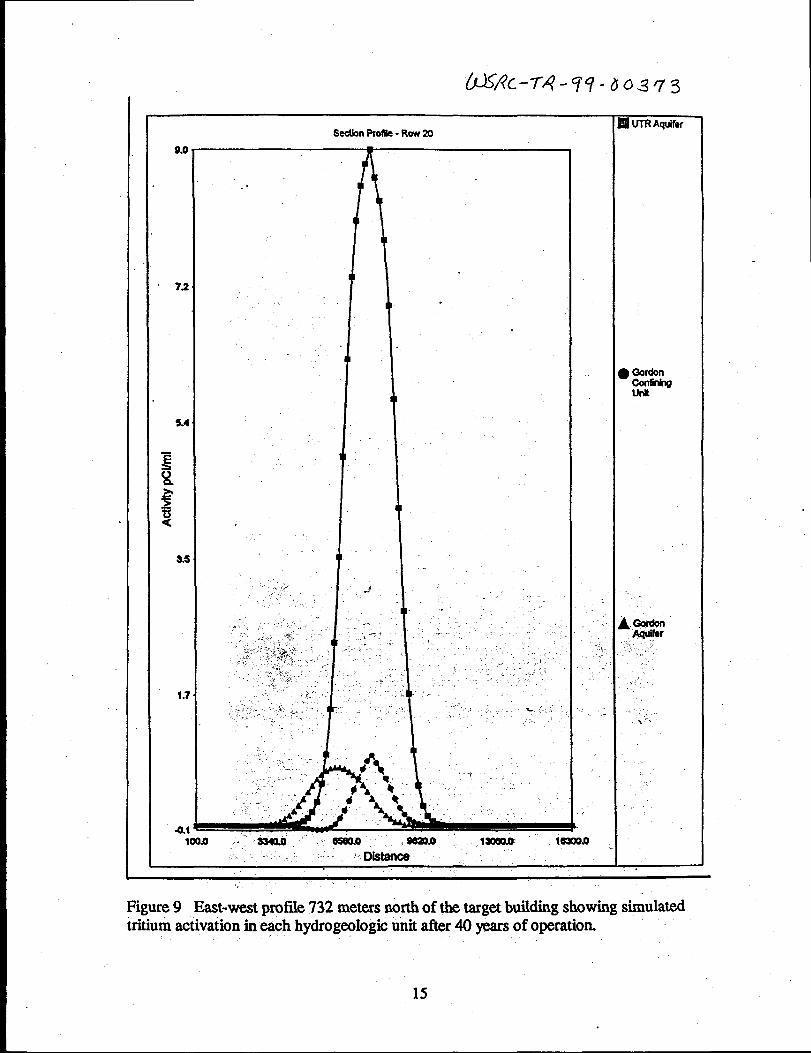
..~source ~ and decreasing activation as the distance increases. Also shown are’ the“values of activation in the lower aquifers. This indicates that ‘kome of the tritium will‘~?~@h,these lower aquifers below the source area after the 40 years of operation. Figure 9,. anobr section 732 m (2400 .ft) to the north, shows the reduction in activation with
distan~ ~d ,~t the mass tithe lower aquifer is moving at the higher velocity. The peak“~’:hi-”ti low~r ‘@@fer at this position is almost byond tlie solute fkont in the upper
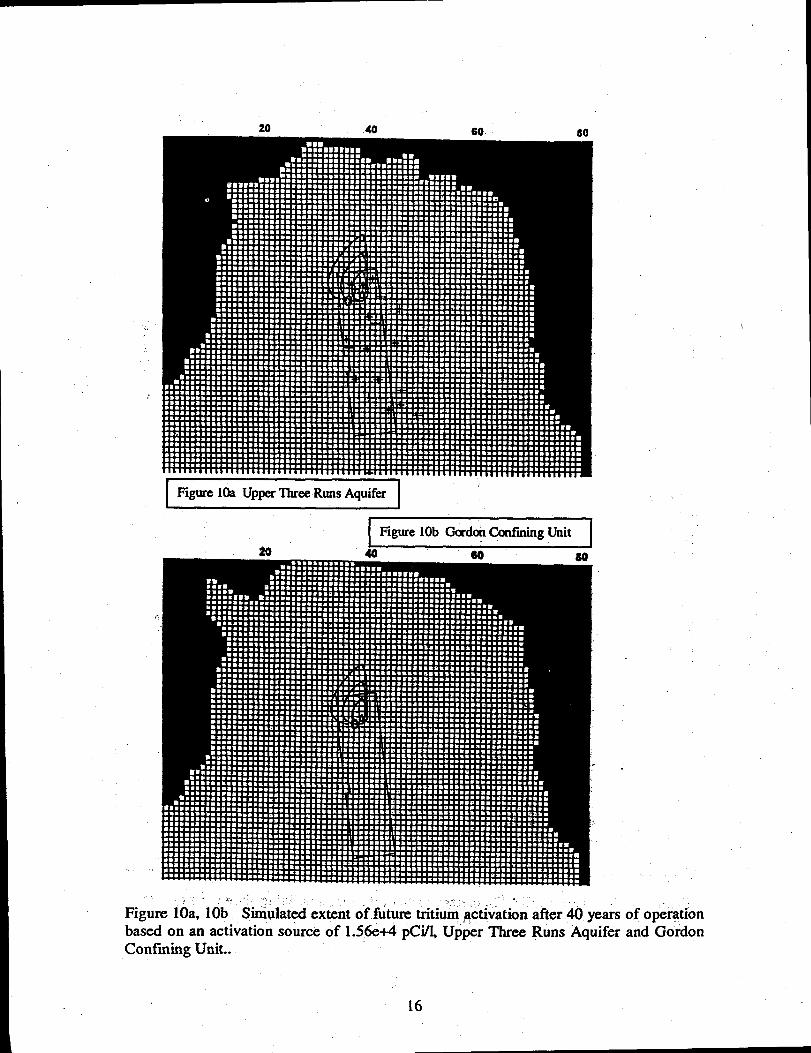
aquifers.. “ ‘The,simulat@ fbture tritium activation levels following @ years of operation at
the facility within the upper aquifix zone and the confining unit are shown in Figure10~b.’Tk ply$~ in’ihe upper aquifer has moved well beyond the footprint of ‘the
‘~proptw# $wilityi hlt$oug~”,not at high levels of activatio~ as shown in Figure 10a.~$~iiti @ co~ig:ti the:major,po~on of the plume is still within the area of ‘the
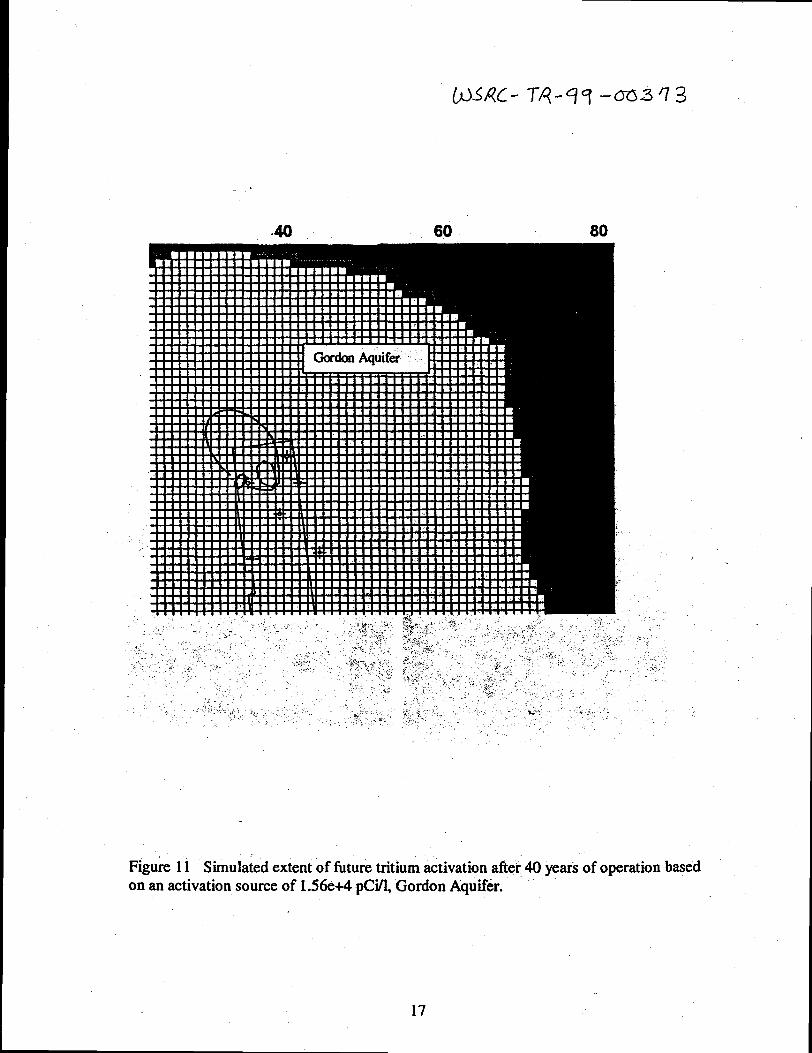
footprint”~ sbo<~’ in @gum l~b: l%is figure closely follows the particle tracking in thatthere is a northward component ti the upper aquifer and confining layer. In the loweraquifer (Figure 11), the tritium plume has moved significantly be ond the footprint but a
Jkg? ,portion, Of @e plume @ below an .Wtivation level of 1x1O pC~ Here the, plumeb“ agb with tie paiticle tracking in @at the flow in the lower *Uifer is mo~gtoward the northwest.
12
6LKW.-TA”7q-oo373
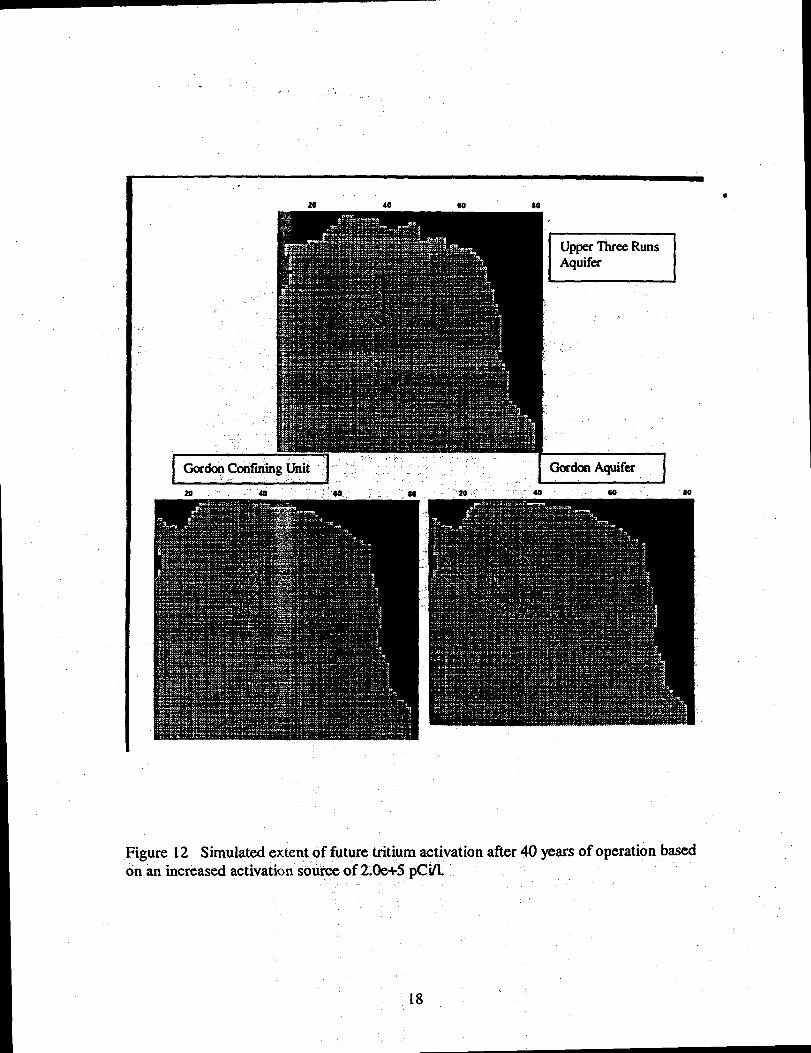
To simulate a possible limiting conditiok a simulation was run in which thetritium activation at the source was increased to 2.00x10S pCi/1 for the 40 year timeperiod. In this case the peak concentration at the edge of the target blanket building at 40years was modeled as 3.4x10⁴ pCi/L which exceeds drinking water standards. The resultsfor this simulation within the two aquifers and the confining unit are presented in Figure12. The plume areas are larger for this case compared to the previous modeled sourceterm as one would expect. However, the plume has not yet reached the on site streamsafter 40 ytws. At all other wells used as model monitoring wells, the concentrations werebelow the drinking water standard.
As a check an analytical solution was also calculated k which both decay anddispersion were included (see Appendix 1). This result indicated that the concentration inthe model monitoring well located at the exterior wall of the target blanket buildingwould be below the drinking water standard even for the case of the large source tenm
“ti
lc
5
0
TargetBlanketBuilding
--
I 1 I 1 I I 1 1 I (200 400 600 800 moo 1200 1400 1600 1800 2000.
TRITIUbf
DIS&ffE
cor4cmmA’rxorwAT bfODELED tiONITORING WELLS.,. . .. ...”. .
1
Figtye 7 Tritium concentration at modeled monitoring wells located downgradient ofthe Target’Blanket Building. .,. .,...... . ,, .
*
13
Activity pCVml
E! E
. .
-.
❑ UTR AquiferSedbn Profile- RCJW20
.
I
1
. .II
4
II
I
,.
I
.. .;.. “9
● Gordonpl#n9
1- 1 I
.,l!Ai2iA ,~lm.o -“ 3340. ““ -~. ~.o :W20@ .moao.a lWWO
,. .,., ,. ‘-wtdnct?)
Figure 9 East-west proffle ?32 meters north of the target building showing simulatedtritium activation in each hydrogeologic unit after 40 years of operation
15
A
I Figure Ma Upper ‘Ihree Runs Aquifer I
—I Figure 10b Gordon Confining LMt I
,“.~. “~jl .. . . . . .,’
Figure 10a, 10b !%iwlatt?d extent of fi”ture tritium activation after 4.0ye~ of op&ationbased on an activation source of 1.56e+4 pC~ Up&r Three Runs Aquifer and GordonConfining Unit..
16
40 , 60 80
Figure 11 Simulat~ extent of fbture tritium activation after 40 years of operation basedon an activation, source of 1.56e+4 pCi/1, Gordon Aquifer.
17
20 M m la
Runs1
1Gordon Cenftiig Unit “‘“ GordonAquifer.. 1m. M an m ’23‘ 40 w’ Jo
Fizure 12 Simulated extent of t%turetritium activation after 40 Yearsof operation b~~on”an iicreased activation soupe of 2.0e+5 pCilL
.
18
●
CONCLUSIONSLAH?c”-vwq”U63 f73
The resuhs of the ground-water modeling provide a representation of the ground-water flow directions and velocities in the vicinity of the proposed APT facility that arein agreement with the limited data available. Limitations of this model result from thelack of spatially distributed data within the ground-water divide which make it moredifficult to accurately represent the hydrogeologic system. Calibration of the model islimited to the central region where calibration target data is available. Additiomlgeologic and hydrogeologic data such as: hydraulic conductivity measurements, waterlevels, stream flow, location of seeps and their volume, and geologic data on thedistribution of clays within the uppti%portion of the geologic colum~ will help refine theunderstanding of the system.
A large uncertainty exists in the pr&lictions provided by this modeling since thevariability of the hydrogeologic and transport parameters are unknown and therefore aredifficult to account for in the modeL It is known from the detailed site characterizationperformed to date that the proposed site is underlain by a complex series of sandy claysand clayey sands which vary spatiidly. Also the values of hydraulic conductivity used inthe analysis are from a limited number of pumping tests confined ‘to the southern portionof the modeled area and in the general region sumounding the site. Therefore, predictionsof tritium velocity and spreading in the region of the APT Tiirget Blanket Building aresubject to a high degree of uncertainty, which we are unable to quantify better than the50-80 years calculated by the modeL
The ground-water flow and solute transport numerical modeling to simulate fitureconcentrations of tritium at b proposed ~ site has shown that plumes of low butdetectable tritium concentrations will be produced by activation below the target blanketbuilding. Simulations predict that some tritium will reach the Gordon aquifer at lowlevels. OveraU the reds ~dicate that it is unlikely that trith.un will be discharged toSRS surface strq during the proposed opetig life of the facilit~ however, with timevery low levels of tiitium may reach the surface streams. The transport modeling resultsrepresent a simulation of be worst-case conditions with a continuous source and nod~ay occufig. These simulatioti’%m @timative by niture ~d actual conditionsshould present less potential for impact to groundwater at the proposed APT site.
“;--,.. .
19
REFERENCES
Aadland, R K, J. A GeIlicL and P. ~ Thayer, (1995), Hydrogeologic Framework ofWest Central South Carolina, State of South Carolina Department of WaterResources, v. 5, Columb@ SC.
Andersou M. P. and Woessner, W. W., (1992), Applied Groundwater Modeling:Simulation of Flow andAdvective Transport, Academic Press, Inc., San Diego,
.CA
Bear, J., (1979), Hydraulics of Ground Water, McGraw-~ New York.
Duffleld, G. M., Benegar, J. J., and Ward, D. S., (1997), MODFLOW, a Modular Z?zreeDimensional Groundwater Fbw and Transport Mo&l, Hydrosdve, Inc., Reston,VA
Fallaw, W. C., and V. Price, Jr., (1995), Stratigraphy of the Savannah River Site andV7cinity,Southeastern GeoIogy, v. 35, p. 21-58.
Hiergeseb lL A., (1995), A Regwnal Water Table M~ of the Savannah River Site, IQ-5,WSRC-MS-9$0524, Westinghouse Savannah River Company, Aike~ SC.
McDonald, M. G. and A W. HarbaugL (1988), A Modul@ lhree-dirnensional FiniteDi#ererice Ground Water FbwMo&l, Techniques of Water ResourcesInv6iWgations of the U.S. Geological Survey, Book 6, Washington D. C.
Ogata, i% and Banks, R B., (1961),$ Solution of the Differential Equation ofLongitudinal Dispersion in Poro~’ Media, U.S. Geological Suryey ProfessionalPaper 41 l-~ U. S.’<@vemm@’Printing Office, Washiggtom D.C.
prowe~ D. C., (1996)? @litniru@eol@k@ of the Saya?uuzhRiver Site; ~i~eni ..Allendale,,@ Bamwell Cbhties, ‘South@olina, 0pe6-lWe Report 94-181, “U.S. Geological Surveyi Atlanm GA
Rumbaugh III, J. O., (1995), GrounchwzterVitas, Advanced ;o&l Design and Analysisfor Windows, Environmental Simulation Inc. HemdoL VA
Thibault, J. J., (1996), Numerical Modd of the McQueen Branch-Mi~lCreek Divi&,Savannah River Site, Souti Clzrolina Characten”~”on of Ground-W~er Fbw inTerti”arySandAqu~ers, M. S. Thesis presented to the Graduate School ofClemson University, Clemson, SC.
Thibauk, J. J. and Stephenson, D. E., (1998), Groundwater Flow Mo&ling at ProposedAPT Site Number 2, PECD-SGS-97-0250, Westinghouse Savannah RiverCompany, Ailce~ SC.
20
APPENDIX 1(Z1.X-” 74”77”00373
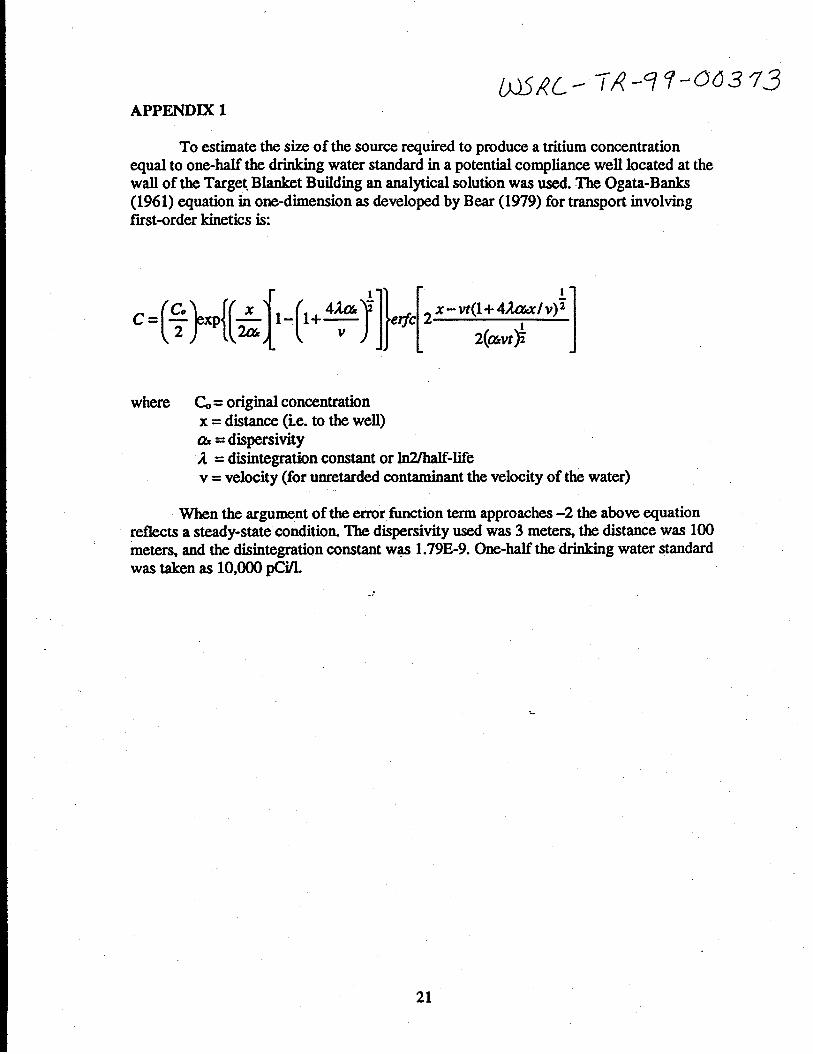
To estimate the size of the source required to produce a tritium concentrationequal to one-half the drinking water standard in a potential compliance well located at thewall of the Target Blanket Building an analytical solution was used. The Ogata-Banlcs(1961) equation in one-dimension as developed by Bear (1979) for transport involvingfwst-order kinetics is:
where G= original concentrationx = distance (i.e. to the well)& = dispersivityA = disintegration constant or ln2/haE-Mev = velocity (for unretarded contaminant the velocity of the water)
When the argument of the error-function term approaches -2 the above equationreflects a steady-state condition. The dispersivity used was 3 meters, the distance was 100meters, and the disintegration constant W* 1.79E-9. One-half the drinking water standardwas taken as 10,000 pCi/1.
.,.
21