Embed Size (px)
DESCRIPTION
Scottsboro Jr. High School the state of the school. 2013-2014 Jason Hass – Principal Jeff Tubbs – Assistant Principal. Scottsboro Jr. High School. Scottsboro Jr. High School Facts Public Middle School which serves the city of Scottsboro, population 15,000 - PowerPoint PPT Presentation
Citation preview
2013-2014Jason Hass – Principal
Jeff Tubbs – Assistant Principal
SCOTTSBORO JR. HIGH SCHOOL
THE STATE OF THE SCHOOL
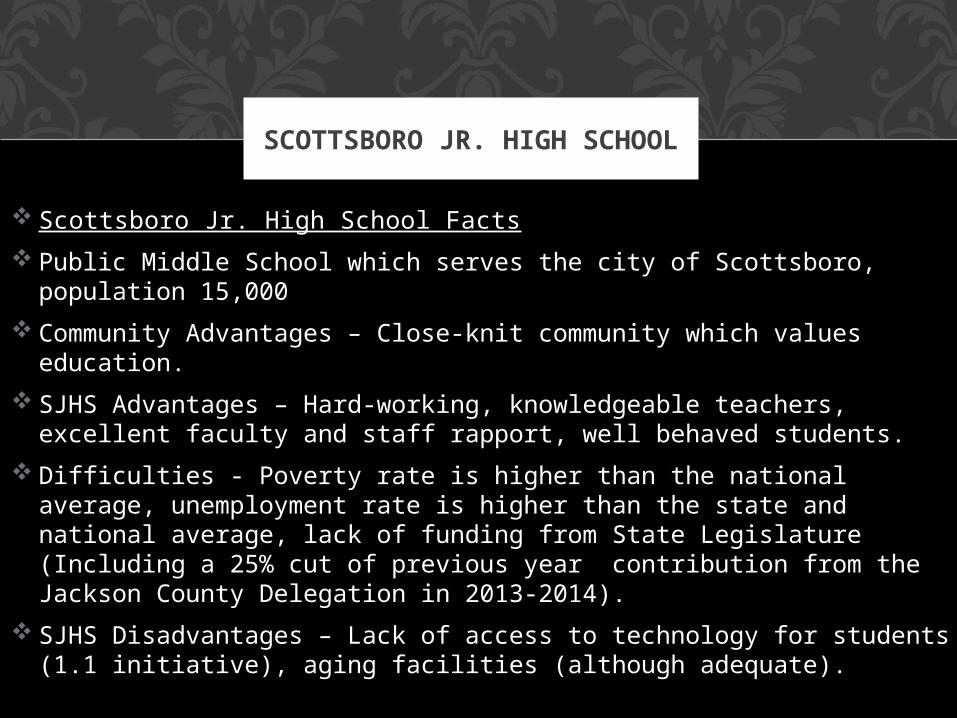
Scottsboro Jr. High School Facts
Public Middle School which serves the city of Scottsboro, population 15,000
Community Advantages – Close-knit community which values education.
SJHS Advantages – Hard-working, knowledgeable teachers, excellent faculty and staff rapport, well behaved students.
Difficulties - Poverty rate is higher than the national average, unemployment rate is higher than the state and national average, lack of funding from State Legislature (Including a 25% cut of previous year contribution from the Jackson County Delegation in 2013-2014).
SJHS Disadvantages – Lack of access to technology for students (1.1 initiative), aging facilities (although adequate).
SCOTTSBORO JR. HIGH SCHOOL

DEMOGRAPHICS
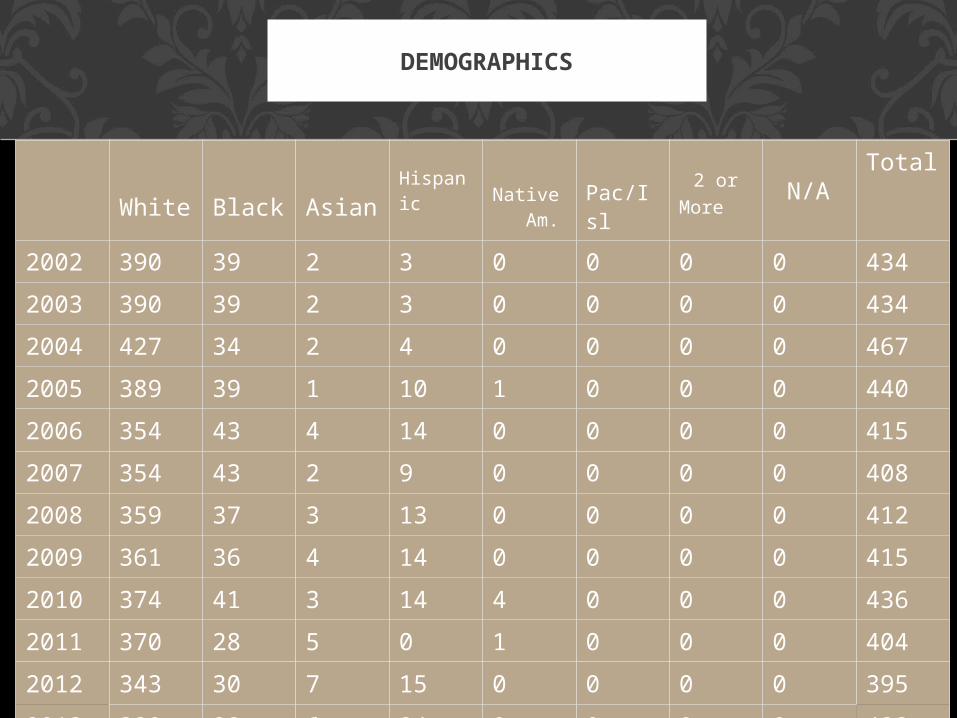
White
Black
Asian
Hispanic
Native Am.
Pac/Isl
2 or More
N/A Total
2002 390 39 2 3 0 0 0 0 434
2003 390 39 2 3 0 0 0 0 434
2004 427 34 2 4 0 0 0 0 467
2005 389 39 1 10 1 0 0 0 440
2006 354 43 4 14 0 0 0 0 415
2007 354 43 2 9 0 0 0 0 408
2008 359 37 3 13 0 0 0 0 412
2009 361 36 4 14 0 0 0 0 415
2010 374 41 3 14 4 0 0 0 436
2011 370 28 5 0 1 0 0 0 404
2012 343 30 7 15 0 0 0 0 395
2013 380 28 6 24 0 0 0 0 438
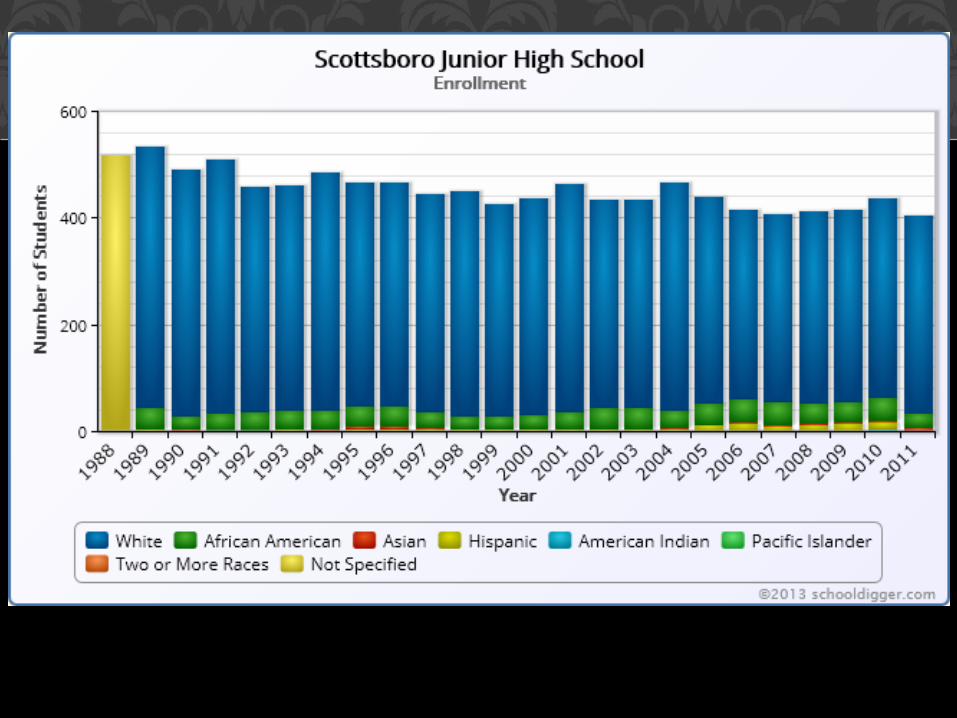
DEMOGRAPHICS
DISCIPLINE, ATTENDANCE, GRADES
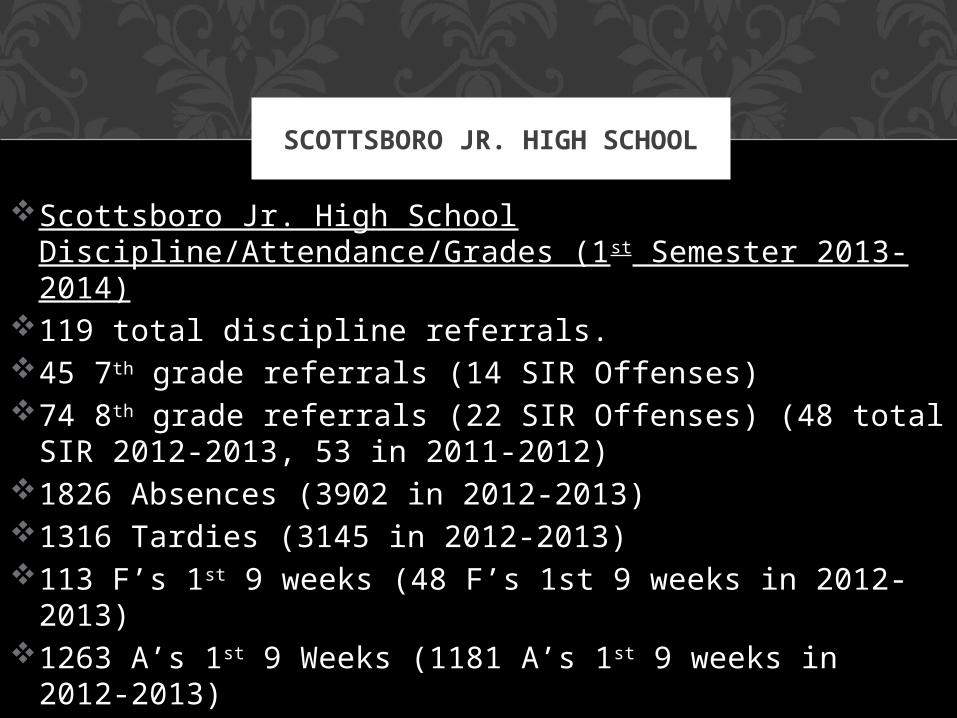
Scottsboro Jr. High School Discipline/Attendance/Grades (1st Semester 2013-2014)
119 total discipline referrals.45 7th grade referrals (14 SIR Offenses)74 8th grade referrals (22 SIR Offenses) (48 total SIR
2012-2013, 53 in 2011-2012)1826 Absences (3902 in 2012-2013)1316 Tardies (3145 in 2012-2013)113 F’s 1st 9 weeks (48 F’s 1st 9 weeks in 2012-2013)1263 A’s 1st 9 Weeks (1181 A’s 1st 9 weeks in 2012-
2013)
SCOTTSBORO JR. HIGH SCHOOL
SJHS RANKINGS
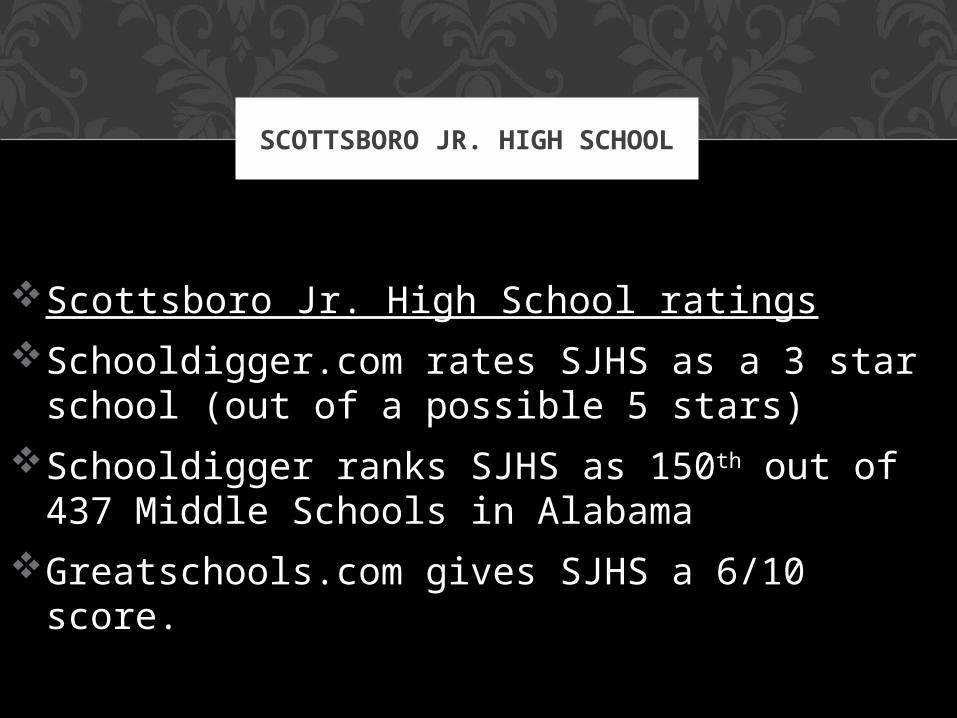
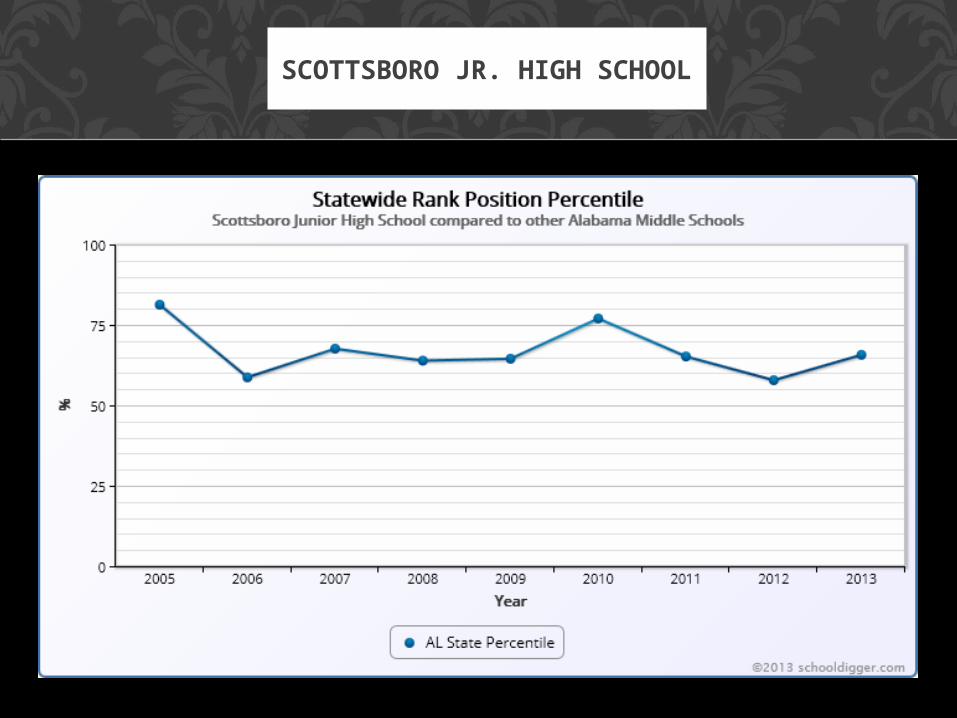
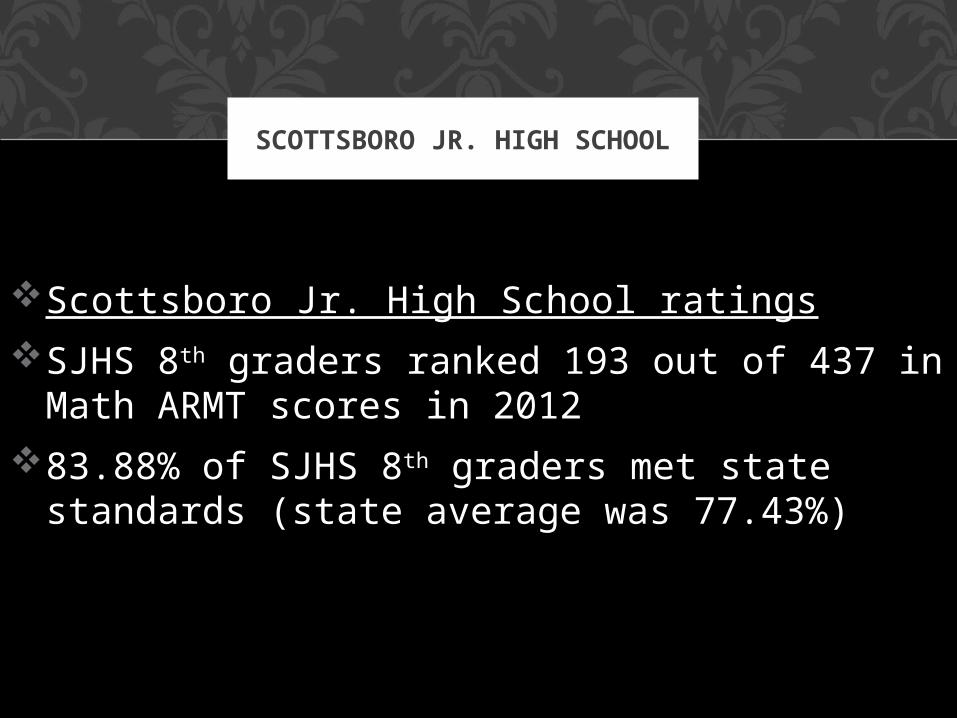
Scottsboro Jr. High School ratings
Schooldigger.com rates SJHS as a 3 star school (out of a possible 5 stars)
Schooldigger ranks SJHS as 150th out of 437 Middle Schools in Alabama
Greatschools.com gives SJHS a 6/10 score.
SCOTTSBORO JR. HIGH SCHOOL
SCOTTSBORO JR. HIGH SCHOOL
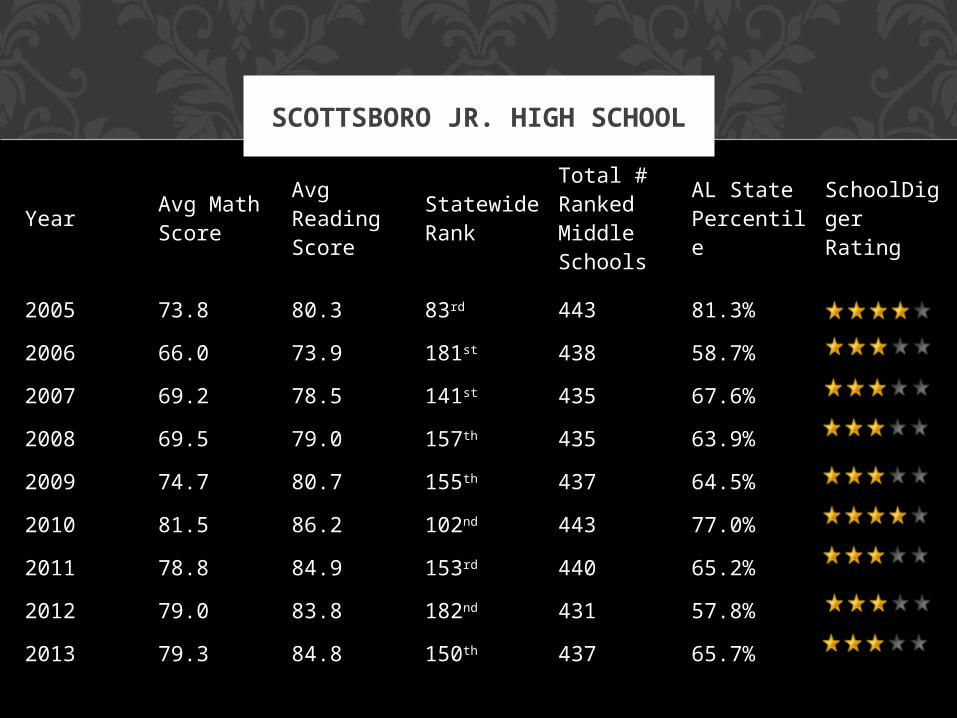
Year Avg Math Score
Avg Reading Score
Statewide Rank
Total # Ranked Middle Schools
AL State Percentile
SchoolDigger Rating
2005 73.8 80.3 83rd 443 81.3%
2006 66.0 73.9 181st 438 58.7%
2007 69.2 78.5 141st 435 67.6%
2008 69.5 79.0 157th 435 63.9%
2009 74.7 80.7 155th 437 64.5%
2010 81.5 86.2 102nd 443 77.0%
2011 78.8 84.9 153rd 440 65.2%
2012 79.0 83.8 182nd 431 57.8%
2013 79.3 84.8 150th 437 65.7%
SCOTTSBORO JR. HIGH SCHOOL
SJHS DEDICATION
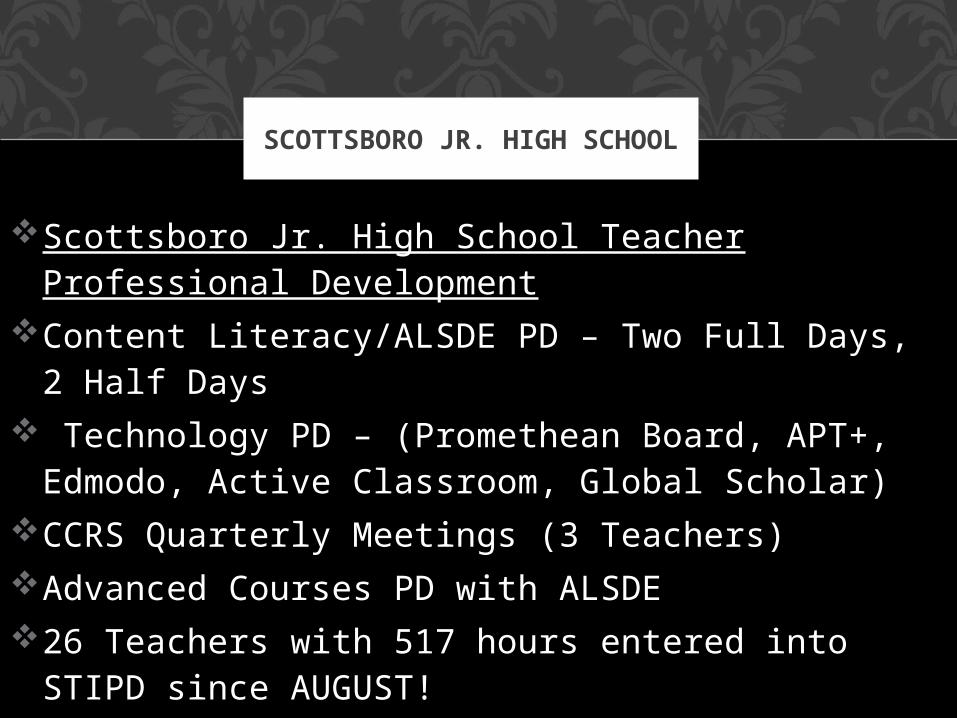
Scottsboro Jr. High School Teacher Professional Development
Content Literacy/ALSDE PD – Two Full Days, 2 Half Days
Technology PD – (Promethean Board, APT+, Edmodo, Active Classroom, Global Scholar)
CCRS Quarterly Meetings (3 Teachers) Advanced Courses PD with ALSDE26 Teachers with 517 hours entered into
STIPD since AUGUST!
SCOTTSBORO JR. HIGH SCHOOL
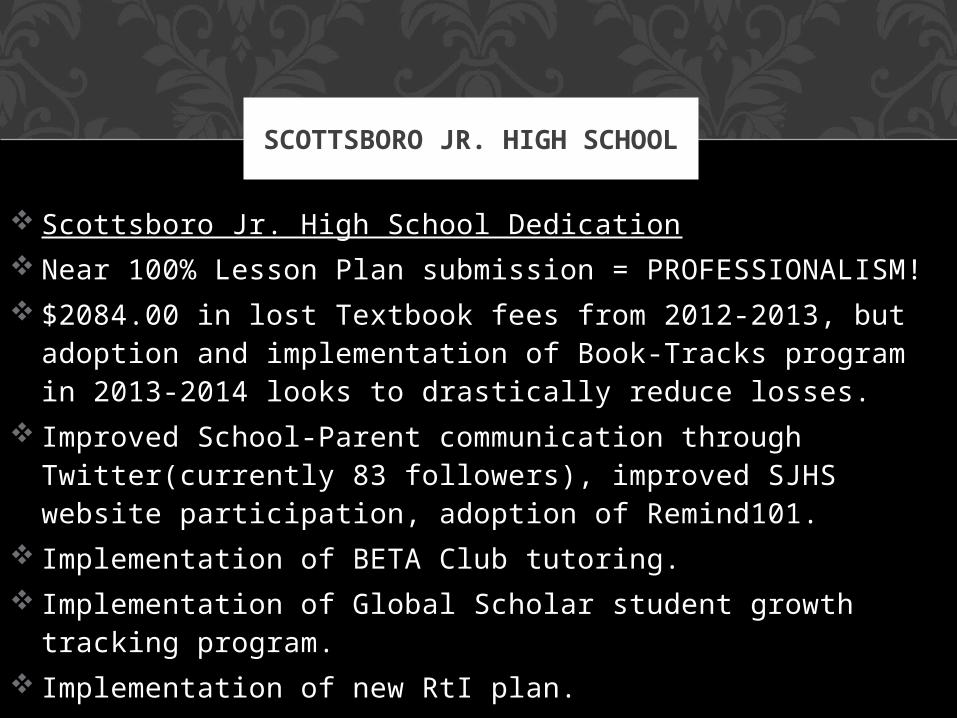
Scottsboro Jr. High School Dedication Near 100% Lesson Plan submission =
PROFESSIONALISM! $2084.00 in lost Textbook fees from 2012-2013, but
adoption and implementation of Book-Tracks program in 2013-2014 looks to drastically reduce losses.
Improved School-Parent communication through Twitter(currently 83 followers), improved SJHS website participation, adoption of Remind101.
Implementation of BETA Club tutoring. Implementation of Global Scholar student growth
tracking program. Implementation of new RtI plan.
SCOTTSBORO JR. HIGH SCHOOL

SJHS CHALLENGES
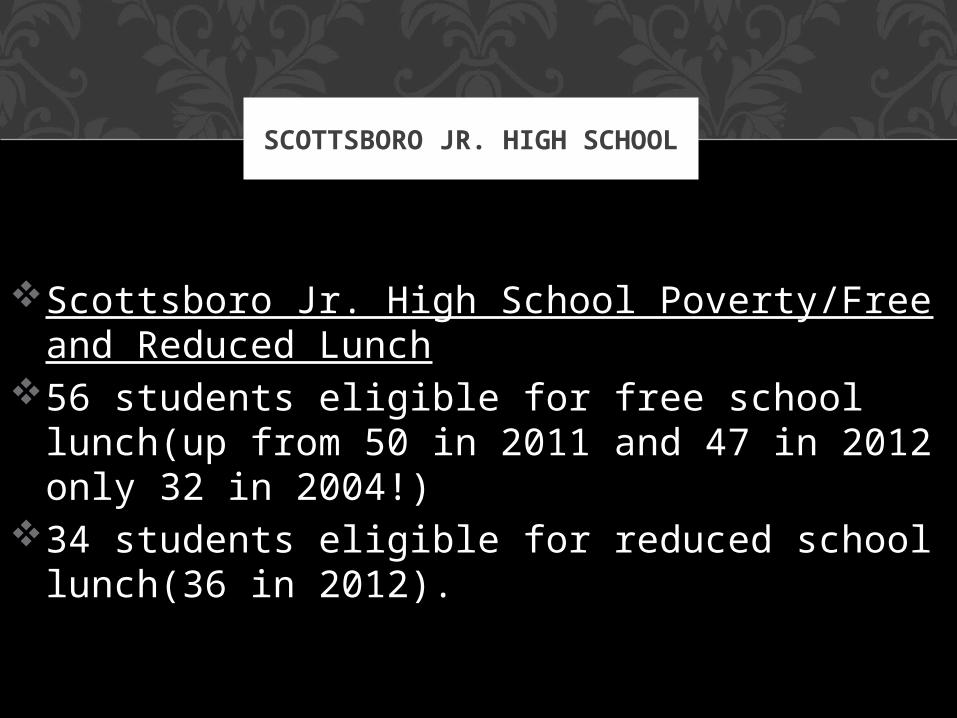
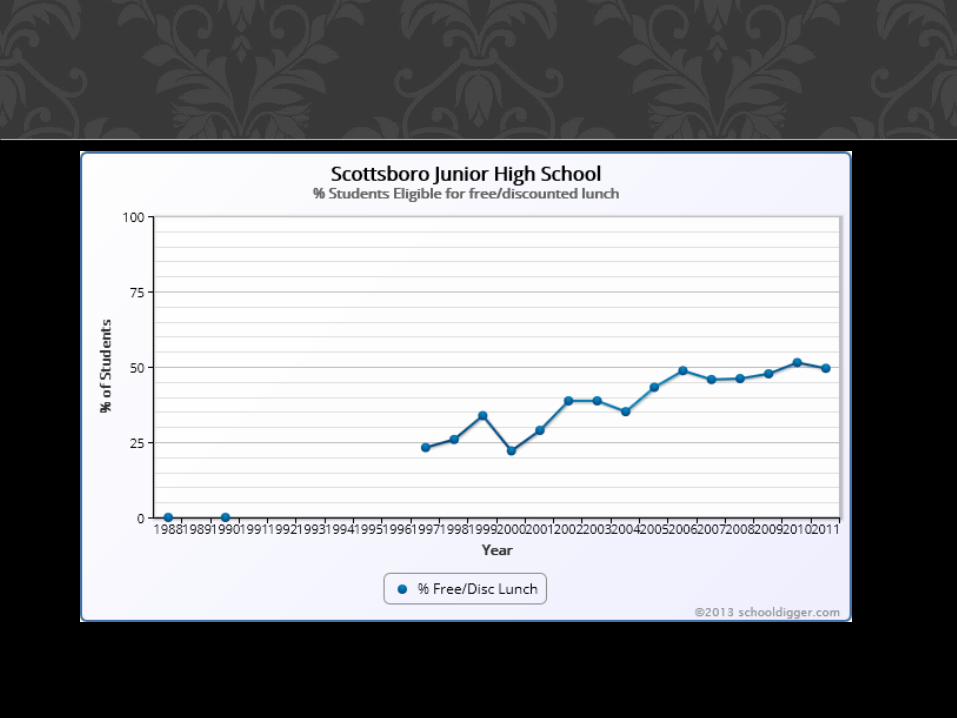
Scottsboro Jr. High School Poverty/Free and Reduced Lunch
56 students eligible for free school lunch(up from 50 in 2011 and 47 in 2012 only 32 in 2004!)
34 students eligible for reduced school lunch(36 in 2012).
SCOTTSBORO JR. HIGH SCHOOL
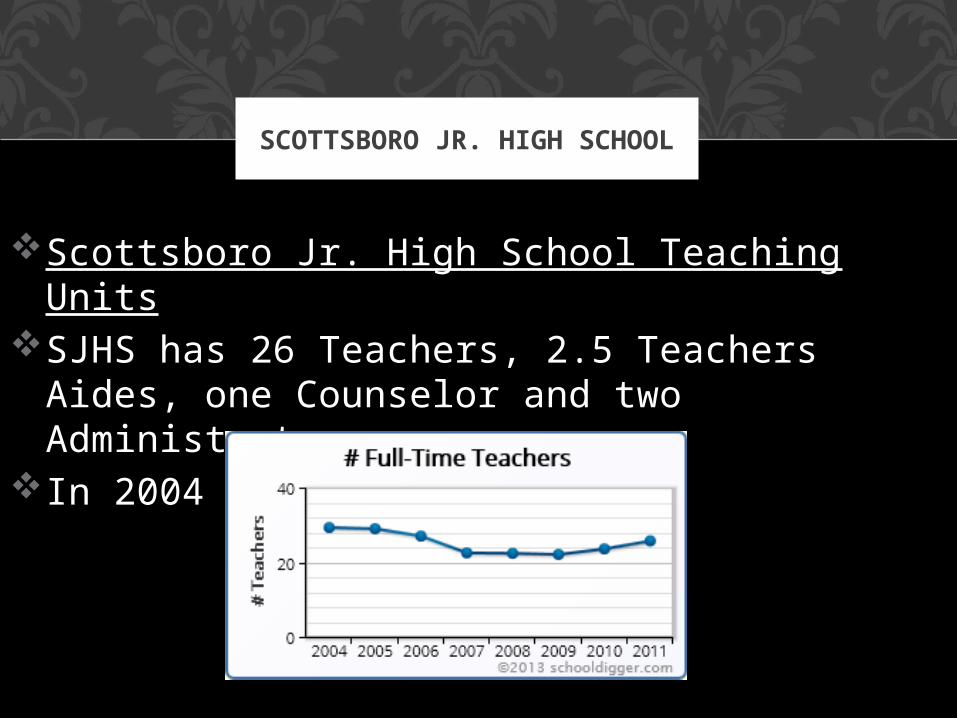
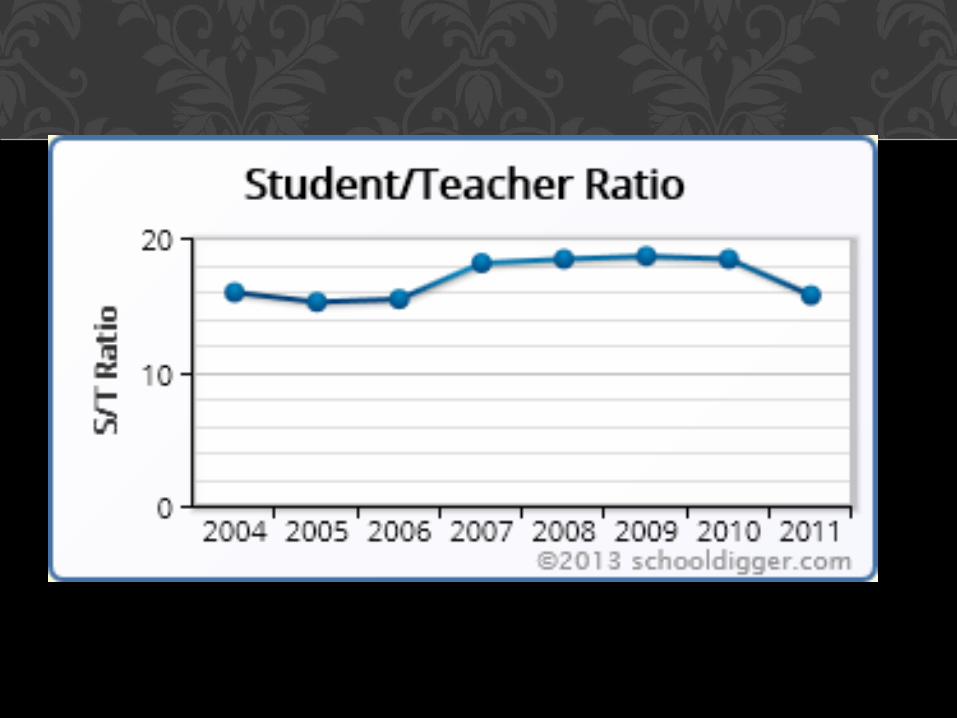
Scottsboro Jr. High School Teaching UnitsSJHS has 26 Teachers, 2.5 Teachers Aides,
one Counselor and two Administrators.In 2004 we had 30 Teachers!
SCOTTSBORO JR. HIGH SCHOOL
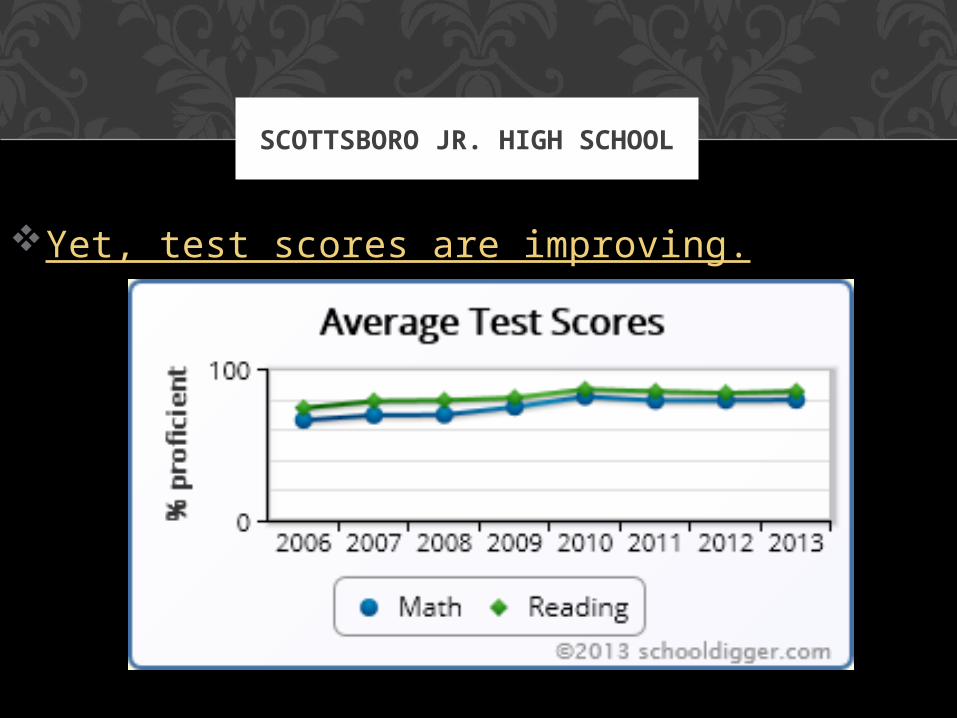
Yet, test scores are improving.
SCOTTSBORO JR. HIGH SCHOOL
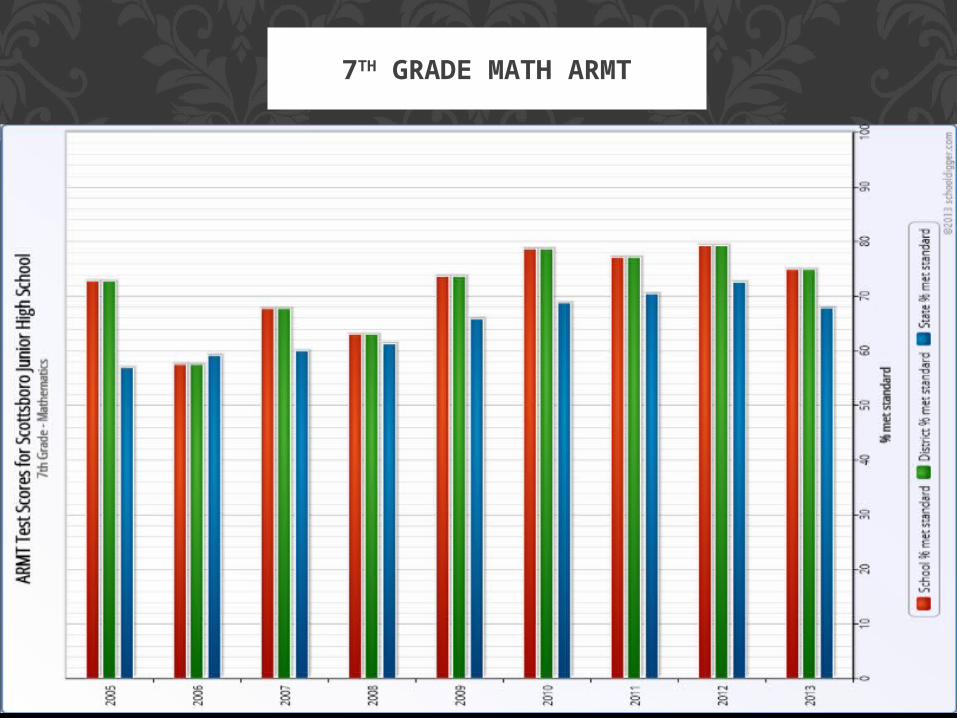
7TH GRADE MATH ARMT
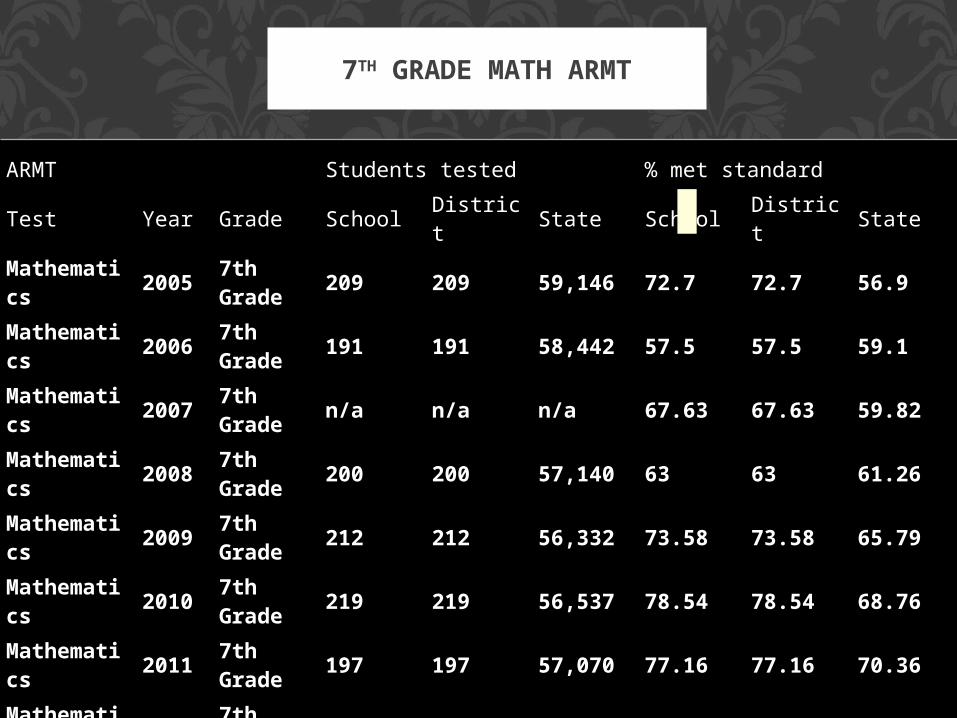
ARMT Students tested % met standardTest Year Grade School District State School District StateMathematics 2005 7th
Grade 209 209 59,146 72.7 72.7 56.9
Mathematics 2006 7th
Grade 191 191 58,442 57.5 57.5 59.1
Mathematics 2007 7th
Grade n/a n/a n/a 67.63 67.63 59.82
Mathematics 2008 7th
Grade 200 200 57,140 63 63 61.26
Mathematics 2009 7th
Grade 212 212 56,332 73.58 73.58 65.79
Mathematics 2010 7th
Grade 219 219 56,537 78.54 78.54 68.76
Mathematics 2011 7th
Grade 197 197 57,070 77.16 77.16 70.36
Mathematics 2012 7th
Grade 198 198 57,704 79.29 79.29 72.5
Mathematics 2013 7th
Grade n/a n/a n/a 74.75 74.75 67.74
7TH GRADE MATH ARMT
Scottsboro Jr. High School ratings
SJHS 8th graders ranked 193 out of 437 in Math ARMT scores in 2012
83.88% of SJHS 8th graders met state standards (state average was 77.43%)
SCOTTSBORO JR. HIGH SCHOOL
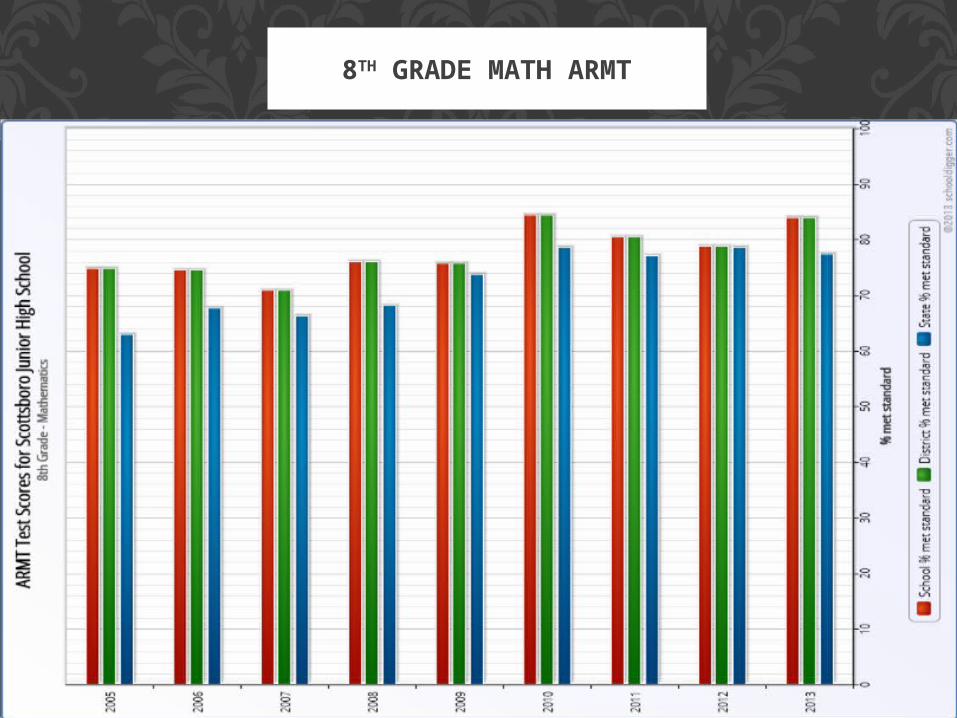
8TH GRADE MATH ARMT
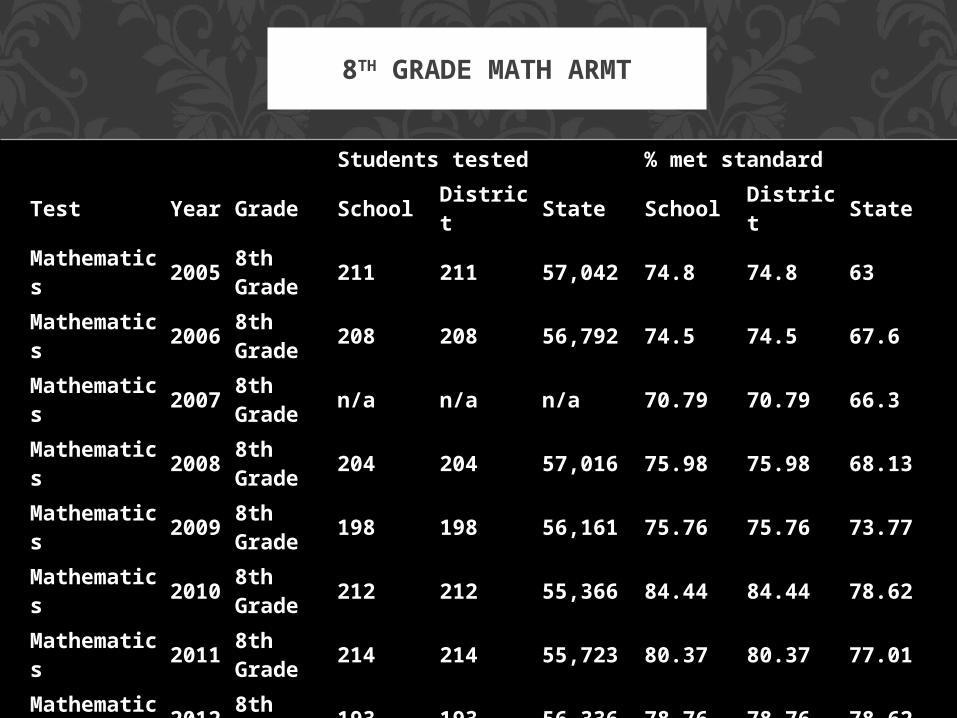
Students tested % met standardTest Year Grade School District State School District StateMathematics
2005
8th Grade 211 211 57,042 74.8 74.8 63
Mathematics
2006
8th Grade 208 208 56,792 74.5 74.5 67.6
Mathematics
2007
8th Grade n/a n/a n/a 70.79 70.79 66.3
Mathematics
2008
8th Grade 204 204 57,016 75.98 75.98 68.13
Mathematics
2009
8th Grade 198 198 56,161 75.76 75.76 73.77
Mathematics
2010
8th Grade 212 212 55,366 84.44 84.44 78.62
Mathematics
2011
8th Grade 214 214 55,723 80.37 80.37 77.01
Mathematics
2012
8th Grade 193 193 56,336 78.76 78.76 78.62
Mathematics
2013
8th Grade n/a n/a n/a 83.88 83.88 77.43
8TH GRADE MATH ARMT
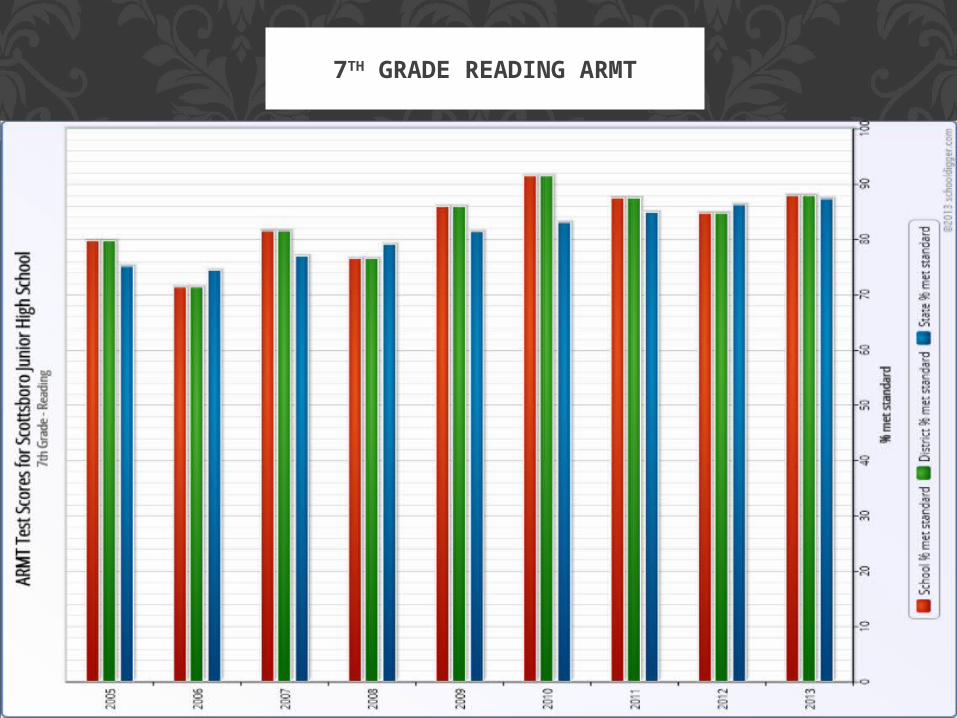
7TH GRADE READING ARMT
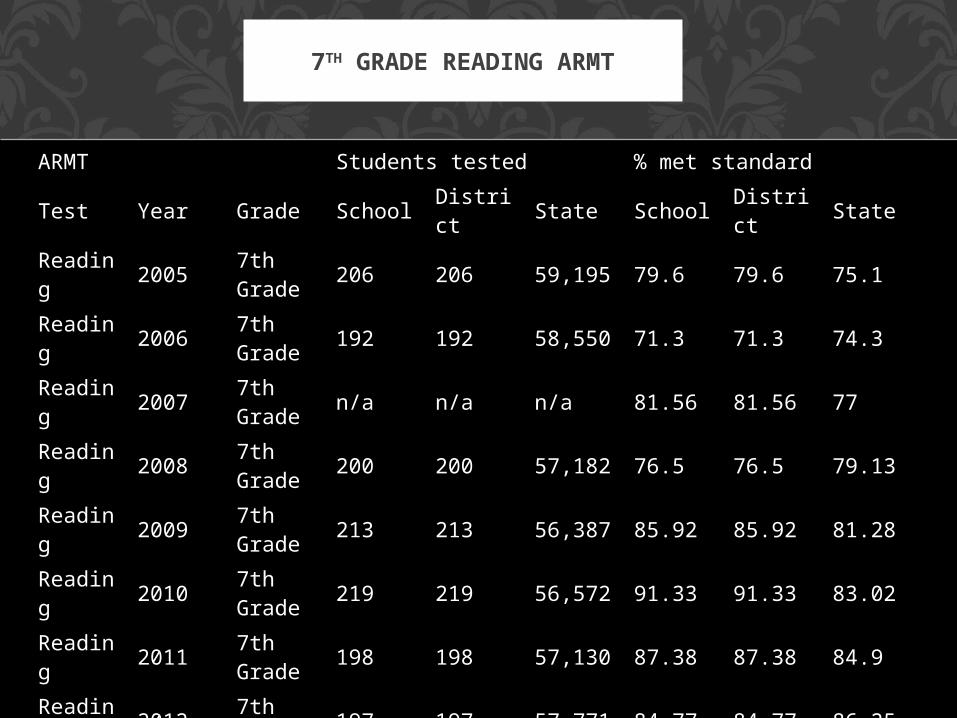
ARMT Students tested % met standard
Test Year Grade School District State School District State
Reading 2005 7th
Grade 206 206 59,195 79.6 79.6 75.1
Reading 2006 7th
Grade 192 192 58,550 71.3 71.3 74.3
Reading 2007 7th
Grade n/a n/a n/a 81.56 81.56 77
Reading 2008 7th
Grade 200 200 57,182 76.5 76.5 79.13
Reading 2009 7th
Grade 213 213 56,387 85.92 85.92 81.28
Reading 2010 7th
Grade 219 219 56,572 91.33 91.33 83.02
Reading 2011 7th
Grade 198 198 57,130 87.38 87.38 84.9
Reading 2012 7th
Grade 197 197 57,771 84.77 84.77 86.25
Reading 2013 7th
Grade n/a n/a n/a 87.86 87.86 87.22
7TH GRADE READING ARMT
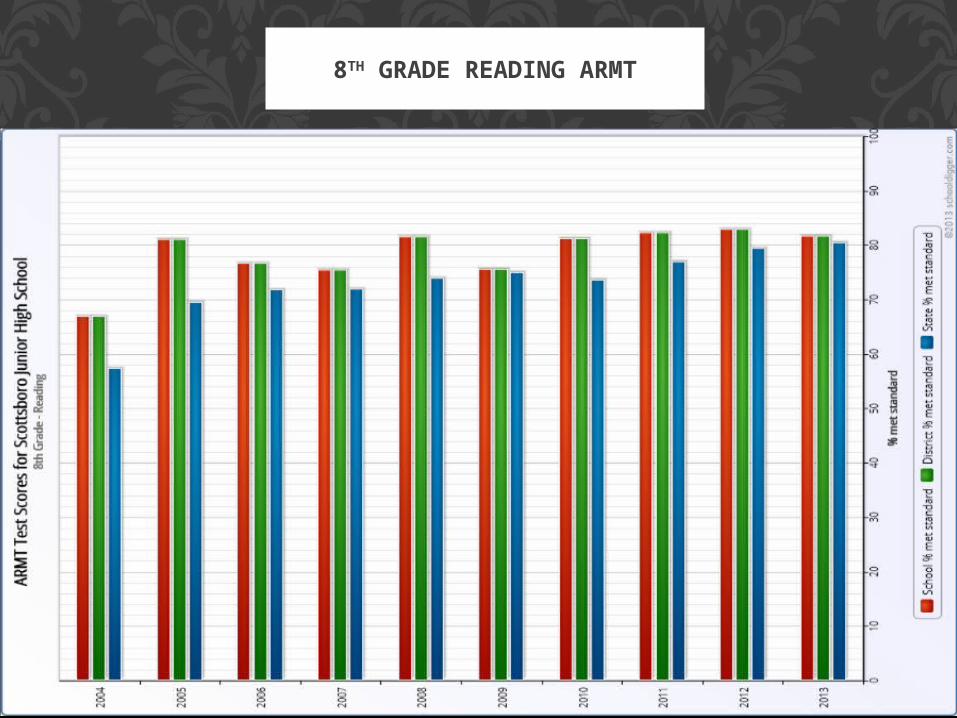
8TH GRADE READING ARMT
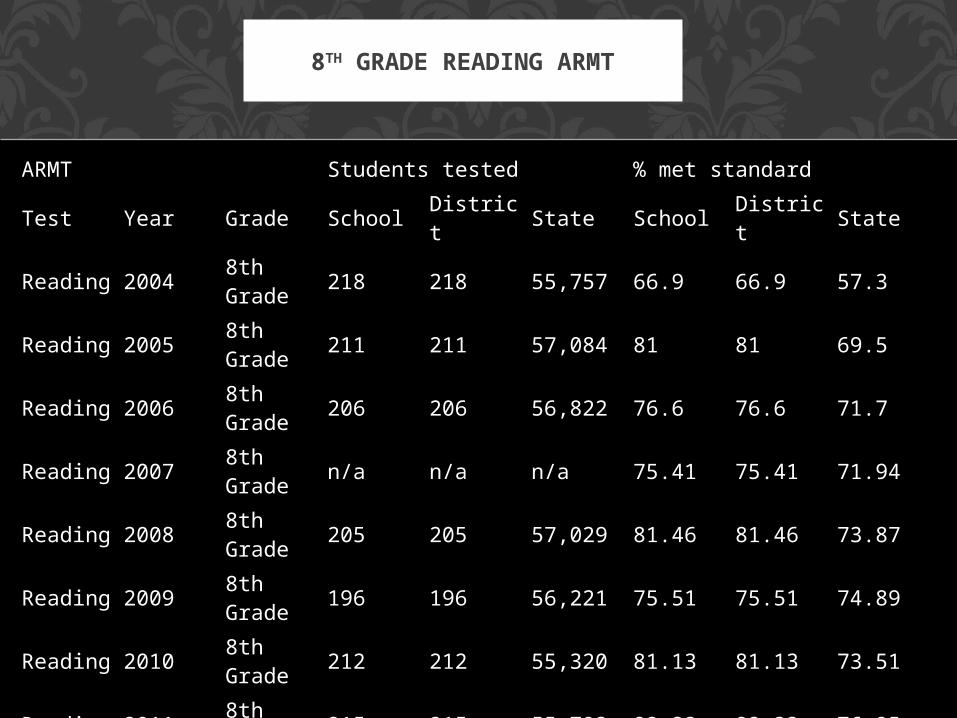
8TH GRADE READING ARMT
ARMT Students tested % met standardTest Year Grade School District State School District State
Reading 2004 8th Grade 218 218 55,757 66.9 66.9 57.3
Reading 2005 8th Grade 211 211 57,084 81 81 69.5
Reading 2006 8th Grade 206 206 56,822 76.6 76.6 71.7
Reading 2007 8th Grade n/a n/a n/a 75.41 75.41 71.94
Reading 2008 8th Grade 205 205 57,029 81.46 81.46 73.87
Reading 2009 8th Grade 196 196 56,221 75.51 75.51 74.89
Reading 2010 8th Grade 212 212 55,320 81.13 81.13 73.51
Reading 2011 8th Grade 215 215 55,793 82.33 82.33 76.95
Reading 2012 8th Grade 193 193 56,429 82.9 82.9 79.33
Reading 2013 8th Grade n/a n/a n/a 81.72 81.72 80.45
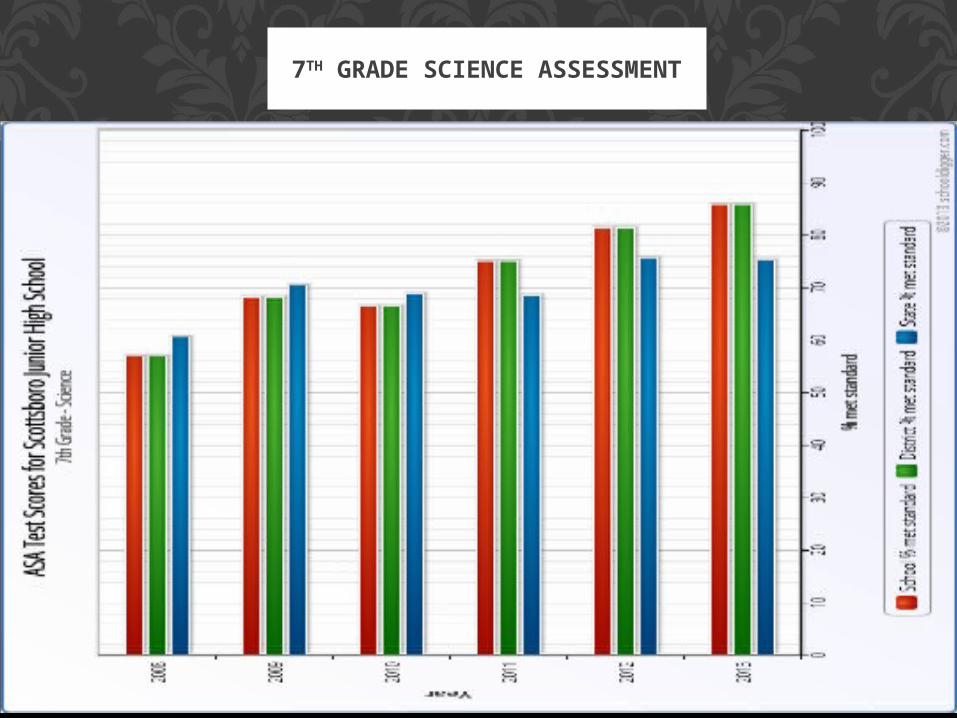
7TH GRADE SCIENCE ASSESSMENT
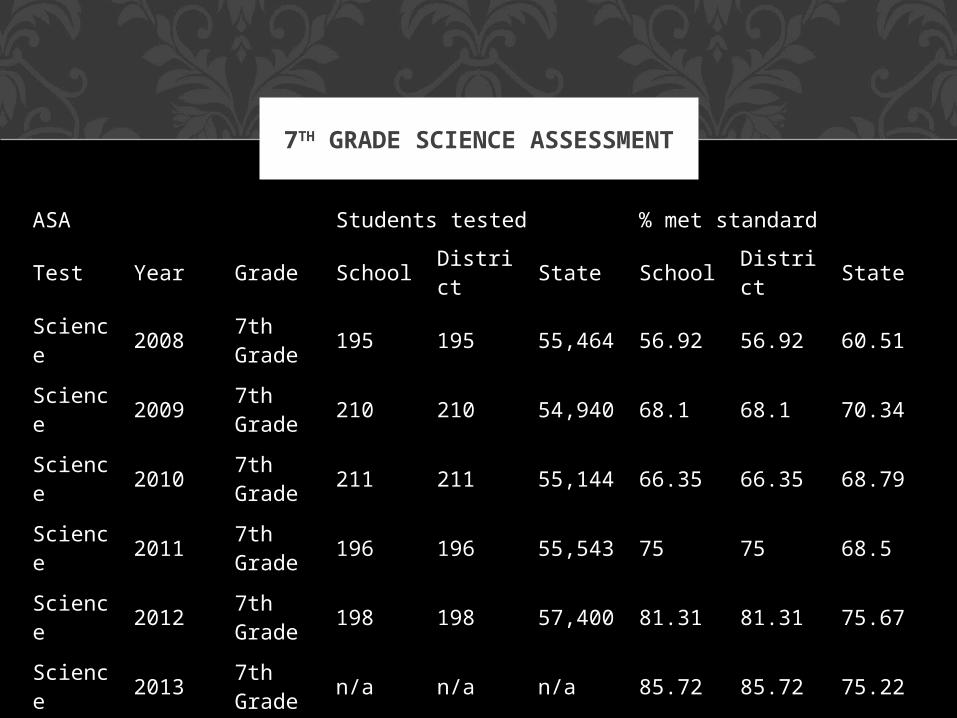
ASA Students tested % met standard
Test Year Grade School District State School District State
Science 2008 7th Grade 195 195 55,464 56.92 56.92 60.51
Science 2009 7th Grade 210 210 54,940 68.1 68.1 70.34
Science 2010 7th Grade 211 211 55,144 66.35 66.35 68.79
Science 2011 7th Grade 196 196 55,543 75 75 68.5
Science 2012 7th Grade 198 198 57,400 81.31 81.31 75.67
Science 2013 7th Grade n/a n/a n/a 85.72 85.72 75.22
7TH GRADE SCIENCE ASSESSMENT
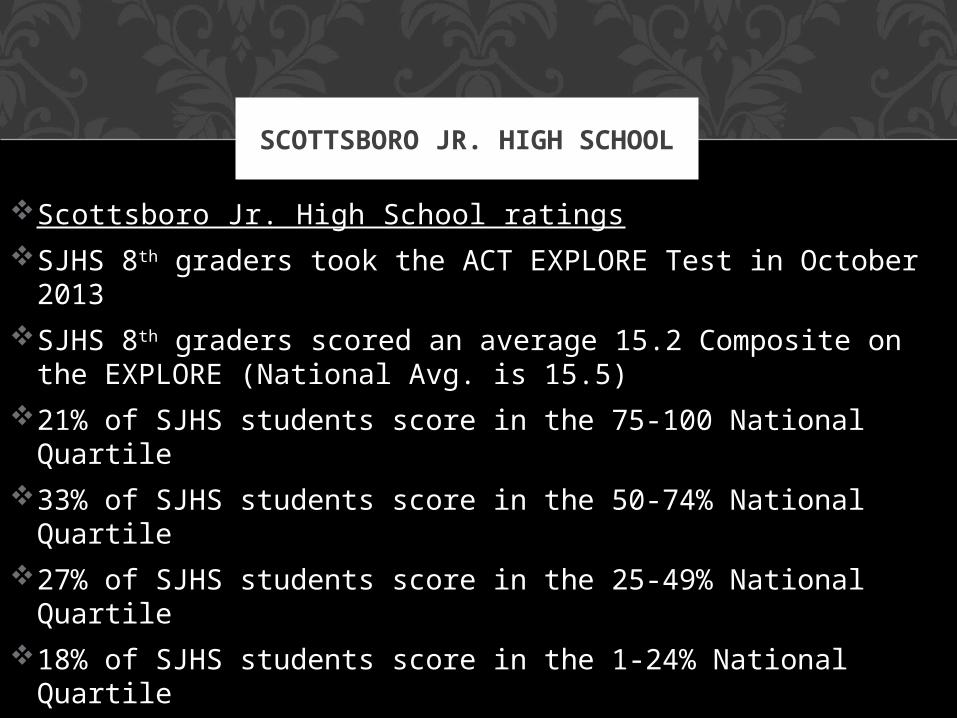
Scottsboro Jr. High School ratings
SJHS 8th graders took the ACT EXPLORE Test in October 2013
SJHS 8th graders scored an average 15.2 Composite on the EXPLORE (National Avg. is 15.5)
21% of SJHS students score in the 75-100 National Quartile
33% of SJHS students score in the 50-74% National Quartile
27% of SJHS students score in the 25-49% National Quartile
18% of SJHS students score in the 1-24% National Quartile
SCOTTSBORO JR. HIGH SCHOOL
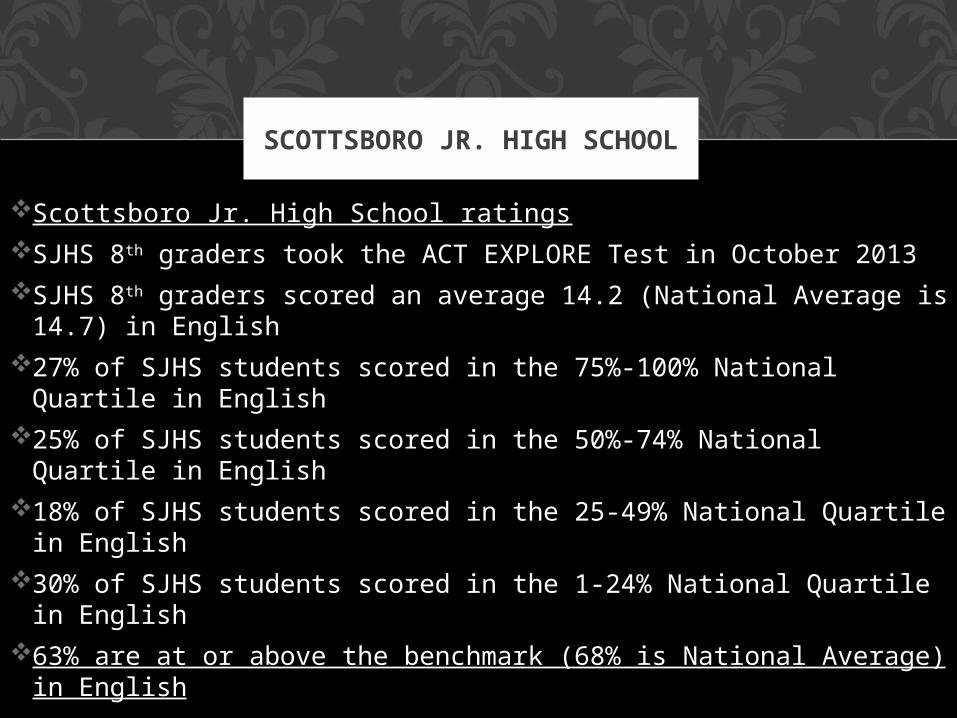
Scottsboro Jr. High School ratings SJHS 8th graders took the ACT EXPLORE Test in October 2013 SJHS 8th graders scored an average 14.2 (National Average is
14.7) in English 27% of SJHS students scored in the 75%-100% National Quartile
in English 25% of SJHS students scored in the 50%-74% National Quartile
in English 18% of SJHS students scored in the 25-49% National Quartile in
English 30% of SJHS students scored in the 1-24% National Quartile in
English 63% are at or above the benchmark (68% is National Average) in
English
SCOTTSBORO JR. HIGH SCHOOL
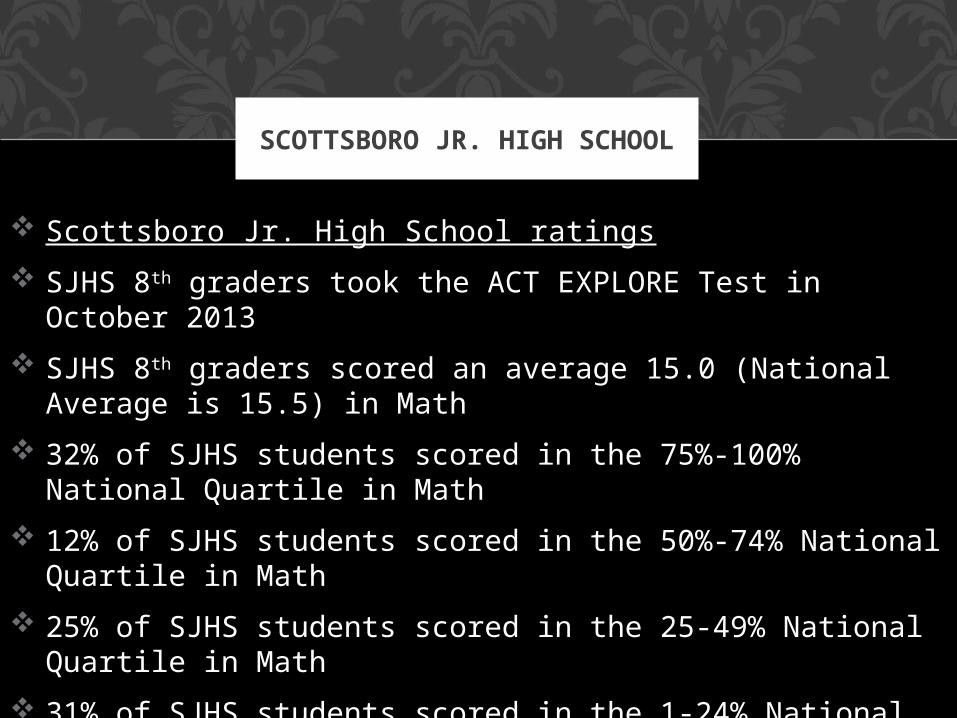
Scottsboro Jr. High School ratings
SJHS 8th graders took the ACT EXPLORE Test in October 2013
SJHS 8th graders scored an average 15.0 (National Average is 15.5) in Math
32% of SJHS students scored in the 75%-100% National Quartile in Math
12% of SJHS students scored in the 50%-74% National Quartile in Math
25% of SJHS students scored in the 25-49% National Quartile in Math
31% of SJHS students scored in the 1-24% National Quartile in Math
32% are at or above the benchmark (36% is National Average) in Math
SCOTTSBORO JR. HIGH SCHOOL
Scottsboro Jr. High School ratings
SJHS 8th graders took the ACT EXPLORE Test in October 2013
SJHS 8th graders scored an average 14.7 (National Average is 14.6) in Reading
28% of SJHS students scored in the 75%-100% National Quartile in Reading
26% of SJHS students scored in the 50%-74% National Quartile in Reading
21% of SJHS students scored in the 25-49% National Quartile in Reading
25% of SJHS students scored in the 1-24% National Quartile in Reading
39% are at or above the benchmark (36% is National Average) in Reading
SCOTTSBORO JR. HIGH SCHOOL
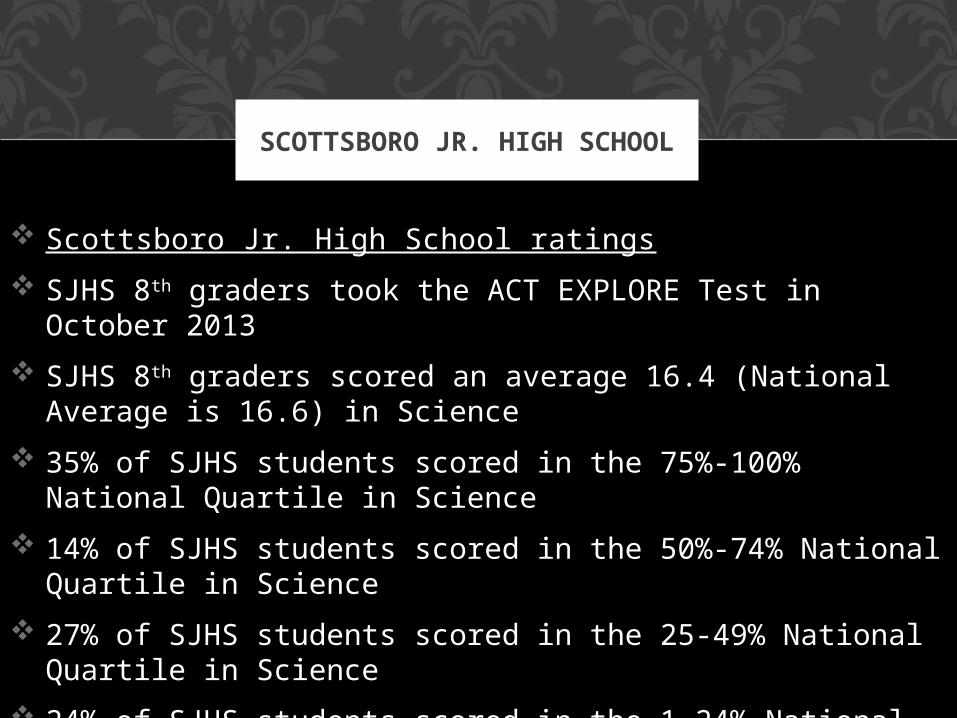
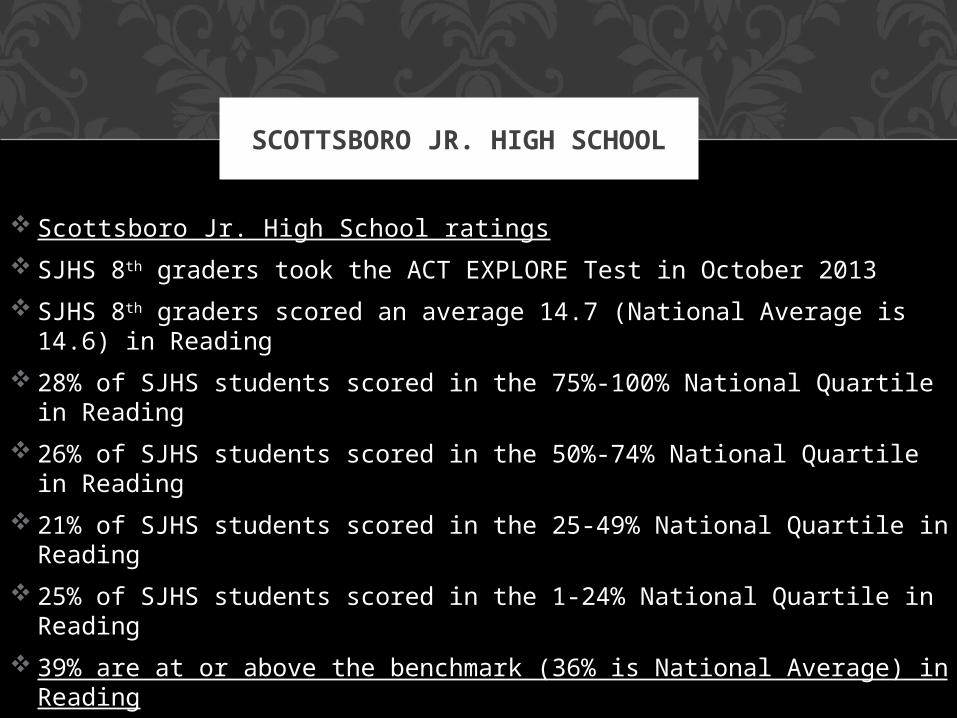
Scottsboro Jr. High School ratings
SJHS 8th graders took the ACT EXPLORE Test in October 2013
SJHS 8th graders scored an average 16.4 (National Average is 16.6) in Science
35% of SJHS students scored in the 75%-100% National Quartile in Science
14% of SJHS students scored in the 50%-74% National Quartile in Science
27% of SJHS students scored in the 25-49% National Quartile in Science
24% of SJHS students scored in the 1-24% National Quartile in Science
35% are at or above the benchmark (37% is National Average) in Science
SCOTTSBORO JR. HIGH SCHOOL

CONCLUSIONS
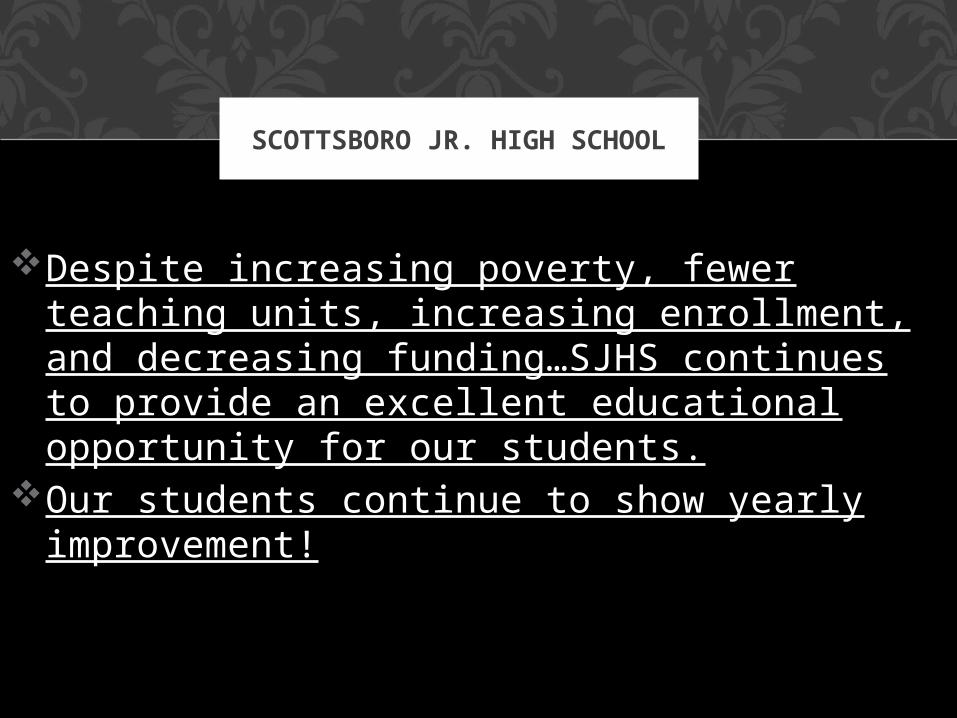
Despite increasing poverty, fewer teaching units, increasing enrollment, and decreasing funding…SJHS continues to provide an excellent educational opportunity for our students.
Our students continue to show yearly improvement!
SCOTTSBORO JR. HIGH SCHOOL