Embed Size (px)
Citation preview

TECHNICAL MEMORANDUM
Scour Analysis for the Hansen Creek
Pedestrian Bridge Project
Prepared for
Skagit County Public Works 1800 Continental Place
Mount Vernon, Washington 98273
Prepared by
Herrera Environmental Consultants 2200 Sixth Avenue, Suite 1100
Seattle, Washington 98121 Telephone: 206.441.9080
May 21, 2012


Contents
Introduction ..................................................................................................................................... 1
Methods........................................................................................................................................... 1
Hydraulic Analysis .................................................................................................................. 1 Scour Analysis ......................................................................................................................... 4
Results ............................................................................................................................................. 4
Hydraulic Characteristics ......................................................................................................... 5 Scour Characteristics ............................................................................................................... 7
Conclusions and Recommendations ............................................................................................... 8
References .................................................................................................................................... 10
Attachment A Draft Bridge Drawings Attachment B Scour Analysis Equations and Output Tables Attachment C HEC-RAS Model Output Attachment D Proposed Location of Log Revetment
c hansen creek pedestrian bridge scour analysis _ draft.docx
i

c hansen creek pedestrian bridge scour analysis _ draft.docx
ii
Tables
Table 1. Summary of bridge scenarios modeled. ......................................................................... 3
Table 2. Hydrologic inputs (steady state) used in the HEC-RAS model. .................................... 3
Table 3. Summary hydraulic model results for the 100-year flood event. ................................... 6
Table 4. Summary of scour analysis results. ................................................................................ 8

Technical Memorandum—Scour Analysis for the Hansen Creek Pedestrian Bridge Project
Introduction
Skagit County (the County) is preparing conceptual drawings and a bid package for the final design and construction of a new pedestrian bridge across Hansen Creek within the Northern State Recreational Area (NSRA). The new pedestrian bridge will allow pedestrian and light maintenance vehicle traffic over Hansen Creek and will replace an existing bridge that is structurally deficient and hazardous. The new bridge site is located approximately 27 feet downstream of the existing bridge location, which currently separates the upper alluvial fan (Reach 2) from the apex of the lower alluvial fan (Reach 3) of Hansen Creek, as defined in the 2002 Hansen Creek Watershed Management Plan (Miller Consulting and Watershed Professionals Network 2002). The proposed prefabricated railcar bridge (see Attachment A, Skagit County 2012) would have a broader clear-span width of about 75 to 85 feet, whereas the existing bridge span width is only about 19 feet. Coincident with constructing the new replacement bridge, the County proposes to remove the old bridge and grade back the channel banks at approximately a 3H:1V (horizontal to vertical) slope landward of the old abutment locations.
This technical memorandum summarizes the methods and results of a scour analysis that was performed to support the structural design of the new bridge crossing. Potential scour of the creek channel bed and banks is an important issue to analyze so that appropriate countermeasures or design alterations are included in the project to assure long-term structure protection. The new pedestrian bridge will not be exposed to direct flow from Hansen Creek immediately after construction because the abutments will be placed several feet behind the existing bank. However, without an upstream log revetment to deflect flow away from the banks, the stream banks will erode over time and the bridge abutments will likely be exposed in the future. As such, the scour analysis presented in this memorandum does not provide an absolute or discrete scour estimate, but rather a range of possible scour outcomes assuming possible channel changes over time. The new crossing and scour mitigation components should be designed to accommodate the estimated maximum probable scour that may occur during a 100-year design flood event based on this range of possible outcomes.
Methods
This section summarizes how an available hydraulic model and hydrologic inputs from a previous analysis for the Reach 3 and Reach 4 Hansen Creek Alluvial Fan and Wetland Restoration Project (Herrera 2007) were modified to evaluate scour associated with the proposed replacement bridge project.
Hydraulic Analysis
The U.S. Army Corps of Engineers’ Hydrologic Engineering Center River Analysis System (HEC-RAS) software was used to analyze both existing conditions and various alternatives of proposed conditions. HEC-RAS was originally developed by the U.S. Army Corps of Engineers (USACE) Hydrologic Engineering Center (HEC) in 1995 (version 1.0) as a flood hazard mapping tool and is typically used by the Federal Emergency Management Agency (FEMA) for
c hansen creek pedestrian bridge scour analysis _ draft.docx
May 21, 2012 1 Herrera Environmental Consultants

Technical Memorandum—Scour Analysis for the Hansen Creek Pedestrian Bridge Project
the development of Flood Insurance Rate Maps (FIRMs). The HEC-RAS program (currently using version 4.1) was the successor to the HEC-2 (river hydraulics) program originally created in 1969.
HEC-RAS is a one-dimensional, stepped, backwater-surface profile program that is used for modeling both steady and unsteady, gradually varied flow. The computational procedure of a steady-state HEC-RAS model is based on the solution of the energy equation and energy losses between adjacent channel/floodplain cross-sections. A typical HEC-RAS model includes numerous channel/floodplain cross-sections through the length of a stream reach. Energy losses at each cross-section are evaluated based on friction (Manning’s equation) and contraction/expansion (coefficient multiplied by the change in velocity head).
The HEC-RAS model used for the Hansen Creek bridge project was based on a previous HEC-RAS model developed to calibrate a 2-dimensional, finite difference, dynamic flood routing FLO-2D hydraulic model for the Hansen Creek Alluvial Fan and Wetland Restoration Project. The input parameters used to establish the geometric, upstream, and downstream boundary conditions of the HEC-RAS model are described in the Conceptual Restoration Report for the Hansen Creek Alluvial Fan and Wetland Restoration Project (Herrera 2007).
HEC-RAS Model Geometry
The geometry files from the original HEC-RAS model for the alluvial fan restoration project (Herrera 2007) were used as the basis for defining the channel upstream, at, and between the existing and proposed bridge crossing sites. The base channel widths, hydraulic roughness coefficients (Manning’s “n” values), and channel elevations were all based on this original HEC-RAS model. It should be noted that the original HEC-RAS model was based on the North American Vertical Datum of 1988 (NAVD 88), whereas the County’s design drawings for the project (Attachment A) reference the National Geodetic Vertical Datum of 1929 (NGVD 29). As the maximum probable scour depths reported are independent of elevation, the datum is not important. However, care should be taken when interpreting any results relative to elevations, as model water surface elevations are reported according to NAVD 88 in this memorandum, and the bridge design elevations are referenced to NGVD 29. For the Hansen Creek bridge location in Skagit County, elevations in either datum can be converted on the basis that NAVD 88 is approximately 3.82 feet higher than NGVD 29. Any elevations specified in this memo reference the appropriate datum used.
To better represent the geometry around the existing and proposed bridge crossing locations, five new cross-sections were interpolated between the upstream-most three cross-sections in the existing model. The geometry file was then modified in order to simulate five possible scenarios for scour around the new bridge site.
The model was adjusted to account for possible combinations of proposed bridge abutment depths, widths, and channel protection options as well as for possible resultant channel changes that would affect the local scour conditions at the new bridge location. Abutments were simulated as flow blockages in the HEC-RAS model. The different scenarios evaluated in the model are summarized in Table 1.
c hansen creek pedestrian bridge scour analysis _ draft.docx
Herrera Environmental Consultants 2 May 21, 2012

Technical Memorandum—Scour Analysis for the Hansen Creek Pedestrian Bridge Project
Table 1. Summary of bridge scenarios modeled.
Scenario Description
1 Constructed condition of the new bridge where the flow is not in direct contact with the new bridge abutments
2 Scour of the banks and initial exposure of the new bridge abutments (small flow obstruction of 5 feet)
3 Additional scour and exposure of the new bridge abutments (medium flow obstruction of 10 feet)4 Additional scour and exposure of the new bridge abutments (large flow obstruction of 15 feet)5 Upstream log revetment to deflect flow away from the new bridge abutments to eliminate
abutment scour effect
Downstream Boundary Condition The HEC-RAS model extends downstream to the State Route (SR) 20 bridge. The downstream boundary condition assumes uniform flow (channel bed slope equals the water surface slope) at the extents of the model. This is the most common type of downstream boundary condition used for HEC-RAS models where known water surfaces based upon actual flow or stage data are not available at the downstream boundary. It is important to note that the downstream boundary condition will have no effect on the upstream model results near the new bridge. The water surface elevation, and thus flow velocity, at the bridge site is hydraulically controlled by channel confinement for approximately 400 feet downstream of the new bridge. As such, recent channel changes in the Reach 3 restoration area (700 feet downstream of the new bridge) will have no effect on the model results.
Upstream Boundary Condition The upstream boundary condition for the HEC-RAS model included steady state inflows (i.e., a single flow value as opposed to a continuous hydrograph) for various flood events. The peak flood flows (discharges) were derived from the Hansen Creek flow data produced for the Hansen Creek Conceptual Restoration Report (Herrera 2007) and are summarized in Table 2.
Table 2. Hydrologic inputs (steady state) used in the HEC-RAS model.
Return Interval (years)
Hansen Creek Discharge (cfs)
2 3505 500
25 650100 800
cfs – cubic feet per second
c hansen creek pedestrian bridge scour analysis _ draft.docx
May 21, 2012 3 Herrera Environmental Consultants

Technical Memorandum—Scour Analysis for the Hansen Creek Pedestrian Bridge Project
Scour Analysis
The scour analysis performed for this project was based on evaluation of several empirical equations developed primarily for the design and analysis of bridge pier scour, as outlined in the Federal Highway Administration’s Hydraulic Engineering Circular No. 18 (FHWA 2001). A detailed description of all equations used and a list of all references cited for the scour analysis are provided in Attachment B. Although the empirical equations represent the best available quantitative methods for evaluating local scour at road crossings, care should be taken in applying these equations for bridge abutments or large woody debris obstructions when many of the physical features such as the size of the substrate or structure may be outside of the numeric limits from which the empirical equations were derived. As a result, the scour estimates produced from these empirical equations must be tempered by observations of actual scour in the field and professional judgment of scour potential given the vulnerability of the channel at a specific site. For the Hansen Creek pedestrian bridge analysis, both the model inputs and the equations used to produce the scour results (Attachment B) were considered to be conservative; thus additional factors of safety were not applied.
Three main types of scour are applicable to the assessment of total scour for the bridge crossing site:
1. Long-term scour due to degradation of the channel bed over time 2. General scour caused by contraction or constriction of flow 3. Local scour (abutment scour or pool formation scour from meander migration)
Long-term scour includes the adjustment of the bed elevation due to overall channel scour over time. For example, the Hansen Creek channel has historically been incising through the Skagit River terrace since the last glacial uplift began, approximately 12,000 years ago. However, given a likely life-span of 50 to 100 years for the replaced bridge structure, the long-term scour resulting from this geologic time-scale incision was assumed to be negligible for the bridge site. Therefore, future scour that may occur at the new bridge crossing is much more likely to be related to general and local scour. For the proposed bridge site, general scour could be induced by contraction or constriction of flow across the entire channel width, and local scour could be induced at an abutment where the direction of flow is perpendicular to the obstruction, or where riffle-pool sequence bed undulations occur parallel along the abutment face. The empirical equations used to evaluate general and local scour require various input parameters for stream substrate characteristics, flow velocity, flow depth, and pier shape characteristics, most of which were derived from the hydraulic model results. A more detailed description of the scour analysis methods, equations, assumptions, and input variables is provided in Attachment B.
Results
This section presents the results of the scour analysis.
c hansen creek pedestrian bridge scour analysis _ draft.docx
Herrera Environmental Consultants 4 May 21, 2012

Technical Memorandum—Scour Analysis for the Hansen Creek Pedestrian Bridge Project
Hydraulic Characteristics
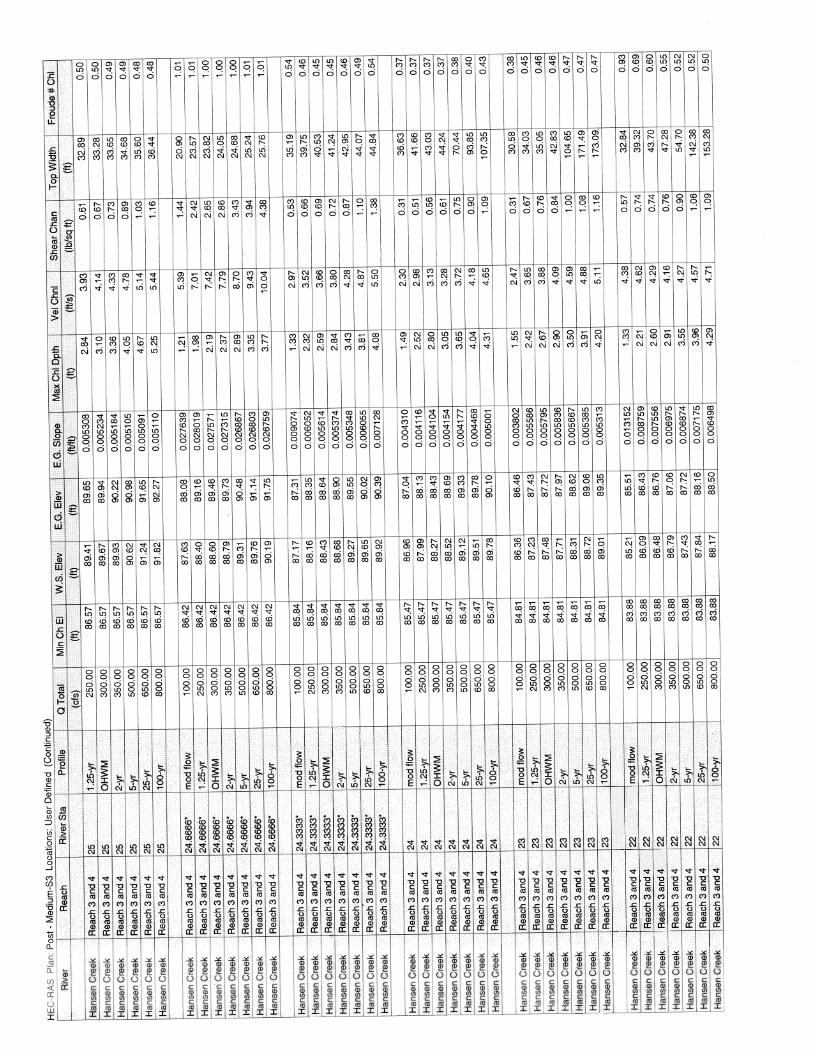
The detailed water surface elevation (WSE, in NAVD 88), depth, velocity, and energy grade-line results from the HEC-RAS model are provided in Attachment C. Table 3 provides summary hydraulic model results that were used as inputs to the scour analysis calculations.
c hansen creek pedestrian bridge scour analysis _ draft.docx
May 21, 2012 5 Herrera Environmental Consultants

Technical Memorandum—Scour Analysis for the Hansen Creek Pedestrian Bridge Project
Table 3. Summary hydraulic model results for the 100-year flood event.
Modeled Scenario River
Station Water Surface Elevation
(ft, NAVD 88) Flow Velocity
(ft/s) Maximum Water Depth
(ft)
Existing 26.2 91.8 6.6 5.7 26 91.6 6.3 5.9 25 90.7 9.1 4.2
24.6 90.2 9.1 3.8 24.3 89.8 8.6 4.0
1 26.2 91.7 6.2 5.6 26 91.7 4.8 6.0 25 91.4 6.1 4.8
24.6 90.2 9.1 3.8 24.3 89.8 8.6 4.0
2 26.2 91.5 6.8 5.4 26 91.5 5.0 5.8 25 91.0 6.8 4.5
24.6 89.8 9.1 3.4 24.3 89.9 5.5 4.1
3 26.2 92.1 5.5 6.0 26 92.1 4.5 6.3 25 91.8 5.4 5.3
24.6 90.2 10.0 3.8 24.3 89.9 5.5 4.1
4 26.2 92.9 4.4 6.8 26 92.9 3.8 7.1 25 92.7 4.4 6.2
24.6 90.8 10.7 4.4 24.3 89.9 5.5 4.1
5 26.2 91.1 6.2 4.4 26 91.2 4.2 5.2 25 90.7 6.0 3.5
24.6 90.2 6.6 3.7 24.3 89.9 6.0 3.7
c hansen creek pedestrian bridge scour analysis _ draft.docx
Herrera Environmental Consultants 6 May 21, 2012

Technical Memorandum—Scour Analysis for the Hansen Creek Pedestrian Bridge Project
Scour Characteristics
The detailed model output used for scour analysis inputs is presented in Attachment C and the scour results are presented in Attachment B. Table 4 provides a summary of the scour analysis results. The maximum scour depth is a cumulative effect (additive) of the different scour types. It should be noted that the maximum probable scour results presented in Table 4 represent a maximum scour depth that could be experienced during the peak of a 100-year flood event. Following the peak of the flood event, the channel bed scour-hole formed at the bridge site will likely be partially filled in with bedload material moving downstream, resulting in a semi-permanent channel bed configuration that is due primarily to long-term scour. The permanent bed scour that remains between flood events would be much shallower than the maximum scour hole depth that could occur in the midst of a large flood.
General scour from constriction of the channel was approximated with conservative assumptions of channel bank erosion leading to the exposure of the abutment with flow striking the abutment at a 90 degree (perpendicular) angle. The estimates are conservative because they assume bank erosion and channel expansion which will likely result in general aggradation of the channel bed. General constriction scour was estimated to range from 0 to 2.5 feet.
Abutment scour is a local scour phenomenon that is a function of the confinement of flow behind an obstruction and the subsequent “squeezing” of the confined flow into the main channel. Turbulence and vortex eddies result in a vertical deformation of the channel bed. Even relatively small abutments can result in significant turbulence, vortices, and scour. The results presented in Table 4 indicate that local abutment scour is the most significant scour effect at the project site and could range from 8.6 to 11.5 feet in the 100-year flood event. Once the abutment is exposed to direct flow, even for a small flow obstruction, the scour depths can be very high. The scour depths increase with increasing obstruction lengths (exposure to flow), but the highest proportional scour is during the initial exposure of the abutment. For Scenario 5 where the abutment scour at the bridge is eliminated assuming an upstream log revetment effectively deflects the flow away from the perpendicular face of the abutment, the calculated maximum probable scour is reduced by over 5 times (2.5 feet). The predominant scour effect expected for scenario 5 is associated with bed undulations from typical riffle-pool sequences, developed during meander migration along the smooth face of the bridge abutment.
Scour that may occur at the bridge site over time depends significantly on whether an upstream revetment (made of logs or other material) is installed to deflect flow into the center of the channel and dampen local scour effects upstream of the bridge. In the short term following bridge construction, the channel will be nowhere near the new bridge abutments, but the channel bed under the bridge may generally incise by 1.3 feet during the peak flow in a 100-year flood. Over time, as the banks erode, the scour depth could be as much as 14 feet in a 100-year flood event at either of the new bridge abutments assuming there is no upstream structure or revetment to deflect flow away from the abutments. See the Attachment D graphics that illustrate a possible route of a neck cutoff, which is a type of meander migration in which an entire meander loop is cut off at its narrowest point. A neck cutoff could isolate the meander immediately upstream of the existing bridge and result in significant erosion of the right bank. The timeframe
c hansen creek pedestrian bridge scour analysis _ draft.docx
May 21, 2012 7 Herrera Environmental Consultants

Technical Memorandum—Scour Analysis for the Hansen Creek Pedestrian Bridge Project
of this bank scour propagation is impossible to predict as it depends on the magnitude and frequency of future flood events and the Hansen Creek channel has been locked into its current alignment at the project site for many years, limiting natural lateral migration. Therefore, the sooner a flow deflection or revetment structure could be installed, the sooner the bridge abutments could be protected from a neck cutoff or lateral migration that could endanger the bridge abutments.
Any flow deflection or revetment structures would also need to be designed to resist scour; however, the location(s) and orientation(s) of such deflection or revetment structures could be optimized to shift the location of scour further away from the bank or abutment as well as to reduce the maximum probable design scour depth. Although any flow deflection or revetment structures have yet to be designed, it is assumed that they could be optimized such that the maximum probable design scour depths are in the range of 8 to 10 feet, versus the maximum of 14 feet for Scenario 4 with abutment scour associated with a large flow obstruction.
Table 4. Summary of scour analysis results.
Modeled Scenario
Scour Type Maximum
Probable Scour Depth
(ft)
General – 100-yr Max Local – 100-yr Max Local – 100-yr Max
Constriction (ft) Abutment (ft) Meander Pools along Abutment Wall (ft)
1 (Post Const) 1.3 0 0 1.32 (Small) 1.1 8.6 0 9.73 (Medium) 2.0 10.4 0 12.44 (Large) 2.5 11.5 0 14.05 (with Revetment) 0.4 0 2.1 2.5
Conclusions and Recommendations
There are many types of scour effects that should be considered for the protection of bridge infrastructure such as long-term scour, general scour (constriction), and local scour (abutment protrusion into the flow). Long-term scour is expected to be negligible at the new bridge site because that process is occurring on a geologic time scale and the bridge site is located within an alluvial fan that is generally aggrading. Constriction scour is typically small but must be considered for reductions in the effective channel width. Localized abutment scour is the most prevalent scour effect and mitigation of this type of scour can reduce risk and bridge costs.
The results presented in this memorandum indicate that the new bridge should be designed to accommodate possible scour depths ranging from 2.5 to 14 feet in the 100-year flood event depending on the selected design approach. A 100-year flood event is appropriate for design of scour protection because statistical probability indicates that one or more such floods could occur within the design life of the bridge. If no upstream revetment structure is installed to deflect flow into the center of the channel, the footings of the new bridge abutments should be designed
c hansen creek pedestrian bridge scour analysis _ draft.docx
Herrera Environmental Consultants 8 May 21, 2012

Technical Memorandum—Scour Analysis for the Hansen Creek Pedestrian Bridge Project
to accommodate maximum probable scour of 14 feet (down to elevation 68 feet [NGVD 29], assuming a channel thalweg elevation of 82 feet [NGVD 29]). If an upstream revetment structure is installed in the general configuration provided in Attachment D, the footings of the bridge abutment could be designed to accommodate maximum probable scour of up to 3 feet (placed down to an elevation of 79 to 80 feet [NGVD 29]). It is important to note that the upstream revetment structure(s) will experience relatively large scour depths in dissipating the energy before the flow approaches the new bridge. This potential scour depth at the revetment can be minimized by:
1. Increasing the roughness of the structure by providing a hydraulically complex frontal area of the revetment. A wall of rootwads provides marginal roughness, but complex orientations of logs with varying lengths projecting into the flow provide significantly more roughness and dissipation of energy.
2. Placing the logs further out into the flow with the core of the structure (anchoring) set back into the bank. This induces the scour to occur further out into the channel and away from the core of the structure.
Channel restoration efforts associated with the replacement of the bridge crossing structure should include some re-grading to lay back the banks around the existing bridge site in anticipation of where a neck cutoff avulsion is otherwise likely to occur between the eroding right bank upstream of the existing bridge site and the unarmored right bank downstream of the existing bridge site. This grading should ensure that the right bank is set back enough so that the addition of any roughening along the bank does not constrict the active floodplain width to less than 40 feet. It is also recommended that the right bank floodplain upstream of the new bridge crossing be excavated to set back the bank.
Wood revetment structures should also be included in the project plans to help with sediment retention and to direct flow through the new channel crossing. Wood revetment structures should be placed along the re-graded right bank in order to provide a smoother transition along the new cutoff channel as well as to prevent channel erosion from heading toward or around the outside of the proposed right bank abutment. The wood revetment structures should not be placed too close to the center of the channel, however, so as to avoid flow concentration and debris accumulation upstream of the new bridge.
c hansen creek pedestrian bridge scour analysis _ draft.docx
May 21, 2012 9 Herrera Environmental Consultants

Technical Memorandum—Scour Analysis for the Hansen Creek Pedestrian Bridge Project
c hansen creek pedestrian bridge scour analysis _ draft.docx
Herrera Environmental Consultants 10 May 21, 2012
References 1
FHWA. 2001. Hydraulic Engineering Circular 18: Evaluating Scour at Bridges, Fourth Edition. Publication No. FHWA NHI 01-001, HEC-18. Federal Highway Administration.
Herrera. 2007. Conceptual Restoration Report for the Hansen Creek Alluvial Fan and Adjacent Wetland Restoration Project. Prepared for the Upper Skagit Indian Tribe by Herrera Environmental, Inc.
Miller Consulting and Watershed Professionals Network. 2002. Hansen Creek Watershed Management Plan. Prepared for the Skagit County Public Works Department by Miller Consulting and Watershed Professionals Network.
Skagit County. 2012. Draft CAD drawings of the proposed bridge plan and section. Obtained via email on April 3, 2012 from Jeff McGowan at Skagit County to Christina Avolio at Herrera.
1 Note: A complete list of scour references is provided in Attachment B.

ATTACHMENT A
Draft Bridge Drawings


ATTACHMENT B
Scour Analysis Equations and Output
Tables

Technical Memorandum—Scour Analysis for the Hansen Creek Pedestrian Bridge Project
Scour Analysis Equations
The scour analysis performed for this project was based on the evaluation of several empirical equations developed primarily for the design and analysis of bridge pier scour. Care should be taken in applying these equations for culverts or large woody debris obstructions when many of the physical features such as the size of the substrate or structure may be outside of the numeric limits from which the empirical equations were derived. These empirical equations include various input parameters for sediment characteristics, flow velocity, flow depth, and pier shape characteristics. The equations include empirical constants and factors for pier width-to-depth ratios, as well as soil characteristics based on typical bridge piers or scaled physical models that typically include sand-bedded or fine gravel systems.
Three main types of scour are applicable to the assessment of total scour for bridges or wood structures:
1) Long-term scour 1) General scour caused by contraction or constriction scour 2) Local scour (abutment scour or pool formation scour from meander migration)
Long-term scour includes the adjustment of the bed elevation due to overall channel scour over time. Long-term scour may be associated with the degradation of a channel bed over time due to a deficit in the upstream sediment supply (FHWA 2001).
Bed deformation around the bridge abutments will be mostly driven by general scour phenomena such as contraction scour and local scour processes associated with abutment scour or pool formation scour associated with riffle-pool sequences resulting from meander migration. Contraction scour is the scour associated with flow acceleration through a constriction and is applicable to the scour process that can be expected for the bridge. Local scour includes complex downward and lateral flow accelerations around obstructions such as the abutments for the bridge or the log revetment.
The following equations were used in the scour analysis:
1) Contraction Scour:
a) Modified Laursen Equation (FHWA 2001) b) Parker Equation (FHWA 2001)
2) Local Scour – Abutment Scour:
a) Froehlich Equation (FHWA 2001; WDFW 2002) b) Liu Equation (Liu et al. 1961) c) Ahmad Equation (1953)
3) Local Scour – Pool Riffle Sequences (meander morphology, bed undulations):
a) Lofthouse and Robert (2008)
c /attachment b - scour analysis equations and results.docx
May 21, 2012 B-1 Herrera Environmental Consultants

Technical Memorandum—Scour Analysis for the Hansen Creek Pedestrian Bridge Project
1) Contraction Scour Equations: Modified Laursen Equation (FHWA 2001)
The modified Laursen equation (Equation 1) is recommended by the Federal Highway Administration (FHWA 2001) and the Washington Department of Fish and Wildlife (WDFW 2002) for estimation of contraction scour in live-bed conditions (a bed where active sediment transport is occurring). The modified Laursen equation accounts for contraction scour that occurs at the structure (Fischenich and Landers 2000). This equation was developed primarily for sand-bed channels, but can provide a conservative estimate of scour depth in gravel-bed channels (WDFW 2002).
022
1
7/6
1
2
1
2 ;1
yydWW
yy
cs
k
−=⎟⎟⎠
⎞⎜⎜⎝
⎛⎟⎟⎠
⎞⎜⎜⎝
⎛= (Equation 1)
Where: dcs = average depth of contraction scour, in meters (m) y0 = existing depth in contracted section before scour, m y1 = average depth in upstream main channel, m y2 = average depth in contracted section after scour, m Q1 = flow in upstream main channel, cubic meters per second (cms) Q2 = flow in contracted channel, cms W1 = channel bottom width of upstream main channel, m W2 = channel bottom width in contracted section, m k1 = exponent determined using Table B-1 u* = shear velocity in upstream section, m/s= Sgy1 ω = fall velocity of bed material based on the D50, m/s = 501)gD-(G S = slope of energy grade line of main channel, m/m
Table B-1. Exponent k1 based on u*/ω.
U*/ω k1 Mode of Bed Material Transport
<0.50 0.59 Mostly bedload0.50 to 2.0 0.64 Some suspended load
>2.0 0.69 Mostly suspended load
Parker Equation (1981) as Referenced in Melville and Coleman (2000)
The Parker equation estimates an average depth of contraction scour based on channel geometry upstream of and within the contracted section of channel, and an empirical relationship between channel dimensions and scour depth as reflected in equations 2 and 3 below.
c /attachment b - scour analysis equations and results.docx
Herrera Environmental Consultants B-2 May 21, 2012

Technical Memorandum—Scour Analysis for the Hansen Creek Pedestrian Bridge Project
(Equation 2) 02 yyd cs −=
where: (Equation 3)
4
2
1
1
2
k
WW
yy
⎟⎟⎠
⎞⎜⎜⎝
⎛=
dcs = average depth of contraction scour, meters (m) y0 = existing depth in contracted section before scour, m y1 = average depth in upstream main channel, m y2 = average depth in contracted section after scour, m W1 = channel bottom width of upstream main channel, m W2 = channel bottom width in contracted section, m K4 = exponent; range used to derive a minimum and maximum:
K4 min = 0.675 K4 max = 0.825
2) Abutment Scour Equations Froehlich Equation (FHWA 2001, WDFW 2002)
The modified Froehlich (1989) equation is recommended by FHWA (2001), WDFW (2002), and Melville and Coleman (2000) for estimation of local abutment scour in live-bed conditions. This equation was developed using laboratory flume regression results.
0.127.2 61.0
43.0
21 +⎟⎟⎠
⎞⎜⎜⎝
⎛ ′= Fr
yLKK
yd as
(Equation 4)
Where: das = depth of scour, m K1 = coefficient for abutment shape K2 = coefficient for angle of embankment to flow
0.13
⎟⎠⎞
⎜⎝⎛=
90K 2
θ
θ<90º if embankment points downstream θ>90º if embankment points upstream)
L' = length of embankment projected normal to flow, m θ ′=′ cosLL , if θ>90 degrees (embankment pointing upstream), then 90−=′ θθ if θ<90 degrees (embankment pointing downstream), then θθ =′
y = flow depth, m
Liu Equation (Liu et al. 1961)
The Liu et al. (1961) equation is recommended by Hoffmans and Verheij (1997). This equation was developed from a dimensional analysis for sand-bed channels. c /attachment b - scour analysis equations and results.docx
May 21, 2012 B-3 Herrera Environmental Consultants

Technical Memorandum—Scour Analysis for the Hansen Creek Pedestrian Bridge Project
33.04.0
FryLyKd Las ⎟⎟⎠
⎞⎜⎜⎝
⎛=
(Equation 5)
Where: das = depth of scour, m KL = coefficient for abutment shape: streamlined: KL=1.1; blunt KL=2.15) y = flow depth, m L = abutment length into flow, m
Ahmad Equation (1953)
The Ahmad (1953) equation was recommended by Hoffmans and Verheij (1997). This equation is based on field and model studies; and was developed for alluvial rivers in Pakistan. The correction factors used with this equation are listed in Table B-2.
3/2
1 1 ⎥⎦⎤
⎢⎣⎡−
′=+m
qKKyd AAas (Equation 6)
Where: K’A =2.14g-1/3 (≈1.0 m-1/3s2/3) 1/WLm =
q =upstream discharge per unit width, m2/s KA =correction factor
ηα KKKKK SPA 2= Kp =correction factor for influence of channel bend (Table B-2) Ks =correction factor for influence of shape of structure (Table B-2) Kα =correction factor for influence of angle of attack (Table B-2) Kη =correction factor for influence of porosity (Table B-2)
Table B-2. Correction factors for Ahmad (1953) from Hoffmans and Verheij (1997).
Kp Position of Structure in Bend Kα Angle of Attack
1.00 Straight channel 0.80 30º 1.10 Concave side of bend 0.90 45º 0.85 Convex side of bend 0.95 60º 1.40 Downstream part of concave side (sharp bend) 1.00 90º 1.10 Downstream part of concave side (moderate bend) 1.05 120º 1.10 150º
Ks Shape of Structure Kη Structure
1.00 Vertical-wall abutment 1.0 20% porosity0.85 Spill through abutment with 45º side slopes 0.9 50% porosity (1V:2H) 0.6 50% porosity (1V:3.5H)
c /attachment b - scour analysis equations and results.docx
Herrera Environmental Consultants B-4 May 21, 2012

Technical Memorandum—Scour Analysis for the Hansen Creek Pedestrian Bridge Project
3) Local Scour – Riffle-Pool Sequences and Meander Migration Relationships The Lofthouse and Robert (2008) Relationships
Lofthouse and Robert (2008) evaluated relationships between the length, height, and curvature of riffle-pool sequences with respect to meander morphology. Statistical relationships were established between these parameters based on five alluvial, gravel bedded river reaches near Toronto, Ontario, with average reach gradients less than 1%. In this study, riffle-riffle sequence height would be equivalent to the maximum scour depth associated with local pools developed due to meander migration. If the length of a riffle-riffle sequence is known, a maximum height (or riffle-pool meander scour depth) can be derived from Figure B-1, below. For Reach 3 of Hansen Creek, downstream of the bridge site, riffle-riffle sequences were approximately 70ft long, thus using a maximum height to length ratio of about 0.03 from Figure B-1 below, results in a height (or a maximum riffle-pool meander scour depth) of about 2.1 feet.
Figure B-1. Relationship between riffle-riffle sequence height to length ratios and total angular deflection for meandering, alluvial rivers.
c /attachment b - scour analysis equations and results.docx
May 21, 2012 B-5 Herrera Environmental Consultants

Technical Memorandum—Scour Analysis for the Hansen Creek Pedestrian Bridge Project
Scour Analysis Results
Contraction Scour
INPUT SUMMARY FOR CONSTRICTION SCOUR
Hansen Creek Pedestrian Bridge - Scenario 1: Bridge Removal Only
symbol variable unit Mean Value
y0 existing depth in contracted section before scour ft 3.03
y1 average depth in upstream main channel ft 3.62
Q1 flow in upstream main channel ft3/s 800
Q2 flow in contracted channel ft3/s 800
W1 channel bottom width of upstream main channel ft 32
W2 channel bottom width in contracted section ft 25
D50 median diameter of bed material mm 25
S Slope of energy grade line of main channel ft/ft 0.01
OUTPUT SUMMARY FOR CONSTRICTION SCOUR Hansen Creek Pedestrian Bridge - Scenario 1: Bridge Removal Only
Output Summary Table Laursen Equation 1.21 ft Parker Equation 1.33 ft
Average 1.27 ft
c /attachment b - scour analysis equations and results.docx
Herrera Environmental Consultants B-6 May 21, 2012

Technical Memorandum—Scour Analysis for the Hansen Creek Pedestrian Bridge Project
INPUT SUMMARY FOR CONSTRICTION SCOUR Hansen Creek Pedestrian Bridge - Scenario 2: Small Obstruction
symbol variable unit Mean Value
y0 existing depth in contracted section before scour ft 2.82
y1 average depth in upstream main channel ft 3.30
Q1 flow in upstream main channel ft3/s 800
Q2 flow in contracted channel ft3/s 800
W1 channel bottom width of upstream main channel ft 32
W2 channel bottom width in contracted section ft 28
D50 median diameter of bed material mm 25
S Slope of energy grade line of main channel ft/ft 0.0089
OUTPUT SUMMARY FOR CONSTRICTION SCOUR Hansen Creek Pedestrian Bridge - Scenario 2: Small Obstruction
Output Summary Table Laursen Equation 0.74 ft Parker Equation 0.82 ft
Average 0.78 ft
c /attachment b - scour analysis equations and results.docx
May 21, 2012 B-7 Herrera Environmental Consultants

Technical Memorandum—Scour Analysis for the Hansen Creek Pedestrian Bridge Project
INPUT SUMMARY FOR CONSTRICTION SCOUR
Hansen Creek Pedestrian Bridge - Scenario 3: Medium Obstruction
symbol variable unit Mean Value
y0 existing depth in contracted section before scour ft 3.02
y1 average depth in upstream main channel ft 4.05
Q1 flow in upstream main channel ft3/s 800
Q2 flow in contracted channel ft3/s 800
W1 channel bottom width of upstream main channel ft 32
W2 channel bottom width in contracted section ft 23.5
D50 median diameter of bed material mm 25
S Slope of energy grade line of main channel ft/ft 0.015
OUTPUT SUMMARY FOR CONSTRICTION SCOUR Hansen Creek Pedestrian Bridge - Scenario 3: Medium Obstruction
Output Summary Table Laursen Equation 1.91 ft Parker Equation 2.08 ft
Average 2.00 ft
c /attachment b - scour analysis equations and results.docx
Herrera Environmental Consultants B-8 May 21, 2012

Technical Memorandum—Scour Analysis for the Hansen Creek Pedestrian Bridge Project
INPUT SUMMARY FOR CONSTRICTION SCOUR
Hansen Creek Pedestrian Bridge - Scenario 4: Large Obstruction
symbol variable unit Mean Value
y0 existing depth in contracted section before scour ft 3.54
y1 average depth in upstream main channel ft 4.37
Q1 flow in upstream main channel ft3/s 800
Q2 flow in contracted channel ft3/s 800
W1 channel bottom width of upstream main channel ft 32
W2 channel bottom width in contracted section ft 20
D50 median diameter of bed material mm 25
S Slope of energy grade line of main channel ft/ft 0.021
OUTPUT SUMMARY FOR CONSTRICTION SCOUR Hansen Creek Pedestrian Bridge - Scenario 4: Large Obstruction
Output Summary Table Laursen Equation 2.35 ft Parker Equation 2.67 ft
Average 2.51 ft
c /attachment b - scour analysis equations and results.docx
May 21, 2012 B-9 Herrera Environmental Consultants

Technical Memorandum—Scour Analysis for the Hansen Creek Pedestrian Bridge Project
Abutment Scour
INPUT SUMMARY FOR LOCAL ABUTMENT SCOUR
Hansen Creek Pedestrian Bridge - Scenario 2: Small Obstruction INPUT VARIABLES FOR CALCULATIONS
approach flow depth= y= 4.45 ft
approach flow depth on floodplain= ya= 3.58 ft
length of embankment= L= 5.0 ft
length of obstruction (blockage of flow tube)= Lob= 5.0 ft
velocity upstream of structure= V= 6.76 ft/s
Calculated velocity directly upstream of structure= Vob= 6.76 ft/s
abutment shape coefficient= K1= 1
angle of structure to flow= θ= 90 degrees
unobstructed channel width= W1= 40 ft
coefficient for abutment shape (Liu et Al.)= KL= 2.15
correction factor for influence of channel bend= Kp= 1
correction factor for influence of shape of structure= Ks= 1
correction factor for influence of angle of attack= Ka= 1
correction factor for influence of porosity= Kn= 1
upstream flow obstructed by abutment/embankment= Qob = 121 ft3/s
upstream flow= Q = 800 ft3/s
unit discharge (Q/W1)= q = 20.0 ft2/s
OUTPUT SUMMARY FOR LOCAL ABUTMENT SCOUR Hansen Creek Pedestrian Bridge - Scenario 2: Small Obstruction
Output Summary Table Froehlich Equation [FHWA 2001] 10.66 ft Liu et. Al. Equation [Hoffmans and Verheij, 1997] 8.61 ft Ahmed Equation [Hoffmans and Verheij, 1997] 6.39 ft
Average 8.55 ft
c /attachment b - scour analysis equations and results.docx
Herrera Environmental Consultants B-10 May 21, 2012

Technical Memorandum—Scour Analysis for the Hansen Creek Pedestrian Bridge Project
INPUT SUMMARY FOR LOCAL ABUTMENT SCOUR Hansen Creek Pedestrian Bridge - Scenario 3: Medium Obstruction
INPUT VARIABLES FOR CALCULATIONS approach flow depth= y= 5.25 ft
approach flow depth on floodplain= ya= 4.31 ft
length of embankment= L= 10.0 ft
length of obstruction (blockage of flow tube)= Lob= 10.0 ft
velocity upstream of structure= V= 5.44 ft/s
Calculated velocity directly upstream of structure= Vob= 5.44 ft/s
abutment shape coefficient= K1= 1
angle of structure to flow= θ= 90 degrees
unobstructed channel width= W1= 40 ft
coefficient for abutment shape (Liu et Al.)= KL= 2.15
correction factor for influence of channel bend= Kp= 1
correction factor for influence of shape of structure= Ks= 1
correction factor for influence of angle of attack= Ka= 1
correction factor for influence of porosity= Kn= 1
upstream flow obstructed by abutment/embankment= Qob = 234 ft3/s
upstream flow= Q = 800 ft3/s
unit discharge (Q/W1)= q = 20.0 ft2/s
OUTPUT SUMMARY FOR LOCAL ABUTMENT SCOUR Hansen Creek Pedestrian Bridge - Scenario 3: Medium Obstruction
Output Summary Table Froehlich Equation [FHWA 2001] 13.08 ft Liu et. Al. Equation [Hoffmans and Verheij, 1997] 11.32 ft Ahmed Equation [Hoffmans and Verheij, 1997] 6.76 ft
Average 10.39 ft
c /attachment b - scour analysis equations and results.docx
May 21, 2012 B-11 Herrera Environmental Consultants

Technical Memorandum—Scour Analysis for the Hansen Creek Pedestrian Bridge Project
INPUT SUMMARY FOR LOCAL ABUTMENT SCOUR
Hansen Creek Pedestrian Bridge - Scenario 4: Large Obstruction INPUT VARIABLES FOR CALCULATIONS
approach flow depth= y= 6.17 ft
approach flow depth on floodplain= ya= 4.36 ft
length of embankment= L= 15.0 ft
length of obstruction (blockage of flow tube)= Lob= 15.0 ft
velocity upstream of structure= V= 4.41 ft/s
Calculated velocity directly upstream of structure= Vob= 4.41 ft/s
abutment shape coefficient= K1= 1
angle of structure to flow= θ= 90 degrees
unobstructed channel width= W1= 40 ft
coefficient for abutment shape (Liu et Al.)= KL= 2.15
correction factor for influence of channel bend= Kp= 1
correction factor for influence of shape of structure= Ks= 1
correction factor for influence of angle of attack= Ka= 1
correction factor for influence of porosity= Kn= 1
upstream flow obstructed by abutment/embankment= Qob = 289 ft3/s
upstream flow= Q = 800 ft3/s
unit discharge (Q/W1)= q = 20.0 ft2/s
OUTPUT SUMMARY FOR LOCAL ABUTMENT SCOUR Hansen Creek Pedestrian Bridge - Scenario 4: Large Obstruction
Output Summary Table Froehlich Equation [FHWA 2001] 13.58 ft Liu et. Al. Equation [Hoffmans and Verheij, 1997] 13.66 ft Ahmed Equation [Hoffmans and Verheij, 1997] 7.39 ft
Average 11.54 ft
c /attachment b - scour analysis equations and results.docx
Herrera Environmental Consultants B-12 May 21, 2012

Technical Memorandum—Scour Analysis for the Hansen Creek Pedestrian Bridge Project
INPUT SUMMARY FOR CONSTRICTION SCOUR
Hansen Creek Pedestrian Bridge - Scenario 5: Revetment
symbol variable unit Mean Value
y0 existing depth in contracted section before scour ft 2.67
y1 average depth in upstream main channel ft 2.77
Q1 flow in upstream main channel ft3/s 800
Q2 flow in contracted channel ft3/s 800
W1 channel bottom width of upstream main channel ft 40
W2 channel bottom width in contracted section ft 35
D50 median diameter of bed material mm 25
S Slope of energy grade line of main channel ft/ft 0.021
OUTPUT SUMMARY FOR CONSTRICTION SCOUR Hansen Creek Pedestrian Bridge - Scenario 5: Revetment
Output Summary Table Laursen Equation 0.35 ft Parker Equation 0.40 ft
Average 0.37 ft
c /attachment b - scour analysis equations and results.docx
May 21, 2012 B-13 Herrera Environmental Consultants

Technical Memorandum—Scour Analysis for the Hansen Creek Pedestrian Bridge Project
c /attachment b - scour analysis equations and results.docx
Herrera Environmental Consultants B-14 May 21, 2012
Scour References
Chase, K.J. and S.R. Holnbeck. 2004. Evaluation of Pier-Scour for Coarse-bed Streams. U.S. Geologic Survey, Scientific Investigations Report 2004-5111.
Fischenich, Craig, and Mark Landers. 2000. Computing Scour, EMRRP Technical Notes Collection (ERDC TN-EMRRP-SR-5). U.S. Army Engineer Research and Development Center, Vicksburg, Mississippi.
FHWA. 2001. Hydraulic Engineering Circular 18: Evaluating Scour at Bridges, Fourth Edition. Federal Highway Administration. Publication No. FHWA NHI 01-001, HEC-18.
Hoffmans, G.J.C.M. and H.J. Verheij. 1997. Scour Manual. A.A. Balkema, Rotterdam, Netherlands, and Brookfield, Vermont.
Landers, M.N. and D.S. Mueller. 1996. Channel scour at bridges in the United States: U.S. Department of Transportation, Federal Highway Administration. Publication FHWARD-95-184, 140 p.
Liu, H.K., F.M. Chang, and M.M. Skinner. 1961. Effect of bridge constriction on scour and backwater. Engineering Research Center, Colorado State University, CER 60 KHL 22.
Melville, B.W. and S.E. Coleman. 2000. Bridge Scour. Water Resources Publications, LLC.
WDFW. 2002. Integrated Streambank Protection Guidelines: Appendix E, Hydraulics. Washington State Aquatic Habitat Guidelines Program. Washington Department of Fish and Wildlife.
Lofthouse, C. and A. Robert. 2008. Riffle-pool sequences and meander morphology. Geomorphology 99 (2008): 214-223.

ATTACHMENT C
HEC-RAS Model Output


ATTACHMENT D
Proposed Location of Log Revetment


Scour Hole Dimensions estimator (Fael et al. 2006)Project: Hansen Reach 2/3 bridge scour analysisEngineer: Ian Mostrenko, Christina AvolioDate: 5‐14‐12 and 5‐18‐12
Goal: Need e and f
ScenarioAbutment Length (L)
Approach flow depth (d)
Abutment Scour Depth (ds) L/d e/d e f/d f
2 5 4.45 8.6 1.1 0.204 0.909 0.976 4.3444 15 6.17 11.5 2.4 0.562 3.470 1.447 8.928
Coefficients:
m n pe/d 0.859 1.312 3.111f/d 2.939 0.51 2.274
Reference: Fael, C. M. S., G. Simarro‐Grande, J.‐P. Martin‐Vide, and A.H. Cardoso. 2006. Local scour at vertical‐wall abutments under clear‐water flow conditions. Water Resources Research 42 (W10408): doi:10.1029/2005WR0004443.
AssumptionU/Uc = 0.6
Applicable Range: 8.9 < L/d < 21.4; under clear‐water flow conditions, for vertical‐wall abutments normal to flow, in wide rectangular open channels
Definitionsds scour depthd depth of the approach flowL abutment length
Angles of reposeangle (deg) Soil
30 smooth gravel40 sharp gravel
25‐30 dry sand30‐45 moist sand20‐40 wet sand37 cement