Embed Size (px)
Citation preview

_____________________________________________________________________________________________________ *Corresponding author: Dr. Gamal Elsaeed: E-mail: [email protected];
Advances in Research 5(2): 1-15, 2015, Article no.AIR.17380
ISSN: 2348-0394
SCIENCEDOMAIN international www.sciencedomain.org
Scour Evaluation for the Nile River Bends on Rosetta Branch
Gamal Elsaeed1*, Hossam Elsersawy2 and Mohammad Ibrahim3
1Department of Civil Engineering, Faculty of Engineering, Shobra, Banha University, Cairo, Egypt.
2Nile Research Institute, National Water Research Center, Cairo, Egypt. 3Department of Civil Engineering, Faculty of Engineering, Shobra, Banha University, Cairo, Egypt.
Authors’ contributions
This work was carried out in collaboration between all authors. All authors read and approved the
final manuscript.
Article Information
DOI: 10.9734/AIR/2015/17380 Editor(s):
(1) Gulnihal Ozbay, Department of Agriculture & Natural Resources, Delaware State University, USA. (2) Shi-Hai Dong, Professor of Department of Physics, School of Physics and Mathematics, National Polytechnic Institute,
Building 9, Unit Professional Adolfo Lopez Mateos, Mexico. Reviewers:
(1) Ahmed Raissouni, Department of Geology, Abdelmalek Essaâdi University, Morocco. (2) Anonymous, King Mongkut’s University of Technology, Thailand.
Complete Peer review History: http://www.sciencedomain.org/review-history.php?iid=1155&id=31&aid=9540
Received 11th March 2015 Accepted 15th May 2015 Published 1
st June 2015
ABSTRACT The objectives of this research were to analyze and evaluate the effect of releasing flow discharges on river meandering in addition to estimating the local scour at 13 bridge piers distributed on 3 bridges located on Rosetta branch. The meandering length was 3.5 Km (from km 145.00 to km 148.50) D.S of El-Roda Gauge at Kafr El-Zayat City. Several sorts of data were collected including site maps, velocity measurements, bed samples, hydrographic survey data, water levels and discharges at several years and seasons, as well as visual inspection photos to be used in the current study. The configurations in bed level, the thalwege line, and the scour holes were determined by comparing the surveyed entire reach at years 1982, 1998, 2003 and 2006. Study area was simulated four times by 2-D mathematical model “SMS” using a survey reach at years 1982, 1998, 2003 and 2006. This was done to estimate the velocities and the water levels for different discharges at the entire reach. The flow was used as upstream boundary condition and the water level was used as downstream boundary condition. The model was calibrated and verified using the field measured velocities. Two proposed alternatives were suggested and numerically simulated separately. The first alternative, the outer bends were filled with layers of filter and riprap to level -5.00 m MSL. The
Original Research Article

Elsaeed et al.; AIR, 5(2): 1-15, 2015; Article no.AIR.17380
2
second alternative included filling the scour regions to level -5.0 m MSL in additional to dredging the inner sides of the bends where sedimentation regions were located to level -3.00 m MSL. The two alternatives were numerically tested under maximum and emergence flows. The results analysis proved that flow conditions were enhanced and improved under the second alternative when compared to the first one. Based on the results, layers of filter and riprap were designed to fill the scour holes.
Keywords: River Meandering; Fill; Dredging; Numerical Modeling, Nile River, Nile Delta, Scour and River Bends.
1. INTRODUCTION
During high floods, higher discharges than the annual maximum were released. These peak discharges cause local scour in the vicinity of bridges, harbors and other structures, also inundate to former flood plains that are currently in use. The Nile River is relatively straight with some sinuous reaches over short distances that are related to steeper slopes. The increase in sinuosity in turn increases the bed slope. Steeper portions become more active and bank erosive. Consequently, scouring action was expected to continue in these areas. The average bed slope along the Damietta and Rosetta Branches of the Nile Delta (240 km from Delta Barrage, Fig.) 1) was 5.6 cm/km. The suspended bed material loads for the Nile downstream Aswan has changed substantially as a result of the creation of Lake Nasser, [1].
The meander wavelengths of the River Nile are varied from 2500 m to 4500 m. The meander pattern was subsequent to the construction of the High Aswan Dam (H.A.D.) as a result of a reduction in discharge and sediment load. After
constructing H.A.D, the Nile was considered as a very low energy river with low water surface gradients. From the Aswan Dam to the head of the Nile Delta, the river distance is about 950 km, and the river bed drops ranging from +79 m to +11 m, giving rise to an average slope of 7.2 cm/km.
The released water from Aswan Dam was kept as far as possible equal to the water demand, leaving no surplus water to be wasted into the sea except during the winter closure period and in emergency cases belonging to the decided regulations of the HAD. High discharges released from HAD were determined according to the regulation guidelines for operating the HAD. These peak discharges cause damages to the water control structures along the Nile and its branches. Relatively high discharges cause local scour near bridges, harbors and other structures. Also, relatively high discharges cause inundation to former flood plains currently in use. Such inundation in turn ruins agricultural properties, urban areas, and roads and may expose human lives to danger. The emergency floods were reported in [2,3].
Fig. 1. Schematic sketch for rosetta and damietta branches

Elsaeed et al.; AIR, 5(2): 1-15, 2015; Article no.AIR.17380
3
Many researches were involved in studying and simulating the flow characteristics around bridge piers; [4] proposed a nonlinear analysis procedure for the performance of bridges with pile foundations under flow-induced loads to evaluate the flood-resistant capacity of scoured bridges. [5] Studied the scour in the wake region of piers, they demonstrated that the scouring action and the geometry of scour holes developed in cohesive sediment was not the same as cohesion less sediments and proportion of clay fraction is the most significant variables controlling the depth of scour. [6] Investigated the final scour depth around cylindrical piers under flood waves, considered only clear-water conditions, proposed an approach to estimate the final scour depth under a flood wave, based on the local scour depth calculated with steady flow equations under peak flow conditions. Focusing on previous studies related to the flow in meander channels, [7] defined meander migrations a process in which water flow erodes soil on one bank and deposits it on the opposite bank. Therefore, a gradual shift of bank line occurs over the long term. Bank erosion undermines bridge piers and abutments, scours the foundations of parallel highways, and causes loss of useful land. [8] explored the features of migrating sediments generated behind piers by local scour processes, and found the main
dimensionless factors governing the dune processes, deduced an equation describing the dune evolution and the downstream propagation as a function of the key parameters. [9] Presented an analysis of evolution of fluvial dynamics along the meandering profile of the central sector through the cartographic study of a long segment of the Ebro River. [10] Discussed dynamic processes of meanders and avulsions with particular attention to factors that may trigger avulsions. A preliminary evaluation scheme is presented for meanders with avulsions.
2. PROBLEM DESCRIPTION AND SITE LOCATION
Kafr El-Zayat City is located at the outer curve of a very sharp bend at Km 123 of Rosetta Branch. The study area was 3.5 km long, located downstream of Delta Barrage from km 145.00 to km 148.50 downstream of El-Roda Gauge Station. The study area is a bend consisting two highway bridges and one railway bridge were located. Fig. 2 and Table 1 showed the geometry and location of the 13 bridge piers and their distance from the left bank. It should be denoted that the coordinates of the study area were (289181.00 m E, 3410603.00 m N), and (287432.08 m E, 3413467.01 m N) UTM.
Fig. 2. Schematic sketch for the study reach

Elsaeed et al.; AIR, 5(2): 1-15, 2015; Article no.AIR.17380
4
Table 1. Location and dimensions of the bridge piers
Bridge No. Bridge 1 Bridge 2 Bridge 3
Location (km)
146.00 146.239 147.682
Pier No. Pier 1 Pier 2 Pier 3 Pier 4 Pier 5 Pier 6 Pier 7 Pier 8 Pier 9 Pier 10 Pier 11 Pier 12 Pier 13
Pier Shape Rec Rec Rec Rec Rec Cir Rec Rec Rec Rec Rec Cir Rec
Diameter (m) ------ ------ ------ ------ ------ 14.00 ------ ------ ------ ------ ------ 11.00 ------
Width (m) 16.00 16.00 16.00 4.00 4.00 ------ 4.00 4.00 4.00 4.00 4.00 ------ 4.00
Length (m) 26.50 26.50 26.50 15.00 15.00 ------ 15.00 15.00 13.00 13.00 13.00 ------ 13.00
Dist. (m) 41.25 182.1 300.9 77.64 147.3 170.0 206.1 276.8 347.7 58.11 132.04 157.61 195.90 Where: Location = downstream of El-Roda Gauge Station, Rec = rectangular, Cir = circular, Dist. = distance from left bank

Elsaeed et al.; AIR, 5(2): 1-15, 2015; Article no.AIR.17380
5
3. METHODOLOGY The “SMS” 2-D mathematical model would be employed, at first, to simulate the morphological and hydrological characteristics in the reach of Rosetta branch. The present study would be carried out applying the following:
1. Collecting the available data of the reach under the study related to hydrographic and hydraulics.
2. Reviewing the available scour hole information in the available literature.
3. Reviewing the previous available studies related to this subject, also determine the different flows at several years passing in the Rosetta Branch from the HAD.
4. To study the development of the morphology on the bend, the reach available bed level data at several years were compared.
5. The reach was numerically simulated for four times using the surveyed data at different years aiming to model calibration and verification.
6. Simulating different proposed alternatives using 2-D model to predict and evaluate the expected scour bed for reach under study including scour around the bridge piers.
7. The previous steps could be followed when a 2-D model used to simulate a meandering reach, [11-15].
Fig. 3. Mesh generation
4. MODEL CONSTRUCTION The simulated length was about 3.5km, including 13 piers under 3 bridges. The mesh was generated for the studied area, and the bed
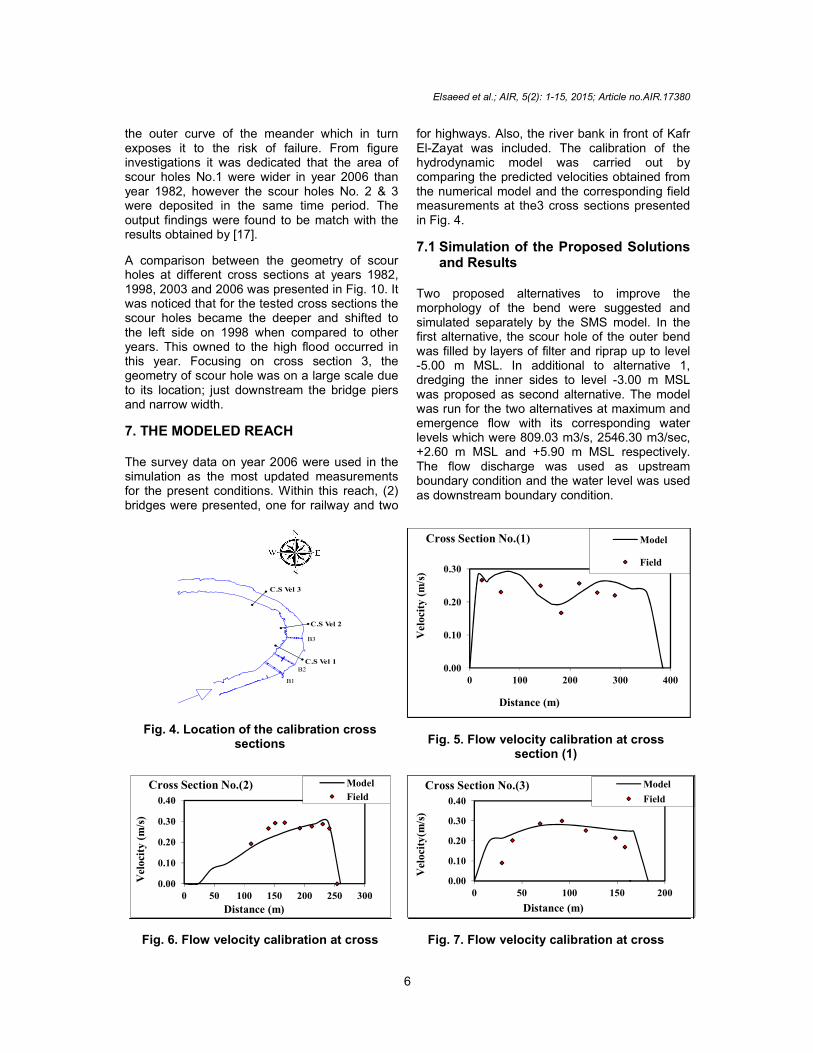
elevations were determined using the bathymetric survey of the river. The mesh was designed by dividing the studied reach into different regions. Each region was divided into elements called quadrilateral elements and triangular elements. It should be mentioned that the designed mesh was condensed at the locations of the bridge piers to simulate the dimensions of piers with high accuracy Fig. 3. The depth file was created based on the hydrographic survey data collected in 2006. The discharge and the water level were used as upstream and downstream boundary conditions respectively. The hydraulic roughness coefficient was defined at each grid point and ranged from 0.02 to 0.05. 4.1 Model Calibration The model was run using the field hydraulic measurements in 2006. The discharge of 222.8 m3/sec and the corresponding water level of 2 m MSL were used as upstream and downstream boundary conditions respectively. In calibration process, the velocity distributions were located at 3 different cross sections, Fig. 4. The water surface slope was adjusted in the model by changing the roughness coefficient up to a good agreement between the prototype, and model water surface slope was obtained after which the roughness coefficient was fixed. Figs. (5-7) showed good agreement between the velocities obtained from the used model and field measurements at different cross sections. The presented velocity distribution was agreed with [16].
5. BED ELEVATION CONTOUR MAP AT
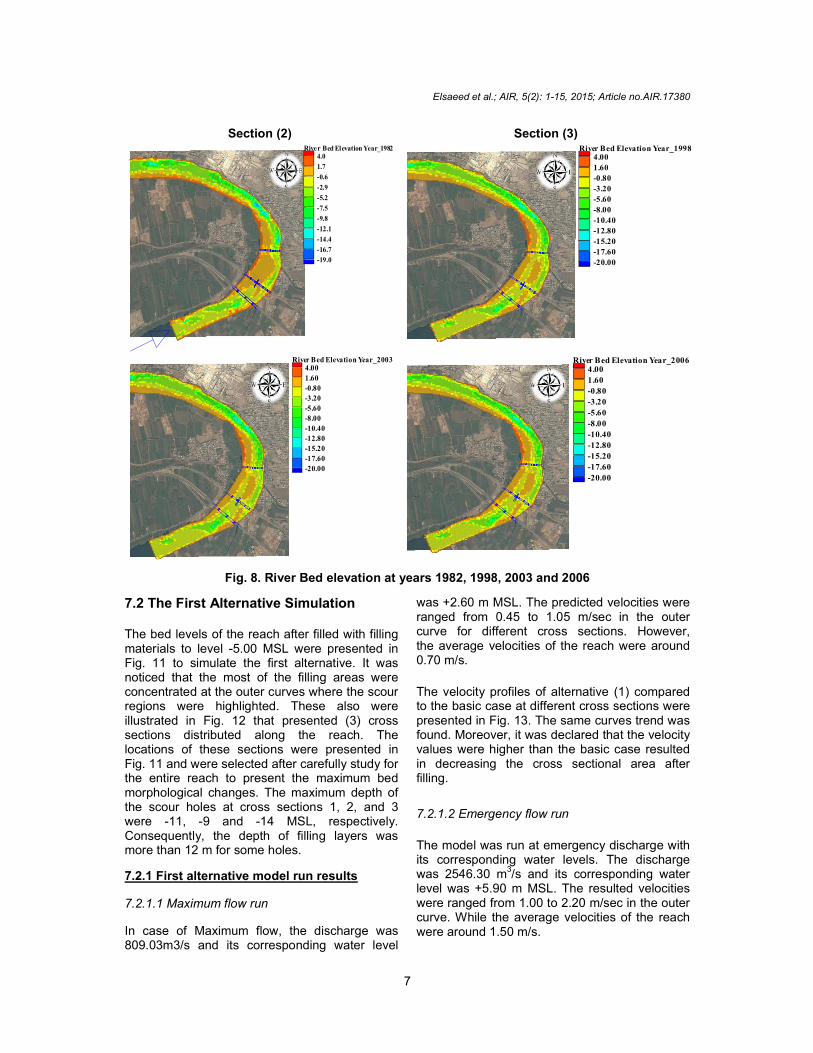
YEARS 1982, 1998, 2003 and 2006 A comparison in bed profiles along the study reach during years 1982, 1998, 2003 and 2006 was presented in Fig. 8. The figure showed that, most of the studied area was exposed to the scouring action. Moreover, the maximum scour occurred at the outer bank on the contrary the deposition region.
6. SCOUR HOLES IN THE AREA OF
STUDY The location and the geometry development of the scour holes in the studied area from years 1982 to 2006 was showed in Fig. 9. In the outer curve, the velocity was higher than inner curve. Consequently, the scour holes were located at
Bridge
Bridge 2
Bridge 3
Elsaeed et al.; AIR, 5(2): 1-15, 2015; Article no.AIR.17380
6
the outer curve of the meander which in turn exposes it to the risk of failure. From figure investigations it was dedicated that the area of scour holes No.1 were wider in year 2006 than year 1982, however the scour holes No. 2 & 3 were deposited in the same time period. The output findings were found to be match with the results obtained by [17].
A comparison between the geometry of scour holes at different cross sections at years 1982, 1998, 2003 and 2006 was presented in Fig. 10. It was noticed that for the tested cross sections the scour holes became the deeper and shifted to the left side on 1998 when compared to other years. This owned to the high flood occurred in this year. Focusing on cross section 3, the geometry of scour hole was on a large scale due to its location; just downstream the bridge piers and narrow width.
7. THE MODELED REACH The survey data on year 2006 were used in the simulation as the most updated measurements for the present conditions. Within this reach, (2) bridges were presented, one for railway and two
for highways. Also, the river bank in front of Kafr El-Zayat was included. The calibration of the hydrodynamic model was carried out by comparing the predicted velocities obtained from the numerical model and the corresponding field measurements at the3 cross sections presented in Fig. 4.
7.1 Simulation of the Proposed Solutions and Results
Two proposed alternatives to improve the morphology of the bend were suggested and simulated separately by the SMS model. In the first alternative, the scour hole of the outer bend was filled by layers of filter and riprap up to level -5.00 m MSL. In additional to alternative 1, dredging the inner sides to level -3.00 m MSL was proposed as second alternative. The model was run for the two alternatives at maximum and emergence flow with its corresponding water levels which were 809.03 m3/s, 2546.30 m3/sec, +2.60 m MSL and +5.90 m MSL respectively. The flow discharge was used as upstream boundary condition and the water level was used as downstream boundary condition.
Fig. 4. Location of the calibration cross sections
Fig. 5. Flow velocity calibration at cross section (1)
Fig. 6. Flow velocity calibration at cross
Fig. 7. Flow velocity calibration at cross
B3
B2
B1
C.S Vel 3
C.S Vel 2
C.S Vel 1 0.00
0.10
0.20
0.30
0 100 200 300 400
Vel
ocit
y (
m/s
)
Distance (m)
Cross Section No.(1) Model
Field
0.00
0.10
0.20
0.30
0.40
0 50 100 150 200 250 300
Vel
ocit
y (m
/s)
Distance (m)
Cross Section No.(2) Model
Field
0.00
0.10
0.20
0.30
0.40
0 50 100 150 200
Vel
ocit
y(m
/s)
Distance (m)
Cross Section No.(3) Model
Field
Elsaeed et al.; AIR, 5(2): 1-15, 2015; Article no.AIR.17380
7
Section (2) Section (3)
Fig. 8. River Bed elevation at years 1982, 1998, 2003 and 2006
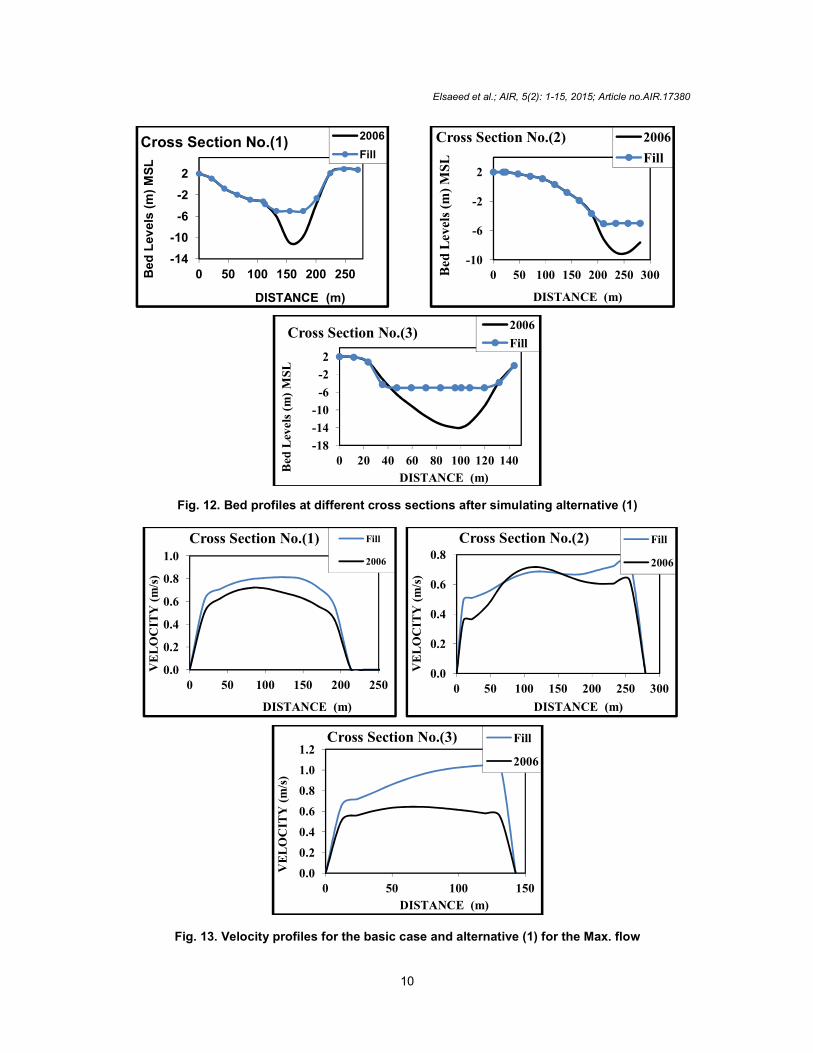
7.2 The First Alternative Simulation The bed levels of the reach after filled with filling materials to level -5.00 MSL were presented in Fig. 11 to simulate the first alternative. It was noticed that the most of the filling areas were concentrated at the outer curves where the scour regions were highlighted. These also were illustrated in Fig. 12 that presented (3) cross sections distributed along the reach. The locations of these sections were presented in Fig. 11 and were selected after carefully study for the entire reach to present the maximum bed morphological changes. The maximum depth of the scour holes at cross sections 1, 2, and 3 were -11, -9 and -14 MSL, respectively. Consequently, the depth of filling layers was more than 12 m for some holes.
7.2.1 First alternative model run results
7.2.1.1 Maximum flow run In case of Maximum flow, the discharge was 809.03m3/s and its corresponding water level
was +2.60 m MSL. The predicted velocities were ranged from 0.45 to 1.05 m/sec in the outer curve for different cross sections. However, the average velocities of the reach were around 0.70 m/s.
The velocity profiles of alternative (1) compared to the basic case at different cross sections were presented in Fig. 13. The same curves trend was found. Moreover, it was declared that the velocity values were higher than the basic case resulted in decreasing the cross sectional area after filling.
7.2.1.2 Emergency flow run
The model was run at emergency discharge with its corresponding water levels. The discharge was 2546.30 m3/s and its corresponding water level was +5.90 m MSL. The resulted velocities were ranged from 1.00 to 2.20 m/sec in the outer curve. While the average velocities of the reach were around 1.50 m/s.
River Bed Elevation Year_1982
-19.0
-16.7
-14.4
-12.1
-9.8
-7.5
-5.2
-2.9
-0.6
1.7
4.0River Bed Elevation Year_1998
-20.00
-17.60
-15.20
-12.80
-10.40
-8.00
-5.60
-3.20
-0.80
1.60
4.00
River Bed Elevation Year_2003
-20.00
-17.60
-15.20
-12.80
-10.40
-8.00
-5.60
-3.20
-0.80
1.60
4.00River Bed Elevation Year_2006
-20.00
-17.60
-15.20
-12.80
-10.40
-8.00
-5.60
-3.20
-0.80
1.60
4.00

Elsaeed et al.; AIR, 5(2): 1-15, 2015; Article no.AIR.17380
8
The velocity profiles of alternative (1) in case of emergency flow comparing to the basic results at cross sections No (1) to (3) were presented in Fig. 14. The figure demonstrated that the results of velocity profiles in case of alternate (1) were
similar to the profiles as the basic case. Clearly, the values of the velocities at cross sections 1&3 increased than in case of basic case because of considerable part of those sections were filled.
Fig. 9. Scour holes location in the study area at years 1982, 1998, 2003 & 2006
Scour Hole in River B ed Elevation for Year_1982
-20.0
-18.5
-17.0
-15.5
-14.0
-12.5
-11.0
-9.5
-8.0
-6.5
-5.0
3
2
1
Scour Hole in River B ed Elevation for Year_1998
-20.0
-18.5
-17.0
-15.5
-14.0
-12.5
-11.0
-9.5
-8.0
-6.5
-5.0
3
2
1
Scour Hole B ed Elevation for Year_2003
-20.0
-18.5
-17.0
-15.5
-14.0
-12.5
-11.0
-9.5
-8.0
-6.5
-5.0
3
2
1
Scour Hole B ed Elevation for Year_2006
-20.0
-18.5
-17.0
-15.5
-14.0
-12.5
-11.0
-9.5
-8.0
-6.5
-5.0
3
2
1

Elsaeed et al.; AIR, 5(2): 1-15, 2015; Article no.AIR.17380
9
Fig. 10. Geometry of Scour Holes at different Cross Sections for Years 1982, 1998, 2003 and 2006
Fig. 11. River Bed Elevation in the Case of Alternative (1)
-14
-10
-6
-2
2
6
0 40 80 120 160 200 240 280BE
D L
EV
EL
(m
)
DISTANCE (m)
Cross Section No.(1) 1982199820032006
-18
-14
-10
-6
-2
2
6
0 40 80 120 160 200 240 280BE
D L
EV
EL
(m
)
DISTANCE (m)
Cross Section No.(2) 1982199820032006
-18
-14
-10
-6
-2
2
6
0 20 40 60 80 100 120 140BE
D L
EV
EL
(m
)
DISTANCE (m)
Cross Section No.(3) 1982199820032006
River B ed Elevation_Fill
-5.00
-4.10
-3.20
-2.30
-1.40
-0.50
0.40
1.30
2.20
3.10
4.00
C.S 1
C.S 2
C.S 3
Elsaeed et al.; AIR, 5(2): 1-15, 2015; Article no.AIR.17380
10
Fig. 12. Bed profiles at different cross sections after simulating alternative (1)
Fig. 13. Velocity profiles for the basic case and alternative (1) for the Max. flow
-14
-10
-6
-2
2
0 50 100 150 200 250Bed
Lev
els
(m
) M
SL
DISTANCE (m)
Cross Section No.(1) 2006
Fill
-10
-6
-2
2
0 50 100 150 200 250 300Bed
Lev
els
(m)
MS
L
DISTANCE (m)
Cross Section No.(2) 2006
Fill
-18
-14
-10
-6
-2
2
0 20 40 60 80 100 120 140
Bed
Lev
els
(m)
MS
L
DISTANCE (m)
Cross Section No.(3) 2006
Fill
0.0
0.2
0.4
0.6
0.8
1.0
0 50 100 150 200 250
VE
LO
CIT
Y (
m/s
)
DISTANCE (m)
Cross Section No.(1) Fill
2006
0.0
0.2
0.4
0.6
0.8
0 50 100 150 200 250 300
VE
LO
CIT
Y (
m/s
)
DISTANCE (m)
Cross Section No.(2) Fill
2006
0.0
0.2
0.4
0.6
0.8
1.0
1.2
0 50 100 150
VE
LO
CIT
Y (
m/s
)
DISTANCE (m)
Cross Section No.(3) Fill
2006

Elsaeed et al.; AIR, 5(2): 1-15, 2015; Article no.AIR.17380
11
7.3 The Second Alternative Simulation
The bed levels of the reach are filled to level -5.00 MSL and the other part are dredged to level +3.00 MSL to represent the second alternative. Fig. 15 showed the entire reach bed elevation in the case of alternative 2. It was cleared that the most of the filling areas were concentrated at the outer curves and the dredging area in the inner curve. These also were showed in Fig. 16, which represented three cross sections distributed along the reach. The location of these sections showed in Fig. 15. The filling layers of some holes were more than 12 m and the dredging layers at some locations were within 5 m.
7.3.1 Second alternative model run results
7.3.1.1 Maximum flow run
In case of Maximum flow, the discharge was 809.03 m3/s and its corresponding water level was +2.60 m MSL. The flow velocities along the reach show that the maximum value of velocities was occurred at the outer curves. The resulted velocities were ranged between 0.28 and 0.93 m/sec at the concerned section. The velocity profiles of alternative 2 compared to the basic
results at cross sections No. 1 to 3 were showed in Fig. 17. The figure illustrated that the results of velocity profiles in case of alternative 2 were redistributed along the sections to be more regular than in case of the basic case at cross sections No. 1 & 3. Consequently, the velocity values were increased at cross section3 and decreased at cross sections No. 2 compared to the basic case because of considerable part of those sections were filled and dredged respectively.
7.3.1.2 Emergency flow run
The model was run at emergency discharge with its corresponding water levels. The discharge was 2546.30 m3/s and its corresponding water level was +5.90 m MSL. The resulted velocities recorded in this case are ranged between 0.80 and 2.00 m/sec in the outer curve. While the average velocities along the reach were around 1.40 m/s.
The velocity profiles at three cross sections along the reach for alternative 2 were presented in Fig. 18 for the case of emergency flow compared to the basic case.
Fig. 14. Velocity profiles for the basic & alternative (1) at future flow conditions
0.00
0.25
0.50
0.75
1.00
1.25
1.50
0 50 100 150 200 250 300
VE
LO
CIT
Y (
m/s
)
DISTANCE (m)
Cross Section No.(1) Fill
2006
0.00
0.40
0.80
1.20
1.60
2.00
0 50 100 150 200 250 300
VE
LO
CIT
Y (
m/s
)
DISTANCE (m)
Cross Section No.(2) Fill
2006
0.00
0.50
1.00
1.50
2.00
2.50
0 50 100 150
VE
LO
CIT
Y (
m/s
)
DISTANCE (m)
Cross Section No.(3) Fill
2006

Elsaeed et al.; AIR, 5(2): 1-15, 2015; Article no.AIR.17380
12
Fig. 15. River Bed elevation in the case of alternative (2)
Fig. 16. Bed profiles at different cross sections for the basic case and alternative (2)
The figure showed that the results of velocity profiles were redistributed along the cross sections to be more regular than the basic case at cross section No.1. It was declared that the velocity values were increased at cross section
No.3 and decreased at cross section No. 2 compared to the basic case. That was resulted in the effective part of these sections were filled and dredged respectively.
River B ed Elevation_Fill & Dredging
-5.00
-4.80
-4.60
-4.40
-4.20
-4.00
-3.80
-3.60
-3.40
-3.20
-3.00
C.S 1
C.S 2
C.S 3
-14
-10
-6
-2
2
0 50 100 150 200 250
Bed
Lev
el (
m)
MS
L
DISTANCE (m)
Cross Section No.(1) 2006Fill& Dredging
-10
-6
-2
2
0 50 100 150 200 250 300
Bed
Lev
el (
m)
MS
L
DISTANCE (m)
Cross Section No.(2) 2006
Fill& Dredging
-18
-14
-10
-6
-2
2
0 20 40 60 80 100 120 140
Bed
Lev
el (
m)
MS
L
DISTANCE (m)
Cross Section No.(3) 2006
Fill& Dredging

Elsaeed et al.; AIR, 5(2): 1-15, 2015; Article no.AIR.17380
13
Fig. 17. Velocity profiles for the basic, alternatives (1) and (2) at maximum flow
Fig. 18. Velocity profiles for the basic, alternatives (1) and (2) at emergency flow
0.0
0.2
0.4
0.6
0.8
1.0
0 50 100 150 200 250
VE
LO
CIT
Y (
m/s
)
DISTANCE (m)
Cross Section No.(1) 2006FillFill&Dredging
0.0
0.2
0.4
0.6
0.8
0 50 100 150 200 250 300
VE
LO
CIT
Y (
m/s
)
DISTANCE (m)
Cross Section No.(2) 2006FillFill&Dredging
0.0
0.2
0.4
0.6
0.8
1.0
1.2
0 50 100 150
VE
LO
CIT
Y (
m/s
)
DISTANCE (m)
Cross Section No.(3) 2006FillFill&Dredging
0.00
0.25
0.50
0.75
1.00
1.25
1.50
0 50 100 150 200 250 300
VE
LO
CIT
Y (
m/s
)
DISTANCE (m)
Cross Section No.(1) 2006FillFill&Dredge
0.00
0.40
0.80
1.20
1.60
2.00
0 50 100 150 200 250 300
VE
LO
CIT
Y (
m/s
)
DISTANCE (m)
Cross Section No.(2) 2006FillFill&Dredge
0.00
0.50
1.00
1.50
2.00
2.50
0 50 100 150
VE
LO
CIT
Y (
m/s
)
DISTANCE (m)
Cross Section No.(3) 2006FillFill&Dredge

Elsaeed et al.; AIR, 5(2): 1-15, 2015; Article no.AIR.17380
14
8. CONCLUSION A 2-D numerical model was applied to simulate the flow pattern for 3.5 Km meandering length including 13 bridge piers to support 3 bridges located at Kafr El-Zayat City, Egypt. Two proposed solutions were used to handle the developed scour and silting problems in the studied reach under different flow conditions. To assure the ability of the used model in simulating the studied reach; the model was calibrated and verified using prototype measurements at 3 different cross sections. Based on the results and focusing on the comparative study for the two purposed solutions by the surveying of year 2006, the following was obtained:
1. Unexpected velocity profiles resulted in the human interference were found at some locations.
2. The maximum scour depth was found at the piers located in the middle of the cross section.
3. The maximum scour depth was directly proportional to discharge.
4. The increase of the scour hole around the piers of the first bridge (upstream) was higher than the increase of the scour hole around the piers of the second and third bridges (downstream).
5. When the scour holes (at the outer curve) were filled up to level of -5 MSL (Alternative 1), the velocity values along the tested cross sections were increased. Consequently, the probability of the expected scour was increased.
6. When the scour holes were filled up to level of -5 m MSL and the other side dredged to -3 m MSL (Alternative 2), slight differences were found in velocity profile compared to the basic case. Consequently, the probability of the expected scour was reduced.
7. In the case of alternative 2 the velocity profiles along the tested cross sections were redistributed and turned more regular compared to the alternative 1 and the basic case.
8. In the case of maximum and emergency flows, the obtained velocity profiles gave the similar trend, with differences in values.
COMPETING INTERESTS Authors have declared that no competing interests exist.
REFERENCES 1. Hydraulic Research Institute (HRI).
Protection of Bank against Erosion along the River Nile”, Report No 3, Cairo, Egypt; 2005.
2. River Nile Development Project, RNDP, Ministry of Public Works and Water Resources, Egypt; 1991a.
3. River Nile Development Project, RNDP, Ministry of Public Works and Water Resources, Egypt; 1992b.
4. Yung-Yen Ko, Jiunn-Shy, Chiou Yu-Ching Tsai, Cheng-Hsing Chen, Helsin Wang, Chung-Yue Wang. Evaluation of flood-resistant capacity of scoured bridges. Journal of Performance of Constructed Facilities. 2014;28(1):61-75.
5. Umesh C Kothyari, Ajay Kumar, Rajesh K Jain. Influence of cohesion on River bed scour in the wake region of piers. Journal of Hydraulic Engineering. 2014;140(1):1-13.
6. Guillermo López, Luis Teixeira, Miguel Ortega-Sánchez, Gonzalo Simarro. Estimating final scour depth under clear-water flood waves. Journal of Hydraulic Engineering. 2014;140(3)328-332.
7. Jean-Louis Briaud, Hamn-Ching Chen, Kuang-An Chang, Young-An Chung, Namgyu Park, Wei Wang, Po-Hung Yeh. Establish guidance for soils properties based-prediction of meander migration rate. Zachry Department of Civil Engineering, Texas A&M University; 2007.
8. Giuseppe Oliveto, Willi H Hager. Morphological evolution of dune-like bed forms generated by bridge scour. Journal of Hydraulic Engineering. 2014;140(5).
9. Fernando Magdaleno, José A Fernández-Yuste. Meander dynamics in a changing river corridor. Geomorphology. 2011; 130(3–4):197-207.
10. Coles D, Klingeman P. Channel avulsion dynamics in meandering rivers. World Environmental and Water Resources Congress. 2014;1475-1485.
11. Davide Motta, Jorge D Abad, Eddy J Langendoen, Marcelo H Garcia. A simplified 2D model for meander migration with physically-based bank evolution. Geomorphology. 2012;163-164:10-25.
12. Chang H. Regular meander path model. Journal of Hydraulic Engineering. 1984; 110(10):1398-1411.
13. Lai Y, Greimann B. Modeling of erosion and deposition at meandering channels.

Elsaeed et al.; AIR, 5(2): 1-15, 2015; Article no.AIR.17380
15
World Environmental and Water Resources Congress. 2008;1-11.
14. He L, Chen D. Modeling curvature- and topography-driven secondary currents in sine generated meandering channels. World Environmental and Water Resources Congress. 2013;1727-1735.
15. Jianchun Huang, Blair P Greimann, Timothy J Randle. Modelling of meander migration in an incised channel.
International Journal of Sediment Research. 2014;29(4):441-453.
16. Patra K, Kar S, Bhattacharya A. Flow and velocity distribution in meandering compound channels. Journal of Hydraulic Engineering. 2004;130(5):398-411.
17. Chang H. Analysis of river meanders. Journal of Hydraulic Engineering. 1984; 110(1):37-50.
_________________________________________________________________________________ © 2015 Elsaeed et al.; This is an Open Access article distributed under the terms of the Creative Commons Attribution License (http://creativecommons.org/licenses/by/4.0), which permits unrestricted use, distribution, and reproduction in any medium, provided the original work is properly cited.
Peer-review history: The peer review history for this paper can be accessed here:
http://www.sciencedomain.org/review-history.php?iid=1155&id=31&aid=9540