Embed Size (px)
Citation preview
FHWA-NJ-2017-015
Scour Evaluation Model Implementation Phase (Volume 1 of 2)
FINAL REPORT November 2017
Submitted by
John R. Schuring, PE, PhD
Professor of Civil & Environmental Engineering
New Jersey Institute of Technology
Robert Dresnack, PE, PhD Professor of Civil &
Environmental Engineering New Jersey Institute of
Technology
Eugene Golub, PE, PhD Professor of Civil &
Environmental Engineering New Jersey Institute of
Technology
NJDOT Research Project Manager
Ms. Pragna Shah
In cooperation with
New Jersey Department of Transportation
Bureau of Research And
U.S. Department of Transportation Federal Highway Administration

D I S C L AI M E R S T A T E M E N T
The contents of this report reflect the views of the authors who are responsible for the
facts and the accuracy of the data presented herein. The contents do not necessarily
reflect the official views or policies of the New Jersey Department of Transportation or
the Federal Highway Administration. This report does not constitute a standard,
specification, or regulation.

TECHNICAL REPORT STANDARD TITLE PAGE
1. Report No.
FHWA-NJ-2017-015
2. Government Accession No. 3. Recipient’s Catalog No.
4. Title and Subtitle
Scour Evaluation Model Implementation Phase, Vol. 1 of 2
5. Report Date
November 2017
6. Performing Organization Code
7. Author(s)
John R. Schuring, Robert Dresnack, & Eugene Golub
8. Performing Organization Report No.
9. Performing Organization Name and Address
Department of Civil and Environmental Engineering
New Jersey Institute of Technology
University Heights
Newark, NJ 07102-1982
10. Work Unit No.
11. Contract or Grant No.
12. Sponsoring Agency Name and Address
N.J. Department of Transportation
1035 Parkway Avenue
P.O. Box 600
Trenton, NJ 08625-0600
Federal Highway Administration
U.S. Department of
Transportation
Washington, D.C.
13. Type of Report and Period Covered
Final Report 7/15/15-7/30/17
14. Sponsoring Agency Code
15. Supplementary Notes
16. Abstract
The overall goal of this project was to launch New Jersey’s new Scour Evaluation Model (SEM) and to begin
applying it to the State’s inventory of scour critical bridges. SEM is designed to evaluate the scour risk of non-
tidal bridges. The model offers new scour assessment methods and protocols, while still retaining the
applicable parts of HEC-18. The study commenced with a prescreening phase that identified 17 high risk
bridges requiring repair or replacement. The next project task evaluated 12 bridges using SEM to fully
demonstrate the method. These evaluations yielded a number of low risk bridges, which were recommended
for removal from the scour critical list. Three New Jersey consulting firms participated in the project for the
purposes of technology transfer. The study also investigated the use of envelope curves to assess scour,
finding that envelope curves can be an effective tool within select geologic regions within the State. The
project concluded with seven supplemental SEM bridge evaluations to further validate the model.
17. Key Words
Bridge Scour, Scour Analysis, Scour Critical Bridges
18. Distribution Statement
No Restrictions.
19. Security Classification (of this report)
Unclassified
20. Security Classification (of this page)
Unclassified
21. No of Pages
40
22. Price
Form DOT F 1700.7 (8-69)
ii
A C K N O W L E D G E M E N T S
This project was conducted with the support and cooperation of the New Jersey
Department of Transportation and the Federal Highway Administration.
The Research Team gratefully acknowledges the contributions of:
Project Manager Pragna Shah for her guidance and skillful administration;
Research Customer Nat Kasbekar for his direction and strong technical insight;
Scour Project Implementation Committee for their valued input, including
members Ayodele Oshilaja and Eddie Germain;
FHWA NJ Division Engineer Paul Cardie for his expert review and comments;
USGS New Jersey Water Science Center for their expert hydrologic support,
especially Tom Suro and Kara Watson.
We are also indebted to the student research assistants for their wonderful efforts on
the project and significant contributions to this report, including Dillion Collins, James
Falcetano, Tom Bandeira, Abolfazl Bayat, and Kristopher Kozlowski. They have now
graduated and moved into the professional world. It was our pleasure to work with
them.
iii
T A B L E O F C O N T E N T S VOLUME 1
Page EXECUTIVE SUMMARY ................................................................................................ 1 BACKGROUND OF THE RESEARCH PROBLEM ........................................................ 4 RESEARCH OVERVIEW AND OBJECTIVES ............................................................... 5 PRESCREENING OF HIGH RISK BRIDGES ................................................................. 7
Background and Methodology .............................................................................. 7 Results and Recommendations ............................................................................ 7
EVALUATION OF SCOUR CRITICAL BRIDGES USING SEM ................................... 10 Background ........................................................................................................... 10 Summary of SEM Results .................................................................................... 10
SEM Experience and Feedback ........................................................................... 14 INVESTIGATION OF ENVELOPE CURVES FOR NEW JERSEY BRIDGES .............. 16
Background ........................................................................................................... 16
Bridges Studied with Envelope Curves .............................................................. 17 Envelope Curve Recommendations .................................................................... 20
METHODOLOGIES USED DURING THE IMPLEMENTATION PHASE ...................... 23 Overview of Scour Evaluation Model (SEM) ....................................................... 23 Hydrologic Analysis Procedure ........................................................................... 26 Ground Penetrating Radar (GPR) Investigations ............................................... 29 Geotechnical Studies: Fascia Soundings and Probing ..................................... 32
REFERENCES .............................................................................................................. 33
VOLUME 2 APPENDICES ............................................................................................................... 35 APPENDIX A – SUPPLEMENTAL SEM EVALUATIONS ............................................ 35 APPENDIX B – SEM SUMMARY FORMS ................................................................... 37 APPENDIX C – SEM REPORTS GENERATED DURING THE STUDY ....................... 46 APPENDIX D – FASCIA SOUNDINGS ........................................................................ 48 APPENDIX E – HYDROLOGIC ANALYSIS CALCULATIONS .................................... 79
iv
L I S T O F F I G U R E S
VOLUME 1
Page Figure 1. Geographic Distribution of SEM Bridges 12 Figure 2. Envelope Curve Results for Abutments 19 Figure 3. Envelope Curve Results for Piers 20 Figure 4. Recommended Envelope Curves for Abutments 21 Figure 5. Recommended Envelope Curves for Piers 22 Figure 6. Overview Flow Chart of SEM Modules 23 Figure 7. SEM Two-dimensional Risk Decision Matrix 25 Figure 8. Flowchart for Hydrologic Analysis of SEM Bridges 27 Figure 9. Example GPR Scans for Envelope Curve Bridges 31
L I S T O F T AB L E S VOLUME 1
Page Table 1 – Prescreened High Risk Bridges Recommended for Repair (With
Ranking) 9 Table 2 – Summary of Key Findings and Data for SEM Study Bridges 11 Table 3 – Summary of Recommended Actions for SEM Study Bridges 13 Table 4 – Summary of Key Findings and Data for Envelope Curve Bridges 18

1
EXECUTIVE SUMMARY
The overall goal of this project was to launch New Jersey’s new Scour Evaluation Model (SEM) and to begin applying it to the State’s inventory of scour critical bridges. This “Implementation Phase,” as it is called, was aimed at transferring previous research performed under the project, “Design and Evaluation of Scour for Bridges Using HEC-18,” into state-wide practice as expeditiously as possible. SEM is designed to evaluate the scour risk of existing bridges and to determine whether or not they are scour critical. The model reflects New Jersey’s unique geological and hydrologic/hydraulic conditions. It also offers new scour assessment methods and protocols, while still retaining the applicable parts of Hydraulic Engineering Circular No. 18 (HEC-18). The main advantage of SEM is it helps discern high risk bridges that require repair or replacement from others that are low risk and may be returned to a normal inspection schedule. In addition, the model also considers bridge importance and helps prioritize the order of corrective work. The core research team was comprised of faculty and students from the Department of Civil and Environmental Engineering at New Jersey Institute of Technology (NJIT) with specializations in hydraulic engineering, geotechnical engineering, hydrology, and bridge engineering. All research work was done with guidance and consultation from the NJDOT Research Project Manager, the NJDOT Research Customer, and the NJDOT Scour Research Implementation Committee. The research study had four principal objectives. Each objective, in turn, was linked to the four main tasks of the project. The study objectives/tasks were:
Task 1: Prescreening of High Risk Bridges
Task 2: Evaluation of Scour Critical Bridges Using SEM
Task 3: Investigation of Envelope Curves for New Jersey Bridges
Task 4: Technology Transfer of SEM The results for each of these study objectives/tasks will now be summarized. The prescreening of high risk bridges was the first project task performed. It allowed the Department to launch a “quick start” for repair of scour critical bridges even while the rest of the research was underway. Work began by developing a list of potential high risk bridges based on information from various sources, including NJDOT scour summaries, preliminary scour results from previous research, and Stage II studies of individual bridges. Next, the NJIT Research Team analyzed potential bridges using an abbreviated version of the SEM method. While the abbreviated analysis did not involve as much rigor as a full SEM analysis, enough work was done to assure that it was worthwhile for the Department to repair the bridge.
The prescreening process identified 17 bridges as having “higher risk” since they received a SEM risk rating of Priority 1 (recommend to install protective measures as soon as possible) or Priority 2 (recommend to install protective measures or a

2
permanent scour monitoring system). The list of high risk bridges was forwarded to the Department in August 2015. Search for additional high risk bridges continued throughout the research study. During late fall 2016, two additional high risk bridges were identified, and the Department was notified in January 2017 once they were confirmed. The second major project task was to evaluate 12 scour critical bridges using the Scour Evaluation Model (SEM) to fully demonstrate the method. Three consulting firms were engaged to perform this project task, AECOM of Piscataway, Mott MacDonald of Iselin, and McCormick Taylor of Mount Laurel. The NJIT Team played a supporting role by furnishing preliminary hydrologic and geotechnical information, and they also offered technical advice during the studies. The 12 bridges evaluated using full SEM represented all four of New Jersey’s physiographic provinces and a wide range of geological, hydrological, and structural characteristics. The key finding for each bridge was the Priority Level (1 thru 4) based on the risk analysis. The results for the 12 study bridges were are follows:
2 bridges were found to be Priority 1 (high risk)
1 bridge was found to be Priority 3 (medium to low risk)
9 bridges were found to be Priority 4 (low risk) A report was generated for each bridge detailing the results of the SEM evaluation. Included were specific recommended actions depending on the priority level, as well as scour coding using Federal Highway Administration (FHWA) guidelines. The third major task of the research study was to investigate the use of envelope curves for evaluating scour at existing bridges in New Jersey. SEM uses envelope curves as one of seven scour risk assessments and also to supplement the HEC-18 scour prediction equations. During this project task, a total of 15 non-tidal bridges were visited to measure actual scour depths. Field measurements were conducted utilizing depth soundings, direct probing, and ground penetrating radar (GPR). Study bridges were selected from nine different New Jersey counties, and they exhibited a wide range of hydraulic characteristics, drainage basin areas, and flooding histories. The scour data for the 15 study bridges were compared with published envelope curve relationships based on scour data from numerous states. The New Jersey data show good consistency from a perspective of both magnitude and trend, leading to the conclusion that envelope curves are an effective tool for screening scour risk of existing bridges within the State. Curves are presented for both abutment/contraction scour and pier scour for application in New Jersey’s Coastal Plain, Non-Glaciated Piedmont, and Non-Glaciated Highlands provinces. The fourth and final task of the study was to begin transfer of the SEM method into State-wide engineering practice. This was accomplished through meetings, conference calls, and field visits with the three participating consultants. By the end of the project, all three participating firms were considered proficient in the use of SEM.

3
Towards the end of the project, seven “supplemental” SEM evaluations were done to further validate the model. The additional work was directed towards high risk bridges, and it was performed by the project consultants working jointly with the Research Team.
4
BACKGROUND OF THE RESEARCH PROBLEM
Prevention of bridge scour has been a national priority for nearly three decades. Working under advisories from the Federal Highway Administration (FHWA), transportation agencies across the U.S. have been deliberately engaged in evaluating the scour susceptibility of bridges within their inventories. In the early 1990s, the New Jersey Department of Transportation (NJDOT) launched a robust statewide Scour Evaluation Program to assess the State’s bridges over waterways. By performing a series of screening and in-depth scour evaluations, a total of 165 bridges were determined to be scour critical. In 2006, the Department launched a Plan of Action to perform corrective work on these scour critical structures. While solid progress is being made, more than 100 bridges remain on the State’s Scour Critical List.
In carrying out the Plan of Action, NJDOT recognized that better methods were needed to analyze scour depth for bridges throughout the State. This was motivated by numerous field studies across the U.S. showing that the standard methods in HEC-18 (Richardson and Davis, 2001; Arneson et al, 2012) often yielded overly conservative values for scour depth (e.g. Benedict et al, 2006; Lombard and Hodgkins, 2008; Wagner et al, 2006). Disparities between predicted and observed scour were particularly apparent for some existing bridges within New Jersey that have continued to perform satisfactorily for many decades when subjected to record storms. Thus, the Department decided to join a growing number of states that use either a modified or alternate method for scour evaluation (e.g. PennDOT, 2000; ILDOT, 2009; TXDOT, 2006 & 2009; SCDOT, 2009). Note that HEC-18 is recognized as a document describing the “state of practice,” and it does not preclude a transportation agency from applying a modified method of scour analysis as long as it is rational and defensible. In an effort to improve scour design and evaluation methods within the State, NJDOT engaged the New Jersey Institute of Technology (NJIT) to perform the bridge scour research study, “Design and Evaluation of Scour for Bridges Using HEC-18” (Schuring et al, 2017). The major deliverable of this project was a new Scour Evaluation Model (SEM) that reflects New Jersey’s unique geological and hydrologic/hydraulic conditions. SEM offers new scour evaluation approaches and protocols, while still retaining the applicable parts of HEC-18. In keeping with FHWA’s latest technical guidance, SEM is risk-based and considers a bridge’s past performance. The model evaluates a number of geotechnical, hydrologic, and hydraulic factors, in addition to a structure’s importance. In summary, the approach offers three main advantages:
SEM discerns more precisely those bridges that are scour critical;
SEM also identifies other bridges that can be removed from the Critical List and returned to a normal NBIS inspection schedule; and
For bridges that are determined to be scour critical, SEM recommends specific actions to repair, replace, or monitor the structures. The model also helps prioritize the order of corrective work.
An overview of the SEM method is provided in the section, “Overview of Scour Evaluation Model (SEM),” on page 23.

5
RESEARCH OVERVIEW AND OBJECTIVES
The overall goal of this project has been to launch the new Scour Evaluation Model and to begin applying it to the State’s inventory of scour critical bridges. This “Implementation Phase,” as it is called, will assure that the previous research (Schuring et al, 2017) is transferred into state-wide practice effectively and expeditiously. All research work was done in close consultation with the NJDOT Research Project Manager and the NJDOT Research Customer. The Scour Research Implementation Committee, which has guided the scour project over the last several years, also remained involved. The Committee convened quarterly to review the research results and provide feedback to the NJIT Research Team. The Implementation Phase had four principal objectives. Each objective, in turn, was linked to the four main tasks of the project. The study tasks are as follows: Task 1: Prescreening of High Risk Bridges:
The first study task was to prescreen selected bridges on the State’s Scour Critical List to identify those bridges that are potentially high risk. This allowed the Department to launch a “quick start” for repair of some scour critical bridges, even while the research project was underway. At the same time, more detailed evaluations were conducted of other lower risk bridges that might be candidates for removal from the scour critical list, thereby saving important resources. The high risk screening utilized an abbreviated SEM analysis that did not involve as much rigor as a full SEM analysis. But enough work was done to assure that the Department was expending funds wisely to repair a bridge. The goal was to deliver a list of approximately 20 high risk bridges to the Department during the first 45 days of the grant so that repair contracts could be initiated. The methodology and results of this research task are described in chapter, “Prescreening of High Risk Bridges,” beginning on page 7. Task 2: Evaluation of Scour Critical Bridges Using SEM:
The second objective of the study was to evaluate 12 scour critical bridges using a full SEM analysis to demonstrate the method. The major deliverable for this task was a separate report for each bridge detailing the results of the SEM evaluation. The key finding for each bridge was the Priority Level generated by the model (1 thru 4) along with recommended actions and NBIS scour coding. In completing this task, the Research Team worked with three New Jersey consulting firms who are expert in scour evaluation, including AECOM, Mott MacDonald, and McCormick Taylor. The methodology and results of this research task are described in chapter, “Evaluation of Scour Critical Bridges Using SEM,” beginning on page 10.
Task 3: Investigation of Envelope Curves for New Jersey Bridges:
The third objective of the study was to investigate envelope curves that are specific to New Jersey bridges. SEM uses envelope curves as one of seven scour risk assessments to evaluate bridges located in central and southern parts of the State. The original curves utilized by SEM were adapted from field scour data from South Carolina

6
and numerous other states. During this research study, a total of 15 non-tidal bridges were evaluated within New Jersey’s Coastal Plain, Non-Glaciated Piedmont, and Non-Glaciated Highlands provinces to build a data archive. The data were analyzed to validate curves for use with SEM. The main goal of this project task was to add an additional degree of confidence to this method for New Jersey. The methodology and results of this research task are described in chapter, “Investigation of Envelope Curves for New Jersey Bridges,” beginning on page 16. Task 4: Technology Transfer of New Jersey SEM:
The fourth and final task of the study was to transfer the SEM method into State-wide engineering practice. A two-day seminar at the NJDOT offices was originally envisioned, but a more efficient mode of technology transfer was employed instead. The three subcontracting consulting firms were instructed in the use and application of SEM during meetings, conference calls, and field visits to build proficiency with the method. The methodology and results for technology transfer are described in chapter, “Evaluation of Scour Critical Bridges Using SEM,” beginning on page 10.

7
PRESCREENING OF HIGH RISK BRIDGES
Background and Methodology
This project task was designed to allow the Department to launch a “quick start” for repair of scour critical bridges deemed to be of high risk. This was the first work performed by the NJIT Research Team. The idea was to begin repairing bridges that displayed definite signs of high risk even while the rest of the research work was underway. This allowed time to perform detailed evaluations of other low risk bridges that might be candidates for removal from the Scour Critical List, thereby saving important resources. This is what SEM is designed to do. It is a tool to make rational decisions about scour risk, providing a deliberate path forward to either repair a bridge or return it to a normal monitoring program. An overview of SEM is provided in section, “Overview of Scour Evaluation Method (SEM),” on page 23. The first step was to develop a list of bridges that were potentially high risk. These were selected from three principal sources:
a. The report, “Design and Evaluation of Scour for Bridges Using HEC-18” (Schuring et al, 2017), which includes bridges that had already been examined and analyzed by the Research Team;
b. NJDOT Scour Program Summary Report for 2012, which includes bridges that had been monitored by the USGS for streambed erosion; and
c. Various summary lists of scour critical bridges developed by the Department over the years.
More than 40 bridges on the Scour Critical List were initially identified as potential high risk candidates during this step. The bridges were then analyzed using the Scour Evaluation Model (SEM). Note that given the timeframe for this task, an abbreviated SEM analysis was performed. While the abbreviated analysis does not involve as much rigor as a full SEM analysis, enough work was done to assure that it was worthwhile for the Department to repair the bridge. Some example “SEM Summary Forms” describing the risk analysis results for bridges studied during this task are included in Appendix B. Results and Recommendations
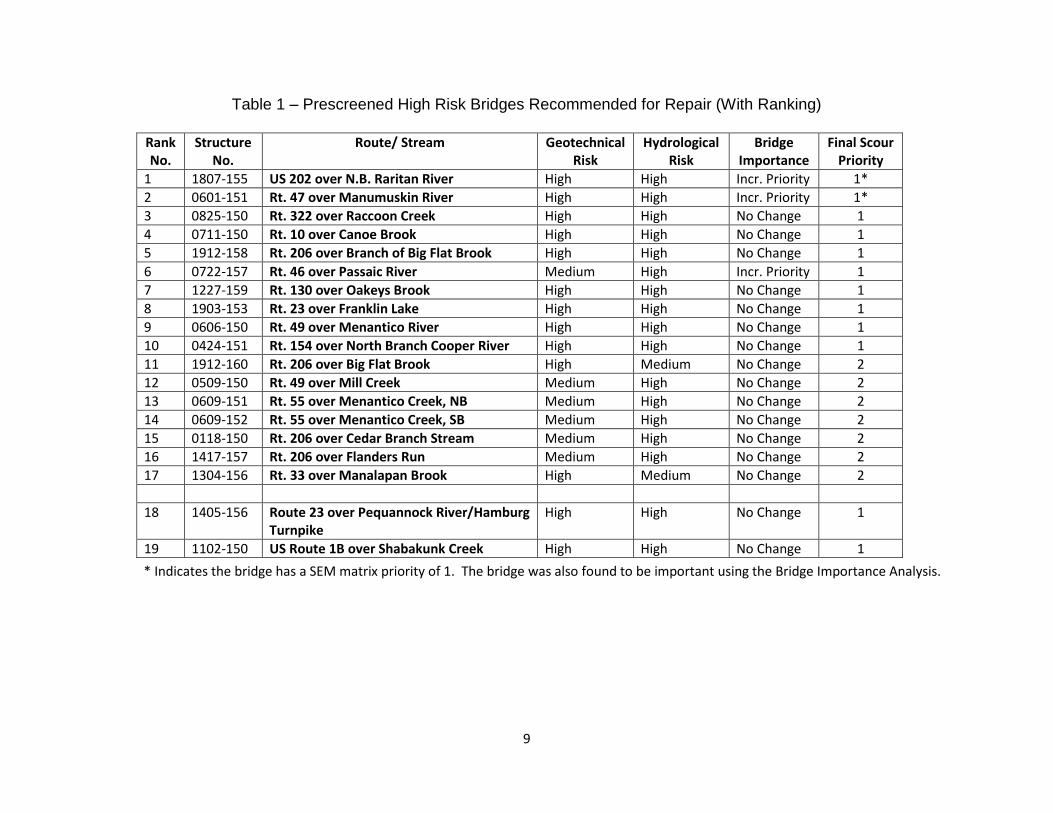
During the prescreening process, 17 bridges were identified as having “higher risk” compared with the other bridges on the critical list. These bridges are listed in Table 1 along with a summary of their risk ratings. Note that the priority is also indicated in the table, in that the bridges are listed in the recommended order of repair, from 1 thru 17. All bridges received a rating of Priority 1 (recommend install protective measures as soon as possible) or Priority 2 (recommend install protective measures or a permanent scour monitoring system). In addition, some bridges received a rating of Priority 1*, which means that in addition to scoring Priority 1 on the Risk Decision Matrix, the bridge was also designated as “important” using the Bridge Importance Analysis. This is the highest priority that a bridge can be assigned. The list of 17 high risk bridges was forwarded to the Department via memorandum on August 5, 2015.
8
It is interesting that all four of the State’s physiographic provinces are represented in these recommendations, including the Coastal Plain, Piedmont, Highlands, and Ridge and Valley. More than half of the bridges (9) are located in the Coastal Plain. Bridge length also varies widely from 21 to 248 feet. The bridge importance rating was also checked for each bridge, since this has the potential to increase scour priority. Bridge importance is based upon ADT, detour length, and bridge length. Only three bridges were designated as having special importance in this group. The search for additional high risk bridges was ongoing throughout the research study. During late Fall 2016, two additional high risk bridges were identified while performing full SEM analyses during Task 1. These bridges are also shown in Table 1. The Department was notified about the additional bridges via memorandum on January 5, 2017. During the prescreening process, the Research Team identified three more high risk bridges that are not listed in Table 1. This is because the bridges were already contracted for repair by the Department. In addition, several more bridges were initially screened as high risk, but further investigation revealed that they are likely founded on bedrock. Such bridges are possible candidates for removal from the Critical List, and they will receive a full SEM analysis at a later time. Risk rating decisions were also delayed for several long span bridges. The reason is that there was insufficient evidence of substantial scour, and more study is needed before committing major repair funds.
9
Table 1 – Prescreened High Risk Bridges Recommended for Repair (With Ranking)
Rank No.
Structure No.
Route/ Stream Geotechnical Risk
Hydrological Risk
Bridge Importance
Final Scour Priority
1 1807-155 US 202 over N.B. Raritan River High High Incr. Priority 1*
2 0601-151 Rt. 47 over Manumuskin River High High Incr. Priority 1*
3 0825-150 Rt. 322 over Raccoon Creek High High No Change 1
4 0711-150 Rt. 10 over Canoe Brook High High No Change 1
5 1912-158 Rt. 206 over Branch of Big Flat Brook High High No Change 1
6 0722-157 Rt. 46 over Passaic River Medium High Incr. Priority 1
7 1227-159 Rt. 130 over Oakeys Brook High High No Change 1
8 1903-153 Rt. 23 over Franklin Lake High High No Change 1
9 0606-150 Rt. 49 over Menantico River High High No Change 1
10 0424-151 Rt. 154 over North Branch Cooper River High High No Change 1
11 1912-160 Rt. 206 over Big Flat Brook High Medium No Change 2
12 0509-150 Rt. 49 over Mill Creek Medium High No Change 2
13 0609-151 Rt. 55 over Menantico Creek, NB Medium High No Change 2
14 0609-152 Rt. 55 over Menantico Creek, SB Medium High No Change 2
15 0118-150 Rt. 206 over Cedar Branch Stream Medium High No Change 2
16 1417-157 Rt. 206 over Flanders Run Medium High No Change 2
17 1304-156 Rt. 33 over Manalapan Brook High Medium No Change 2
18 1405-156 Route 23 over Pequannock River/Hamburg Turnpike
High High No Change 1
19 1102-150 US Route 1B over Shabakunk Creek High High No Change 1
* Indicates the bridge has a SEM matrix priority of 1. The bridge was also found to be important using the Bridge Importance Analysis.
10
EVALUATION OF SCOUR CRITICAL BRIDGES USING SEM
Background
A principal objective of the current study was to evaluate 12 scour critical bridges using the Scour Evaluation Model (SEM) to demonstrate the method. In completing this task, the Research Team worked with three New Jersey consulting firms, who are expert in scour evaluation: AECOM of Piscataway, Mott MacDonald of Iselin, and McCormick Taylor of Mount Laurel. The purpose of teaming with the consultants was to transfer knowledge of SEM into statewide practice as effectively and expeditiously as possible. During the task, the Consultants led the SEM analyses, including office reconnaissance, field investigation, scour analysis, risk assessment, priority determination, and report preparation. The Research Team played a supporting role by furnishing preliminary geotechnical and hydrologic information, and they also offered technical advice during the study. Separate kick-off meetings were held with each firm during late spring to provide instruction about SEM and to introduce the bridge assignments. The firms immediately began performing SEM reconnaissance studies, and field scour inspections were launched during the summer months. Additional meetings, conference calls, and field visits were held between the Research Team and the Consultants to address application questions as they arose. Summary of SEM Results
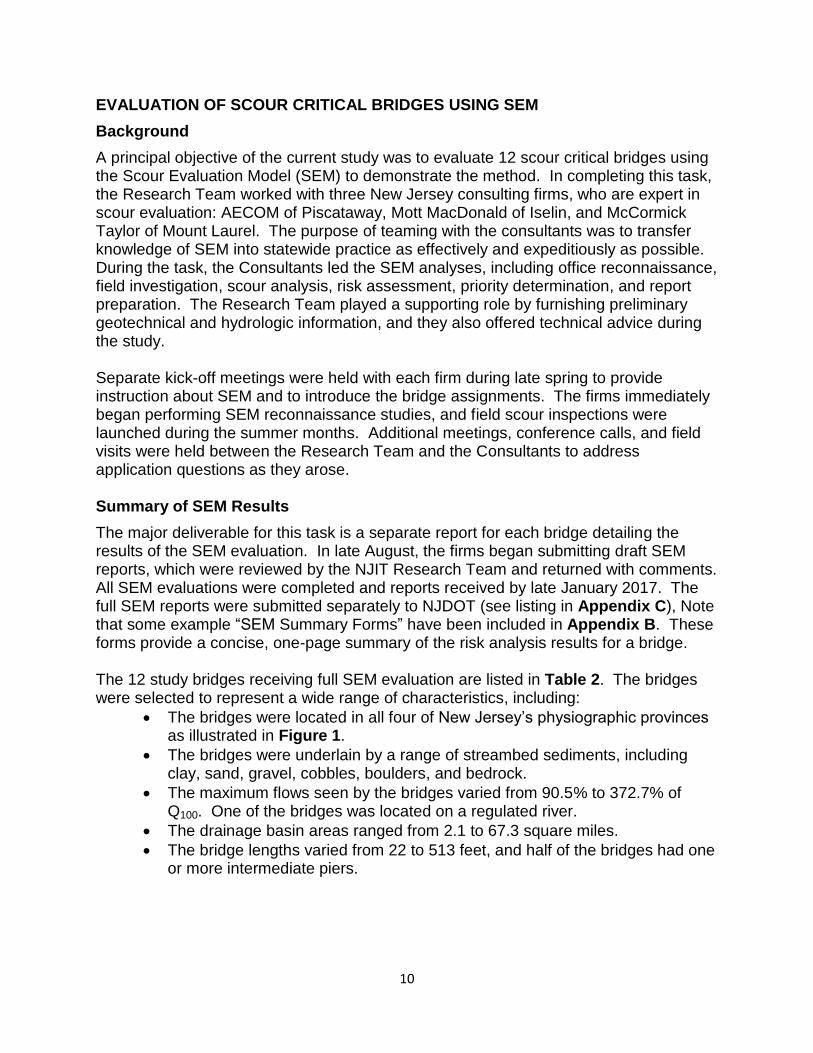
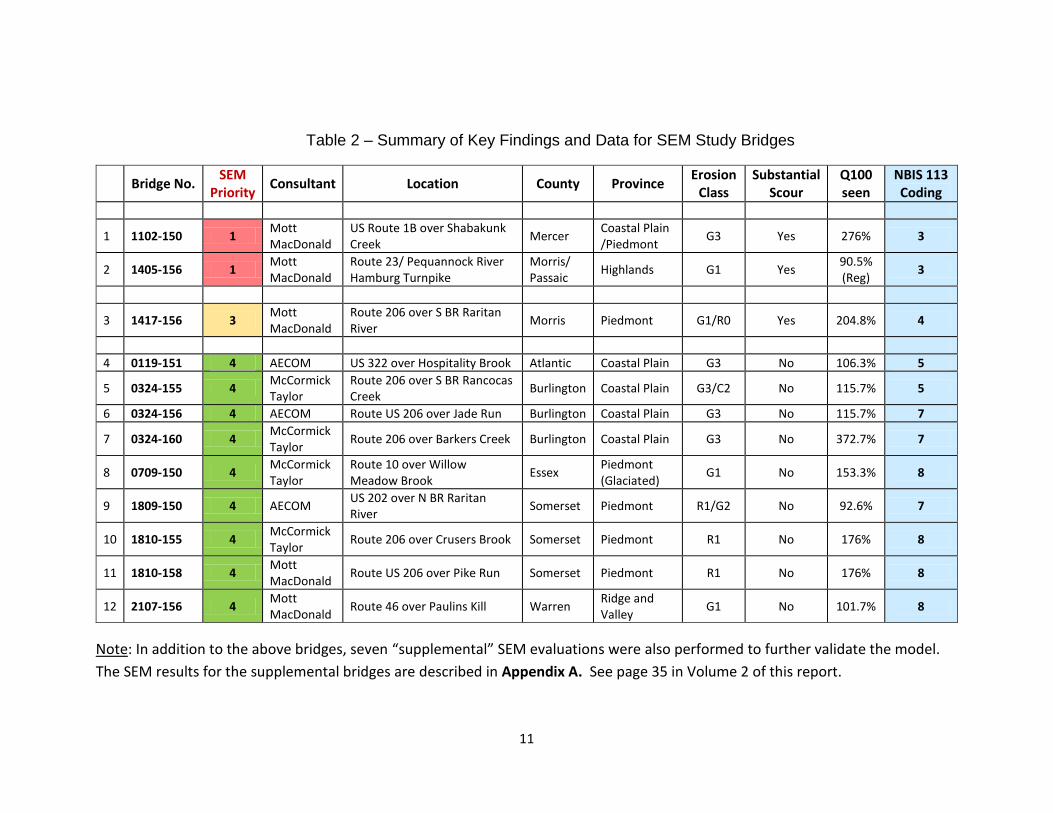
The major deliverable for this task is a separate report for each bridge detailing the results of the SEM evaluation. In late August, the firms began submitting draft SEM reports, which were reviewed by the NJIT Research Team and returned with comments. All SEM evaluations were completed and reports received by late January 2017. The full SEM reports were submitted separately to NJDOT (see listing in Appendix C), Note that some example “SEM Summary Forms” have been included in Appendix B. These forms provide a concise, one-page summary of the risk analysis results for a bridge. The 12 study bridges receiving full SEM evaluation are listed in Table 2. The bridges were selected to represent a wide range of characteristics, including:
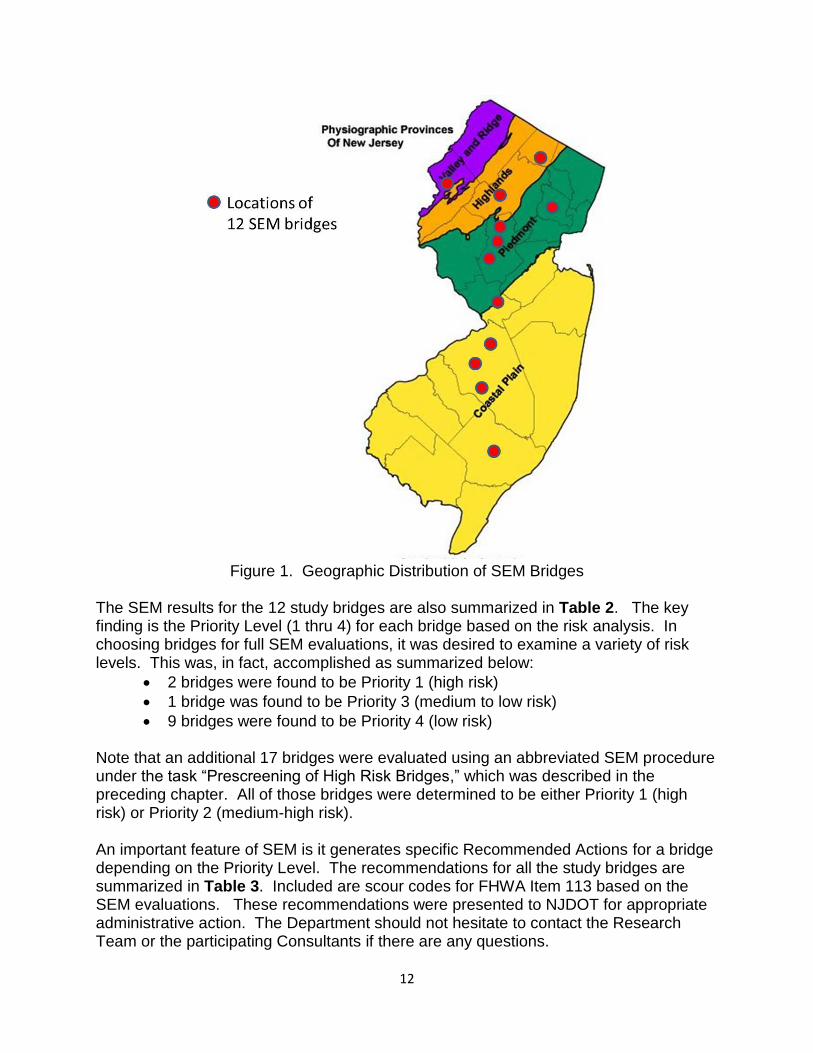
The bridges were located in all four of New Jersey’s physiographic provinces as illustrated in Figure 1.
The bridges were underlain by a range of streambed sediments, including clay, sand, gravel, cobbles, boulders, and bedrock.
The maximum flows seen by the bridges varied from 90.5% to 372.7% of Q100. One of the bridges was located on a regulated river.
The drainage basin areas ranged from 2.1 to 67.3 square miles.
The bridge lengths varied from 22 to 513 feet, and half of the bridges had one or more intermediate piers.
11
Table 2 – Summary of Key Findings and Data for SEM Study Bridges
Bridge No.
SEM Priority
Consultant Location County Province Erosion
Class Substantial
Scour Q100 seen
NBIS 113 Coding
1 1102-150 1 Mott MacDonald
US Route 1B over Shabakunk Creek
Mercer Coastal Plain /Piedmont
G3 Yes 276% 3
2 1405-156 1 Mott MacDonald
Route 23/ Pequannock River Hamburg Turnpike
Morris/ Passaic
Highlands G1 Yes 90.5% (Reg)
3
3 1417-156 3 Mott MacDonald
Route 206 over S BR Raritan River
Morris Piedmont G1/R0 Yes 204.8% 4
4 0119-151 4 AECOM US 322 over Hospitality Brook Atlantic Coastal Plain G3 No 106.3% 5
5 0324-155 4 McCormick Taylor
Route 206 over S BR Rancocas Creek
Burlington Coastal Plain G3/C2 No 115.7% 5
6 0324-156 4 AECOM Route US 206 over Jade Run Burlington Coastal Plain G3 No 115.7% 7
7 0324-160 4 McCormick Taylor
Route 206 over Barkers Creek Burlington Coastal Plain G3 No 372.7% 7
8 0709-150 4 McCormick Taylor
Route 10 over Willow Meadow Brook
Essex Piedmont (Glaciated)
G1 No 153.3% 8
9 1809-150 4 AECOM US 202 over N BR Raritan River
Somerset Piedmont R1/G2 No 92.6% 7
10 1810-155 4 McCormick Taylor
Route 206 over Crusers Brook Somerset Piedmont R1 No 176% 8
11 1810-158 4 Mott MacDonald
Route US 206 over Pike Run Somerset Piedmont R1 No 176% 8
12 2107-156 4 Mott MacDonald
Route 46 over Paulins Kill Warren Ridge and Valley
G1 No 101.7% 8
Note: In addition to the above bridges, seven “supplemental” SEM evaluations were also performed to further validate the model.
The SEM results for the supplemental bridges are described in Appendix A. See page 35 in Volume 2 of this report.
12
Figure 1. Geographic Distribution of SEM Bridges
The SEM results for the 12 study bridges are also summarized in Table 2. The key finding is the Priority Level (1 thru 4) for each bridge based on the risk analysis. In choosing bridges for full SEM evaluations, it was desired to examine a variety of risk levels. This was, in fact, accomplished as summarized below:
2 bridges were found to be Priority 1 (high risk)
1 bridge was found to be Priority 3 (medium to low risk)
9 bridges were found to be Priority 4 (low risk) Note that an additional 17 bridges were evaluated using an abbreviated SEM procedure under the task “Prescreening of High Risk Bridges,” which was described in the preceding chapter. All of those bridges were determined to be either Priority 1 (high risk) or Priority 2 (medium-high risk). An important feature of SEM is it generates specific Recommended Actions for a bridge depending on the Priority Level. The recommendations for all the study bridges are summarized in Table 3. Included are scour codes for FHWA Item 113 based on the SEM evaluations. These recommendations were presented to NJDOT for appropriate administrative action. The Department should not hesitate to contact the Research Team or the participating Consultants if there are any questions.

13
Table 3 – Summary of Recommended Actions for SEM Study Bridges
SEM Priority
Recommended Actions Bridges Identified Item 113 Code
1 (1) Continue flood watch or Install Real-time Monitoring System until repaired.
(2) Continue annual NBIS inspection with fascia soundings until repaired.
(3) Install Protective Measures* as soon as possible.
1102-150: US Route 1B over Shabakunk Creek
1405-156: Route 23/ Pequannock River Hamburg Turnpike
3
3
2 (1) Continue Flood Watch until repaired. (2) Continue annual NBIS inspection with
fascia soundings until repaired. (3) Install Protective Measures*
None in this study group. -
3 (1) Continue annual NBIS inspection with fascia soundings until resolved.
(2) Consider use of engineering judgment to designate the bridge as either Priority 2 or 4.
(3) Alternatively, consider monitoring for an intermediate period (3± years), then revisit SEM Risk Analysis.
1417-156: Route 206 over S BR Raritan River
4
4 Bridge is recommended for removal from the Scour Critical List. Return to biannual NBIS inspection schedule. Continue M&R to control minor erosion zones and debris.
0119-151: US 322 over Hospitality Brook
0324-155: Route 206 over S BR Rancocas Creek
0324-156: Route US 206 over Jade Run
0324-160: Route 206 over Barkers Creek
0709-150: Route 10 over Willow Meadow Brook
1809-150: US 202 over N BR Raritan River
1810-155: Route 206 over Crusers Brook
1810-158: Route US 206 over Pike Run
2107-156: Route 46 over Paulins Kill
5
5
7
7
8
7
8
8
8
* Note that long term monitoring is an acceptable protective measure for Priority 2 and 3 bridges determined to have the lowest consequence of failure (COF) and/or low average daily traffic (ADT). However, a bridge with a monitoring countermeasure shall retain its scour critical code. Long term monitoring is not permitted as a protective measure for Priority 1 bridges.

14
SEM Experience and Feedback
Since SEM is a new procedure to evaluate scour risk of existing bridges, the participating Consultants were asked about their experience in applying the model to their assigned bridges. The Consultants were also solicited for suggestions to improve the model. The following is a composite summary of their responses.
1. General Use and Effectiveness of SEM: There was a general consensus that SEM offered some advantages over a straight application of HEC-18. This is because SEM provided “more detail and structure” to bridge scour evaluation. The model also made it easier for an evaluator to reach a conclusion about the risk level of a bridge and to make a specific recommendation. In addition, it was acknowledged that SEM’s geotechnical and hydrologic/hydraulic protocols examine more technical factors affecting scour performance than standard scour evaluations. Overall, the Consultants said they were “comfortable” in using SEM and relying on the final result.
2. Role of Engineering Judgement. Even though the SEM flow charts and decision matrix are quite determinate, users were asked to comment on the role of “engineering judgement” in the model. The consistent response was that there is still ample opportunity for exercising judgment when using SEM. Two specific examples include the decision of whether “significant scour” has been observed, and also the assessment of whether “adequate cover” remains over a spread footing. Such judgements permit an evaluator to steer a model result towards a higher or lower risk level.
3. Specific Suggestions for SEM Flow Charts and Risk Decision Matrix: a. When plotting the results of the geotechnical and hydrologic/hydraulic risk
analyses on the Risk Decision Matrix, users should have the option to locate a point on a boundary line between two Priority Levels, if that is their judgement.
b. Consideration should be given to inserting structural vulnerability into the risk analysis. For example, a two-stringer framing system tends to increase scour risk, while a monolithic arch framing system or a scour slab tend to reduce scour risk.
c. The presence of existing countermeasures can influence the risk level of a bridge. Thus, it was suggested to more formally document existing countermeasures, including: (1) assessment of condition; (2) whether or not they are performing adequately; and (3) whether or not they were designed in accordance with HEC-23.
d. For the Bridge Importance Analysis (BIA), consider developing a better definition of the variable “Detour Length.” For example, car and truck detour lengths may be different. Also, detour time may be more relevant than detour distance since it factors in the speed limit.
4. Specific Suggestions for SEM Investigations, Protocols, and Reports: a. There was consensus that if a bridge is determined to be medium to low risk
(Priority Level 3 or 4), then a full length SEM Report is necessary to justify any recommended actions. But if during the early stages of an evaluation a

15
bridge is determined to have high scour risk (Priority Level 1 or 2), an “abbreviated” SEM Report is normally sufficient to document the findings and recommend the bridge for repair.
b. It was suggested to add more guidance about checking for evidence of substructure damage and/or settlement due to scour, since this often generates an observation of “substantial scour”.
c. A more detailed outline of report format would be helpful. d. Consider adding Item 113 bridge coding to the example problems. e. It was suggested that the Field Scour Inspection Form be formatted for use in
an electronic tablet for convenience of the field team. Research Team Note: The preceding comments and feedback from the participating Consultants are both insightful and valuable. The Research Team plans to incorporate some of the suggestions into the next iteration of SEM. However, all are viewed as clarifications or enhancements, and they do not affect the principal function and efficacy of the current version of SEM.
16
INVESTIGATION OF ENVELOPE CURVES FOR NEW JERSEY BRIDGES
Background
The third major task of the research study was to investigate use of envelope curves to evaluate scour for New Jersey bridges. SEM recommends that envelope curves be used for existing bridges to supplement the HEC-18 scour prediction equations. The general concept of the envelope curve is to correlate the upper range of expected scour depth with a measurable hydraulic variable such as embankment length or pier width. The method was developed by the USGS, and the original envelope curves were based on comprehensive studies of historic scour measured at bridges located in 14 states, including Alabama, Alaska, Arkansas, Colorado, Georgia, Indiana, Louisiana, Maine, Minnesota, Missouri, Ohio, South Carolina, South Dakota and Montana (Benedict, 2003; Benedict and Caldwell 2005, 2009). The majority of these bridges were located in South Carolina’s Coastal Plain and Piedmont physiographic provinces. More recently, the method was validated with field scour measurements from additional states, as well as experimental data from laboratory flume studies (Benedict and Caldwell, 2016a and 2016b; Benedict et al, 2016). There are two main reasons why envelope curves are recommended for existing bridges in New Jersey. First, the method is straightforward to apply, yet it provides reliable estimates of expected scour. In their studies, the USGS examined different hydraulic variables to isolate the ones that best correlate with scour depth. For abutment scour, the most effective scour predictor was found to be embankment length blocking the flow (L). For pier scour, width of the pier (b) was the best predictor. These same two variables are used in SEM
The second reason for adopting the envelope curve method is the geologic similarity between South Carolina and New Jersey. For example, the Coastal Plain province extends through both states, where it is underlain by very similar unconsolidated sediments consisting of sand, clay, and silt. In addition, South Carolina’s Piedmont province is dominated by nearly the same residual soil and weathered bedrock as New Jersey’s Non-Glaciated Piedmont and Non-Glaciated Highlands provinces. These geologic similarities were confirmed quantitatively by the Research Team. More background and details about the envelope curves adapted for use in New Jersey are provided in the report, “Design and Evaluation of Scour for Bridges Using HEC-18” (Schuring et al, 2017). It is worth noting that envelope curve results are just one of seven input parameters used by New Jersey SEM to evaluate scour risk. The other six are erosion resistance of streambed, bridge age, field scour observations, channel stability, flow history relative to Q100, and HEC-18 scour calculations. This multidimensional approach assures that bridges are vetted “holistically” instead of just relying on a few factors as was sometimes the practice in the past.

17
Bridges Studied with Envelope Curves
In conjunction with this task, 15 bridges throughout the State were visited to measure actual scour depths. The objective was to generate actual New Jersey data in support of the envelope curve method. Work was performed by the Research Team during the summer, fall, and winter of 2016. Field measurements were made at the upstream and downstream fascia of each bridge to establish the current stream bed level and to estimate the amount of cover over the foundations. Measurements were conducted in-stream utilizing depth soundings, direct probing, and ground penetrating radar (GPR). Additional information about the methods of measurement is provided in the next chapter, “Methodologies Used during the Implementation Phase,” on page 23.
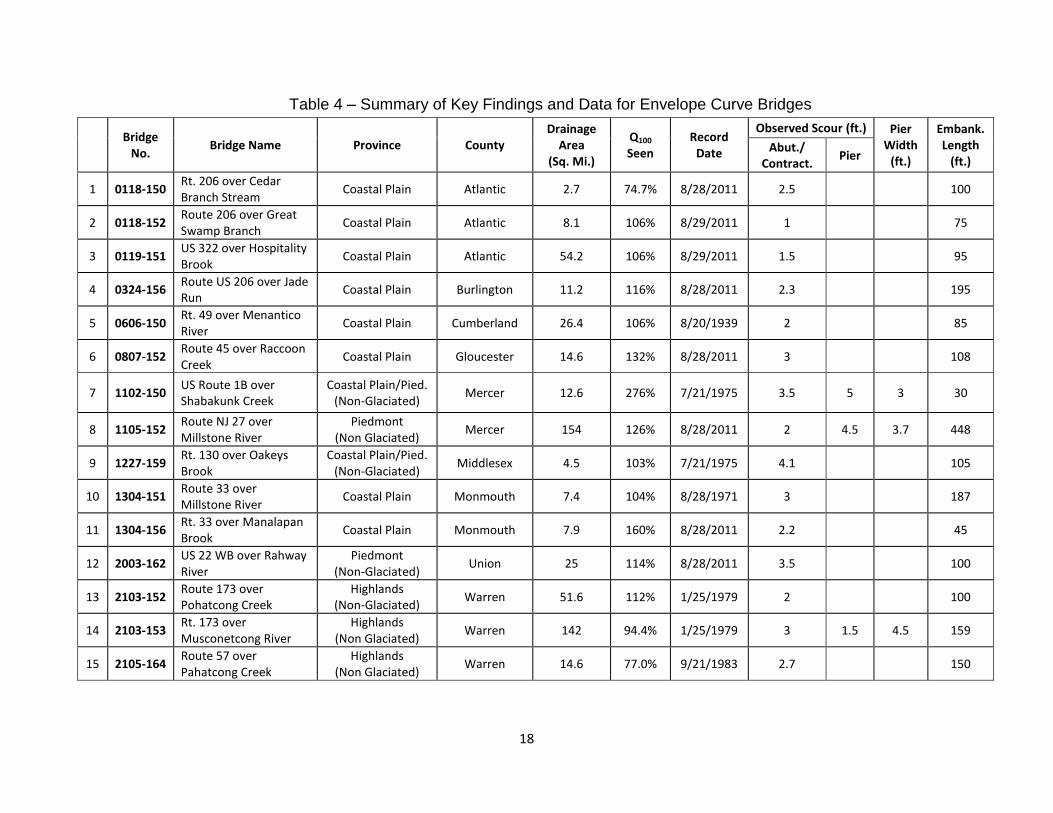
The 15 bridges investigated during this task are listed in Table 4 along with their basic data. The bridges were selected to represent a range of characteristics, including:
Bridges were located in three physiographic provinces: Coastal Plain, Non-Glaciated Piedmont, and Non-Glaciated Highlands. Thus, all streambeds contained non-glaciated, fine-grained soils;
Bridges were located in nine different New Jersey counties;
The bridges featured a wide range of embankment lengths blocking flow (L);
Most bridges had experienced flow rates exceeding a 100-year flood event. The exceptions were two bridges that had flow rates less than Q100, but had large L values, which were useful for plotting purposes;
The selected bridges included some that had “passed” the envelope curve criteria and some that had “failed.” This was based on whether predicted scour depths were above or below the bottom of the footings, respectively;
There was significant variation in the drainage areas of the selected bridges; and
The study also included three bridges with piers, which is consistent with the proportion of scour critical bridges within the non-glaciated regions of New Jersey that have multiple spans.
Table 4 also summarizes the key results for each of the study bridges, including the values of observed abutment/contraction scour, embankment length, observed pier scour, and pier width. The initial source of embankment lengths was the Stage II studies, but a number of bridges were also field-checked and adjusted by the NJIT Research Team, especially where the values were unreasonably small or large. Note that the larger of two embankment lengths was always chosen whenever there was a difference between the left and right values. This is consistent with the USGS approach, where the larger value was shown to have the stronger influence on scour depth. The “Fascia Soundings” used to estimate scour depth for the study bridges are presented in Appendix D. Both upstream and downstream sections are shown for each of the 15 bridges. The figures also indicate the streambed level recorded during the Stage II investigation, as well as the level at original construction, when available.
18
Table 4 – Summary of Key Findings and Data for Envelope Curve Bridges
Bridge
No. Bridge Name Province County
Drainage Area
(Sq. Mi.)
Q100 Seen
Record Date
Observed Scour (ft.) Pier Width
(ft.)
Embank. Length
(ft.) Abut./
Contract. Pier
1 0118-150 Rt. 206 over Cedar Branch Stream
Coastal Plain Atlantic 2.7 74.7% 8/28/2011 2.5 100
2 0118-152 Route 206 over Great Swamp Branch
Coastal Plain Atlantic 8.1 106% 8/29/2011 1 75
3 0119-151 US 322 over Hospitality Brook
Coastal Plain Atlantic 54.2 106% 8/29/2011 1.5 95
4 0324-156 Route US 206 over Jade Run
Coastal Plain Burlington 11.2 116% 8/28/2011 2.3 195
5 0606-150 Rt. 49 over Menantico River
Coastal Plain Cumberland 26.4 106% 8/20/1939 2 85
6 0807-152 Route 45 over Raccoon Creek
Coastal Plain Gloucester 14.6 132% 8/28/2011 3 108
7 1102-150 US Route 1B over Shabakunk Creek
Coastal Plain/Pied. (Non-Glaciated)
Mercer 12.6 276% 7/21/1975 3.5 5 3 30
8 1105-152 Route NJ 27 over Millstone River
Piedmont (Non Glaciated)
Mercer 154 126% 8/28/2011 2 4.5 3.7 448
9 1227-159 Rt. 130 over Oakeys Brook
Coastal Plain/Pied. (Non-Glaciated)
Middlesex 4.5 103% 7/21/1975 4.1 105
10 1304-151 Route 33 over Millstone River
Coastal Plain Monmouth 7.4 104% 8/28/1971 3 187
11 1304-156 Rt. 33 over Manalapan Brook
Coastal Plain Monmouth 7.9 160% 8/28/2011 2.2 45
12 2003-162 US 22 WB over Rahway River
Piedmont (Non-Glaciated)
Union 25 114% 8/28/2011 3.5 100
13 2103-152 Route 173 over Pohatcong Creek
Highlands (Non-Glaciated)
Warren 51.6 112% 1/25/1979 2 100
14 2103-153 Rt. 173 over Musconetcong River
Highlands (Non Glaciated)
Warren 142 94.4% 1/25/1979 3 1.5 4.5 159
15 2105-164 Route 57 over Pahatcong Creek
Highlands (Non Glaciated)
Warren 14.6 77.0% 9/21/1983 2.7 150
19
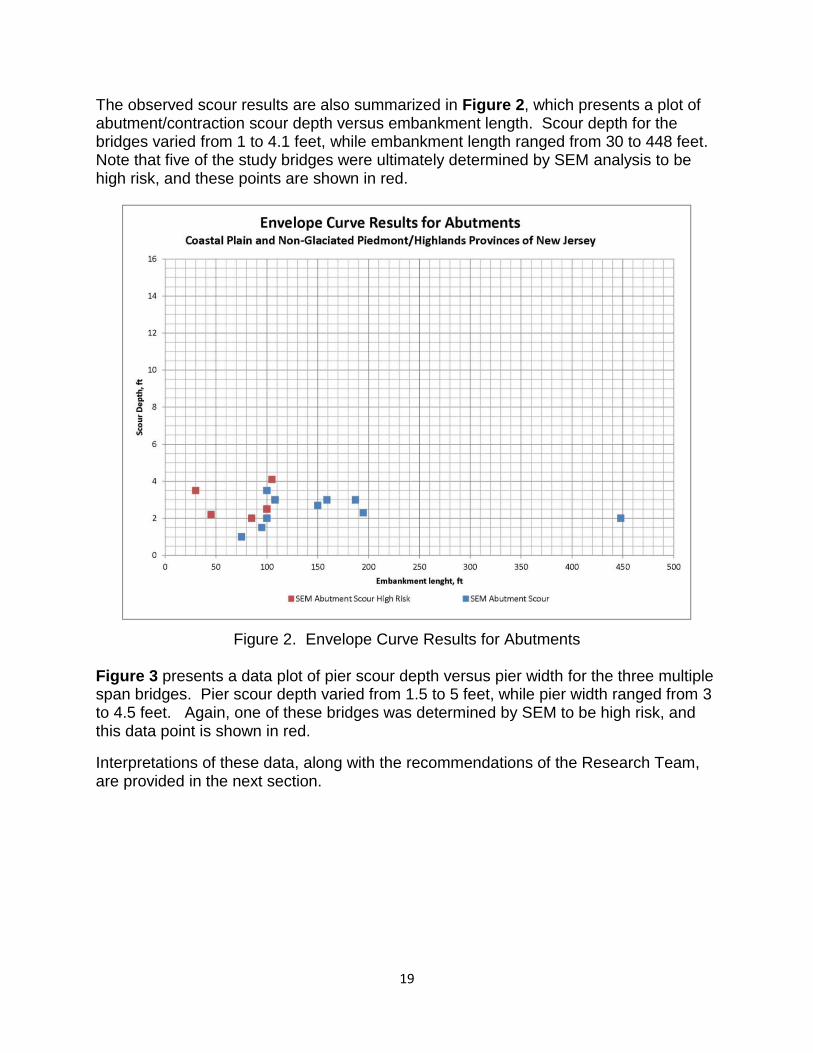
The observed scour results are also summarized in Figure 2, which presents a plot of abutment/contraction scour depth versus embankment length. Scour depth for the bridges varied from 1 to 4.1 feet, while embankment length ranged from 30 to 448 feet. Note that five of the study bridges were ultimately determined by SEM analysis to be high risk, and these points are shown in red.
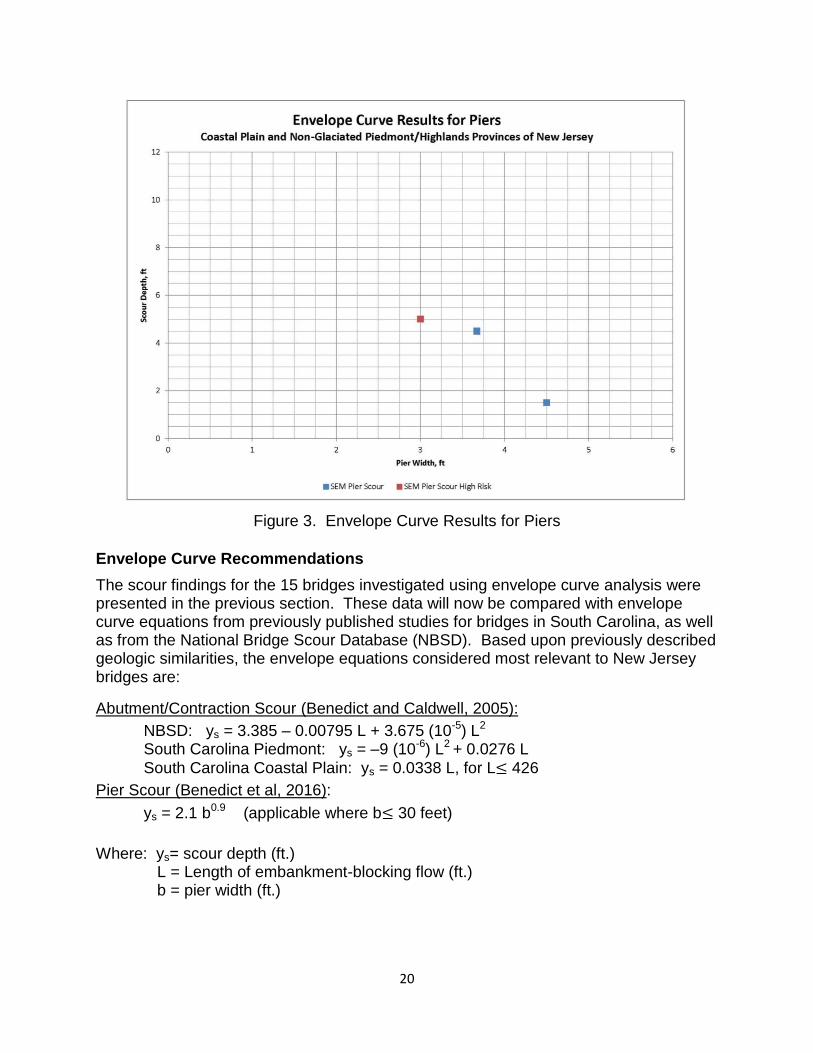
Figure 2. Envelope Curve Results for Abutments Figure 3 presents a data plot of pier scour depth versus pier width for the three multiple span bridges. Pier scour depth varied from 1.5 to 5 feet, while pier width ranged from 3 to 4.5 feet. Again, one of these bridges was determined by SEM to be high risk, and this data point is shown in red.
Interpretations of these data, along with the recommendations of the Research Team, are provided in the next section.
20
Figure 3. Envelope Curve Results for Piers
Envelope Curve Recommendations
The scour findings for the 15 bridges investigated using envelope curve analysis were presented in the previous section. These data will now be compared with envelope curve equations from previously published studies for bridges in South Carolina, as well as from the National Bridge Scour Database (NBSD). Based upon previously described geologic similarities, the envelope equations considered most relevant to New Jersey bridges are:
Abutment/Contraction Scour (Benedict and Caldwell, 2005):
NBSD: ys = 3.385 – 0.00795 L + 3.675 (10-5) L2
South Carolina Piedmont: ys = –9 (10-6) L2 + 0.0276 L
South Carolina Coastal Plain: ys = 0.0338 L, for L 426
Pier Scour (Benedict et al, 2016):
ys = 2.1 b0.9 (applicable where b 30 feet)
Where: ys= scour depth (ft.) L = Length of embankment-blocking flow (ft.)
b = pier width (ft.)
21
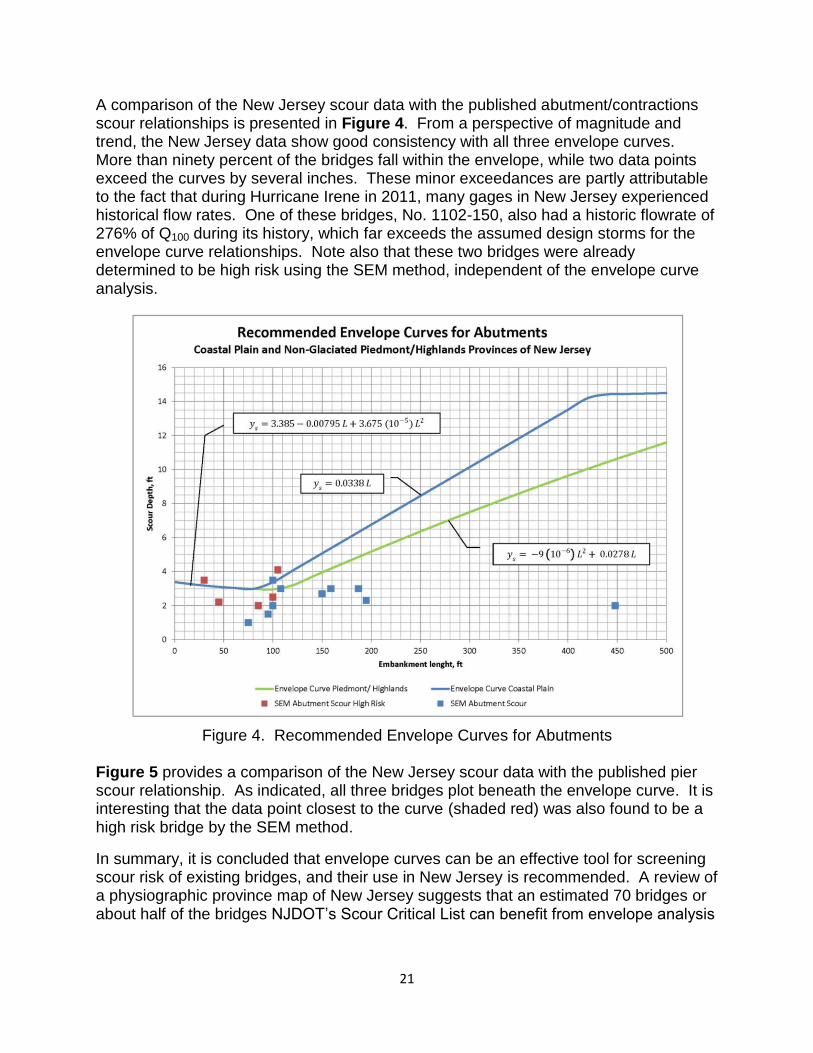
A comparison of the New Jersey scour data with the published abutment/contractions scour relationships is presented in Figure 4. From a perspective of magnitude and trend, the New Jersey data show good consistency with all three envelope curves. More than ninety percent of the bridges fall within the envelope, while two data points exceed the curves by several inches. These minor exceedances are partly attributable to the fact that during Hurricane Irene in 2011, many gages in New Jersey experienced historical flow rates. One of these bridges, No. 1102-150, also had a historic flowrate of 276% of Q100 during its history, which far exceeds the assumed design storms for the envelope curve relationships. Note also that these two bridges were already determined to be high risk using the SEM method, independent of the envelope curve analysis.
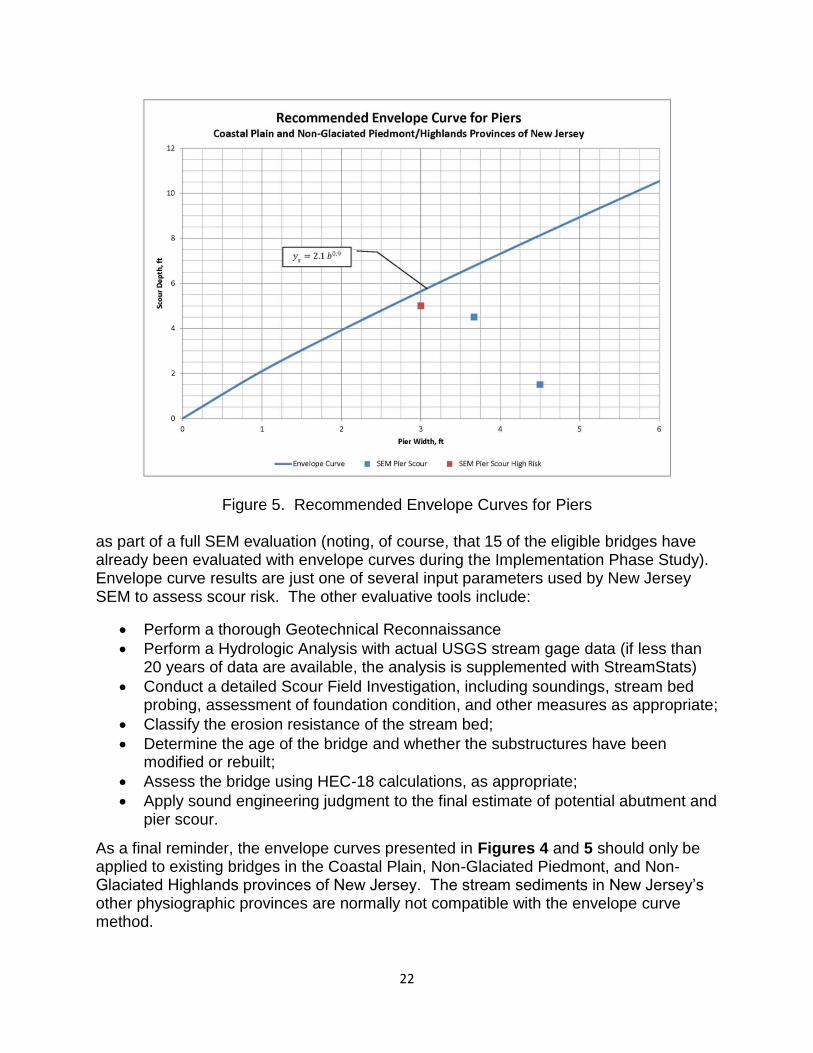
Figure 4. Recommended Envelope Curves for Abutments Figure 5 provides a comparison of the New Jersey scour data with the published pier scour relationship. As indicated, all three bridges plot beneath the envelope curve. It is interesting that the data point closest to the curve (shaded red) was also found to be a high risk bridge by the SEM method.
In summary, it is concluded that envelope curves can be an effective tool for screening scour risk of existing bridges, and their use in New Jersey is recommended. A review of a physiographic province map of New Jersey suggests that an estimated 70 bridges or about half of the bridges NJDOT’s Scour Critical List can benefit from envelope analysis
22
Figure 5. Recommended Envelope Curves for Piers as part of a full SEM evaluation (noting, of course, that 15 of the eligible bridges have already been evaluated with envelope curves during the Implementation Phase Study). Envelope curve results are just one of several input parameters used by New Jersey SEM to assess scour risk. The other evaluative tools include:
Perform a thorough Geotechnical Reconnaissance
Perform a Hydrologic Analysis with actual USGS stream gage data (if less than 20 years of data are available, the analysis is supplemented with StreamStats)
Conduct a detailed Scour Field Investigation, including soundings, stream bed probing, assessment of foundation condition, and other measures as appropriate;
Classify the erosion resistance of the stream bed;
Determine the age of the bridge and whether the substructures have been modified or rebuilt;
Assess the bridge using HEC-18 calculations, as appropriate;
Apply sound engineering judgment to the final estimate of potential abutment and pier scour.
As a final reminder, the envelope curves presented in Figures 4 and 5 should only be applied to existing bridges in the Coastal Plain, Non-Glaciated Piedmont, and Non-Glaciated Highlands provinces of New Jersey. The stream sediments in New Jersey’s other physiographic provinces are normally not compatible with the envelope curve method.
23
METHODOLOGIES USED DURING THE IMPLEMENTATION PHASE
Overview of Scour Evaluation Model (SEM)
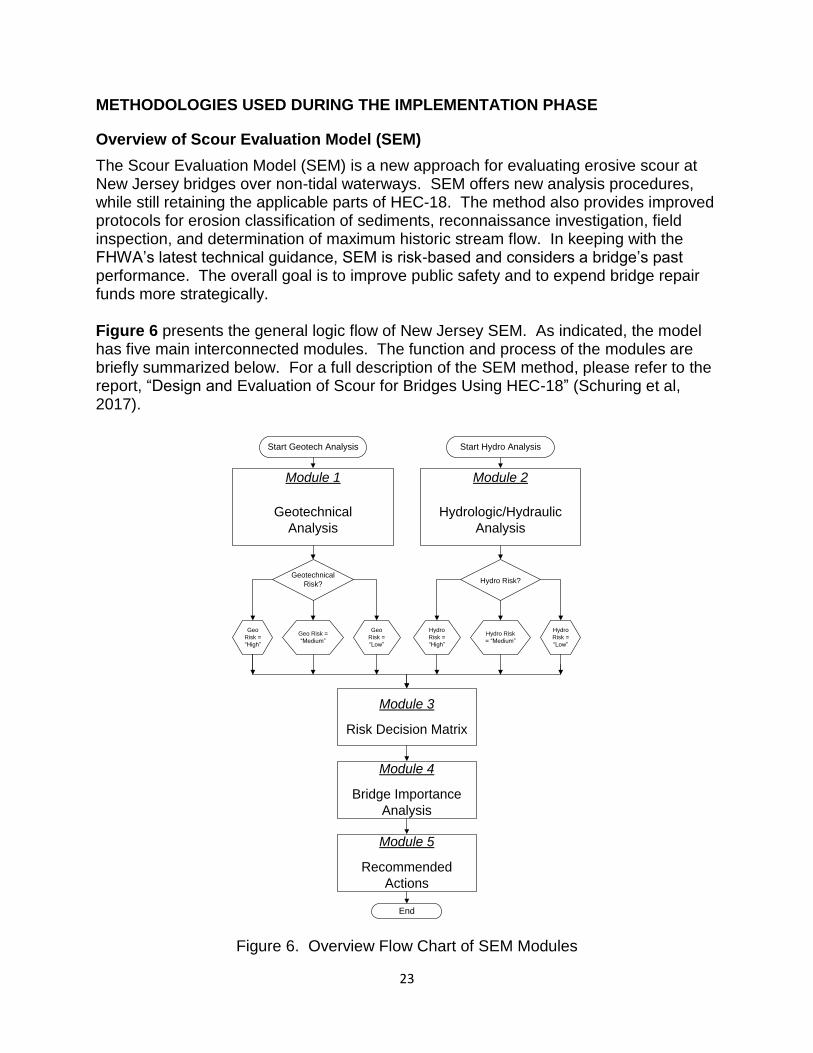
The Scour Evaluation Model (SEM) is a new approach for evaluating erosive scour at New Jersey bridges over non-tidal waterways. SEM offers new analysis procedures, while still retaining the applicable parts of HEC-18. The method also provides improved protocols for erosion classification of sediments, reconnaissance investigation, field inspection, and determination of maximum historic stream flow. In keeping with the FHWA’s latest technical guidance, SEM is risk-based and considers a bridge’s past performance. The overall goal is to improve public safety and to expend bridge repair funds more strategically. Figure 6 presents the general logic flow of New Jersey SEM. As indicated, the model has five main interconnected modules. The function and process of the modules are briefly summarized below. For a full description of the SEM method, please refer to the report, “Design and Evaluation of Scour for Bridges Using HEC-18” (Schuring et al, 2017).
Start Geotech Analysis
Module 1
Geotechnical
Analysis
Module 2
Hydrologic/Hydraulic
Analysis
Module 3
Risk Decision Matrix
Module 5
Recommended
Actions
Geo Risk =
“Medium”
Geo
Risk =
“High”
Geo
Risk =
“Low”
Geotechnical
Risk?
Hydro Risk
= “Medium”
Hydro
Risk =
“High”
Hydro
Risk =
“Low”
Start Hydro Analysis
End
Hydro Risk?
Module 4
Bridge Importance
Analysis
Figure 6. Overview Flow Chart of SEM Modules
24
Module 1 - Geotechnical Evaluation of Scour Model analysis begins with a geotechnical evaluation of scour. The soil and rock materials at the bridge are characterized as accurately as possible by a combination of reconnaissance study and field investigation. The model utilizes a new SEM classification system that reflects the erosion resistance of the streambed. The module also considers mitigating factors such as bridge age and evidence of field scour. The end result is a geotechnical risk rating of low, medium, or high.
Module 2 – Hydrologic/Hydraulic Evaluation of Scour The second module involves a hydrologic/hydraulic evaluation of scour. Again, the user performs certain reconnaissance and field studies to collect data, which are then analyzed. A key factor is whether or not the bridge has experienced a 100-year storm, and if it has, how did it perform. A field check also determines whether substantial scour is present. For bridges located in Coastal Plain and Non-glaciated Piedmont/Highlands provinces, a supplemental analysis is conducted using envelope curves. The end result is a hydrologic/hydraulic risk rating of low, medium, or high.
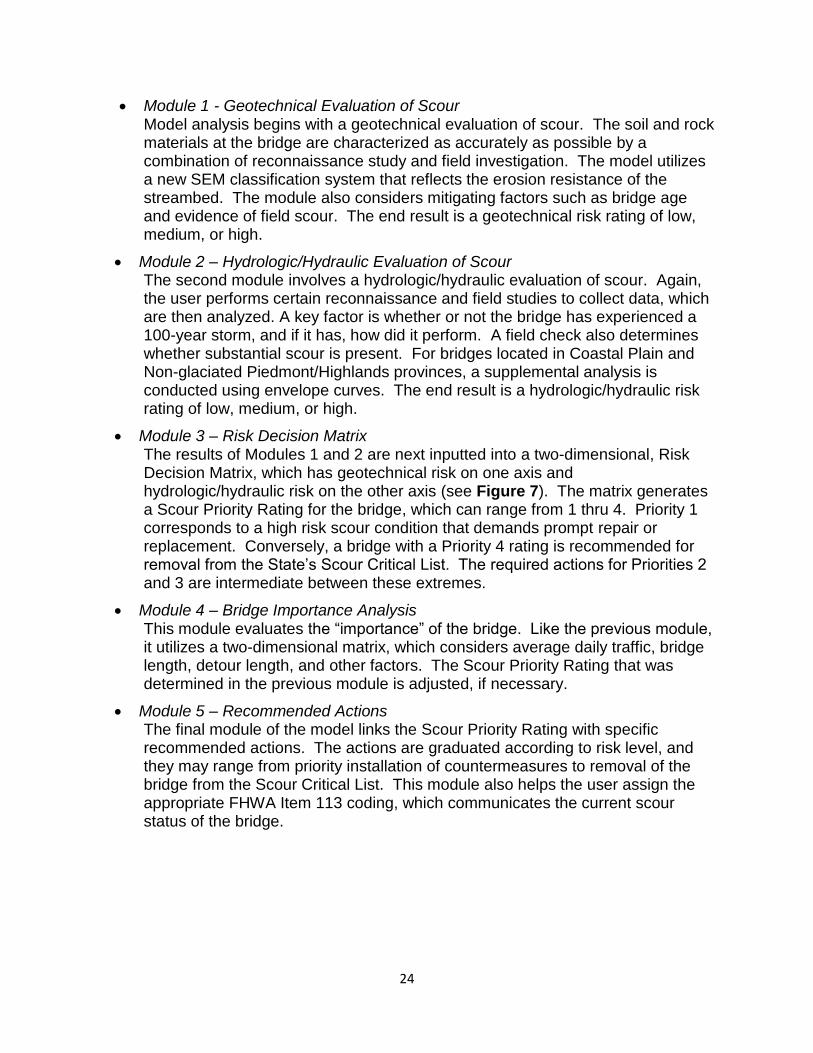
Module 3 – Risk Decision Matrix The results of Modules 1 and 2 are next inputted into a two-dimensional, Risk Decision Matrix, which has geotechnical risk on one axis and hydrologic/hydraulic risk on the other axis (see Figure 7). The matrix generates a Scour Priority Rating for the bridge, which can range from 1 thru 4. Priority 1 corresponds to a high risk scour condition that demands prompt repair or replacement. Conversely, a bridge with a Priority 4 rating is recommended for removal from the State’s Scour Critical List. The required actions for Priorities 2 and 3 are intermediate between these extremes.
Module 4 – Bridge Importance Analysis This module evaluates the “importance” of the bridge. Like the previous module, it utilizes a two-dimensional matrix, which considers average daily traffic, bridge length, detour length, and other factors. The Scour Priority Rating that was determined in the previous module is adjusted, if necessary.
Module 5 – Recommended Actions The final module of the model links the Scour Priority Rating with specific recommended actions. The actions are graduated according to risk level, and they may range from priority installation of countermeasures to removal of the bridge from the Scour Critical List. This module also helps the user assign the appropriate FHWA Item 113 coding, which communicates the current scour status of the bridge.
25
Figure 7. SEM Two-dimensional Risk Decision Matrix
26
Hydrologic Analysis Procedure
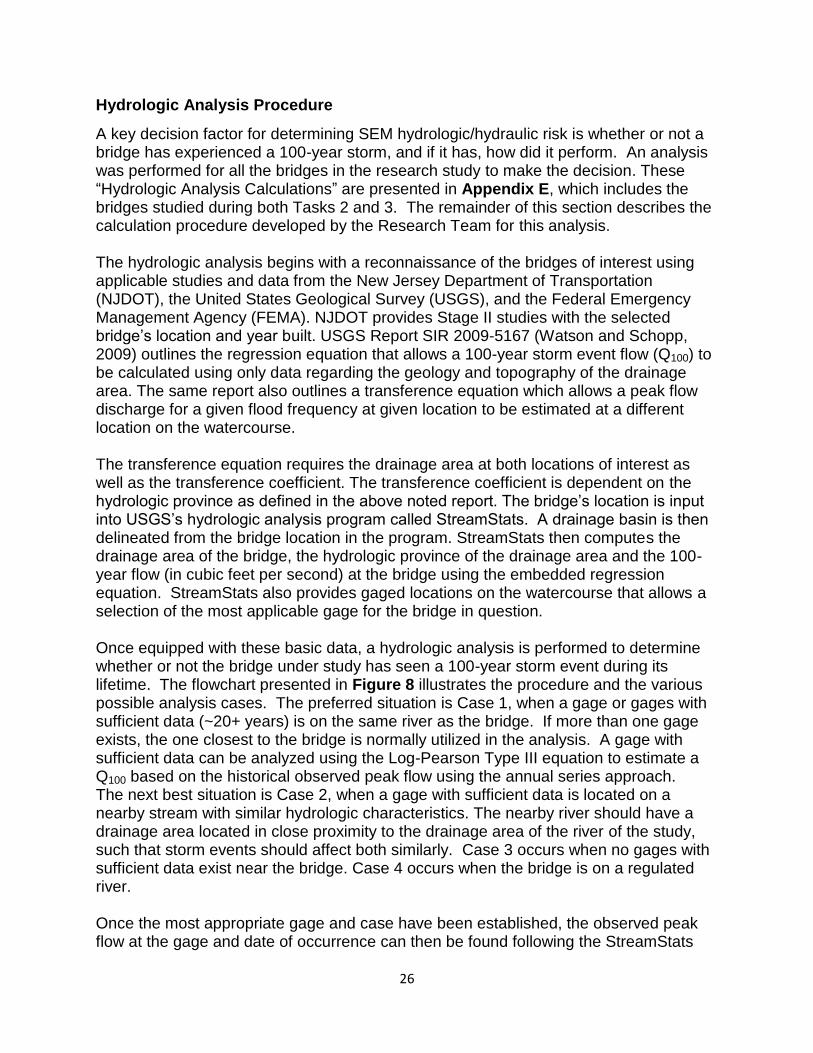
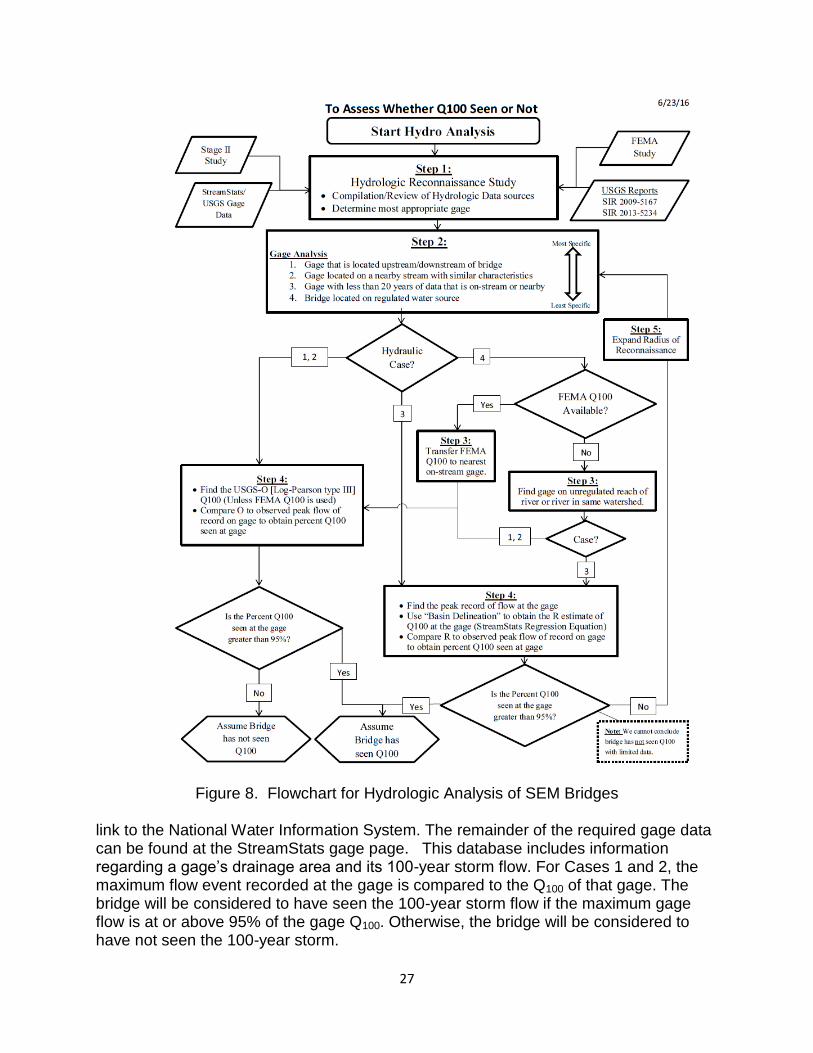
A key decision factor for determining SEM hydrologic/hydraulic risk is whether or not a bridge has experienced a 100-year storm, and if it has, how did it perform. An analysis was performed for all the bridges in the research study to make the decision. These “Hydrologic Analysis Calculations” are presented in Appendix E, which includes the bridges studied during both Tasks 2 and 3. The remainder of this section describes the calculation procedure developed by the Research Team for this analysis. The hydrologic analysis begins with a reconnaissance of the bridges of interest using applicable studies and data from the New Jersey Department of Transportation (NJDOT), the United States Geological Survey (USGS), and the Federal Emergency Management Agency (FEMA). NJDOT provides Stage II studies with the selected bridge’s location and year built. USGS Report SIR 2009-5167 (Watson and Schopp, 2009) outlines the regression equation that allows a 100-year storm event flow (Q100) to be calculated using only data regarding the geology and topography of the drainage area. The same report also outlines a transference equation which allows a peak flow discharge for a given flood frequency at given location to be estimated at a different location on the watercourse. The transference equation requires the drainage area at both locations of interest as well as the transference coefficient. The transference coefficient is dependent on the hydrologic province as defined in the above noted report. The bridge’s location is input into USGS’s hydrologic analysis program called StreamStats. A drainage basin is then delineated from the bridge location in the program. StreamStats then computes the drainage area of the bridge, the hydrologic province of the drainage area and the 100-year flow (in cubic feet per second) at the bridge using the embedded regression equation. StreamStats also provides gaged locations on the watercourse that allows a selection of the most applicable gage for the bridge in question. Once equipped with these basic data, a hydrologic analysis is performed to determine whether or not the bridge under study has seen a 100-year storm event during its lifetime. The flowchart presented in Figure 8 illustrates the procedure and the various possible analysis cases. The preferred situation is Case 1, when a gage or gages with sufficient data (~20+ years) is on the same river as the bridge. If more than one gage exists, the one closest to the bridge is normally utilized in the analysis. A gage with sufficient data can be analyzed using the Log-Pearson Type III equation to estimate a Q100 based on the historical observed peak flow using the annual series approach. The next best situation is Case 2, when a gage with sufficient data is located on a nearby stream with similar hydrologic characteristics. The nearby river should have a drainage area located in close proximity to the drainage area of the river of the study, such that storm events should affect both similarly. Case 3 occurs when no gages with sufficient data exist near the bridge. Case 4 occurs when the bridge is on a regulated river. Once the most appropriate gage and case have been established, the observed peak flow at the gage and date of occurrence can then be found following the StreamStats
27
Figure 8. Flowchart for Hydrologic Analysis of SEM Bridges
link to the National Water Information System. The remainder of the required gage data can be found at the StreamStats gage page. This database includes information regarding a gage’s drainage area and its 100-year storm flow. For Cases 1 and 2, the maximum flow event recorded at the gage is compared to the Q100 of that gage. The bridge will be considered to have seen the 100-year storm flow if the maximum gage flow is at or above 95% of the gage Q100. Otherwise, the bridge will be considered to have not seen the 100-year storm.
28
In Case 3, the Q100 at the gage is calculated from the regression equation utilizing Stream Stats rather than the Log-Pearson Type III approach. The maximum flow event recorded at the gage is compared to the regression Q100 of that gage. The bridge will be considered to have seen the 100-year storm flow if the maximum gage flow is above 95% of the gage Q100. However, unlike Case 1 and 2, it cannot be concluded that the bridge has not seen Q100 with limited data even if the maximum gage flow is below 95% of the gage regression Q100. In this case, the radius of gage reconnaissance should be expanded to locate another potential gage. A Case 4 situation is when the bridge is located on a regulated river that has reservoirs, pumping stations, major discharges/withdrawals, or other infrastructure. Gages on such rivers do not reflect natural flow amounts and therefore should not be used to calculate natural Q100 values. In situations where a bridge is located on a regulated river, FEMA Flood Insurance Studies can be helpful. If a FEMA study is not available for the area, a gage would have to be selected on an unregulated reach of the river or an unregulated river in the same watershed. Similar to the other cases, an unregulated gage would be selected nearest the FEMA Q100 data point or along the nearest unregulated section/river. The value would then be transferred to the selected gage using the transference equation, and the transferred Q100 value would be compared with the peak flow at the gage. The bridge will be considered to have seen the 100-year storm flow if the maximum gage flow is above 95% of the transferred Q100. The bridge will be considered to have not seen the 100-year storm flow if the maximum gage flow is below 95% of the transferred Q100. Note that, fortunately, the Case 4 condition is rarely encountered. Lastly, USGS Report SIR 2013-5234 (Watson et al, 2014), prepared in the aftermath of Hurricane Irene, examined selected gages in New Jersey. For those gages, the Log-Pearson estimates for Q100 were updated to reflect the impact of Irene. The updated Q100 estimates were utilized in this research study, where available.
29
Ground Penetrating Radar (GPR) Investigations
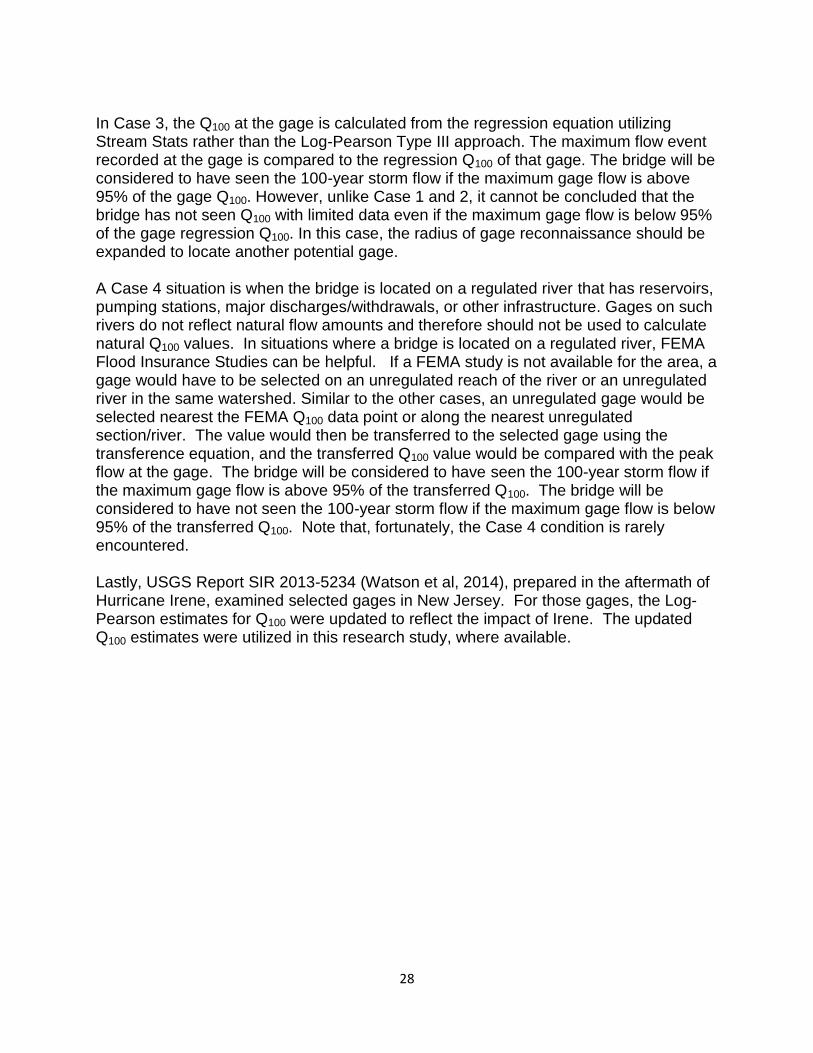
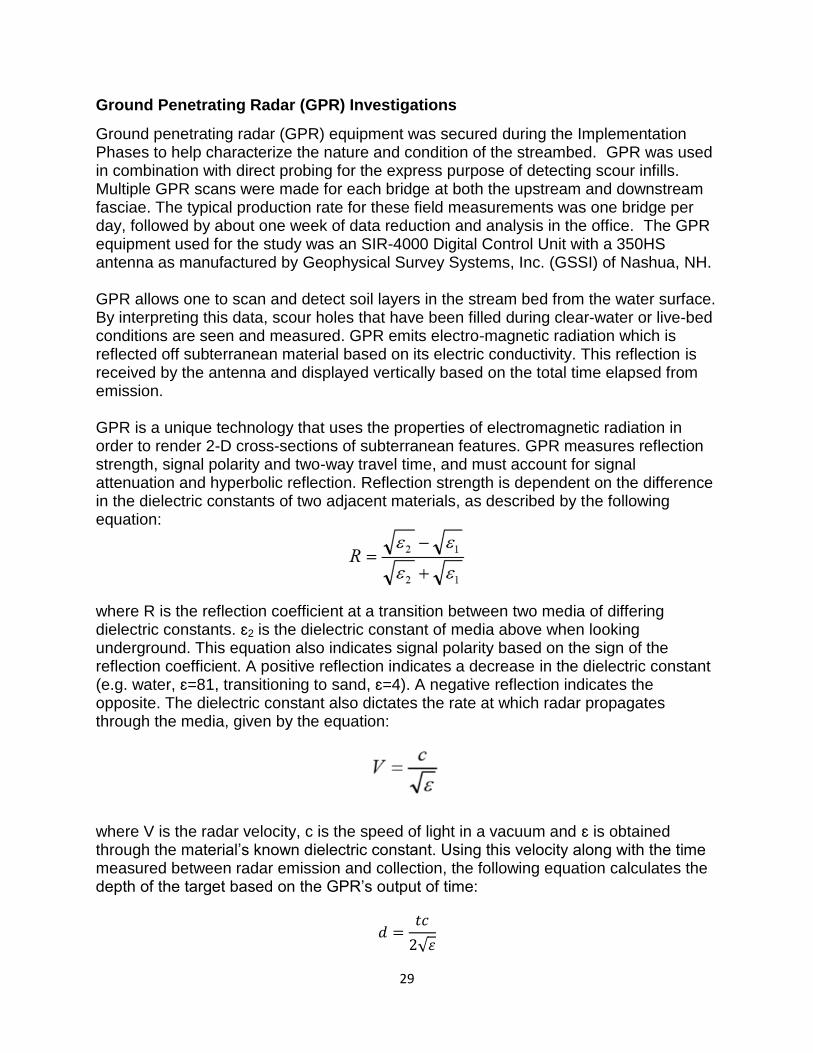
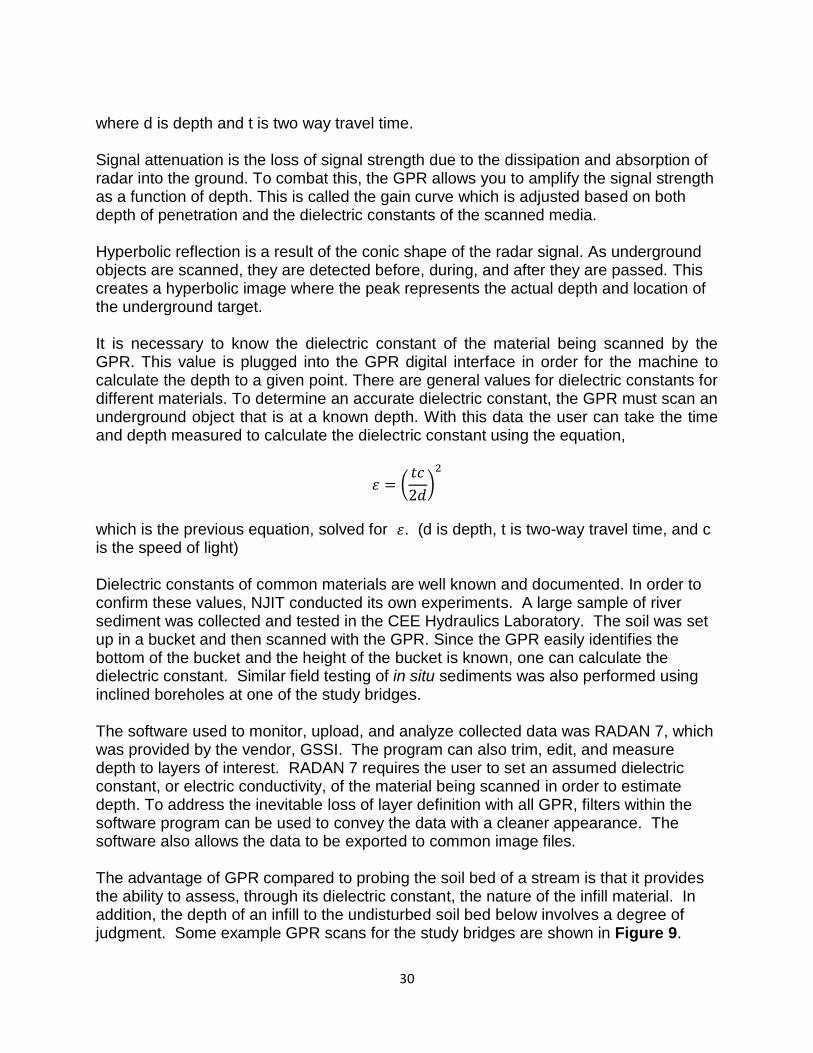
Ground penetrating radar (GPR) equipment was secured during the Implementation Phases to help characterize the nature and condition of the streambed. GPR was used in combination with direct probing for the express purpose of detecting scour infills. Multiple GPR scans were made for each bridge at both the upstream and downstream fasciae. The typical production rate for these field measurements was one bridge per day, followed by about one week of data reduction and analysis in the office. The GPR equipment used for the study was an SIR-4000 Digital Control Unit with a 350HS antenna as manufactured by Geophysical Survey Systems, Inc. (GSSI) of Nashua, NH. GPR allows one to scan and detect soil layers in the stream bed from the water surface. By interpreting this data, scour holes that have been filled during clear-water or live-bed conditions are seen and measured. GPR emits electro-magnetic radiation which is reflected off subterranean material based on its electric conductivity. This reflection is received by the antenna and displayed vertically based on the total time elapsed from emission. GPR is a unique technology that uses the properties of electromagnetic radiation in order to render 2-D cross-sections of subterranean features. GPR measures reflection strength, signal polarity and two-way travel time, and must account for signal attenuation and hyperbolic reflection. Reflection strength is dependent on the difference in the dielectric constants of two adjacent materials, as described by the following equation: where R is the reflection coefficient at a transition between two media of differing dielectric constants. ɛ2 is the dielectric constant of media above when looking underground. This equation also indicates signal polarity based on the sign of the reflection coefficient. A positive reflection indicates a decrease in the dielectric constant (e.g. water, ɛ=81, transitioning to sand, ɛ=4). A negative reflection indicates the opposite. The dielectric constant also dictates the rate at which radar propagates through the media, given by the equation: where V is the radar velocity, c is the speed of light in a vacuum and ɛ is obtained through the material’s known dielectric constant. Using this velocity along with the time measured between radar emission and collection, the following equation calculates the depth of the target based on the GPR’s output of time:
30
where d is depth and t is two way travel time. Signal attenuation is the loss of signal strength due to the dissipation and absorption of radar into the ground. To combat this, the GPR allows you to amplify the signal strength as a function of depth. This is called the gain curve which is adjusted based on both depth of penetration and the dielectric constants of the scanned media. Hyperbolic reflection is a result of the conic shape of the radar signal. As underground objects are scanned, they are detected before, during, and after they are passed. This creates a hyperbolic image where the peak represents the actual depth and location of the underground target. It is necessary to know the dielectric constant of the material being scanned by the GPR. This value is plugged into the GPR digital interface in order for the machine to calculate the depth to a given point. There are general values for dielectric constants for different materials. To determine an accurate dielectric constant, the GPR must scan an underground object that is at a known depth. With this data the user can take the time and depth measured to calculate the dielectric constant using the equation,
which is the previous equation, solved for . (d is depth, t is two-way travel time, and c is the speed of light) Dielectric constants of common materials are well known and documented. In order to confirm these values, NJIT conducted its own experiments. A large sample of river sediment was collected and tested in the CEE Hydraulics Laboratory. The soil was set up in a bucket and then scanned with the GPR. Since the GPR easily identifies the bottom of the bucket and the height of the bucket is known, one can calculate the dielectric constant. Similar field testing of in situ sediments was also performed using inclined boreholes at one of the study bridges. The software used to monitor, upload, and analyze collected data was RADAN 7, which was provided by the vendor, GSSI. The program can also trim, edit, and measure depth to layers of interest. RADAN 7 requires the user to set an assumed dielectric constant, or electric conductivity, of the material being scanned in order to estimate depth. To address the inevitable loss of layer definition with all GPR, filters within the software program can be used to convey the data with a cleaner appearance. The software also allows the data to be exported to common image files. The advantage of GPR compared to probing the soil bed of a stream is that it provides the ability to assess, through its dielectric constant, the nature of the infill material. In addition, the depth of an infill to the undisturbed soil bed below involves a degree of judgment. Some example GPR scans for the study bridges are shown in Figure 9.
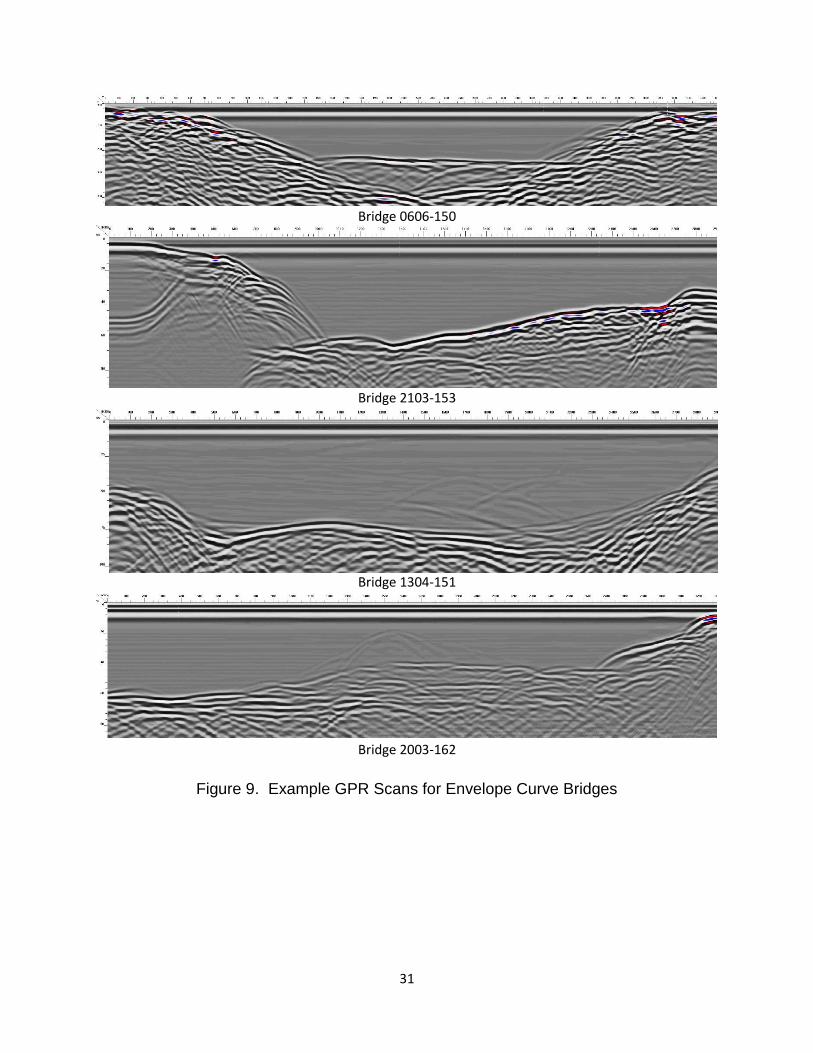
31
Bridge 0606-150
Bridge 2103-153
Bridge 1304-151
Bridge 2003-162
Figure 9. Example GPR Scans for Envelope Curve Bridges
32
Geotechnical Studies: Fascia Soundings and Probing
The development of reliable envelope curves requires careful field measurements to evaluate the geometry of the channel, as well as the composition and condition of the streambed. A detailed geotechnical study was conducted for each bridge to obtain needed data for the envelope curves and also to support the GPR measurements. The following procedure was followed:
1) Review of Existing Data: A desk study of available information sources was conducted for every bridge site. The investigation commenced with an examination of the Stage II study report. Reconnaissance geologic sources were also consulted to assess the nature of the streambed sediments, including boring logs, surficial geologic maps, and soils surveys.
2) Survey of Channel Geometry and Substructures: The topography of the channel beneath and adjacent to the bridge was examined to check for evidence of aggradation, degradation, and scour. Substructures were inspected, including piers, columns, abutments, and wing walls. Assessment of any exposed spread footings or pile caps was also made. This included what parts of the foundation elements were showing (top surface, face) and whether or not there was undermining.
3) Fascia Soundings: Soundings were made at the upstream and downstream fascias of each bridge to establish scaled cross-sections. Soundings are a valuable tool for evaluating general channel condition and also for detecting aggradation, degradation, and scour. Depending on bridge height and water depth, measurements were made using either a stadia rod or a weighted measuring tape. Local benchmarks were used when available, and when they were not, a survey crew was dispatched to establish a reference elevation using GPS. The results of the fascia soundings are shown as cross sections in Appendix D.
4) Probing the Streambed: The key to developing reliable envelope curves is accurate determination of the depth and extent of scour holes and erosion zones. The streambed at each bridge was physically probed using graduated range poles and steel probes in order to assess the general density and texture of the sediments. Special attention was given to the detection of “infills,” which are scour holes that are partially or totally refilled with sediments after flood flows recede. Since Ground Penetrating Radar (GPR) is also effective in detecting infills, the results of the probing were correlated with the GPR scans.
5) Sampling of Streambed Sediments: At some bridge sites, samples were taken to aid in distinguishing infills and aggraded sediments from original Holocene soils. Various methods were employed depending on soil texture and degree of saturation. These include split spoon samplers, hand augers, and post-hole diggers. Identifications were made using field visual methods.
6) Establishment of a Photographic Record: Photographs were taken of each bridge, including upstream, downstream, and at the structure. When possible, the photos were compared with archive images to check for changes in the channel over time.

33
REFERENCES
Arneson, L.A., Zevenbergen, L.W., Lagasse, P.F., and Clopper, P.E. (2012). "Evaluating Scour at Bridges (5th ed.)." HEC-18, Report No. FHWA-HIF-12-003, Federal Highway Administration., U.S. Department of Transportation, Washington D.C.
Benedict, S.T., 2003. “Clear-Water Abutment and Contraction Scour in the Coastal Plain and Piedmont Provinces of South Carolina.” Water Resources Investigations Report 2003-4064. U.S. Geological Survey, Reston, VA.
Benedict, S.T., and A.W. Caldwell, 2005. “Development and Evaluation of Clear-Water Pier and Contraction Scour Envelope Curves in the Coastal Plain and Piedmont Provinces of South Carolina.” Scientific Investigations Report 2005-5289. U.S. Geological Survey, Reston, VA.
Benedict, S.T., Deshpande, N., Aziz, N.M., and Conrads, P.A. (2006). “Trends of Abutment-Scour Prediction Equations Applied to 144 Field Sites in South Carolina.” Open-File Report 2003–295, U.S. Geological Survey, Reston, VA.
Benedict, S.T., N. Deshpande, and N.M. Aziz (2007). “Evaluation of Abutment-Scour Prediction Equations Using Field Data. “ Transportation Research Record: Journal of the Transportation Research Board, No. 2025, Transportation Research Board of the National Academies, Washington, D.C. pp. 118-126.
Benedict, S.T. and A.W. Caldwell (2009). “Development and Evaluation of Live-Bed Pier and Contraction Scour Envelope Curves in the Coastal Plain and Piedmont Provinces of South Carolina.” Scientific Investigations Report 2009-5099, U.S. Geological Survey, Reston, VA.
Benedict, S.T. and Caldwell, A.W. (2014). “A Pier-Scour Database: 2,453 Field and Laboratory Measurements of Pier Scour.” Data Series Report 845. U.S. Geological Survey, Reston, VA.
Benedict, S.T., and Caldwell, A.W. (2016a). “The upper bound of pier scour in laboratory and field data”, Transportation Research Record No. 2588, Transportation Research Board, Washington, D.C., pp. 145-153.
Benedict, S.T., and Caldwell, A.W. (2016b). “The upper bound of abutment scour in laboratory and field data,“ Transportation Research Record No. 2588, Transportation Research Board, Washington, D.C., pp. 154-162.
Benedict, S.T., Feaster, T., and Caldwell, A.W. (2016). “The South Carolina Bridge-Scour Envelope Curves,” Scientific Investigations Report 2016-5121. U.S. Geological Survey, Reston, VA.
Gehrig, M. D., Morris, D. V., and Bryant, J.T. (2004). “Ground Penetrating Radar for Concrete Evaluation Studies.” Foundation Performance Association, March 2004. <http://www.foundationperformance.org/pastpresentations/gehrig_paper_march2004.pdf>
Illinois Department of Transportation, Bureau of Bridges and Structures. (2009), “Bridge Manual.” Springfield, Ill. <http://www.dot.state.il.us/bridges/brmanuals.html>

34
Lombard, P.J., and Hodgkins, G.A., 2008. “Comparison of Observed and Predicted Abutment Scour at Selected Bridges in Maine.” Scientific Investigations Report 2008-5099, U.S. Geological Survey, Reston, Va.
Pennsylvania Department of Transportation, 2000. “Design Manual, Part 4, Vol. 1,” PDT – Pub. No 15M, Harrisburg, Pa. <ftp://ftp.dot.state.pa.us/public/PubsForms/Publications/PUB%2015M.pdf>
Richardson, E.V. and Davis, S.R. (2001). “Evaluating Scour at Bridges (4th ed.).” HEC-18, Report No. FHWA NHI 01-001, Federal Highway Administration., U.S. Department of Transportation, Washington, D.C.
Schuring, J.R., Dresnack, R. and Golub, E. (2017). “Design and Evaluation of Scour for Bridges Using HEC-18.” Final Report for NJDOT TO-89, FHWA-NJ-2017-011, in 3 volumes.
South Carolina Department of Transportation (2009). “Requirements for Hydraulic Design Studies.” SCDOT, Columbia, S.C.
StreamStats. Computer software. StreamStats. Vers. 4. United States Geological Survey, Web. <https://water.usgs.gov/osw/streamstats/>
Texas Department of Transportation (2006; 2009). “Geotechnical Manual.” Austin, Texas.
United States Geological Survey. National Water Information System. <https://waterdata.usgs.gov/usa/nwis/rt>.
United States of America. Federal Emergency Management Agency. Flood Insurance Study: Passaic County, New Jersey. 2.1.1.1 ed. Vol. 1 of 5. N.p.: n.p., 2015. Print.
Wagner, C.R., Mueller, D.S, Parola, A.C., Hagerty, D.J., and Benedict, S.T. (2006). “Scour at Contracted Bridges.” Web-Only Document 83 (Project 21-14), National Cooperative Highway Research Program, Transportation Research Board, Washington, D.C.
Watson, K.M. and Schopp, R.D. (2009). “Methodology for estimation of flood magnitude and frequency for New Jersey streams.” U.S. Geological Survey Scientific Investigations Report 2009–5167, 51 pp.
Watson, K.M., Collenburg, J.V., and Reiser, R.G. (2014). “Hurricane Irene and associated floods of August 27–30, 2011, in New Jersey.” U.S. Geological Survey Scientific Investigations Report 2013–5234, 149 pp.