Embed Size (px)
Citation preview
John R. Mattox, II, Ph.D.
Senior Consultant, Talent Solutions
Scrap Learning—Your Programs Are Not
As Good as You Think They Are
Training Industry Conference & Exposition 2015
May 7, 2015
8:30 ET
© 2014 CEB. All rights reserved.
2
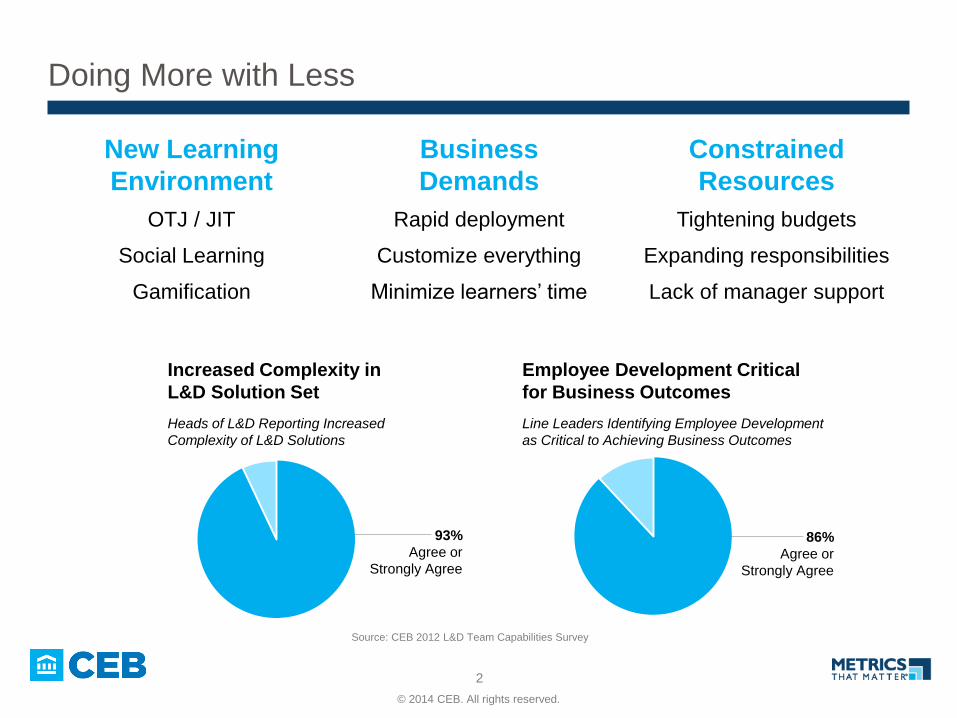
Doing More with Less
New Learning
Environment
Business
Demands
Constrained
Resources
OTJ / JIT
Social Learning
Gamification
Rapid deployment
Customize everything
Minimize learners’ time
Tightening budgets
Expanding responsibilities
Lack of manager support
Increased Complexity in
L&D Solution Set
Heads of L&D Reporting Increased
Complexity of L&D Solutions
93%
Agree or
Strongly Agree
Source: CEB 2012 L&D Team Capabilities Survey
86%
Agree or
Strongly Agree
Employee Development Critical
for Business Outcomes
Line Leaders Identifying Employee Development
as Critical to Achieving Business Outcomes

© 2014 CEB. All rights reserved.
3 3
Falling Short of Expectations
Line Leaders Not Satisfied with
Effectiveness of L&D
Line Leaders Reporting Satisfaction with the Overall
Effectiveness of the L&D Function
23%
Agree or
Strongly Agree
Source: CEB 2011 L&D Team Capabilities Survey
0% 50% 100%
Receives Sufficient Information
Information is Important
CEOs Expect More Insights
CEOs Opinions Regarding Information on Return on Investment in Human Capital
Source: PwC 2012 Annual Global CEO Survey
CFOs Lack Confidence in
HR / L&D Spend
CFOs that feel HR / L&D are spending
the right amounts in the right places
12%
Confident or
Highly Confident
Source: CEB 2014 CEB Overhead Cost Management Survey
© 2014 CEB. All rights reserved.
4
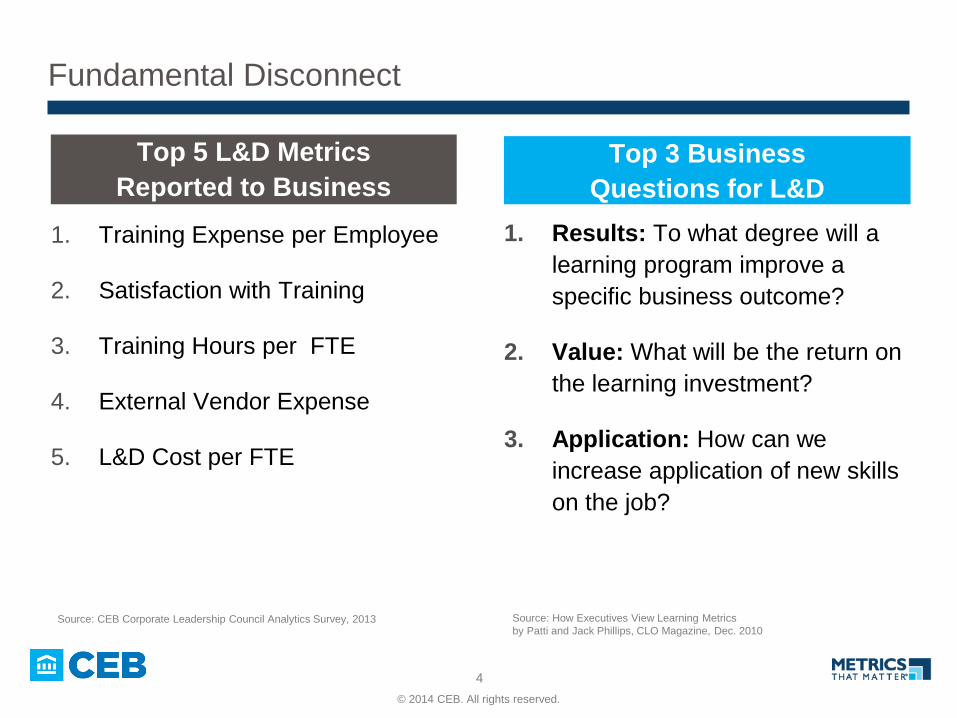
Fundamental Disconnect
Top 5 L&D Metrics
Reported to Business
1. Training Expense per Employee
2. Satisfaction with Training
3. Training Hours per FTE
4. External Vendor Expense
5. L&D Cost per FTE
Top 3 Business
Questions for L&D
1. Results: To what degree will a
learning program improve a
specific business outcome?
2. Value: What will be the return on
the learning investment?
3. Application: How can we
increase application of new skills
on the job?
Source: How Executives View Learning Metrics
by Patti and Jack Phillips, CLO Magazine, Dec. 2010 Source: CEB Corporate Leadership Council Analytics Survey, 2013

© 2014 CEB. All rights reserved.
5 5
Predictive Stats: Exercise
Which aspects of training predict business impact?
© 2014 CEB. All rights reserved.
6 6
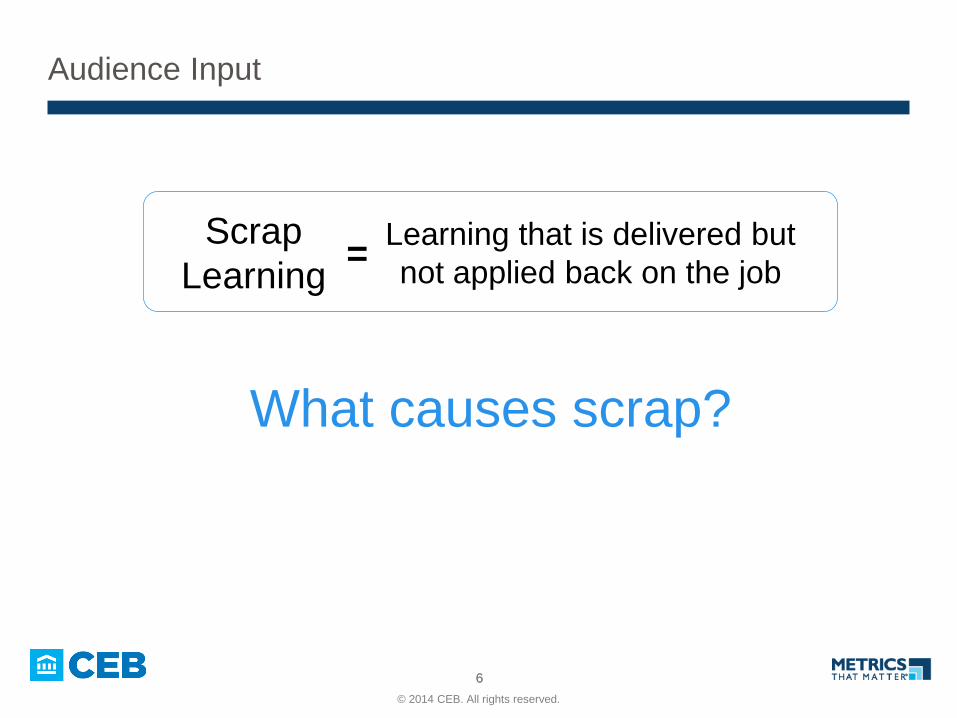
Audience Input
Scrap
Learning Learning that is delivered but
not applied back on the job =
What causes scrap?
© 2014 CEB. All rights reserved.
7 7
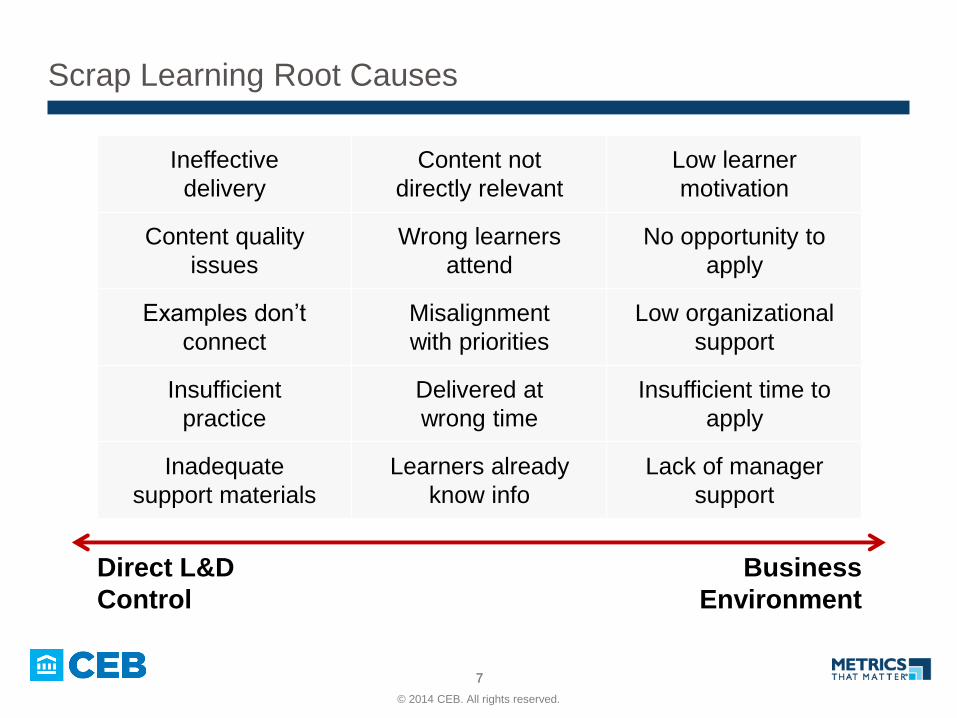
Scrap Learning Root Causes
Direct L&D
Control
Business
Environment
Ineffective
delivery
Content not
directly relevant
Low learner
motivation
Content quality
issues
Wrong learners
attend
No opportunity to
apply
Examples don’t
connect
Misalignment
with priorities
Low organizational
support
Insufficient
practice
Delivered at
wrong time
Insufficient time to
apply
Inadequate
support materials
Learners already
know info
Lack of manager
support
© 2014 CEB. All rights reserved.
8 8
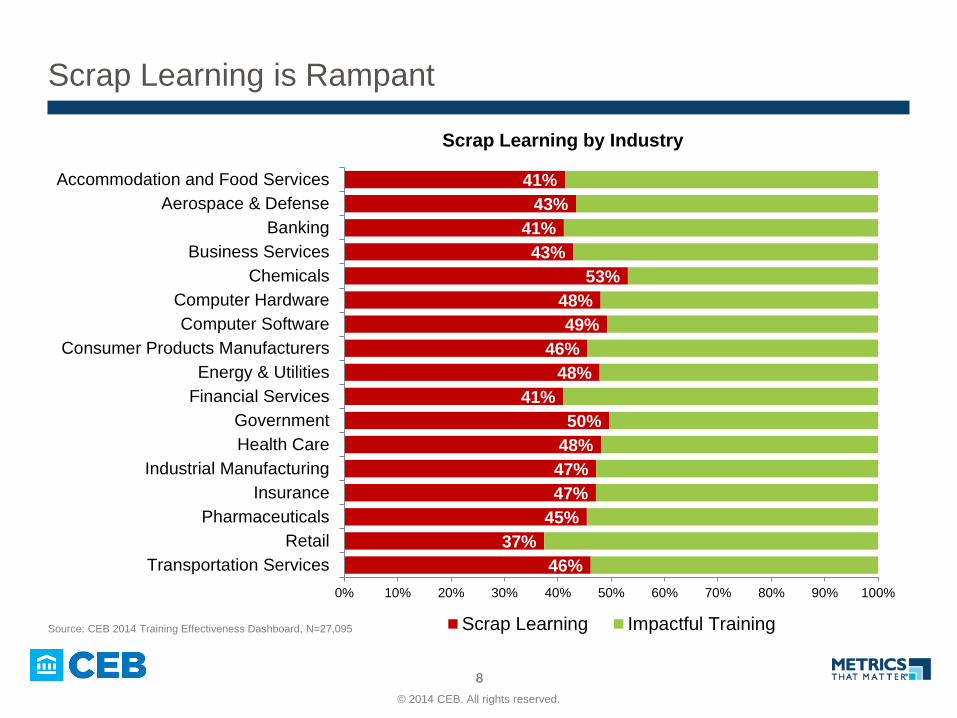
Scrap Learning is Rampant
46%
37%
45%
47%
47%
48%
50%
41%
48%
46%
49%
48%
53%
43%
41%
43%
41%
0% 10% 20% 30% 40% 50% 60% 70% 80% 90% 100%
Transportation Services
Retail
Pharmaceuticals
Insurance
Industrial Manufacturing
Health Care
Government
Financial Services
Energy & Utilities
Consumer Products Manufacturers
Computer Software
Computer Hardware
Chemicals
Business Services
Banking
Aerospace & Defense
Accommodation and Food Services
Scrap Learning by Industry
Scrap Learning Impactful TrainingSource: CEB 2014 Training Effectiveness Dashboard, N=27,095

© 2014 CEB. All rights reserved.
9 9
Make an Impact
45%
38%
33%
18%
10%
Typical Company
MTM Client Averagewithin 6 Months
MTM Client Average
MTM Top 25%
MTM Top 5%
Scrap Learning
Source: CEB Analysis 2014
6%
8%
11%
20%
29%
Performance Improvement
© 2014 CEB. All rights reserved.
10 10
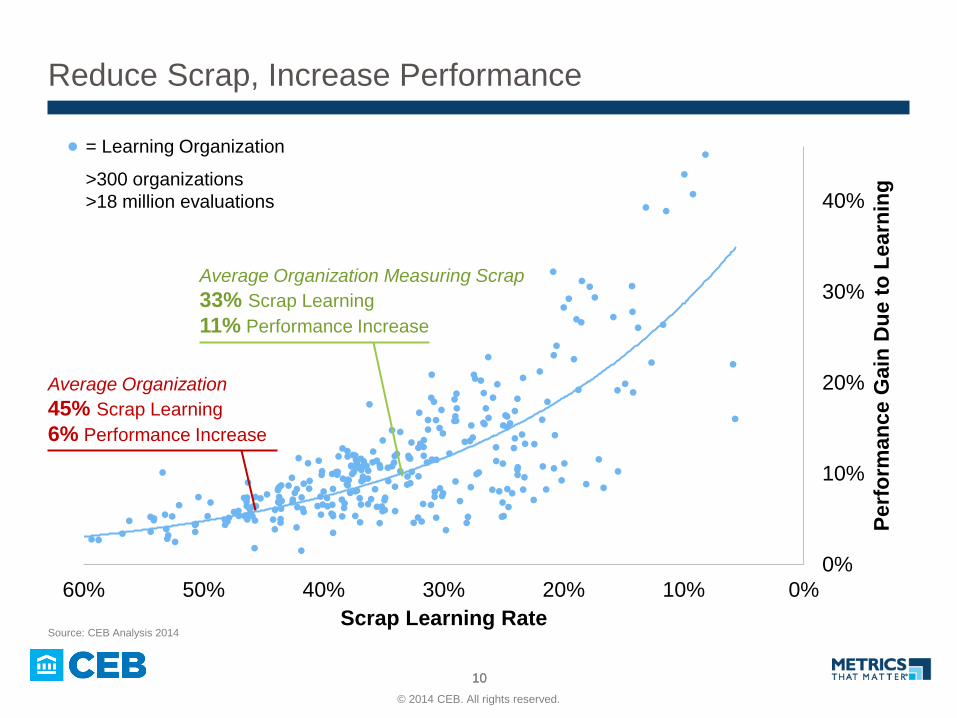
Reduce Scrap, Increase Performance
0%
10%
20%
30%
40%
0%10%20%30%40%50%60%
Perf
orm
an
ce G
ain
Du
e t
o L
earn
ing
Scrap Learning Rate
>300 organizations
>18 million evaluations
= Learning Organization
Average Organization Measuring Scrap
33% Scrap Learning
11% Performance Increase
Source: CEB Analysis 2014
Average Organization
45% Scrap Learning
6% Performance Increase
© 2014 CEB. All rights reserved.
11 11
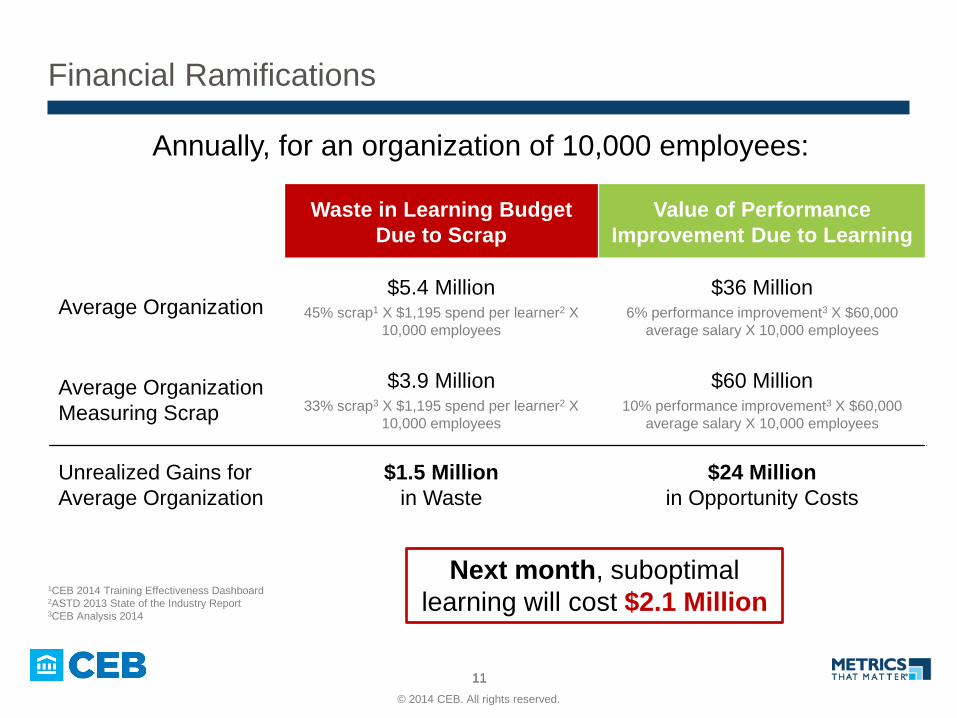
Financial Ramifications
Annually, for an organization of 10,000 employees:
Waste in Learning Budget
Due to Scrap
Value of Performance
Improvement Due to Learning
Average Organization $5.4 Million
45% scrap1 X $1,195 spend per learner2 X
10,000 employees
$36 Million 6% performance improvement3 X $60,000
average salary X 10,000 employees
Average Organization
Measuring Scrap
$3.9 Million 33% scrap3 X $1,195 spend per learner2 X
10,000 employees
$60 Million 10% performance improvement3 X $60,000
average salary X 10,000 employees
Unrealized Gains for
Average Organization
$1.5 Million
in Waste
$24 Million
in Opportunity Costs
Next month, suboptimal
learning will cost $2.1 Million 1CEB 2014 Training Effectiveness Dashboard 2ASTD 2013 State of the Industry Report 3CEB Analysis 2014
© 2014 CEB. All rights reserved.
12 12
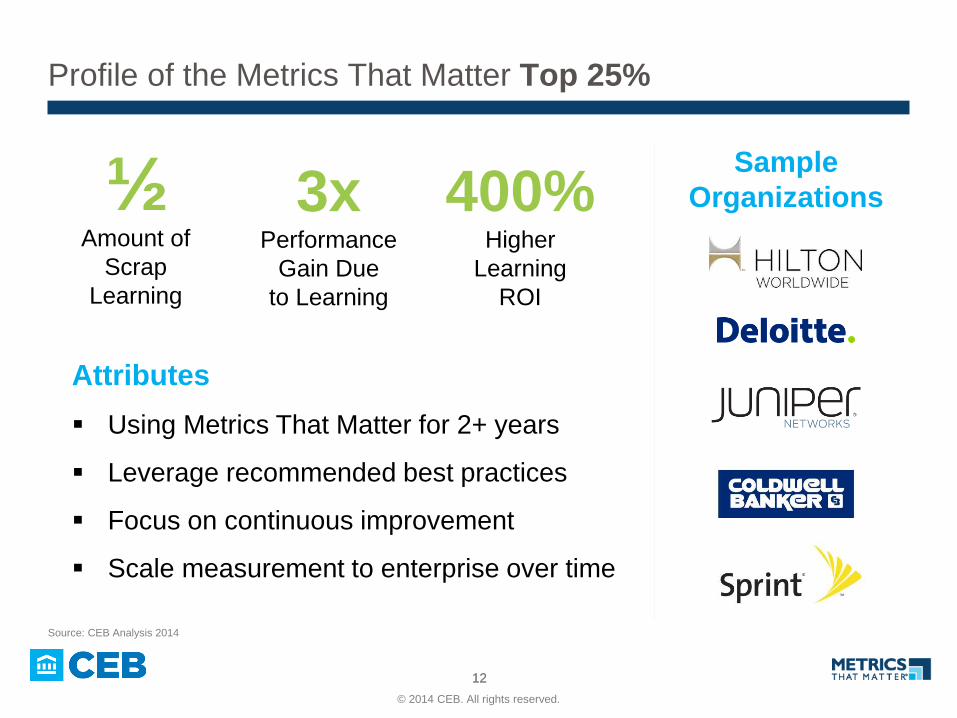
Profile of the Metrics That Matter Top 25%
Source: CEB Analysis 2014
Attributes
Using Metrics That Matter for 2+ years
Leverage recommended best practices
Focus on continuous improvement
Scale measurement to enterprise over time
Sample
Organizations ½ 3x Performance
Gain Due
to Learning
400% Higher
Learning
ROI
Amount of
Scrap
Learning
© 2014 CEB. All rights reserved.
13 13
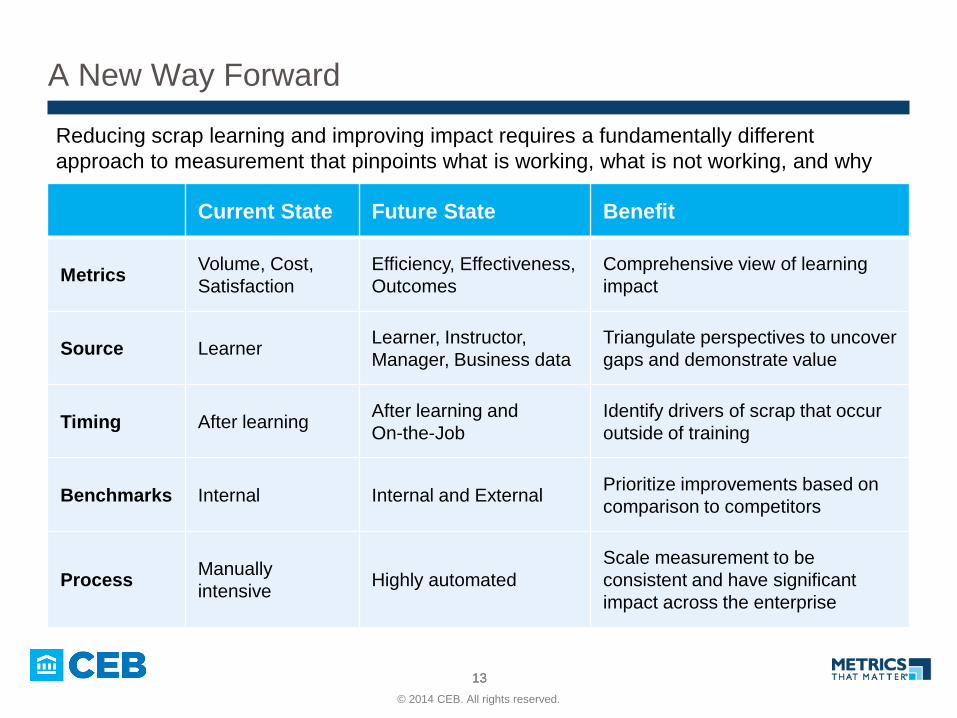
A New Way Forward
Current State Future State Benefit
Metrics Volume, Cost,
Satisfaction
Efficiency, Effectiveness,
Outcomes
Comprehensive view of learning
impact
Source Learner Learner, Instructor,
Manager, Business data
Triangulate perspectives to uncover
gaps and demonstrate value
Timing After learning After learning and
On-the-Job
Identify drivers of scrap that occur
outside of training
Benchmarks Internal Internal and External Prioritize improvements based on
comparison to competitors
Process Manually
intensive Highly automated
Scale measurement to be
consistent and have significant
impact across the enterprise
Reducing scrap learning and improving impact requires a fundamentally different
approach to measurement that pinpoints what is working, what is not working, and why
© 2014 CEB. All rights reserved.
14
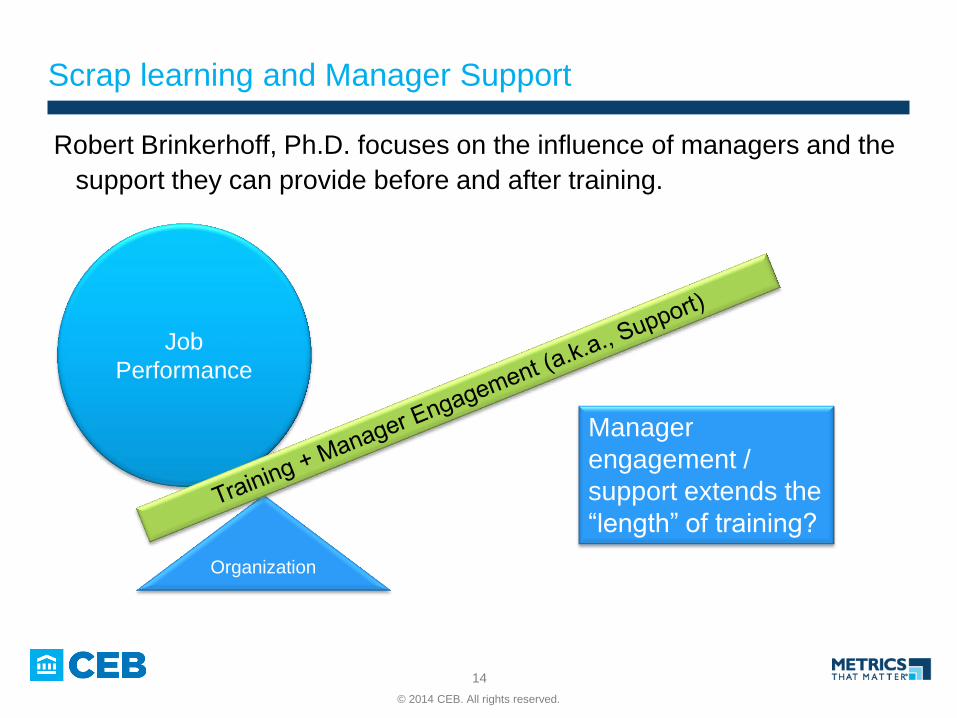
Scrap learning and Manager Support
Job
Performance
Organization
Robert Brinkerhoff, Ph.D. focuses on the influence of managers and the
support they can provide before and after training.
Manager
engagement /
support extends the
“length” of training?

© 2014 CEB. All rights reserved.
15
Manager Support
Manager support comes both before and after training
Key steps include:
Evaluate learner
readiness
Follow up on
expectations
Provide performance
resources
Get involved after
training Training
Expectation setting
Evaluate learner
readiness
Get involved after
training Training
Expectation setting
© 2014 CEB. All rights reserved.
16
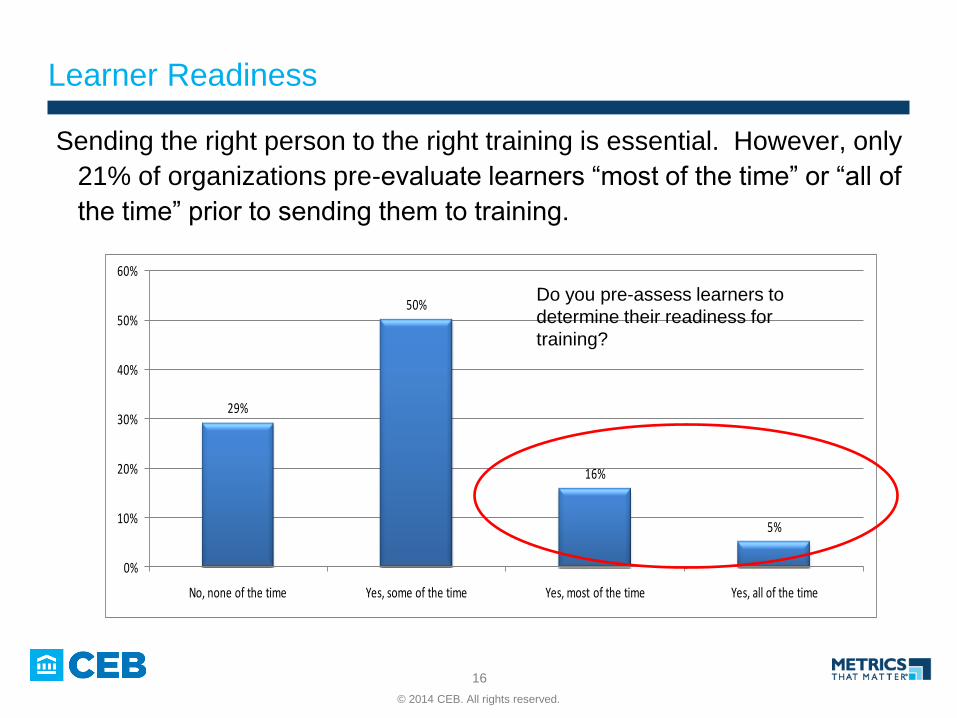
Learner Readiness
29%
50%
16%
5%
0%
10%
20%
30%
40%
50%
60%
No, none of the time Yes, some of the time Yes, most of the time Yes, all of the time
Sending the right person to the right training is essential. However, only
21% of organizations pre-evaluate learners “most of the time” or “all of
the time” prior to sending them to training.
Do you pre-assess learners to
determine their readiness for
training?
© 2014 CEB. All rights reserved.
17
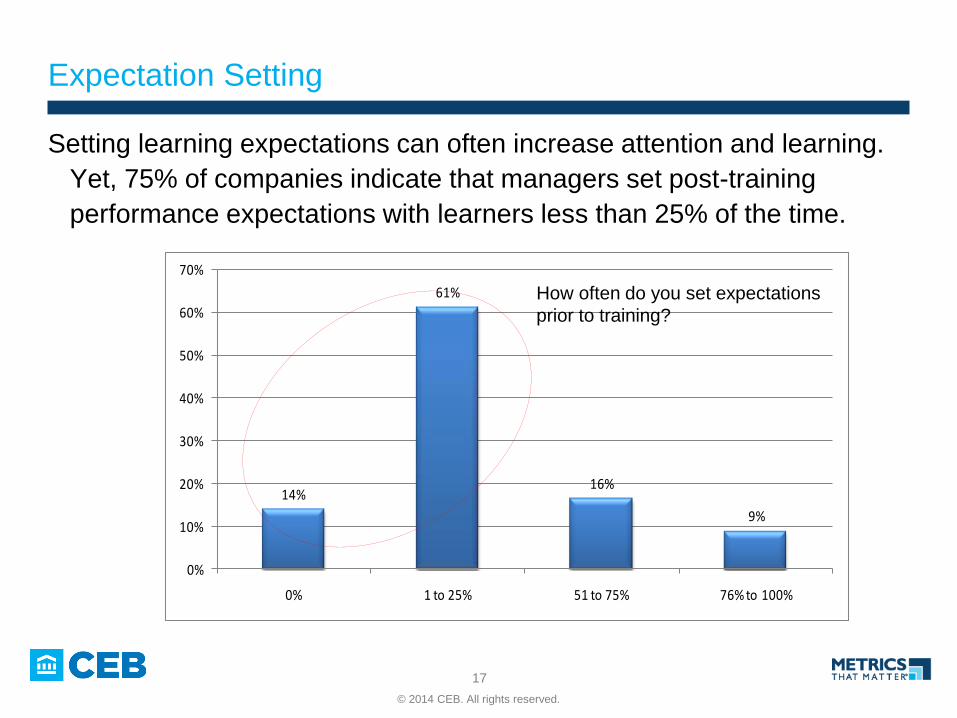
Expectation Setting
Setting learning expectations can often increase attention and learning.
Yet, 75% of companies indicate that managers set post-training
performance expectations with learners less than 25% of the time.
14%
61%
16%
9%
0%
10%
20%
30%
40%
50%
60%
70%
0% 1 to 25% 51 to 75% 76% to 100%
How often do you set expectations
prior to training?

© 2014 CEB. All rights reserved.
18
Manager Involvement
While 52% of managers appear to have some level of involvement—encouraging
application of training–there is a large minority (44%) that does not. Scrap learning can
be reduced by getting managers involved.
4%
11%
41%
44%
0% 5% 10% 15% 20% 25% 30% 35% 40% 45% 50%
Other
“I will hold my employees accountable for how they use the training back on the job.”
“I will encourage my employee to use the training they take back on the job.”
"I have little involvement in how my employees use what they learned back on the job.”
52%
© 2014 CEB. All rights reserved.
19
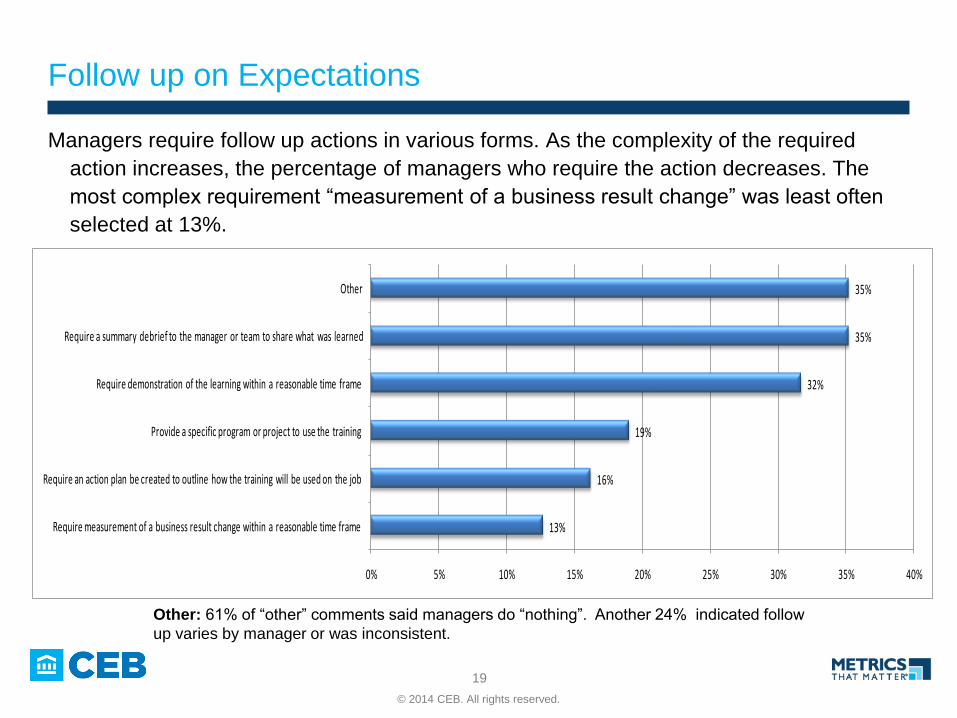
Follow up on Expectations
Managers require follow up actions in various forms. As the complexity of the required
action increases, the percentage of managers who require the action decreases. The
most complex requirement “measurement of a business result change” was least often
selected at 13%.
13%
16%
19%
32%
35%
35%
0% 5% 10% 15% 20% 25% 30% 35% 40%
Require measurement of a business result change within a reasonable time frame
Require an action plan be created to outline how the training will be used on the job
Provide a specific program or project to use the training
Require demonstration of the learning within a reasonable time frame
Require a summary debrief to the manager or team to share what was learned
Other
Other: 61% of “other” comments said managers do “nothing”. Another 24% indicated follow
up varies by manager or was inconsistent.
© 2014 CEB. All rights reserved.
20
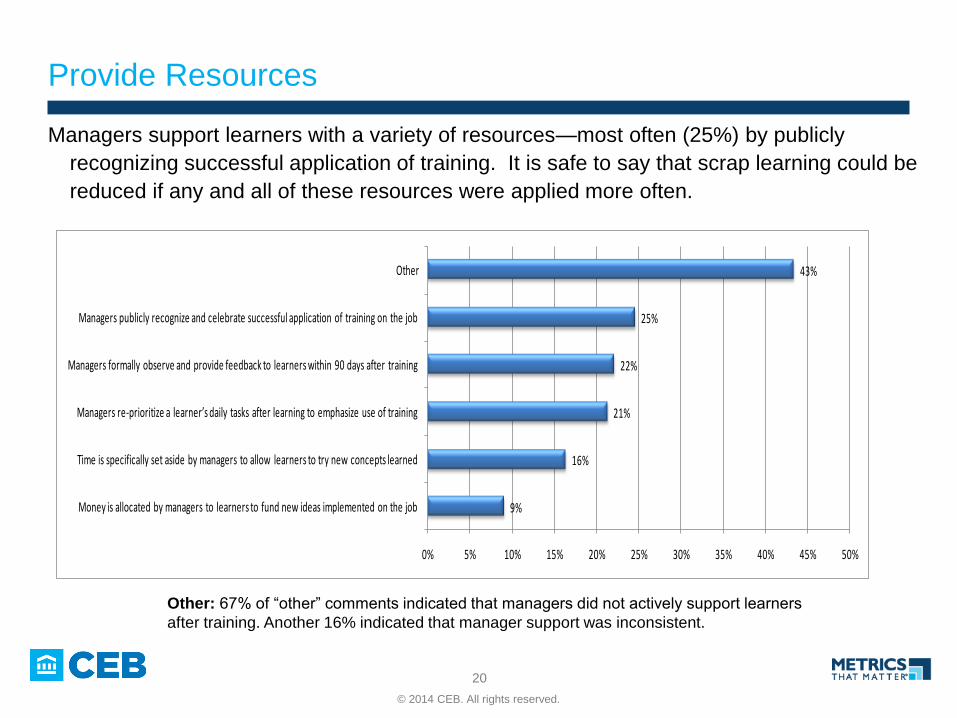
Provide Resources
9%
16%
21%
22%
25%
43%
0% 5% 10% 15% 20% 25% 30% 35% 40% 45% 50%
Money is allocated by managers to learners to fund new ideas implemented on the job
Time is specifically set aside by managers to allow learners to try new concepts learned
Managers re-prioritize a learner’s daily tasks after learning to emphasize use of training
Managers formally observe and provide feedback to learners within 90 days after training
Managers publicly recognize and celebrate successful application of training on the job
Other
Managers support learners with a variety of resources—most often (25%) by publicly
recognizing successful application of training. It is safe to say that scrap learning could be
reduced if any and all of these resources were applied more often.
Other: 67% of “other” comments indicated that managers did not actively support learners
after training. Another 16% indicated that manager support was inconsistent.
© 2014 CEB. All rights reserved.
21
Follow up on
expectations
Provide performance
resources
Evaluate learner
readiness
Get involved after
training Training
Expectation setting
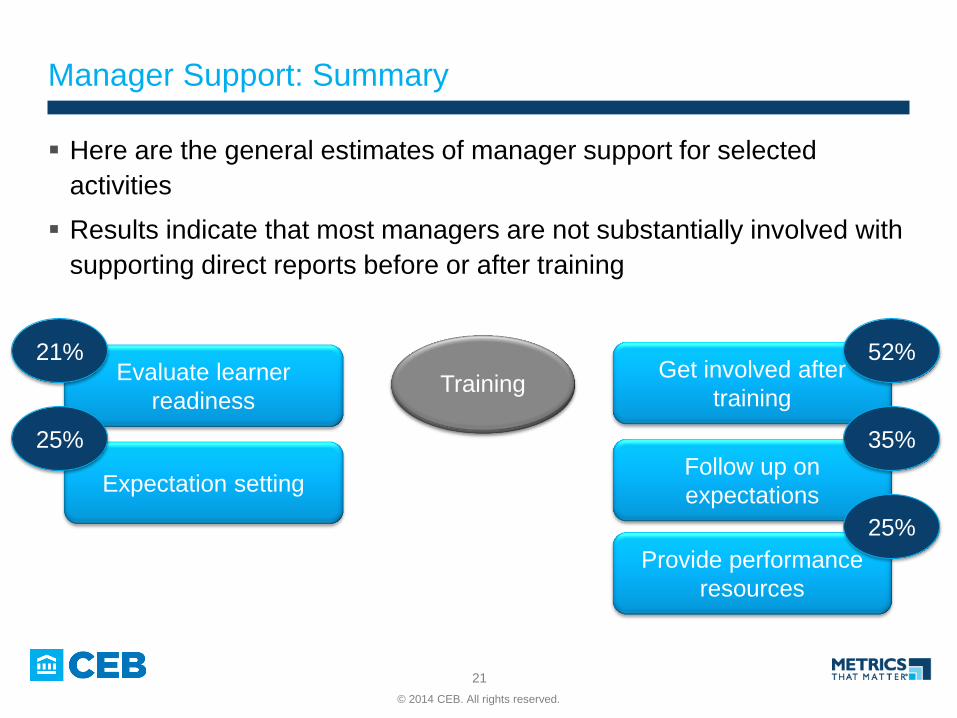
Manager Support: Summary
Here are the general estimates of manager support for selected
activities
Results indicate that most managers are not substantially involved with
supporting direct reports before or after training
Training
21%
25%
52%
35%
25%

© 2014 CEB. All rights reserved.
22 22
Manager Support and Performance
• N = 93,806 ** N = 1,286
• 0.419 * 0.419 = .175 or 17.5%
• Correlations between
“Transfer of Learning” and
other factors
• All are statistically significant
• Based on responses from
managers, when they are
engaged, they contribute
17.5% to training transfer
and performance on the job.
Source: Training Industry Quarterly Magazine http://www.cedma-
europe.org/newsletter%20articles/TrainingOutsourcing/Manager%20Engagement
%20-%20Reducing%20Scrap%20Learning%20(Oct%2010).pdf
© 2014 CEB. All rights reserved.
23 23
Making Your Programs Better
The road to improvement is filled with measurement
• Evaluate programs using an appropriate model (e.g., Kirkpatrick)
• Use standard processes and tools (e.g., Metrics That MatterTM)
• Compare results to benchmarks
• Measure scrap and other factors that lead to performance
improvement

© 2014 CEB. All rights reserved.
24
Thank You
John R. Mattox, II, Ph.D.
Senior Consultant, CEB Metrics That Matter
615 714 7299