Embed Size (px)
Citation preview
SCRIM Friction Testing in the USA
Edgar de León Izeppi, Research Scientist
Virginia Tech Transportation Institute
Nashville, October 13th 2,016

Outline
• Introduction: What is the SCRIM?
• Background and Friction 101
• Pavement Friction Management and Crash Data Analysis
• Case Studies (examples)
• Final Considerations
2

3
SCRIM•Friction
•Macrotexture
•IMU + GPS–Grade
–Cross-slope
–Curvature
•Video (front)
•2,400 gallons
•150 miles of
Continuous
Data per tank
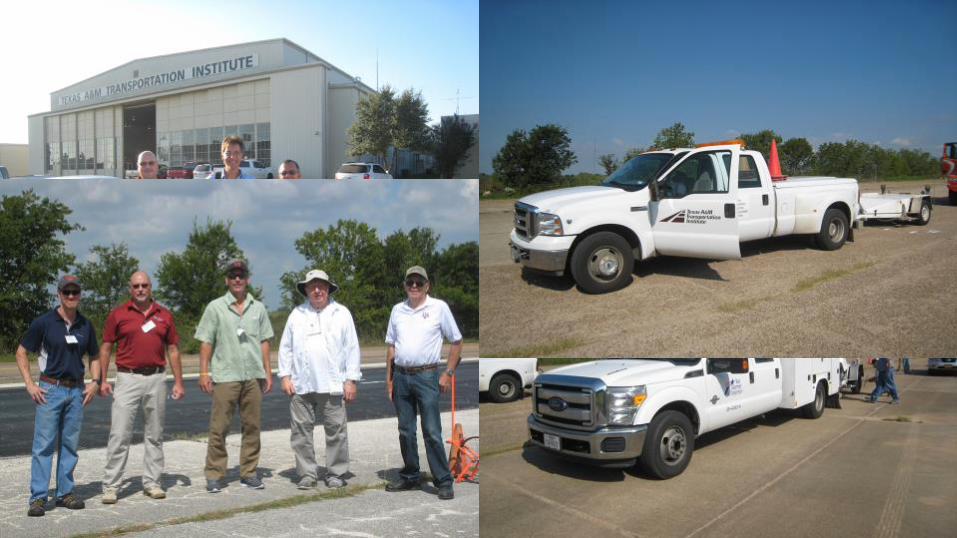
Sideway-Force Coefficient
Routine Investigation Machine
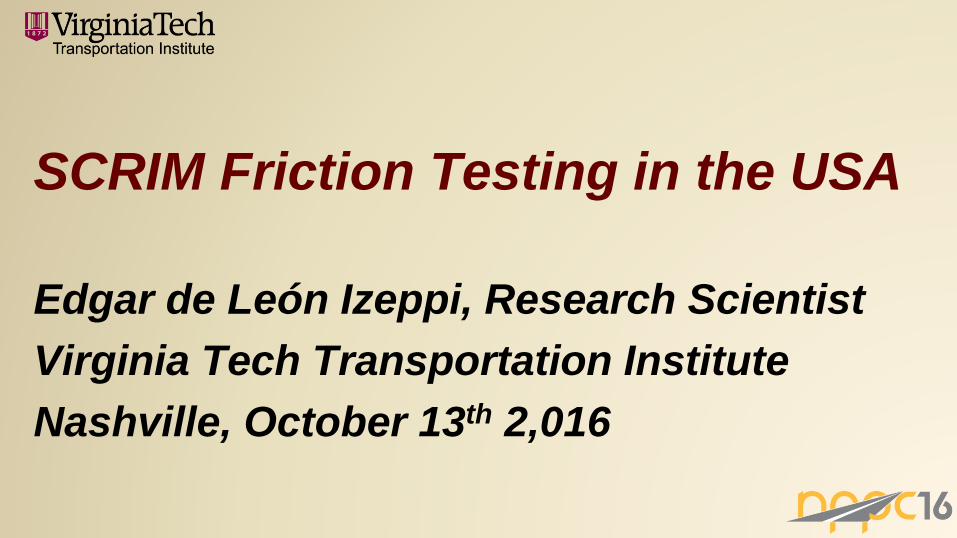
•Electrical
Systems:
24 vs 12 V
•EPA/EU
diesel
rules are
not the
same???
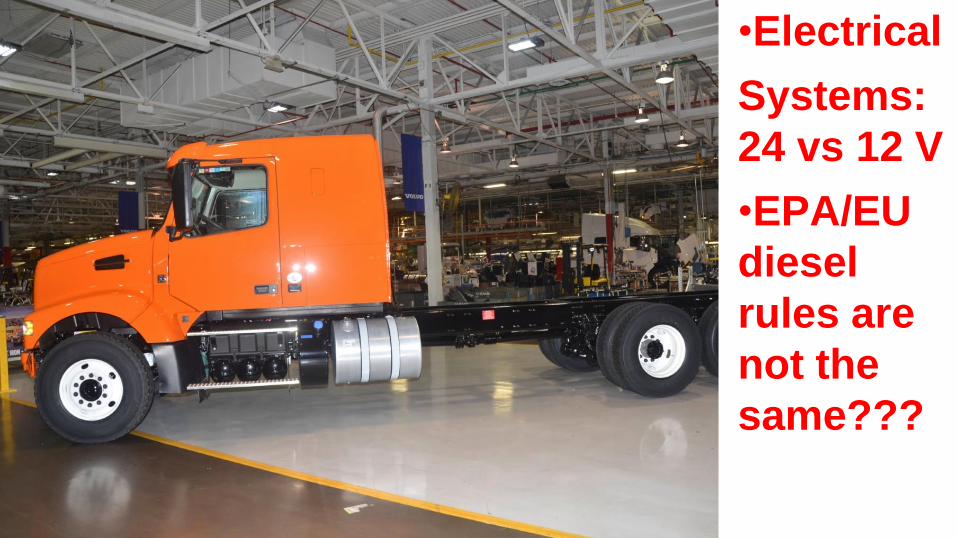
SCRIM
•Friction–Dynamic vertical load
system
–Dynamic water flow
control
–20° skew angle for
34% slip speed
–Operating speed of
15 – 55 mph
•Macrotexture–64 kHz laser system
Background
6
• Federal Rulemaking
• Report:
–Fatalities and Serious Injuries
–Rate of Fatalities and Serious Injuries

Background
7
10/6/2016
NHSTA
early
projection
Deaths
jump up
10.6% in
first half
of 2016
Background
8
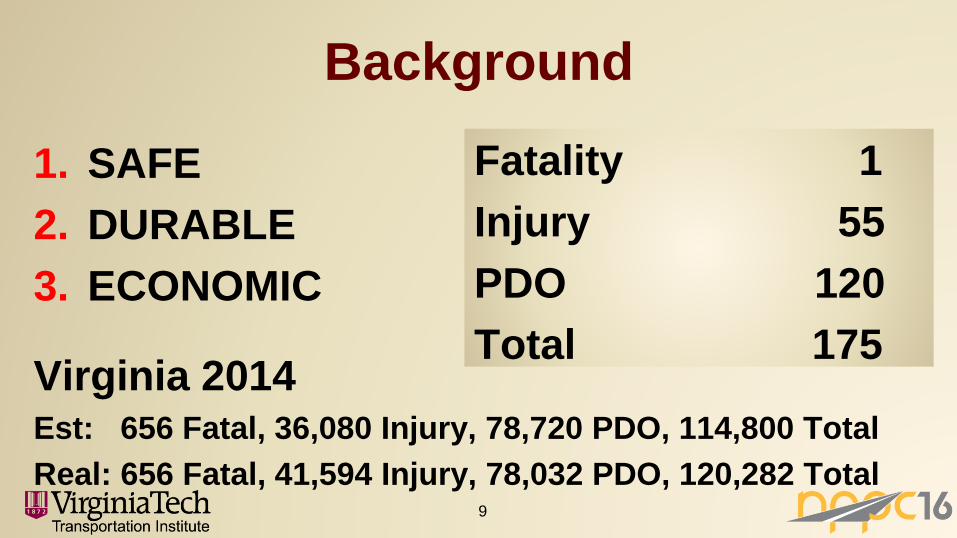
Background
9
1. SAFE
2. DURABLE
3. ECONOMIC
Fatality 1
Injury 55
PDO 120
Total 175Virginia 2014Est: 656 Fatal, 36,080 Injury, 78,720 PDO, 114,800 Total
Real: 656 Fatal, 41,594 Injury, 78,032 PDO, 120,282 Total
10
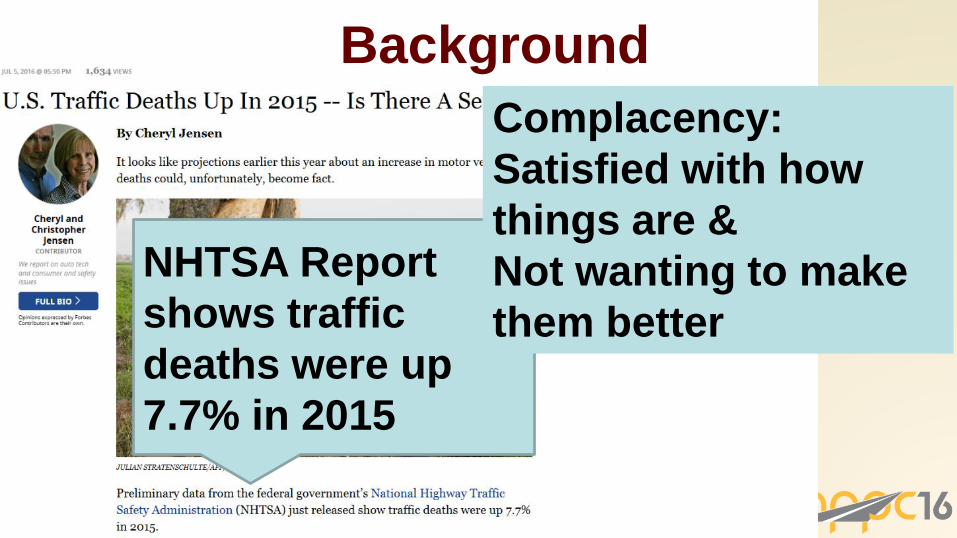
Background
NHTSA Report
shows traffic
deaths were up
7.7% in 2015
Complacency:
Satisfied with how
things are &
Not wanting to make
them better

Introduction
11
CDC 7/6/2016
•Motor vehicle
crash fatalities
in the U.S. could
drop by half
with proven
strategies
•Lower death
rates in high-
income
comparison
countries
suggest that
progress is
possible

Introduction
12
Background
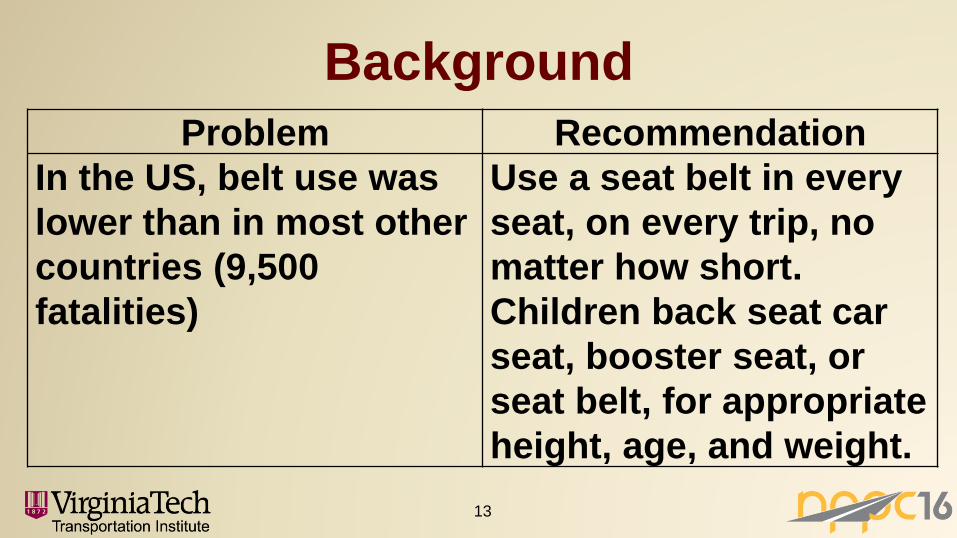
13
Problem Recommendation
In the US, belt use was
lower than in most other
countries (9,500
fatalities)
Use a seat belt in every
seat, on every trip, no
matter how short.
Children back seat car
seat, booster seat, or
seat belt, for appropriate
height, age, and weight.
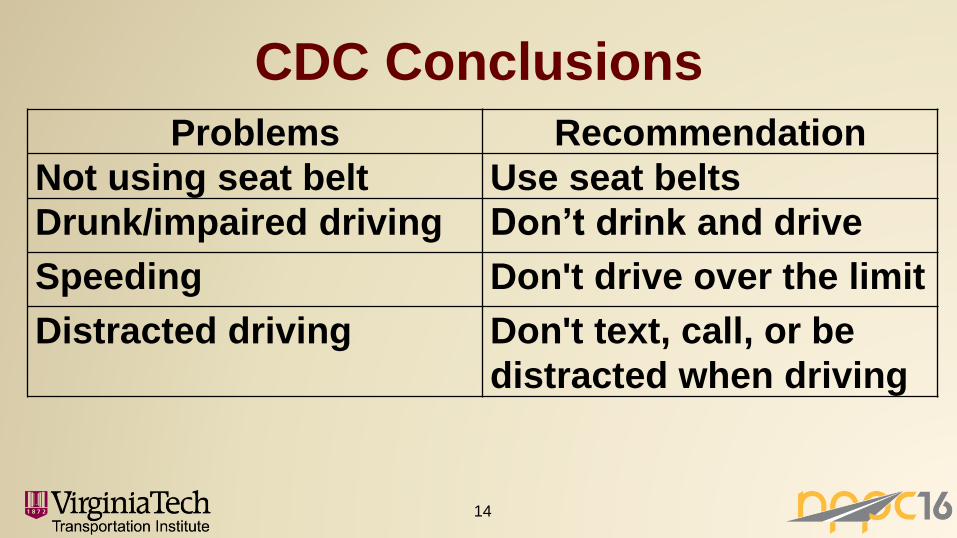
CDC Conclusions
14
Problems Recommendation
Not using seat belt Use seat belts
Drunk/impaired driving Don’t drink and drive
Speeding Don't drive over the limit
Distracted driving Don't text, call, or be
distracted when driving
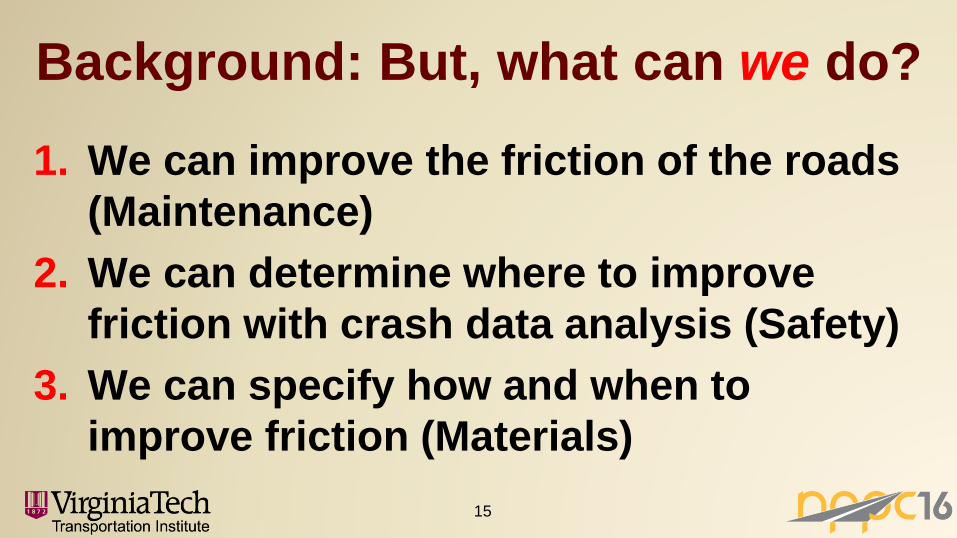
Background: But, what can we do?
15
1. We can improve the friction of the roads
(Maintenance)
2. We can determine where to improve
friction with crash data analysis (Safety)
3. We can specify how and when to
improve friction (Materials)
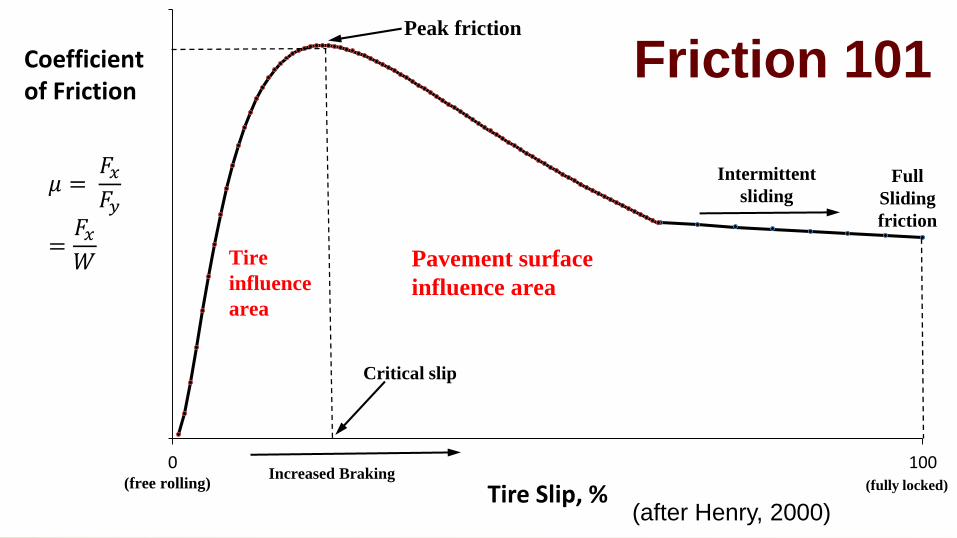
0
1.2
0 100
Tire Slip, %
Peak friction
Full
Sliding
friction
(fully locked)Increased Braking
Critical slip
Intermittent
sliding
(free rolling)
Coefficient of Friction
Pavement surface
influence area
Tire
influence
area
(after Henry, 2000)
𝜇 =𝐹𝑥𝐹𝑦
=𝐹𝑥𝑊
Friction 101
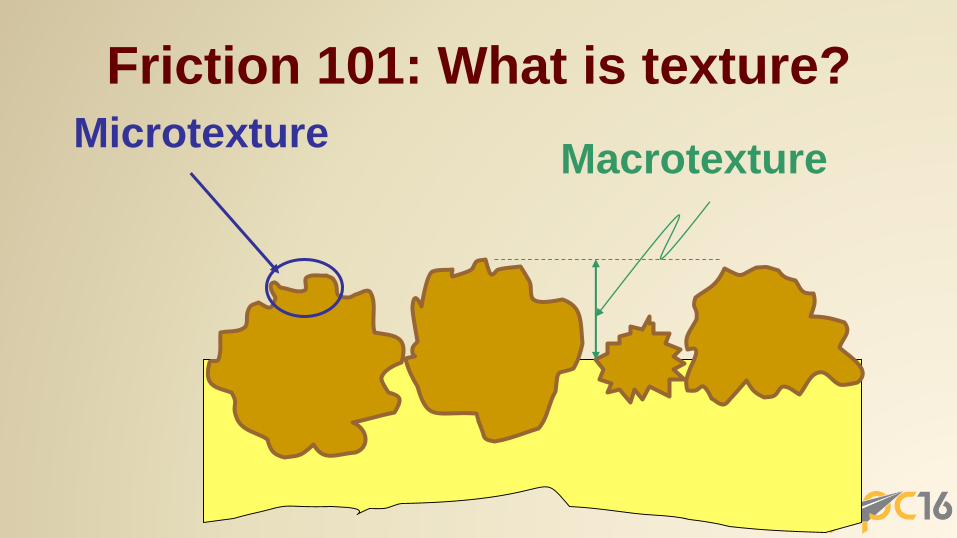
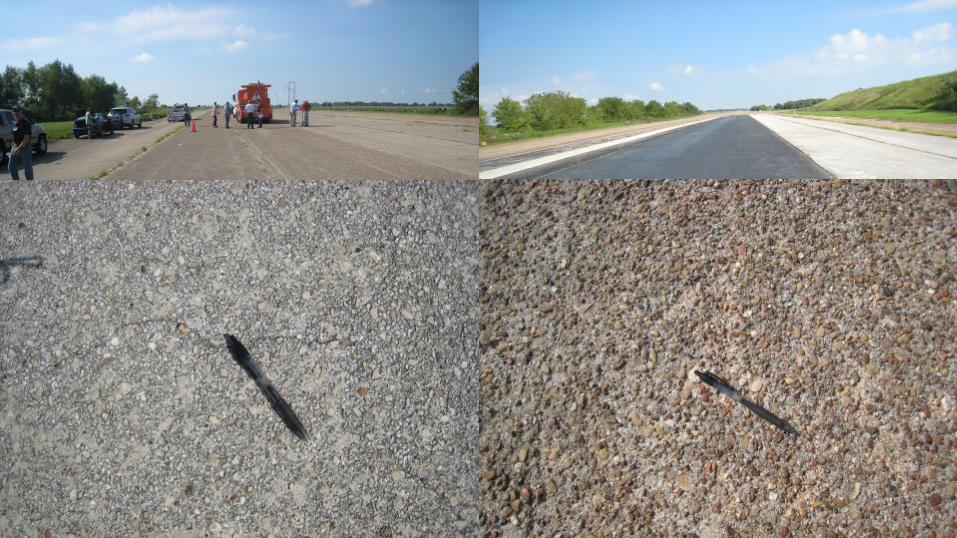
MicrotextureMacrotexture
Friction 101: What is texture?
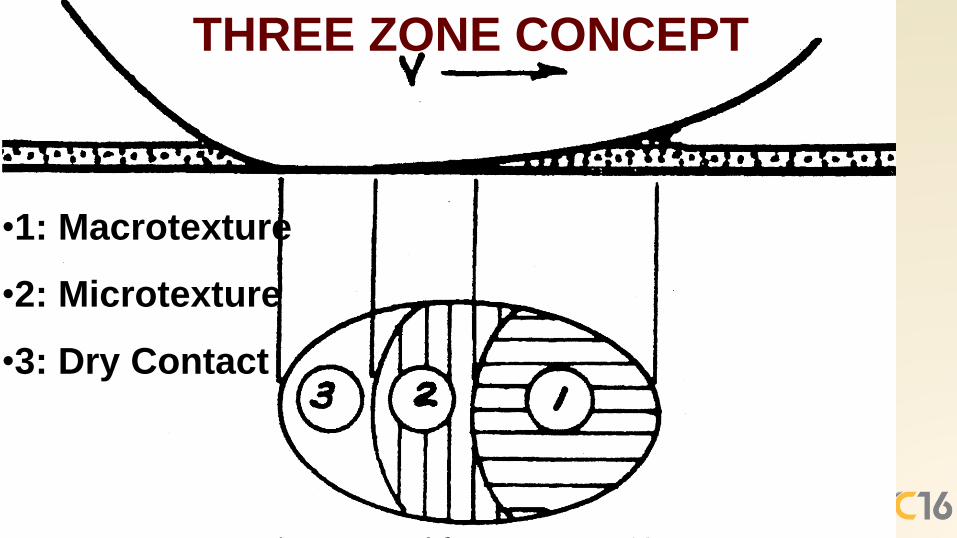
•1: Macrotexture
•2: Microtexture
•3: Dry Contact
THREE ZONE CONCEPT

Guide for
Pavement
Friction, p.62
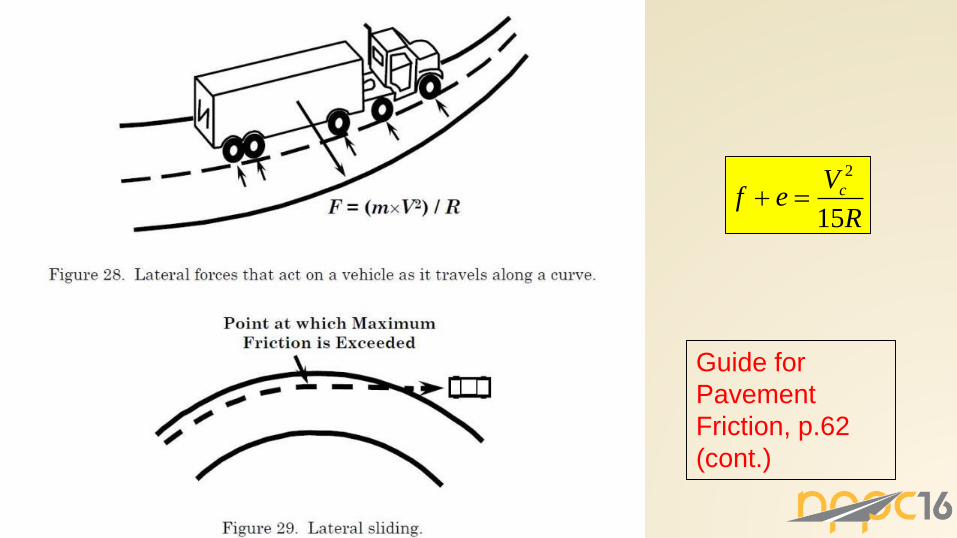
Guide for
Pavement
Friction, p.62
(cont.)
R
Vef c
15
2

Mraz and Nazef, 2008
How cross-slope affects hydroplaning
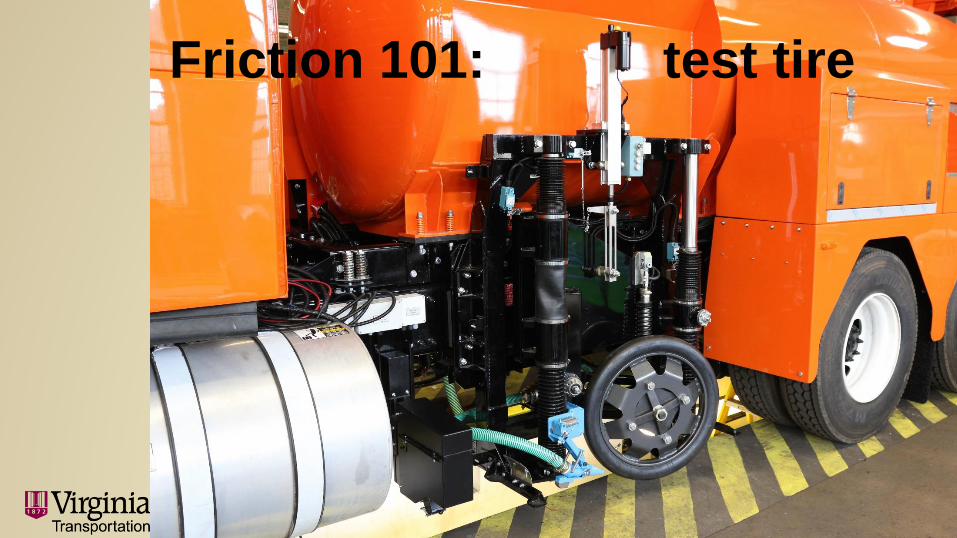
Friction 101: test tire
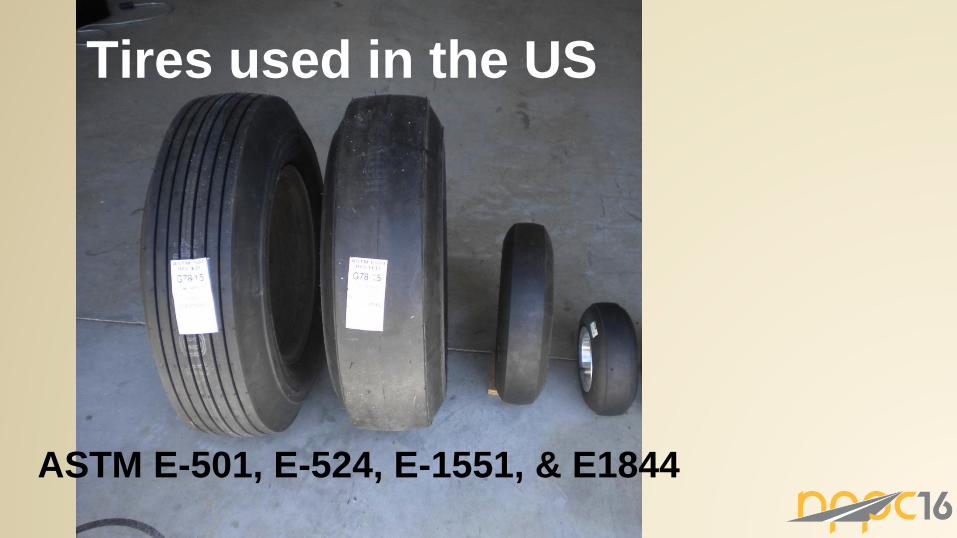
Tires used in the US
ASTM E-501, E-524, E-1551, & E1844
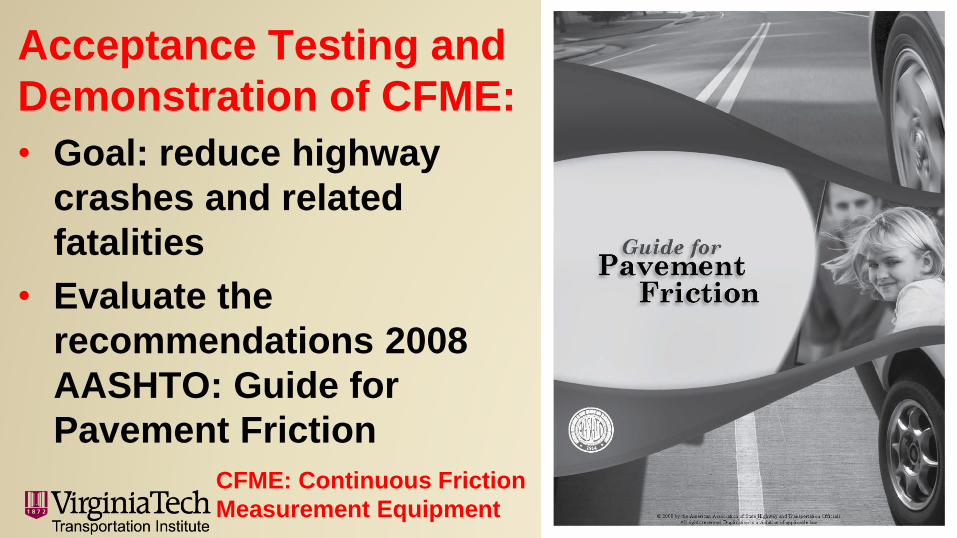
Acceptance Testing and
Demonstration of CFME:
• Goal: reduce highway
crashes and related
fatalities
• Evaluate the
recommendations 2008
AASHTO: Guide for
Pavement Friction
CFME: Continuous Friction
Measurement Equipment
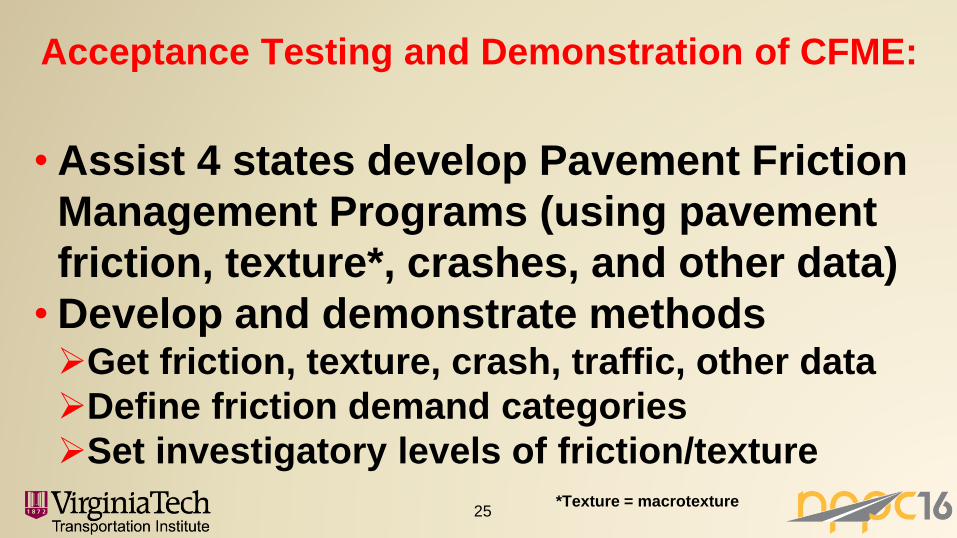
Acceptance Testing and Demonstration of CFME:
•Assist 4 states develop Pavement Friction
Management Programs (using pavement
friction, texture*, crashes, and other data)
•Develop and demonstrate methodsGet friction, texture, crash, traffic, other data
Define friction demand categories
Set investigatory levels of friction/texture*Texture = macrotexture
25
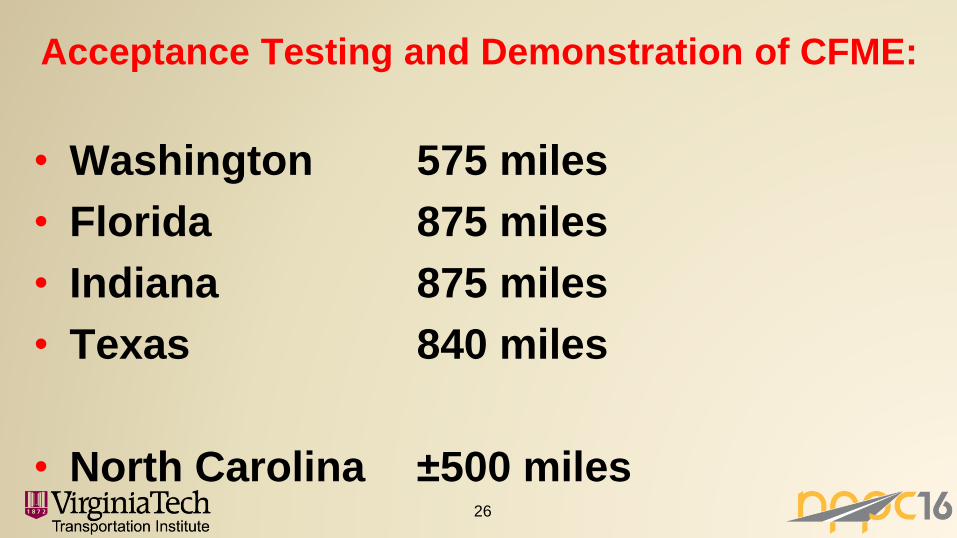
Acceptance Testing and Demonstration of CFME:
• Washington 575 miles
• Florida 875 miles
• Indiana 875 miles
• Texas 840 miles
• North Carolina ±500 miles26
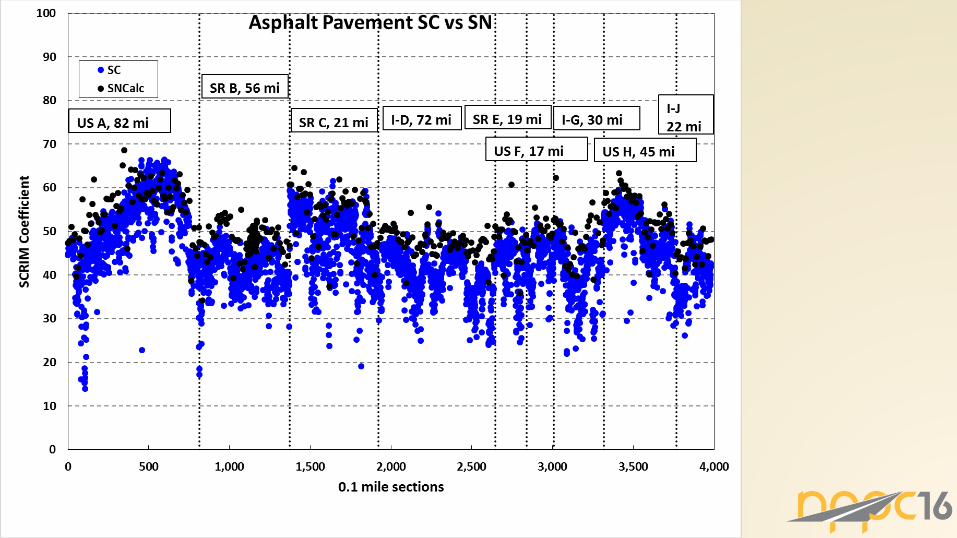
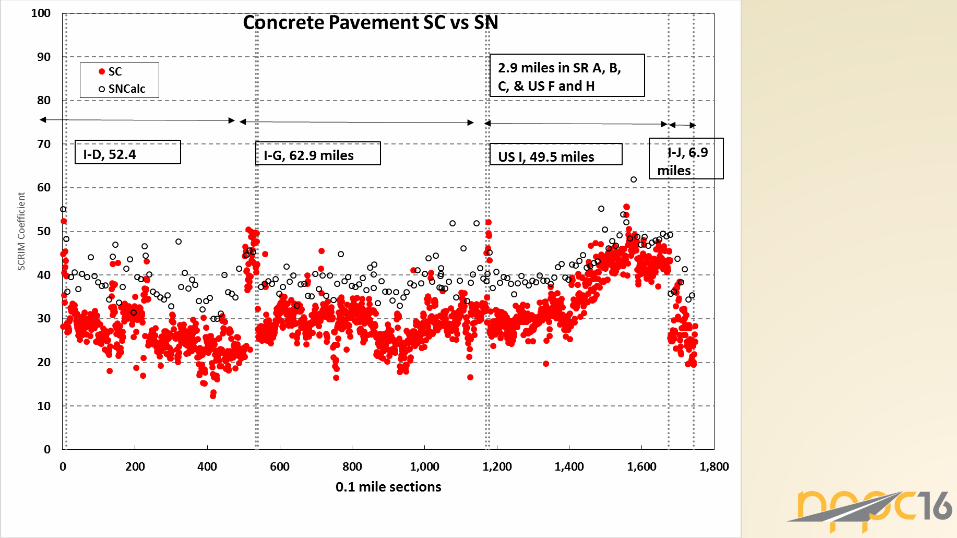
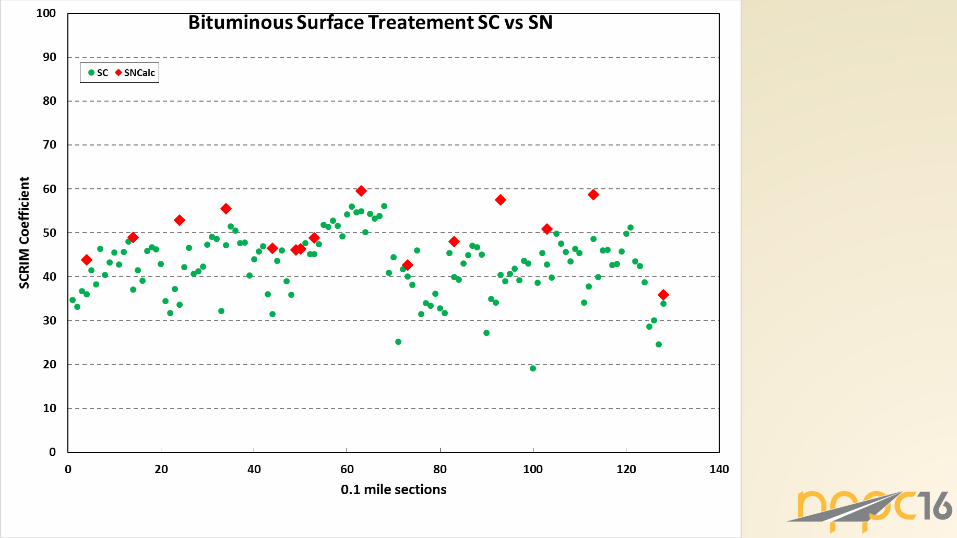

Statistical Analysis: Regression
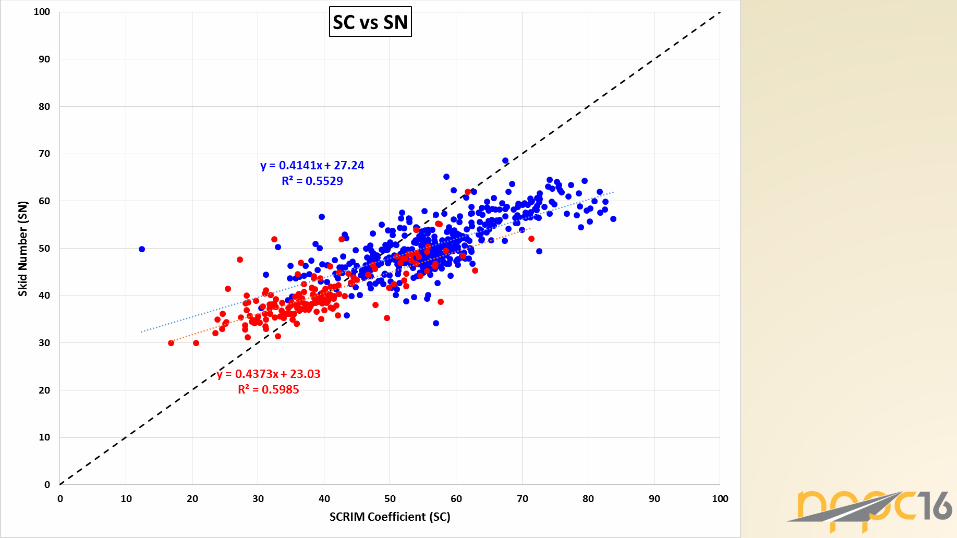

Crash analysis
Do we need the same friction everywhere?
• Minimum friction (VA: SN 40S = 20)
• Perera et. al. Skid Crash Reduction
Programs – Synthesis (MN SN 40R):
– Interstate: 28-41
–Primary: 25-37
–Secondary: 22-37


0.30 0.35 0.40 0.45 0.50 0.55 0.60 0.65
A Motorway
B Dual carriageway non-event
C Single carriageway non-event
QApproaches to and across minor and major
junctions, approaches to roundabouts
KApproaches to pedestrian crossings and other
high risk situations
R Roundabout
G1 Gradient 5-10% longer than 50m
G2 Gradient >10% longer than 50m
S1 Bend radius < 500m - dual carriageway
S2 Bend radius < 500m - single carriageway
Investigatory level 50 km/h
Site category and definition(UK-English)

0.30 0.35 0.40 0.45 0.50 0.55 0.60 0.65
A Interstate highways
B Divided highways-no event
C Two lane road-no event
Q Approaches to Intersection (& roundabouts)
K Pedestrian crossings and other high risk areas
R Roundabout
G1 Slope 5-10%, longer than 160 feet
G2 Slope >10% longer than 160 feet
S1 Curve radius < 1600 feet - divided roads
S2 Curve radius < 1600 feet - two lane roads
Road classification definitions
Investigatory level 30 mph(US-English)
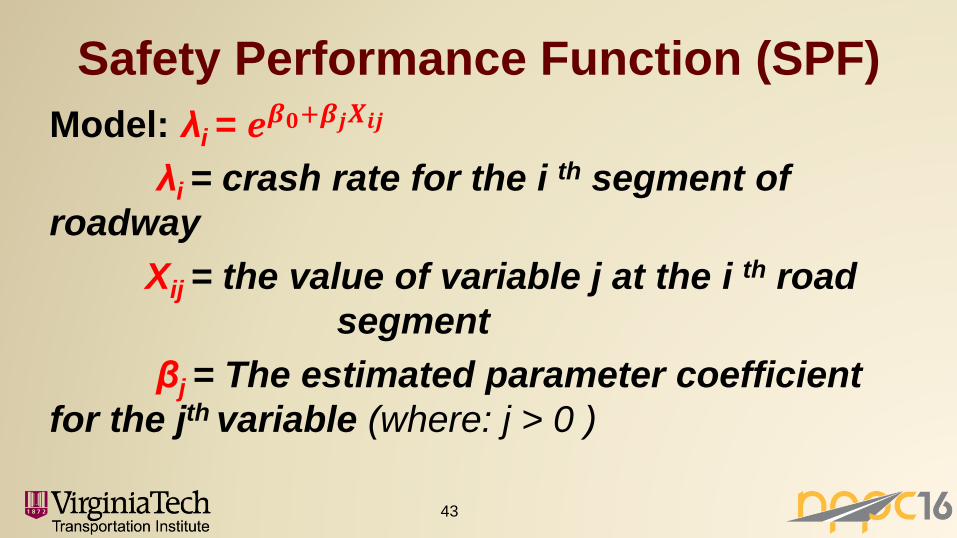
Safety Performance Function (SPF)
Model: λi = 𝒆𝜷𝟎+𝜷𝒋𝑿𝒊𝒋
λi = crash rate for the i th segment of
roadway
Xij = the value of variable j at the i th road
segment
βj = The estimated parameter coefficient
for the jth variable (where: j > 0 )
43
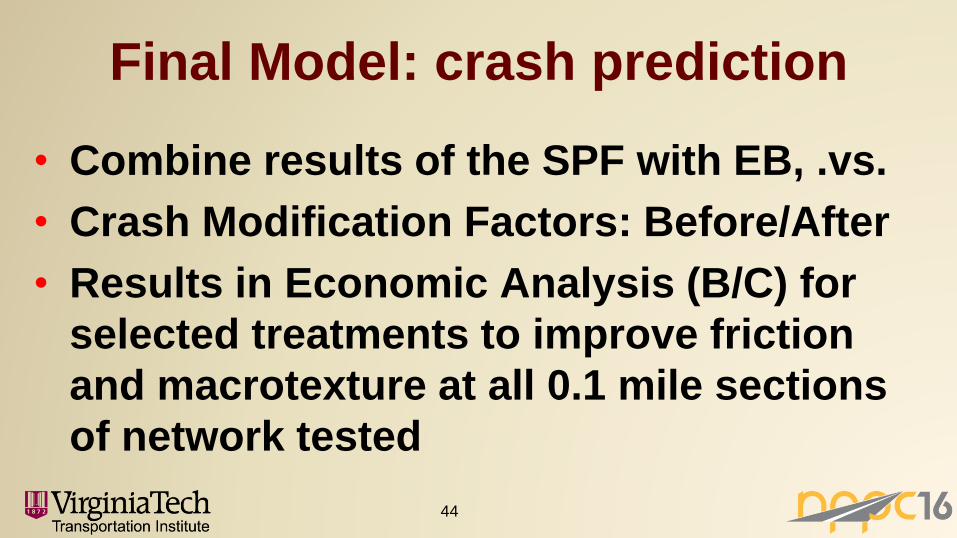
Final Model: crash prediction
• Combine results of the SPF with EB, .vs.
• Crash Modification Factors: Before/After
• Results in Economic Analysis (B/C) for
selected treatments to improve friction
and macrotexture at all 0.1 mile sections
of network tested
44
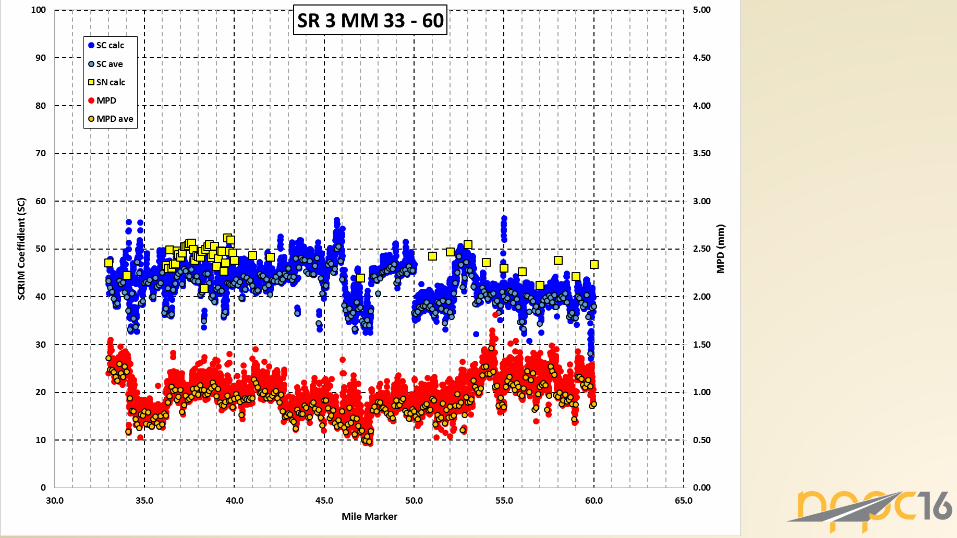
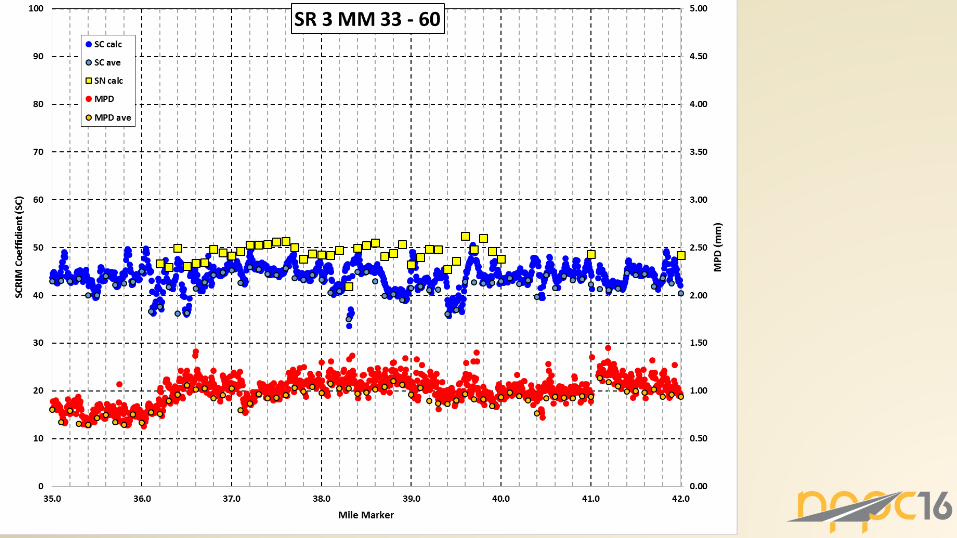
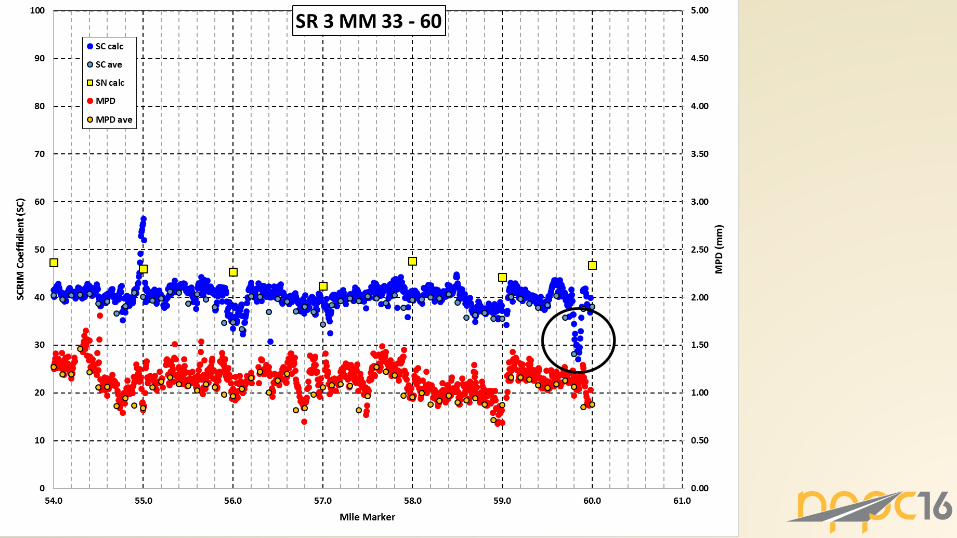
CASE 1
• State Route 3 (MM 59.9)
• 0.1 mile comparison data collection
45
46
47
48

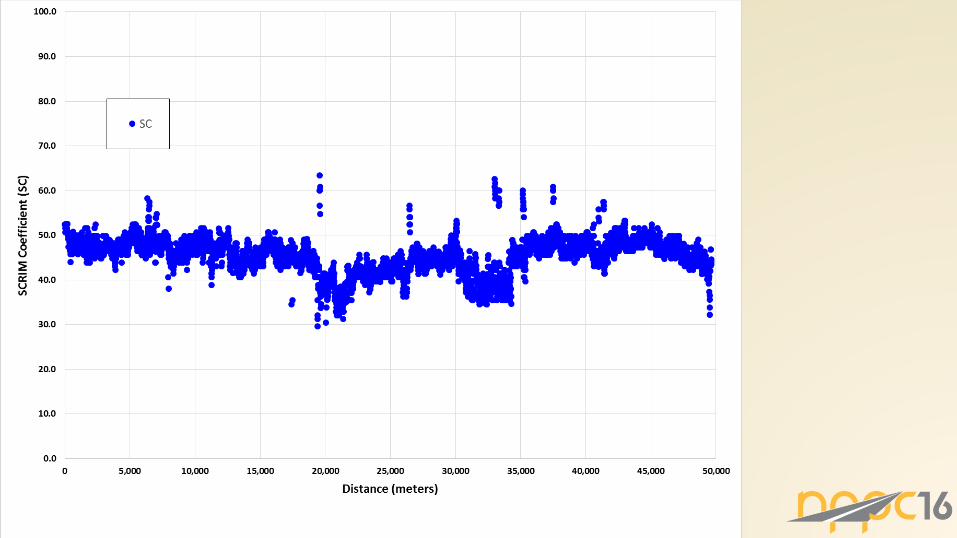
CASE 2
• Interstate Pavement
• Friction and Texture
50
51

52

53

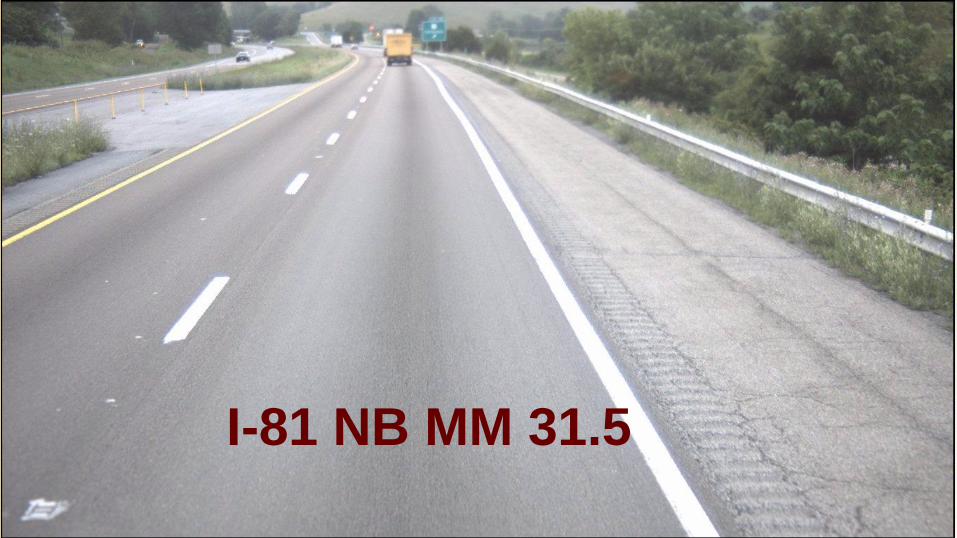
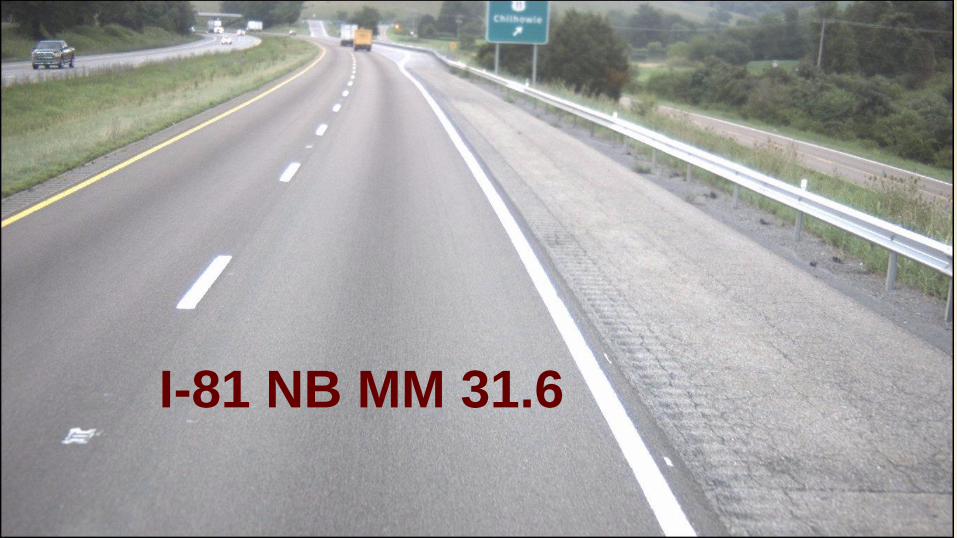
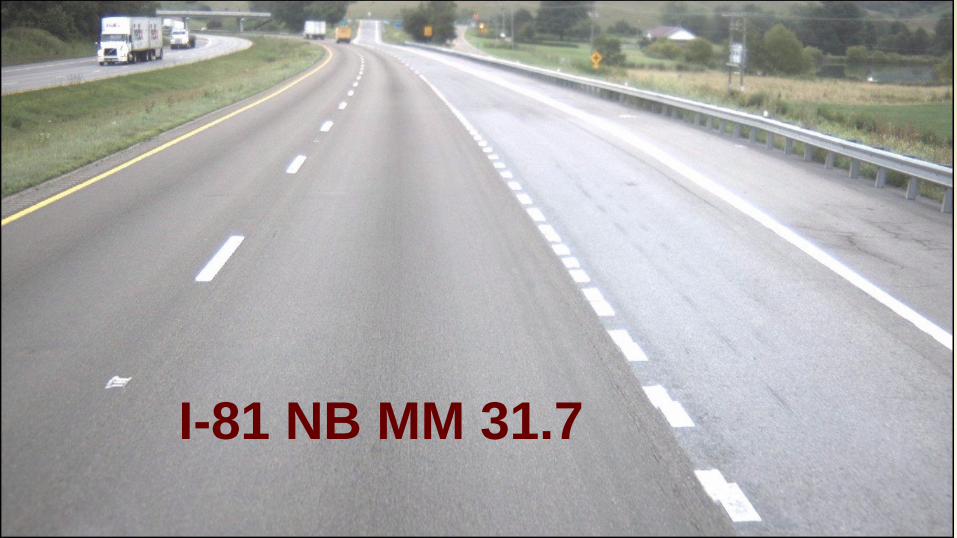
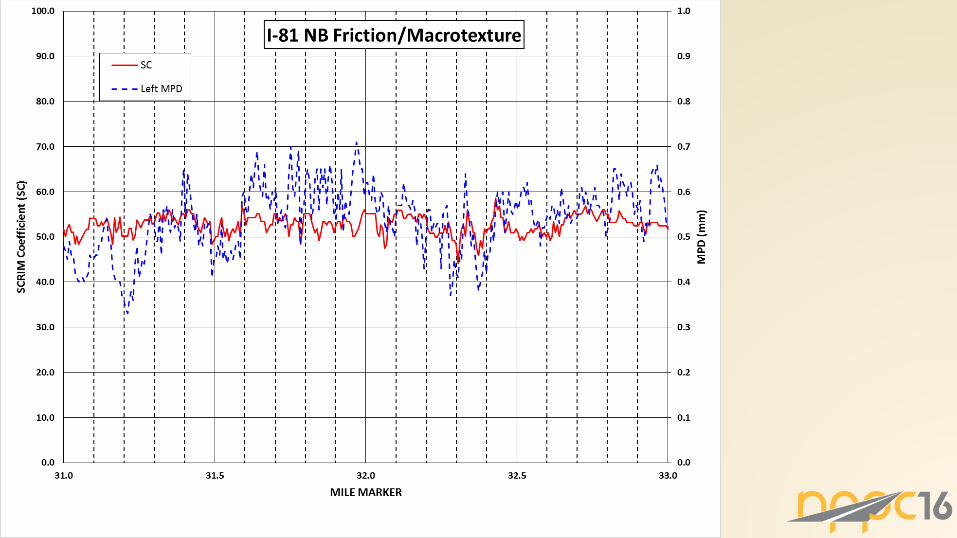
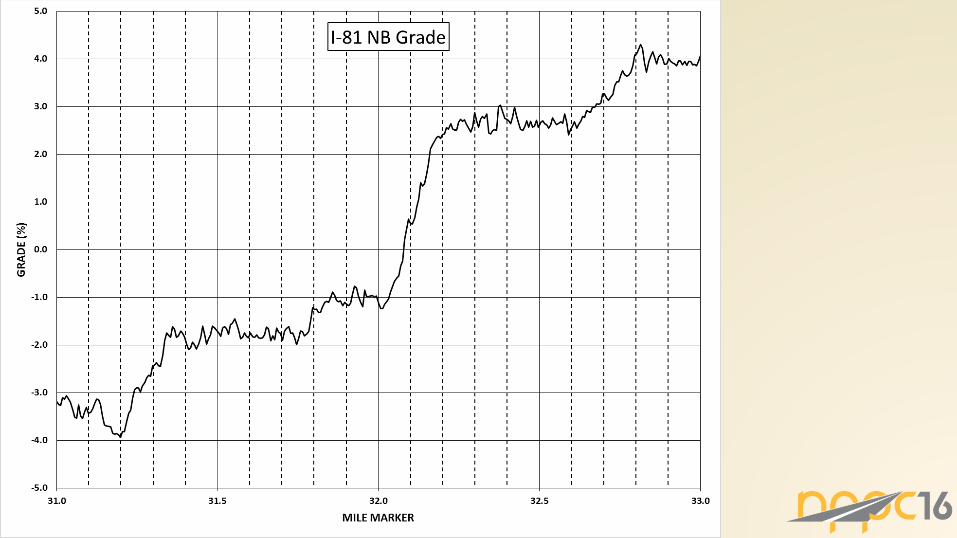
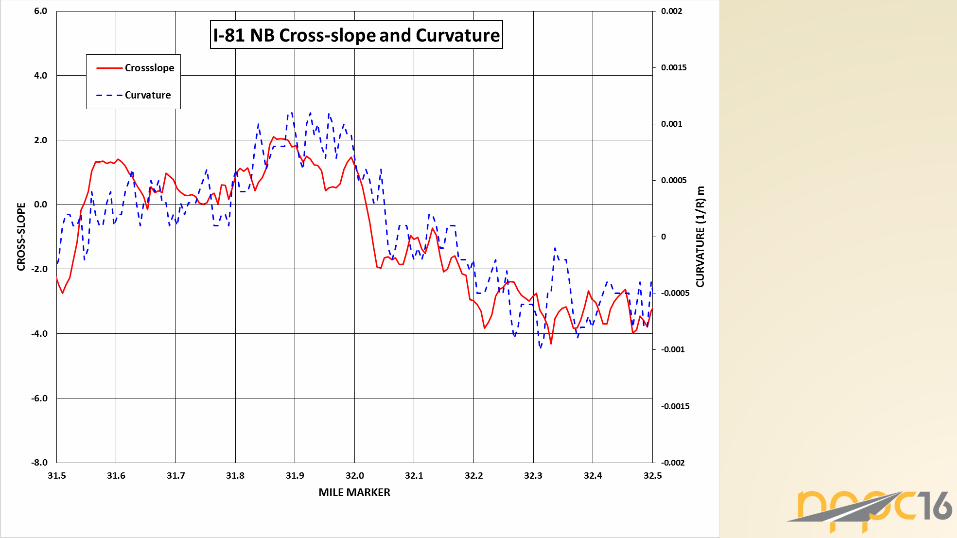
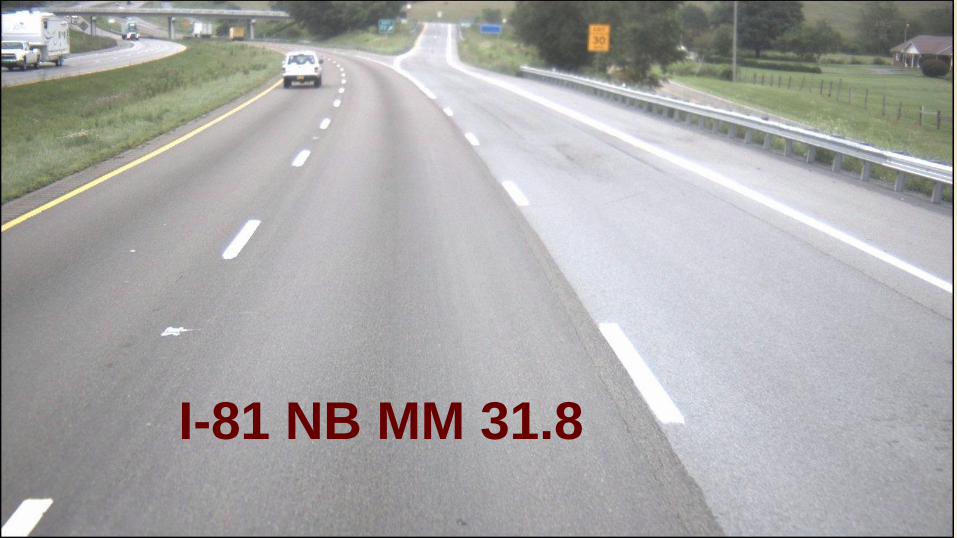
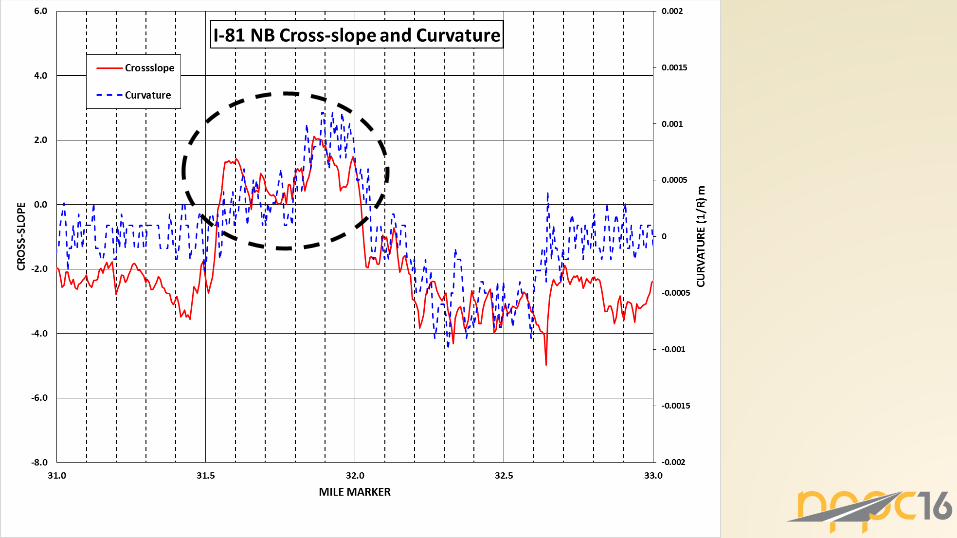
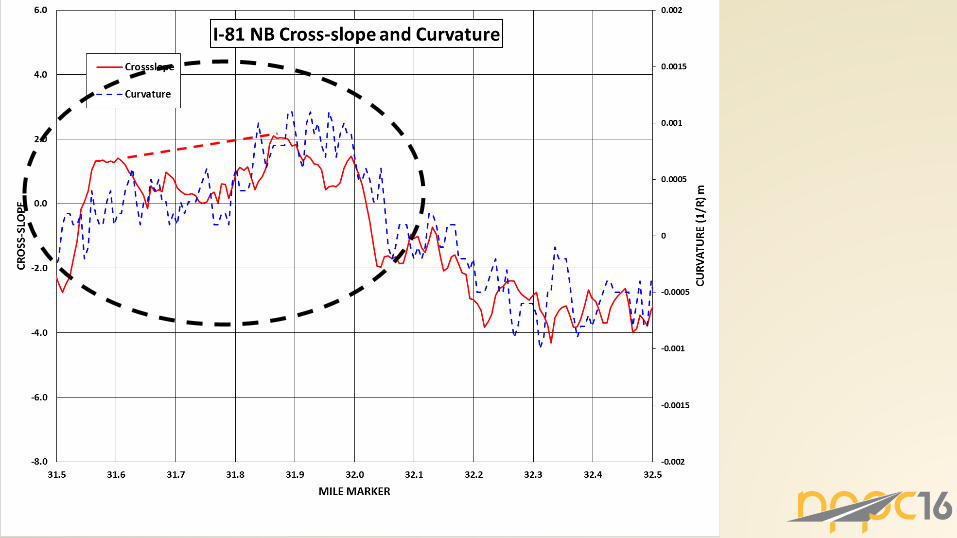
CASE 3
• Interstate I-81
• Friction and Texture
• Grade, cross-slope and curvature
54
Advancing
Transportation
Through Innovation
Center for
Sustainable
Transportation
Infrastructure
I-81 NB MM 31.5
Advancing
Transportation
Through Innovation
Center for
Sustainable
Transportation
Infrastructure
I-81 NB MM 31.6
Advancing
Transportation
Through Innovation
Center for
Sustainable
Transportation
Infrastructure
I-81 NB MM 31.7
Advancing
Transportation
Through Innovation
Center for
Sustainable
Transportation
Infrastructure
I-81 NB MM 31.8
CASE 4
• Interstate I-275 Tampa, Florida
• To TOLL 589
• HFST
• Friction and Texture
64
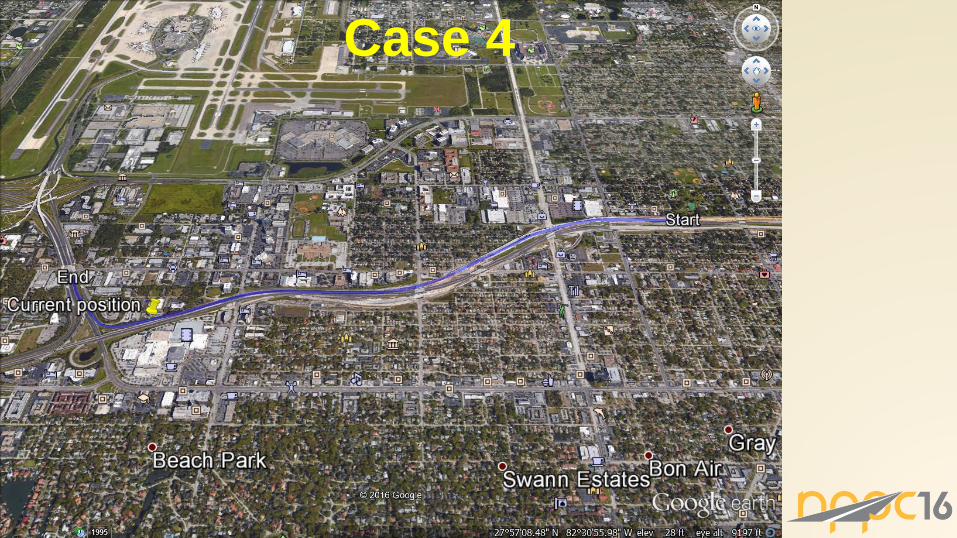
Case 4
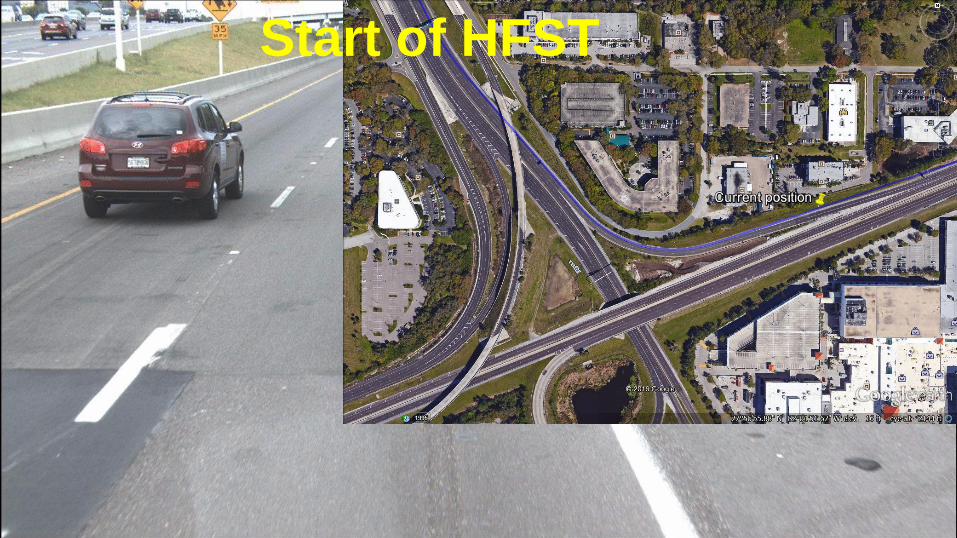
Start of HFST
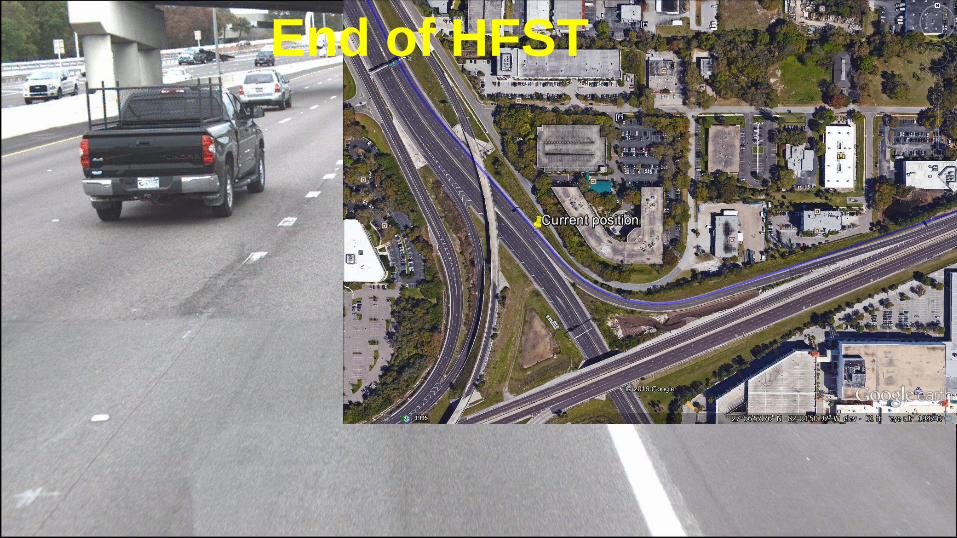
End of HFST
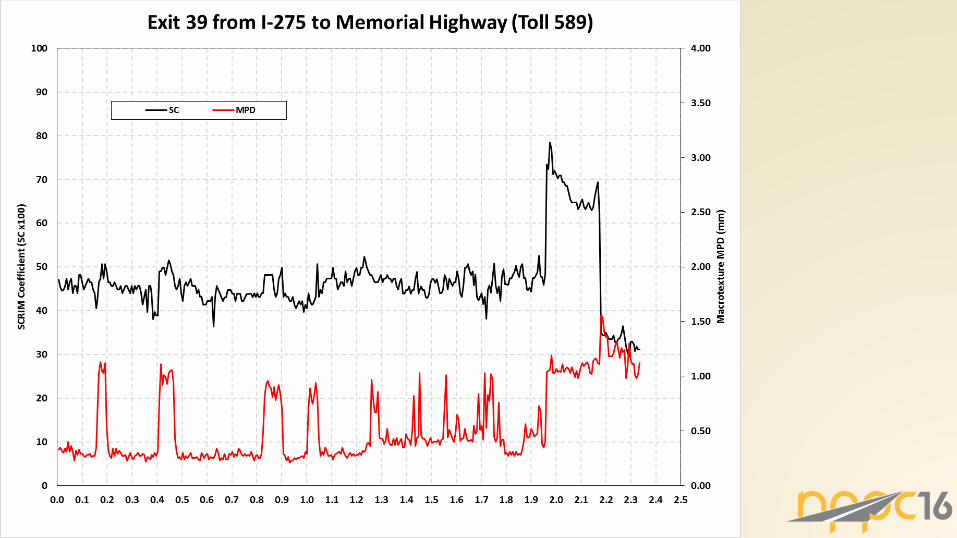
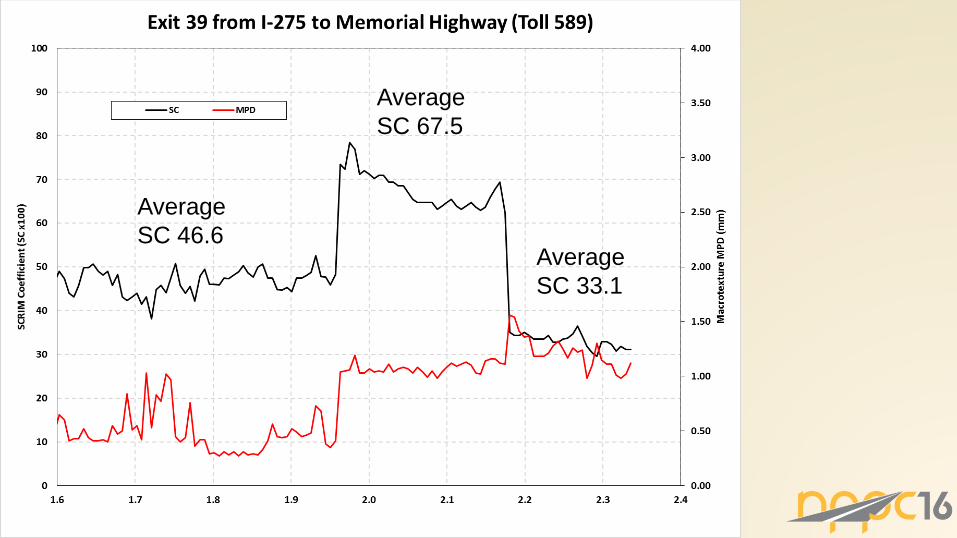
Average
SC 46.6Average
SC 33.1
Average
SC 67.5
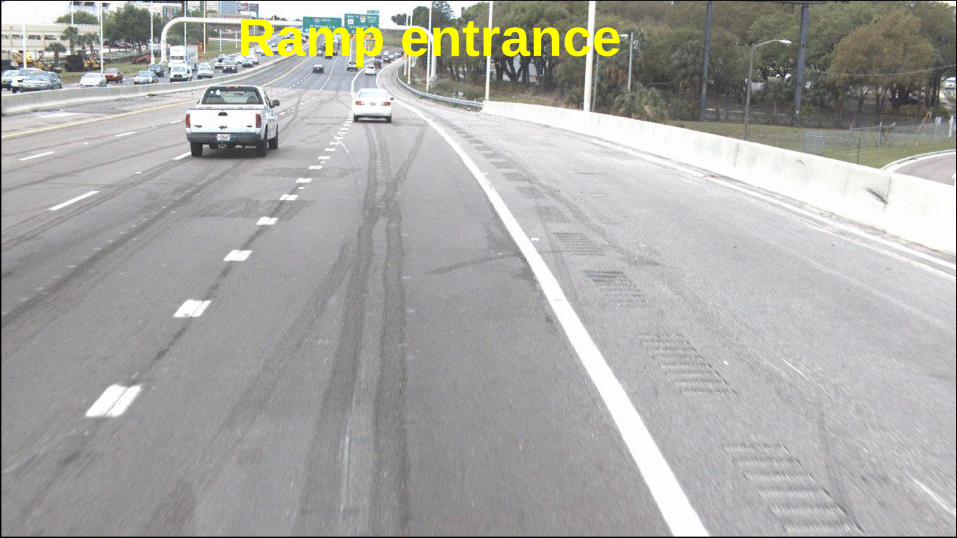
Ramp entrance

Ground sections
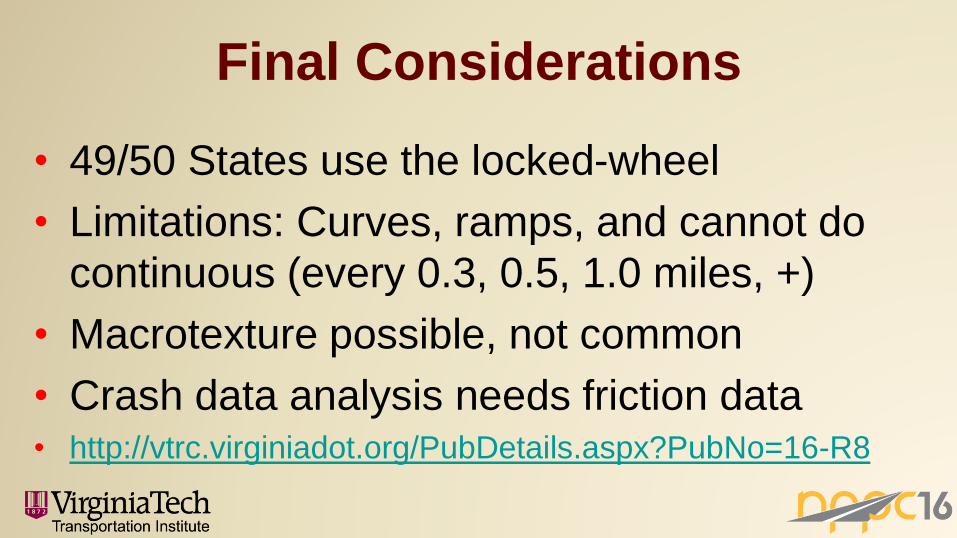
Final Considerations
• 49/50 States use the locked-wheel
• Limitations: Curves, ramps, and cannot do
continuous (every 0.3, 0.5, 1.0 miles, +)
• Macrotexture possible, not common
• Crash data analysis needs friction data• http://vtrc.virginiadot.org/PubDetails.aspx?PubNo=16-R8
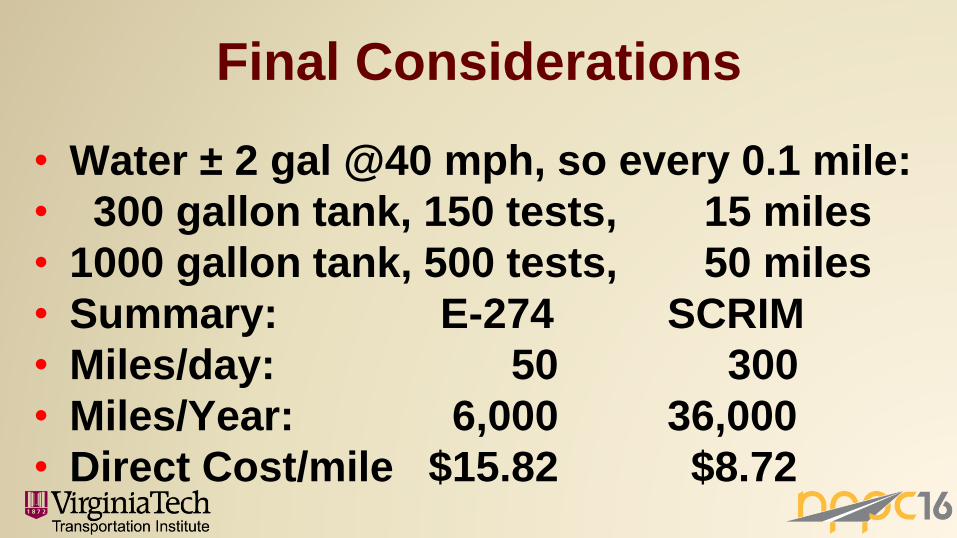
Final Considerations
• Water ± 2 gal @40 mph, so every 0.1 mile:
• 300 gallon tank, 150 tests, 15 miles
• 1000 gallon tank, 500 tests, 50 miles
• Summary: E-274 SCRIM
• Miles/day: 50 300
• Miles/Year: 6,000 36,000
• Direct Cost/mile $15.82 $8.72
• Katherine Petros, Jim Sherwood, and
Andy Mergenmeier FHWA
• Team Members: Gerardo Flintsch, Samer
Katicha, Ross McCarthy
• Kevin McGhee (VTRC), Kelly Smith (AP
Tech), James Wambold (CDRM Inc.)
Acknowledgements

• FDOT: Bouzid Choubane and Charles
Holzschuher
• INDOT: Shuo Li and Timothy Wells
• TXDOT: Magdy Mikhail and John Wirth
• WASH DOT: David Luhr and Jianhua Li
• TTI: Don Zimmer and Dusty Arrington
Acknowledgements

Questions?
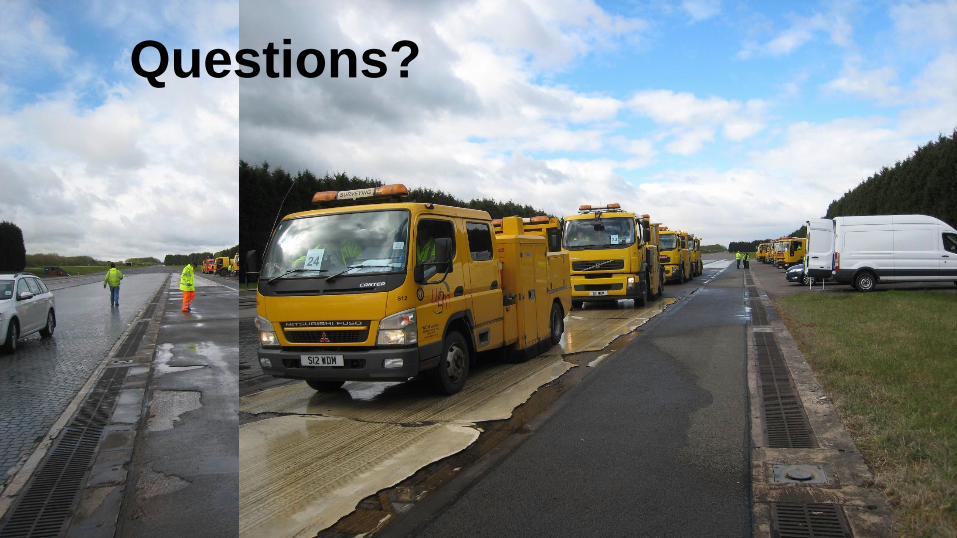
Questions?
Edgar de León Izeppi, Ph.D.
Research Scientist
Center for Sustainable Transportation
Infrastructure,
Virginia Tech Transportation Institute (VTTI)
3500 Transportation Research Plaza
Blacksburg, VA 24061-0105
Phone: (540) 231-1504, fax (540) 231-1555,
email: [email protected]